 Franziska Zoelzer
 Daniel dos Santos Monteiro
 Paul Wilhelm Dierkes
- Bioscience Education and Zoo Biology, Goethe University, Frankfurt am Main, Germany
Much research has been conducted to describe the factors that determine the fecal microbiome, with diet and host phylogeny as the main drivers. The influence of diet has been described at different levels. Firstly, there are major differences in the microbiomes of herbivorous and carnivorous species and secondly the morphology of the digestive system also determines the composition and diversity of the microbiota. In this study, we aim to describe the influence of the three factors – diet, digestive system and host - on the microbiota in order to develop a model that is able to characterize host-specific metadata from an unknown fecal sample. We therefore analyzed the 16s rRNA from 525 fecal samples of 14 zoo-housed species belonging to different phylogenetic groups including herbivores, carnivores and omnivores. We found significant differences in the bacterial taxa correlated with these groups. While herbivores show positive correlations with a large number of bacterial taxa, we found fewer taxa correlating with carnivores or omnivores. We also detected considerable differences in the microbiota of the ruminant, hindgut fermenting and simple digestive system. Based on these results, we developed a logistic ensemble model, that predicts the diet and based on these findings either the herbivorous digestive system or the carnivorous host-family from a given fecal microbiota composition. This model is able to effectively discriminate herbivores, omnivores and carnivores. It also excels at predicting the herbivore-specific digestive system with 98% accuracy, further reinforcing the strong link between microbiota and digestive system morphology. Carnivorous host-family identification achieves an overall accuracy of 79%, although this performance varies between families. We provide this trained model as a tool to enable users to generate host-specific information from their microbiome data. In future research, tools such as the one presented here could lead to a combined approach of microbiome and host-specific analyses which would be a great advantage in non-invasive wildlife monitoring.
1 Introduction
In recent years, both extensive research efforts in the field of microbiome science as well as advances in DNA sequencing technology highlighted the importance of gastrointestinal microorganisms. These microorganisms have been extensively characterized, with a particular focus on their ability to produce short-chain fatty acids (SCFAs) as an essential energy source for the host organism (Koh et al., 2016; Ríos-Covián et al., 2016; Sanna et al., 2019). In addition, a large number of studies have been carried out investigating composition, diversity, and intricate relationships that govern the gastrointestinal microbiome in different animal species as well as within different phylogenetic and dietary groups (Ley et al., 2008a; Nelson et al., 2015; Youngblut et al., 2019; Milani et al., 2020). Contemporary research raised compelling questions beyond the mere description of species-specific microbiomes, especially on influencing factors. Diet and phylogeny are now widely recognized as the primary drivers that shape the composition of the fecal microbiota.
For dietary studies on animals, the morphology of the respective digestive system must be taken into account. Carnivorous species are characterized by a simple digestive system with a short intestine and colon as well as a small cecum. In general, carnivores show little adaptations to microbial fermentation, as they rely on an easily digestible protein-based diet and have lower glucose requirements (Stevens and Hume, 1995; Mackie, 2002). In contrast, herbivores depend on microbial fermentation to break down cellulose and hemicellulose. Within herbivores, two digestive systems are predominant. On the one hand, hindgut fermenters have a simple stomach and an enlarged large intestine to increase food retention time. Furthermore, microbial fermentation occurs after enzymatic digestion in either an enlarged cecum (e.g. Leporidae, Caviidae) or colon (e.g. Equidae, Tapiridae). On the other hand, microbial fermentation takes place prior to enzymatic digestion in foregut fermenters. This dietary group has a segmented stomach that differs in the extent of compartmentalization. While the stomach of ruminants (e.g. Bovidae) consists of the rumen, reticulum, omasum and abomasum, the stomach of pseudo-ruminants (e.g. Camelidae) consists of only three parts. Furthermore, non-ruminant foregut fermenters (e.g. Macropodidae) have a bipartite foregut consisting of a sacciform and tubiform area (Stevens and Hume, 1995). Several studies have shown that each of these digestive systems hosts its own microbiota due to the different morphological adaptations and specializations (Ley et al., 2008a; Muegge et al., 2011; Nishida and Ochman, 2018; Zoelzer et al., 2021).
Host phylogeny is the second key factor that shapes the fecal microbiota composition. The interaction between host and microorganisms is defined as phylosymbiosis (Lim and Bordenstein, 2020). Phylosymbiosis is described on different scales. Firstly, regarding a great phylogenetic context where numerous animal orders are compared with each other, the microbiota similarity increases with an increasing degree of kinship among the host species (Kartzinel et al., 2019; Rojas et al., 2021; Wu et al., 2022). Secondly, even on a smaller phylogenetic scale, indications for phylogeny have emerged in the last years. Some studies found that closely related species express a high similarity in their fecal microbiota. This was shown for great apes (Ochman et al., 2010), small rodents (Knowles et al., 2019) and Cervinae (Li et al., 2018). Although these studies provide clear evidence of phylosymbiosis, it is important not to ignore the possible additional influence of environment and diet.
Due to the strong influence of the host on the microbiota, we aim to reverse this approach by developing a computational model that predicts the host from a given fecal microbiota sample. In a first step, we test whether different bacterial taxa correlate with the host’s characteristics: the host diet group (herbivore, carnivore, omnivore), the host digestive system (ruminant, hindgut fermenter, simple) and the host-family applying a correlational analysis. In a second step, we develop a model that is able to predict those metadata from a given microbiota composition. Various modeling approaches gained widespread recognition and are now being applied in the fields of ecology and evolution, as they provide a versatile approach to effectively deal with complex data structures (Bolker et al., 2009). In microbiome research, machine learning techniques are mainly used to predict disease susceptibility patterns in the human microbiome (Korpela et al., 2014; Yazdani et al., 2016; Duvallet et al., 2017; Espinoza, 2018). Recently, some studies developed models to predict host-specific factors from the fecal microbiota such as age or sex (Pannoni et al., 2022; Sweeny et al., 2023). Based on these findings and on the strong influence of host phylogeny, we hypothesize that it is possible to develop a model that identifies different host-families from an undisclosed fecal sample. This approach would open up new possibilities for microbiome analysis in non-invasive wildlife monitoring, i.e. using a single fecal sample of undisclosed origin and only one DNA sequencing workflow for an analysis of both microbiome and host-specific information. Compared to common microsatellite methods, this is more cost- and labor-efficient in sampling, sequencing and analysis efforts.
2 Materials and methods
2.1 Sample collection
Between May 2018 and November 2020, a total of 525 fecal samples were collected from 14 species belonging to different dietary groups of 17 zoos across Germany (Supplementary Table 1). To ensure adequate representation, a minimum of 20 samples were analyzed for each species. The collection method employed is non-invasive, with samples primarily obtained during the daily cleaning routines by the keepers. After collection, the fecal samples were promptly transferred to sterile cryotubes and stored in liquid nitrogen until further processing. The care and use of animals during the research adhered to the guidelines set by the European Association of Zoos and Aquaria (EAZA). StarSEQ GmbH, located in Mainz, Germany, conducted the subsequent sample preparation. Initially, the samples underwent homogenization using the Precellys® Evolution Homogenizer (Bertin Instruments, Rockville, USA). Next, DNA extraction was carried out using the QIAamp® PowerFecal DNA Kit (Qiagen, Hilden, Germany). To measure the DNA concentration in the extracted samples, a NanoDrop spectrophotometer (Thermofisher, Massachusetts, USA) was utilized.
2.2 16S rRNA gene sequencing and data processing
At StarSEQ GmbH, sequencing of the V3-V4 region of the 16S rRNA gene was performed using a dual-index strategy based on the protocol of Caporaso et al., 2012 with minor modifications. To generate amplicons, a single step PCR of 33 cycles was performed using the primer combination 341f and 806bR as described by (Apprill et al., 2015) and (Takahashi et al., 2014). The resulting library was then sequenced on the Illumina MiSeq platform in paired-end mode (300 nt), including a 25% PhiX control library.
Subsequent data analysis was carried out using the QIIME 2 platform (Bolyen et al., 2019), and amplicon sequence variants (ASVs) were determined using DADA2 (Callahan et al., 2016). A phylogenetic tree was constructed for all sequences using MAFFT sequence alignment (Katoh et al., 2002) and low abundant features that are covered by less than 10 sequences, chloroplast and mitochondrial sequences were removed from the dataset. For taxonomic assignment of ASVs, a pre-trained Naive Bayes classifier (Bokulich et al., 2018) based on the SILVA 138 full-length database (Quast et al., 2013) was employed. The following statistical analyses were performed in R version 4.3 (R Core Team, 2022) as well as in Python version 3.10 (van Rossum and Drake, 2009). To identify bacterial families that are linked to either dietary, morphologically similar digestive systems or phylogenetic groups, we calculated the spearman correlation coefficient with a minimum of R>0.5. Taxa that showed correlation coefficients from above 0.5 as strongly correlating. Based on those results, we performed a general linear model (glm) to test whether the correlating taxa are statistically significant factors in explaining whether a given microbiome composition belongs to one of the given categories or not.
Next, we developed a model to predict the diet, digestive system and host-family of an undisclosed sample. The preprocessing steps included:
1. Ensuring no missing values were present, which attests to the thoroughness of our data collection process.
2. Normalizing the data by converting raw counts to relative abundances, thus facilitating comparison across samples.
3. Removing sequences that were low in abundance or non-bacterial, refining the dataset to emphasize bacterial profiles relevant to the animals’ diets.
These steps, essential for preparing the data for machine learning, complement the methodical sample collection and sequencing methods described in our documentation. We acknowledge that due to the unstandardized collection procedure of the samples and the time component among other factors our dataset does not strongly support the assumption of IID. However, we have taken several steps to ensure that the data we used was thoroughly checked and prepared for further analysis and the use in machine learning models.
In the development of our machine learning model, the initial feature space comprised a comprehensive set of 164 bacterial taxa identified in the fecal samples. Recognizing the potential for overfitting and the importance of focusing on the most impactful features, we implemented a pre-processing step to refine this feature space. Specifically, we applied a thresholding technique to exclude bacterial taxa present in quantities below a certain threshold, thereby reducing the dimensionality of our feature space. This resulted in a total of 128 bacterial taxa. This approach ensured that only the most prevalent and potentially influential taxa were included in the model, allowing for a more interpretable and robust analysis. The final dimensionality of our feature space, therefore, reflects this subset of features, each representing a dimension, and was determined based on their relative abundance in the dataset. This methodology aligns with best practices for managing high-dimensional data and enhances the model’s ability to generalize by focusing on features with sufficient representation across samples (James et al., 2013).
2.3 Model training and evaluation framework
The dataset was divided into training, development, and test sets with a ratio of 64%, 16%, and 20%, respectively. This split ensured enough data for training the models, allowed for hyperparameter optimization on the development set, and provided an unbiased evaluation on the test set. The training of the models was systematically conducted through grid search, meticulously iterating over a range of hyperparameter combinations to identify the optimal settings based on AUC and macro average F1 scores.
In our quest to solve a classification problem, we explored four models that are recognized for their superior performance in managing the intricacies of high-dimensional datasets: Logistic Regression, Decision Tree, Random Forest, and SVM. Such models have been substantiated to offer the best outcomes in contexts akin to ours, adept at navigating the challenges unique to complex data landscapes (Papoutsoglou et al., 2023). After evaluating those models, we enhanced the predictive accuracy by employing an ensemble of logistic regression models, adhering to the hierarchical classification procedure of diet, herbivorous digestion types, and carnivorous host-family. Ensemble modeling combines the predictions from multiple models to increase the robustness of the results, leveraging the strength of each individual model without weakness of a general model.
1. Hierarchical Model Training and Validation: We trained individual logistic regression models at each level of the hierarchy—first on diet, then on digestion types for herbivores, and on the host-family for carnivores and omnivores. Each model was validated using the development set, ensuring that we could fine-tune the hyperparameters effectively. This hierarchical approach allowed the ensemble to build upon the structure and dependencies inherent in the data, using the development set to guide the selection and combination of models without biasing the final evaluation.
2. Aggregation of Model Probabilities: Aggregation of Model Probabilities: The ensemble method was implemented using a sequential, multi-stage approach. In each stage, multiple models predict the label for the respective category, and the label with the highest calculated probability is selected. This approach ensures that the most precise prediction of each model is considered, with the final decision based on the most probable forecast. This method allows for a differentiated and context-dependent integration of predictions from various models, taking into account both the accuracy and the consensus of individual models at different classification stages
3. Performance Evaluation: The final evaluation of the ensemble model’s performance was conducted on the test set. This step is crucial, as it provides an unbiased estimate of how well the ensemble model generalizes to new, unseen data. The metrics from this evaluation were used to assess the success of the modeling approach.
The emphasis throughout the modeling process was on the refinement of the ensemble based on development set results rather than test data, maintaining the integrity of the test set for a genuine evaluation of model generalization. The ensemble’s performance was quantified using the F1 score, which harmonizes precision and recall, to ensure the model’s efficacy across both prevalent and rare classes within our dataset.
3 Results
A total of 525 fecal samples comprising 14 species were sequenced on Illumina MiSeq platform in paired-end mode, targeting the V3-V4 region of the 16S rRNA gene. After preprocessing, the dataset contained 27,188,318 sequences, ranging from 5,836 to 303,032 sequences per sample, with an average of 51,299 sequences per sample.
3.1 Correlation of bacterial taxa with diet
Applying the Spearman correlation to the data set with respect to diet groups, the strongest correlation values are found for herbivores. All correlation coefficients and respective p-values are shown in the Supplementary Table 2. Within the R>0.5 limit, 12 positively correlating bacterial families are identified (Figure 1A). Within these, Spirochaetaceae (R=0.83), F082 (R=0.81), Rikenellaceae (R=0.77), Methanobacteriaceae (0.75), Akkermansiaceae (R=0.75), Ruminococcaceae (R=0.69), Christensenellaceae (R=0.67), Fibrobacteraceae (R=0.60) and Prevotellaceae (R=0.57) show a strong positive correlation with herbivores. The following generalized linear model (glm) confirms these findings, indicating that the occurrence of Methanobacteriaceae (t=9.95, p<0.01), Spirochaetaceae (t=6.21, p<0.01), Akkermansiaceae (t=3.99, p<0.01), Ruminococcaceae (t=3.66, p<0.01) and Rikenellaceae (t=3.62, p<0.01), as well as the absence of Peptostreptococcaceae (t=-9.69, p<0.01), Fusobacteriaceae (t=-8.94, p<0.01) and Clostridiaceae (t=2.09, p=0.04), are significant factors in distinguishing a herbivorous from carnivorous or omnivorous host. Nevertheless, these bacterial taxa contribute in different proportions to the herbivore microbiota. While Ruminococcaceae (Average ± standard deviation: 16.30% ± 10.20%), Spirochaetaceae (9.06% ± 8.74%) and Rikenellaceae (7.55% ± 4.78%) are on average more abundant, Akkermansiaceae (2.53% ± 2.85%) and Methanobacteriaceae (4.31% ± 5.37%) are less abundant (Figure 2). Carnivorous species show a negative correlation with most of the bacterial families that correlate with herbivores. Only two positively correlating bacterial taxa are identified: Fusobacteriaceae (R=0.80, t=17.84, p<0.001) as well as Burkholderiaceae (R=0.58, t=4.38, p<0.001). As shown in Figure 2, Fusobacteriaceae (19.93% ± 15.37%) is a predominant taxon while Burkholderiaceae (1.62% ± 2.29%) occurs in low proportions in carnivores. Contrary to herbivores and carnivores, the omnivorous hosts assessed in this study only display strong correlation to Enterococcaceae (R=0.50, t=8.90, p<0.01). Enterococcaceae shows no correlation to either herbivores or carnivores, but this family only contributes on average to 5.65% ± 8.51% to the microbiota composition of omnivores.
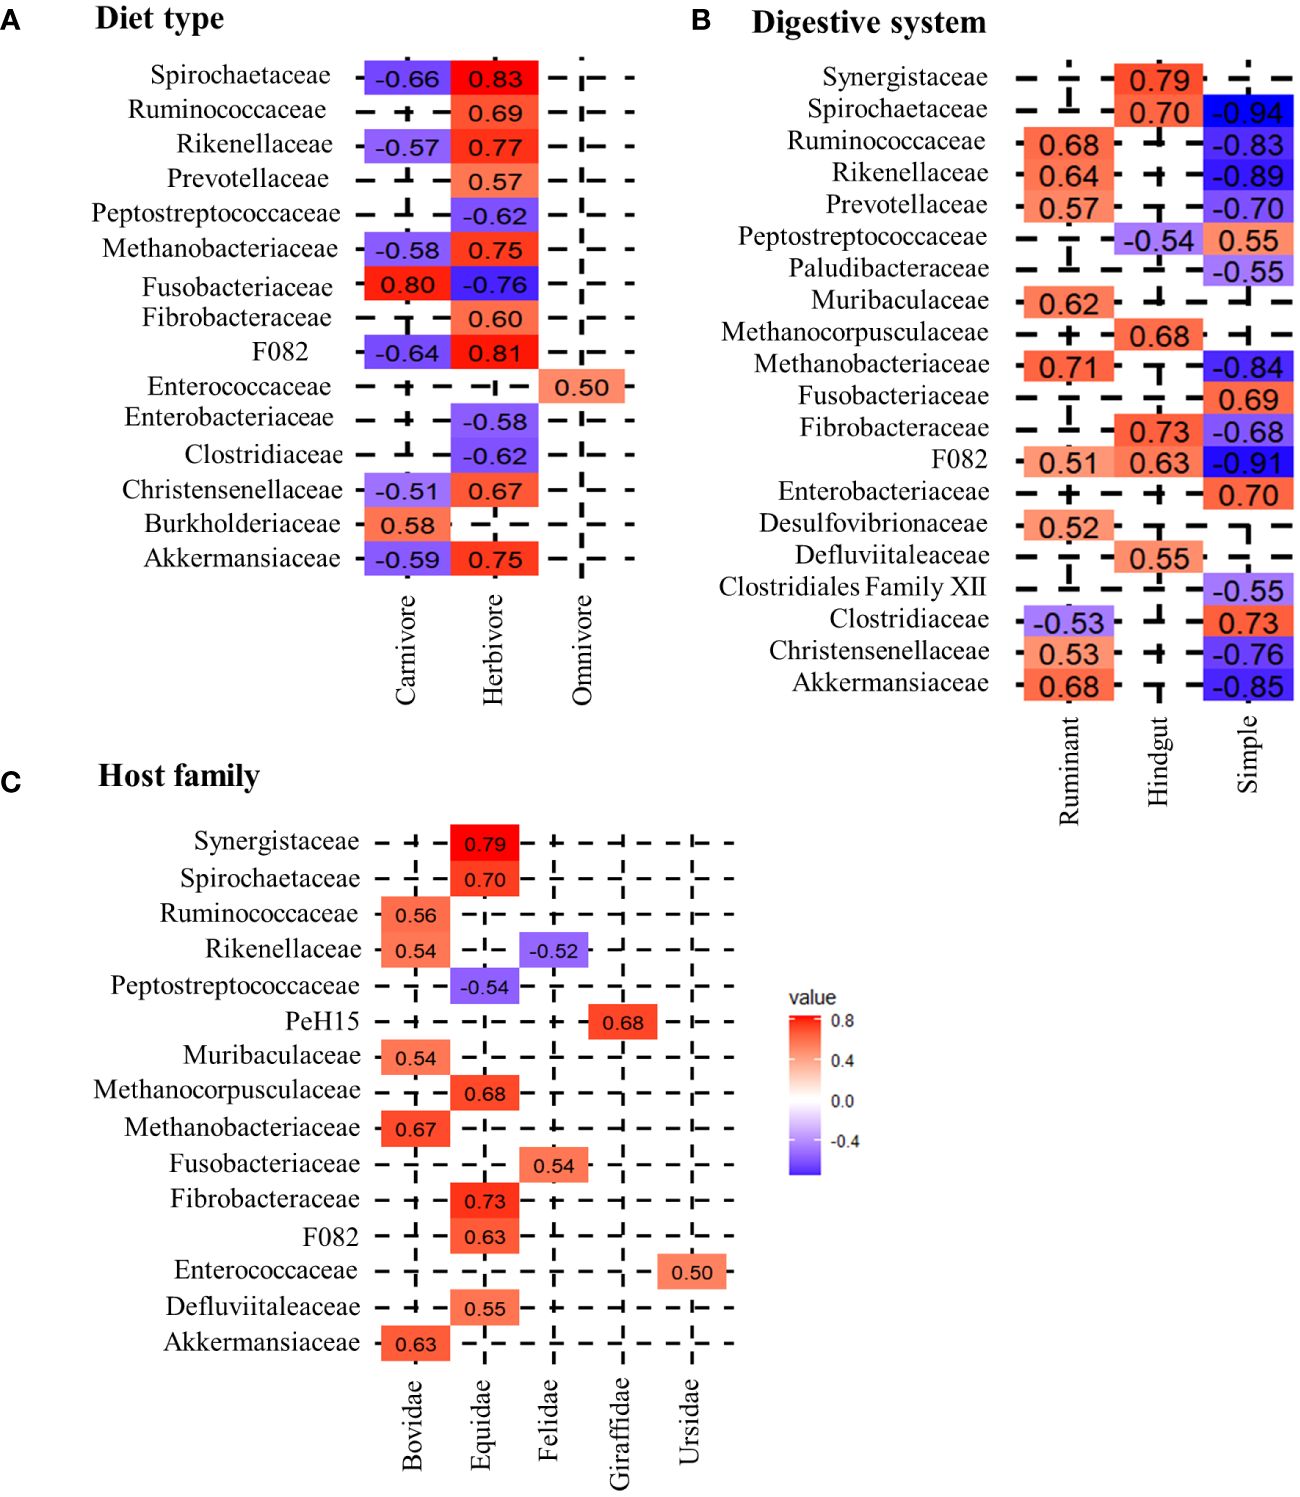
Figure 1 Spearman correlation between different host-specific groups and microbial taxa. (A) shows the correlation of diet, (B) the correlation of the digestive system and (C) the correlation of the host-family with microbial families. The coloring scheme ranges from highly negatively correlating (dark blue) to highly positively correlating (dark red) taxa. For this analysis a threshold of the correlation coefficients was set to a minimum of R>0.5.
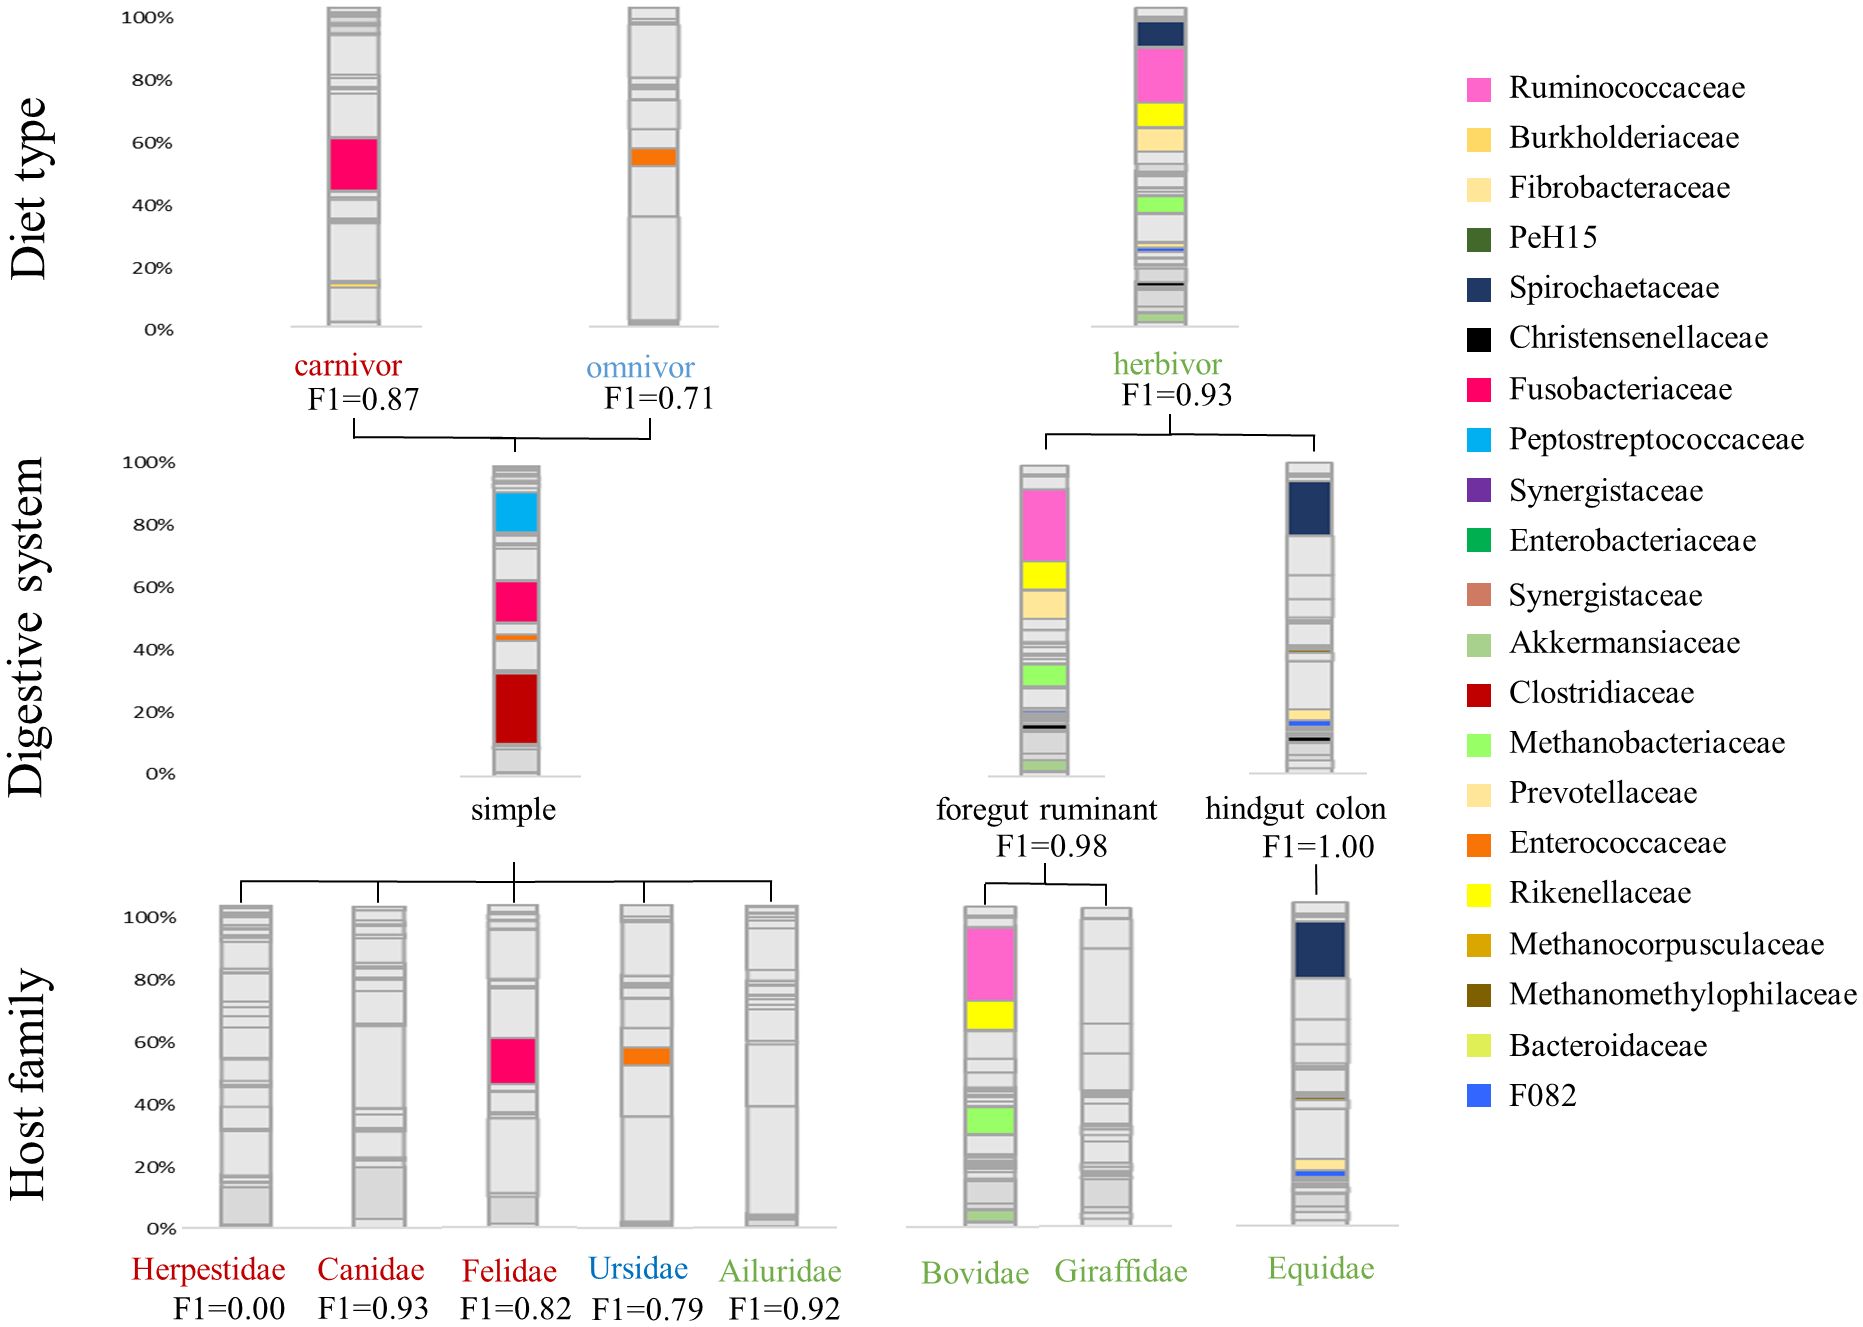
Figure 2 Average taxonomic microbial composition of different host-specific groups. Only the respective correlating taxa (R>0.5) are colored to show the differences within diet type, digestive system and host-family. Furthermore, the F1 score of the logistic regression model is shown for each category.
3.2 Correlation of bacterial taxa with digestive system
With regard to the digestive system, herbivores in this study are divided into foregut ruminants and hindgut colon fermenters. Ruminants show strong and significant positive correlations with Methanobacteriaceae (R=0.71, t=17.50, p<0.001), Ruminococcaceae (R=0.68, t=12.13, p<0.001), Akkermansiaceae (R=0.63, t=3.87, p<0.01), Prevotellaceae (R=0.57, t=4.80, p<0.001), Christensenellaceae (R=0.53, t=-3.52, p<0.01), Desulfovibrionaceae (R=0.52, t=4.10, p<0.01) and F082 (R=0.51, t=-5.96, p<0.01). With the exception of the latter, which is shared with the hindgut fermenters, these bacterial taxa are exclusively positively correlated with ruminants. Ruminococcaceae are highly abundant in this dietary group with an average of 22.62% ± 8.58%, followed by Prevotellaceae (9.68% ± 4.51%) and Methanobacteriaceae (6.75% ± 6.06%) (Figure 2). Furthermore, the absence of Clostridiaceae (R=-0.53, t=3.04, p<0.01) is another indicator of a ruminant host species.
The correlation analysis reveals differences between ruminants and hindgut fermenters. While Ruminococcaceae are high-abundant in the microbiota of ruminants, this taxon does not correlate with hindgut fermenters (Figure 1). In contrast, Spirochaetaceae are the most abundant taxon that shows the strongest positive correlation (R=0.70, t=5.66, p<0.001) and on average make up 18.81% ± 6.22% of the hindgut fermenters microbiota. Similar to ruminants, there is an archaeal taxon strongly positively correlating with hindgut fermenters, namely Methanocorpuscularceae (R=0.68, t=3.16, p<0.01). Other hindgut-specific bacterial families make up less than 5% on the average microbiota as shown in Figure 2. These include Fibrobacteraceae (R=0.73, t=4.27, p<0.001), Synergistaceae (R=0.79, t=5.67, p<0.001) and Defluviitaleaceae (R=0.55, t=3.28, p<0.01).
The simple carnivore digestive system is characterized by a different bacterial composition. In general, bacterial families are less positively correlated with this digestive system, which is reflected in the correlation values as well as in the lower t-values of the glm. Therefore, the four positively correlating bacterial families occur in higher proportions. Strong correlational values are found for Clostridiaceae (R=0.73, t=3.21, p<0.01), Enterobacteriaceae (R=0.70, t=2.56, p=0.01), Fusobacteriaceae (R=0.69, t=6.43, p<0.001) and Peptostreptococcaceae (R=0.55. t=2.77, p<0.01) which contribute to 19.50% ± 17.52%, 9.64% ± 15.15%, 15.71% ± 16.08% and 11.13% ± 9.98% to the microbiota composition. The glm also identifies significantly negatively correlating taxa as indicators to distinguish this digestive system from the others. These include Ruminococcaceae (R=-0.83, t=-10.49, p<0.001), Rikenellaceae (R=-0.89, t=-8.03, p<0.001), Spirochaetaceae (R=-0.94, t=-17.10, p<0.001), Methanobacteriaceae (R=-0.84, t=-22.77, p<0.001) and Akkermansiaceae (R=-0.85, t=-8.70, p<0.01), which were previously identified as herbivore-specific taxa.
3.3 Correlation of bacterial taxa with host-family
The calculation of correlations for bacterial taxa with host-families does not reveal strong correlations for Ailuridae, Herpestidae and Canidae. The only carnivorous host-families that show strong correlations with bacterial taxa are Felidae and Ursidae. As shown in Figure 1, Felidae correlate significantly positive with Fusobacteriaceae (R=0.54, t=5.27, p<0.001) and negative with Rikenellaceae (R=-0–52, t=-7.90, p<0.001), while Ursidae only show a positive correlation with the occurrence of Enterococcaceae (R=0.50, t=8.90, p<0.001).
Within herbivores, the Equidae display three significantly positive correlations with Spirochaetaceae (R=0.70, t=15.33, p<0.001), Fibrobacteraceae (R=0.73, t=4.28, p<0.001) and Synergistaceae (R=0.79, t=5.68, p<0.001). Further positive correlations are found for F082 (R=0.63, t=0.49, p=0.62), Methanocorpuscularceae (R=0.66, t=3.15, p<0.01) and Defluviitaleaceae (R=0.55, t=3.29, p<0.01). In particular, the high average abundance of Spirochaetaceae (18.81% ± 6.22%) and the low abundance of Ruminococcaceae differentiate the Equidae from Giraffidae and Bovidae as is shown in Figure 2. In contrast, the other identified taxa represent less than 5% of the average Equidae microbiota. Giraffidae only show a strong positive correlation with PeH15 (R=0.68, t=13.13, p<0.001) which therefore can be used to differentiate this ruminant family. However, this family contribute on average less than 1% to the microbiota composition. Figure 2 shows that Ruminococcaceae is another important taxon for the discrimination that occurs on average in 23.34% ± 4.49% within the Giraffidae. The second ruminant family, Bovidae, shows significant positive correlation to Methanobacteriaceae (R=0.67, t=17.83, p<0.001), Ruminococcaceae (R=0.56, t=6.17, p<0.001) and Akkermansiaceae (R=0.63, t= 5.57, p<0.001). Compared to the Giraffidae, the Bovidae show a comparable average proportion of Ruminococcaceae (22.43% ± 9.39%), but a higher average proportion of Methanobacteriaceae (8.06% ± 6.13%).
3.4 Developing an ensemble model to identify host-specific information
Upon evaluating these models, we gravitated toward Logistic Regression for several reasons, chief among them being its optimal balance between predictive prowess and interpretability. This model not only showcased high accuracy and exceptional AUC scores but also presented an ease of interpretability vital for elucidating the biological narratives underlying our data. While Random Forest exhibited marginally superior AUC values, signifying its robustness in class differentiation, the preference for Logistic Regression was driven by its straightforwardness and the lucidity it offers in result explanation—a critical consideration in our study aimed at decoding complex biological phenomena (Table 1). This approach aligns with recommendations for handling high-dimensional data, underscoring the importance of model interpretability alongside performance (Papoutsoglou et al., 2023). Thus, our decision underscores a deliberate prioritization of analytical clarity and reliability, reinforcing the rationale for our model selection amid a landscape of equally compelling alternatives.
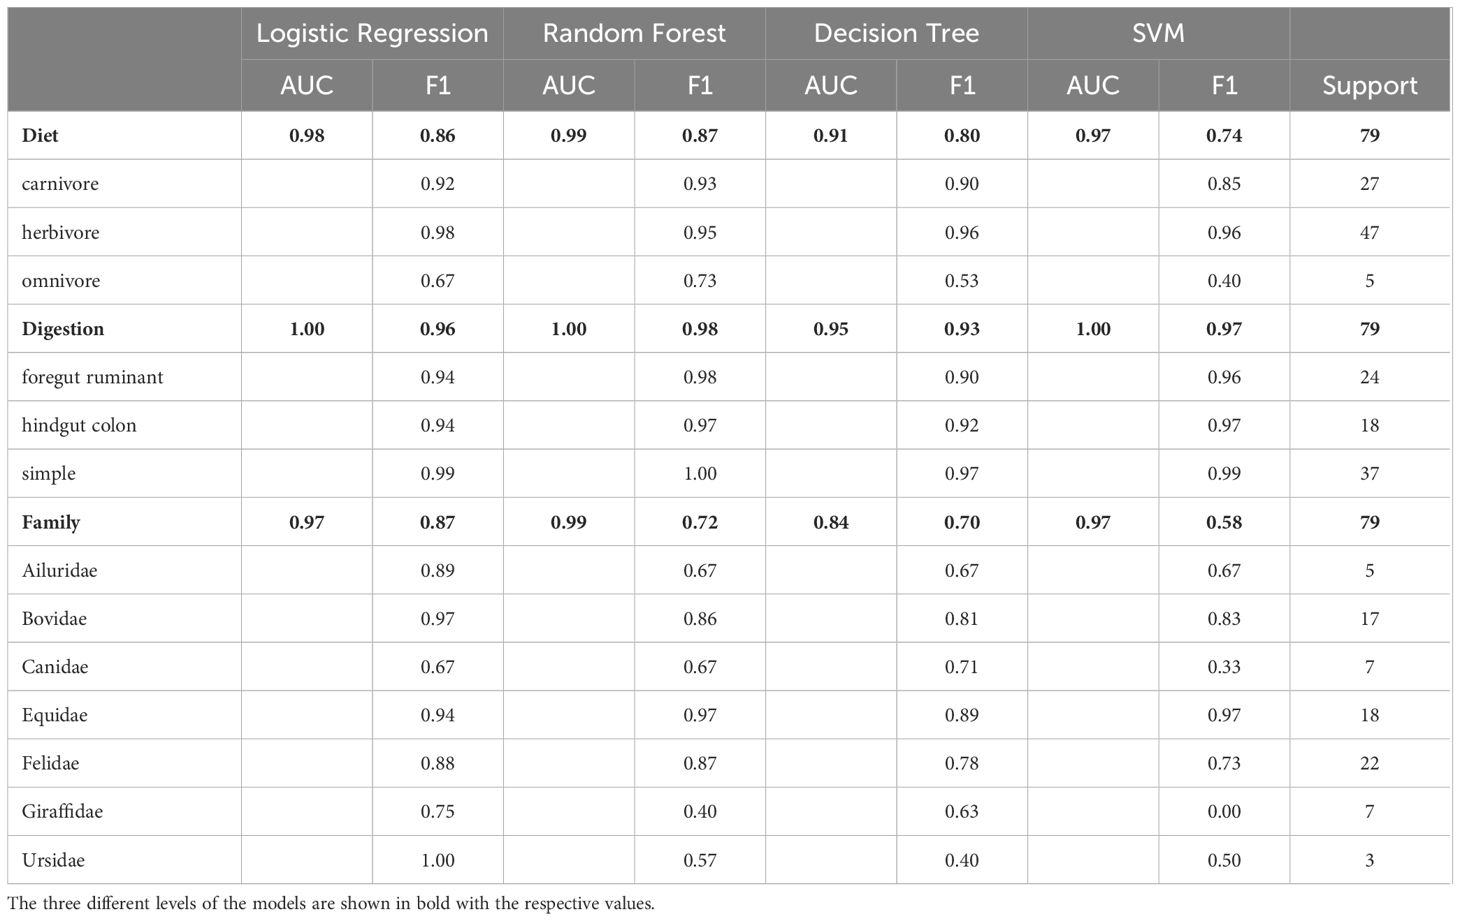
Table 1 Performance comparison of logistic regression, random forest, decision tree and SVM models for predicting diet, digestion and family based on bacteria taxa.
As we expect herbivores, carnivores and omnivores to differ in their microbiota composition, we developed an ensemble model that can accurately identify the diet type (herbivore, carnivore, omnivore) based on the microbiota composition of a fecal sample. The model has an accuracy of 88%. The F1 score for identifying diet type varies between 0.73 for omnivores, 0.87 for carnivores, and 0.93 for herbivores (Table 2). In a second step, the model predicts the digestive system of herbivores to be simple, ruminant, or hindgut fermenter with an overall accuracy of 98%. The hindgut fermenters show the best results (F1 = 1.00), followed by the ruminants (F1 = 0.98) and the simple digestive system (F1 = 0.92). Due to the limited number of samples after this step and the resulting poor results of the model in predicting the host-family, we omitted this step for the herbivores. Nevertheless, since the Equidae is the only family present in the hindgut fermenters in this study, the F1 score applies to this family as well. Another distinguishable host-family due to its unique feature of a simple digestive system is the Ailuridae (F1 = 0.92). Since all carnivores have the same simple digestive system, a discrimination at this level is not necessary here. Instead, the model achieves an accuracy of 79% in distinguishing between host-families. Canidae are distinguished from the other carnivores with a F1 score of 0.93, while Felidae (F1 = 0.82) and Ursidae (F1 = 0.79) are detected with slightly less reliably. However, this step of the model fails to identify the Herpestidae because of an insufficient sample size (F1 = 0.00).
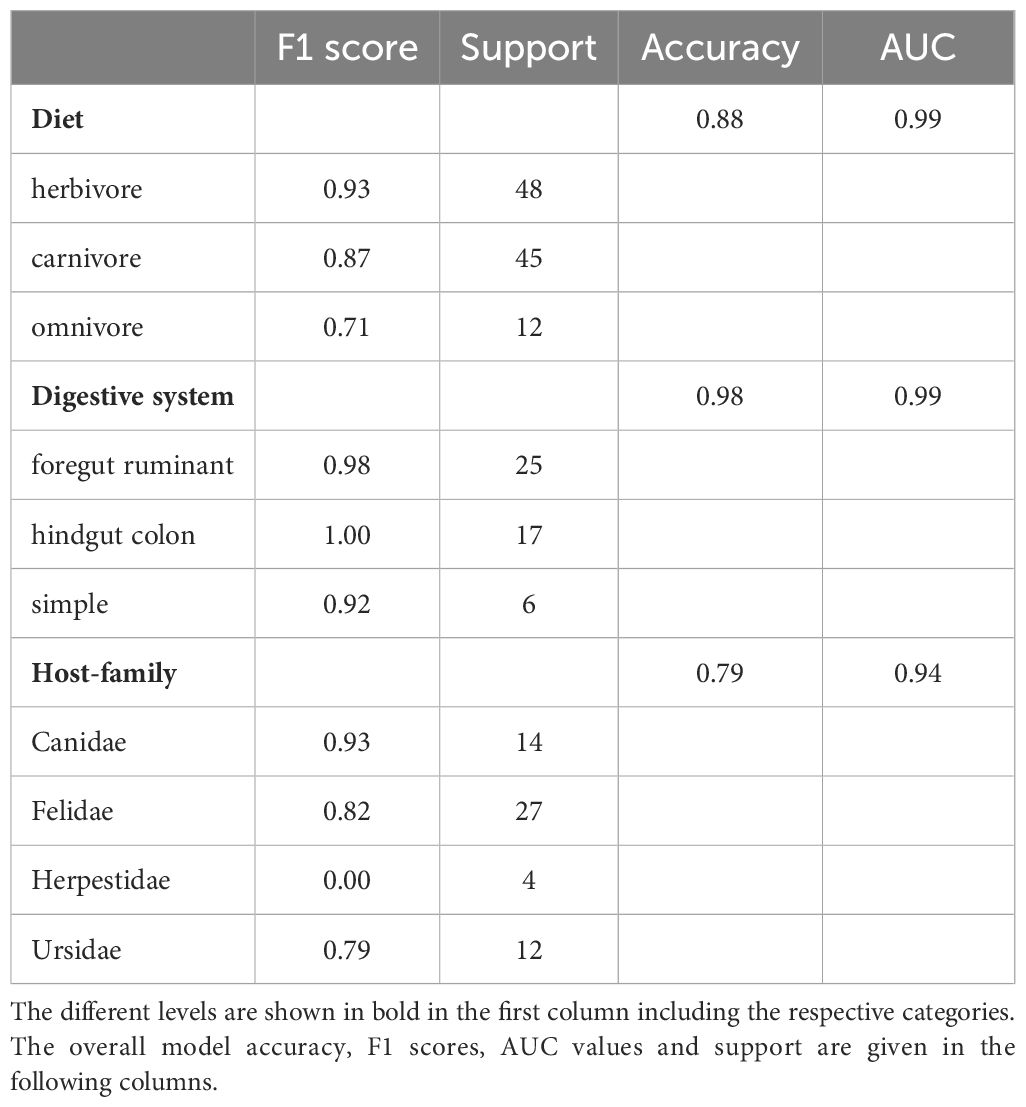
Table 2 Logistic ensemble model to characterize an unknown fecal sample.
4 Discussion
4.1 The influence of diet, digestive system and host phylogeny on the microbiota
We found clear differences in bacterial families correlating with either herbivorous, carnivorous or omnivorous hosts. The greatest divergence between these groups is the number of either positively or negatively correlating bacterial taxa. While herbivores show positive correlations with many taxa, carnivores express the opposite pattern. One reason for this may be the overall higher microbial diversity in the feces of herbivores, which has been demonstrated repeatedly (Ley et al., 2008a; Vital et al., 2014; Youngblut et al., 2019; Guo et al., 2020; Zoelzer et al., 2021). The dependence of herbivores on fermentative bacteria is further supported by the fact that the most strongly correlating taxa are involved in fiber digestion. For example Rikenellaceae and Ruminococcaceae are known as herbivore-specific bacterial families (Milani et al., 2020; Zoelzer et al., 2021) and play an important role in cellulose degradation and fiber digestion (Obregon-Tito et al., 2015; La Reau and Suen, 2018). Another important aspect of fiber digestion by fermentative bacteria is the production of short-chain fatty acids (SCFAs), which serve as an energy source for the host. Spirochaetaceae, which correlate strongly with herbivores, are able to produce the SCFAs butyrate and acetate from different polysaccharide intakes (Pascale et al., 2018; van den Abbeele et al., 2022). In contrast, less positively correlating taxa are found in carnivores. Fusobacteriaceae show strong correlation with carnivore hosts. This family is known to be dominant in meat-based diets and is involved in protein digestion (Vital et al., 2014; An et al., 2017; Badri et al., 2021; Martínez-López et al., 2021). A different pattern is observed within omnivores. Here only one bacterial families is found to correlate positively, Enterococcaceae. Nevertheless, this taxon belong to the phylum Firmicutes, which is known to be highly represented in omnivore species (Sommer et al., 2016; Trujillo et al., 2022a, Trujillo et al., 2022b). Overall, these results suggest that there are considerable differences in the microbiota, especially between herbivores and carnivores/omnivores.
Furthermore, we analyzed microbial taxa that correlate with the morphology of the digestive system. We found clear differences here as well (Figure 1). Both herbivore digestive systems rely on microbial degradation of cellulose and production of SCFA’s, but the site of fermentation differs. As the name indicates, the fermentation in ruminants takes place in the highly comparted forestomach, prior to enzymatic digestion. We identified Ruminococcaceae, Prevotellaceae and Methanobacteriaceae as strongly correlating with this digestive system. The two ruminants assessed in this study, namely Giraffidae and Bovidae, can be distinguished in terms of the methanogenic archaea and Bacteroidales PeH15. While Bovidae correlate strongly with Methanobacteriaceae, Giraffidae do not show a correlation with archaea. The low proportion of Methanobacteriaceae in Giraffidae has also been demonstrated in several studies (Roggenbuck et al., 2014; Zoelzer et al., 2021). The differences between these two ruminants may be due to adaptation to either browsing (Giraffidae) or grazing (Bovidae). Compared to grazing ruminants, browsers have a smaller rumen and larger intestines to increase retention time in the digestive system (Giesecke and van Gylswyk, 1975; Hofmann, 1989; Woodall and Skinner, 1993; Ginnett and Demment, 1997; Clauss et al., 2003; Mitchell, 2021). As methanogenic archaea are responsible for balancing the pH-value in the rumen, as mentioned above, the different archaeal taxa may be adapted to different rumen sizes and compartments.
Hindgut fermenting species are adapted to a microbial fermentation that occurs after the enzymatic digestion. Although the site of fermentation is not the rumen but the large intestine, the fermentation process is quite similar. In this study, we identified Spirochaetaceae and Fibrobacteraceae as significantly correlating with this digestive system in Equidae. This is consistent with previous findings that Spirochaetaceae is a predominant core member in the equid microbiota (Yatsunenko et al., 2012; Obregon-Tito et al., 2015; Edwards et al., 2020). Another important taxon in the Equidae is Fibrobacteraceae (Figures 1, 2). This family consists of only one genus, Fibrobacter. Taxa within this genus are particularly known for their ability to degrade cellulose in low-oxygen environments, and therefore contain many genes encoding glycoside hydrolases (Montgomery et al., 1988; Abdul Rahman et al., 2015). In terms of archaeal taxa, the Equidae are distinct from ruminants. Here, we identified Methanocorpuscularceae as another class of methanogenic archaea within the fecal microbiota of herbivores. This taxon has also been identified in several Equidae species (Edwards et al., 2020) suggesting that the archaeal microbiota is also host- or at least digestion type specific.
Regarding the simple digestive system, strongly correlating taxa such as Fusobacteriaceae and Clostridiaceae, are mainly involved in protein degradation and digestion of high-fat diets, which again strengthens the influence of diet on the microbiota. We found no strong correlations with microbial taxa for Ailuridae, Herpestidae and Canidae host-families, which may be a limitation for the model prediction. Further indications for a possible differentiation of carnivore and omnivore host species can be morphological differences in the simple digestive system. For example, both Ailurus fulgens and Ursus arctos have no caecum so microbial fermentation takes place in the enlarged large intestine (Roberts and Gittleman, 1984; Stevens and Hume, 1995). This increased intestinal surface might be an adaptation for microbial fermentation of plant material.
Overall, the different digestive systems have a strong impact on the respective microbiota and the microbial taxa necessary for the digestive process are important to distinguish between the digestive system or host-families.
4.2 Developing a model to identify host-specific information from the microbiota
The analytical challenge we addressed is a classification problem, with the aim to predict categorical outcomes such as diet, digestion type or host-family, based on the microbiota composition of various species. For such classification issues, logistic regression and decision trees are commonly employed models. Logistic regression is advantageous when the probability of a class membership is a linear function of the features, and it is particularly effective in binary and multinomial scenarios. Decision trees are favored for their interpretability and ease of handling non-linear relationships and have been used in microbiome studies as well (Roguet et al., 2018). In the present study, however, we decided to use logistic regression instead of random forest models. This improved efficacy can be attributed to logistic regression’s resilience against overfitting, especially when the underlying relationship between the predictor variables and the log-odds is linear. Decision trees, while powerful, can sometimes overfit the training data, particularly when the feature space is large, and the model is complex. Given these considerations, logistic regression was selected as the primary model moving forward.
A logistic ensemble model was developed to extract as many host-specific information as possible from an unknown fecal sample. Mainly, the three factors diet, digestive system and host species, that shape the microbiota composition, are of interest. The model accurately distinguishes between the diet type and the herbivore digestive systems with a high model accuracy and nearly perfect F1 scores. This indicates that the model is sound from a computational perspective and furthermore supports the hypothesis that diet and the morphology of the digestive system have a strong influence on the composition of the microbiota (Ley et al., 2008a, Ley et al., 2008b; O' Donnell et al., 2017; Zoelzer et al., 2021). For carnivores, which all have a simple digestive system, we tried to identify the host-family. The overall model accuracy is 79%, but the F1 scores vary between the host-families. The best results are obtained for Canidae (F1 = 0.93) and Felidae (F1 = 0.82) samples. To the best of our knowledge, this is one of the first studies that clearly distinguishes between canid and felid microbiota sample. Many studies focusing on the differences between carnivores, herbivores and omnivores found no distinct clustering of samples from these two groups. In contrast, canids and felids mostly fall into the same cluster and even express a high variability within the respective cluster (Vital et al., 2014; Zhu et al., 2018; Guo et al., 2020). The fact that it is possible to distinguish between these two families using the modeling approach shown here, demonstrates the potential utility of the method in the field of microbiome research. Differences in the microbiota of canids and felids occur e.g. in the respective correlating taxa (Figure 1). While canids correlate with Bacteroidaceae, felids show a correlation with Peptostreptococcaceae that occur in greater proportion in this family. This is in line with the fact that canids are able to cope with higher amounts of dietary carbohydrates and a fiber-rich diet (Deng and Swanson, 2015). Bacteroidaceae are often linked and affected by an increased amount of carbohydrates (Kerr et al., 2013; Panasevich et al., 2015; Vázquez-Baeza et al., 2016) while Peptostreptococcaceae are linked to the dietary protein metabolism (Schulz et al., 2014; Fan et al., 2017). Another aspect in the distinction of the canid and felid microbiota may be phylosymbiosis. Since the Canidae evolved in the Eocene about 40–43 Mya and the Felidae in the Oligocene about 34–24 Mya each microbiota may have evolved with the respective host-family (Wang, 2008; Tedford et al., 2009; Berta, 2011). The classification of the Ursidae results in a F1 score of 0.79, slightly less accurate than the Canidae and Felidae. Overall a distinction of the Ursidae was to be expected. Many descriptive studies on the microbiome of different mammals show that the Ursidae cluster slightly separated from other carnivore species, being grouped together with panda species (Ley et al., 2008a; Zoelzer et al., 2021). During this third step of host-family identification limitations occur in identifying the Herpestidae. Reasons for this may be the small sample size of 20, which is the minimum number that was being applied to the model. Therefore, it is recommended for future studies that for host-family or even species detection, the sample size should be increased.
With an increased sample size, host-family detection would also be possible within the different herbivore digestive systems. The model reaches a very good accuracy for the herbivore digestive systems. Furthermore, Figures 1, 2 suggest that the microbiota of hindgut fermenters such as the Equidae is distinct from other herbivores, so it makes sense that the model is able to identify this host-family. Furthermore, the model reaches a F1 score of 0.92 for the herbivores with a simple digestive system, namely the Ailuridae. This was also expected. As previously discussed, this family is characterized by a herbivore diet, simple digestive system and belongs to the Carnivora. Because of this unique combination of host-specific factors, and the high model accuracy in discriminating diet and digestive system, the Ailuridae can be identified as host-family.
Overall, we have developed a model that is able to predict the host’s diet and digestive system very reliably from a given fecal microbiota composition. Limitations arise in the prediction of host-families which works very well for the carnivores, but more effort is needed to train the model on herbivores. To improve the accuracy of the model, the number of samples per family should be increased considerably. With this enlarged dataset the model is even able to identify host-species without complications. As a guideline, we would use a number of at least 50 samples per species, as this worked well to identify canid and felid host-families. Furthermore, it would be interesting to implement time series data for different individuals per species. As we have shown in a previous study, it is possible to identify individuals, that show a very unique microbiota, based on such datasets (Zoelzer et al., 2023). This was possible because of low-abundant bacterial taxa that varied temporarily within and between individuals. Not only could this improve the model accuracy because of more input data per species, it would also open up a new level beside species recognition – individual identification. Some studies have already successfully identified host-specific factors such as age (Biagi et al., 2012; Yatsunenko et al., 2012; Björk et al., 2019; Low et al., 2022), diet (Ley et al., 2005), health status (Greenblum et al., 2012; Tuddenham and Sears, 2015; Gupta et al., 2020) or even kinship from the microbiota composition, nevertheless this studies were mostly performed on one species. With an ensemble model approach as presented in this study, such host-specific information could be gained from a variety of species, originated from undisclosed fecal samples.
5 Conclusion
We were able to show that diet, digestive system and host-family are influencing factors for an animal’s microbiota. Based on these findings, we developed a logistic ensemble model that is able to identify the host’s diet and digestive system very accurately. Furthermore, the identification of host-families works very well for carnivores, but limitations arose due to small sample sizes. Future studies will overcome these limitations by increasing sample size and including more host species in the model. This will allow future studies to look at other influencing factors, such as seasonal effects on the microbiome caused by dietary changes throughout the year.
Such modeling approaches are very promising in the field of microbiome research as they provide new opportunities to combine the analysis of microbial data with host metadata. This has a wide range of applications, particularly in field studies. With a well curated study design, distinct fecal samples can be easily collected especially from herbivorous species, but host information is usually rare or difficult to collect non-invasively. Currently, this is usually done by fecal microsatellite analysis. Unfortunately, this method is cost-intensive because microsatellite loci need to be described for a species or at least a group of animals, and multiple microsatellites are required for species identification (Kurose et al., 2005; Miller et al., 2016; Walker et al., 2019). Another limitation is the need for high quality host DNA, which is possible but difficult to obtain from fecal samples. Therefore, the modeling approach to gain as much host specific information as possible from the fecal microbial composition is promising as it is more cost- and labor efficient than traditional approaches and opens up a new field in microbiome research.
Data availability statement
The datasets presented in this study can be found in online repositories. The names of the repository/repositories and accession number(s) can be found below: https://www.ncbi.nlm.nih.gov/, PRJNA1068843; https://www.ncbi.nlm.nih.gov/, PRJNA912880; https://www.ncbi.nlm.nih.gov/, PRJNA716130.
Author contributions
FZ: Conceptualization, Data curation, Formal analysis, Methodology, Visualization, Writing – original draft, Writing – review & editing. DS: Conceptualization, Methodology, Software, Writing – original draft, Writing – review & editing. PD: Funding acquisition, Project administration, Supervision, Writing – review & editing.
Funding
The author(s) declare financial support was received for the research, authorship, and/or publication of this article. Open-access funding enabled and organized by Open-Access publication fond of the Goethe University. FZ and PD were supported by Opel-Zoo Foundation Professorship in Zoo Biology from the “von Opel Hessische Zoostiftung” and by the “Vereinigung von Freunden und Förderern der Goethe-Universität e.V.”.
Acknowledgments
We gratefully acknowledge support from the directors, curators and especially keepers of Berlin zoo, Tierpark Berlin, Vivarium Darmstadt, Zoo Dortmund, Zoo Duisburg, Zoo Frankfurt, Zoom Erlebniswelt Gelsenkirchen, Zoo Heidelberg, Kölner Zoo, Zoo Krefeld, Zoo Landau in der Pfalz, Zoo Neuwied, Tiergarten Nürnberg, Opel-Zoo, Zoo Schwerin, Wilhelma Stuttgart and Wuppertal Zoo, who enabled this project.
Conflict of interest
The authors declare that the research was conducted in the absence of any commercial or financial relationships that could be construed as a potential conflict of interest.
Publisher’s note
All claims expressed in this article are solely those of the authors and do not necessarily represent those of their affiliated organizations, or those of the publisher, the editors and the reviewers. Any product that may be evaluated in this article, or claim that may be made by its manufacturer, is not guaranteed or endorsed by the publisher.
Supplementary material
The Supplementary Material for this article can be found online at: https://www.frontiersin.org/articles/10.3389/fmamm.2024.1380915/full#supplementary-material
Supplementary Table 1 | Metadata of all samples.
Supplementary Table 2 | Results of the spearman correlation presented as correlation coefficients and p-values for all bacterial taxa with the respective metadata categories.
References
Abdul Rahman N., Parks D. H., Vanwonterghem I., Morrison M., Tyson G. W., Hugenholtz P. (2015). A phylogenomic analysis of the bacterial phylum fibrobacteres. Front. Microbiol. 6. doi: 10.3389/fmicb.2015.01469
An C., Okamoto Y., Xu S., Eo K. Y., Kimura J., Yamamoto N. (2017). Comparison of fecal microbiota of three captive carnivore species inhabiting Korea. J. Vet. Med. Sci. 79, 542–546. doi: 10.1292/jvms.16-0472
Apprill A., McNally S., Parsons R., Weber L. (2015). Minor revision to V4 region SSU rRNA 806R gene primer greatly increases detection of SAR11 bacterioplankton. Aquat. Microb. Ecol. 75, 129–137. doi: 10.3354/ame01753
Badri D. V., Jackson M. I., Jewell D. E. (2021). Dietary protein and carbohydrate levels affect the gut microbiota and clinical assessment in healthy adult cats. J. Nutr. 151, 3637–3650. doi: 10.1093/jn/nxab308
Berta A. (2011). Carnivoran evolution: new views on phylogeny, form and function. Systematic Biol. 60, 241–243. doi: 10.1093/sysbio/syq087
Biagi E., Candela M., Fairweather-Tait S., Franceschi C., Brigidi P. (2012). Aging of the human metaorganism: the microbial counterpart. Age (Dordr) 34, 247–267. doi: 10.1007/s11357-011-9217-5
Björk J. R., Dasari M., Grieneisen L., Archie E. A. (2019). Primate microbiomes over time: Longitudinal answers to standing questions in microbiome research. Am. J. Primatol 81, e22970. doi: 10.1002/ajp.22970
Bokulich N. A., Kaehler B. D., Rideout J. R., Dillon M., Bolyen E., Knight R., et al. (2018). Optimizing taxonomic classification of marker-gene amplicon sequences with QIIME 2's q2-feature-classifier plugin. Microbiome 6, 90. doi: 10.1186/s40168-018-0470-z
Bolker B. M., Brooks M. E., Clark C. J., Geange S. W., Poulsen J. R., Stevens M. H. H., et al. (2009). Generalized linear mixed models: a practical guide for ecology and evolution. Trends Ecol. Evol. 24, 127–135. doi: 10.1016/j.tree.2008.10.008
Bolyen E., Rideout J. R., Dillon M. R., Bokulich N. A., Abnet C. C., Al-Ghalith G. A., et al. (2019). Reproducible, interactive, scalable and extensible microbiome data science using QIIME 2. Nat. Biotechnol. 37, 852–857. doi: 10.1038/s41587-019-0209-9
Callahan B. J., McMurdie P. J., Rosen M. J., Han A. W., Johnson A. J. A., Holmes S. P. (2016). DADA2: High-resolution sample inference from Illumina amplicon data. Nat. Methods 13, 581–583. doi: 10.1038/nmeth.3869
Caporaso J. G., Lauber C. L., Walters W. A., Berg-Lyons D., Huntley J., Fierer N., et al. (2012). Ultra-high-throughput microbial community analysis on the Illumina HiSeq and MiSeq platforms. ISME J. 6, 1621–1624. doi: 10.1038/ismej.2012.8
Clauss M., Lechner-Doll M., Streich W. J. (2003). Ruminant diversification as an adaptation to the physicomechanical characteristics of forage. Oikos 102, 253–262. doi: 10.1034/j.1600-0706.2003.12406.x
Deng P., Swanson K. S. (2015). Gut microbiota of humans, dogs and cats: current knowledge and future opportunities and challenges. Br. J. Nutr. 113 Suppl, S6–17. doi: 10.1017/S0007114514002943
Duvallet C., Gibbons S. M., Gurry T., Irizarry R. A., Alm E. J. (2017). Meta-analysis of gut microbiome studies identifies disease-specific and shared responses. Nat. Commun. 8, 1784. doi: 10.1038/s41467-017-01973-8
Edwards J. E., Shetty S. A., van den Berg P., Burden F., van Doorn D. A., Pellikaan W. F., et al. (2020). Multi-kingdom characterization of the core equine fecal microbiota based on multiple equine (sub)species. Anim. Microbiome 2, 6. doi: 10.1186/s42523-020-0023-1
Espinoza J. L. (2018). Machine learning for tackling microbiota data and infection complications in immunocompromised patients with cancer. J. Intern. Med. 284 (2), 189–192. doi: 10.1111/joim.12746
Fan P., Liu P., Song P., Chen X., Ma X. (2017). Moderate dietary protein restriction alters the composition of gut microbiota and improves ileal barrier function in adult pig model. Sci. Rep. 7, 43412. doi: 10.1038/srep43412
Giesecke D., van Gylswyk N. O. (1975). A study of feeding types and certain rumen functions in six species of South African wild ruminants. J. Agric. Sci. 85, 75–83. doi: 10.1017/S0021859600053430
Ginnett T. F., Demment M. W. (1997). Sex differences in giraffe foraging behavior at two spatial scales. Oecologia 110, 291–300. doi: 10.1007/s004420050162
Greenblum S., Turnbaugh P. J., Borenstein E. (2012). Metagenomic systems biology of the human gut microbiome reveals topological shifts associated with obesity and inflammatory bowel disease. Proc. Natl. Acad. Sci. U.S.A. 109, 594–599. doi: 10.1073/pnas.1116053109
Guo X., Lei H., Zhang K., Ke F., Song C. (2020). Diversification of animal gut microbes and NRPS gene clusters in some carnivores, herbivores and omnivores. Biotechnol. Biotechnol. Equip. 34, 1280–1287. doi: 10.1080/13102818.2020.1835536
Gupta V. K., Kim M., Bakshi U., Cunningham K. Y., Davis J. M., Lazaridis K. N., et al. (2020). A predictive index for health status using species-level gut microbiome profiling. Nat. Commun. 11, 4635. doi: 10.1038/s41467-020-18476-8
Hofmann R. R. (1989). Evolutionary steps of ecophysiological adaptation and diversification of ruminants: a comparative view of their digestive system. Oecologia 78, 443–457. doi: 10.1007/BF00378733
James G., Witten D., Hastie T., Tibshirani R. (2013). An introduction to statistical learning: With applications in R (New York: Springer). doi: 10.1007/978-1-4614-7138-7
Kartzinel T. R., Hsing J. C., Musili P. M., Brown B. R. P., Pringle R. M. (2019). Covariation of diet and gut microbiome in African megafauna. Proc. Natl. Acad. Sci. U.S.A. 116, 23588–23593. doi: 10.1073/pnas.1905666116
Katoh K., Misawa K., Kuma K.-I., Miyata T. (2002). MAFFT: a novel method for rapid multiple sequence alignment based on fast Fourier transform. Nucleic Acids Res. 30, 3059–3066. doi: 10.1093/nar/gkf436
Kerr K. R., Forster G., Dowd S. E., Ryan E. P., Swanson K. S. (2013). Effects of dietary cooked navy bean on the fecal microbiome of healthy companion dogs. PloS One 8, e74998. doi: 10.1371/journal.pone.0074998
Knowles S. C. L., Eccles R. M., Baltrūnaitė L. (2019). Species identity dominates over environment in shaping the microbiota of small mammals. Ecol. Lett. 22, 826–837. doi: 10.1111/ele.13240
Koh A., Vadder F., Kovatcheva-Datchary P., Bäckhed F. (2016). From dietary fiber to host physiology: short-chain fatty acids as key bacterial metabolites. Cell 165, 1332–1345. doi: 10.1016/j.cell.2016.05.041
Korpela K., Flint H. J., Johnstone A. M., Lappi J., Poutanen K., Dewulf E., et al. (2014). Gut microbiota signatures predict host and microbiota responses to dietary interventions in obese individuals. PloS One 9, e90702. doi: 10.1371/journal.pone.0090702
Kurose N., Masuda R., Tatara M. (2005). Fecal DNA analysis for identifying species and sex of sympatric carnivores: a noninvasive method for conservation on the Tsushima Islands, Japan. J. Hered 96, 688–697. doi: 10.1093/jhered/esi124
La Reau A. J., Suen G. (2018). The Ruminococci: key symbionts of the gut ecosystem. J. Microbiol. 56, 199–208. doi: 10.1007/s12275-018-8024-4
Ley R. E., Bäckhed F., Turnbaugh P., Lozupone C. A., Knight R. D., Gordon J. I. (2005). Obesity alters gut microbial ecology. Proc. Natl. Acad. Sci. U.S.A. 102, 11070–11075. doi: 10.1073/pnas.0504978102
Ley R. E., Hamady M., Lozupone C., Turnbaugh P. J., Ramey R. R., Bircher J. S., et al. (2008a). Evolution of mammals and their gut microbes. Science 320, 1647–1651. doi: 10.1126/science.1155725
Ley R. E., Lozupone C. A., Hamady M., Knight R., Gordon J. I. (2008b). Worlds within worlds: evolution of the vertebrate gut microbiota. Nat. Rev. Microbiol. 6, 776–788. doi: 10.1038/nrmicro1978
Li J., Zhan S., Liu X., Lin Q., Jiang J., Li X. (2018). Divergence of fecal microbiota and their associations with host phylogeny in cervinae. Front. Microbiol. 9. doi: 10.3389/fmicb.2018.01823
Lim S. J., Bordenstein S. R. (2020). An introduction to phylosymbiosis. Proc. Biol. Sci. 287. doi: 10.1098/rspb.2019.2900
Low A., Soh M., Miyake S., Seedorf H. (2022). Host age prediction from fecal microbiota composition in male C57BL/6J mice. Microbiol. Spectr. 10, e0073522. doi: 10.1128/spectrum.00735-22
Mackie R. I. (2002). Mutualistic fermentative digestion in the gastrointestinal tract: diversity and evolution. Integr. Comp. Biol. 42, 319–326. doi: 10.1093/icb/42.2.319
Martínez-López L. M., Pepper A., Pilla R., Woodward A. P., Suchodolski J. S., Mansfield C. (2021). Effect of sequentially fed high protein, hydrolyzed protein, and high fiber diets on the fecal microbiota of healthy dogs: a cross-over study. Anim. Microbiome 3, 42. doi: 10.1186/s42523-021-00101-8
Milani C., Alessandri G., Mancabelli L., Mangifesta M., Lugli G. A., Viappiani A., et al. (2020). Multi-omics approaches to decipher the impact of diet and host physiology on the mammalian gut microbiome. Appl. Environ. Microbiol. 86, 1820–1864. doi: 10.1128/AEM.01864-20
Miller S. M., Clarke A. B., Bloomer P., Guthrie A. J., Harper C. K. (2016). Evaluation of microsatellites for common ungulates in the South African wildlife industry. Conserv. Genet. Resour 8, 329–341. doi: 10.1007/s12686-016-0554-7
Mitchell G. (2021). ““The machinery of digestion,“,” in How giraffes work. Ed. Mitchell G. (Oxford University Press, New York), 147–186.
Montgomery L., Flesher B., Stahl D. (1988). Transfer of Bacteroides succinogenes (Hungate) to Fibrobacter gen. nov. as Fibrobacter succinogenes comb. nov. and Description of Fibrobacter intestinalis sp. nov. Int. J. Systematic Bacteriology 38, 430–435. doi: 10.1099/00207713-38-4-430
Muegge B. D., Kuczynski J., Knights D., Clemente J. C., González A., Fontana L., et al. (2011). Diet drives convergence in gut microbiome functions across mammalian phylogeny and within humans. Science 332, 970–974. doi: 10.1126/science.1198719
Nelson T. M., Apprill A., Mann J., Rogers T. L., Brown M. V. (2015). The marine mammal microbiome: current knowledge and future directions. Microbiol. Aust. 36, 8. doi: 10.1071/MA15004
Nishida A. H., Ochman H. (2018). Rates of gut microbiome divergence in mammals. Mol. Ecol. 27, 1884–1897. doi: 10.1111/mec.14473
O' Donnell M. M., Harris H. M. B., Ross R. P., O'Toole P. W. (2017). Core fecal microbiota of domesticated herbivorous ruminant, hindgut fermenters, and monogastric animals. Microbiologyopen 6. doi: 10.1002/mbo3.509
Obregon-Tito A. J., Tito R. Y., Metcalf J., Sankaranarayanan K., Clemente J. C., Ursell L. K., et al. (2015). Subsistence strategies in traditional societies distinguish gut microbiomes. Nat. Commun. 6, 6505. doi: 10.1038/ncomms7505
Ochman H., Worobey M., Kuo C.-H., Ndjango J.-B. N., Peeters M., Hahn B. H., et al. (2010). Evolutionary relationships of wild hominids recapitulated by gut microbial communities. PloS Biol. 8, e1000546. doi: 10.1371/journal.pbio.1000546
Panasevich M. R., Kerr K. R., Dilger R. N., Fahey G. C., Guérin-Deremaux L., Lynch G. L., et al. (2015). Modulation of the faecal microbiome of healthy adult dogs by inclusion of potato fibre in the diet. Br. J. Nutr. 113, 125–133. doi: 10.1017/S0007114514003274
Pannoni S. B., Proffitt K. M., Holben W. E. (2022). Non-invasive monitoring of multiple wildlife health factors by fecal microbiome analysis. Ecol. Evol. 12, e8564. doi: 10.1002/ece3.8564
Papoutsoglou G., Tarazona S., Lopes M. B., Klammsteiner T., Ibrahimi E., Eckenberger J., et al. (2023). Machine learning approaches in microbiome research: challenges and best practices. Front. Microbiol. 14. doi: 10.3389/fmicb.2023.1261889
Pascale A., Marchesi N., Marelli C., Coppola A., Luzi L., Govoni S., et al. (2018). Microbiota and metabolic diseases. Endocrine 61, 357–371. doi: 10.1007/s12020-018-1605-5
Quast C., Pruesse E., Yilmaz P., Gerken J., Schweer T., Yarza P., et al. (2013). The SILVA ribosomal RNA gene database project: improved data processing and web-based tools. Nucleic Acids Res. 41, D590–D596. doi: 10.1093/nar/gks1219
R Core Team (2022). R: A language and environment for statistical computing (Vienna, Austria: R Foundation for Statistical Computing).
Ríos-Covián D., Ruas-Madiedo P., Margolles A., Gueimonde M., de Los Reyes-Gavilán C. G., Salazar N. (2016). Intestinal short chain fatty acids and their link with diet and human health. Front. Microbiol. 7. doi: 10.3389/fmicb.2016.00185
Roggenbuck M., Sauer C., Poulsen M., Bertelsen M. F., Sørensen S. J. (2014). The giraffe (Giraffa camelopardalis) rumen microbiome. FEMS Microbiol. Ecol. 90, 237–246. doi: 10.1111/fem.2014.90.issue-1
Roguet A., Eren A. M., Newton R. J., McLellan S. L. (2018). Fecal source identification using random forest. Microbiome 6, 185. doi: 10.1186/s40168-018-0568-3
Rojas C. A., Ramírez-Barahona S., Holekamp K. E., Theis K. R. (2021). Host phylogeny and host ecology structure the mammalian gut microbiota at different taxonomic scales. Anim. Microbiome 3, 33. doi: 10.1186/s42523-021-00094-4
Sanna S., van Zuydam N. R., Mahajan A., Kurilshikov A., Vich Vila A., Võsa U., et al. (2019). Causal relationships among the gut microbiome, short-chain fatty acids and metabolic diseases. Nat. Genet. 51, 600–605. doi: 10.1038/s41588-019-0350-x
Schulz M. D., Atay C., Heringer J., Romrig F. K., Schwitalla S., Aydin B., et al. (2014). High-fat-diet-mediated dysbiosis promotes intestinal carcinogenesis independently of obesity. Nature 514, 508–512. doi: 10.1038/nature13398
Sommer F., Ståhlman M., Ilkayeva O., Arnemo J. M., Kindberg J., Josefsson J., et al. (2016). The gut microbiota modulates energy metabolism in the hibernating brown bear ursus arctos. Cell Rep. 14, 1655–1661. doi: 10.1016/j.celrep.2016.01.026
Stevens C. E., Hume I. D. (1995). Comparative physiology of the vertebrate digestive system (Cambridge: Cambridge University Press).
Sweeny A. R., Lemon H., Ibrahim A., Watt K. A., Wilson K., Childs D. Z., et al. (2023). A mixed-model approach for estimating drivers of microbiota community composition and differential taxonomic abundance. mSystems 8, e0004023. doi: 10.1128/msystems.00040-23
Takahashi S., Tomita J., Nishioka K., Hisada T., Nishijima M. (2014). Development of a prokaryotic universal primer for simultaneous analysis of Bacteria and Archaea using next-generation sequencing. PloS One 9, e105592. doi: 10.1371/journal.pone.0105592
Tedford R. H., Wang X., Taylor B. E. (2009). Phylogenetic systematics of the North American fossil caninae (Carnivora: canidae). Bull. Am. Museum Natural History 325, 1–218. doi: 10.1206/574.1
Trujillo S. M., McKenney E. A., Hilderbrand G. V., Mangipane L. S., Rogers M. C., Joly K., et al. (2022a). Correlating gut microbial membership to brown bear health metrics. Sci. Rep. 12, 15415. doi: 10.1038/s41598-022-19527-4
Trujillo S. M., McKenney E. A., Hilderbrand G. V., Mangipane L. S., Rogers M. C., Joly K., et al. (2022b). Intrinsic and extrinsic factors influence on an omnivore's gut microbiome. PloS One 17, e0266698. doi: 10.1371/journal.pone.0266698
Tuddenham S., Sears C. L. (2015). The intestinal microbiome and health. Curr. Opin. Infect. Dis. 28, 464–470. doi: 10.1097/QCO.0000000000000196
van den Abbeele P., Ghyselinck J., Marzorati M., Koch A.-M., Lambert W., Michiels J., et al. (2022). The effect of amino acids on production of SCFA and bCFA by members of the porcine colonic microbiota. Microorganisms 10. doi: 10.3390/microorganisms10040762
Vázquez-Baeza Y., Hyde E. R., Suchodolski J. S., Knight R. (2016). Dog and human inflammatory bowel disease rely on overlapping yet distinct dysbiosis networks. Nat. Microbiol. 1, 16177. doi: 10.1038/nmicrobiol.2016.177
Vital M., Gao J., Rizzo M., Harrison T., Tiedje J. M. (2014). Diet is a major factor governing the fecal butyrate-producing community structure across Mammalia, Aves and Reptilia. ISME J. 9, 832–843. doi: 10.1038/ismej.2014.179
Walker F. M., Tobin A., Simmons N. B., Sobek C. J., Sanchez D. E., Chambers C. L., et al. (2019). A fecal sequel: Testing the limits of a genetic assay for bat species identification. PloS One 14, e0224969. doi: 10.1371/journal.pone.0224969
Wang X. (2008). Dogs: their fossil relatives and evolutionary history (New York: Columbia University Press). doi: 10.7312/wang13528
Woodall P. F., Skinner J. D. (1993). Dimensions of the intestine, diet and faecal water loss in some African antelope. J. Zoology 229, 457–471. doi: 10.1111/j.1469-7998.1993.tb02648.x
Wu X., Wei Q., Wang X., Shang Y., Zhang H. (2022). Evolutionary and dietary relationships of wild mammals based on the gut microbiome. Gene 808, 145999. doi: 10.1016/j.gene.2021.145999
Yatsunenko T., Rey F. E., Manary M. J., Trehan I., Dominguez-Bello M. G., Contreras M., et al. (2012). Human gut microbiome viewed across age and geography. Nature 486, 222–227. doi: 10.1038/nature11053
Yazdani M., Taylor B. C., Debelius J. W., Li W., Knight R., Smarr L. (2016). “Using machine learning to identify major shifts in human gut microbiome protein family abundance in disease,” in IEEE international conference on big data. 1272–1280. doi: 10.1109/BigData.2016.7840731
Youngblut N. D., Reischer G. H., Walters W., Schuster N., Walzer C., Stalder G., et al. (2019). Host diet and evolutionary history explain different aspects of gut microbiome diversity among vertebrate clades. Nat. Commun. 10, 2200. doi: 10.1038/s41467-019-10191-3
Zhu L., Yang Z., Yao R., Xu L., Chen H., Gu X., et al. (2018). Potential mechanism of detoxification of cyanide compounds by gut microbiomes of bamboo-eating pandas. mSphere 3, 218–229. doi: 10.1128/mSphere.00229-18
Zoelzer F., Burger A. L., Dierkes P. W. (2021). Unraveling differences in fecal microbiota stability in mammals: from high variable carnivores and consistently stable herbivores. Anim. Microbiome 3, 77. doi: 10.1186/s42523-021-00141-0
Keywords: 16S rRNA gene, microbiota, logistic regression, phylosymbiosis, animal
Citation: Zoelzer F, Monteiro DdS and Dierkes PW (2024) Development and evaluation of an ensemble model to identify host-related metadata from fecal microbiota of zoo-housed mammals. Front. Mamm. Sci. 3:1380915. doi: 10.3389/fmamm.2024.1380915
Received: 02 February 2024; Accepted: 20 May 2024;
Published: 06 June 2024.
Edited by:
Jan Kopečný, Academy of Sciences of the Czech Republic (ASCR), CzechiaReviewed by:
Attila Németh, University of Debrecen, HungaryFrancisco Ceacero, Czech University of Life Sciences Prague, Czechia
Copyright © 2024 Zoelzer, Monteiro and Dierkes. This is an open-access article distributed under the terms of the Creative Commons Attribution License (CC BY). The use, distribution or reproduction in other forums is permitted, provided the original author(s) and the copyright owner(s) are credited and that the original publication in this journal is cited, in accordance with accepted academic practice. No use, distribution or reproduction is permitted which does not comply with these terms.
*Correspondence: Franziska Zoelzer, em9lbHplckBiaW8udW5pLWZyYW5rZnVydC5kZQ==