 Mahbod Entezami1*
 Martina Nocerino2
 Jo Widdicombe1Antonio Bosco2
 Giuseppe Cringoli2
 Adriano Casulli3,4Giovanni Lo Iacono1
 Laura Rinaldi2
 Joaquin M. Prada1
- 1School of Veterinary Medicine, University of Surrey, Guildford, United Kingdom
- 2Unit of Parasitology and Parasitic Diseases, Department of Veterinary Medicine and Animal Production, University of Naples Federico II, Naples, Italy
- 3European Union Reference Laboratory for Parasites, Department of Infectious Diseases, Istituto Superiore di Sanità, Rome, Italy
- 4World Health Organization (WHO) Collaborating Centre for the Epidemiology, Detection and Control of Cystic and Alveolar Echinococcosis, Department of Infectious Diseases, Istituto Superiore di Sanità, Rome, Italy
Introduction: Cystic echinococcosis (CE) is a zoonotic parasite caused by the cestode Echinococcus granulosus sensu lato (s.l.) which predominantly affects livestock. The disease is endemic in central-southern and insular Italy, with CE particularly infecting sheep, goats, cattle, and water buffalo. The spatial distribution of CE in endemic regions is not widely understood, with surveillance efforts varying across the region.
Methods: In this study, we investigated the spatial distribution of CE in livestock using samples from farms across different livestock species using a Stochastic Partial Differential Equations (SPDE) model. Samples were collected during a survey conducted in the area of central-southern and insular Italy between the years 2019 – 2021.
Results: A total of 3141 animal samples (126 goats, 601 sheep and 2414 cattle and water buffalo) were inspected for Echinococcus s.l. cysts through routine surveillance in abattoirs by postmortem visual examination, palpation and incision of target organs. The geographic location of the farm of origin (a total of 2,878) for each sample was recorded. CE prevalence of 46.0% (1,323/2,878) was estimated at the farm level with 78.3% (462/590) of farms with sheep, 28.6% (36/126) of farms with goats, 36.5% (747/2,049) of farms with cattle, and 23.5% (102/434) of farms with water buffalo infected.
Discussion: The spatial model evaluated the probability of infection in farms across the sampled regions, with the distribution of CE showing high clustering of infected cattle farms in Sardinia and Sicily regions, and sheep farms in Salerno province (Campania region). The output of this study can be used to identify CE hot-spots and to improve surveillance and control programs in endemic areas of Italy.
Introduction
Cystic echinococcosis (CE) is a zoonotic parasitic disease caused by the tapeworm Echinococcus granulosus sensu lato (s.l.). The parasite’s life cycle involves a variety of wild and domestic ungulates as the intermediate host and canids as the definitive host. In pastoral farming, the disease most commonly infects livestock animals such as sheep, goats, cattle, pigs and dogs. Intermediate hosts become infected through the ingestion of E. granulosus s.l. eggs in the pasture, which have been excreted by the definitive host. Subsequently, the eggs hatch in the intestine and after penetrating the gut wall, form Echinococcus s.l. cysts on the intermediate host organs, most commonly the liver and lungs. After some time these cysts will become fertile and start producing protoscoleces. Definitive hosts are infected when they consume E. granulosus s.l. protoscoleces (1) through deliberate feeding of infested offal by owners or through scavenging. Humans are dead-end hosts and are infected through the consumption of food and water contaminated with eggs, or by hand-to-mouth contact and close contact with dogs (2).
E. granulosus s.l. is globally distributed and is endemic in Central Asia, Eastern Europe, Northern Africa, Mediterranean countries, the Middle East, Southern Africa, and South America (3, 4). E. granulosus s.l. is a species complex that includes several species (genotypes). E. granulosus sensu stricto (s.s.) (G1, G3), E. orteppi (G4), E. equinus (G5), E. canadensis (G6/7, G8, G10), and E. felidis (5, 6), with different spatial distributions. E. granulosus s.s. (G1) is responsible for the majority of infections in humans worldwide (7). In Italy, cases in intermediate hosts including humans are predominantly caused by E. granulosus s.s. (8). E. granulosus s.s. is also considered to be responsible for most cases in cattle across Europe (9). Studies have shown that while the prevalence in farms can be below 1% in northern regions of Italy, 10 presents evidence of outbreaks in shepherd dog populations. On the other hand, the central-southern and insular regions of Italy can reach a prevalence of more than 50% (11–13). The annual human incidence of CE has been found to be as high as 6.41 per 100,000 people in these regions (14).
CE inflicts a considerable financial burden on the public health and animal sector. It is estimated that CE affects one million people worldwide, and has an estimated global burden of 184,000 disability-adjusted life-years (DALYs), comparable to other diseases such as Dengue, Chagas disease, and African trypanosomiasis (15). Cysts developed on the organs of an infected human can cause morbidity and mortality, however, the latter only occurs in a small minority of patients (16). CE is responsible for 3 billion dollars worth of losses a year in the agricultural sector. Production losses are incurred due to contaminated offal and decreased livestock performance, such as reduced carcass weight and milk production (4, 17). Individuals affected by CE are sometimes hard-to-reach, in particular those living in marginalized pastoral communities.
The World Health Organization (WHO) includes the echinococcosis disease group (cystic and alveolar echinococcosis) as one of its 20 neglected tropical diseases (NTDs). As part of the WHO 2030 roadmap to end the neglect of NTDs, the objective for CE is to increase the number of countries with intensified control from 1 (in 2020) to 17. One of the critical actions listed to achieve this goal is to “Map disease prevalence to establish baseline data, and strengthen integrated national surveillance” (18). Much of the established mapping describes prevalence at a regional level, without considering that prevalence can differ greatly between contiguous areas. Current surveillance data that highlights disease hotspots can be used to identify areas which require control measures implementation (19).
Here, we compiled surveillance data from routine sampling in abattoirs to map the spatial distribution of CE in ruminant farms across Italy at a fine spatial scale. The risk of infection was estimated from the probability that a farm is infected, defined as returning a positive sample for CE. The evaluation was also carried out for each species individually, to assess indicators of infection hotspots.
Methods
Data source and collection
In this study samples were collected during a survey conducted in the area of central-southern and insular Italy from 2019 to 2021. The routine inspection of the animals slaughtered was carried out for hydatid cysts by post-mortem visual examination, palpation, and incision of target organs (heart, kidneys, liver, lungs, and spleen). When cysts were found, these were dissected and the cystic structure was carefully inspected to evaluate the morphostructural types (unilocular, multiseptate, calcified, caseous and hyperlaminated) in accordance with the methodology by Conchedda (20) and Bosco (12). The structural and morphological evaluation of each cyst found, allowed the diagnosis of CE cysts with certainty. Once CE cysts were detected, the animal, and the farm to which it belonged, were classified as positive. The ID and geographical location of the farm the animals originated from were recorded. Cattle and water buffalo samples were mostly collected from Sardinia, Sicily, and central-southern Italy. Sheep data collection available to us was limited to the Basilicata and Campania regions, and goat data collection was limited to Basilicata only, Figure 1. Further detail of the location of sample farms can be viewed in Supplementary Figure 1.
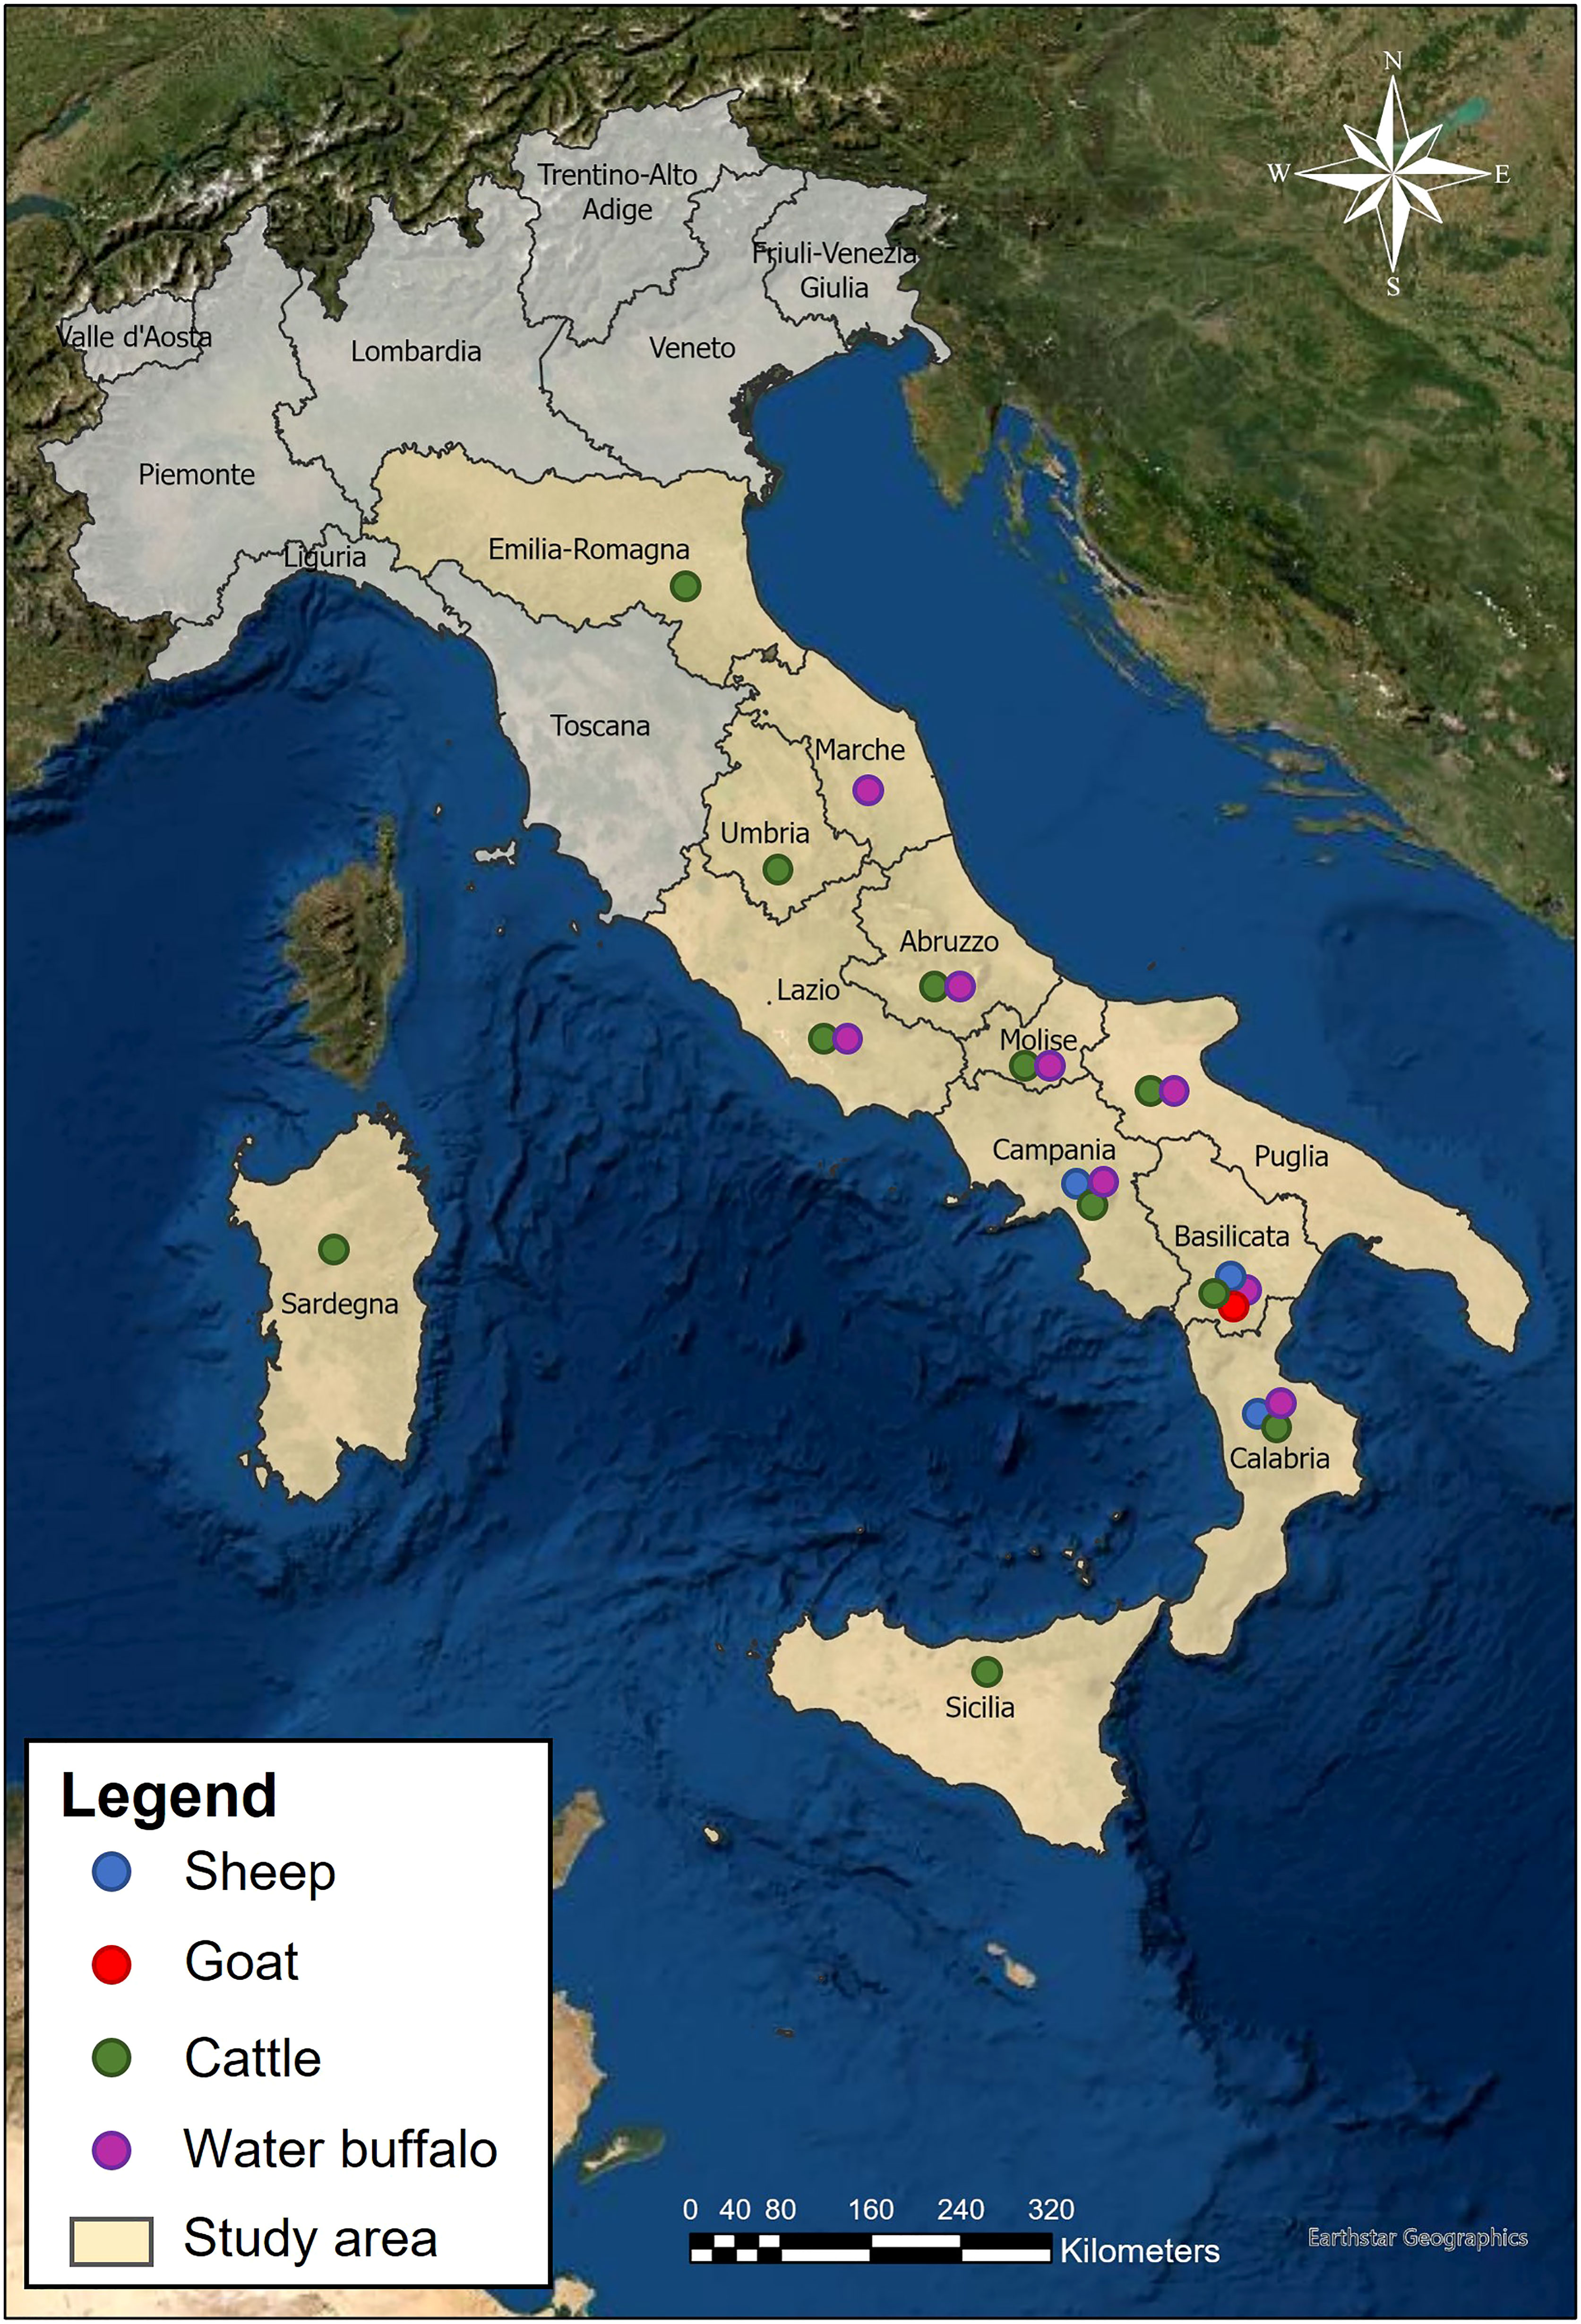
Figure 1 The spatial distribution of the samples in the study area, by species.
3,141 animals were sampled from 2,878 farms across 12 regions of Italy, Table 1. This included samples from 126 goats, 601 sheep and 2,414 cattle and water buffalo. Many samples originated from farms which contained both cattle and water buffalo; in these cases, they were classified as both “cattle farms” and “water buffalo farms” for further analysis. All samples that originated from the same location were assumed to be from the same farm. A total of 349 samples shared locations with other samples and 247 locations were the point of origin for more than one sample. Farms with multiple samples were considered positive if they had one animal which tested positive. This was done as only a small minority of farms had multiple samples, which would prevent the description of within-farm prevalence accurately.
Table 1 Total number of samples collected from each region of the study area.
Data analysis
A Bayesian geostatistical model was developed to predict the probability of finding a farm positive with CE by adapting the methodology by P. Moraga (21), using the “INLA” package (22) in R (23). It was assumed that a farm, i, is characterized by a probability of returning at least one sample positive with CE, pi. This probability pi is then related to its linear predictor through the logit link function:
With β0 representing the intercept (i.e. the average national between-farm prevalence) and Si capturing the spatial random effect, which follows a zero-mean Gaussian process with Matérn covariance function (24). A stochastic partial differential equation approach was used to fit the spatial model and predict the probability of CE at unsampled locations (25). A 2-dimensional triangulate mesh was created to cover the area surrounding the region of sampled farms. This allows for barycentric interpolation for any point within the triangles. The mesh is designed so that finer triangles are created closer to the sampled points, which allows for greater accuracy within the more critical regions whilst keeping computational requirements low. The predicted infection probability is then projected onto 0.05° longitude by 0.05° latitude pixels (approximately 5.55 by 5.55 squares km) which cover the regions where samples were collected from. For simulations analyzing only goat or sheep samples, smaller pixels (0.0133° longitude by 0.0133° latitude, 1.48 by 1.48 squares km) were used to be able to accurately capture the smaller study area. We limited our analysis to the regions where at least one sample was collected to avoid extrapolating excessively beyond the sampled area. The model outputs were visualized using the R package ggplot2 (26). A full description of the model and all code is available at https://github.com/MabEntez/CE-spatial-distribution-in-italy .
Results
A total of 2,878 unique sampled farm locations were registered within the area of Italy. This includes farms of sheep, goats, cattle, and water buffalo. Out of the total number of farm locations, 1,243 (41.8%) were identified to be infected with E. granulosus s.l. Between-farm prevalence across the ruminant species evaluated ranged from 23.5% to 78.3%, Table 2.
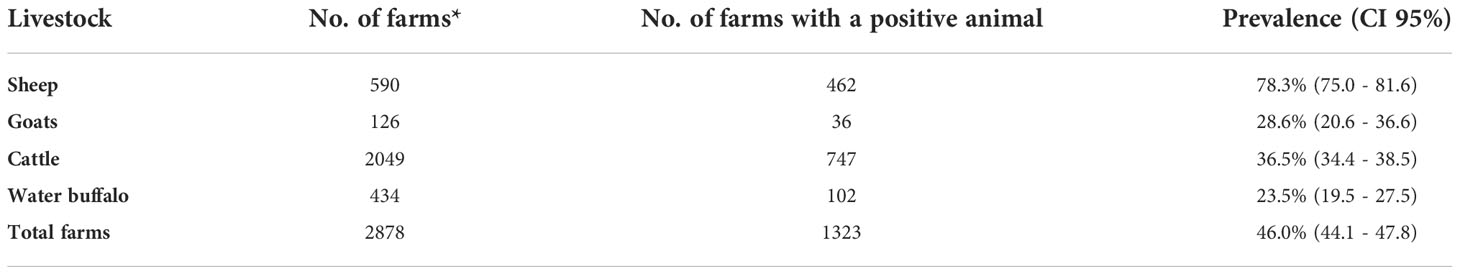
Table 2 Total number of farms with different livestock sampled for Echinococcus granulosus s.l. in Italy.
The spatial distribution of E. granulosus sl. approximated by the Stochastic Partial Differential Equations (SPDE) model including all livestock farms estimated the mean predicted probability of infection ranges from 14.8% to 78.7%, Figure 2. The lowest mean probability of infection was estimated for the region of Puglia, and the highest in the Sardinia region, with farms in Sardinia, Sicily and Basilicata regions consistently showing a higher probability of infection, above 60%. The northern regions of Italy show a very uniform distribution due to the paucity of the data available to us (a very low number of samples collected from those regions, see Table 1). When evaluating the species-specific spatial models considering only either sheep, goat, cattle, or water buffalo farms, the mean predicted probability of infection ranged geographically from 67.1% to 80.3%, 25.0% to 33.7%, 7.7% to 82.1%, and from 20.9% to 28.1% respectively, Figure 3.
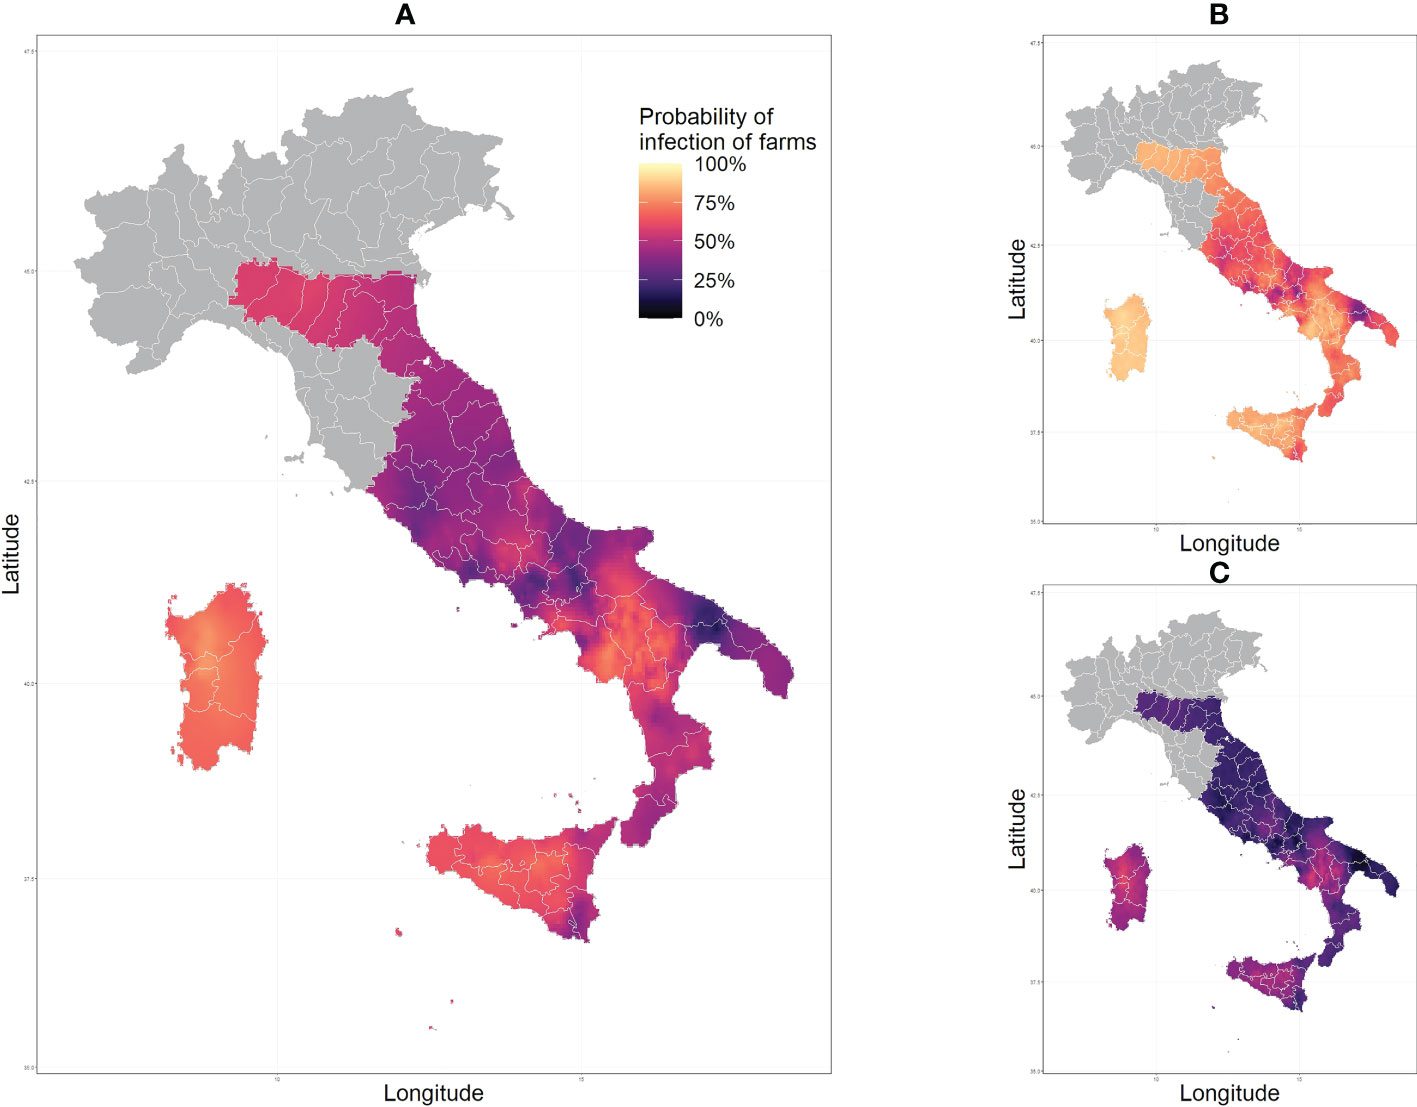
Figure 2 Predicted values of probability of infection of Echinococcus granulosus s.l. across Italy output from the fitted model showing the mean (A) lower (B) and upper (C) 95% confidence intervals.
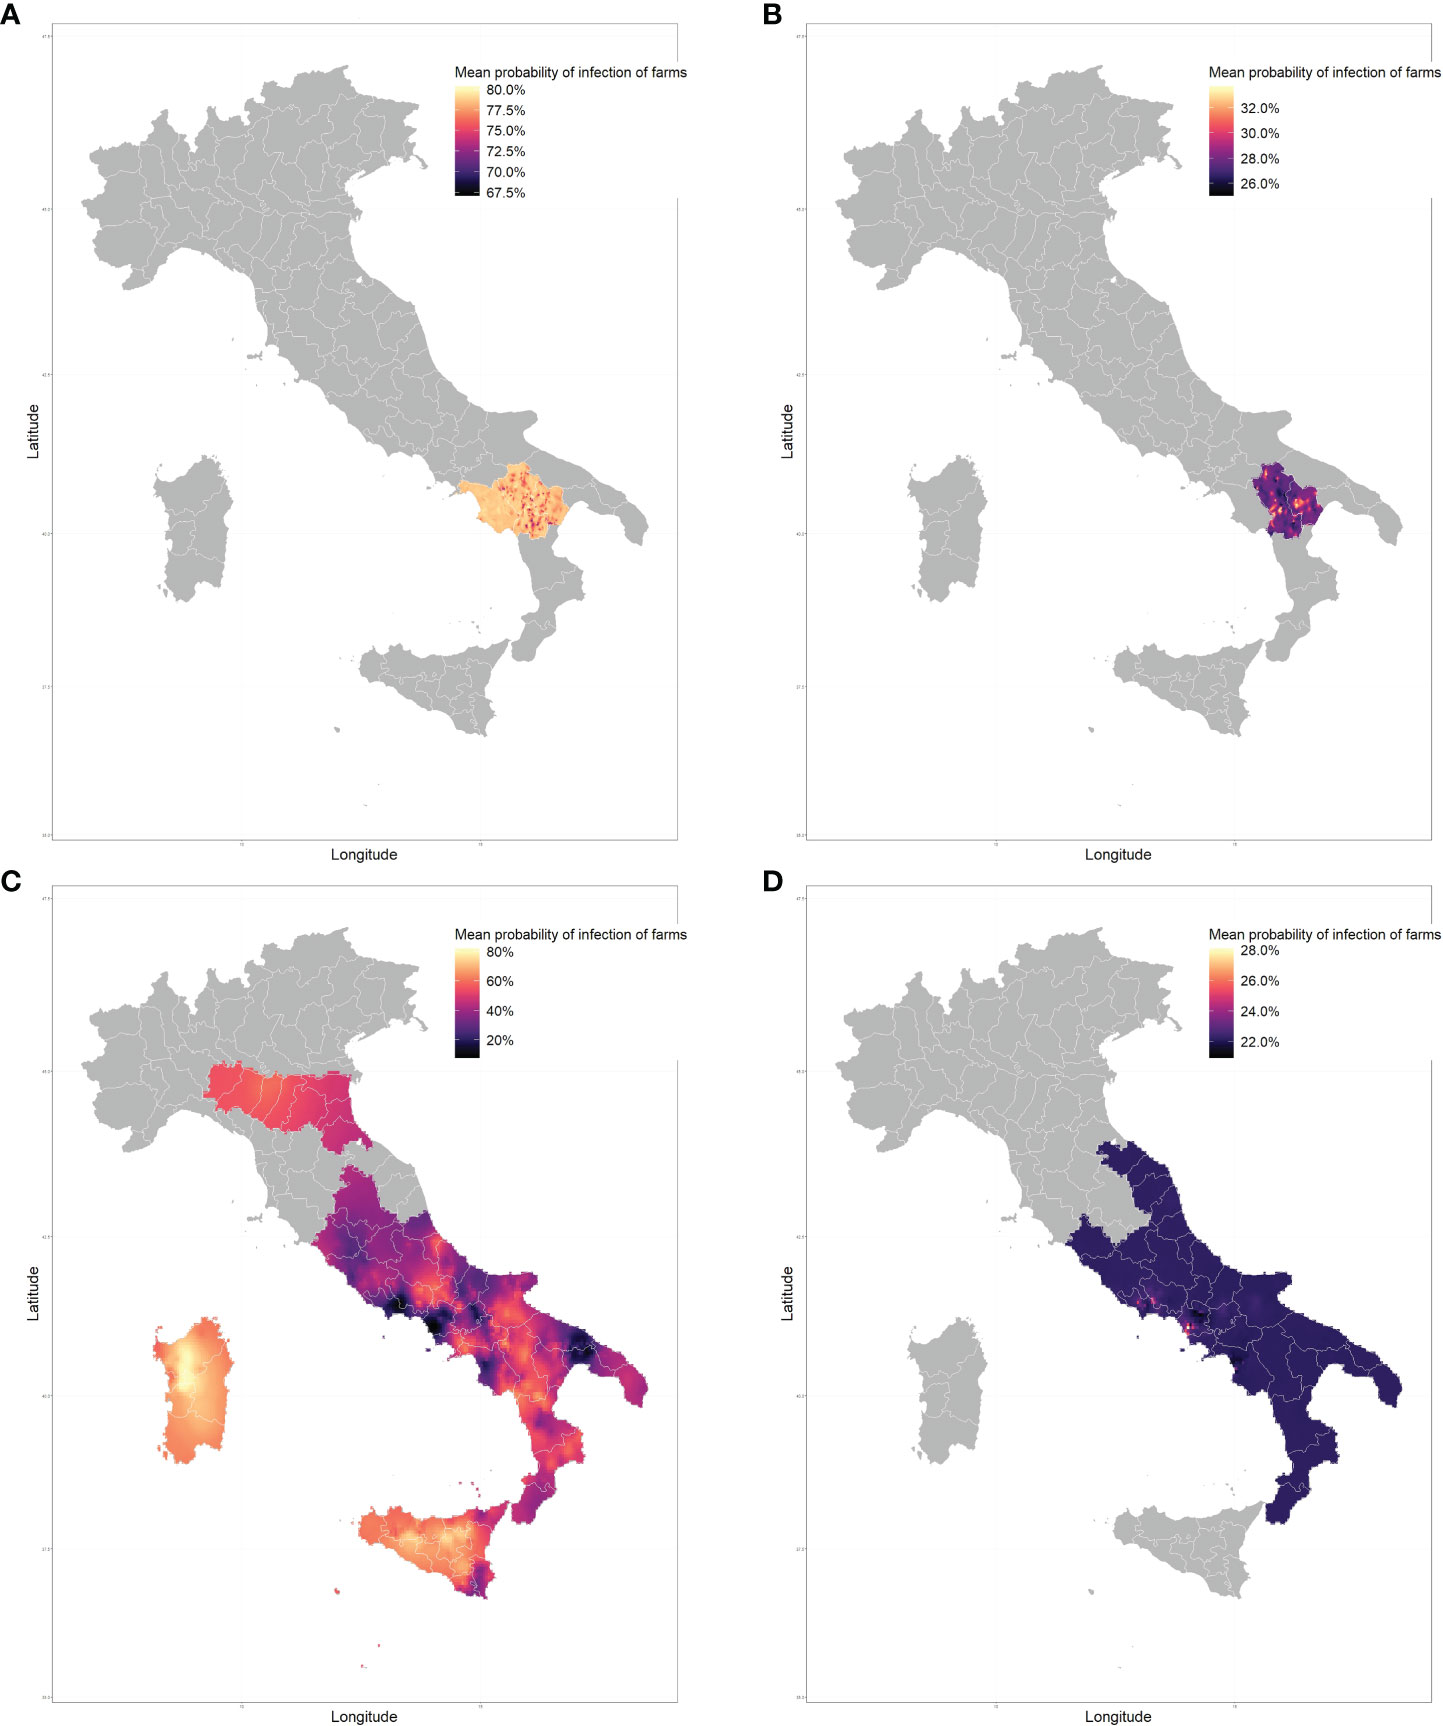
Figure 3 Predicted mean probability of infection with Echinococcus granulosus s.l. across Italy in sheep farms (A), goats (B), cattle (C) and water buffalo (D).
Discussion
CE is endemic in Italy, with recent studies indicating high prevalence in the central-southern and insular regions (11–13). This study investigated the distribution of CE in ruminant livestock (sheep, goats, cattle and water buffaloes) farms in Italy. Prevalence data of CE in specific regions of Italy can be scarce, furthermore, very few studies have investigated the spatial distribution of the disease in Italy as a whole. The spatial model approximations show a large range of infection probabilities across Italy (14% - 78%) for all farm types combined. Distinct hotspots of high infection can be seen around the region of Basilicata, Sardinia, and Sicily. All individual-species model simulations show a much narrower range of infection probabilities, with the exception of cattle. This could be due to the fact that most of the samples evaluated originated from cattle farms (2,049 out of 2,878), and also had the largest spatial coverage, with samples from all 12 regions considered. Simulations with goat and water buffalo farms show a relatively homogenous distribution of disease with a small increase of infection in focused areas.
It should be noted that many of the infection hotspots, shown in Figure 2, could be a consequence of species bias. This could mean that an area with many samples from one species with a higher prevalence would show an increased probability of infection. However, this does not necessarily represent the true probability of infection, due to the over-representation of samples of said species. Hence, high infection in the Basilicata region and Salerno province (Campania region) can be explained by the fact that all sheep samples were collected from that region and sheep farms have a high prevalence of infection (78.3%). Predictions for cattle samples also show increased infection in the Basilicata region, however, it is not as pronounced nor consistent as in sheep. Predictions in Sardinia and Sicily regions can be assumed to be entirely based on cattle samples as no samples of other livestock originated from those regions. These predictions are of interest as they show much higher infection probabilities (from around 60% to more than 80%) than the average across the whole country (36.5%). This can be explained by the fact that Sardinia has a longstanding tradition of sheep farming. Sardinia contains 45% of the entire Italian sheep stock on the island and is known to have a high prevalence, with an average value of 65.3% reported from 2012 to 2018 (27). The higher cyst fertility rate in sheep (28, 29) and large volume of sheep farms in the regions could be an explanation for the high infection pressure in the region, which is then observed in the samples collected in cattle. The infection probability predicted in the Emilia-Romagna, Marche, and Umbria region is quite uniform because of the low number of samples available in these regions. The values we see in these regions would be in a major part dictated by the intercept in the model, and some spatial effect from samples collected in the surround regions.
A systematic review (14) of the epidemiological distribution of E. granulosus s.l. found that CE prevalence reported for bovines and ovines were 21.26% and 21.09% in southern Italy, and 42.61% and 68.50% in insular Italy, respectively between 1995 and 2015. In 2009-2010 the prevalence of CE in cattle was 3.2% in central Italy, 20.8% in southern Italy, and 45.9% in Sardinia (30). In southern Italy, using data from slaughterhouses showed that 44.8% of goat farms were positive for CE (13). A recent study in Lebanon (29) investigated CE prevalence in sheep (62.9%) and goats (20.%) in the same region. In the Basilicata region, the prevalence of sheep and goats was 62.9% and 28.0%, respectively (12). It is important to be mindful of the fact that we are comparing the probability of a farm containing at least one animal infected with CE prevalence across a number of samples that might or might not originate from different farms and be representative of the region. While these two statistics are not necessarily synonymous, it is still a useful comparison to make. As our model outputs correlate closely with recent prevalence reported in the literature, this helps to corroborate the reliability of the approximations from the spatial model, specifically in the sampled regions. Between the years 2001-2014, Basilicata, Sicily, and Sardinia had the highest average annual human CE direct costs per 100,000 inhabitants calculated from hospital discharge records. Basilicata and Sardinia also had the highest average annual human CE DALYs per 100,000 inhabitants, with Sicily and Calabria following them as the regions with the subsequent highest (31). Brundu et al. (32) reported the highest average annual incidence rates of hospital cases of CE between 2001 and 2012 in Sardinia (6.78/105 inhabitants), Basilicata (5.43/105 inhabitants), and Sicily (3.96/105 inhabitants). The disease hotspots described in this study also correlate with increased annual human costs, DALYs and incidence rates of hospital cases per 100,000 inhabitants. This could be an indicator of spatial correlation between the probability of farms being infected and infection in humans. This could also mean that mapping the risk in animals also can be used to estimate E. granulosus s.l. egg contamination
One major consideration while reviewing our results is that in this study we assumed, for simplicity, a 100% sensitivity and specificity for the samples collected. While specificity is generally very high, in practice this is often not the case for the sensitivity; the prevalence of CE in livestock is often underestimated as surveillance systems, based on reports recorded at slaughterhouses in Italy, routine surveillance is still regarded as inaccurate and inefficient (11). A study by Wilson et al. (33) investigated the sensitivity and specificity of hepatic hydatid cysts in cattle in Australian abattoirs and found that sensitivity can be as low as 24.9% with a specificity of 98.9%. Even in the case of thorough necropsies in sheep, it was estimated to have an average sensitivity of 79.9% (34). The current surveillance system in place in Italy utilizes macroscopic inspection (as reported in this paper) of the organs of all the animals at the slaughterhouse in search of CE cysts.
Further studies could incorporate knowledge of sensitivity and specificity into the model calculations to extrapolate a “true” prevalence in farms and gain a greater understanding of the underestimation of prevalence from current surveillance systems. The identification of clustered farms positive with CE at a fine spatial resolution establishes a good baseline understanding of the distribution of disease. This can be used to inform which areas are high risk, not only at a regional level but also at a local level. Optimal surveillance and control programs can then be designed which incorporate more nuance across species infected with E. granulosus s.l. Another limitation of this study was with the coverage of the sample locations across species varying. The number of samples taken from each species may not be representative of the proportion of species on farms in the area; As mentioned before, an over-representation of samples from a certain species can skew predictions towards the prevalence of disease in said species. Areas with a limited number of samples will also have less accurate and reliable predictions; Areas with very high upper limit and very low lower limit with 95% credible intervals (Figure 2) are regions with high uncertainty due to this. The regions of Emilia-Romagna, Marche, and Umbria had very few samples analyzed and will have a probability of infection predicted heavily influenced by the national average and the surrounding regions, therefore may not be truly reflective of the prevalence in those regions.
Conclusion
The present study has identified CE hotspots, where farms positive with CE are clustered across central -southern, and insular Italy. This information is important to understand the epidemiology of the disease better and to inform areas with high disease risk, to both humans and animals, that require increased surveillance and control. These surveillance and control strategies can be further optimized at a local level by considering different strategies for different species. Further studies are required to gain greater insights into the distribution of the disease in northern Italy, investigating the prevalence of disease in sheep and goats in the wider Italian region or further considerations around diagnostics.
Data availability statement
The original contributions presented in the study are included in the article/supplementary files, further inquiries can be directed to the corresponding author/s.
Ethics statement
The animal study was reviewed and approved by University of Naples Federico II. Written informed consent was obtained from the owners for the participation of their animals in this study.
Author contributions
ME, MN, LR, and JP conceived the study. AB and GC participated in the design of the sample survey. MN and LR conducted data processing, and cleaning. ME and JP designed the model and conducted the formal coding. ME, MN, LR, and JP wrote and edited the manuscript. LR and JP secured the funding. All authors discussed the results and critically reviewed the manuscript.
Funding
This research was funded by the project “New sustainable tools and innovative actions to control cystic ECHINOcoccosis in sheep farms in the MEDiterranean area: improvement of diagnosis and SAFEty in response to climatic changes - ECHINO-SAFE-MED”, supported by PRIMA (Partnership for research and innovation in the Mediterranean area), and the MACE project as part of the One Health European Joint Project (European Union’s Horizon 2020 -Grant No 773830). The authors would also like to acknowledge that part of the funding was received from the Basil Longhurst Legacy and the doctoral college at the School of Veterinary Medicine, University of Surrey.
Conflict of interest
The authors declare that the research was conducted in the absence of any commercial or financial relationships that could be construed as a potential conflict of interest.
Publisher’s note
All claims expressed in this article are solely those of the authors and do not necessarily represent those of their affiliated organizations, or those of the publisher, the editors and the reviewers. Any product that may be evaluated in this article, or claim that may be made by its manufacturer, is not guaranteed or endorsed by the publisher.
Supplementary material
The Supplementary Material for this article can be found online at: https://www.frontiersin.org/articles/10.3389/fitd.2022.1034572/full#supplementary-material
Supplementary Figure 1 | Location of farms sampled for Echinococcus granulosus s.l.
References
1. Thompson RCA, McManus D. Aetiology: parasites and life-cycles, in: WHO/OIE manual on echinococcosis in human and animals: A public health problem of global concern (2001). Paris, France: World Organization for Animal Health. Available at: https://researchrepository.murdoch.edu.au/id/eprint/13954/ (Accessed Accessed: 26 August 2022). in J. Eckert et al. (eds) Thompson, R.C.A.< https://researchrepository.murdoch.edu.au/view/author/Thompson, Andrew.html> and McManus, D. (2001) Aetiology: parasites and life-cycles. In.
2. Tamarozzi F, Deplazes P, Casulli A. Reinventing the wheel of echinococcus granulosus sensu lato transmission to humans. Trends Parasitol (2020) 36(5):427–34. doi: 10.1016/j.pt.2020.02.004
3. Deplazes P, Rindaldi L, Alvarez Rojas CA, Torgerson PR, Harandi MF, Romig T, et al. Global distribution of alveolar and cystic echinococcosis. Adv Parasitol (2017) 95:315–493. doi: 10.1016/bs.apar.2016.11.001
4. WHO. (2022). World Health Organization. Available at: http://www.who.int/echinococcosis/epidemiology/en/ (Accessed 17 February 2021).
5. Casulli A, Siles-Lucas M, Tamarozzi F. Echinococcus granulosus sensu lato. Trends Parasitol (2019) 35(8):663–4. doi: 10.1016/j.pt.2019.05.006
6. Vuitton DA, McManus DP, Rogan MT, Romig T, Gottstein B, Naidich A, et al. International consensus on terminology to be used in the field of echinococcoses. Parasite (2020) 27:41. doi: 10.1051/parasite/2020024
7. Alvarez Rojas CA, Romig T, Lightowlers MW. Echinococcus granulosus sensu lato genotypes infecting humans – review of current knowledge. Int J Parasitol (2014) 44(1):9–18. doi: 10.1016/j.ijpara.2013.08.008
8. Casulli A, Massolo A, Saarma U, Umhang G, Santolamazza F, Santoro A, et al. Species and genotypes belonging to echinococcus granulosus sensu lato complex causing human cystic echinococcosis in Europe, (2000–2021): a systematic review. Parasites Vectors (2022) 15(1):109. doi: 10.1186/s13071-022-05197-8
9. Cardona GA, Carmena D. A review of the global prevalence, molecular epidemiology and economics of cystic echinococcosis in production animals. Vet Parasitol (2013) 192(1):10–32. doi: 10.1016/j.vetpar.2012.09.027
10. Cassini R, Simonato G, Mulatti P, Reavagnan S, Danesi P, Pascotto E, et al. A new approach to outbreak management for bovine cystic echinococcosis cases in hypo-endemic areas. Vet Parasitol: Regional Stud Rep (2019) 16:100269. doi: 10.1016/j.vprsr.2019.100269
11. Loi F, Berchilla P, Masu G, Masala G, Scaramozzino P, Carvelli A, et al. Prevalence estimation of Italian ovine cystic echinococcosis in slaughterhouses: A retrospective Bayesian data analysis 2010–2015. PloS One (2019) 14(4):e0214224. doi: 10.1371/journal.pone.0214224
12. Bosco A, Alves LC, Cociancic P, Amadesi A, Pepe P, Morgoglione ME, et al. Epidemiology and spatial distribution of echinococcus granulosus in sheep and goats slaughtered in a hyperendemic European Mediterranean area. Parasites Vectors (2021) 14(1):421. doi: 10.1186/s13071-021-04934-9
13. Cringoli G, Pepe P, Bosco A, Maurelli MP, Baldi L, Ciaramella P, et al. An integrated approach to control cystic echinococcosis in southern Italy. Vet Parasitol (2021) 290:109347. doi: 10.1016/j.vetpar.2021.109347
14. Tamarozzi F, Legnardi M, Fittipaldo A, Drigo M, Cassini R. Epidemiological distribution of echinococcus granulosus s.l. infection in human and domestic animal hosts in European Mediterranean and Balkan countries: A systematic review. PloS Negl Trop Dis (2020) 14(8):e0008519. doi: 10.1371/journal.pntd.0008519
15. Torgerson PR, Devleesschauwer B, Praet N, Speybroeck N, Willingham AL, Kasuga F, et al. World health organization estimates of the global and regional disease burden of 11 foodborne parasitic disease 2010: A data synthesis. PloS Med (2015) 12(12):e1001920. doi: 10.1371/journal.pmed.1001920
16. Belhassen-García M, Romero-Alegria A, Velasco-Tirado V, Alonso-Sardón M, Lopez-Bernus A, Alvela-Suarez L, et al. Study of hydatidosis-attributed mortality in endemic area. PloS One (2014) 9(3):e91342. doi: 10.1371/journal.pone.0091342
17. Torgerson PR, Macpherson CNL. The socioeconomic burden of parasitic zoonoses: Global trends. Vet Parasitol (2011) 182(1):79–95. doi: 10.1016/j.vetpar.2011.07.017
18. WHO. Ending the neglect to attain the sustainable development goals: A road map for neglected tropical diseases 2021–2030 (2021). Available at: https://www.who.int/publications-detail-redirect/9789240010352 (Accessed 25 July 2022).
19. Moro PL, Cavero CA, Tambini M, Briceño Y, Jiménez R, Cabera L. Identification of risk factors for cystic echinococcosis in a peri-urban population of Peru. Trans R Soc Trop Med Hygiene (2008) 102(1):75–8. doi: 10.1016/j.trstmh.2007.09.010
20. Conchedda M, Seu V, Capra S, Caredda A, Pani SP, Lochi PG, et al. A study of morphological aspects of cystic echinococcosis in sheep in Sardinia. Acta Trop (2016) 159:200–10. doi: 10.1016/j.actatropica.2016.04.003
21. Moraga P. Geospatial health data: Modeling and visualization with r-INLA and shiny. Boca Raton, Florida: CRC Press (2019).
22. Rue H, et al. ‘Bayesian computing with INLA: A review’. arXiv (2016). Available at: http://arxiv.org/abs/1604.00860 (Accessed Accessed: 9 June 2022).
23. R Core Team. ‘R: A language and environment for statistical computing.’ r foundation for statistical computing (2020). Available at: http://www.R-project.org/.
25. Lindgren F, Rue H, Lindström J. An explicit link between Gaussian fields and Gaussian Markov random fields: the stochastic partial differential equation approach. J R Stat Soc: Ser B (Statistical Methodology) (2011) 73(4):423–98. doi: 10.1111/j.1467-9868.2011.00777.x
26. Wickham H. ggplot2: Elegant graphics for data analysis (2016). Springer-Verlag New York. Available at: https://ggplot2.tidyverse.org/ (Accessed 25 July 2022).
27. Varcasia A, Dessì G, Lattanzio S, Marongiu D, Cuccuru C, Carta S, et al. Cystic echinococcosis in the endemic island of Sardinia (Italy): has something changed? Parasitol Res (2020) 119(7):2207–15. doi: 10.1007/s00436-020-06717-0
28. Daryani A, Sharif M, Amouei A, Nasrolahei M. Fertility and viability rates of hydatid cysts in slaughtered animals in the mazandaran province, northern Iran. Trop Anim Health Production (2009) 41(8):1701. doi: 10.1007/s11250-009-9368-x
29. Joanny G, Mehmood N, Dessì G, Tamponi C, Nonnis F, Hhosri C, et al. Cystic echinococcosis in sheep and goats of Lebanon. Parasitology (2021) 148(7):871–8. doi: 10.1017/S0031182021000494
30. Poglayen G, Varcasia A, Pipia AP, Tamponi C, Pagiri M, Marchesi B, et al. Retrospective study on cystic echinococcosis in cattle of Italy. J Infect Develop Countries (2017) 11(09):719–26. doi: 10.3855/jidc.9433
31. Piseddu T, Brundu D, Stegel G, Loi F, Ronlesu S, Masu G, et al. The disease burden of human cystic echinococcosis based on HDRs from 2001 to 2014 in Italy. PloS Negl Trop Dis (2017) 11(7):e0005771. doi: 10.1371/journal.pntd.0005771
32. Brundu D, Piseddu T, Stegel G, Masu G, Ledda S, Masala G. Retrospective study of human cystic echinococcosis in Italy based on the analysis of hospital discharge records between 2001 and 2012. Acta Trop (2014) 140:91–6. doi: 10.1016/j.actatropica.2014.08.011
33. Wilson CS, Jenkins DJ, Barnes TS, Brookes VJ. Evaluation of the diagnostic sensitivity and specificity of meat inspection for hepatic hydatid disease in beef cattle in an Australian abattoir. Prev Vet Med (2019) 167:9–15. doi: 10.1016/j.prevetmed.2019.03.014
Keywords: Cystic echinococcosis, Italy, disease mapping, epidemiology, spatial modeling
Citation: Entezami M, Nocerino M, Widdicombe J, Bosco A, Cringoli G, Casulli A, Iacono GL, Rinaldi L and Prada JM (2022) The spatial distribution of cystic echinococcosis in Italian ruminant farms from routine surveillance data. Front. Trop. Dis 3:1034572. doi: 10.3389/fitd.2022.1034572
Received: 01 September 2022; Accepted: 14 November 2022;
Published: 01 December 2022.
Edited by:
Mark Bradley, GlaxoSmithKline (United Kingdom), United KingdomReviewed by:
Rodolfo Paredes, Andres Bello University, ChileKatherina Alicia Vizcaychipi, Instituto Nacional de Enfermedades Infecciosas Dr. Carlos G. Malbrán (INEI), Argentina
Copyright © 2022 Entezami, Nocerino, Widdicombe, Bosco, Cringoli, Casulli, Iacono, Rinaldi and Prada. This is an open-access article distributed under the terms of the Creative Commons Attribution License (CC BY). The use, distribution or reproduction in other forums is permitted, provided the original author(s) and the copyright owner(s) are credited and that the original publication in this journal is cited, in accordance with accepted academic practice. No use, distribution or reproduction is permitted which does not comply with these terms.
*Correspondence: Mahbod Entezami, TS5lbnRlemFtaUBzdXJyZXkuYWMudWs=