
94% of researchers rate our articles as excellent or good
Learn more about the work of our research integrity team to safeguard the quality of each article we publish.
Find out more
ORIGINAL RESEARCH article
Front. Trop. Dis., 10 January 2022
Sec. Neglected Tropical Diseases
Volume 2 - 2021 | https://doi.org/10.3389/fitd.2021.809757
This article is part of the Research TopicHighlights in Neglected Tropical Diseases 2021/22View all 8 articles
 Dziedzom K. de Souza1,2*†
 Albert Picado1†
 Paul R. Bessell3
 Abduba Liban4
 Davis Wachira5
 Daniel Mwiti5
 Sultani H. Matendechero5
 Mercedes Bosch6
 Joseph M. Ndung’u1
 Israel Cruz1,7
Background: Visceral leishmaniasis (VL), also known as kala-azar, is a neglected tropical disease (NTD) that is fatal if not treated early. The WHO targets the elimination of VL as a public health problem in its 2030 NTD road map. However, improving access to VL diagnosis and treatment remains a major challenge in many VL-endemic countries. Kenya is endemic for VL and is among the top 6 high-disease burden countries in the world.
Methods: FIND, through its activities in improving the diagnosis of VL and supporting the elimination of the disease in Kenya, has worked with various county ministries of health (MOH) and central MOH over the last couple of years. FIND’s activities in Marsabit county started in 2018. In this work, we present the implementation of activities and the impacts in Marsabit county. We reviewed the data for 2017 and 2019 outbreaks (before and after the implementation of FIND’s activities) and assessed the importance of improving access and community sensitization to VL diagnosis. We assessed the contribution of each facility to the total distance traveled from a perspective of location optimization.
Results: There was a sharp increase in the number of people tested in the 2017 outbreak compared to the 2019 outbreak. In 2017, 437 people were tested compared to 2,338 in 2019. The county reported 234 and 688 VL cases in 2017 and 2019, respectively. The data revealed a shift in the demographic structures of cases toward the younger population (mean age in 2017 was 17.6 years and 15.3 years in 2019), with more female cases reported in 2019 compared to 2017. In 2017, 44.4% were 10 years of age or under. In 2019, the proportion 10 years or below was 52.2%. The addition of two new diagnosis facilities in 2018 resulted in a decrease in the distance traveled by confirmed VL cases from 28.1 km in 2017 to 10.8 km in 2019. Assessing the impact of facility placement indicated the most optimal facilities to provide VL diagnostic services and minimize the distance traveled by patients. Adding new facilities reduces the travel distance until a point where the addition of a new facility provides no additional impact.
Conclusion: The results from this study indicate the need to carefully consider the placement of health facilities in improving access to VL diagnosis and treatment and could serve as an investment case in deciding when to stop adding new facilities in a particular setting. Extending the activities in Kenya to other VL-endemic countries in East Africa will contribute significantly toward the elimination of the disease, addressing the needs of marginalized populations and leaving no one behind.
Commonly known as kala-azar, visceral leishmaniasis (VL) is a vector-borne neglected tropical disease (NTD) caused by the Leishmania parasites L. donovani and L. infantum. Left untreated, it is fatal in almost all cases. It is estimated that there are 50,000 to 90,000 cases annually (1), representing only 25% to 45% of reported cases. In 2020, six countries, Kenya among them, reported more than 1,000 VL cases each, representing 79% of all cases worldwide (2). The new World Health Organization (WHO) NTD road map 2021–2030 (3) targets VL for elimination as a public health problem, defined as a reduction to <1% in case fatality rate due to primary disease. However, there are critical actions that must be undertaken to achieve these targets. These include early detection and confirmation of diagnosis to enable early treatment, adequate supply of drugs and diagnostics, and the need for more effective diagnostics and treatment especially in Africa.
Kenya is endemic for VL, with an estimated 4,000 cases occurring annually, and 5 million people are at risk of infection (4). The diagnostic algorithm for VL in Kenya is based on a complex combination of tests (5). Clinically suspected patients are first tested using the rK39 rapid diagnostic test (RDT) (6), and if negative, they are tested using direct agglutination test (DAT) (7). DAT, in contrast to the RDTs, can only be performed in well-established laboratories because it requires equipment and trained personnel. RDT-negative VL suspects should be tested by DAT in facilities where this can be performed. Patients with a borderline DAT result, or negative but still with a high suspicion of VL, are referred for tissue aspirate (usually spleen or bone marrow) microscopy. In most VL-endemic areas in Kenya, the number of health facilities that have access to VL RDTs, DAT, and microscopy is limited. Furthermore, there is a high turnover of staff resulting in shortages and unavailability of trained personnel to perform VL testing in various health facilities. Better access to VL diagnosis in endemic areas and improving the current diagnostic algorithm would enable faster and more effective management of cases, thus accelerating control and possible elimination of the disease.
Marsabit is one of the VL-endemic counties in Kenya. Bordering another three VL-endemic counties (Isiolo, Wajir, and Turkana) and Ethiopia to the North, Marsabit has been reporting an increasing number of VL cases in recent years, in particular among nomadic pastoralists. Like the other counties in North Kenya, Marsabit is prone to VL outbreaks. Three outbreaks have been registered in recent years: in 2014 (8), 2017 (9), and 2019 (10). In 2014 and 2017 (8, 11), most of the VL cases were diagnosed and treated in two health facilities: Marsabit County Referral Hospital and Laisamis Sub-County Hospital, with 5 other facilities also contributing to VL diagnosis. During the outbreak in 2019, additional treatment facilities were also created.
The Ministry of Health and the county governments have been working in collaboration with international institutions such as FIND to improve the access to VL diagnosis and treatment in endemic counties in Kenya in recent years. In this work, we analyze the impact of improving VL diagnostic capacity in Marsabit County.
The strengthening of VL diagnosis capacity in Marsabit County by FIND started in 2018. An access strategy based on strengthening healthcare facilities to diagnose VL by combining clinical signs with RDTs backed up by strategic referral centers to confirm RDT-negative suspects using DAT was implemented. This strategy had 5 components (Phases) outlined below.
In order to assess the diagnostic capacity, a full inventory of health facilities in the endemic areas of Marsabit County was conducted in 2018. These surveys allowed to identify the health facilities with capacity to conduct VL diagnosis and their location relative to the distribution of cases. This was conducted by county staff visiting the health facilities in the VL-endemic subcounties. On visiting the facilities, a questionnaire using the Open Data Kit (ODK) App (12) was implemented. As part of the survey, the location was recorded using the phone’s built-in GPS system.
The data collected were used to select the health facilities that would provide VL diagnosis using RDTs and/or DAT. The selection was made based on VL epidemiology (location of the cases in previous years) and health and laboratory facilities and personnel. The final selection was agreed upon with the county’s Ministry of Health and in consultation with the national control program.
The health facilities selected in Phase 1 were upgraded so they can provide VL diagnosis by using rK39 RDTs and DAT. Laboratories were equipped in selected facilities conducting DAT, and consumables and supplies were provided.
Personnel in the selected health facilities were trained in VL diagnosis. The training was directed to clinicians and technicians to ensure the VL diagnostic algorithm was correctly applied. Laboratory staff in health centers (HCs) where rK39 RDT and DAT were implemented were also trained. The training was repeated every 12 months.
Education and communication activities targeting primary healthcare providers and communities (local leaders, brochures, radio broadcasts) were conducted to improve local awareness of the availability of screening and treatment of VL.
As part of the project, we strengthened the monitoring and evaluation of the different activities by empowering local coordination. The collection and reporting of data on VL diagnosis and VL cases were reinforced in collaboration with the national control program and the WHO, with training and awareness campaigns tailored to the local needs. The data gathered were used to monitor the activities (e.g., location of VL cases) and the programmatic needs (e.g., RDT stock available).
Data on VL suspects were collected as part of testing activities. The data collected in 2017 and 2019 included the following information on VL suspects: village of origin, age, gender, VL tests conducted, and final outcome. VL cases were identified as individuals positive to either rK39 RDT and/or DAT. In these settings, microscopy was not routinely undertaken due to the challenges associated with it.
Data compiled by the local control program in Marsabit gave the temporal and geographical distribution of VL cases in the county. The date that the patient was seen at the facility was used to plot the epidemic curves, and the village of origin of patients was used to map the location of cases. The coordinates were sourced from OpenStreetMap, GeoNames (www.geonames.org), and Google maps.
To assess the impact of improving access to VL diagnosis, the following parameters were compared before and after the implementation of the VL access strategy:
1. First, the age and sex distribution of VL cases was represented in age pyramids.
2. The distance that patients traveled to access VL diagnosis. The village of residence of VL patients was used to estimate the distance to the facility where the patient was diagnosed. The facility that performed the VL testing was not recorded, so it was assumed that the patient was tested at the nearest diagnostic facility. The impact of the VL access strategy on the distance to VL testing was visualized using spider diagrams of the edges between village and facility and by plotting the distances to screening at the nearest facility and estimating the impact on distance traveled when facility is dropped and patients diverted to the nearest facility.
3. The distance traveled by the population to screening was assessed using gridded population data estimates at approximately 100 m from WorldPop (13), estimating the proportion of the population at increasing distances from screening. Within the population, we define a rural population with fewer than 0.1 people per grid cell; this accounts for 44% of the population.
4. We conducted an analysis around the positive predictive values (PPVs) of the RDTs based on the number of positive and negative RDT test results. To estimate these, we took published estimates of test sensitivity and specificity (14–16) to estimate the numbers of true positives, true negatives, false positives, and false negatives using the sensitivity, specificity, and the number of positive and negative test results. We extrapolated this to the full range of positive test results and accordingly the proportion of expected true positives. For a range of prevalence values (prev) from 0 to 1, we estimated the expected number of true positives (tp), false negatives (fn), false positives (fp), and true negatives (tn):
where se is the sensitivity, and sp is the specificity. For the total positive tests (tp + fp), we plot the proportions that are true positives and false positives.
All analyses were performed in the R statistical environment (17). We tested for statistical significance in the ages of patients using the Mann–Whitney U-test; this test was selected in preference to Student’s t-test because the data are non-normally distributed. Statistical significance was estimated at p value ≤0.05.
The data analysis is limited to the information available from the county. To enable comparisons between years, the analysis was restricted to the data and indicators available in 2017. There were also difficulties mapping the cases to their home villages on account of not being able to match the recorded village name to a village on a database. This led to a lack of coordinates for 13 patients in 2017 (3%) and 89 patients in 2019 (3.8%). Furthermore, while the data had a column for the date of onset of symptoms, this was rarely recorded and normally recorded as the date that the patient was seen.
In 2017, seven health facilities provided VL diagnosis: Marsabit County Referral Hospital and Laisamis Sub-County Hospital had the capacity to perform both RDT and DAT, while the rest could use RDTs. In 2018, following the characterization, selection, and strengthening of health facilities, health facilities at Kargi and Turbi were added to the network. Laboratory supplies and diagnostic tests were provided, clinical and medical staff were trained, and awareness campaigns were conducted in endemic communities. By the end of 2018, 9 facilities in Marsabit County had the capacity to diagnose VL (Figure 1).
Marsabit reported 234 and 688 VL cases in 2017 and 2019, respectively. VL cases are primarily distributed in the South of the county, with some in the North (Figure 2). There is little difference between 2017 and 2019 with the exception of the village of Kargi, which was a village reporting a large number of cases in 2017 but not in 2019.
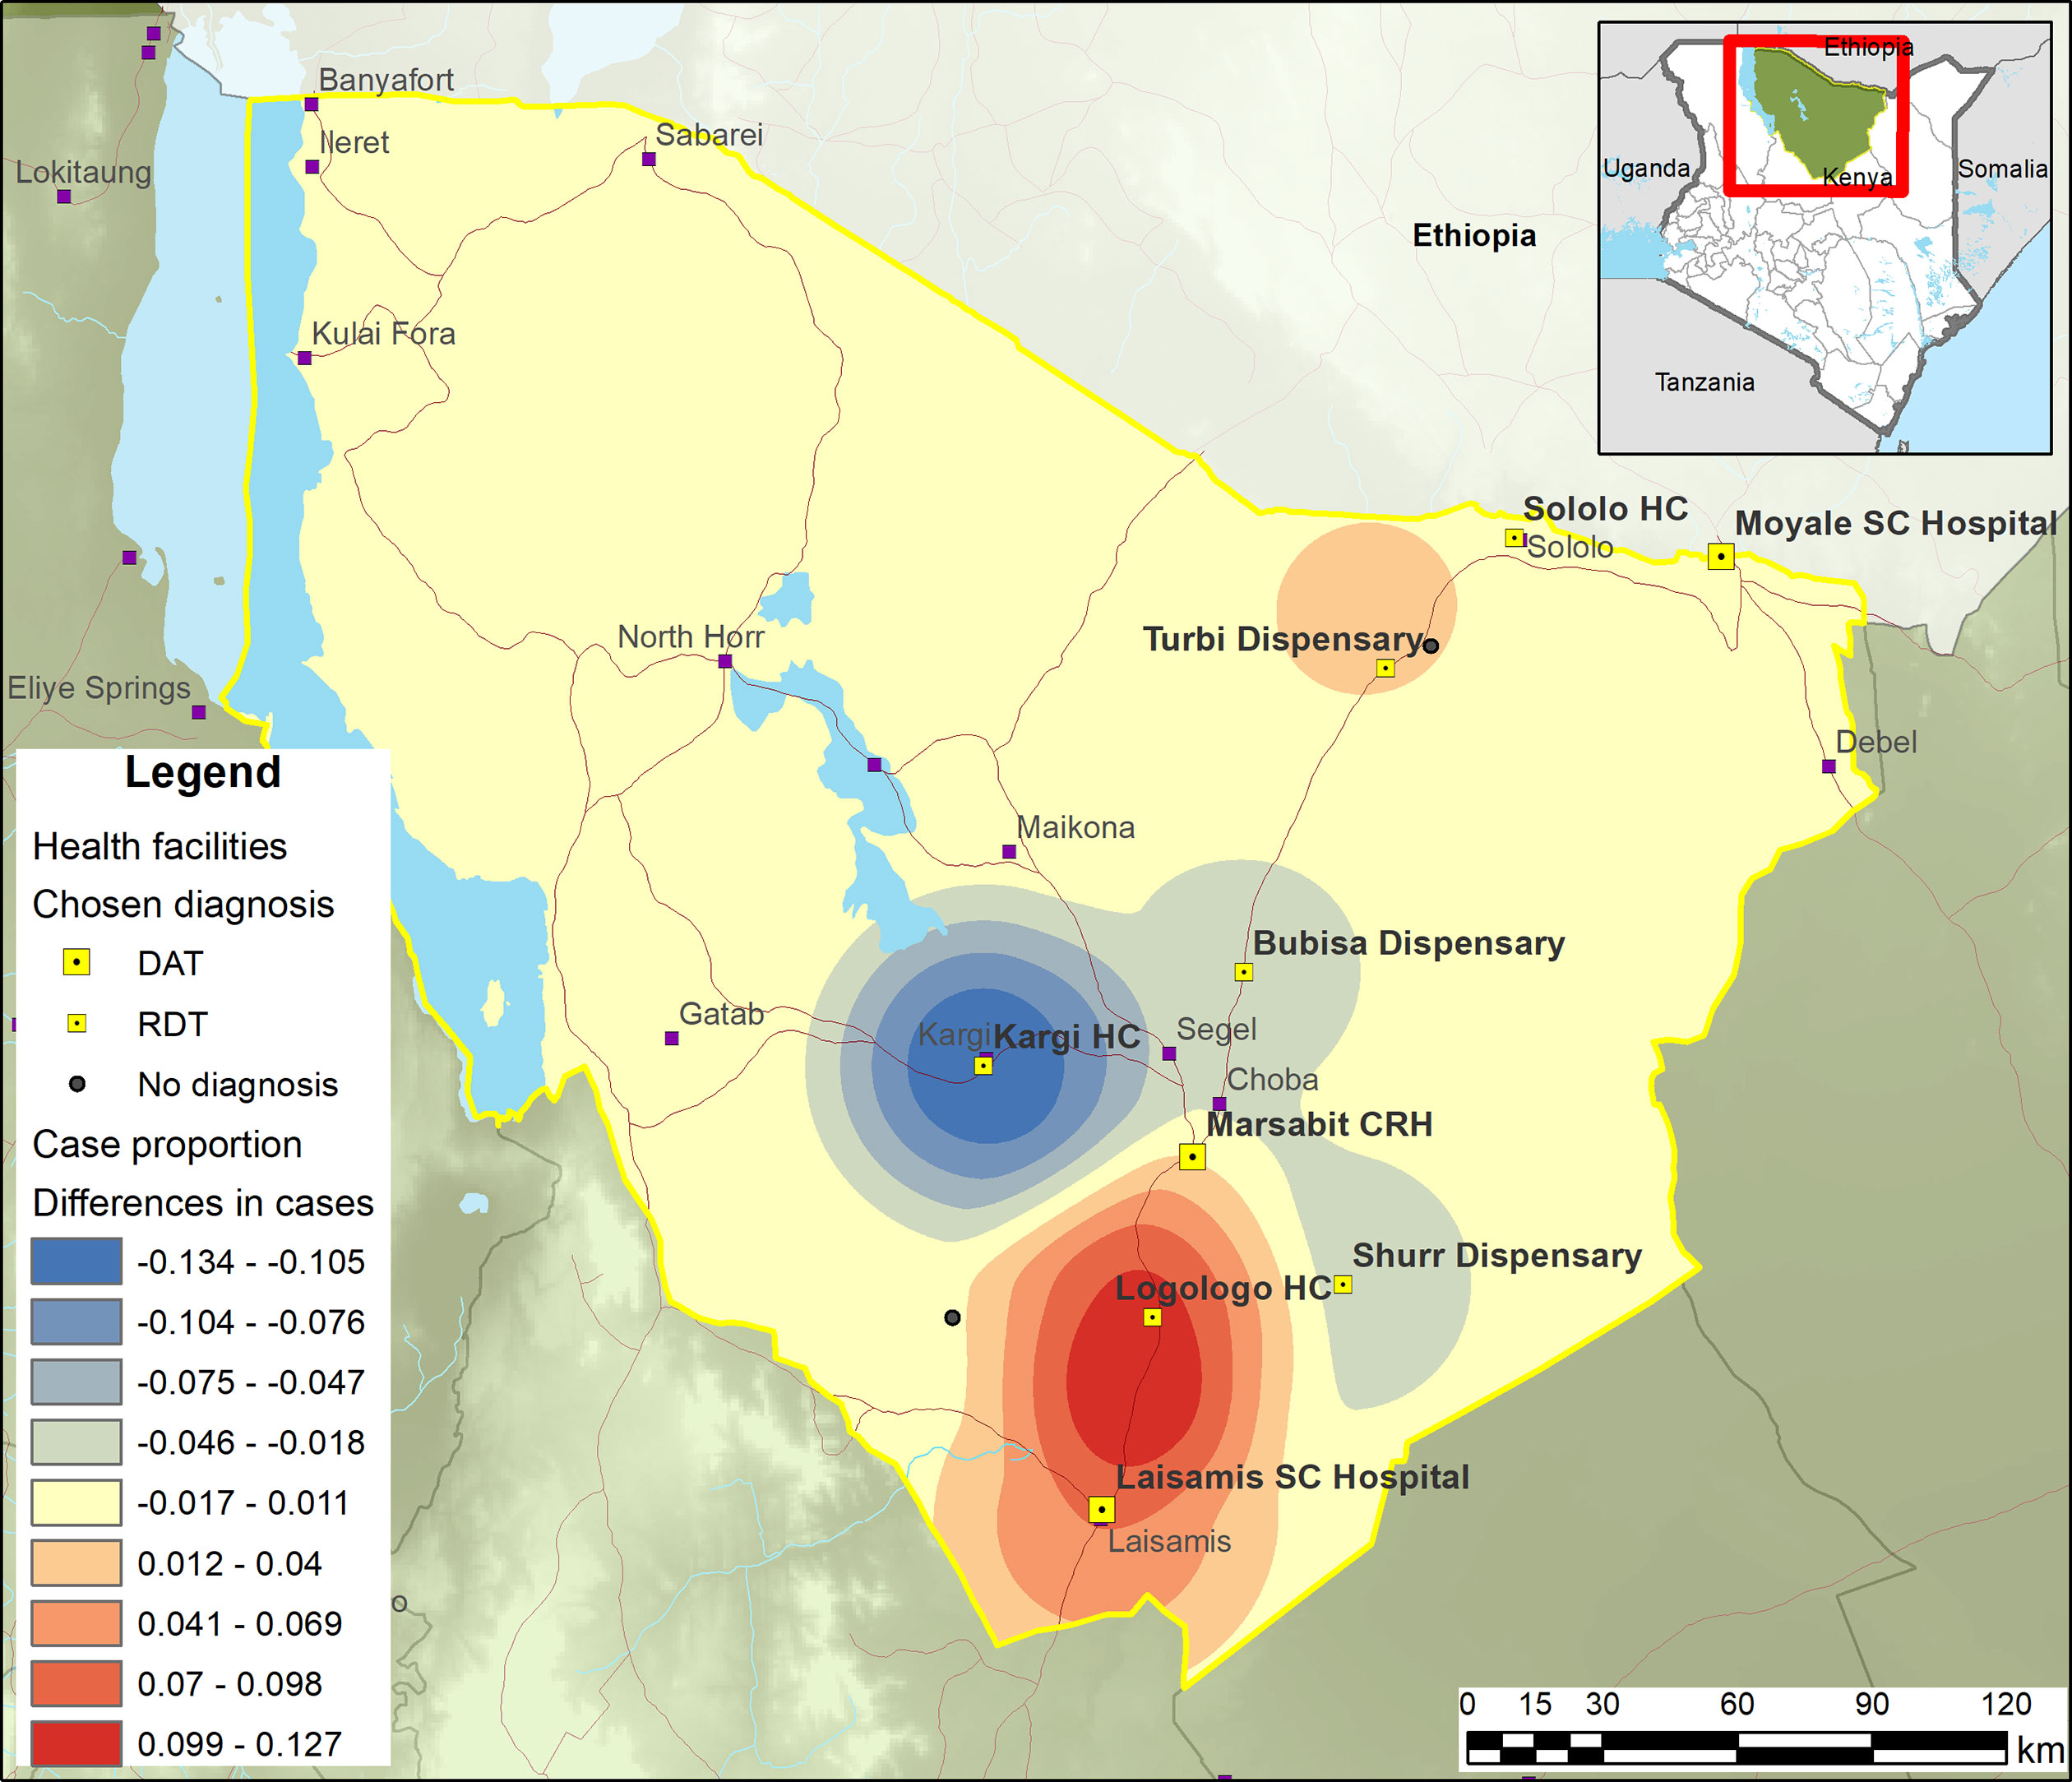
Figure 2 Smoothed map showing the shift in cases between 2019 and 2017. Red = more cases in 2019; blue = 2017.
There has been a sharp increase in the number of people being tested in 2019 compared to 2017 (Figure 3). In 2017, 437 people were tested compared to 2,338 in 2019 (Table 1). Also, there was a much greater rK39 RDT positivity rate (53.5%) in 2017 compared to 2019 (29.4%). There were 6 deaths among VL patients during 2017 and 19 during 2019, corresponding to 3.3% and 2.8% of cases, respectively, with most deaths occurring during the peak transmission season. The peak in case numbers broadly corresponds with the dry season. During both outbreaks, the peak screening months were from May to August.
The data also reveal a shift in the demographic structures of cases toward the younger population, particularly children below 10 years (Figure 4 and Table 2). Also, more female cases were reported in 2019 compared to 2017. During both years, the majority of those tested and positive were males and predominantly younger. The mean age in 2017 was 17.6 years and 15.3 years in 2019 (medians were 12 and 10 years, respectively). In 2017, 44.4% were 10 years of age or under. In 2019, the proportion of 10 years or below was 52.2%. The ages of those who tested positive were significantly lower in 2017 (15.3 years) compared to those who tested negative (20.3 years) [Mann-Whitney U p = 0.013]. Similarly, in 2019, mean age of positive tests was 13.4 and 16.1 for negative tests (p < 0.001). The differences in ages between positive and negative results are primarily among females with a much younger age among positives compared to negatives (Table 2).
In 2018, the VL diagnostic capability in Marsabit County was extended through the strengthening of two new health facilities in Kargi and Turbi. By mapping the VL-suspected cases to the health facilities attended (Figure 5), we are able to understand the extent to which new facilities enhance the diagnostic capacity of the county especially in the “leave no one behind” (LNOB) strategy (18). The figure reveals the extent to which adding new facilities as part of the diagnostic network influences the importance of other facilities. As could be observed from Figure 5, Bubisa dispensary and Sololo HC contributed significantly during the 2017 outbreak. However, following the addition of Kargi and Turbi to the network, the relative importance of Bubisa dispensary and Sololo HC and Marsabit County Referral Hospital had been greatly reduced in 2019. However, removing Bubisa dispensary from the network would result in a small number of cases traveling additional distance for diagnosis. Figure 6 shows the distance to the facilities (left) and what happens if that facility is removed (right). Thus, patients attending Bubisa dispensary for VL diagnosis would have to travel almost 48 km to access diagnosis at the nearest facilities. Shurr dispensary is only the catchment for Shurr village, but there are many cases in this village and Shurr is around 45 km from the next nearest facility. Kargi HC on the other hand that was established in 2018 serves villages that are not well served by other facilities.
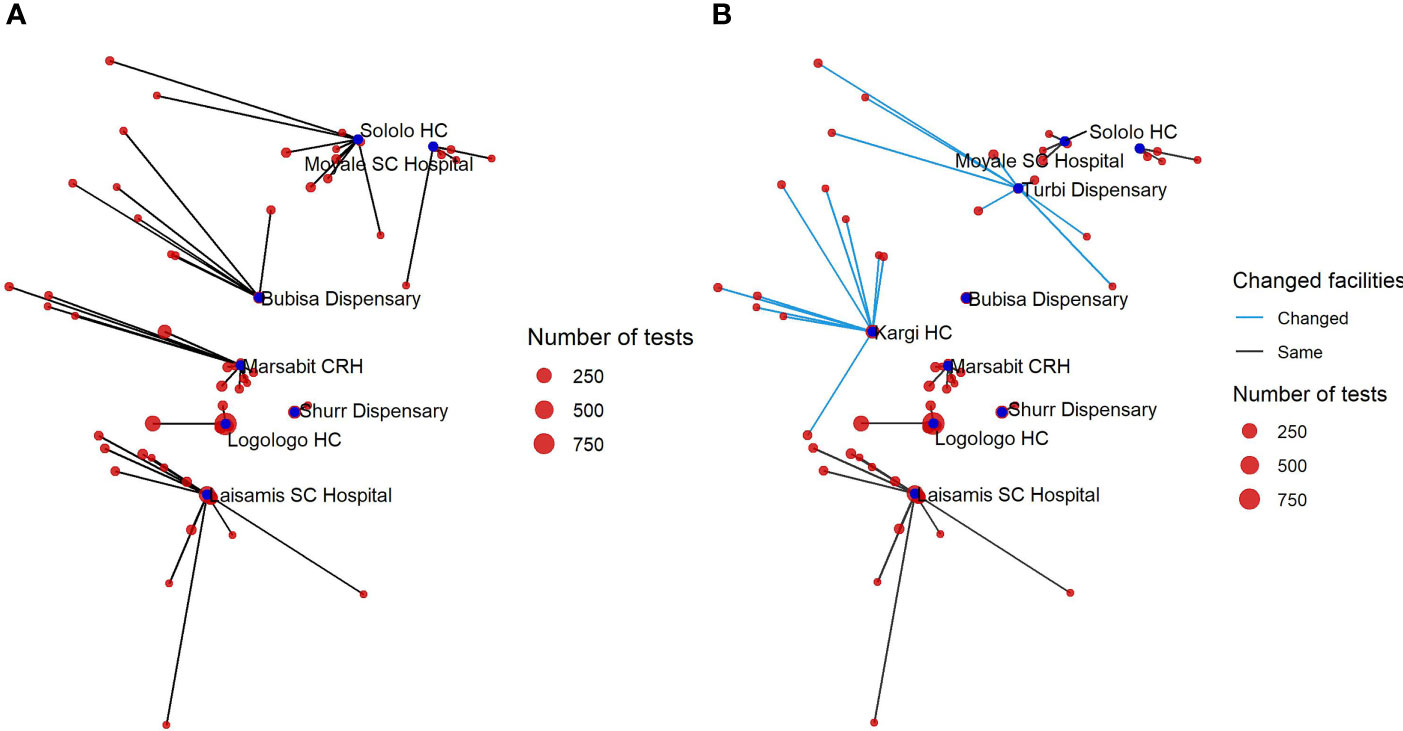
Figure 5 Network diagram showing the distance of those tested to the testing facility in 2017 (A) and in 2019 following the expansion of diagnostics to two additional facilities (B).
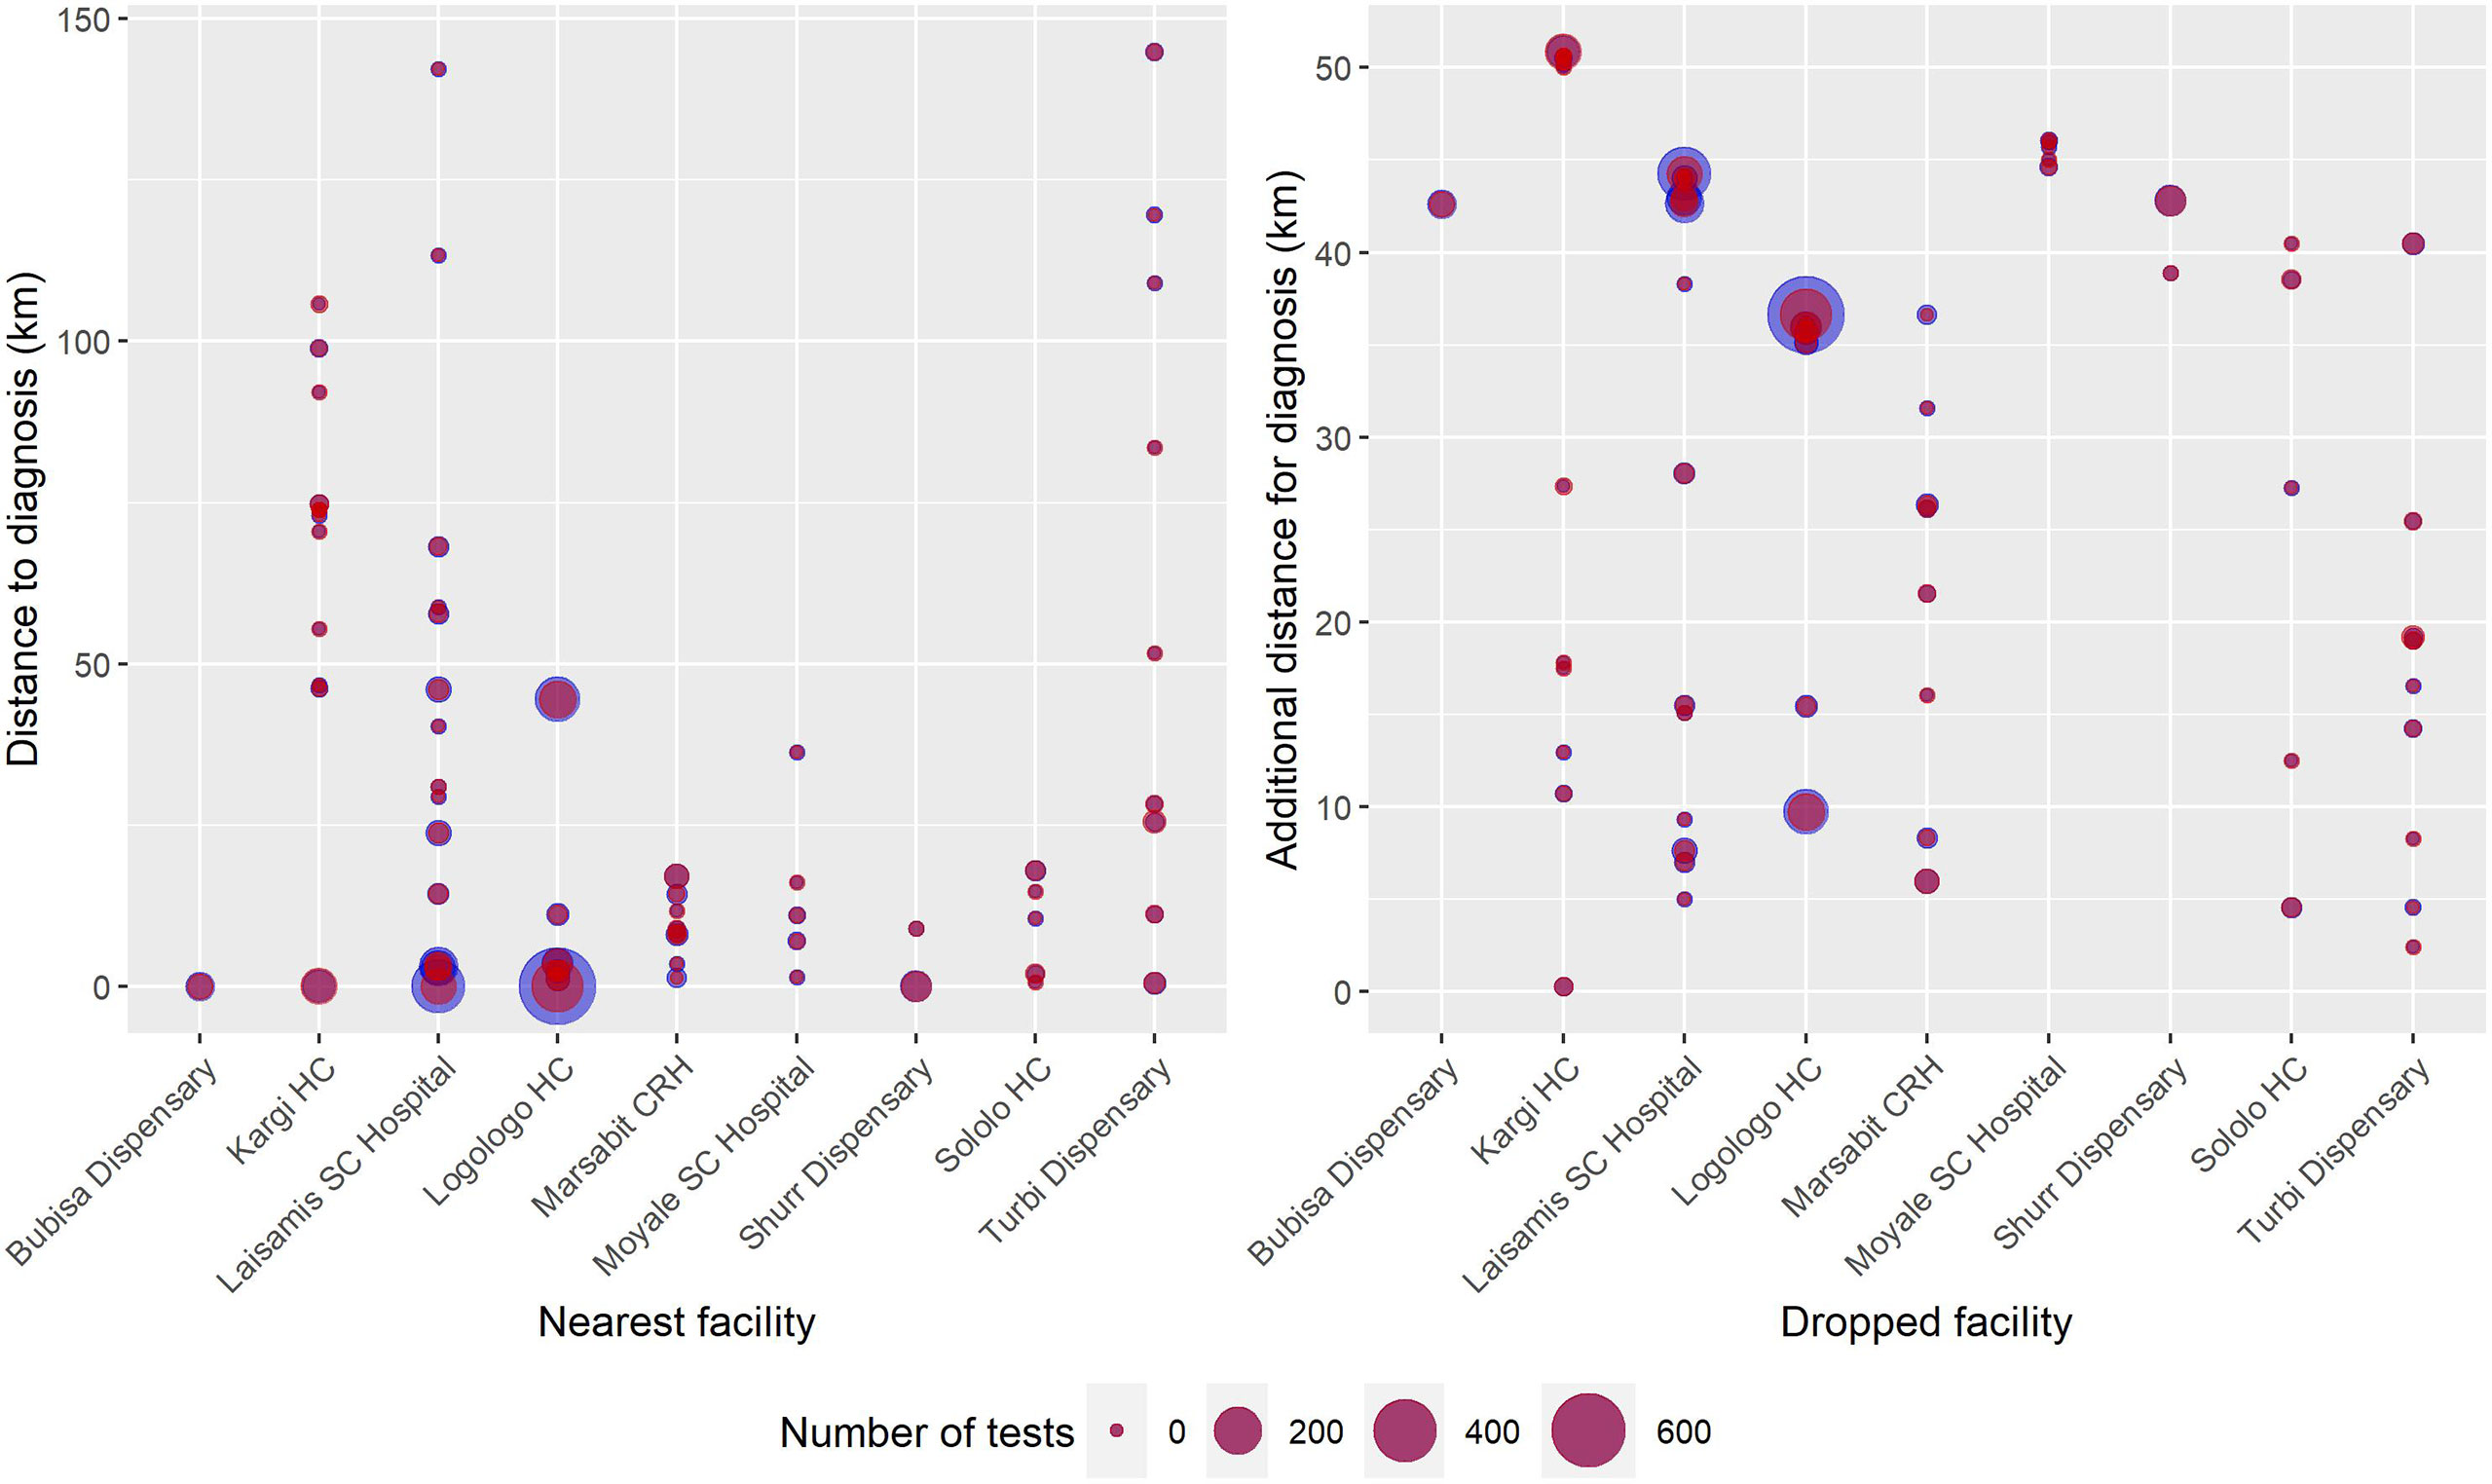
Figure 6 Blob plot of facilities and the communities accessing diagnosis. (Left) The x-axis is the nearest facility to the villages reporting cases, the y-axis is the distance to those facilities, and the size of the circles corresponds to the number of cases in that village in 2019. (Right) The x-axis corresponds to dropping each facility in turn, and the y-axis is the additional distance that must be traveled for diagnosis once that facility is dropped. The size of the blue circles corresponds to the number of negative RDT tests; red circles correspond to the number of positive RDT tests in that village in 2019.
We assessed the contribution of each facility to the total distance traveled from a perspective of location optimization (Figure 7). Based on this, if only one facility was to be optimally selected in the county to provide VL diagnostic services to and minimize the total travel distance of patients, this facility would be Logologo HC. The next facility to be optimally located would be Laisamis SCH, followed by Kargi HC and Turbi dispensary (strengthened as diagnostic facilities in 2018). Thus, assuming Logologo HC is the only facility providing VL diagnosis in the county, the total distance traveled by all suspected patients is around 90,000 km (mean travel distance 35.1 km). Adding Laisamis SCH reduces this to around 65,000 km (mean travel distance 24.3 km). As new facilities are added, the distance reduces until a point where the addition of a new facility provides no additional impact. The result of adding Kargi HC and Turbi Dispensary is that the distance to the nearest facility with diagnosis was reduced for 15.3% of those cases diagnosed during the period. This serves as an investment case in deciding on when to stop adding new facilities to the network.
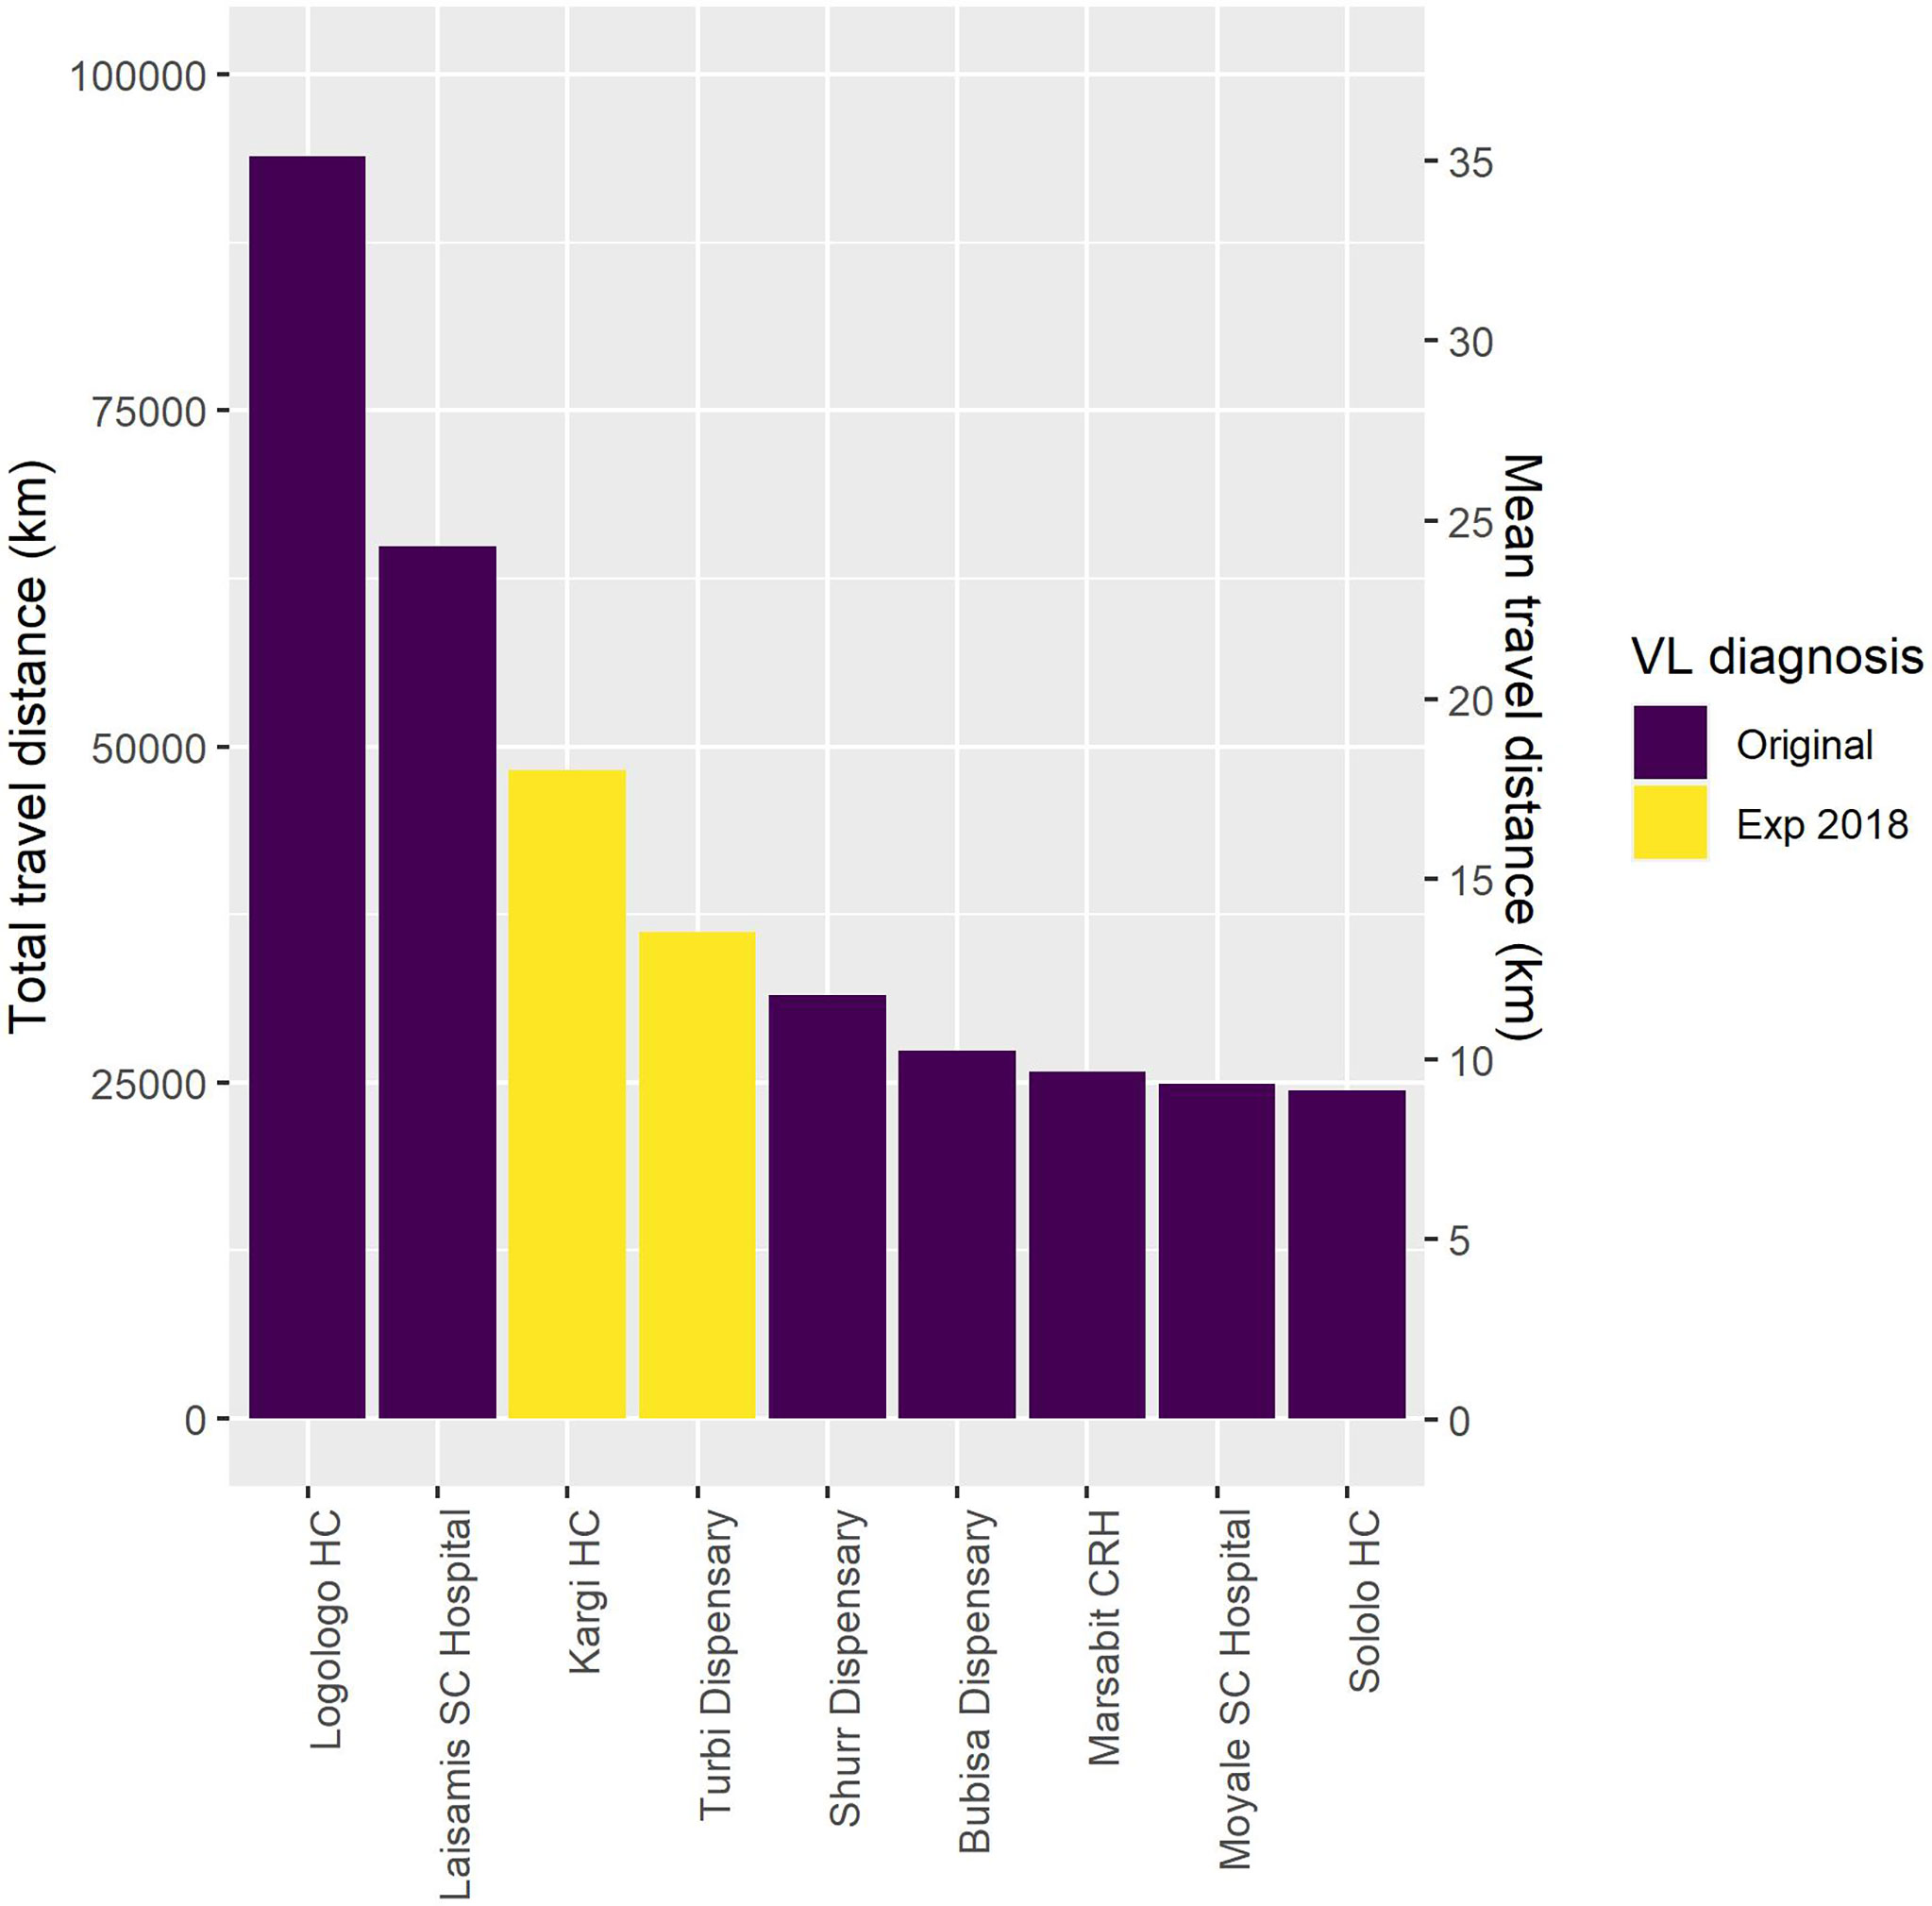
Figure 7 Results of the total and mean distance traveled for visceral leishmaniasis (VL) screening as facilities are added to the diagnostic network.
Overall, the addition of two new facilities in 2018 contributed to the reduction in the travel distance of patients. The median population distance to screening was 20.8 km in 2017 and 22.1 km in 2019 (Figure 8). During the 2017 outbreak, all patients tested with the rK39 RDT traveled a mean distance of 26.2 km for diagnosis, while rk39 RDT-positive patients traveled 28.1 km. However, during the 2019 outbreak, all patients tested with the rK39 RDT traveled a mean of 9.15 km for screening and rk39 RDT-positive patients traveled 10.8 km. Based on the improvements in the diagnostic network, if the VL diagnosis capacity in 2017 had been that as per 2019, the mean travel distance for all patients tested with rK39 RDT would have been 6.05 km (reduction of 20.1 km) and 6.05 km for rK39 RDT-positive patients only (reduction of 22 km).
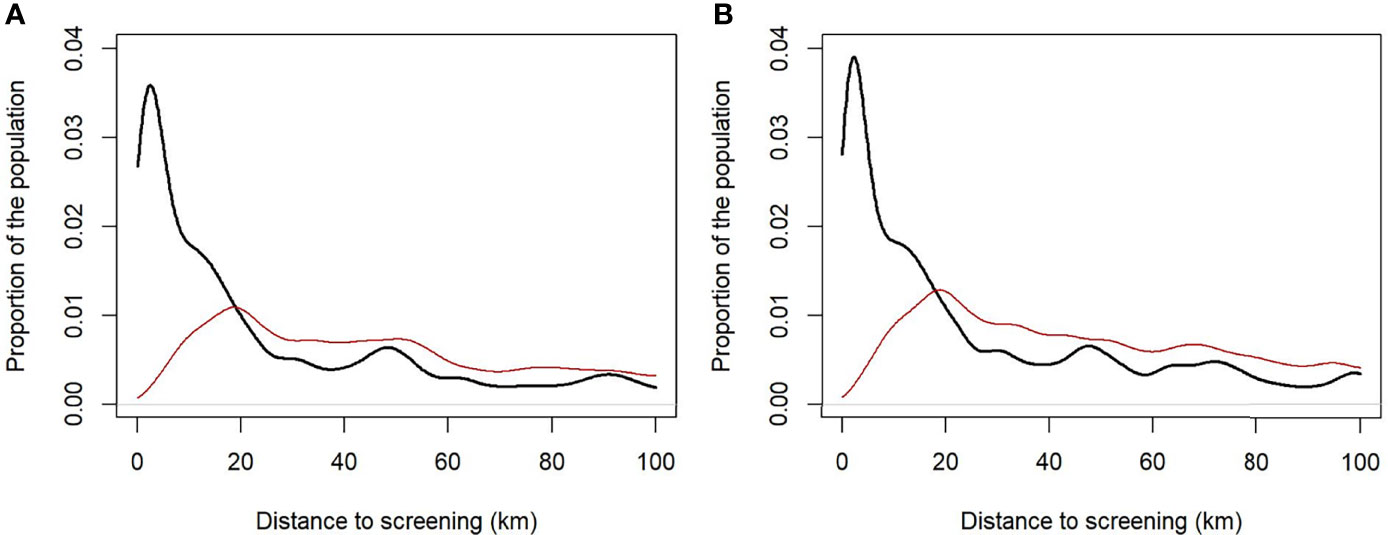
Figure 8 Population distance to screening based on the distribution of diagnostics in 2017 (A) and the post-intervention (2019) diagnostics distribution (B). For the entire population (thick black line) and the rural population alone (red line).
Using published estimates of the sensitivity and specificity of the rK39 RDT (15, 16), we determined the proportion of positive test results (Figure 9). In 2017, 53.6% rK39 RDT tests were positive. Thus, it was estimated that 49.7% of test results were true positives and 5.6% were false positives, and 89.3% of the RDT positives were VL cases. In 2019, 19.5% of tests were true positives and 9.5% were false positives. Thus, 67.2% of rK39 RDT-positive results were VL cases. Breaking this down, we observe that while there were 5.4 times more tests performed in 2019, there were only 3 times more true positives detected (Table 3).
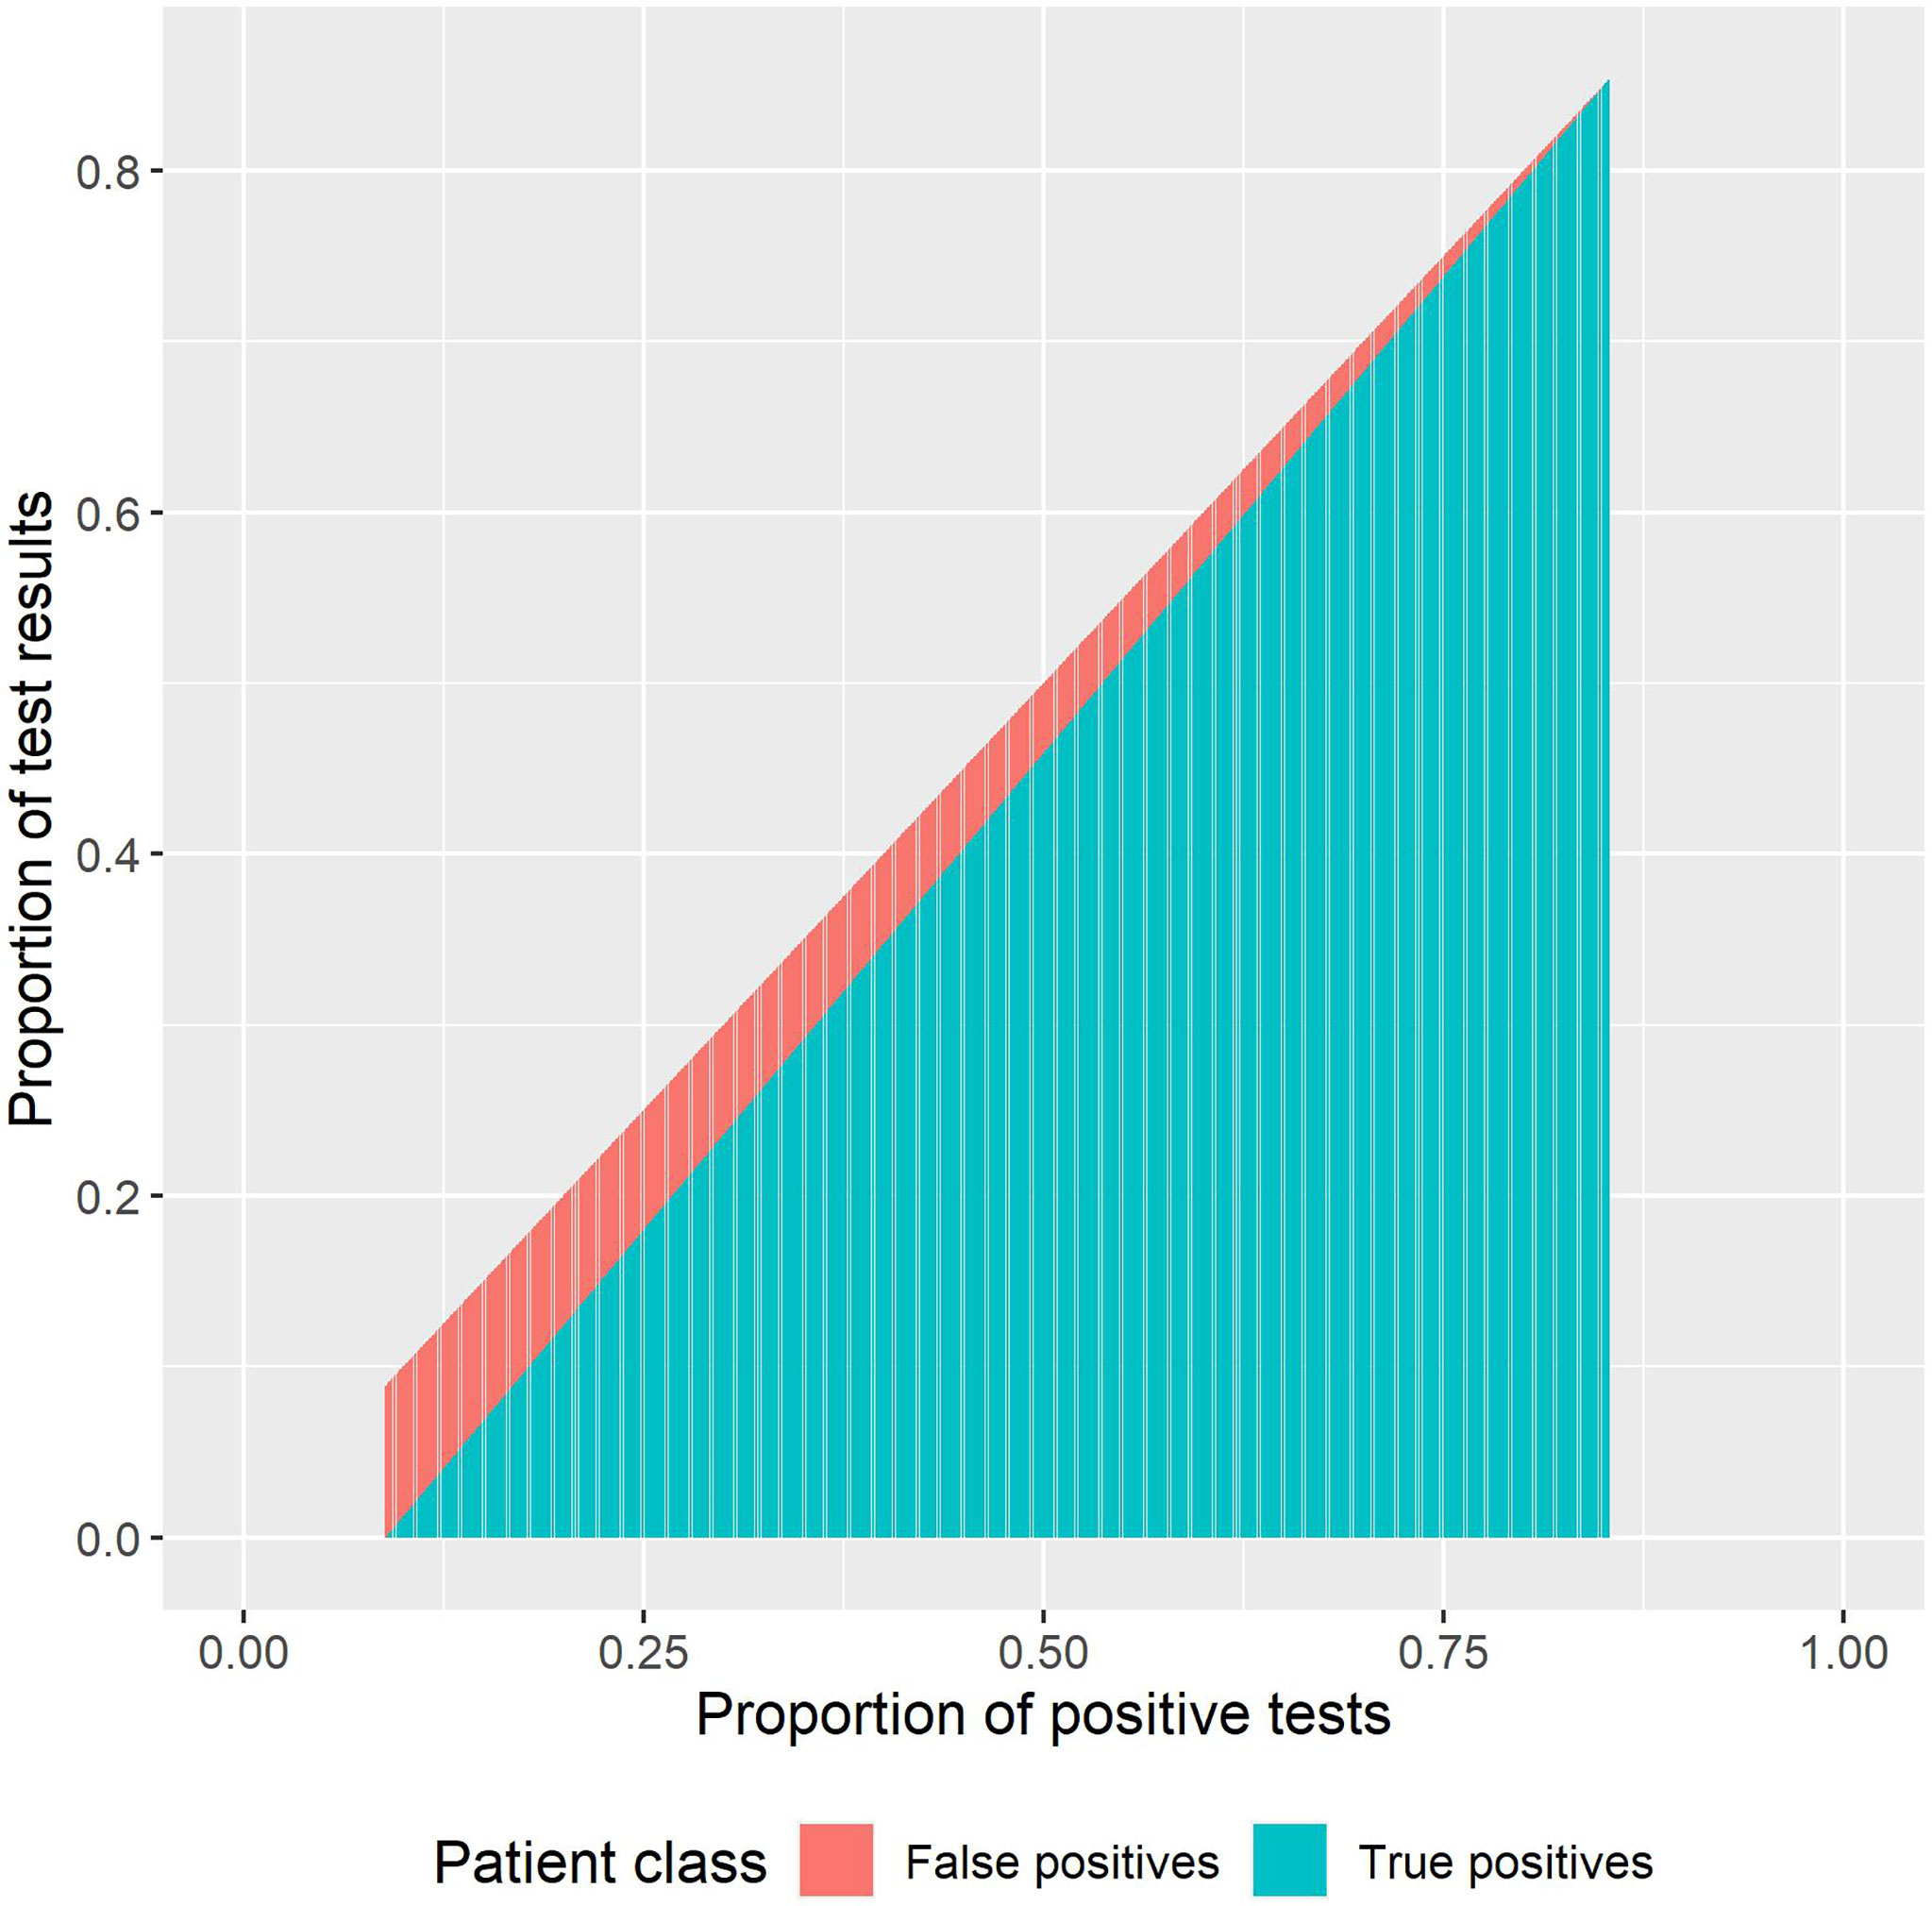
Figure 9 Proportion of true positives and false positives from the rapid diagnostic test (RDT) results.
Figure 9 also shows how our interpretation of the results should be impacted by the PPVs and the impact of overtesting. For example, if there are 100 cases in a population and we run just 100 tests on these 100 individuals, then the false positive rate is 0. If we test the 100 positive and 100 non-infected patients, then the proportion positive would be 0.498 (once sensitivity and specificity are factored in). If 100 + 900 were tested, then the proportion of positive would be 0.181 with a small proportion of true positives (Figure 9).
In this paper, we assessed the use of the rK39 RDT for the diagnosis of VL in an endemic county in Kenya, with the aim of improving access for the endemic and marginalized communities that are most affected. The LNOB strategy represents the main tenet for achieving the 2030 sustainable development goals and requires the need to reach the poorest of the poor, as well as combating discrimination and rising inequalities within and among countries (19). LNOB represents an NTD indicator in ensuring that the targets for SDG3 “Ensure healthy lives and promote wellbeing for all at all ages” are met (18). As an NTD, VL affects the poorest individuals. In Kenya, the challenges with VL control are multifaceted but exacerbated by the vast expanse of the endemic counties, the very bad road networks limiting access to healthcare, high turnover of trained personnel, and the presence of infection in pastoralist communities that are hard to reach. In addition, the nature of the current diagnostic tools and treatment prevents their deployment to all primary health centers.
The diagnosis of VL in Kenya requires the deployment of the recommended rK39 RDTs only in health facilities with the appropriate refrigeration conditions for adequate storage. This limitation effectively prevents the rollout of rK39 RDT in all health facilities in VL-endemic counties. As such, there is the need to carefully identify and select health facilities for VL diagnosis using the rK39 RDT. The DAT has even more stringent requirements, necessitating its deployment only in health facilities with trained technicians and available laboratory infrastructure.
The analysis of the patient information in the two outbreaks revealed a changing demographics toward the younger population, particularly children below 10 years. This we believe is linked to the education of health workers and community sensitization activities that have been implemented in the endemic areas. Thus, with increasing knowledge, adults are better able to protect themselves.
The high burden of maintenance has left the subcounty of North Horr, which reports VL cases without diagnostic coverage. This is a very rural area in which the distances involved have made the maintenance of a diagnostic network for VL impossible.
In the endemic areas, VL is co-endemic with malaria, with similar symptoms. While the diagnostic algorithm requires the presence of other infections to first be ruled out, this is usually not done. As a result, a significant proportion of rK39 tests are negative. rK39 RDT has a short shelf life of 12 months and is relatively expensive to procure. The use of the DAT did not contribute much in terms of diagnosis, except during shortage of rK39. Thus, it is important for the diagnostic algorithm to be carefully followed.
Another challenge to the use of the tests is the relatively low specificity. From the specificity parameters, we worked back the number of false positives detected by the test. This offers the opportunity for further research, especially in relation to reports of non-response to treatment. As such, it is absolutely critical to strictly follow the diagnostic algorithm to avoid treating patients who do not require treatment. Training is therefore of the utmost importance. In Marsabit, the characterization of the VL outbreak in 2014 indicated that no VL case management training had been conducted nor VL treatment guidelines distributed among healthcare workers in the 12 months prior to the outbreak (8).
Going forward, diagnosis strategies for the VL elimination programs will have to consider active screening activities, with identified cases referred for confirmation before treatment. Until then, the current challenges with VL diagnostics will have to be carefully considered and addressed. New and improved diagnostic tools that will ensure the extension of diagnosis to primary health centers are urgently required (3). In addition, new threats such as the planned discontinuation of production of the only effective rapid test by Bio-Rad Laboratories (20) will also need to be addressed.
In conclusion, the analysis of the VL diagnostic facilities linked to the patients and their communities helps to guide the decision on where to place diagnostic services in order to improve access and reduce the distance traveled by patients. This also provides a basis for an investment case toward the selection and strengthening of facilities that may otherwise not be suitable for VL diagnosis.
The original contributions presented in the study are included in the article/supplementary material. Further inquiries can be directed to the corresponding author.
JN, IC, DS, and AP conceived the study. MB provided funding. DS, AP, AL, DW, and IC collected the data. DW, SM, DM, and JN provided oversight. DS, AP, and PB analyzed the data. DS wrote the first draft. All authors reviewed and approved the final version of the article. All authors contributed to the article and approved the submitted version.
Funding for the VL activities in Kenya presented in this paper was provided by the Swiss Agency for Development and Cooperation (SDC) and the Fundación Probitas.
The authors declare that the research was conducted in the absence of any commercial or financial relationships that could be construed as a potential conflict of interest.
All claims expressed in this article are solely those of the authors and do not necessarily represent those of their affiliated organizations, or those of the publisher, the editors and the reviewers. Any product that may be evaluated in this article, or claim that may be made by its manufacturer, is not guaranteed or endorsed by the publisher.
We are grateful to the Ministry of Health, Marsabit County, Kenya, for the support during the implementation of activities in the county.
1. World Health Organization. Leishmaniasis. In: World Health Organization (2020). Available at: https://www.who.int/news-room/fact-sheets/detail/leishmaniasis.
2. World Health Organization. Global Leishmaniasis Surveillance: 2019–2020, a Baseline for the 2030 Roadmap. In: Wkly Epidemiol Rec, vol. 35. (2021). p. 401–19. Available at: https://apps.who.int/iris/handle/10665/344795.
3. World Health Organization. Ending the Neglect to Attain the Sustainable Development Goals: A Road Map for Neglected Tropical Diseases 2021–2030 (2020). Available at: https://www.who.int/neglected_diseases/Ending-the-neglect-to-attain-the-SDGs–NTD-Roadmap.pdf.
4. Ministry of Public Health and Sanitation. Integrated Disease Surveillance and Response in Kenya: Technical Guidelines 2012. (2012).
5. Kenya Ministry of Health. Prevention, Diagnosis and Treatment of Visceral Leishmaniasis (Kala-Azar) in Kenya: National Guidelines for Health Workers (2017). Available at: https://www.who.int/leishmaniasis/burden/Kala_Azar_Kenya_2017.pdf?ua=1.
6. Cunningham J, Hasker E, Das P, El Safi S, Goto H, Mondal D, et al. A Global Comparative Evaluation of Commercial Immunochromatographic Rapid Diagnostic Tests for Visceral Leishmaniasis. Clin Infect Dis an Off Publ Infect Dis Soc Am (2012) 55:1312–9. doi: 10.1093/cid/cis716
7. Schallig HDFH, Canto-Cavalheiro M, da Silva ES. Evaluation of the Direct Agglutination Test and the Rk39 Dipstick Test for the Sero-Diagnosis of Visceral Leishmaniasis. Memórias do Instituto Oswaldo Cruz. scielo; (2002) 97(7):1015–8. doi: 10.1590/S0074-02762002000700015
8. Kanyina EW. Characterization of Visceral Leishmaniasis Outbreak, Marsabit County, Kenya, 2014. BMC Public Health (2020) 20:446. doi: 10.1186/s12889-020-08532-9
9. World Health Organization. WHO Responds to Visceral Leishmaniasis Outbreak in Kenya (2017). Available at: https://www.who.int/leishmaniasis/news/WHO_responds_to_VL_outbreak_kenya/en/.
10. Reliefweb. Death Toll in Marsabit Kala Azar Outbreak Now Rises to Seven (2019). Available at: https://reliefweb.int/report/kenya/death-toll-marsabit-kala-azar-outbreak-now-rises-seven.
11. Dulacha D, Mwatha S, Lomurukai P, Owiny MO, Matini W, Irura Z, et al. Epidemiological Characteristics and Factors Associated With Visceral Leishmaniasis in Marsabit County, Northern Kenya. J Interv Epidemiol Public Heal (2019) 2(1):3. doi: 10.37432/JIEPH.2019.2.1.14
12. Hartung C, Lerer A, Anokwa Y, Tseng C, Brunette W, Borriello G. (2010). Open Data Kit: Tools to Build Information Services for Developing Regions. In: Proceedings of the 4th ACM/IEEE International Conference on Information and Communication Technologies and Development, . New York, NY, USA: Association for Computing Machinery. doi: 10.1145/2369220.2369236
13. Linard C, Gilbert M, Snow RW, Noor AM, Tatem AJ. Population Distribution, Settlement Patterns and Accessibility Across Africa in 2010. PloS One (2012) 7:e31743. doi: 10.1371/journal.pone.0031743
14. Maia Z, Lírio M, Mistro S, Mendes CMC, Mehta SR, Badaro R. Comparative Study of Rk39 Leishmania Antigen for Serodiagnosis of Visceral Leishmaniasis: Systematic Review With Meta-Analysis. Franco-Paredes C, Editor. PloS Negl Trop Dis (2012) 6:e1484. doi: 10.1371/journal.pntd.0001484
15. Mbui J, Wasunna M, Balasegaram M, Laussermayer A, Juma R, Njenga SN, et al. Validation of Two Rapid Diagnostic Tests for Visceral Leishmaniasis in Kenya. PloS Negl Trop Dis (2013) 7:e2441. doi: 10.1371/journal.pntd.0002441
16. Boelaert M, Verdonck K, Menten J, Sunyoto T, van Griensven J, Chappuis F, et al. Rapid Tests for the Diagnosis of Visceral Leishmaniasis in Patients With Suspected Disease. Cochrane Database Syst Rev (2014) 2014:CD009135. doi: 10.1002/14651858.CD009135.pub2
17. R Core Team. R: A Language and Environment for Statistical Computing. Vienna, Austria: R Foundation for Statistical Computing (2020). Available at: http://www.r-project.org/index.html.
18. Fitzpatrick C, Engels D. Leaving No One Behind: A Neglected Tropical Disease Indicator and Tracers for the Sustainable Development Goals. Int Health (2016) 8(Suppl 1):i15–8. doi: 10.1093/inthealth/ihw002
19. United Nations Sustainable Development Group. Leave No One Behind. United Nations (2021). Available at: https://unsdg.un.org/2030-agenda/universal-values/leave-no-one-behind.
Keywords: visceral leishmaniasis, kala-azar, Kenya, access, diagnosis, rK39
Citation: de Souza DK, Picado A, Bessell PR, Liban A, Wachira D, Mwiti D, Matendechero SH, Bosch M, Ndung’u JM and Cruz I (2022) Strengthening Visceral Leishmaniasis Diagnosis Capacity to Improve Access to Care in Kenya: The Example of Marsabit County. Front. Trop. Dis 2:809757. doi: 10.3389/fitd.2021.809757
Received: 05 November 2021; Accepted: 10 December 2021;
Published: 10 January 2022.
Edited by:
Angela H. Lopes, Federal University of Rio de Janeiro, BrazilReviewed by:
Adekunle Sanyaolu, Federal Ministry of Health (Nigeria), NigeriaCopyright © 2022 de Souza, Picado, Bessell, Liban, Wachira, Mwiti, Matendechero, Bosch, Ndung’u and Cruz. This is an open-access article distributed under the terms of the Creative Commons Attribution License (CC BY). The use, distribution or reproduction in other forums is permitted, provided the original author(s) and the copyright owner(s) are credited and that the original publication in this journal is cited, in accordance with accepted academic practice. No use, distribution or reproduction is permitted which does not comply with these terms.
*Correspondence: Dziedzom K. de Souza, ZHppZWR6b21rb21pLmRlc291emFAZmluZGR4Lm9yZw==
†These authors share first authorship
Disclaimer: All claims expressed in this article are solely those of the authors and do not necessarily represent those of their affiliated organizations, or those of the publisher, the editors and the reviewers. Any product that may be evaluated in this article or claim that may be made by its manufacturer is not guaranteed or endorsed by the publisher.
Research integrity at Frontiers

Learn more about the work of our research integrity team to safeguard the quality of each article we publish.