 Ryan M. Kalinoski1*
 Jian Shi
- 1Biosystems and Agricultural Engineering, University of Kentucky, Lexington, KY, United States
- 2Department of Chemical and Materials Engineering, University of Kentucky, Lexington, KY, United States
Meta-analysis, experimental and data-driven quantitative structure–activity relationship (QSAR) models were developed to predict the antimicrobial properties of lignin derivatives. Five machine learning algorithms were applied to develop QSAR models based on the ChEMBL, a public non-lignin specific database. QSAR models were refined using ordinary-least-square regressions with a meta-analysis dataset extracted from literature and an experimental dataset. The minimum inhibition concentration (MIC) values of compounds in the meta-analysis dataset correlate to classification-based descriptors and the number of aliphatic carboxylic acid groups (R2 = 0.759). Comparatively, QSARs derived from the experimental datasets suggest that the number of aromatic hydroxyl groups were better predictors of Bacterial Load Difference (BLD, R2 = 0.831) for Bacillus subtilis, while the number of alkyl aryl groups were the strongest correlation in predicting the BLD (R2 = 0.682) of Escherichia coli. This study provides insights into the type of descriptors that correlate to antimicrobial activity and guides the valorization of lignin into sustainable antimicrobials for potential applications in food preservation, fermentation, and other industrial sectors.
Introduction
Due to the overuse of antibiotics in our society, there has been a renewed interest in natural compounds for antimicrobial discovery amongst the scientific community (WHO, 2014; Harvey et al., 2015). Plant-based phenolics have a wide spectrum of antimicrobial activity and a variety of ring structures with low ecotoxicity that makes them an promising source of potential antimicrobial replacements (Upadhyay et al., 2014; Harvey et al., 2015). To this end, lignin is one of the most abundant naturally occurring sources of phenolic polymers on earth and is currently considered a major waste product in the paper and pulp industries and industrial lignocellulosic biorefineries (Mathew et al., 2018). Lignin is known to have antimicrobial properties against different microorganisms, which is due to the phenolic subunits that comprise lignin’s polyphenolic structure (Telysheva et al., 2005; Cazacu et al., 2013). Lignin’s antimicrobial properties are dictated by the source of the lignin, its extraction methods and chemical structure (i.e., monomers, oligomers, and functional groups) (Cazacu et al., 2013; Calvo-Flores et al., 2015). In general, it is believed that lignin phenolics have a mode of action that centers around their ability to increase the ion permeability of cell membranes or by causing direct cell membrane damage resulting in cell lysis (Barber et al., 2000; Dong et al., 2011; Espinoza-Acosta et al., 2016; Yang et al., 2018). However, lignin’s inhomogeneity and complex structure greatly reduces its capacity to be used in industrial and commercial sectors.
While a variety of technical lignin (i.e., Kraft lignin and organosolv lignin) with large undefined structures have had notable antimicrobial properties, there remains inconsistencies in different batches, across different lignin sources and extraction methods (Cazacu et al., 2013; Calvo-Flores et al., 2015). Conversely, when lignin is depolymerized into smaller more defined structures, these smaller oligomers and phenolic monomers have shown increased antimicrobial activity and higher specificity (Zemek et al., 1979). Thus, to increase the effectiveness and selectivity of lignin’s antimicrobial properties, it is necessary to depolymerize the polyphenolic structure of technical lignins into smaller units.
There are a plethora of lignin depolymerization techniques including: pyrolysis, acid/base/metal catalyzed hydrolysis, hydrogenolysis and oxidation (Pandey and Kim, 2011; Wang et al., 2013; Sun et al., 2018). Depending on the lignin source each depolymerization method will produce a variety of different phenolic compounds (monomers and oligomers) with potential antimicrobial properties in the form of a bio-oil. Pyrolysis oils, liquid smoke and wood vinegars are derived from the liquid fraction obtained from the incomplete combustion of wood and other lignocellulosic materials. These products have been used extensively in human history to preserve food by smoking and creating a protective barrier on wood for building applications (Lourençon et al., 2016; Sari et al., 2019). More recently, pyroligneous acid from the slow pyrolysis of hardwood has shown significant antimicrobial activity against multi-antibiotic resistant strains of E. coli, Pseudomonas aeruginosa, Staphylococcus aureus, Candida albicans and Cryptococcus neoformans, based on agar diffusion tests (de Souza Araujo et al., 2018). The pyrolysis oil from pine trees has also been shown to have antimicrobial properties against the foodborne pathogens, Bacillus cereus and Listeria monocytogenese, at concentrations ranging from 500 to 1,000 ug/ml (Patra et al., 2015). The main antimicrobial components of these products have been attributed to phenolics, furans, formaldehyde, and organic acids. Wood vinegars from sapwood were found to have significant antimicrobial activity against Ralstonia solanacearum, Phytophthora capsici, Fusarium oxysporum, and Pythium splendens (Hwang et al., 2005).
While lignin bio-oils have shown promising antimicrobial properties for a variety of industrial applications, questions remain as to what individual compounds are responsible for their diverse antimicrobial properties (Lourençon et al., 2016; Sari et al., 2019). In practice, when antimicrobials are developed, they are usually composed of a single compound or combination of a few compounds. When considering the use of lignin-based bio-oils it would be incredibly difficult to attribute a single compound to its antimicrobial properties, as it is too complex of a mixture. Therefore, methods need to be developed that can predict the antimicrobial potential of lignin derivatives, so that the search for lignin depolymerization products with enhanced antimicrobial properties can be expedited.
Quantitative structure–activity relationship (QSAR) models are an indispensable tool in drug design and discovery including predicting antimicrobial properties. They work by finding relationships between the variations in calculated molecular descriptors (properties) or fingerprints (functional groups) with the biological activity of a group of compounds, so that biological activity of new chemical entities can be assessed more quickly (Shahlaei, 2013). QSAR modeling for predicting antimicrobial properties of polyphenols typically utilizes experimentally derived datasets with a limited number of compounds (<50) and selected descriptors for developing a predictive regression type model, such as multiple linear regressions (MLR) (Araya-Cloutier et al., 2018; Bouarab-Chibane et al., 2019b). While this increases the specificity of the model to predict the identified target compounds, it simultaneously limits the model’s ability to predict the activity of new compounds with a wider variety of structures. One of the ways to circumvent this issue would be to increase dataset size and compound variability. However, due to the lengthy experimental procedures used to measure antimicrobial activity, and the fact that many lignin oligomers after depolymerization are currently unidentifiable, it would be difficult to drastically increase the number of compounds tested in an efficient manner. Given the recent advances in machine learning and the increase in the amount of chemical and biological activity data available in the public domain in recent years (Camacho et al., 2018), QSAR models that can explore a large chemical space (thousands of compounds) can now be more widely applied (Lenselink et al., 2017).
In this context, the aim of this study was to develop and compare QSAR models that can predict the antimicrobial properties of lignin derivatives against representative Gram-positive (Bacillus subtilis) and negative bacteria (Escherichia coli). The compounds used to construct the models were selected from 1) a large public access database that were non-specific to lignin, 2) a database created from a meta-analysis of available lignin compounds with activity measurements, and 3) an experimentally derived dataset of lignin monomers and dimers. ChEMBL was used as the open access database, which contains over 1.9 million distinct bioactive molecules with drug-like properties and 16 million activity measurements (Gaulton et al., 2012). Since minimum inhibitory concentration (MIC) is one the most widely used antimicrobial activity measurements (Andrews, 2001), both the ChEMBL and meta-analyses datasets used MIC to describe the compounds activity. For both B. subtilis and E. coli, three distinct datasets from ChEMBL were obtained by first choosing all the available compounds with MIC measurements against both organisms, selecting a subset of compounds with only C, H, and O atoms (the only atoms present in lignin), and then an additional subset of compounds with at least one phenolic ring. By enhancing the quality of these datasets and making them more lignin specific to improve the accuracy of our models we are applying a more data-centric approach to developing our models, which has become an emerging trend in data science (Tsai et al., 2020). Due to the large sizes of these ChEMBL datasets, five different regression-based machine learning algorithms were used to create their QSAR models: support vector machine, random forest, k-nearest neighbor, decision tree, and neural networks.
Next, a meta-analysis of the available literature with MIC activity measurements for lignin derivatives against both B. subtilis and E. coli was conducted. Not only was this dataset used to develop a QSAR model using ordinary least square (OLS) regressions, but it was also used as a validation set for determining the ChEMBL-based model’s performance for predicting lignin specific compounds.
Finally, a variety of commercially available lignin monomers and dimers were screened for antimicrobial properties against B. subtilis and a subsequent OLS regression based QSAR was developed. The activity measurement used in the experimental set was the Bacterial Load Difference (BLD) (percent inhibition of growth) as it more easily measured, encompasses the low antibacterial activity, absence of antibacterial activity, and potential growth promoting effect sometimes observed with phenolics compared to MIC (Bouarab-Chibane et al., 2019b). The results from this study will provide insights into using different types of databases (open access, meta-analysis, experimentally derived, and lignin specific/non-specific) to develop QSAR models with the potential to predict the antibacterial activity of lignin derivatives.
Materials and methods
ChEMBL datasets
Antimicrobial data for both B. subtilis and E. coli, used as representative Gram-positive and -negative bacteria, were obtained from the ChEMBL database (version 27) (Gaulton et al., 2012). Using the ChEMBL web server, a dataset was created for each bacteria type by selecting minimum inhibitory concentration (MIC) as the biological/antimicrobial activity measurement. The datasets were then downloaded, and further filtering was performed in the Python environment.
Firstly, compounds with ‘non standard unit for type’ or ‘outside typical range’ in the data validity comments were removed. Then compounds with standard relation values of ‘<’ or ‘>’ were also removed, and duplicates based on compound ‘Molecule ChEMBL ID’ were averaged into one value. At this point the B. subtilis dataset had 9,828 compounds and E. coli had 21,657 compounds, which are hereafter referred to as ‘B-All’ and ‘E-All’, respectively. Since lignin has a chemical composition that only contains carbon (C), hydrogen (H), and oxygen (O) atoms, the datasets were further filtered by keeping compounds with only those atoms. This was performed by searching for compounds with a canonical simplified molecular-input line-entry system (SMILES) string with only C, H, and O atoms (Weininger et al., 1989). The resulting filtering produced a B. subtilis dataset with 768 compounds and an E. coli dataset with 703 compounds, which are hereafter referred to as ‘B-Sorted’ and ‘E-Sorted’, respectively. Finally, to increase the datasets specificity for predicting lignin phenolics, the previously SMILE sorted dataset was filtered for compounds with at least one phenolic ring. This resulted in a B. subtilis dataset with 309 compounds and an E. coli dataset with 278 compounds, which are hereafter referred to as ‘B-Phenolic’ and ‘E-Phenolic’, respectively. Therefore, three datasets for both B. subtilis and E. coli were created with MIC data. Furthermore, MIC values originally determined in µg/ml were converted to micromolar values (µM/ml) and then converted to pMIC (i.e. -logMIC, in molar) for all datasets (Araya-Cloutier et al., 2018). One could consider preprocessing the dataset differently for different ML models, especially for ANN as ANN models can bear more noise than some others. However, the purpose of this study is to compare performance across different ML models using the same dataset. We decided to use the same preprocessing methods across all ML models.
Lignin monomers meta-analysis dataset
A new dataset of MIC biological activity measurements for lignin monomers against both B. subtilis and E. coli were compiled from published sources. Multidisciplinary databases such as Academic OneFile, Academic Search Complete, EBSCO, and Google Scholar for terms including combinations such as ‘lignin,’ ‘antimicrobial,’ ‘phenolic,’ ‘MIC,’ ‘monomer,’ ‘antibacterial,’ as well as authors with previous work containing appropriate data, were used to find journal articles that contained MIC antimicrobial data for phenolics that can be derived from lignin. In total, 16 compounds were found with MIC data for B. subtilis and 27 compounds for E. coli (listed in Section 3.2). MIC values originally determined in µg/ml were converted to micromolar values (µM/ml) and then converted to pMIC (i.e. -logMIC, in molar) prior to modeling (Araya-Cloutier et al., 2018). The resulting datasets for B. subtilis and E. coli are hereafter referred to as ‘B-Meta’ and ‘E-Meta’, respectively.
Experimental dataset
The antibacterial activity of 25 lignin derived monomers and three dimers were assessed by monitoring the cell growth (as represented by the optical density at 600 nm, OD600) of B. subtilis (NRRL B-354) and E. coli using a spectrophotometry. The full list of compounds and subsequent antimicrobial activity measurements are listed in Section 3.3. The monomers were of analytical quality and purchased from either Sigma Aldrich (St. Louis, MO, USA) or TCI America. The guaiacylglycerol-beta-guaiacyl ether dimer was purchased from TCI America, while 2-(2-methoxyphenoxy)-1-(4-methoxyphenyl)ethanol and 3-hydroxy-2-(2-methoxyphenoxy)-1-(4-methoxyphenyl)-1-propanone dimers were kindly provided by Dr. Mark Crocker at the Center for Applied Energy, University of Kentucky (Song et al., 2018).
Briefly, frozen cultures were first revived in liquid growth media (LB broth, Fisher BioReagents™, BP9723) and allowed to grow at 180 rpm shaking speed for 12 h at 37°C. Afterwards the cells were pelletized, washed, and resuspended in fresh liquid media. To test for the antimicrobial properties, each microbe was cultivated in 96-well plates (run in triplicate) and the OD600 was monitored for 24 h with time points taken every 10 min. All wells were brought to an OD600 of 0.2 prior to growth, and the phenolics were added to treatment wells to create a final concentration of 1 g/L. To facilitate the solubility of the phenolics in media, all cultures had a final ethanol concentration of 5% (v/v). Two controls were used, one having the 5% ethanol concentration, and one having just microbes and the media. To determine how the phenolics affected microbial growth, the percent change in OD600 of the ethanol control during the exponential phase of growth was compared to the growth of the phenolic treatments. This resulted in the percent decrease in growth or Bacterial Load Difference (BLD) for each phenolic treatment (Bouarab-Chibane et al., 2019b), with the formula described in Equation 1:
After obtaining the BLD values for each phenolic, the structures of each compound were converted to canonical SMILES strings using PubChem for use in descriptor calculations. The final experimental datasets for B. subtilis and E. coli are here after referred to as ‘B-Experimental’ and ‘E-Experimental’, respectively.
Descriptor calculations and QSAR modeling
To calculate the various molecular descriptors, all the compound’s structures in each dataset were converted into canonical SMILES strings (Weininger et al., 1989), if not already provided. These SMILES were then entered into an open-access molecular descriptor calculator software package for Python, RDKit (http://www.rdkit.org). RDKit has a variety of calculatable descriptors that describe a molecule’s lipophilicity (i.e., LogP, LogD), topological indices (i.e., fragment complexity, size, polarity), connectivity indices and different molecular fingerprints (i.e., number of hydroxyl groups, phenolic rings, carboxylic acids etc.). A full list of descriptors and their description is provided in Supplementary Table S1. While it is possible to create models with all the calculatable descriptors, a variety of descriptor selection methods were utilized to improve model accuracy by reducing dimensionality of input space without losing important information.
For the B-All, E-ALL, B-Sorted, E-Sorted, B-Phenolic, and E-Phenolic datasets 200 of RDKit’s available descriptors were calculated. Highly correlated (|r| ≥ 0.8) and constant descriptors were eliminated from the list for each individual dataset. To further reduce the dimensionality of the predictors (descriptors) a principal component analysis (PCA) was performed using scikit-learn (Pedregosa et al., 2011). The number of new principal components to be used was assessed by plotting the number of components vs the percent explained variance, and the number of components that explained 99% of the variance were chosen for each dataset. After the optimal number of principal components were chosen and calculated these values were used as the independent variables for predicting the pMIC values in the subsequent QSAR models. Before modeling, each of the above dataset’s with pMIC and PCA data were randomly split into training (80%) and test (20%) sets three times for cross-validation. We compared and utilized five machine learning algorithms to build the QSAR models for the B-All, E-ALL, B-Sorted, E-Sorted, B-Phenolic, and E-Phenolic datasets. They were the support vector machine (Epsilon-Support Vector Regression), random forest regressor, k-nearest neighbors regressor, decision tree regressor, and neural network regressor (Multi-layer Perceptron regressor) algorithms provided by scikit-learn. The specific settings and parameters used to build each machine learning algorithm are provided below. QSAR models were assessed based on their average coefficient of determination (R2) and root mean squared error (RMSE) based on the predictions made for the three training and test sets.
The best QSAR models constructed from the ChEMBL datasets were further tested for prediction accuracy, by using the meta-analysis datasets as a test set for predicting lignin-specific compounds. Kernel density estimate (KDE) plots using the Seaborn plugin for python were constructed to determine the distribution of each dataset’s pMIC values. Furthermore, the applicability domain (AD) for estimating the reliability in the prediction of new compounds from the ChEMBL datasets were evaluated against the meta-analysis datasets, according to previous work (Golbraikh et al., 2003).
For the B-Meta, E-Meta, B-Experimental, and E-Experimental datasets all 200 of RDKit’s available descriptors were calculated. Pearson’s correlation coefficient (|r| ≥ 0.5) was used to select a fixed subset of predictors (descriptors) best able to predict the antimicrobial activities (either pMIC or BLD) using the ordinary least squares (OLS) regression analysis (Hira and Gillies, 2015). The OLS regressions were performed using Statsmodels (Seabold and Perktold, 2010). As the number of compounds for each of these datasets were very low (less than 30 compounds), the datasets were not separated into training and test sets due to higher risks of chance correlation and overfitting (Araya-Cloutier et al., 2018). For each dataset, the selected descriptors were fed into an OLS regression and backwards elimination was used until the significance of each descriptor coefficient in the model (p-value) was less than 0.05, which identified the best fitting model.
Machine learning algorithms
All machine learning models were created using scikit-learn and either the default hyper parameters were used or a number of different parameters through a grid search based exploration of model parameter space was utilized (Lenselink et al., 2017). The final parameters used for the machine learning algorithms that used grid search for QSAR model development are reported in Table 1.
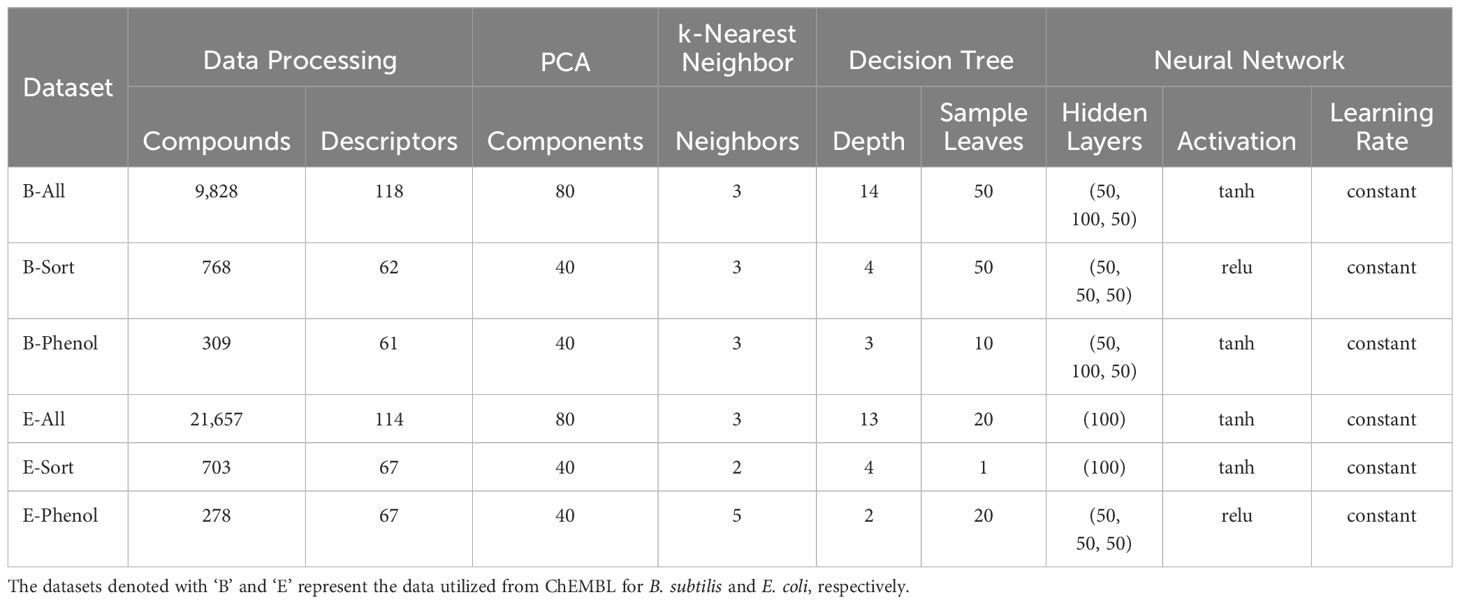
Table 1. Each dataset’s final number of compounds, descriptors, and hyper parameters for machine learning algorithms that used grid search parameterization.
The support vector machine (SVM) or Epsilon-Support Vector regression is a non-linear regression that calculates an optimal hyper-plane where the distance and error between each data points is minimized (Mei et al., 2005). The SVM performed here used the default parameters provided by scikit-learn. These included a radial basis function kernel, gamma of 1/number of descriptors, parameter cost of 1, and epsilon of 0.1.
Decision tree regressors (DT) are a non-parametric learning method that works by creating a set of binary rules to calculate the target value by dividing the data into subsets that contain data with similar values (Basant et al., 2016). The DT used a grid search to select the optimal maximum depth from 1 to 21 and minimum number of sample leaves from 1 to 100 for each dataset, by fitting the training set and using five cross-fold validations and RMSE to choose the best values. All other parameters utilized the scikit-learn default settings.
The random forest regressor (RF) is an ensemble learning method for non-linear regression analysis, that operates by constructing a multitude of decision trees and outputting the mean prediction of the individual trees (Svetnik et al., 2003). We used all the default parameters provided by scikit-learn, but the number of estimators was increased from the default 100 to 500.
K-nearest neighbor regressions (KNN) are a non-parametric method that stores all available cases and predicts a continuous target based on the similarity measure (distance function) between different features in the same neighborhood (Zheng and Tropsha, 2000). The KNN used a grid search to select the optimal number of neighbors from 2 to 15 for each dataset, by fitting the training set using five cross-fold validations and RMSE to choose the best number of neighbors. The rest of the parameters including the weight function and leaf size utilized scikit-learns default settings.
Neural networks (NN) are brain-inspired algorithms where input features are fed into an input layer, and after a number of nonlinear transformations are performed in a hidden layer, the predictions are generated in an output layer to produce a regression (Lenselink et al., 2017; Camacho et al., 2018; Vamathevan et al., 2019). The ANN relied on most of the default settings provided by scikit-learn’s MLPRegressor neural network. In order to optimize the model’s hyper-parameters, the GridSearchCV function was utilized, with the best parameters being selected based on the best five cross-fold validations and RMSE score. The hyper-parameters chosen to be optimized were the hidden layer sizes, activation type, and learning rate. Specifically, for the hidden layers and number of neurons in each layer was either three layers with 50–100 neurons [(50,50,50), (50,100,50)], or the default setting of a single layer and 100 neurons (100). The activation functions used for the hidden layers were either the rectified linear unit function ‘relu’ or the hyperbolic tan function ‘tanh’. The learning rate schedule for weight updates was either the constant or adaptive learning rates. For further documentation and explanation of the other default settings used to create this model please refer to the scikit-learn version 0.23.2 documentation.
Software used
Python (version 3.7.7) was used with the following libraries: RDKit (version 2020.03.6) for the calculation of fingerprints and descriptors, Scikit-learn (version 0.23.2) for all machine learning algorithms and descriptor selection techniques, seaborn (version 0.11.0) with Matplotlib (version 3.3.2) for all figure visualizations, and Pandas (version 1.1.2) for all dataset analysis and manipulation.
Results and discussion
ChEMBL dataset models
The open access database, ChEMBL, was used to develop datasets of compounds with antimicrobial activity measurements (MIC) against both B. subtilis and E. coli. These datasets were used alongside machine learning algorithms to develop QSAR models with the potential to predict the antimicrobial activity of lignin derived phenolics, from compounds that are not lignin specific.
The initial ChEMBL datasets created for B. subtilis (B-All) and E. coli (E-All) contained 9,628 and 21,657 compounds, respectively. These datasets were filtered into two additional subsets, that contained compounds having more similar structures to that of lignin derivatives. The first subset was created by selecting compounds with only C, H, and O atoms, resulting in a B. subtilis dataset with 768 compounds (B-Sort) and an E. coli dataset with 703 compounds (E-Sort). By removing compounds with nitrogenous, chlorine, or fluorine based functional groups, the remaining compounds could have more similar chemical characteristics to that of lignin derivatives. Then those subsets were further filtered by selecting compounds with at least one phenolic ring, resulting in a B. subtilis dataset with 309 compounds (B-Phenolic) and an E. coli dataset with 278 compounds (E-Phenolic). Lignin’s antimicrobial properties have been reported to attribute to its phenolic structures, so it was important to include a subset of compounds that contained only phenolic-based structures. These were the final six datasets used for QSAR model development from the ChEMBL database.
The QSAR models used antimicrobial activities measured in pMIC (-log MIC, in µM/mL) values as the target and the molecular descriptors calculated from RDKit as the variables. Supplementary Table S1 lists the descriptors and molecular fingerprints used in this work. These descriptors represent the lipophilicity (i.e., LogP, LogD), topological indices (i.e., fragment complexity, size, polarity), connectivity indices and functional groups. They are selected based on previous work (Speck-Planche et al., 2012; Svensson et al., 2017; Araya-Cloutier et al., 2018; Bouarab-Chibane et al., 2019b). Supplementary Table S2 (Additional File 2) lists the specific descriptors used for each dataset after pre-processing. Table 1 summarizes the number of descriptors.
Principal component analysis (PCA) was used to reduce the number of descriptors and the dimensionality of the feature space. PCA reconstructs features of a dataset into a new set of uncorrelated features called principal components (PCs). The optimal number of new PCs for each dataset was selected by the number of components that explained 99% of the variance in the dependent variable. Figure 1 shows the number of PCs vs the percent explained variance, and Table 1 summarizes the number that explained 99% of the variance. Since this feature extraction technique creates new independent variables that are less interpretable, the ability to examine how each descriptor influences pMIC is no longer easily obtainable. This is actually beneficial when using the ChEMBL datasets, as we are attempting to predict the antimicrobial properties of lignin with non-lignin based compounds from a data driven perspective, and do not need to understand the exact relationship between these compound’s descriptors and pMIC values. Therefore, the QSAR models were developed from the pMIC and PC values from each dataset using five popular regression-based machine learning algorithms: support vector machine (SVM), random forest (RF), k-nearest neighbor (KNN), decision tree (DT), and neural networks (NN).
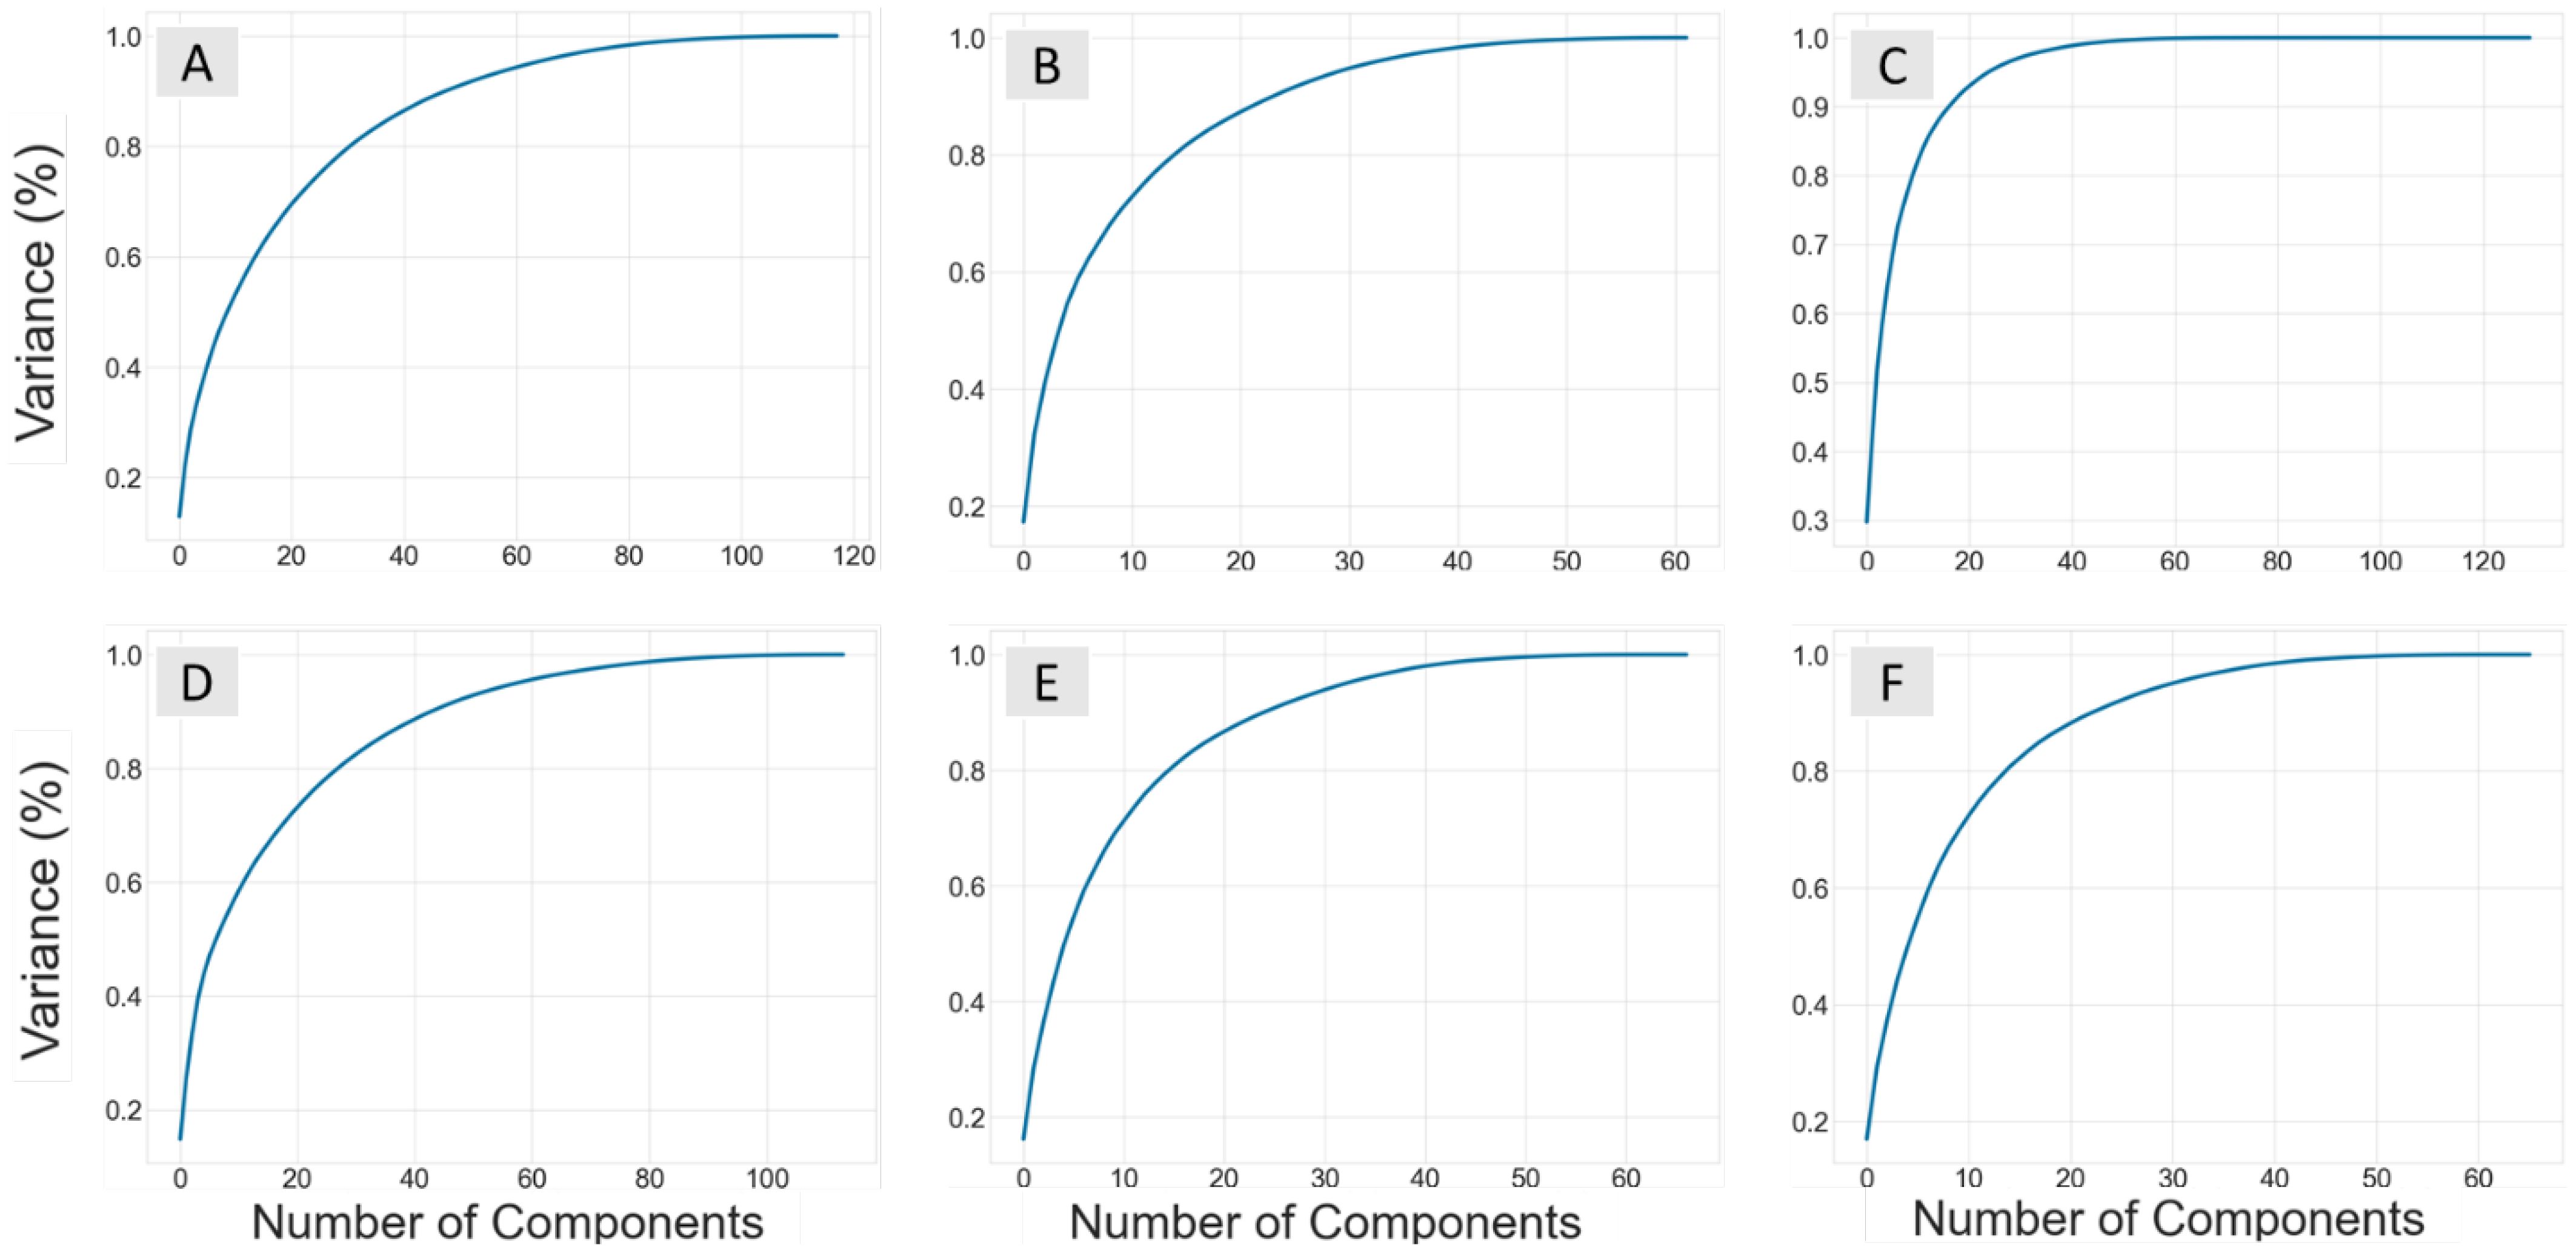
Figure 1. Plots showing the number of components from the principal component analysis performed on each datasets descriptor set against the explained variance (%). The ChEMBL datasets for B. subtilis are B-All (A), B-Sort (B), and B-Phenol (C), while the E. coli sets are E-All (D), E-Sort (E), and E-Phenol (F).
The performance summary of five machine learning QSAR models for each ChEMBL dataset is provided in Supplementary Tables S3–S5, respectively. Each dataset was split randomly into three different training (80%) and test (20%) sets, with each of these same sets being applied to the different model types. The training sets were used to build each machine learning model and the test sets were used for model validation. The metrics used for measuring model performance was the average coefficient of determination (R2) and root mean square error (RMSE) for the three training and test sets. The better performing model is identified as having a high R2 and low RMSE value for the average test scores and training scores; thus, Table 2 provides a summary of the best fitting models for each ChEMBL dataset. When comparing models, if one model had a higher R2 and lower RMSE for the test sets, but not the training sets, the model with better performance for the test set was chosen, as it is ultimately the more important metric (Bengio et al., 2017). For example, B-All’s best performing QSAR model was the KNN algorithm (Supplementary Table S3), as it had the highest R2 of 0.69 for the test set, despite a slightly lower R2 for the training sets (0.86) compared to the RF algorithm (0.95). Accordingly, the E-All, B-Sort, E-Sort, B-Phenol, and E-phenol datasets had the most robust QSAR models using the RF, NN, KNN, RF, and KNN algorithms, respectively (Table 2). Not surprisingly the table shows that only NN model has sensible generalization capabilities as there is almost no difference between RMSE for training and test set. The only similar model is E-phenol KNN but it has low prediction quality, so this is most probably effect of high error and low prediction capability of the model in general. The stark difference between training and test group suggests that the model is over-trained or has only interpolation capabilities (like B-ALL KNN and E-ALL RF – huge differences in R2). Future work could test an ensemble system with different techniques to get averaged predications; a possible way to improve the model capability.
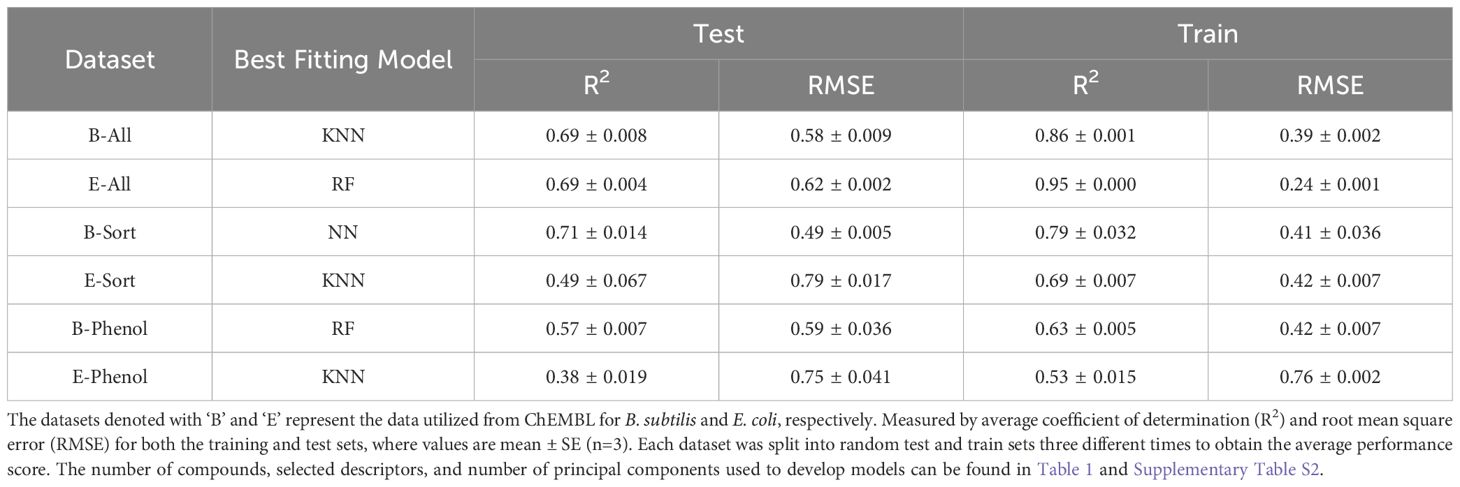
Table 2. QSAR model performance for the best fitting machine learning models for each ChEMBL dataset.
A common theme with all the models in each dataset, was that the R2 for the test set was always lower than the training set. This could be a sign of model overfitting or unrepresentative data between the training and test sets (Bengio et al., 2017). However, all the models had very low SE values when averaging the R2 values of the three different test/train splits for cross-validation, which would suggest compounds are not being underrepresented. The number of independent variables (ICs) used for each dataset were also rather large (80 or 40), which could contribute to overfitting, but they explained 99% of the dependent variable’s variation and when smaller numbers of ICs were used the model’s performance drastically decreased (data not shown). Coupled with the fact that most models used a grid search parametrization technique to fine tune the hyperparameters, these discrepancies may just be a function of the data itself and not with how the models were evaluated or fit. Furthermore, the E-Sort, B-Phenol, and E-Phenol datasets did not have any QSAR models with a R2 > 0.6, which is usually needed to describe a truly predictive model (Shahlaei, 2013). Yet, since these datasets are not lignin-specific, the true measure of these model’s performance needs to be evaluated with an additional test set of actual lignin derived compounds.
To this end, the available literature was searched for lignin derived monomers that had reported MIC values against B. subtilis and E. coli. The results from this meta-analysis are reported in Supplementary Table S6, where 16 compounds were found with MIC data for B. subtilis (B-Meta) and 27 compounds for E. coli (E-Meta). These two datasets were then evaluated as an additional test set for each of the best performing QSAR models found for each ChEMBL dataset, described above. The data is summarized in Figure 2, where the predicted vs actual pMIC values of the lignin monomers are plotted. It can immediately be seen that none of the ChEMBL QSAR models could accurately predict the lignin monomers. All the models predicted the lignin compounds as having pMIC values roughly less than 2.5, when they are reported as actually having pMIC values greater than 2.5. This suggests these models are grossly underpredicting the pMIC values for the lignin compounds, which would correlate to them having a lower MIC and subsequently greater antimicrobial activity. To understand this, a kernel density estimate (KDE) plot for the ChEMBL and meta-analysis datasets were constructed to visualize the distribution of their pMIC values (Figure 3), and their applicability domains were evaluated (Supplementary Tables S7, S8, respectively).
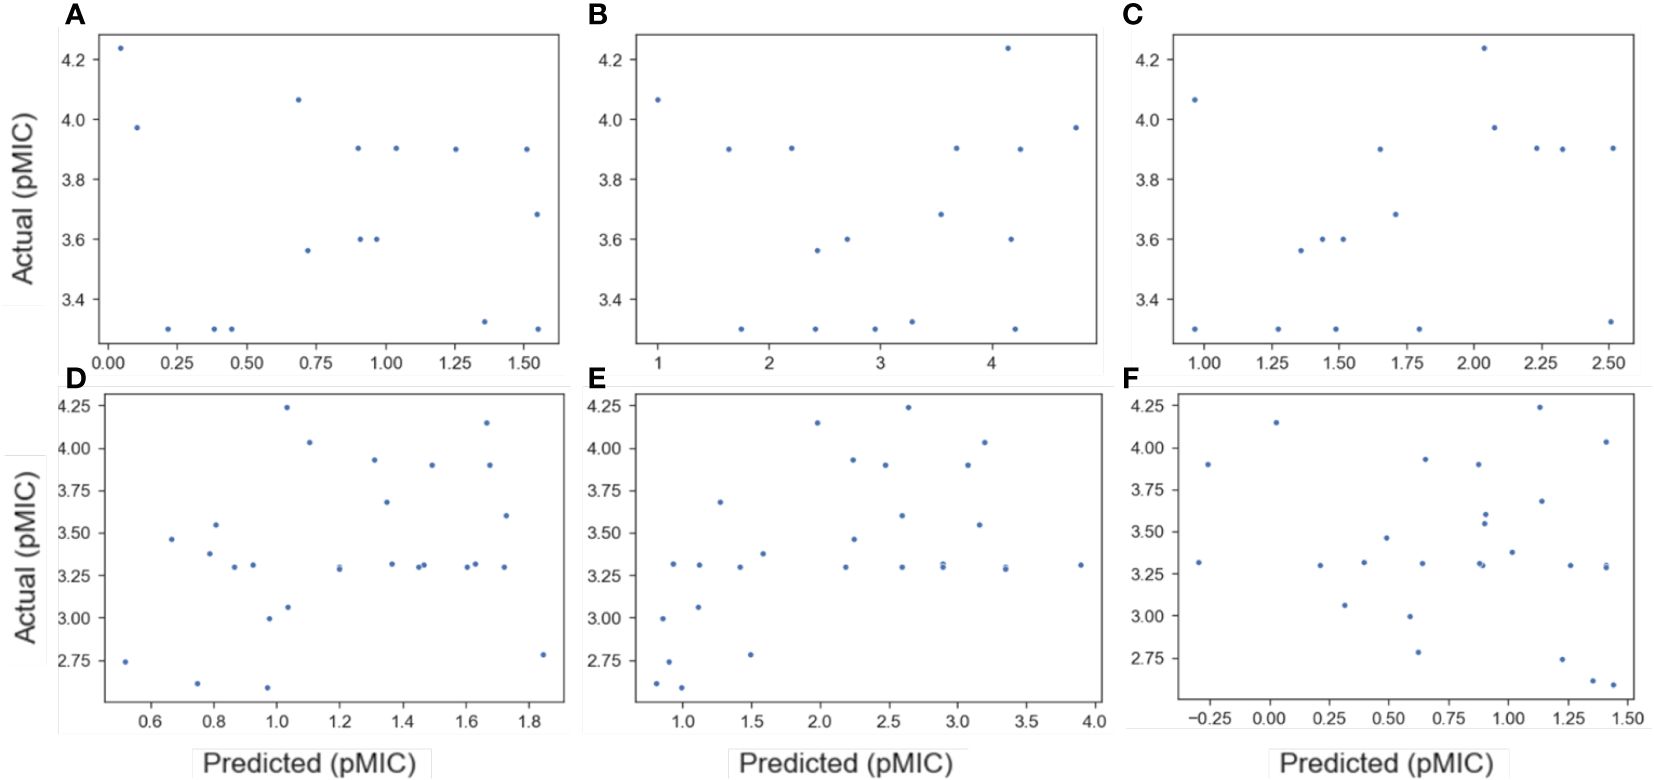
Figure 2. Plots of predicted versus actual pMIC values for the B-Meta (A–C) and E-Meta (D–F) datasets by utilizing the best QSAR models developed from the ChEMBL datasets. The ChEMBL datasets used to predict pMIC of the meta-analysis datasets for B. subtilis are B-All (A), B-Sort (B), and B-Phenol (C), while the E. coli sets are E-All (D), E-Sort (E), and E-Phenol (F). The best QSAR models used in each prediction are as follows: RF (A), NN (B), RF (C), RF (D), SVM (E), and KNN (F).
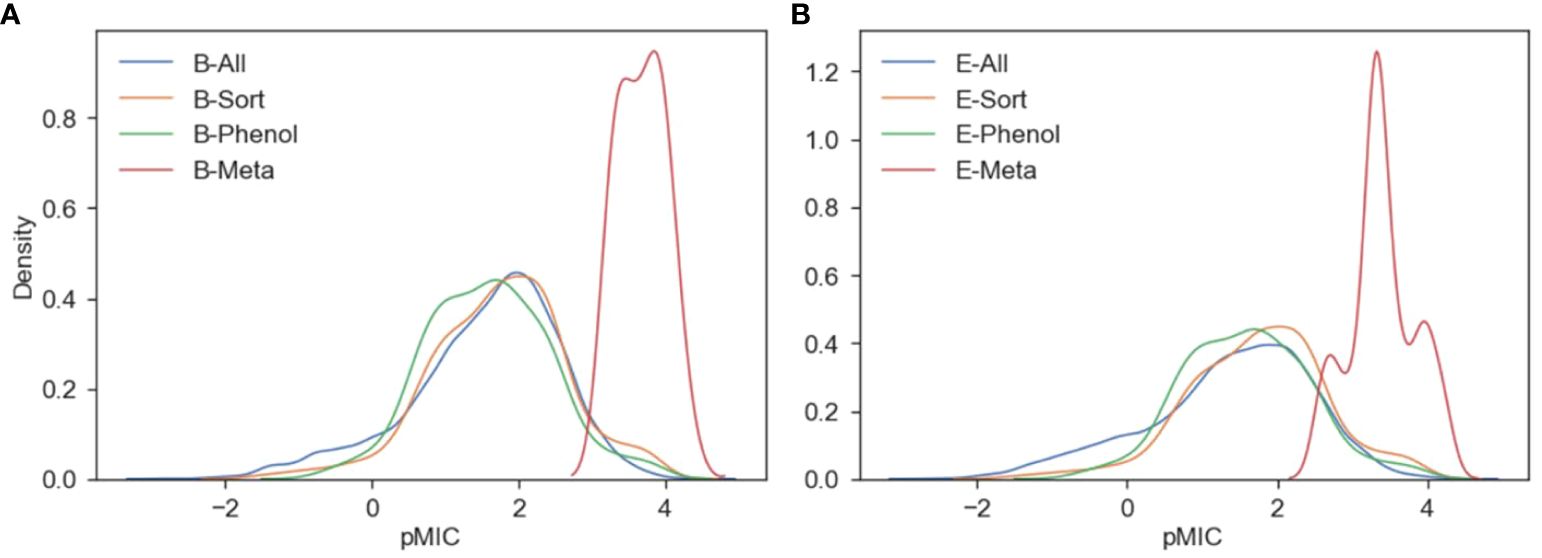
Figure 3. Kernel density estimates describing the distribution of pMIC values for the B. subtilis (A) and E. coli (B) ChEMBL/meta-analysis datasets.
The KDE plots show that the meta-analysis datasets for both E. coli and B. subtilis have pMIC distributions centered around 3–4, while the ChEMBL datasets are centered between 0–2.5. Even though the ChEMBL datasets clearly contain compounds with pMIC values within the distribution of the meta-analysis datasets, they did not lie within the applicability domains (AD) of the ChEMBL datasets. The AD is a useful measure for determining the reliability of a model’s prediction for a new set of compounds. Based on the PCA for each ChEMBL dataset, their ADs were calculated based on the Euclidean distances among all their compounds and a final threshold value is determined (Golbraikh et al., 2003). Then, the same measure is calculated for each of the compounds in the meta-analysis dataset to test if they lie within the threshold of the ChEMBL dataset’s AD. We can see in Supplementary Tables S7, S8 that none of the B-Meta or E-Meta compounds fall within the AD of the ChEMBL datasets. The data show that our data-centric approach to creating datasets of traditional pharmacological compounds that are most similar to potential lignin structures still cannot accurately be used to predict the antimicrobial activity of true lignin derivates. Even though these results are not what the authors had hoped, these data create a more concrete conclusion that a comprehensive dataset of lignin derivatives with antimicrobial measurements needs to be developed. Considering this, QSAR models using actual lignin compounds from the meta-analysis datasets, and an experimentally derived dataset were developed and are discussed in the further sections.
Meta-analysis dataset models
The meta-analysis datasets, used for validating the ChEMBL QSAR models, were applied to develop their own QSARs using ordinary least square (OLS) regressions. Instead of using PCA as a feature extraction technique, univariate feature selection relying on Pearson’s correlation coefficient (r) was employed. Since OLS regressions rely on linear relationships, it made more sense to utilize Pearson’s correlation as it measures the strength of the linear correlation between the independent (descriptors) and dependent variables (pMIC). Therefore, the same 200 molecular descriptors were calculated for the B-Meta and E-Meta datasets, and the descriptors with a r>0.5 were selected to develop the OLS regressions. Subsequently, the selected descriptors were fed into an OLS regression and backwards elimination was used until the significance of each descriptor coefficient in the model (p-value) was less than 0.05, which indicated the best fitting model. It should be noted that this approach is biased for linear relationships and it undercasts models that have non-linear capabilities.
No reliable QSARs using OLS was obtained for the E-Meta dataset (results not shown). This result was not surprising considering the pMIC distribution in E-Meta dataset had three different centers, as shown in the KDE plot (Figure 3B). Its variable distribution and small sample size could prevent the QSAR model from capturing any relevant relationships in the feature space (Bouarab-Chibane et al., 2019b). Conversely, even though the B-Meta (16 compounds) dataset was smaller than E-Meta (27 compounds), a more successful QSAR model was developed. To improve model capacity, one could use ANN MLP with two regression outputs – one for E-Meta and the other for B-Meta. Provided the intrinsic relations are not entirely different this would increase dataset and allow training more sophisticated models.
The model for best predicting the antibacterial activity (pMIC) of the lignin monomers in the B-Meta dataset is summarized in Table 3 and Figure 4. As observed, the selected OLS model showed good predictive power with a R2 of 0.759. Three descriptors, SLogP_VSA3, SLogP_VSA5, and fr_AL_COO, were used to develop the best fitting OLS regression model. The SLogP_VSA3 and SLogP_VSA5 descriptors are Molecular Operation Environment (MOE)-type descriptors that bin the output from other descriptor types (i.e., SLogP) and calculate the van der Waals (VDWs) surface area (VSA) of atoms contributing to any specified bin of that output. Thus, SLogP_VSA3 and SLogP_VSA5 calculate the sum of VSA contributions to the lipophilicity measurement SLogP (partition coefficient of compound in two immiscible solvent) within −0.2–0 and 0.1–0.15 bin ranges, respectively. While SLogP and VSA are ‘primary’ descriptors that have a more-or-less interpretable contributions to a compounds mechanism of action, the MOE-type descriptors are intended to be used as model predictors and are not as interpretable (Labute, 2000). Therefore, the negative and positive relationships SLogP_VSA3 and SLogP_VSA5 contribute to the OLS regression, can only be used as a data driven identifier for predicting the pMIC values of lignin compounds. On the other hand, the fr_AL_COO descriptor represents the number of aliphatic carboxylic acid groups in each compound and can directly be used to infer the mechanism of action.
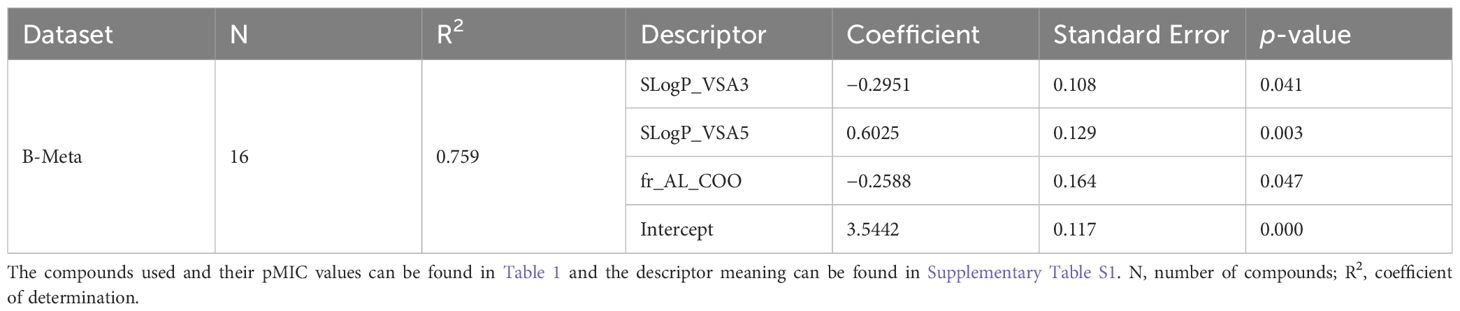
Table 3. Statistical performance of the best OLS models obtained through backwards elimination of descriptors, for predicting pMIC values of lignin phenolics against B. subtilis in the B-Meta dataset.
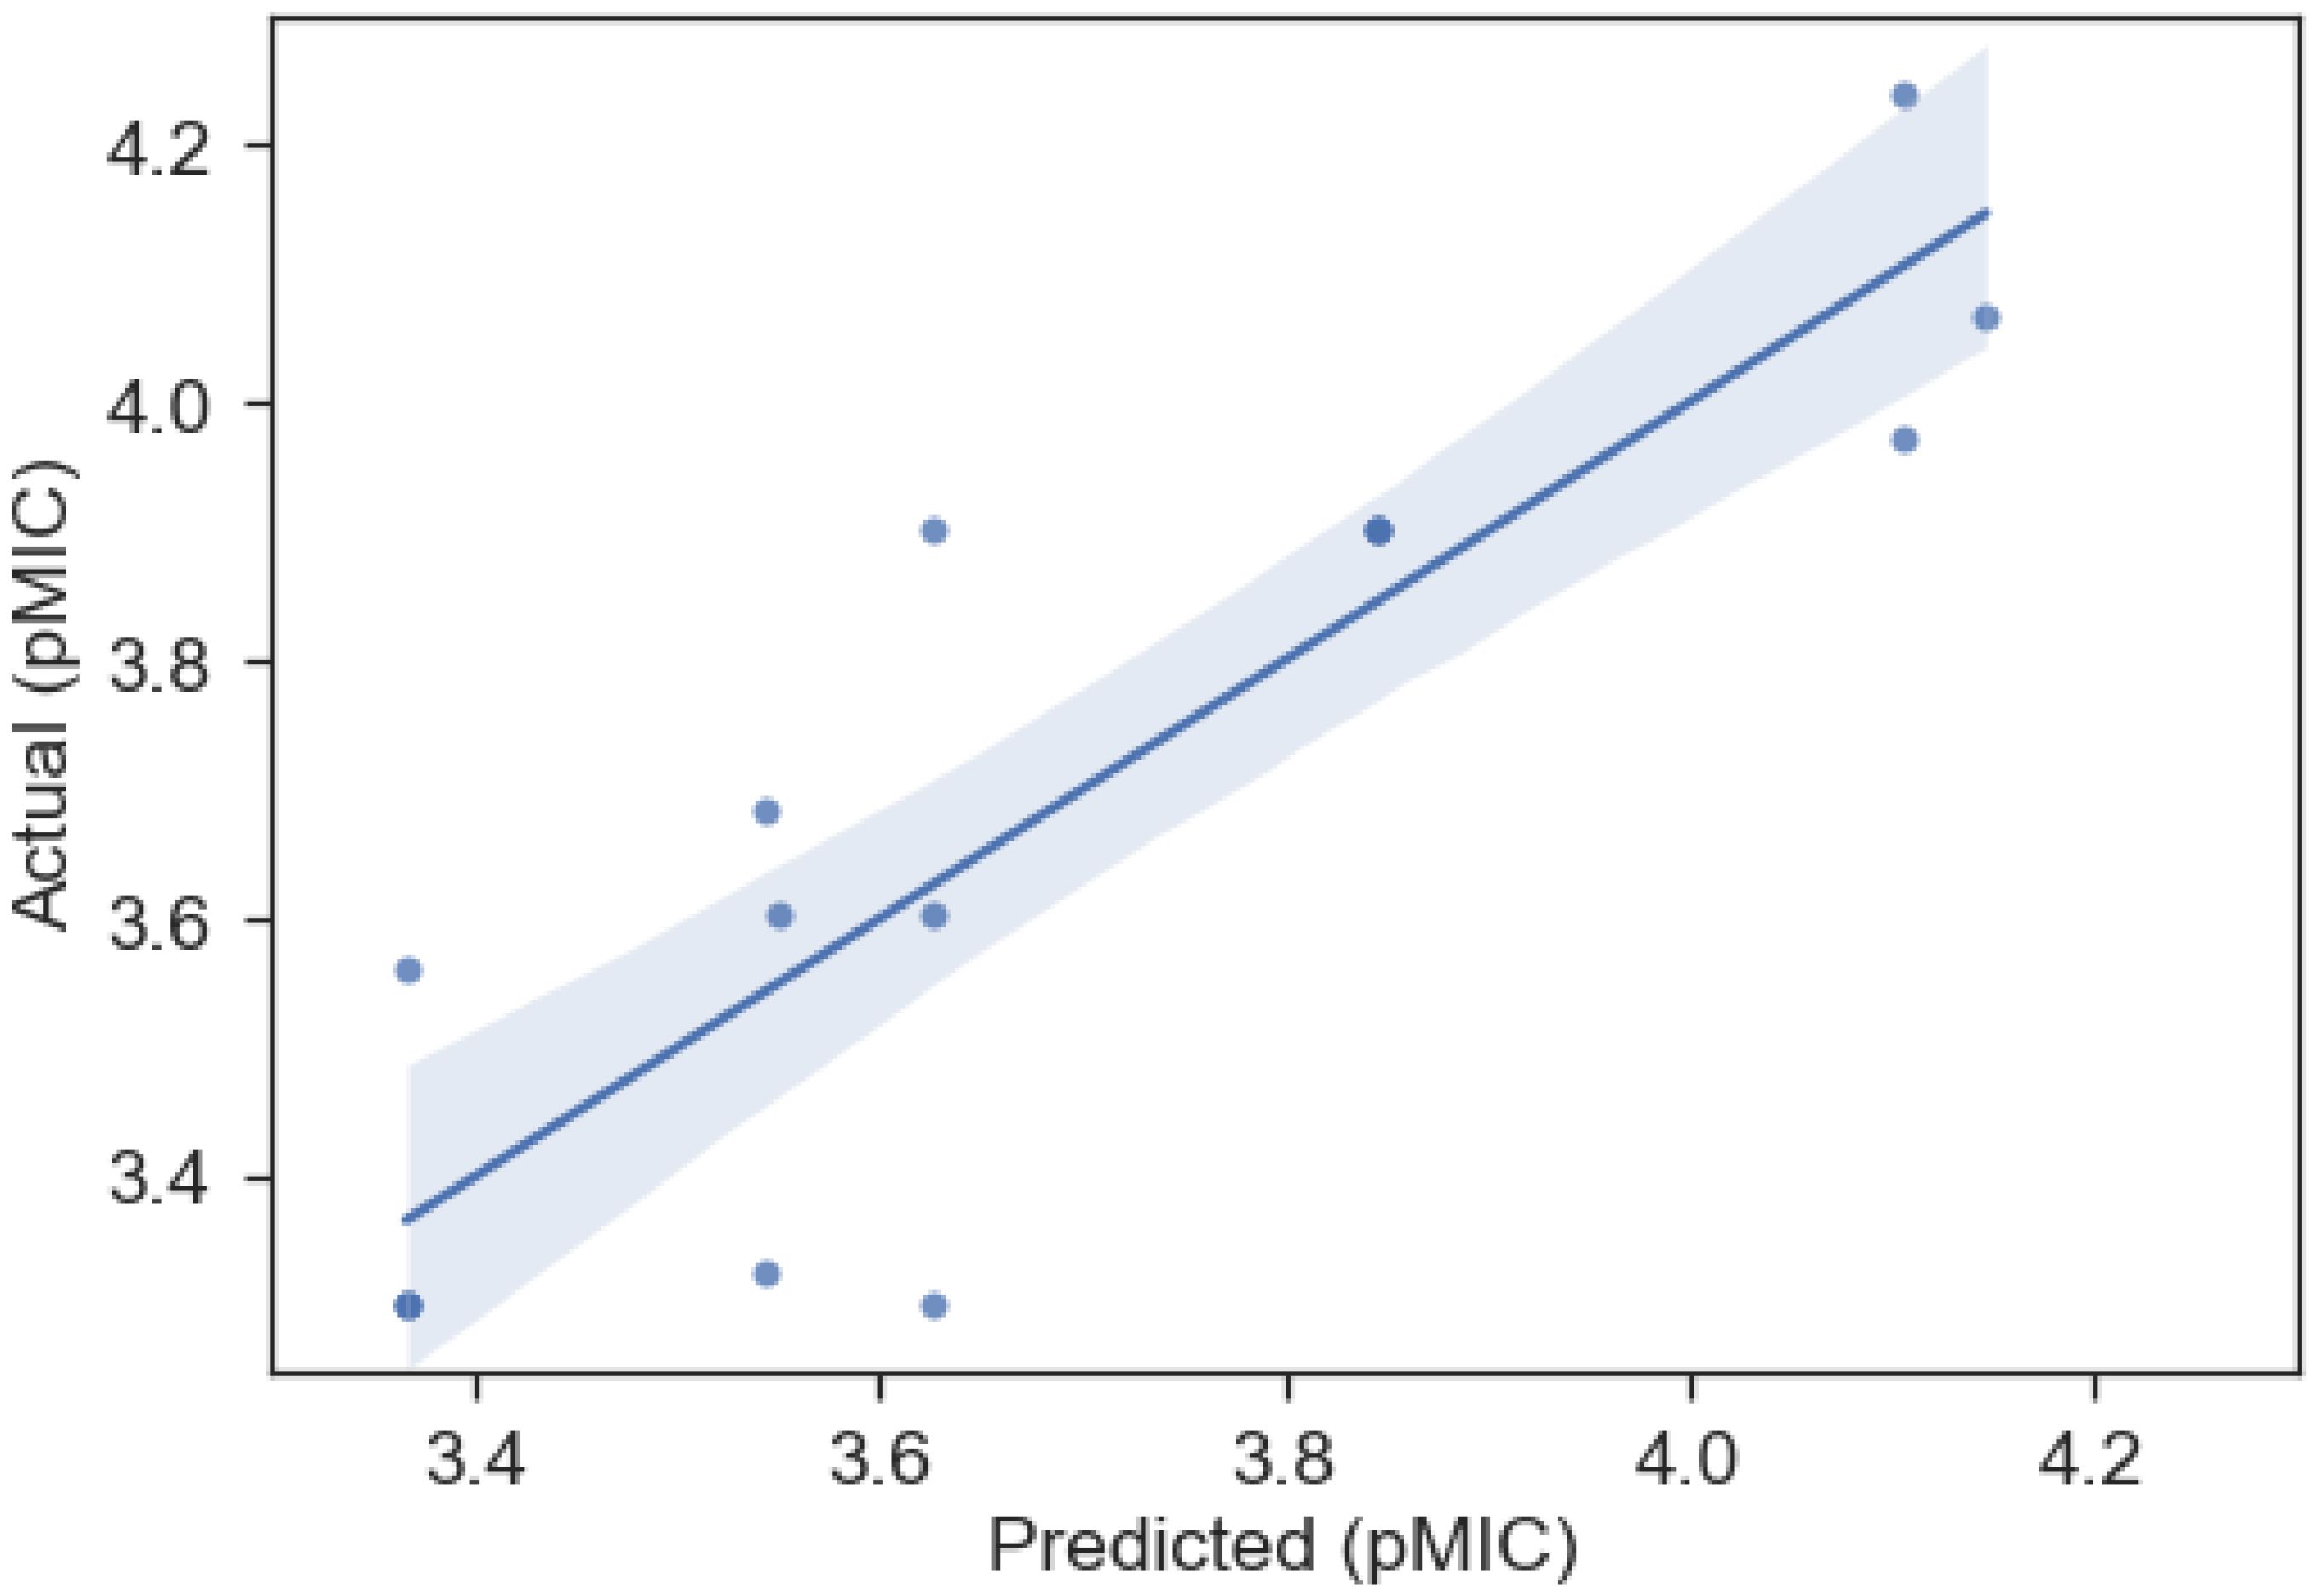
Figure 4. Predicted vs actual pMIC regression from the OLS QSAR model for the B-Meta dataset, whose parameters can be found in Table 3. The shaded region represents the 95% confidence interval for the regression.
Caffeic, ferulic, sinapic, and p-coumaric acid were the only compounds with an aliphatic carboxylic acid group present in this dataset and they had the lowest observed pMIC values (~3.3). They also represent hydroxycinnamic acid derivatives that are known to have increased antimicrobial properties compared to their more polar hydroxybenzoic acid counterparts (Borges et al., 2013). This is confirmed here by the fact that gallic and protocatechuic acids, with aromatic carboxylic acid groups, had higher MIC values that corresponds to lower antimicrobial activity. Previous work has suggested that hydroxycinnamic acid’s propenoic side chain is responsible for its increased antimicrobial properties, as it facilitates the transport of the molecule through the cell membrane of Gram-positive bacteria (Campos et al., 2003; Nohynek et al., 2006; Borges et al., 2013). Therefore, this explains why an increase in aliphatic carboxylic acid groups correlated to an increase in antimicrobial activity (lower pMIC) for this dataset. Nonetheless, the B-Meta dataset only represents a very small number of lignin monomers and more compounds need to be examined to truly understand or predict the properties that influence their antimicrobial activity.
Experimental dataset models
The antibacterial activity of 25 lignin derived monomers and three relevant dimers were assessed by measuring their BLD or percent inhibition against B. subtilis and E. coli at concentrations of 1 g/L. The BLD values are presented in Table 4, and they ranged from 2% up to 100%, indicating compounds can be completely inhibitory to both organisms. The 3-hydroxy-2-(2-methoxyphenoxy)-1-(4-methoxyphenyl)-1-propanone lignin dimer was the only compound to show complete inhibition against both B. subtilis and E. coli. Interestingly, the 2-(2-methoxyphenoxy)-1-(4-methoxyphenyl)ethanol lignin dimer only had a BLD value of 66% and 55% for both B. subtilis and E. coli, but its chemical structure differs only by an absence of a methoxy group on β-carbon compared to 3-hydroxy-2-(2-methoxyphenoxy)-1-(4-methoxyphenyl)-1-propanone. Therefore, the presence of this one methoxy group seems to increase the molecules BLD by ~34–45%. Moreover, we can also see from Table 4 that that alkyl chains on the phenolic subunit (4-ethylphenol) and the lignin dimers themselves play an important role in these lignin derivatives antimicrobial properties (i.e., higher BLD values). However, the development of a QSAR model for both organisms will provide an actual statistical relationship between these molecules BLD values and descriptors for more predictive purposes.
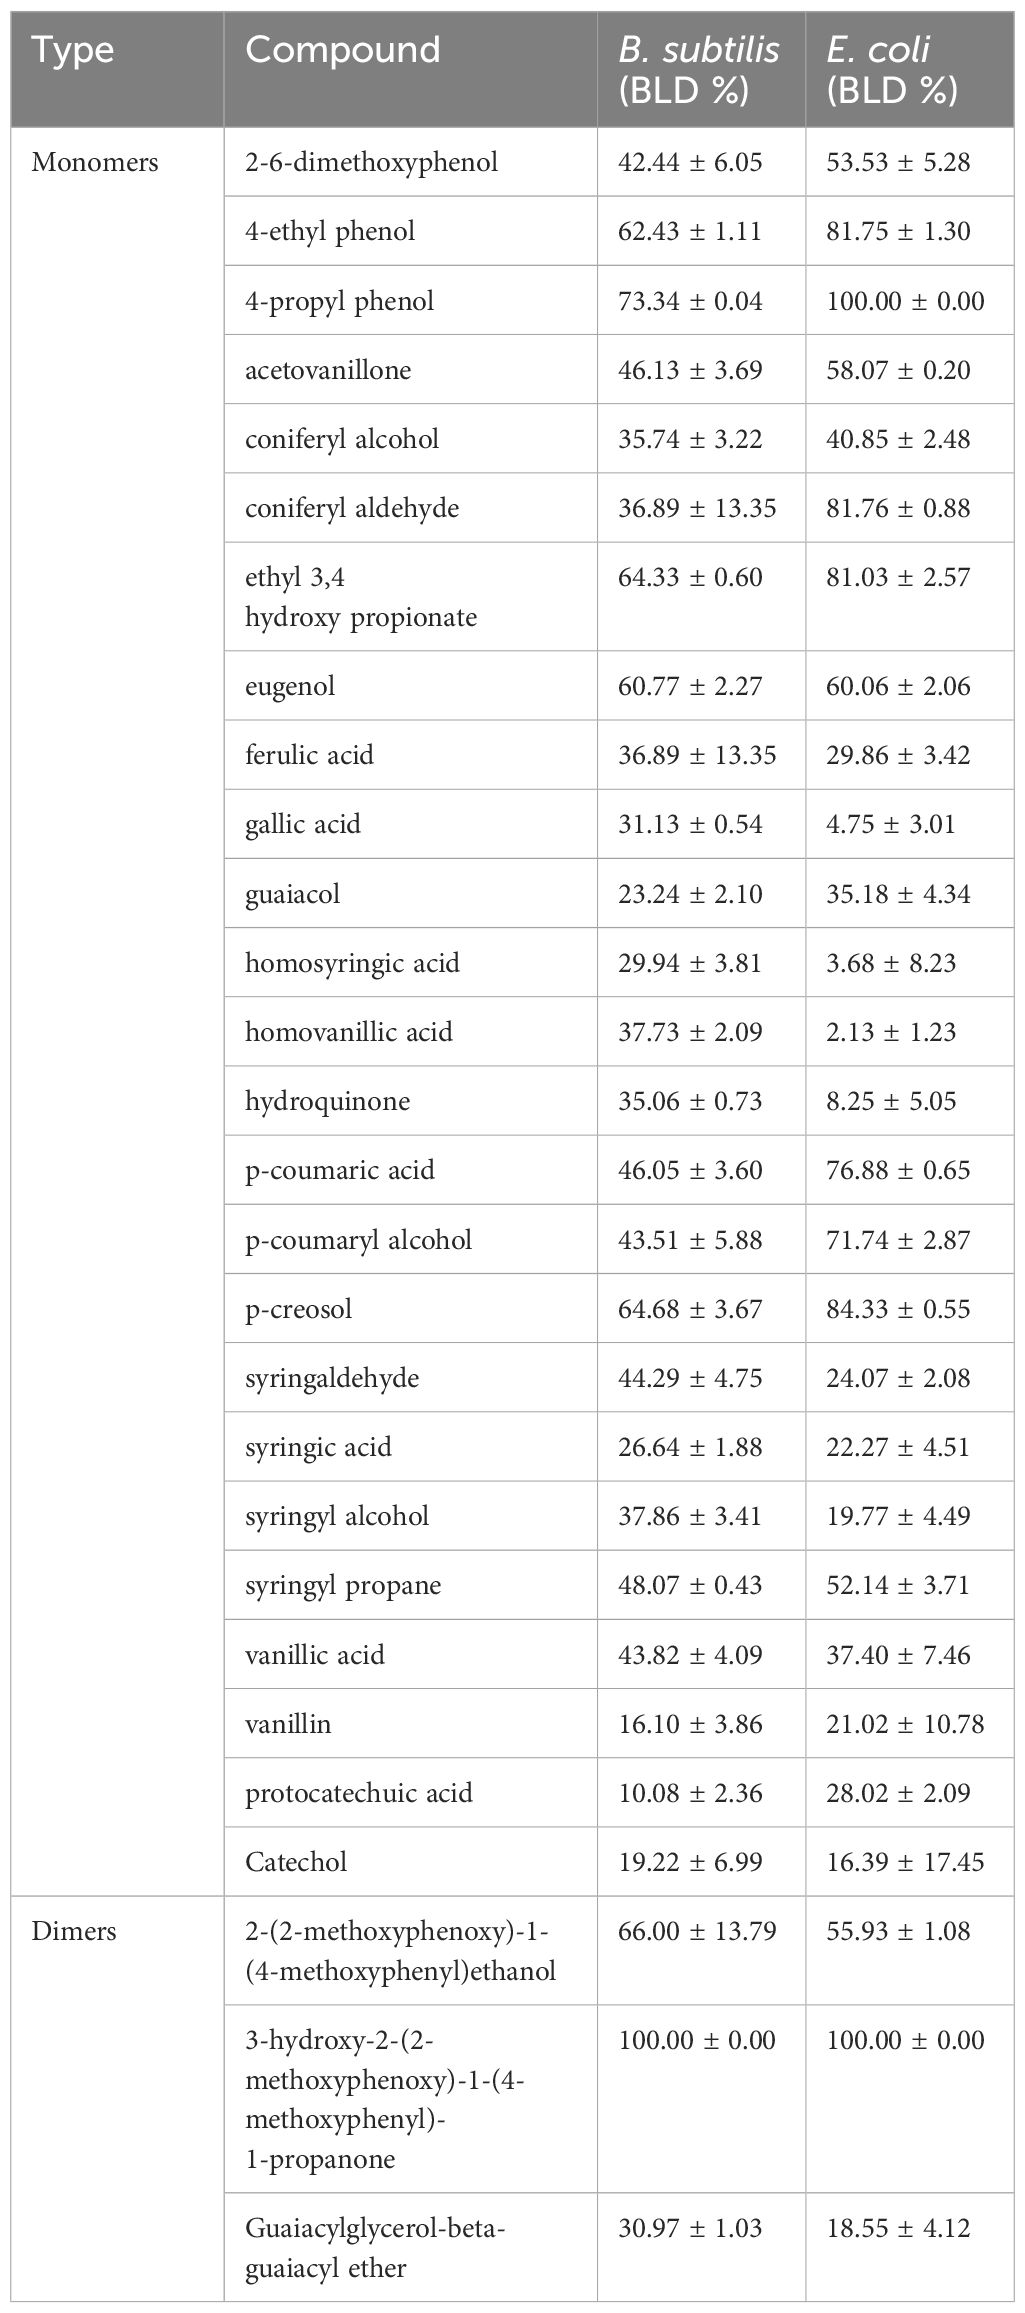
Table 4. Experimental antimicrobial activity of lignin monomers and dimers against B. subtilis and E. coli (BLD %), where experimental values are mean ± SE (n=3).
The same methods used to the develop the QSAR models for the B-Meta dataset were used for both the B-Experimental and E-Experimental datasets. Where RDKit’s calculated descriptors were chosen based on univariate feature selection (r>0.5) and an OLS regression with backwards elimination was performed until all descriptors had a p-value less than 0.05. The best fitting OLS regressions are summarized in Table 5 and the predicted vs actual BLD values are plotted in Figure 5. Firstly, the B-Experimental dataset’s OLS regression had greater predictive power with a R2 of 0.831 than that of the B-Meta dataset. Four descriptors were used to develop the best fitting OLS regression model: MinABSEStateIndex, PEOE_VSA13, VSA_EState8, and fr_Ar_OH. As stated previously, PEOE_VSA13 and VSA_EState8 are MOE-type descriptors that are intended to be used as model predictors and are not as interpretable for describing the compounds mechanism of action (Labute, 2000). The MinABSEStateIndex is the minimum absolute electrotopological state (E-state) of a skeletal atom, formulated as an intrinsic value plus a perturbation term arising from the electronic interaction and modified by the molecular topological environment of each atom in the molecule (Hall et al., 1991). This descriptor, like the MOE-type descriptors, is used as more of a classification tool for identifying similar compounds instead of describing a feature that could relate to the compounds mode of action. Therefore, while the MinABSEStateIndex, PEOE_VSA13 and VSA_EState8 descriptors show a positive relationship to the lignin compound’s BLD value against B. subtilis. Comparatively, fr_Ar_OH represents the number of aromatic hydroxyl groups in each compound and is better at elucidating their potential antibacterial mechanisms.
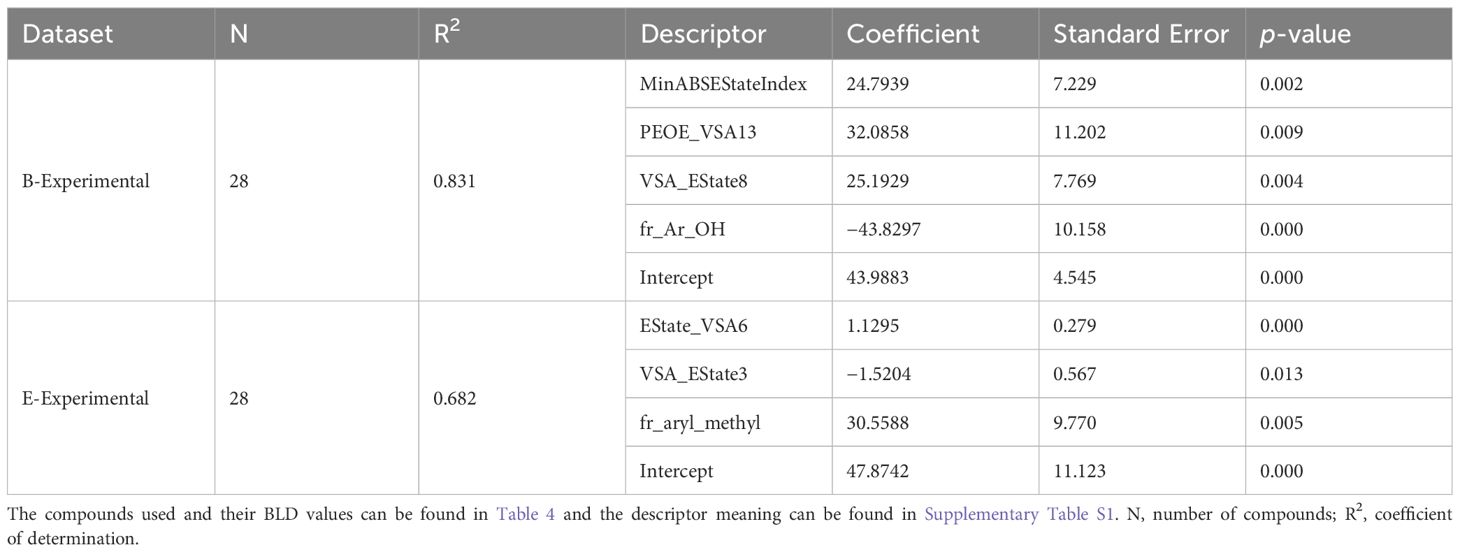
Table 5. Statistical performance of the best OLS models obtained through backwards elimination of descriptors, for predicting BLD (%) values of lignin phenolics against B. subtilis in the B-Experimental dataset and E. coli in the E-Experimental dataset.
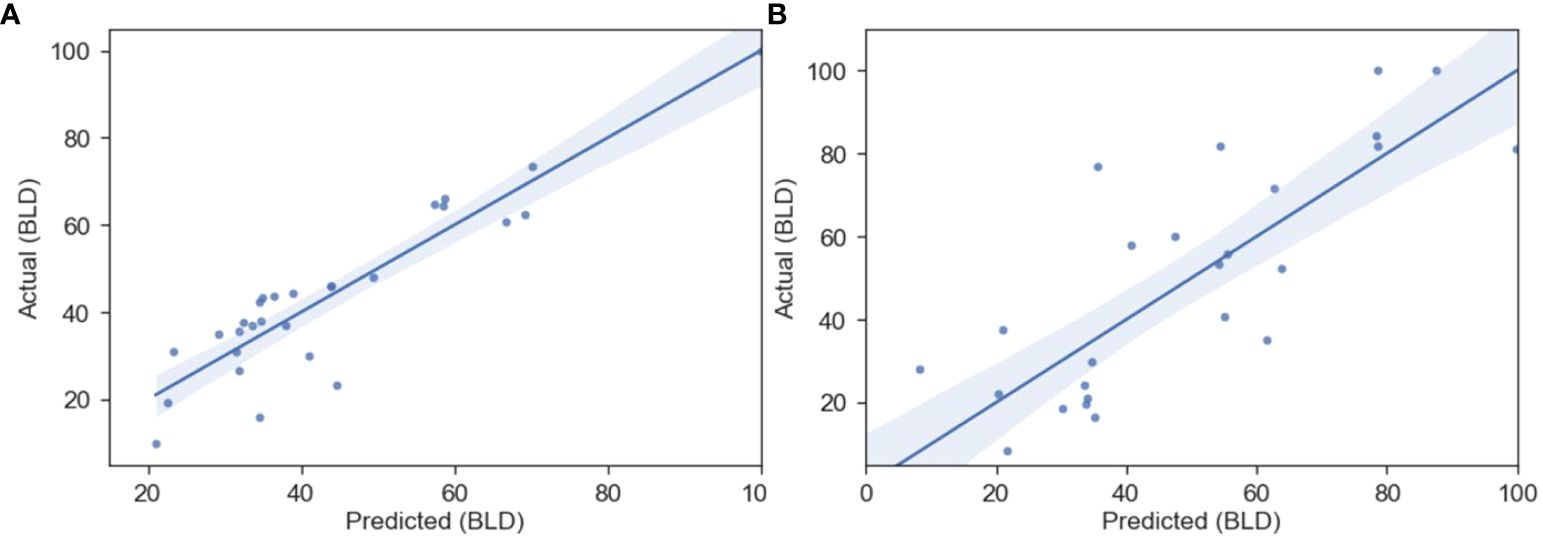
Figure 5. Predicted vs actual BLD (%) regression from the OLS QSAR model for the B-Experimental (A) and E-Experimental (B) datasets, whose parameters can be found in Table 5. The shaded region represents the 95% confidence interval for the regression.
The number of aromatic hydroxyl groups can be seen to have a negative relationship with BLD for the B. subtilis data (Table 5). Where gallic acid, catechol, and protocatechuic acid had more than one aromatic hydroxyl group and the lowest BLD values compared to all the other compounds. So, with an increase in the number of aromatic hydroxyl groups there will be a decrease in BLD, correlating to a decrease in the compound’s antibacterial properties against B. subtilis. Bouarab-Chibane et al. (2019a) found a negative relationship between the number of hydrogen donors and the BLD of plant-based polyphenols screened against B. subtilis. Since the number of aromatic hydroxyl groups and the number of hydrogen donors have a direct positive relationship (Bouarab-Chibane et al., 2019a), we can see that in general phenolics with higher overall polarity will have a decrease in antimicrobial properties. This is supported by the experimental data seen here, where highly lipophilic compounds like 4-ethylphenol had high BLD values. However, this model does not provide an explanation for the 3-hydroxy-2-(2-methoxyphenoxy)-1-(4-methoxyphenyl)-1-propanone lignin dimers high BLD value compared to the monomers, highlighting the issue QSAR models can have with limited data sizes and breadth of compound variability.
When examining the OLS regression for E. coli, we can see that the EState_VSA6, VSA_EState3, and fr_aryl_methyl descriptors were used to create the best fitting model. Again, EState_VSA6 and VSA_EState3 are MOE type descriptors that are used for classification-based purposes and cannot be used to infer an influence on the molecules antimicrobial activity. Comparatively, the fr_aryl_methyl descriptor represents the number of aryl methyl groups or an alkyl chain (i.e., ethyl or propyl) on the molecule and it shows a positive correlation with BLD. Thus, as the number of methyl or alkyl chain groups on the phenolic ring increase there is an increase in the BLD or antimicrobial activity of the compounds against E. coli (Table 5). The compounds described by the fr_aryl_methyl descriptor such as 4-ethyl phenol, 4-propyl phenol, and p-creosol are seen to have BLD values of 80–100% for E. coli (Table 5). These compounds are also considered to be more lipophilic given their alkyl groups on the phenolic ring, of which, lipophilicity is already considered an important factor in increasing antibacterial activity against E. coli in the literature (Sikkema et al., 1995; Bouarab-Chibane et al., 2019b). Furthermore, since Gram-negative bacteria have a substantially higher lipid content in their cell wall compared to Gram-positive bacteria (Salton, 1953), it makes sense that the alkylated phenolics were seen to have greater BLD values for E. coli compared to B. subtilis. Additionally, like the B. subtilis OLS regression, E. coli’s model also did not provide inferences as to why the lignin dimer 3-hydroxy-2-(2-methoxyphenoxy)-1-(4-methoxyphenyl)-1-propanone had such a high BLD value.
Overall, when comparing the results from the QSAR models for the meta-analysis and experimental datasets, we can see that the presence of certain compounds and how antimicrobial activity was measured will influence which descriptors play the most important role in describing antimicrobial activity. We saw that the hydroxycinnamic derivatives in the B-Meta dataset drove the negative relationship between the number of aliphatic carboxylic acid groups and pMIC. Comparatively, a higher number of aromatic hydroxyl groups were shown to decrease the BLD in the B-Experimental dataset. Additionally, the E-Meta dataset did not provide an accurate OLS regression model, while E-Experimental’s model showed increasing alkyl groups on the phenolic ring increases BLD values against E. coli. This emphasizes the fact that using different measures of antimicrobial properties and different lignin compounds to develop QSARs for predicting the antimicrobial properties of lignin may lead to different conclusions. It is important to understand the origin of the strains and the cultivation parameters. Meanwhile one could introduce reference compounds across datasets to ensure a more reproducible response. While this is intuitive, the data here provide support for the need in developing a comprehensive and cohesive dataset with lignin derivatives and their antimicrobial properties. Without such a dataset, the ability to accurately predict the antimicrobial potential of lignin and the variety of derivatives that are produced from depolymerization schemes for biorefinery waste stream – lignin valorization is limited.
Conclusions
Based on meta-analysis, MOE-type descriptors and the number of aliphatic carboxylic acid groups were the descriptors that showed strong correlations to the pMIC values. Comparatively, experimentally based QSAR found that MOE-type descriptors and the number of aromatic hydroxyl groups were better predictors of BLD for B. subtilis, while MOE-type descriptors and the number of aryl methyl groups were predictors of BLD for E. coli. This study represents one of the first steps towards expediting the search for highly active lignin derivatives that can be produced from depolymerization reactions for valorizing lignin into a sustainable source of antimicrobial compounds.
Data availability statement
The original contributions presented in the study are publicly available. This data can be found here: Harvard Dataverse repository, https://doi.org/10.7910/DVN/LYX4TS.
Author contributions
RK: Conceptualization, Data curation, Formal analysis, Investigation, Methodology, Validation, Visualization, Writing – original draft. QS: Conceptualization, Methodology, Resources, Supervision, Writing – review & editing. JS: Conceptualization, Funding acquisition, Project administration, Supervision, Writing – review & editing.
Funding
The author(s) declare financial support was received for the research, authorship, and/or publication of this article. This work was supported by the National Science Foundation under Cooperative Agreement No. 1355438 and 1632854. In addition, this work was also supported by the National Institute of Food and Agriculture, U.S. Department of Agriculture, Hatch-Multistate project under accession number 1018315.
Conflict of interest
The authors declare that the research was conducted in the absence of any commercial or financial relationships that could be construed as a potential conflict of interest.
Publisher’s note
All claims expressed in this article are solely those of the authors and do not necessarily represent those of their affiliated organizations, or those of the publisher, the editors and the reviewers. Any product that may be evaluated in this article, or claim that may be made by its manufacturer, is not guaranteed or endorsed by the publisher.
Supplementary material
The Supplementary Material for this article can be found online at: https://www.frontiersin.org/articles/10.3389/finmi.2024.1404729/full#supplementary-material
References
Andrews J. M. (2001). Determination of minimum inhibitory concentrations. J. Antimicrob. Chemother. 48 Suppl 1, 5–16. doi: 10.1093/jac/48.suppl_1.5
Araya-Cloutier C., Vincken J.-P., van de Schans M. G. M., Hageman J., Schaftenaar G., den Besten H. M. W., et al. (2018). QSAR-based molecular signatures of prenylated (iso)flavonoids underlying antimicrobial potency against and membrane-disruption in Gram positive and Gram negative bacteria. Sci. Rep. 8, 9267. doi: 10.1038/s41598-018-27545-4
Barber M. S., McConnell V. S., DeCaux B. S. (2000). Antimicrobial intermediates of the general phenylpropanoid and lignin specific pathways. Phytochemistry 54, 53–56. doi: 10.1016/S0031-9422(00)00038-8
Basant N., Gupta S., Singh K. P. (2016). QSAR modeling for predicting reproductive toxicity of chemicals in rats for regulatory purposes. Toxicol. Res. 5, 1029–1038. doi: 10.1039/C6TX00083E
Borges A., Ferreira C., Saavedra M. J., Simões M. (2013). Antibacterial activity and mode of action of ferulic and gallic acids against pathogenic bacteria. Microb. Drug Resist. 19, 256–265. doi: 10.1089/mdr.2012.0244
Bouarab-Chibane L., Forquet V., Lantéri P., Clément Y., Léonard-Akkari L., Oulahal N., et al. (2019a). Antibacterial properties of polyphenols: characterization and QSAR (quantitative structure-activity relationship) models. Front. Microbiol. 10. doi: 10.3389/fmicb.2019.00829
Bouarab-Chibane L., Forquet V., Lantéri P., Clément Y., Léonard-Akkari L., Oulahal N., et al. (2019b). Antibacterial properties of polyphenols: characterization and QSAR (Quantitative structure–activity relationship) models. Front. Microbiol. 10. doi: 10.3389/fmicb.2019.00829
Calvo-Flores F. G., Dobado J. A., Isac-García J., Martín-MartíNez F. J. (2015). “Applications of modified and unmodified lignins,” in Lignin and lignans as renewable raw materials. (Hoboken, NJ, USA: John Wiley & Sons, Ltd), 247–288.
Camacho D. M., Collins K. M., Powers R. K., Costello J. C., Collins J. J. (2018). Next-generation machine learning for biological networks. Cell 173, 1581–1592. doi: 10.1016/j.cell.2018.05.015
Campos F. M., Couto J. A., Hogg T. A. (2003). Influence of phenolic acids on growth and inactivation of Oenococcus oeni and Lactobacillus hilgardii. J. Appl. Microbiol. 94, 167–174. doi: 10.1046/j.1365-2672.2003.01801.x
Cazacu G., Capraru M., Popa V. I. (2013). “Advances concerning lignin utilization in new materials,” in Advances in natural polymers. (Springer, Berlin, Heidelberg), 255–312.
de Souza Araujo E., Pimenta A. S., Feijo F. M. C., Castro R. V. O., Fasciotti M., Monteiro T. V. C., et al. (2018). Antibacterial and antifungal activities of pyroligneous acid from wood of Eucalyptus urograndis and Mimosa tenuiflora. J. Appl. Microbiol. 124, 85–96. doi: 10.1111/jam.13626
Dong X., Dong M., Lu Y., Turley A., Jin T., Wu C. (2011). Antimicrobial and antioxidant activities of lignin from residue of corn stover to ethanol production. Ind. Crops Products 34, 1629–1634. doi: 10.1016/j.indcrop.2011.06.002
Espinoza-Acosta J. L., Torres-Chávez P. I., Ramírez-Wong B., López-Saiz C. M., Montaño-Leyva B. (2016). Antioxidant, antimicrobial, and antimutagenic properties of technical lignins and their applications. BioResources 11, 5452–5481. doi: 10.15376/biores
Gaulton A., Bellis L. J., Bento A. P., Chambers J., Davies M., Hersey A., et al. (2012). ChEMBL: a large-scale bioactivity database for drug discovery. Nucleic Acids Res. 40, D1100–D1107. doi: 10.1093/nar/gkr777
Golbraikh A., Shen M., Xiao Z., Xiao Y.-D., Lee K.-H., Tropsha A. (2003). Rational selection of training and test sets for the development of validated QSAR models. J. Computer-Aided Mol. Design 17, 241–253. doi: 10.1023/A:1025386326946
Hall L. H., Mohney B., Kier L. B. (1991). The electrotopological state: structure information at the atomic level for molecular graphs. J. Chem. Inf. Comput. Sci. 31, 76–82. doi: 10.1021/ci00001a012
Harvey A. L., Edrada-Ebel R., Quinn R. J. (2015). The re-emergence of natural products for drug discovery in the genomics era. Nat. Rev. Drug Discovery 14, 111–129. doi: 10.1038/nrd4510
Hira Z. M., Gillies D. F. (2015). A review of feature selection and feature extraction methods applied on microarray data. Adv. Bioinf. 282, 111–135. doi: 10.1155/2015/198363
Hwang Y. H., Matsushita Y. I., Sugamoto K., Matsui T. (2005). Antimicrobial effect of the wood vinegar from Cryptomeria japonica sapwood on plant pathogenic microorganisms. J. Microbiol. Biotechnol. 15(5), 1106–1109
Labute P. (2000). A widely applicable set of descriptors. J. Mol. Graphics Model. 18, 464–477. doi: 10.1016/S1093-3263(00)00068-1
Lenselink E. B., ten Dijke N., Bongers B., Papadatos G., van Vlijmen H. W. T., Kowalczyk W., et al. (2017). Beyond the hype: deep neural networks outperform established methods using a ChEMBL bioactivity benchmark set. J. Cheminformatics 9, 45. doi: 10.1186/s13321-017-0232-0
Lourençon T. V., Mattos B. D., Cademartori P. H. G., Magalhães W. L. E. (2016). Bio-oil from a fast pyrolysis pilot plant as antifungal and hydrophobic agent for wood preservation. J. Analytical Appl. Pyrolysis 122, 1–6. doi: 10.1016/j.jaap.2016.11.004
Mathew A. K., Abraham A., Mallapureddy K. K., Sukumaran R. K. (2018). “Chapter 9 - lignocellulosic biorefinery wastes, or resources?,” in Waste biorefinery,. Eds. Bhaskar T., Pandey A., Mohan S. V., Lee D.-J., Khanal. S. K. (B.V., Amsterdam, Netherlands: Elsevier), 267–297.
Mei H., Zhou Y., Liang G., Li Z. (2005). Support vector machine applied in QSAR modelling. Chin. Sci. Bull. 50, 2291–2296. doi: 10.1007/BF03183737
Nohynek L. J., Alakomi H. L., Kähkönen M. P., Heinonen M., Helander I. M., Oksman-Caldentey K. M., et al. (2006). Berry phenolics: antimicrobial properties and mechanisms of action against severe human pathogens. Nutr. Cancer 54, 18–32. doi: 10.1207/s15327914nc5401_4
Pandey M. P., Kim C. S. (2011). Lignin depolymerization and conversion: A review of thermochemical methods. Chem. Eng. Technol. 34, 29–41. doi: 10.1002/ceat.201000270
Patra J. K., Hwang H., Choi J. W., Baek K. H. (2015). Bactericidal Mechanism of Bio-oil Obtained from Fast Pyrolysis of Pinus densiflora Against Two Foodborne Pathogens, Bacillus cereus and Listeria monocytogenes. Foodborne Pathog. Dis. 12, 529–535. doi: 10.1089/fpd.2014.1914
Pedregosa F., Varoquaux G., Gramfort A., Michel V., Thirion B., Grisel O., et al. (2011). Scikit-learn: machine learning in python. J. Mach. Learn. Res. 12, 2825–2830. doi: 10.5555/1953048.2078195
Salton M. R. (1953). Studies of the bacterial cell wall. IV. The composition of the cell walls of some Gram-positive and Gram-negative bacteria. Biochim. Biophys. Acta 10, 512–523. doi: 10.1016/0006-3002(53)90296-0
Sari E., Khatab U., Burmawi, Rahman E. D., Afriza F., Maulidita A., et al. (2019). Production of liquid smoke from the process of carbonization of durian skin biomass, coconut shell and palm shell for preservation of tilapia fish. IOP Conf. Series: Materials Sci. Eng. 543, 12075. doi: 10.1088/1757-899X/543/1/012075
Seabold S., Perktold J. (2010). “Statsmodels: Econometric and statistical modeling with python,” in Proceedings of the 9th python in science conference(Austin, TX), 61. doi: 10.25080/issn.2575-9752
Shahlaei M. (2013). Descriptor selection methods in quantitative structure–activity relationship studies: A review study. Chem. Rev. 113, 8093–8103. doi: 10.1021/cr3004339
Sikkema J., de Bont J. A., Poolman B. (1995). Mechanisms of membrane toxicity of hydrocarbons. Microbiological Rev. 59, 201–222. doi: 10.1128/mr.59.2.201-222.1995
Song Y., Mobley J. K., Motagamwala A. H., Isaacs M., Dumesic J. A., Ralph J., et al. (2018). Gold-catalyzed conversion of lignin to low molecular weight aromatics. Chem. Sci. 9, 8127–8133. doi: 10.1039/C8SC03208D
Speck-Planche A., Kleandrova V. V., Luan F., Cordeiro M. N. (2012). Predicting multiple ecotoxicological profiles in agrochemical fungicides: a multi-species chemoinformatic approach. Ecotoxicol Environ. Saf. 80, 308–313. doi: 10.1016/j.ecoenv.2012.03.018
Sun Z., Fridrich B., de Santi A., Elangovan S., Barta K. (2018). Bright side of lignin depolymerization: toward new platform chemicals. Chem. Rev. 118, 614–678. doi: 10.1021/acs.chemrev.7b00588
Svensson F., Norinder U., Bender A. (2017). Modelling compound cytotoxicity using conformal prediction and PubChem HTS data. Toxicol. Res. 6 1, 73–80. doi: 10.1039/C6TX00252H
Svetnik V., Liaw A., Tong C., Culberson J. C., Sheridan R. P., Feuston B. P. (2003). Random forest: A classification and regression tool for compound classification and QSAR modeling. J. Chem. Inf. Comput. Sci. 43, 1947–1958. doi: 10.1021/ci034160g
Telysheva G., Dizhbite T., Lebedeva G., Niokolaeva V. (2005). Lignin products for decontamination of environment objects from pathogenic microorganisms and pollutants. Proc. 7th ILI Forum Barcelona Spain, 71–74.
Tsai W.-P., Fang K., Ji X., Lawson K., Shen C. (2020). Revealing causal controls of storage-streamflow relationships with a data-centric bayesian framework combining machine learning and process-based modeling. Front. Water 2. doi: 10.3389/frwa.2020.583000
Upadhyay A., Upadhyaya I., Kollanoor-Johny A., Venkitanarayanan K. (2014). Combating pathogenic microorganisms using plant-derived antimicrobials: A minireview of the mechanistic basis. BioMed. Res. Int. 2014, 761741. doi: 10.1155/2014/761741
Vamathevan J., Clark D., Czodrowski P., Dunham I., Ferran E., Lee G., et al. (2019). Applications of machine learning in drug discovery and development. Nat. Rev. Drug Discovery 18, 463–477. doi: 10.1038/s41573-019-0024-5
Wang H., Tucker M., Ji Y. (2013). Recent development in chemical depolymerization of lignin: A review. J. Appl. Chem. 2013, 9. doi: 10.1155/2013/838645
Weininger D., Weininger A., Weininger J. L. (1989). SMILES. 2. Algorithm for generation of unique SMILES notation. J. Chem. Inf. Comput. Sci. 29, 97–101. doi: 10.1021/ci00062a008
WHO W. H. O. (2014). Antimicrobial resistance: global report on surveillance (Geneva, Switzerland: World Health Organization).
Yang W., Fortunati E., Gao D., Balestra G. M., Giovanale G., He X., et al. (2018). Valorization of acid isolated high yield lignin nanoparticles as innovative antioxidant/antimicrobial organic materials. ACS Sustain. Chem. Eng. 6, 3502–3514. doi: 10.1021/acssuschemeng.7b03782
Zemek J., Košíková B., Augustín J., Joniak D. (1979). Antibiotic properties of lignin components. Folia Microbiologica 24, 483–486. doi: 10.1007/BF02927180
Keywords: quantitative structure–activity relationship, machine learning, open-source database, meta-analysis, lignin valorization
Citation: Kalinoski RM, Shao Q and Shi J (2024) Predicting antimicrobial properties of lignin derivatives through combined data driven and experimental approach. Front. Ind. Microbiol. 2:1404729. doi: 10.3389/finmi.2024.1404729
Received: 21 March 2024; Accepted: 09 July 2024;
Published: 12 August 2024.
Edited by:
Minliang Yang, North Carolina State University, United StatesReviewed by:
Maciej Szaleniec, Polish Academy of Sciences, PolandSandra Vojnovic, University of Belgrade, Serbia
Luan Luong Chu, Vietnam National University, Vietnam
Copyright © 2024 Kalinoski, Shao and Shi. This is an open-access article distributed under the terms of the Creative Commons Attribution License (CC BY). The use, distribution or reproduction in other forums is permitted, provided the original author(s) and the copyright owner(s) are credited and that the original publication in this journal is cited, in accordance with accepted academic practice. No use, distribution or reproduction is permitted which does not comply with these terms.
*Correspondence: Ryan M. Kalinoski, cm1rYWxpbm9za2k0QGdtYWlsLmNvbQ==; Jian Shi, ai5zaGlAdWt5LmVkdQ==