 Federica Zavaglio1
 Irene Cassanti1,2*Marilena Gregorini3,4Maria Antonietta Grignano4
 Teresa Rampino4
 Daniele Lilleri2
 Fausto Baldanti1,2
- 1Microbiology and Virology Department, Fondazione IRCCS Policlinico San Matteo, Pavia, Italy
- 2Department of Clinical, Surgical, Diagnostic and Pediatric Sciences, University of Pavia, Pavia, Italy
- 3Department of Internal Medicine and Therapeutics, University of Pavia, Pavia, Italy
- 4Unit of Nephrology and Dialysis and Transplantation, Fondazione IRCCS Policlinico San Matteo, Pavia, Italy
Background: Human cytomegalovirus (HCMV) infection represents a significant complication for kidney transplant recipients (KTRs). The goal of this study was to evaluate potential immunological markers at pre-transplant in HCMV-seropositive KTRs for predicting HCMV severe reactivation (e.g treated HCMV reactivation) during the first year after transplant.
Methods: Before transplant, lymphocyte count was measured in whole blood and HCMV-specific T-cell response was determined using ELISpot assay after stimulation with pp65, IE-1 and IE-2 peptides pool. HCMV DNA was monitored during the first year after transplant. Among the 65 KTRs enrolled, 44 (68%) patients had HCMV self-resolving reactivation (Controllers) while 21 (32%) required antiviral treatment for HCMV reactivation (Non-Controllers).
Results: No significant difference in CD4 T-cell count was observed, but Controllers had higher CD8+ T-cell counts compared to Non-Controllers. Based on ROC analysis, a CD8+ T-cell count ≥215 cells/μl was associated with a lower incidence of HCMV reactivation after transplant. Additionally, a higher IE-1-specific T-cell response was observed in Controllers and patients with IE1-specific T-cell response ≥60 spots showed a reduced incidence of HCMV reactivation and lower DNAemia peak.
Discussion: Lymphocyte counts and HCMV-specific T-cell response can be measured at pre-transplant in KTRs in order to efficiently predict the risk of treated HCMV reactivation during the first year after transplant. Potential cut-off and diagnostics algorithm should be better investigated in a large patients setting.
1 Introduction
Human Cytomegalovirus (HCMV) infection still represents one of the most important opportunistic infection in solid organ transplant recipients (SOTRs) (1). Two approaches have been proposed for control of HCMV prevention, pre-emptive therapy (PET), which involves a PCR-guided administration of anti-HCMV treatment to patients at risk for HCMV disease (i.e., monitoring the blood viral load and giving antiviral drugs to patients at predetermined levels of viral load), and universal prophylaxis (i.e., administration of antiviral drugs to all transplanted patients for 6-12 months) (2, 3). Although it is widely known that patients who are HCMV-seronegative at transplant and receive the organ from a HCMV-seropositive donor (D+/R-) are at higher risk of HCMV infection, HCMV-seropositive recipients (R+) may be at risk of reactivation in the post-transplant period, especially in relation to the type of transplanted organ and immunosuppressive therapies (4–6).
To date, the assessment of immunological tools able to predict the spontaneous clearance of HCMV infection in HCMV-seropositive SOTRs represents a crucial milestone for the success of transplant. In this setting, monitoring of lymphocytes subsets in SOTRs could be used as simple approach for stratification of the risk of HCMV infection, reactivation or relapse after treatment (7–12). Moreover, HCMV-specific T cells are crucial for the prevention of HCMV disease, observing that both CD4+ and CD8+ HCMV-specific T cells are involved in the first line of specific cellular immune response in HCMV-seropositive transplanted recipients, as well as in a long term control of reactivation (13–18). Furthermore, the risk of high-level DNAemia and consequently early treatment is reduced in those patients with higher T-cell response between 2 and 4 week post-transplant (16, 19).
On the other side, the evaluation of pre-transplant HCMV-specific immune response seems to be useful for a preliminary patients’ stratification of the risk of HCMV reactivation in HCMV-seropositive recipients (20–25). However, the role of pre-transplant HCMV-specific T-cell response and its potential use in clinical practice should be better elucidated.
In this study, we aimed to evaluate HCMV-specific T-cell response at pre-transplant in HCMV-seropositive kidney transplant recipients in order to investigate the predictive role in the stratification of HCMV DNAemia and requirement of antiviral treatment.
2 Materials and methods
2.1 Patients enrolment and HCMV monitoring
HCMV-seropositive kidney transplant recipients were consecutively enrolled at Nephrology and Dialysis Department of IRCCS Policlinico San Matteo in Pavia (Northern Italy). At baseline (day of transplant), heparinized whole blood samples were collected for peripheral blood mononuclear cells (PBMC) isolation and lymphocyte T cell count. Detailed flow-chart representing patients’ enrollment, follow-up and stratification is included in Supplementary Figure 1 (Supplementary Figure S1).
All the patients were treated with induction therapy with anti-thymocyte globulin (ATG; 1 mg/kg/die for three days) or anti-CD25 monoclonal antibody (basiliximab; 20 mg at time of transplant and 20 mg at the fourth day post-transplant). Methylprednisolone was added in both cases. Triple immunosuppressive standard regimens was also administered after transplant (cyclosporin or tacrolimus/micophenolic acid or mycophenolatemofetil/methylprednisolone), according to therapeutic protocols. All the analysis were performed according to our Institutional Review Board and written informed consent was obtained by all enrolled patients (Protocol number 20180004199).
2.2 HCMV management and infection definitions
After transplant, HCMV DNAemia was monitored according to diagnostic protocols. In detail, HCMV DNAemia was monitored in whole blood weekly for the first 8 weeks and subsequently every 15 days until the 4th month, then monthly until first year after transplant.
HCMV DNA was quantified using in-house real-time PCR performed on blood samples (26) with some modification. In detail, extraction QIAsymphony® DSP DNA Mini kit (Qiagen; Hilden, Germany) (200 µl of extraction volume) and QuantiFast Pathogen PCR kit (Qiagen) were used for DNA extraction and DNA amplification, respectively.
In case of suspected tissue invasive disease (TID), a tissue biopsy (gastrointestinal disease) or a bronco-alveolar lavage (BAL) fluid sample (pneumonia) was collected for HCMV DNA quantification and histopathological analysis. HCMV disease was defined as possible, probable, or proven according to Ljungman et al. (27).
Self-resolving HCMV DNAemia was defined as the detection of HCMV DNA in blood at any level with subsequent spontaneous clearance without antiviral treatment. Clinically significant HCMV infection was defined as HCMV infection requiring antiviral treatment (either as pre-emptive therapy or for treatment of HCMV disease).
2.3 Peripheral blood mononuclear cells isolation
Peripheral blood mononuclear cells (PBMC) were isolated from heparinized whole blood samples by density gradient centrifugation (Lymphoprep, Axis-Shield, Norway) and resuspended in culture medium (RPMI 1640 supplemented with 2mM L-glutamine, 100U/mL penicillin and 100 µg/mL streptomycin and 10% of heat inactivated fetal bovine serum (Euroclone, Italy). Isolated PBMC were stored in nitrogen liquid using freezing medium (65% RPMI 1640 supplemented with 2mM L-glutamine, 100U/mL penicillin and 100 µg/mL streptomycin, 25% human albumin (Grifolds Biologicals, CA, USA) and 10% DMSO (Sigma-Aldrich, MO, USA). Before the use, PBMC were thawed, washed, resuspended in cultured medium and rested overnight at 37°C in a 5% CO2 humidified atmosphere (28).
2.4 Synthetic peptides
For the evaluation of HCMV-specific T-cell response three peptide pools representative of the whole proteins pp65, IE1 and IE2 were used (JPT Peptide Technologies, Germany). All peptides were 15 aminoacids in length with an overlap of 11 aminoacids, representing a good compromise for stimulation of both CD4+ and CD8+ T cells (29). Pp65 peptide pool was composed by 138 peptides, IE1 by 120 peptides and IE2 by 143 peptides. Peptides were dissolved in DMSO (Sigma-Aldrich) and diluted in RPMI 1640 medium supplemented with 2mM L-glutamine, 100U/mL penicillin and 100 µg/mL streptomycin. Aliquotes were stored at - 20°C until use. All peptide pools were used at the final concentration of 0,25 µg/mL for each peptide.
2.5 HCMV-specific T-cell response detected by ELISpot assay
HCMV-specific T-cell response was determined by ELISpot assay, using ELISpot IFN-γ Basis kits from ELITech (Milan, Italy) according to manufacturer’s instructions.
The Multitestplates (MTP) fitted with membranes and coated with anti-human IFN-γ antibody were supplied in the test kit. PBMC (2x10⁵ cells/100 µl per well) were added in duplicate and stimulated with100 µl of antigen solution or culture medium only (negative control) or phytoheamagglutin (PHA; 5 µg/ml, Sigma-Aldrich). Plates were incubated from 20 to 24 hours at 37°C 5%CO2 humidified atmosphere. After cells remove, the alkaline phosphatase (AP)-labeled secondary antibody was added. Two hours later a substrate solution (BCIP/NBT) was added. After several washes under running water, plates were dried. Spots per counted using automated AID ELISpot reader system (AutoImmunDiagnostika GmbH, Germany).
2.6 Lymphocyte count
Fresh whole blood was stained with anti-CD3-PC5, anti-CD45-FITC, anti-CD4-RD1 and anti-CD8-ECD monoclonal antibodies (Beckman Coulter, Milan, Italy). After lysis of red blood cells, the absolute number of CD3+, CD3+CD4+ and CD3+CD8+ T-cell counts were determined by flow cytometry (Navios, Beckman Coulter) using Flow-Count Fluorospheres (Beckman Coulter).
2.7 Data analysis
The mean number of spots obtained from duplicate wells was adjusted to 106 PBMC. The mean number of spots/million PBMC obtained by culture medium only was subtracted by the mean number of spots/million PBMC in response to the corresponding antigen in order to obtain the net spots/million PBMC. Results were then given as net spots/million PBMC (later in the text defined as “spots”). Quantitative variables were shown in terms of median or mean values and interquartile range (IQR) while categorical variables were presented as number or percentage. Mann-Whitney test and Fisher’s test were used for data analysis, as well as receiver-operator characteristic (ROC) analysis. Log-rank test was used for the evaluation of cumulative incidence. The best cut-off to predict the spontaneous clearance of HCMV infection at pre-transplant was calculated according to the Youden Index. A multivariate logistic regression was also performed. All the statistical analysis were performed by using GraphPad Prism 8.3.0 (GraphPad Software Inc, CA, USA). All tests were two tailed and p value<0.05 was considered significant.
3 Results
3.1 Patients
Sixty-five HCMV-seropositive KTRs (47 males and 18 females; median age 51 years, [IQR 46-61]) were enrolled at time of transplant. HCMV serological status was positive in 39 (60%) donors, negative in 8 (12.3%) donors and un-known in 18 (27.7%) donors. Clinical characteristics of the patients are shown in Table 1. Overall, 44/65 (68%) patients showed at least one self-resolved HCMV reactivation event or undetectable HCMV DNA during the follow up period and were defined as “Controllers”, while 21/65 (32%) were treated for clinically significant HCMV reactivation and were defined as “Non-Controllers”.
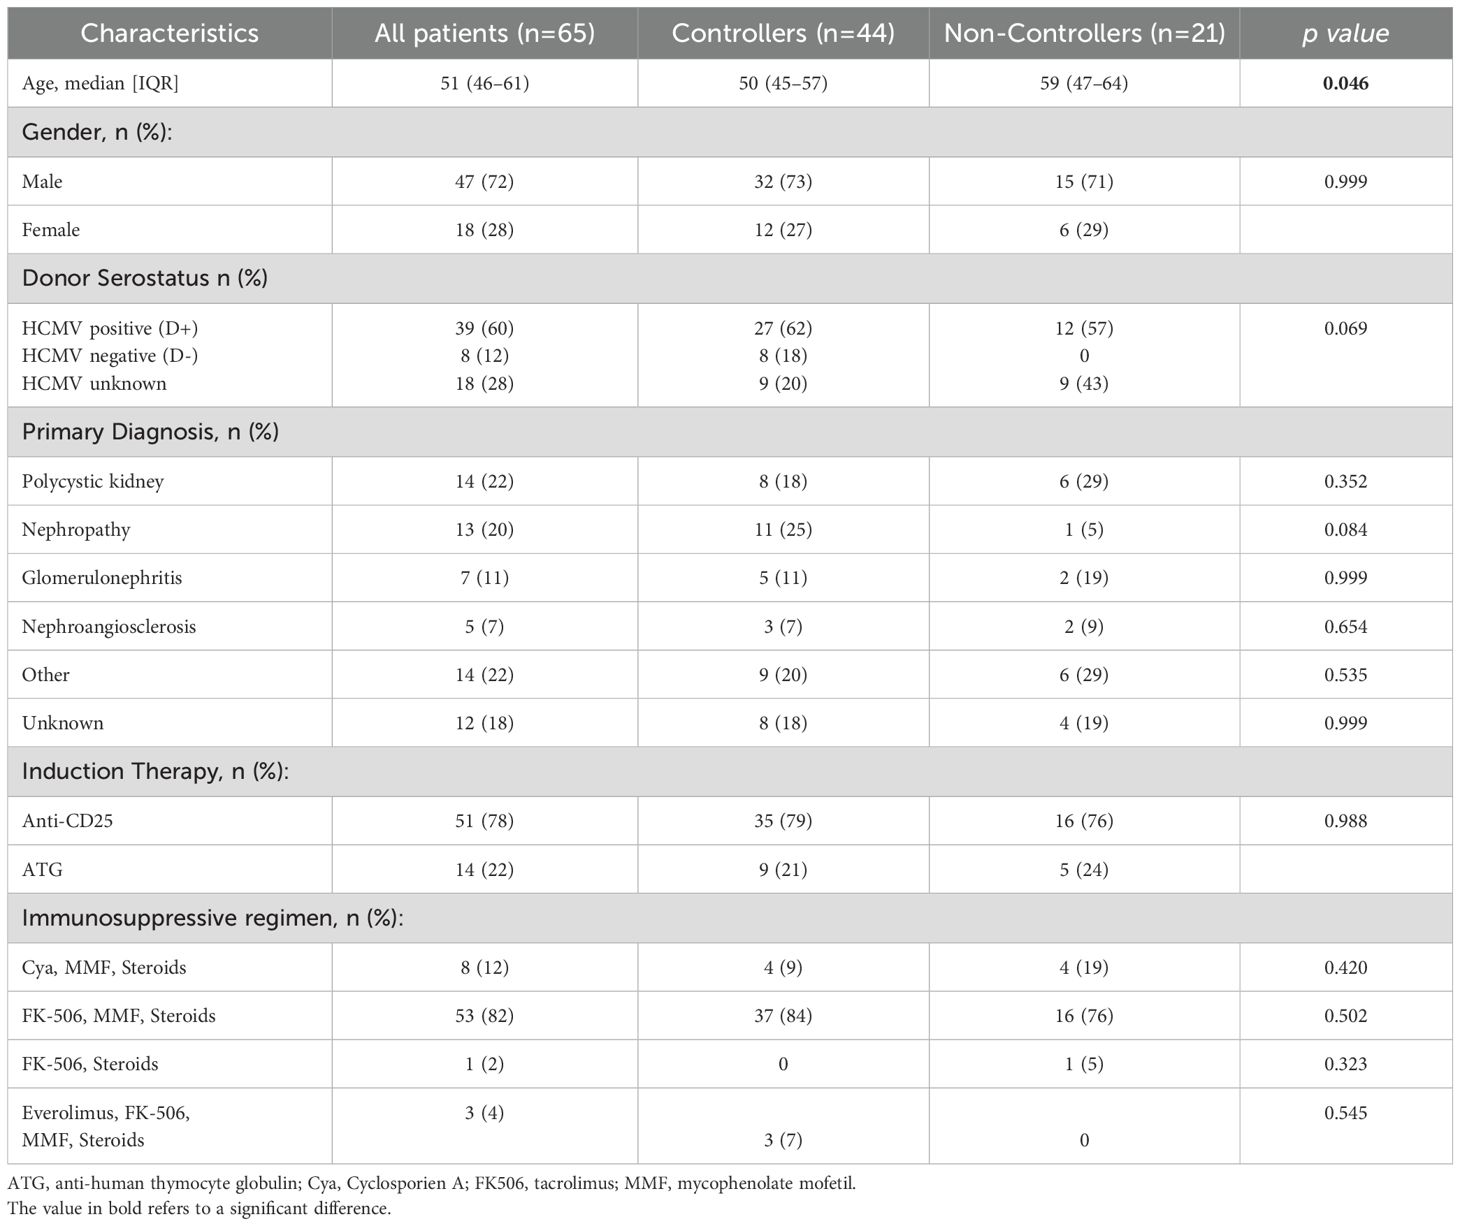
Table 1. Clinical and demographic patients’ characteristics.
There were no significant differences in baseline characteristics between the two groups of Controllers and Non-Controllers, except for the age at time of transplant (p=0.046). Additionally, even if the difference is not statistically significant, the rate of HCMV seropositive donors was higher in Non-controllers (p=0.069) (Table 1). The median follow-up after transplantation was 7.2 years (IQR 5.9–8.5 years) for the entire cohort of patients, 7 years (IQR 5.9–8.5 years) for Controllers and 7.3 years (IQR 5.4–8.4 years) for Non-Controllers. Overall, 10/65 (15%) patients died, and 5 of them were Non-Controllers (Figure 1A). Based on our results, the overall survival in controllers seems to be higher than that measured in non-controllers. However, this difference is not statistically significant. Regarding the graft survival, 9/65 (14%) patients had graft failure and 3 of them were Non-Controllers (Figure 1B).
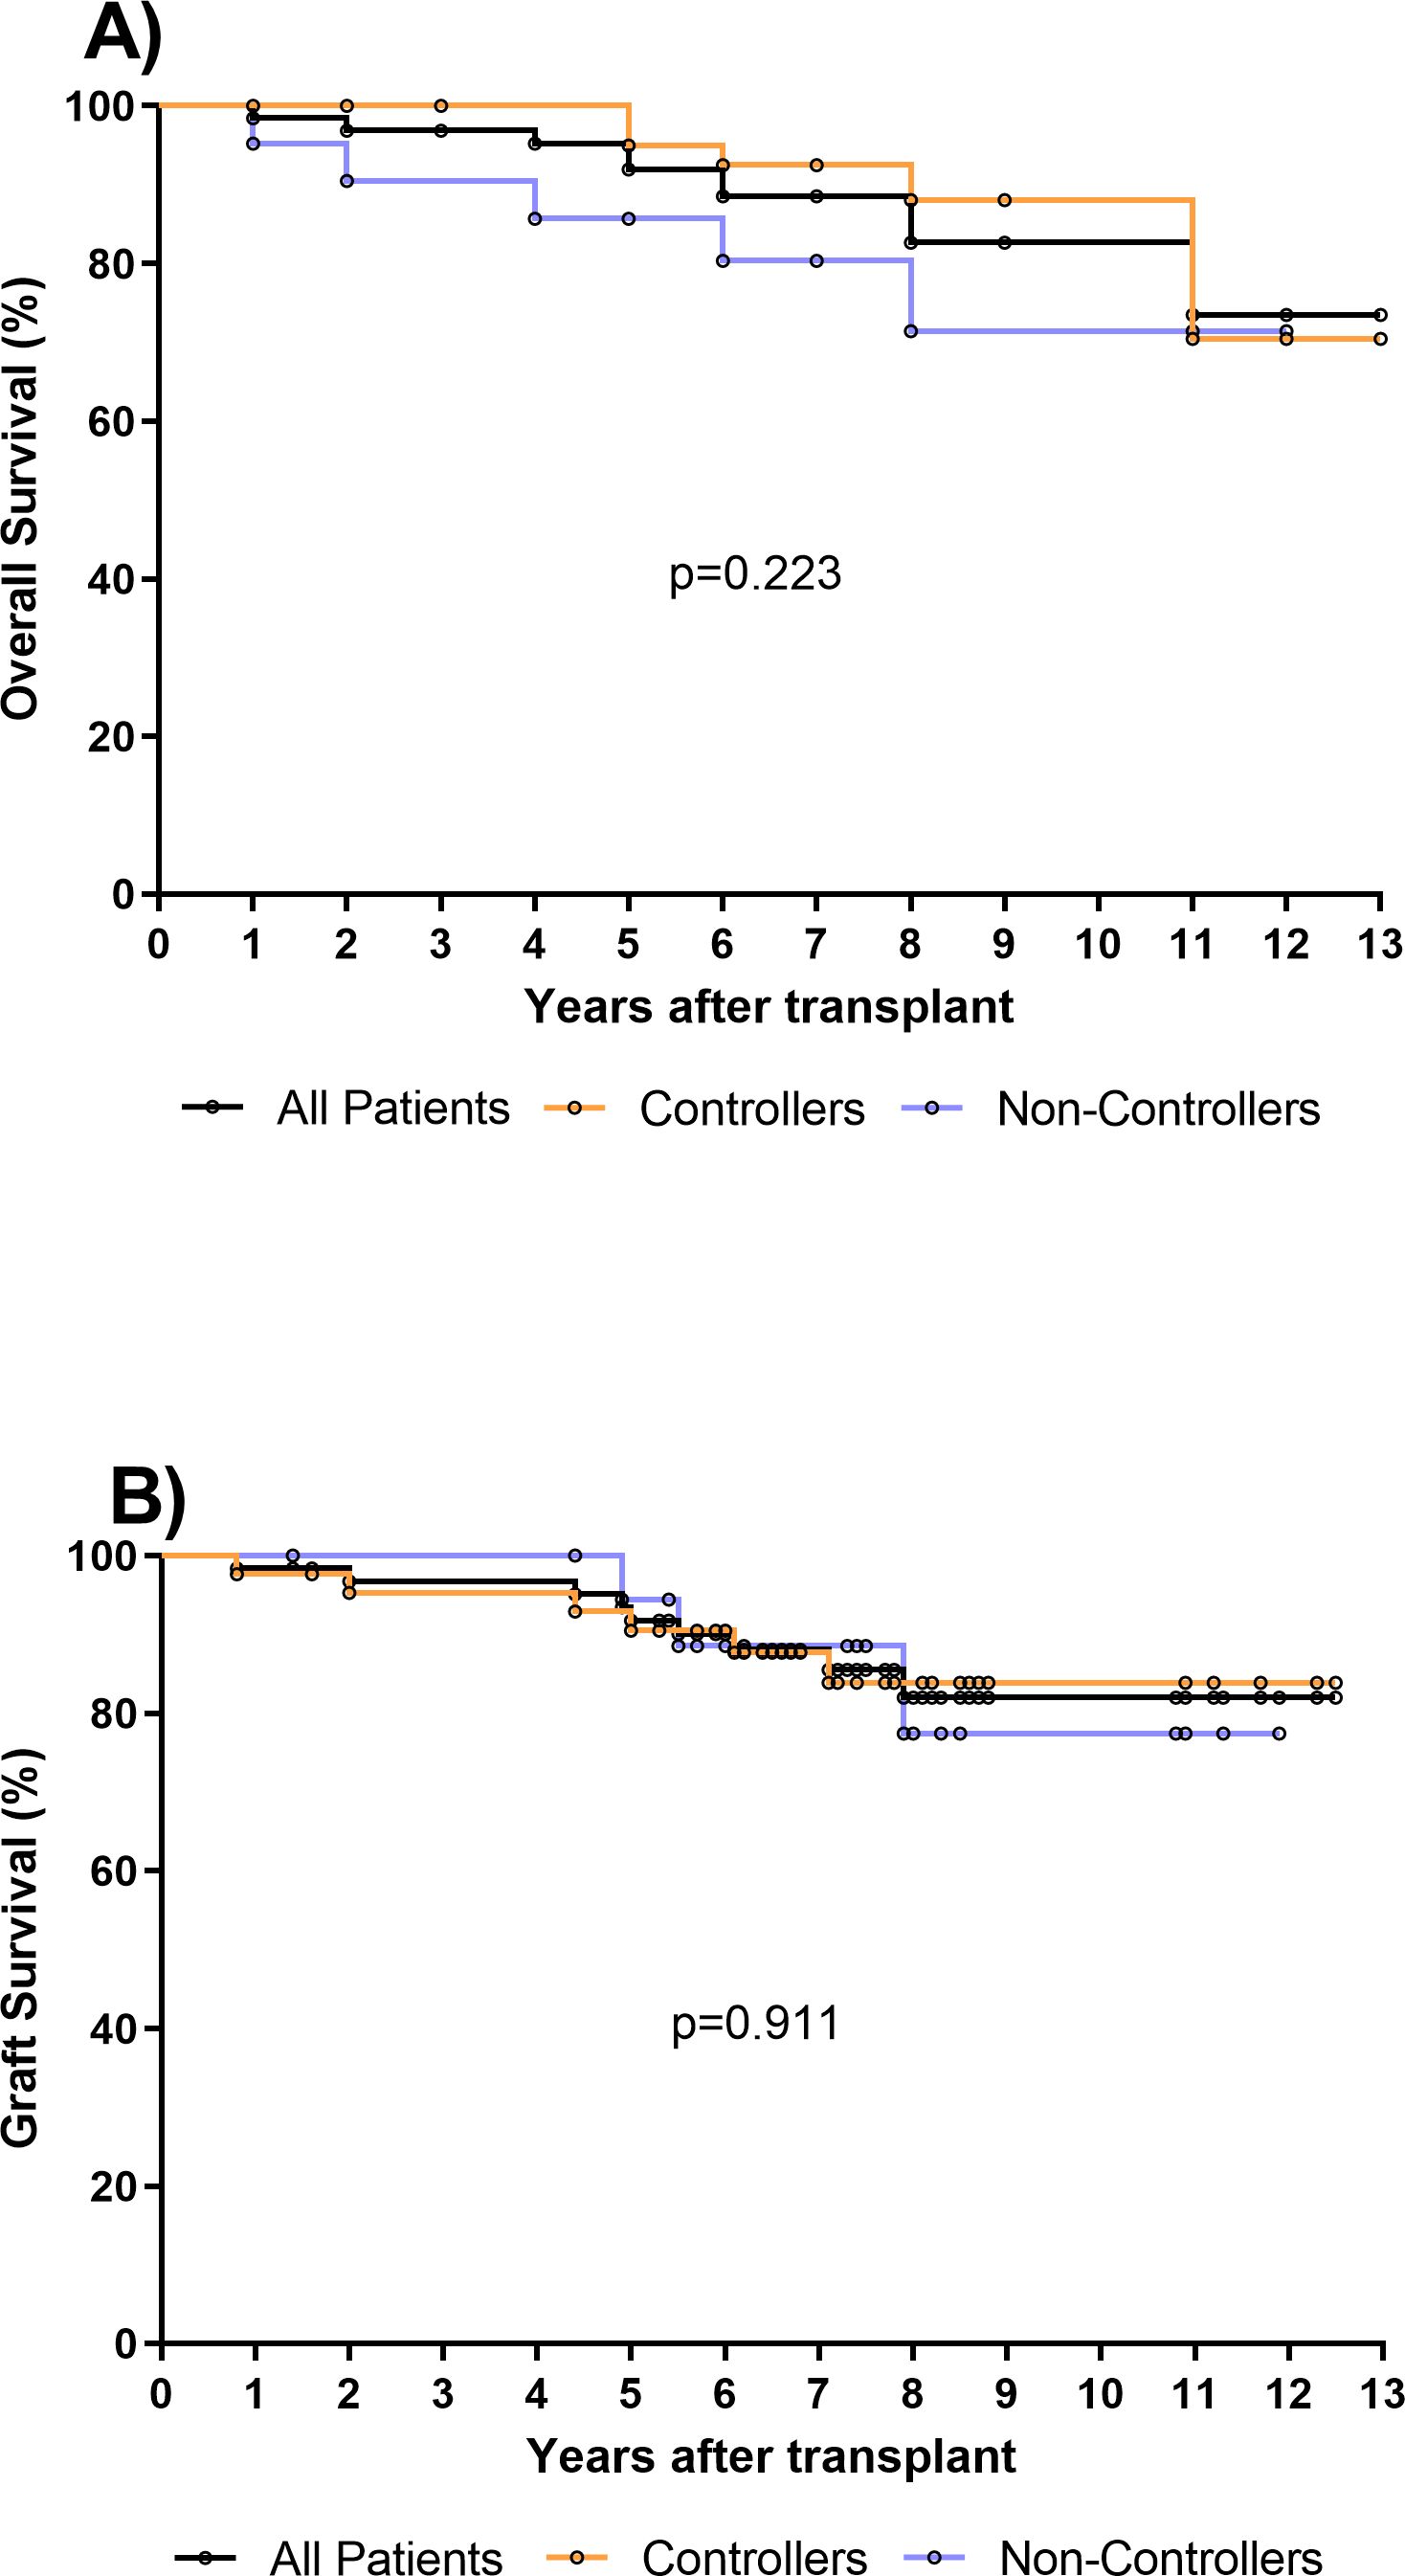
Figure 1. (A) Overall survival was evaluated in all kidney transplant recipients (KTR, n=65) (black line), in 44 Controllers (orange line) and in 21 Non-Controllers (purple line). No difference in overall survival was observed between controllers and non-controllers (p=0.223). (B) Graft survival was evaluated in all kidney transplant recipients (KTR, n=65) (black line), in 44 Controllers (orange line) and in 21 Non-Controllers (purple line). No difference of graft survival was observed between controllers and non-controllers (p=0.911).
3.2 Pre-transplant absolute number of total CD8+ T cell as predictive marker of spontaneously resolving HCMV reactivation during the first year post-transplant
The pre-transplant absolute number of total CD4+ and CD8+ T cells in blood was compared in 44 Controllers and 21 Non-Controllers at pre-transplant. No difference was observed in terms of the median of total CD4+ T cell between Controllers and Non-Controllers (610 [IQR 418-838] vs 528 [IQR 377-788] T-cell/μl, respectively) while the median of total CD8+T cell was found to be higher in Controllers than Non-Controllers (310 [IQR 215-424] vs 212 [IQR 157-338] T-cell/μl, respectively, p=0.025) (Figure 2A). In order to predict the spontaneous clearance of HCMV infection based on the absolute number of CD8+ T cell, the ROC curve analysis was performed. The optimal cut-off value of 215 CD8+ T cell/μl was selected using the Youden index (AUC: 0.67, 95% CI: 0.52-0.82, p=0.025) (Supplementary Table 1).
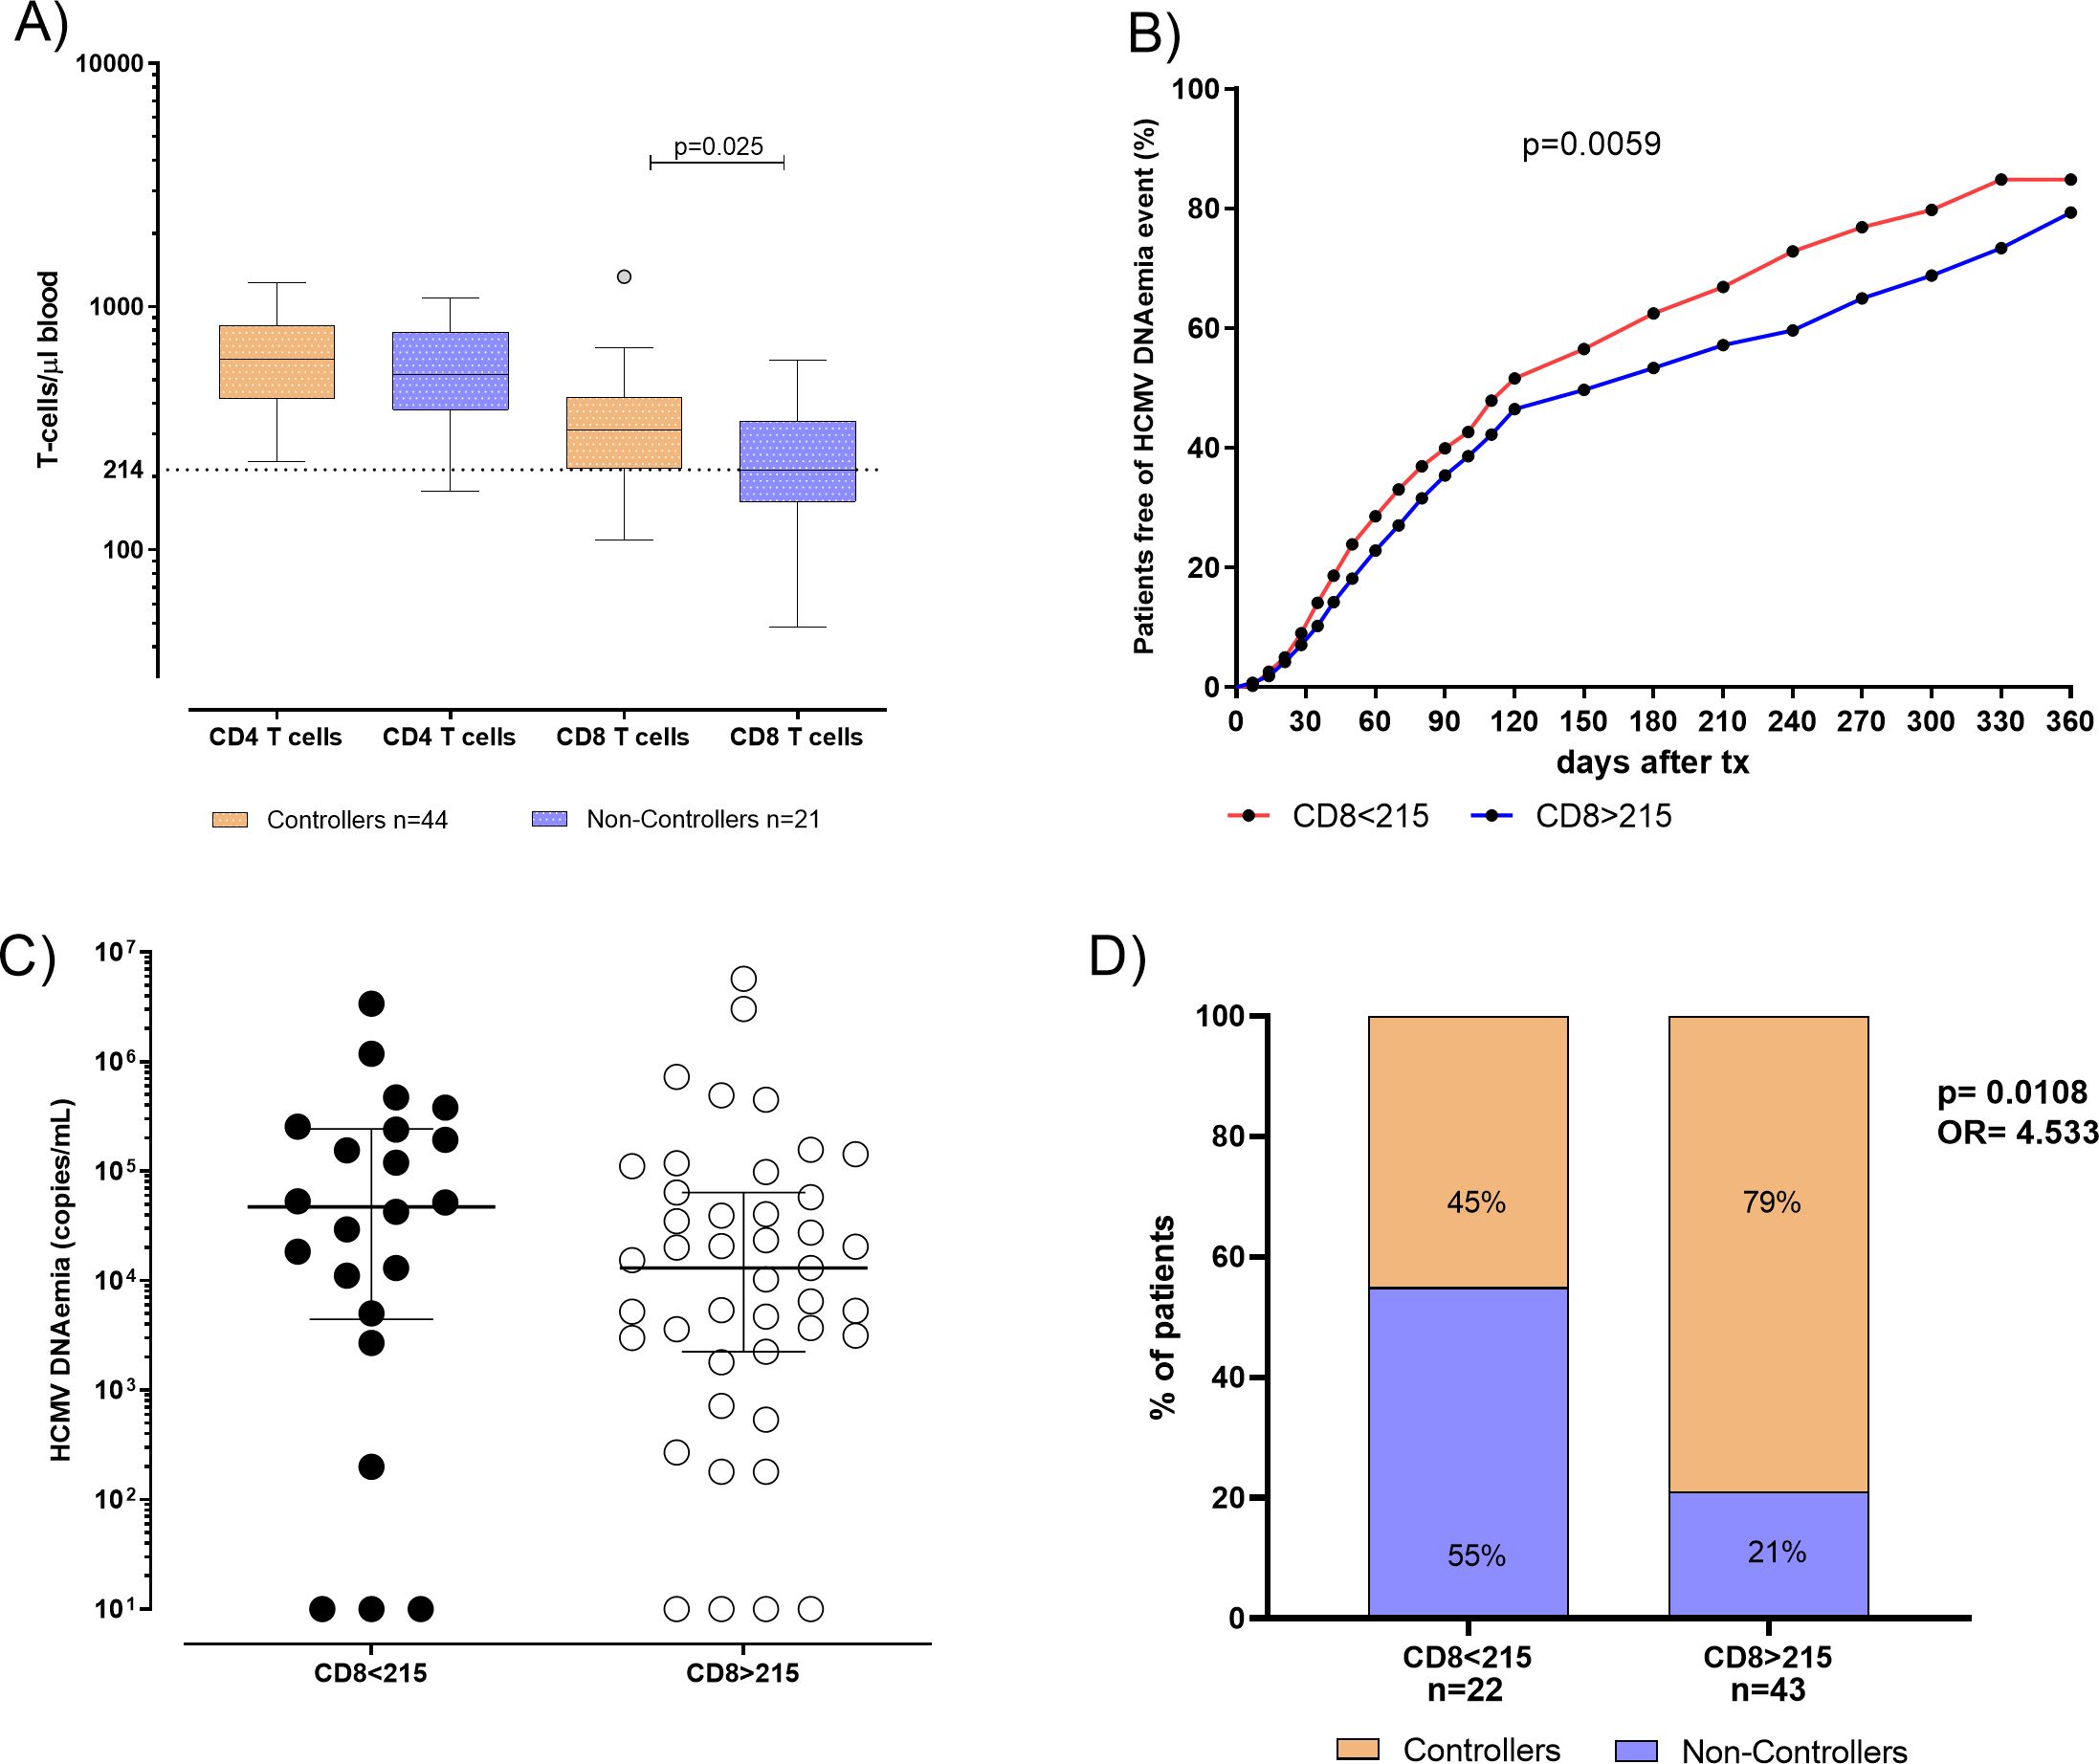
Figure 2. (A) Absolute number of total CD4 and CD8 T cells were evaluated and compared in 44 patients Controllers (orange bars) for and 21 Non-Controllers (purple bars). Median of total CD4 and CD8 T cells were shown in the graph as well as significant p value. (B) Cumulative incidence of HCMV reactivation events in patients absolute number of total CD8 T-cell response<215 CD8 T cells/µl (red line) and in patients with absolute number of total CD8 T-cell response ≥ 215 CD8 T cells/µl (blue line). (C) HCMV DNAemia peak in kidney transplant recipients (KTR) was measured in 22 patients with total CD8 T. (D) Percentage of Controllers (orange bars) and Non-Controllers patients (purple bars) according to absolute number of total CD8 T-cell response<215 CD8 T cells/µl and in patients with absolute number of CD8 T-cell response ≥ 215 CD8 T cells/µl. P value and Odd ratio (OR) were also given.
Interestingly, the cumulative incidence of HCMV reactivations during the first year after transplant in patients with the absolute number of CD8+< 215 T cell/μl was 85%, while in patients with the absolute number of CD8+ ≥215 T cell/μl it was 79% (p=0.005, Figure 2B). HCMV DNAemia at peak was measured and compared in 22 patients with the absolute number of CD8+< 215 T cell/μl and in 43 patients with CD8+ ≥ 215 T cell/μl in blood. We observed that median of HCMV DNAemia at peak was 47295 [IQR 4455-243863] copies/mL in patients with the absolute number of CD8+< 215 T cell/μl in blood, and 13050 (2250–64150) copies/mL in patients with the absolute number of CD8+ ≥ 215 T cell/μl in blood (Figure 2C), even if this difference was not statistically significant (p=0.169). Regarding patients with the absolute number of CD8+< 215 T cell/μl, 12 out of 22 (55%) were Non-Controllers, while 10 out of 22 (45%) patients were Controllers. On the other hand, patients with the absolute number of CD8+ ≥ 215 T cell/μl, 9 out of 43 (21%) were Non-Controllers, while 34 out of 43 (79%) were Controllers (p=0.018, Figure 2D).
3.3 Pre-transplant IE1-specific T-cell response as a second predictive marker of spontaneously resolving HCMV reactivation during the first year post-transplant
HCMV-specific T-cell response was evaluated in 62 patients (41 Controllers and 21 Non-Controllers). Both pp65 and IE2-specific T-cell response did not significantly differ between Controllers and Non-Controllers (p=0.193 and p=0.869, respectively). On the contrary, a significantly higher median IE1-specific T-cell response was observed in Controllers compared to Non-Controllers (330 [IQR 69-1744] vs 28 [IQR 7-292] spots, respectively; p=0.015) (Figure 3A). Additionally, a negative correlation between DNAemia peak and IE1-specific T-cell responses was observed (p=0.0092, r= -0.33 IC 95% between -0.54 and -0.07). Based on these results, a ROC curve analysis was used to predict the spontaneous clearance of HCMV infection and cut-off of 60 spots of IE1-specific T-cell response was calculated using Youden index (Supplementary Table 1).
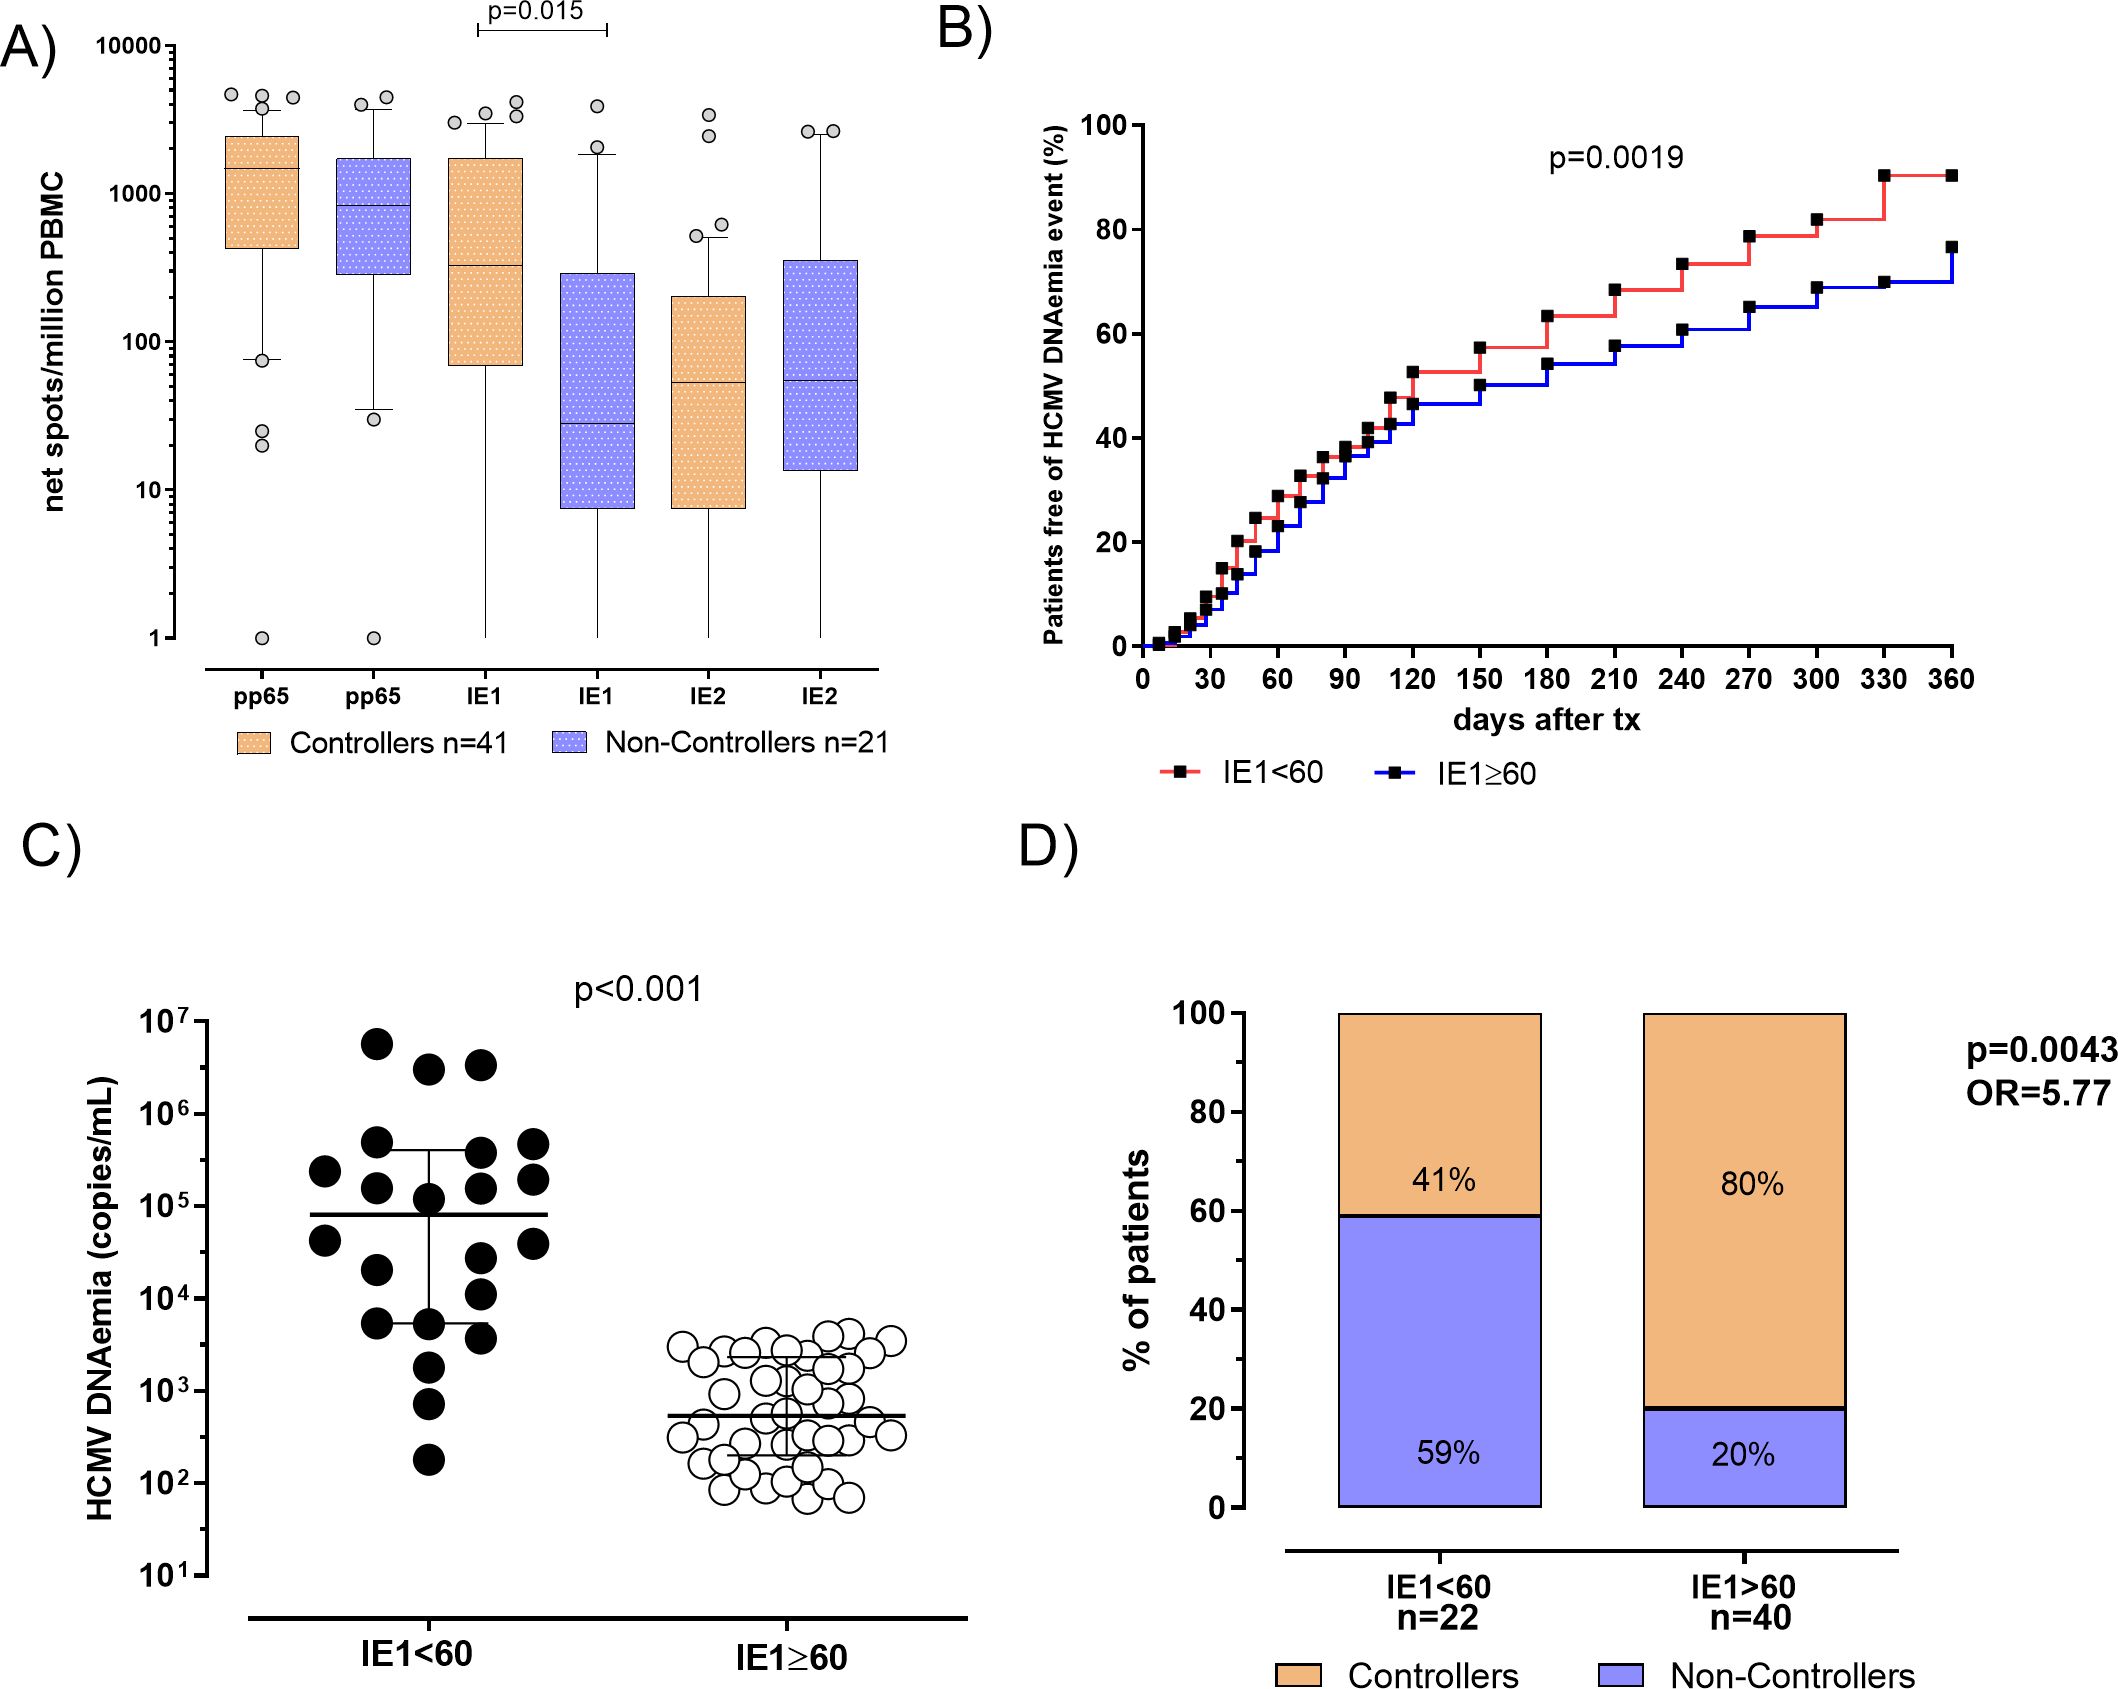
Figure 3. (A) Pp65, IE1 and IE2 specific T-cell responses were evaluated and compared in 41 patients Controllers (orange bars) for and 21 Non-Controllers (purple bars). Median antigen-specific T-cell responses were shown in the graph as well as each p value. (B) Cumulative incidence of HCMV reactivation events in patients with IE1-specific T-cell response<60 spots (red line) patients with IE1-specific T-cell response ≥ 60 spots (blue line). (C) HCMV DNAemia peak in patients classified according to pre transplant IE1-specific T-cell response. (D) Percentage of Controllers (orange bars) and Non-Controllers patients (purple bars) according to pre-defined IE1-specific T-cell response cut-off of 60 spots. P value and Odd ratio (OR) were also given.
In patients with IE1-specific T-cell response< 60 spots the cumulative incidence of HCMV reactivation events was 90%, while in patients with IE1-specific T-cell response ≥ 60 spots a cumulative incidence of HCMV reactivation events of 77% was observed (p=0.0019, Figure 3B). HCMV DNAemia at peak was measured and compared in the two groups of patients, showing that median of HCMV DNAemia at peak was 81325 [IQR 5378-404325] copies/mL in patients with IE1-specific T-cell response< 60 spots and 8390 (337–50085) copies/mL in patients with IE1-specific T-cell response ≥ 60 spots (p<0.001, Figure 3C). Among patients with an IE1-specific T-cell response at pre-transplant<60 spots, 13 out of 22 (59%) were Non-Controllers, while 9 out of 22 (41%) were Controllers. Otherwise, looking at patients with an IE1-specific T-cell response ≥ 60 spots, 8 out of 40 (20%) were Non-Controllers, while 32 out of 40 (80%) were Controllers (p=0.004, Figure 3D). In other words, since a higher proportion of Controllers patients showed an IE1-specific T-cell response ≥ 60 spots, measuring HCMV-specific T-cell response at baseline might be used for identifying patients with high rate of self-resolving HCMV reactivation in the post-transplant period.
3.4 The use of combined immunological markers might be used for optimizing the HCMV management of transplanted patients
Based on these findings, age at time of transplant, CD8+ T-cell count and IE1-specific T-cell response can be independently used for predicting the risk of treatment for severe HCMV reactivation in HCMV seropositive KTRs. Then, we combined the parameters for identifying the percentage of non-controllers in each group as shown in Figure 4. Groups were classified according to age lower than 60 years, high CD8+ T cell count (≥215 cells/µl), and high level of IE1-specific T-cell response (≥60 spots). In detail, group 1 included patients with all the three markers (n=21), group 2 included patients at two of the three markers (n=26) while group 3 included patients with only one of the markers described (n=12). Group 4 included patients with none of the markers (n=3). The number and percentage of controllers and non-controllers were given for each group. Interestingly, among group 1, only one of the 21 patients was treated for uncontrolled HCMV infection. On the other hand, all the three patients of group 4 were treated for uncontrolled HCMV infection.
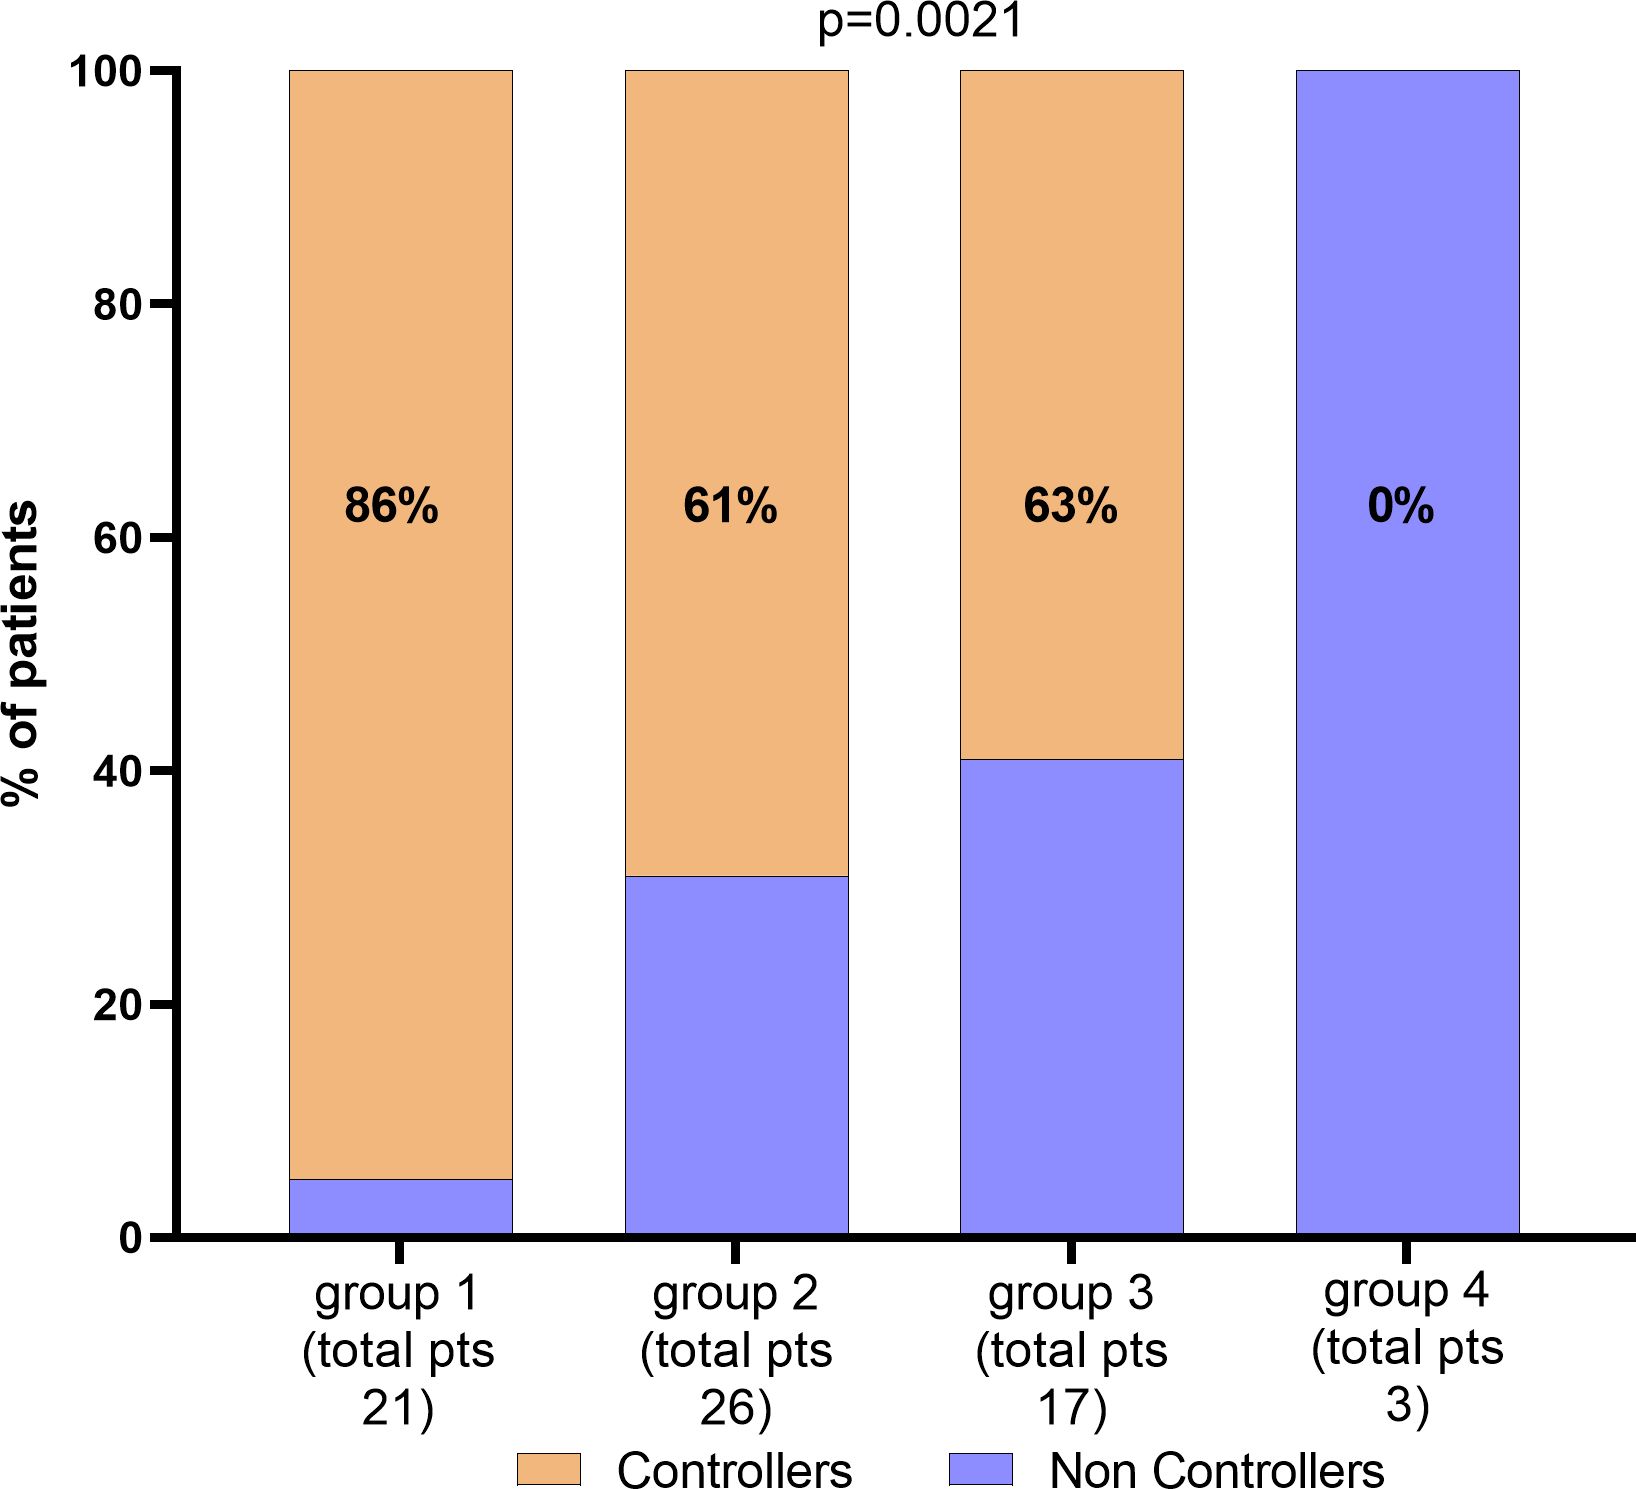
Figure 4. Percentage of patients according with CD8 T-cells, IE1 spots levels and age. Total number of patients and percentage of Controllers have been given for each group. Parameters for the classification of each group have been described in the text.
Multivariate logistic analysis for predicting the risk of HCMV Non-Controllers (treated) infection was performed including IE1-specific T-cell response (higher or lower than 60 spots), CD8+ T-cell count (higher or lower than 215 cells/µl) and age (higher or lower than 60 years) as variables. Results were given in Table 2 and Figure 5. Mathematical function is the following:
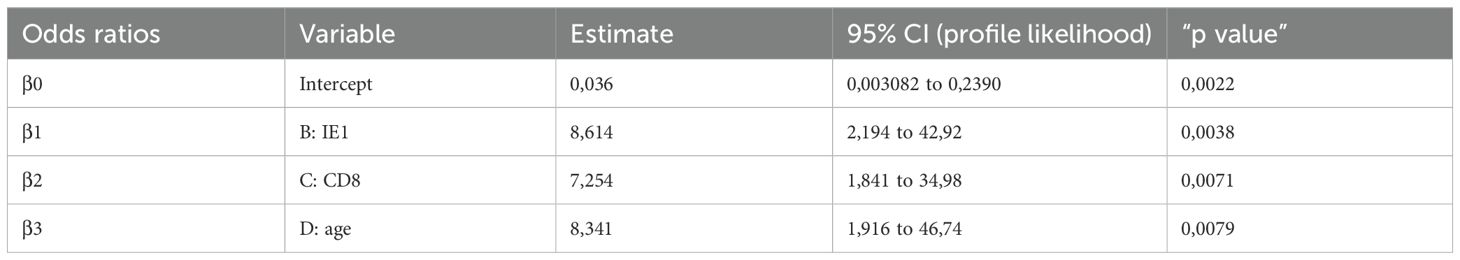
Table 2. Multivariate logistic regression.
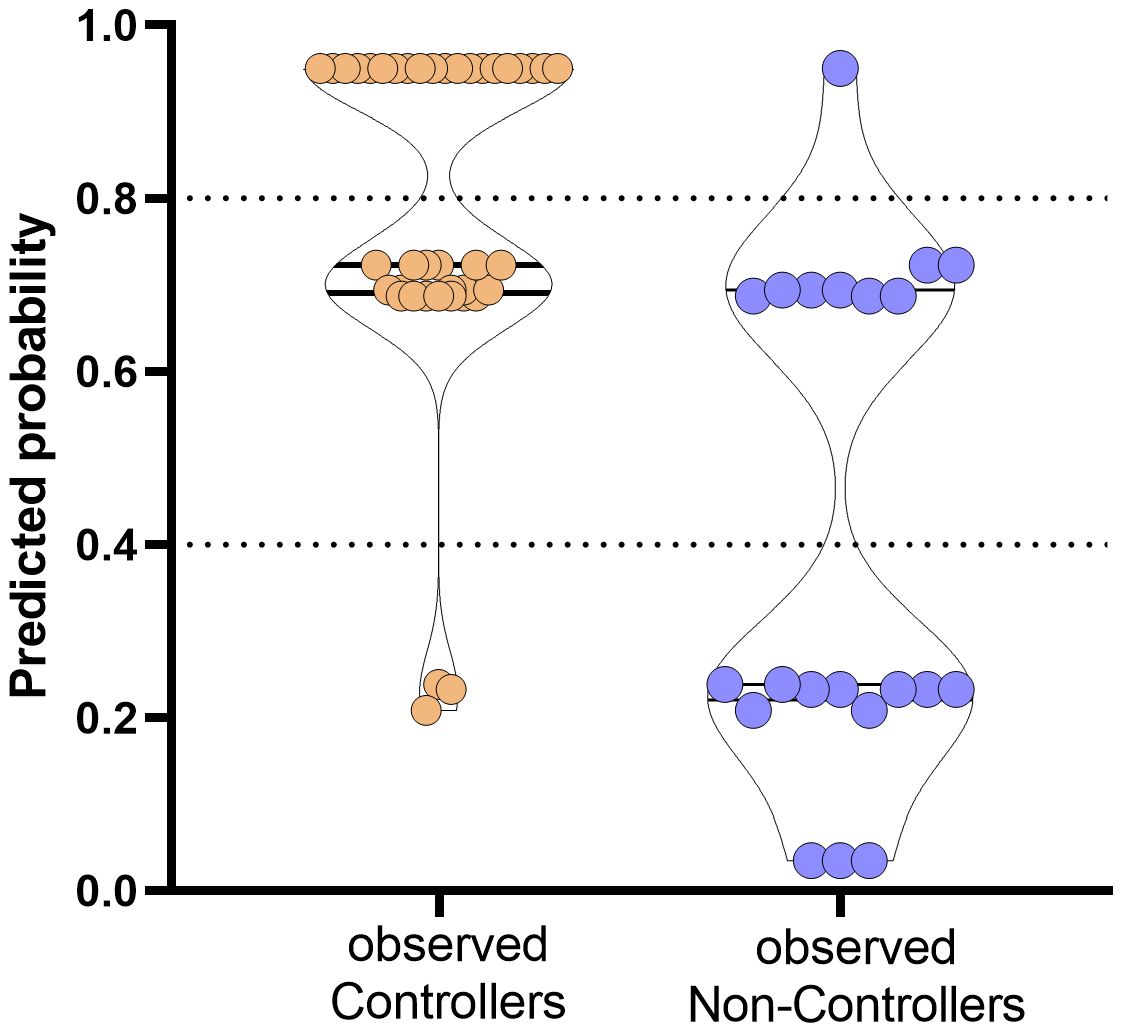
Figure 5. Prediction of probability of the event occurrence in observed Controllers (orange dots) and Non-Controllers (purple dots). The y-axis ranges from 0 (highest probability to be HCMV uncontroller) to 1 (highest probability to be HCMV controller). Dotted horizontal lines have been included for indicating grey zone.
Based on the proposed model, the combination of the three variables are able to predict with high probability the rate of controller patients. In detail, percentages of negative and positive predictive power were 80% and 80.85%, respectively. The percentage of correctly classified “Controllers” was 92.7% while the percentage of correctly classified “Non-Controllers” was 57.2%.
4 Discussion
The evaluation of HCMV serostatus in both donor and recipient at time of transplant is considered the most informative approach for the stratification of the risk for HCMV infection after transplant. However, even if HCMV-seropositive recipients are considered to have HCMV-specific immune response, HCMV can reactivate in some patients leading to the risk of HCMV-related complications (30). For this reason, a tool for a better stratification should be introduced, especially for the risk definition among HCMV-seropositive recipients (31).
In this study, we examined the role of lymphocyte count and HCMV-specific T-cell response measured at pre-transplant as potential predictive markers of spontaneous control of HCMV reactivations following kidney transplant. High absolute number of CD8+ T cells and sustained IE1-specific T-cell response were independently associated with highest rate of patients with spontaneous resolution of HCMV reactivation (defined as controllers) during the first year after transplant. Moreover, the rate of Controllers was higher in younger subjects. Additionally, even if the difference is not statistically significant, it seems that donor serostatus could have an impact on the occurrence of clinically relevant HCMV reactivations. However, as major limitation of the study, HCMV donor serostatus is unknown for about 30% of the subjects.
Many studies investigated the role of absolute lymphocyte count measured after transplant or at time of treatment in predicting the rate of HCMV infection or recurrent HCMV infection after treatment (10, 32–34). However, the potential role of baseline pre-transplant measurement has been less extensively investigated. In our study, a threshold of IE1-specific T-cell response of 60 net spots/million PBMC was the best cut off for the identification of patients with high probability to control HCMV reactivation spontaneously. Previous studies suggested a possible role of lower IE1-specific T-cell response as risk factor for HCMV reactivation (20, 23, 25, 35). In our study, higher pre-transplant pp65-specific T-cell response was observed in patients with self-resolving HCMV reactivation than in patients with clinically relevant HCMV reactivation, although the difference was not statistically significant. On the contrary, Kim and colleagues reported that pp65-specific T-cell response measured at pre-transplant, but not IE1-specific T-cell response seems to predict the development of HCMV reactivation in HCMV-seropositive patients (36). The reasons for these differences might be related to the type of stimuli used or outcome definition. Further evaluation on this field are necessary. So far, the lack of standardized assays represents a crucial issue for the comparison of results between different clinical settings.
Based on our results, patients with pre-transplant IE1-specific T-cell response above this cut off showed higher probability to develop self-resolving HCMV reactivations. Furthermore, the cumulative incidence of HCMV reactivation events in patients with impaired pre-transplant IE1-specific T-cell response was higher. This means that higher pre-transplant IE1-specific T-cell response could be predictive of sustained immunity in the post-transplant period (15). According to this hypothesis, it was previously observed that patients with positive pre-transplant HCMV-specific T-cell response showed higher HCMV-specific immune response in the post-transplant period. On the contrary, in patients with no pre-transplant HCMV-specific immune response, post-transplant T-cell response specific for HCMV was detectable 3 months after transplant in less than 50% of patients, suggesting a long-term impairment in the control of HCMV infection (21). To date, no universal cut-off of DNAemia have been chosen for starting pre-emptive therapy; for this reason pre-transplant HCMV-specific T-cell response should be evaluated in different transplant setting, in relation to diagnostic and therapeutic protocols. To conclude, in addition to the assessment of HCMV serostatus in patients attending for transplant, pre-transplant IE1-specific T-cell response and CD8+ T cell count evaluation should be further investigated for definition of potential algorithm for a better stratification of the risk in HCMV-seropositive recipients and “ad hoc” therapeutic strategies, including modulation of immunosuppression therapy.
Data availability statement
The raw data supporting the conclusions of this article will be made available by the authors, without undue reservation.
Ethics statement
The studies involving humans were approved by The study was approved by the Ethics Committee and Fondazione IRCCS Policlinico San Matteo Institutional Review Board (Protocol number 20180004199) and patients gave written informed consent. The studies were conducted in accordance with the local legislation and institutional requirements. The participants provided their written informed consent to participate in this study.
Author contributions
FZ: Data curation, Formal Analysis, Writing – review & editing, Investigation, Methodology. IC: Data curation, Formal Analysis, Writing – review & editing, Conceptualization, Funding acquisition, Supervision, Writing – original draft. MGre: Data curation, Writing – review & editing. MGri: Data curation, Writing – review & editing. TR: Data curation, Supervision, Writing – review & editing. DL: Supervision, Writing – review & editing. FB: Funding acquisition, Supervision, Writing – review & editing.
Funding
The author(s) declare that financial support was received for the research and/or publication of this article. This study was supported by grants from the Ministero della Salute, Fondazione IRCCS Policlinico San Matteo, Ricerca Corrente grant no. 08075023 (to I.C) and Ricerca Finalizzata (Grant RF-2019-12370797 to F.B.).
Acknowledgments
We thank Daniela Sartori for manuscript editing.
Conflict of interest
The authors declare that the research was conducted in the absence of any commercial or financial relationships that could be construed as a potential conflict of interest
Generative AI statement
The author(s) declare that no Generative AI was used in the creation of this manuscript.
Publisher’s note
All claims expressed in this article are solely those of the authors and do not necessarily represent those of their affiliated organizations, or those of the publisher, the editors and the reviewers. Any product that may be evaluated in this article, or claim that may be made by its manufacturer, is not guaranteed or endorsed by the publisher.
Supplementary material
The Supplementary Material for this article can be found online at: https://www.frontiersin.org/articles/10.3389/fimmu.2025.1538795/full#supplementary-material
Supplementary Figure 1 | Flow-chart representing the enrollment and monitoring of kidney transplant recipients. KTR: kidney transplant recipients; PBMC: peripheral blood mononuclear cells; (*) patients with self-resolving HCMV reactivations or undetectable HCMV DNAemia; (**) patients treated for clinically significant HCMV reactivation
References
1. Fishman JA. Infection in organ transplantation. Am J Transplant. (2017) 17:856–79. doi: 10.1111/ajt.14208
2. Fishman JA, Emery V, Freeman R, Pascual M, Rostaing L, Schlitt HJ, et al. Cytomegalovirus in transplantation - challenging the status quo. Clin Transplant. (2007) 21:149–58. doi: 10.1111/j.1399-0012.2006.00618.x
3. Bruminhent J, Razonable RR. Management of cytomegalovirus infection and disease in liver transplant recipients. World J Hepatol. (2014) 6:370–83. doi: 10.4254/wjh.v6.i6.370
4. Kotton CN, Kumar D, Caliendo AM, Asberg A, Chou S, Danziger-Isakov L, et al. Updated international consensus guidelines on the management of cytomegalovirus in solid-organ transplantation. Transplantation. (2013) 96:333–60. doi: 10.1097/TP.0b013e31829df29d
5. Grossi PA, Peghin M. Recent advances in cytomegalovirus infection management in solid organ transplant recipients. Curr Opin Organ Transplant. (2024) 29:131–7. doi: 10.1097/MOT.0000000000001139
6. Razonable RR, Humar A. AST Infectious Diseases Community of Practice. Cytomegalovirus in solid organ transplantation. Am J Transplant. (2013) 13 Suppl 4:93–106. doi: 10.1111/ajt.12103
7. Calarota SA, Zelini P, De Silvestri A, Chiesa A, Comolli G, Sarchi E, et al. Kinetics of T-lymphocyte subsets and posttransplant opportunistic infections in heart and kidney transplant recipients. Transplantation. (2012) 93:112–9. doi: 10.1097/TP.0b013e318239e90c
8. Calarota SA, Chiesa A, De Silvestri A, Morosini M, Oggionni T, Marone P, et al. T-lymphocyte subsets in lung transplant recipients: association between nadir CD4 T-cell count and viral infections after transplantation. J Clin Virol. (2015) 69:110–6. doi: 10.1016/j.jcv.2015.06.078
9. Hall VG, Humar A, Kumar D. Utility of cytomegalovirus cell-mediated immunity assays in solid organ transplantation. J Clin Microbiol. (2022) 60:e0171621. doi: 10.1128/jcm.01716-21
10. Gardiner BJ, Nierenberg NE, Chow JK, Ruthazer R, Kent DM, Snydman DR. Absolute lymphocyte count: A predictor of recurrent cytomegalovirus disease in solid organ transplant recipients. Clin Infect Dis. (2018) 67:1395–402. doi: 10.1093/cid/ciy295
11. Zavaglio F, Rivela F, Cassaniti I, Arena F, Gabanti E, Asti AL, et al. ELISPOT assays with pp65 peptides or whole HCMV antigen are reliable predictors of immune control of HCMV infection in seropositive kidney transplant recipients. J Med Virol. (2023) 95:e28507. doi: 10.1002/jmv.28507
12. Zavaglio F, Cassaniti I, d’Angelo P, Zelini P, Comolli G, Gregorini M, et al. Immune control of human cytomegalovirus (HCMV) infection in HCMV-seropositive solid organ transplant recipients: the predictive role of different immunological assays. Cells. (2024) 13:1325. doi: 10.3390/cells13161325
13. Gabanti E, Bruno F, Lilleri D, Fornara C, Zelini P, Cane I, et al. Human cytomegalovirus (HCMV)-specific CD4+ and CD8+ T cells are both required for prevention of HCMV disease in seropositive solid-organ transplant recipients. PloS One. (2014) 9:e106044. doi: 10.1371/journal.pone.0106044
14. Meesing A, Razonable RR. New developments in the management of cytomegalovirus infection after transplantation. Drugs. (2018) 78:1085–103. doi: 10.1007/s40265-018-0943-1
15. Gerna G, Lilleri D, Fornara C, Comolli G, Lozza L, Campana C, et al. Monitoring of human cytomegalovirus-specific CD4 and CD8 T-cell immunity in patients receiving solid organ transplantation. Am J Transplant. (2006) 6:2356–64. doi: 10.1111/j.1600-6143.2006.01488.x
16. Gerna G, Lilleri D, Chiesa A, Zelini P, Furione M, Comolli G, et al. Virologic and immunologic monitoring of cytomegalovirus to guide preemptive therapy in solid-organ transplantation. Am J Transplant. (2011) 11:2463–71. doi: 10.1111/j.1600-6143.2011.03636.x
17. Rogers R, Saharia K, Chandorkar A, Weiss ZF, Vieira K, Koo S, et al. Clinical experience with a novel assay measuring cytomegalovirus (CMV)-specific CD4+ and CD8+ T-cell immunity by flow cytometry and intracellular cytokine staining to predict clinically significant CMV events. BMC Infect Dis. (2020) 20:58. doi: 10.1186/s12879-020-4787-4
18. Fernández-Ruiz M, Giménez E, Vinuesa V, Ruiz-Merlo T, Parra P, Amat P, et al. Regular monitoring of cytomegalovirus-specific cell-mediated immunity in intermediate-risk kidney transplant recipients: predictive value of the immediate post-transplant assessment. Clin Microbiol Infect. (2019) 25:381. doi: 10.1016/j.cmi.2018.05.010
19. Mena-Romo JD, Pérez Romero P, Martín-Gandul C, Gentil M.Á., Suárez-Artacho G, Lage E, et al. CMV-specific T-cell immunity in solid organ transplant recipients at low risk of CMV infection. Chronology and applicability in preemptive therapy. J Infect. (2017) 75:336–45. doi: 10.1016/j.jinf.2017.05.020
20. Rittà M, Costa C, Sidoti F, Ballocco C, Ranghino A, Messina M, et al. Pre-transplant assessment of CMV-specific immune response by Elispot assay in kidney transplant recipients. New Microbiol. (2015) 38:329–35.
21. Molina-Ortega A, Martín-Gandul C, Mena-Romo JD, Rodríguez-Hernández MJ, Suñer M, Bernal C, et al. Impact of pretransplant CMV-specific T-cell immune response in the control of CMV infection after solid organ transplantation: a prospective cohort study. Clin Microbiol Infect. (2019) 25:753–8. doi: 10.1016/j.cmi.2018.09.019
22. Cantisán S, Lara R, Montejo M, Redel J, Rodríguez-Benot A, Gutiérrez-Aroca J, et al. Pretransplant interferon-γ secretion by CMV-specific CD8+ T cells informs the risk of CMV replication after transplantation. Am J Transplant. (2013) 13:738–45. doi: 10.1111/ajt.12049
23. López-Oliva MO, Martinez V, Buitrago A, Jiménez C, Rivas B, Escuin F, et al. Pretransplant CD8 T-cell response to IE-1 discriminates seropositive kidney recipients at risk of developing CMV infection posttransplant. Transplantation. (2014) 97:839–45. doi: 10.1097/01.TP.0000438025.96334.eb
24. López-Oliva MO, Martínez V, Rodríguez-Sanz A, Álvarez L, Santana MJ, Selgas R, et al. Pre-transplant assessment of pp65-specific CD4 T cell responses identifies CMV-seropositive patients treated with rATG at risk of late onset infection. Clin Immunol. (2020) 211:108329. doi: 10.1016/j.clim.2019.108329
25. Bestard O, Lucia M, Crespo E, Van Liempt B, Palacio D, Melilli E, et al. Pretransplant immediately early-1-specific T cell responses provide protection for CMV infection after kidney transplantation. Am J Transplant. (2013) 13:1793–805. doi: 10.1111/ajt.12256
26. Furione M, Rognoni V, Cabano E, Baldanti F. Kinetics of human cytomegalovirus (HCMV) DNAemia in transplanted patients expressed in international units as determined with the Abbott RealTime CMV assay and an in-house assay. J ClinVirol. (2012) 55:317–22. doi: 10.1016/j.jcv.2012.08.017
27. Ljungman P, Boeckh M, Hirsch HH, Josephson F, Lundgren J, Nichols G, et al. Disease definitions working group of the cytomegalovirus drug development forum. Definitions of cytomegalovirus infection and disease in transplant patients for use in clinical trials. Clin Infect Dis. (2017) 64:87–91. doi: 10.1093/cid/ciw668
28. Cassaniti I, Calarota SA, Adzasehoun KM, Chiesa A, Comolli G, Parea M, et al. Memory T cells specific for HBV enumerated by a peptide-based cultured enzyme-linked immunospot assay in healthy HBV-vaccinated subjects. Hum VaccinImmunother. (2016) 12:2927–33. doi: 10.1080/21645515.2016.1204500
29. Kiecker F, Streitz M, Ay B, Cherepnev G, Volk HD, Volkmer-Engert R, et al. Analysis of antigen-specific T-cell responses with synthetic peptides–what kind of peptide for which purpose? Hum Immunol. (2004) 65:523–36. doi: 10.1016/j.humimm.2004.02.017
30. Westall GP, Mifsud NA, Kotsimbos T. Linking CMV serostatus to episodes of CMV reactivation following lung transplantation by measuring CMV-specific CD8+ T-cell immunity. Am J Transplant. (2008) 8:1749–54. doi: 10.1111/j.1600-6143.2008.02294.x
31. Yong MK, Lewin SR, Manuel O. Immune monitoring for CMV in transplantation. Curr Infect Dis Rep. (2018) 20:4. doi: 10.1007/s11908-018-0610-4
32. Meesing A, Abraham RS, Razonable RR. Clinical correlation of cytomegalovirus infection with CMV-specific CD8+ T-cell immune competence score and lymphocyte subsets in solid organ transplant recipients. Transplantation. (2019) 103:832–8. doi: 10.1097/TP.0000000000002396
33. Schoeberl AK, Zuckermann A, Kaider A, Aliabadi-Zuckermann A, Uyanik-Uenal K, Laufer G, et al. Absolute lymphocyte count as a marker for cytomegalovirus infection after heart transplantation. Transplantation. (2023) 107:748–52. doi: 10.1097/TP.0000000000004360
34. Yoon M, Oh J, Chun KH, Lee CJ, Kang SM. Post-transplant absolute lymphocyte count predicts early cytomegalovirus infection after heart transplantation. Sci Rep. (2021) 11:1426. doi: 10.1038/s41598-020-80790-4
35. Bunde T, Kirchner A, Hoffmeister B, Habedank D, Hetzer R, Cherepnev G, et al. Protection from cytomegalovirus after transplantation is correlated with immediate early 1-specific CD8 T cells. J Exp Med. (2005) 201:1031–6. doi: 10.1084/jem.20042384
Keywords: pre-transplant immunity, human cytomegalovirus, kidney transplant, immunological markers, T-cell response
Citation: Zavaglio F, Cassanti I, Gregorini M, Grignano MA, Rampino T, Lilleri D and Baldanti F (2025) Pre-transplant IE1-specific T-cell response and CD8+ T-cell count as predictive markers of treated HCMV reactivation in kidney transplant recipients. Front. Immunol. 16:1538795. doi: 10.3389/fimmu.2025.1538795
Received: 03 December 2024; Accepted: 28 March 2025;
Published: 16 April 2025.
Edited by:
Mohammad Hossein Karimi, Shiraz University of Medical Sciences, IranReviewed by:
Ramin Yaghobi, Shiraz University of Medical Sciences, IranRoberto Crocchiolo, Niguarda Ca’ Granda Hospital, Italy
Luigi Nespoli, University of Insubria, Italy
Copyright © 2025 Zavaglio, Cassanti, Gregorini, Grignano, Rampino, Lilleri and Baldanti. This is an open-access article distributed under the terms of the Creative Commons Attribution License (CC BY). The use, distribution or reproduction in other forums is permitted, provided the original author(s) and the copyright owner(s) are credited and that the original publication in this journal is cited, in accordance with accepted academic practice. No use, distribution or reproduction is permitted which does not comply with these terms.
*Correspondence: Cassaniti Irene, aS5jYXNzYW5pdGlAc21hdHRlby5wdi5pdA==; aXJlbmUuY2Fzc2FuaXRpQHVuaXB2Lml0