 Paulo Rodrigues-Santos1,2,3,4,5,6*
 Jani Sofia Almeida1,2,3,4,5,6
 Luana Madalena Sousa1,5,6
 Patrícia Couceiro1,3,4,5
 António Martinho7
 Joana Rodrigues8Ruben Fonseca8Manuel Santos-Rosa2,3,4,5,6
 Paulo Freitas-Tavares8José Manuel Casanova3,4,5,6,8
- 1Laboratory of Immunology and Oncology, Center for Neurosciences and Cell Biology (CNC), University of Coimbra, Coimbra, Portugal
- 2Institute of Immunology, University of Coimbra, Faculty of Medicine (FMUC), Coimbra, Portugal
- 3Center for Investigation in Environment, Genetics and Oncobiology (CIMAGO), University of Coimbra, Coimbra, Portugal
- 4Coimbra Institute for Clinical and Biomedical Research (iCBR), University of Coimbra, Coimbra, Portugal
- 5Center for Innovation in Biomedicine and Biotechnology (CIBB), University of Coimbra, Coimbra, Portugal
- 6Clinical and Academic Centre of Coimbra (CACC), Coimbra, Portugal
- 7Blood and Transplantation Center of Coimbra, Portuguese Institute for Blood and Transplantation (IPST), Coimbra, Portugal
- 8Tumor Unit of the Locomotor Apparatus, University Clinic of Orthopedics, Orthopedics Oncology Service, Coimbra Local Health Unit (ULSC), Coimbra, Portugal
Soft tissue sarcomas (STS) encompass over 50 histologic subtypes, representing more than 1% of solid tumors. Standard treatments include surgical resection and therapies such as anthracyclines or trabectedin for advanced cases, though challenges persist due to the tumor microenvironment’s complexity and limited immune profiling data. This study evaluates Trabectedin therapy in 22 refractory STS patients, analyzing progression-free survival (PFS) and immune responses. Immune monitoring included deep immunophenotyping (200+ parameters), gene expression profiling (103 genes), and soluble proteome analysis (99 analytes). Using RECIST1.1 criteria, 68.2% of patients achieved stable disease (SD), while 31.8% exhibited progression disease (PD). Therapy duration revealed 59.1% treated for less than 12 months (<12M) and 40.9% for 12 or more months (≥12M). A significant PFS improvement was observed in SD versus PD patients (p=0.0154), while therapy duration showed no effect (p=0.5433). PD patients showed reduced eosinophils (p<0.05) and Th2 cells (p<0.05). Gene expression analysis identified changes in BTRC (decreased), IFNA1 (increased), and IL9 (increased) in PD versus SD patients (p<0.05). Patients treated ≥12M exhibited increased activated HLA-DR Th2 cells (p<0.05) and decreased exhausted B cells and NK cell subsets (p<0.05). Principal component and hierarchical clustering analyses identified distinct immune profiles associated with RECIST1.1 and therapy duration, underscoring immune profiling’s role in understanding treatment responses. These findings support further research into immune monitoring for future clinical trials.
1 Introduction
Soft tissue sarcomas (STS) are a rare and heterogeneous group of diseases. STS comprise over 50 distinct histologic subtypes and represent over 1% of solid tumors1-3. This group of diseases affects patients of all ages and can occur anywhere in the body. In addition to their heterogeneity in terms of histology and anatomical localization, STS are highly heterogeneous in terms of molecular characteristics and prognosis (1–3). The standard treatment for localized STS is surgical resection with or without radiotherapy. For locally inoperable or metastatic disease, single-agent anthracycline (4–6) and trabectedin (7, 8) are the first line and second-line treatments, respectively.
Anthracyclines are among the most effective anti-cancer drugs ever developed. Belonging to the anthracycline family, doxorubicin was proved to be active against this group of diseases and changed the therapy for STS patients, whose prognosis was extremely poor (9). Its ability to intercalate the DNA, leading ultimately to cell death, is the primary mechanism responsible for doxorubicin anti-cancer activity. However, the exact mechanism of action is still uncertain (10, 11).
Trabectedin (Yondelis®, PharmaMar, Madrid, Spain), initially isolated from the ascidian Ecteinascidia turbinate, is a tetrahydroisoquinoline alkaloid now prepared synthetically (12). Like anthracyclines, trabectedin is also a DNA-binding agent. However, the mechanism of action of trabectedin appears to be distinct from the other DNA-damaging drugs available and functions as an immunomodulatory drug (12, 13). Trabectedin exhibits antitumor activity in soft tissue sarcomas by targeting tumor-associated macrophages, selectively depleting pro-tumoral macrophages while sparing anti-tumoral ones, thus altering the tumor microenvironment (14).
Despite the remarkable improvement in STS diagnosis and treatment, their rarity and diversity result in a challenging diagnosis as well as a limited response to therapy (15, 16). Moreover, the lack of effectiveness of current therapies can also be attributed to the complexity of the tumor microenvironment (TME) that comprises different populations of non-tumor cells, including immune cells.
With the development of immunotherapy, the assessment of the immunological status of cancer patients is growing in importance since the immune cells and the mediators of the immune response may represent potential immunotherapeutic agents or targets, or potential biomarkers for an accurate prognosis and to monitor the response to therapy.
Although initially STS were simply classified as ‘non-immunogenic’ tumors, studies have proved that this characterization does not apply to all (17). Indeed, different TME compositions have been found in STS patients, and some of them exhibited an elevated infiltration of immune cells and immune-related factors. Furthermore, the TME has also been associated with patient prognosis and could predict the patient’s response to therapy (17, 18).
Despite these advances, the rarity and heterogeneity of STS make TME evaluation challenging, often requiring invasive biopsies that limit the availability of samples and longitudinal studies. Peripheral immune status assessment through blood biomarkers offers a minimally invasive alternative, enabling dynamic immune monitoring. Systemic inflammatory indices, such as the lymphocyte-to-monocyte ratio (LMR) and neutrophil-to-lymphocyte ratio (NLR), have emerged as significant prognostic markers in STS (19). Elevated LMR has been associated with improved clinical outcomes, serving as a reliable predictor of treatment response and overall survival in STS patients (20). In contrast, a low LMR correlates with worse prognosis, reflecting an imbalance in immune homeostasis and a pro-tumor inflammatory environment. LMR has been shown to improve predictive accuracy and clinical outcomes in STS patients, highlighting its potential for aiding treatment stratification. Similarly, NLR has been found to be significantly associated with survival in synovial sarcoma patients, underscoring its prognostic importance (21). Furthermore, systemic inflammatory indices in STS patients treated with trabectedin identified LMR as a crucial marker linked to improved treatment responses (22). These findings emphasize the clinical value of inflammatory indices as minimally invasive biomarkers to predict treatment efficacy and patient outcomes in STS management.
Further research has identified correlations between immune cell subsets, such as T cells and natural killer (NK) cells, with patient outcomes. For example, increased myeloid-derived suppressor cells (MDSCs) in the blood of STS patients have been linked to reduced NK cell function and poor prognosis (23–25). Similarly, alterations in immune-related genes and soluble factors have been shown to reflect immune dysregulation in STS (26, 27). Recently, our group demonstrated the benefits of using deep imunophenotyping, transcriptomic analysis, and soluble proteomics to identify peripheral immune biomarkers and signatures associated with survival in soft tissue sarcoma (28).
Despite these promising findings, the results are often inconsistent due to variations in patient cohorts, therapies, and methodologies (29). Therefore, further studies integrating multi-parametric immune profiling are essential to better understand the immunological landscape of STS and develop immune-based prognostic tools and therapies.
The aim of this study was to assess the peripheral immunological status, including the immune cells, immune-related genes, immune-related soluble factors, and immune checkpoints of STS patients, characterizing the STS patients with a better response to trabectedin therapy. Immune monitoring revealed key markers, including decreased eosinophils, Th2 cells, and dendritic cells in patients with disease progression, along with significant gene expression changes (BTRC, IFNA1, IL9). Additionally, prolonged therapy (>12 months) was linked to alterations in specific immune subsets, such as activated NK cells and HLA-DR-positive T cells, highlighting potential biomarkers of response.
2 Material and methods
2.1 Study design
This was a non-interventional, prospective study where trabectedin was administered according to the summary of product characteristics (SmPC) in the local language. There was no involvement with any treatment decisions for the patients included in the study. The choice of therapy was made prior to the patient’s inclusion in the study. Treatment administration was independent of and dissociated from participation in the study.
2.2 Selection criteria
Patients meeting the inclusion criteria were invited to participate in the study. Before any study-specific data was recorded, patients were provided with all the study details prior to their decision to participate and were requested to sign an informed consent form (ICF) prior to their participation in the study.
2.2.1 Inclusion criteria
Patients had to comply with all the criteria to be enrolled in the study. They had to be 18 years or older and have histologically proven STS. The patients needed to have advanced STS and measurable disease. A baseline tumor evaluation for RECIST 1.1 (30) and/or Choi criteria must have been performed, with assessments completed by available methods. The baseline imaging procedure should have been the one conducted within 30 days prior to the initial trabectedin administration (first treatment cycle) or the earliest imaging following the start of trabectedin therapy, and this baseline image had to be available. Patients must have completed at least one cycle of trabectedin according to the SmPC before being included in the study. They were required to have been currently receiving trabectedin as per the SmPC, treated according to the indication in line with the local label and reimbursement for trabectedin treatment, and demonstrate evidence of adequate end-organ function as outlined in the SmPC. Lastly, patients must have signed an ICF, acknowledging that they understood the purpose and procedures of the study and were willing to participate.
2.2.2 Exclusion criteria
Patients who met any of the following criteria were excluded from participating in the study: those with contraindications for the use of trabectedin as defined in the SmPC, those currently receiving any other therapy for STS, those who had not recovered from prior treatment-related toxicity (except for alopecia), and those undergoing a rechallenge of trabectedin.
2.3 Study samples
Peripheral blood samples and clinical data were collected at the Tumor Unit of the Locomotor Apparatus (UTAL) - Orthopedic Service from Coimbra Hospital and Universitary Centre (CHUC), Portugal, from June 2019 to December 2022.
This work follows the World Medical Association’s Helsinki Declaration for human-subject research. All the volunteers agreed and signed informed consent to participate. The present study was approved by the Service Directors, the Ethical Committee (CHUC-021-19 from 30 May 2019), and the Administration Board of the Coimbra Hospital and Universitary Centre (CHUC), Coimbra, Portugal.
The study group consisted of 22 patients with STS treated with Trabectedin (Yondelis®, PharmaMar, Madrid, Spain), and the demographic and clinical-pathological characterization at baseline are presented in Table 1. Samples were collected 42 ± 34 months after diagnostic and STS patients were followed for an average of 15 ± 2 months.

Table 1. Baseline characteristics of Soft Tissue Sarcoma (STS) patients enrolled in the study.
Histologic classification at baseline according to the International Classification of Diseases for Oncology, Third Edition (ICD-O-3) is presented in Figures 1A, B.
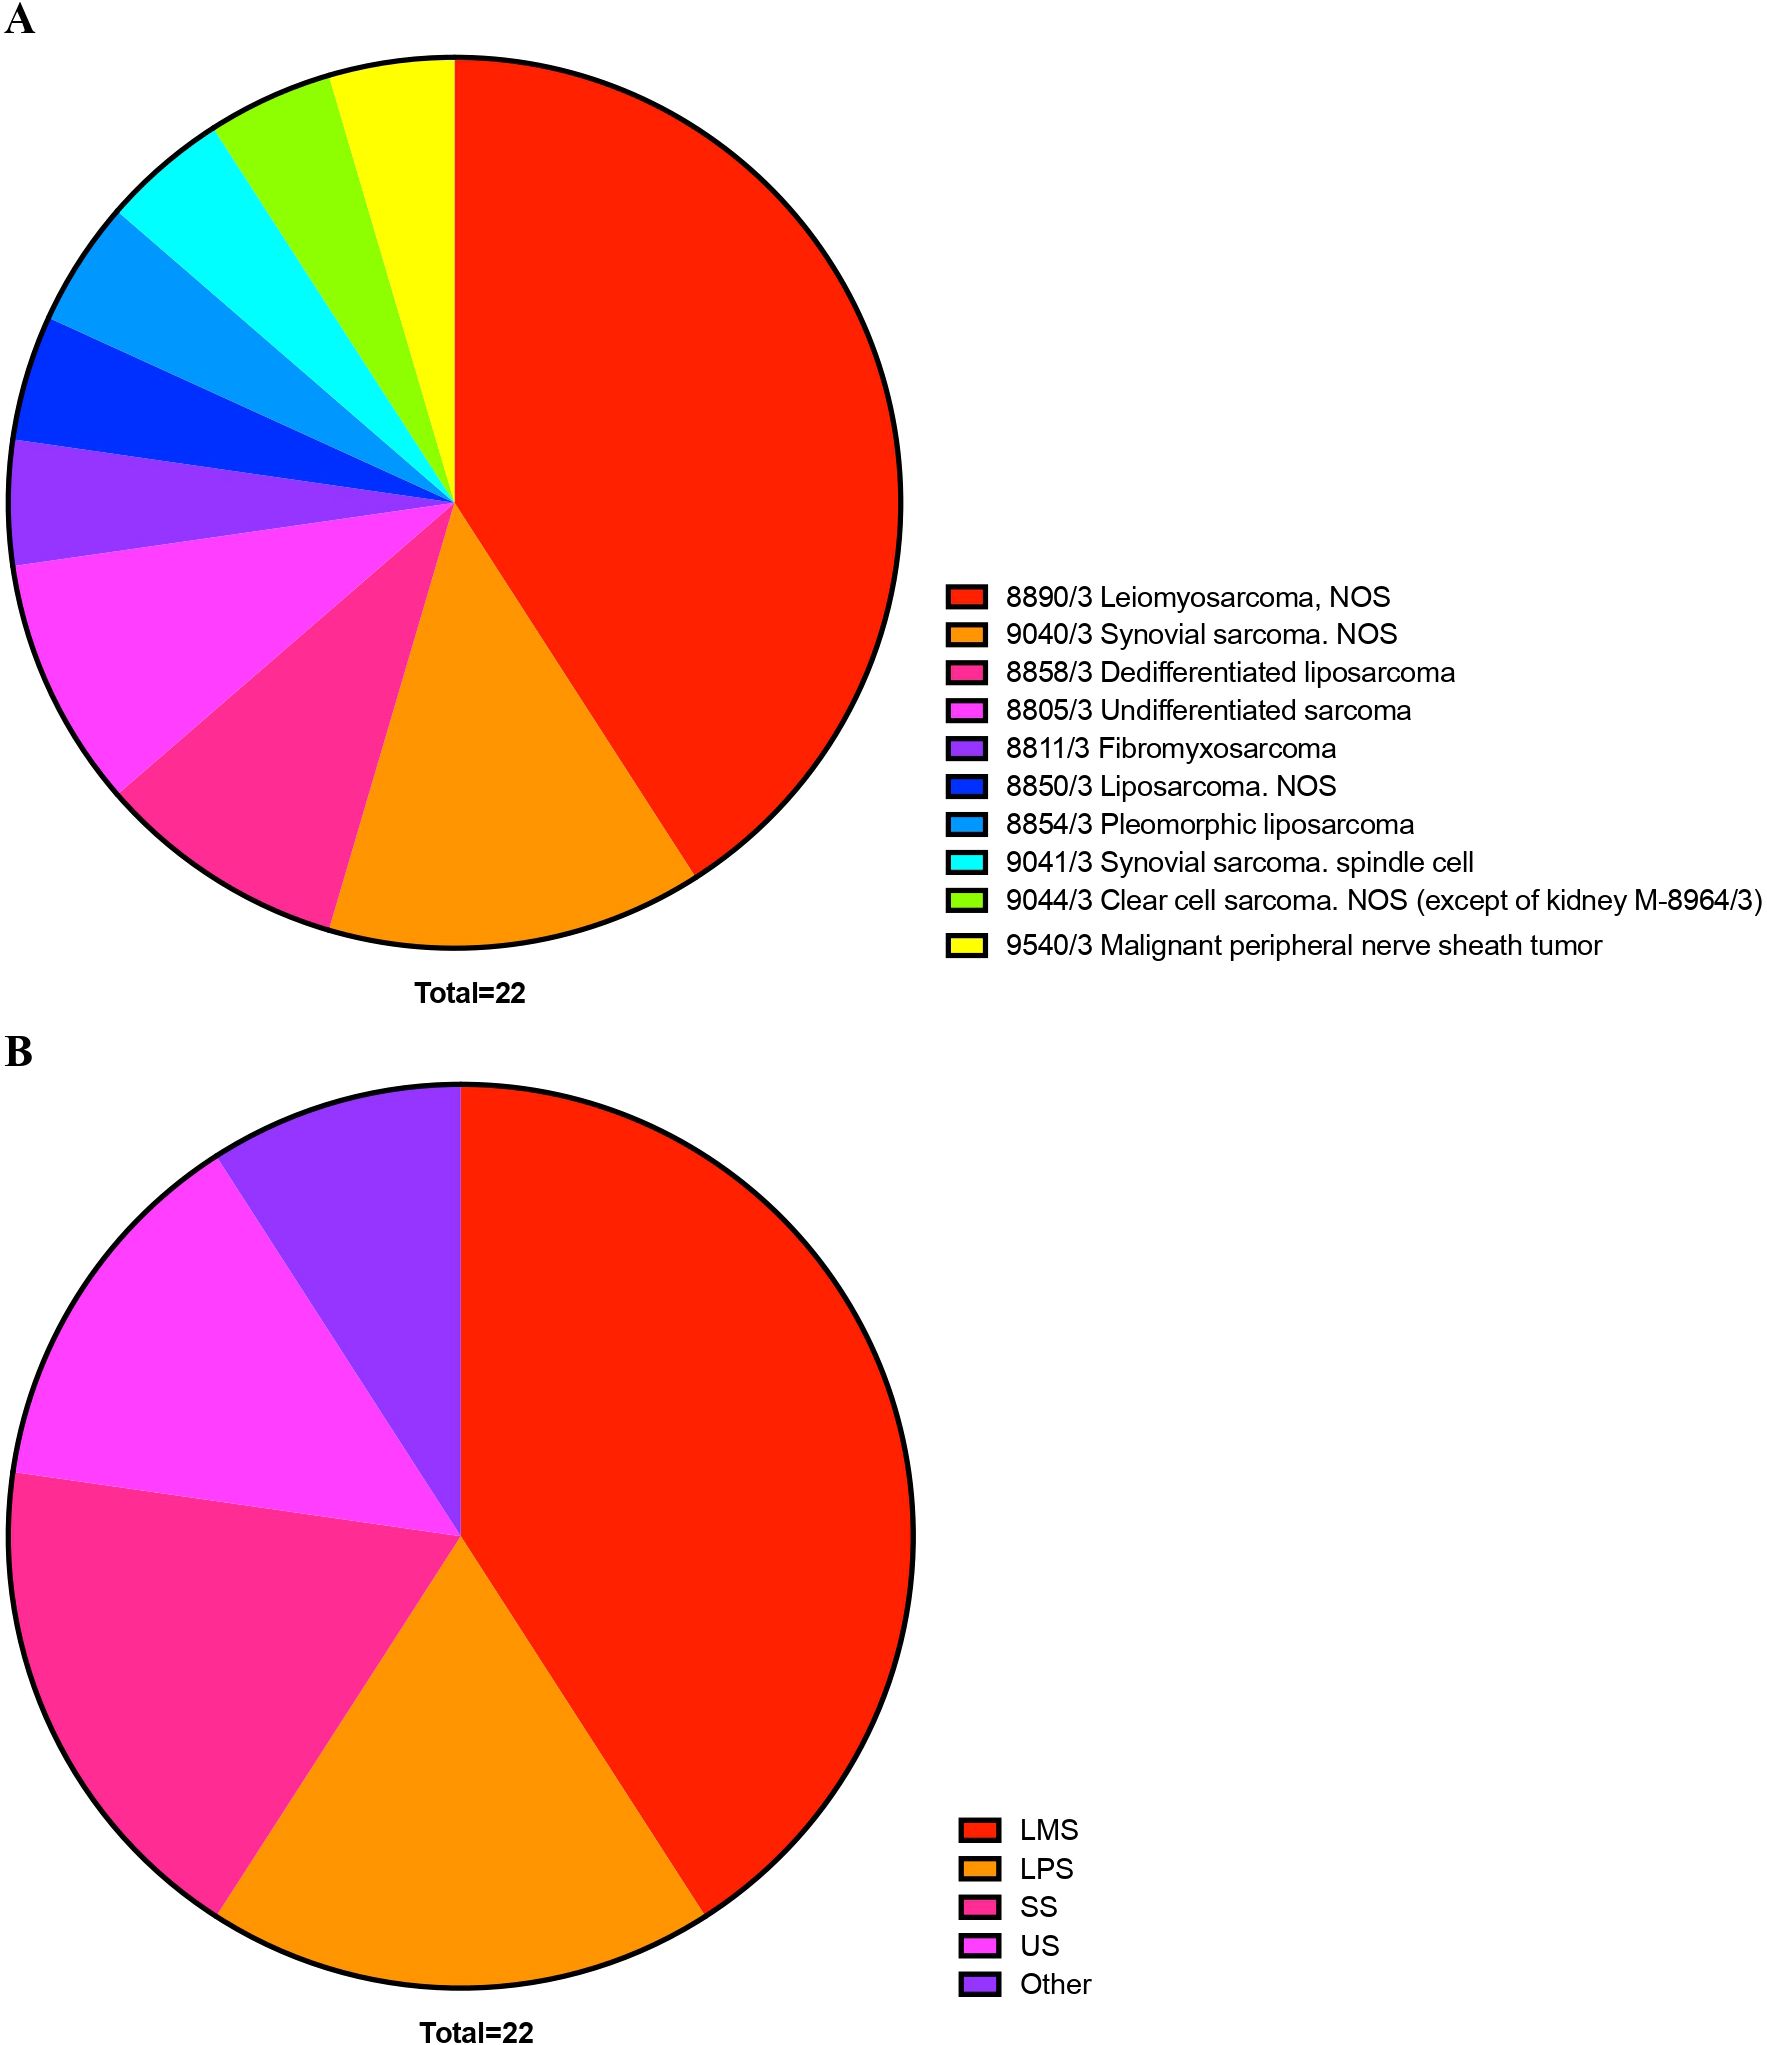
Figure 1. Distribution of Soft Tissue Sarcoma patients participating in the study, according to histology (A) and histology group (B), following to the International Classification of Diseases for Oncology, Third Edition (ICD-O-3).
2.4 Immunophenotyping
Blood samples were drawn at the baseline, after cycle 1 and subsequent visits, and during the follow-up period. Peripheral blood samples collected into EDTA were counted with a hematological counter (DxH500, Beckman Coulter, Pasadena, CA, USA). Whole blood, 100 µL of or up to 1 x 10⁶ cells, were incubated with a panel of monoclonal antibodies (Supplementary Files S1, S2) (31, 32) for 15 minutes in the dark at room temperature. Then, red blood cells were lysed with BD Lysing Solution 1x (BD Biosciences, San Jose, CA, USA) for 10 minutes in the dark. The cell suspensions were centrifuged at 450 x g for 5 minutes, and the supernatants were discarded. The suspensions were washed with phosphate-buffered saline (PBS), and lastly, samples were acquired in a BD FACSCanto II eight-color flow cytometer (BD Biosciences, San Jose, CA, USA) using BD FACSDiva 6.0 software (Becton Dickinson, San Jose, CA, USA). Gating strategy for the analysis of T, B, NK cells, monocytes, dendritic cells, and myeloid-derived suppressor cells is presented as a supplement (Supplementary File S3). All the data were treated with FlowJo® v.10.7 (BD Life Sciences, Ashland, OR, USA).
2.5 Immune-related gene expression (real-time quantitative PCR)
Whole blood samples were collected into PAXgene® Blood RNA tubes (PreAnalytiX GmbH, Hombrechtikon, Switzerland), and RNA extracted using the PAXgene Blood RNA Kit (PreAnalytiX GmbH, Hombrechtikon, Switzerland) according to the manufacturer’s instructions. Purity of the RNA was assessed using a NanoDrop 2000 (ThermoFisher Scientific, Wilmington, DE, USA). Complementary DNA was synthesized with the iScriptTM Reverse Transcription Supermix for RT-qPCR (BIO-RAD, Hercules, CA, USA).
The real-time quantitative PCR was performed using iTaqTM Universal SYBR® Green Supermix (BIO-RAD, Hercules, CA, USA), according to the manufacturer´s instructions. In short, the optimized ready-to-use reaction master mix was combined with the forward and reverse primers for the gene of interest or reference genes (33). All oligonucleotide primer sequences are presented in Supplementary File S4. Then, equal aliquots were dispensed into the plate containing the cDNA samples and non-template controls to guarantee no unspecific amplifications. Lastly, the plates were incubated in a thermal cycler Roche LightCycler II 480 (Roche, Basel, Switzerland) previously programmed for: one pre-incubation cycle of 2 minutes at 95°C, 50 amplification cycles of 5 seconds at 95°C and one minute at 60°C, and a melt curve analysis (65-95°C). The results were analyzed with qBase+ v3.2 software (Biogazelle, Gent, Belgium).
2.6 Multiplex Analyte Profiling
The plasma was isolated from the whole blood, collected into EDTA tubes, centrifuged at 1250 x g for 10 minutes, and then stored at −20°C until analysis. Plasmatic levels of several cytokines, chemokines, growth factors, and immune checkpoints were measured using: ProcartaPlex Human Immune Monitoring 65-Plex Panel (Cat. Nr. EPX650-10065-901, Invitrogen), ProcartaPlex Human Immuno-Oncology Checkpoint Panel 1 14-Plex (Cat. Nr. EPX14A-15803-901, Invitrogen), ProcartaPlex Human Immuno-Oncology Checkpoint Panel 2 14-Plex (Cat. Nr. EPX140-15815-901, Invitrogen), and ProcartaPlex Human Immuno-Oncology Checkpoint Panel 3 10-Plex (Cat. Nr. EPX100-15820-901, Invitrogen), all from ThermoFisher Scientific, Waltham, Massachusetts, USA (Supplementary Files S5, S6). All the multiplex immunoassays were performed according to the manufacturer’s instructions and acquired on the Luminex® 100/200™ xMAP™ System (Luminex Corporation, Austin, Texas, USA). The run data were analyzed using the ProcartaPlex™ Analysis App (ThermoFisher Scientific, Waltham, Massachusetts, USA). The analytes with concentrations outside the limits of quantification were excluded from the analysis.
2.7 Statistical analysis
All statistical analyses and the graphs were performed and generated using GraphPad Prism 10.4.1 for Windows (GraphPad Software, San Diego, CA, USA). Multiple Mann-Whitney tests were used to compare the means between two groups. The data is presented as mean ± standard deviation, and a value of p < 0.05 was considered statistically significant. For the visualization of clusters of multivariate data, we used the Principal Component Analysis (PCA) and heatmaps, accessed online from ClustVis (34) (https://biit.cs.ut.ee/clustvis). In the PCA analysis, the original values were ln(x+1)-transformed, unit variance scaling was applied to rows, and singular value decomposition (SVD) with imputation was used to calculate the principal components. The X and Y axes show principal component 1 and principal component 2 that explain the percentages indicated of the total variance. Prediction ellipses are such that with a probability of 0.95, a new observation from the same group will fall inside the ellipse. For the heatmaps, the original values are also ln(x+1)-transformed, rows are centered, unit variance scaling is applied to rows, imputation is used to estimate missing values, and both rows and columns are clustered using Manhattan distance and Ward (unsquared distances) linkage. Clustering distances were obtained using Pearson correlation subtracted from 1. The Ward linkage method was calculated using the sum of squared differences from points to centroids as the distance. For the OS analysis, we used the Kaplan-Meier survival analysis. OS time was defined as the time from the sample harvest to the date of death or the date of the last follow-up (censored patients). The Kaplan–Meier curves were performed in IBM SPSS statistics version 26.0 (IBM Corp., Armonk, NY, USA).
2.8 Bioinformatic analyses
Clinical, genomic, and transcriptomic data from 206 primary sarcoma samples in The Cancer Genome Atlas (TCGA) were analyzed using CBioPortal v6.0.22 (35). The dataset ‘Adult Soft Tissue Sarcomas’ (36) was selected, and 174 soft tissue sarcoma samples were included in the survival analysis, excluding those without complete genomic and expression data, as well as uterine sarcoma and nerve sheath tumor samples. CBioPortal was additionally utilized to visualize data from the TCGA sarcoma cohort, retrieve patient clinical information, and access genomic and transcriptomic data.
3 Results
3.1 Progression-free survival and duration of trabectedin therapy
The primary goal of this study was to analyze progression-free survival (PFS) in STS patients treated with trabectedin using RECIST1.1). Distribution of the STS participants is shown in Figure 2A. Stable disease (SD) was achieved for 68.2% (15/22) of STS patients treated with Trabectedin. Progression disease (PD) was observed in 31.8% (7/22) of the patients.
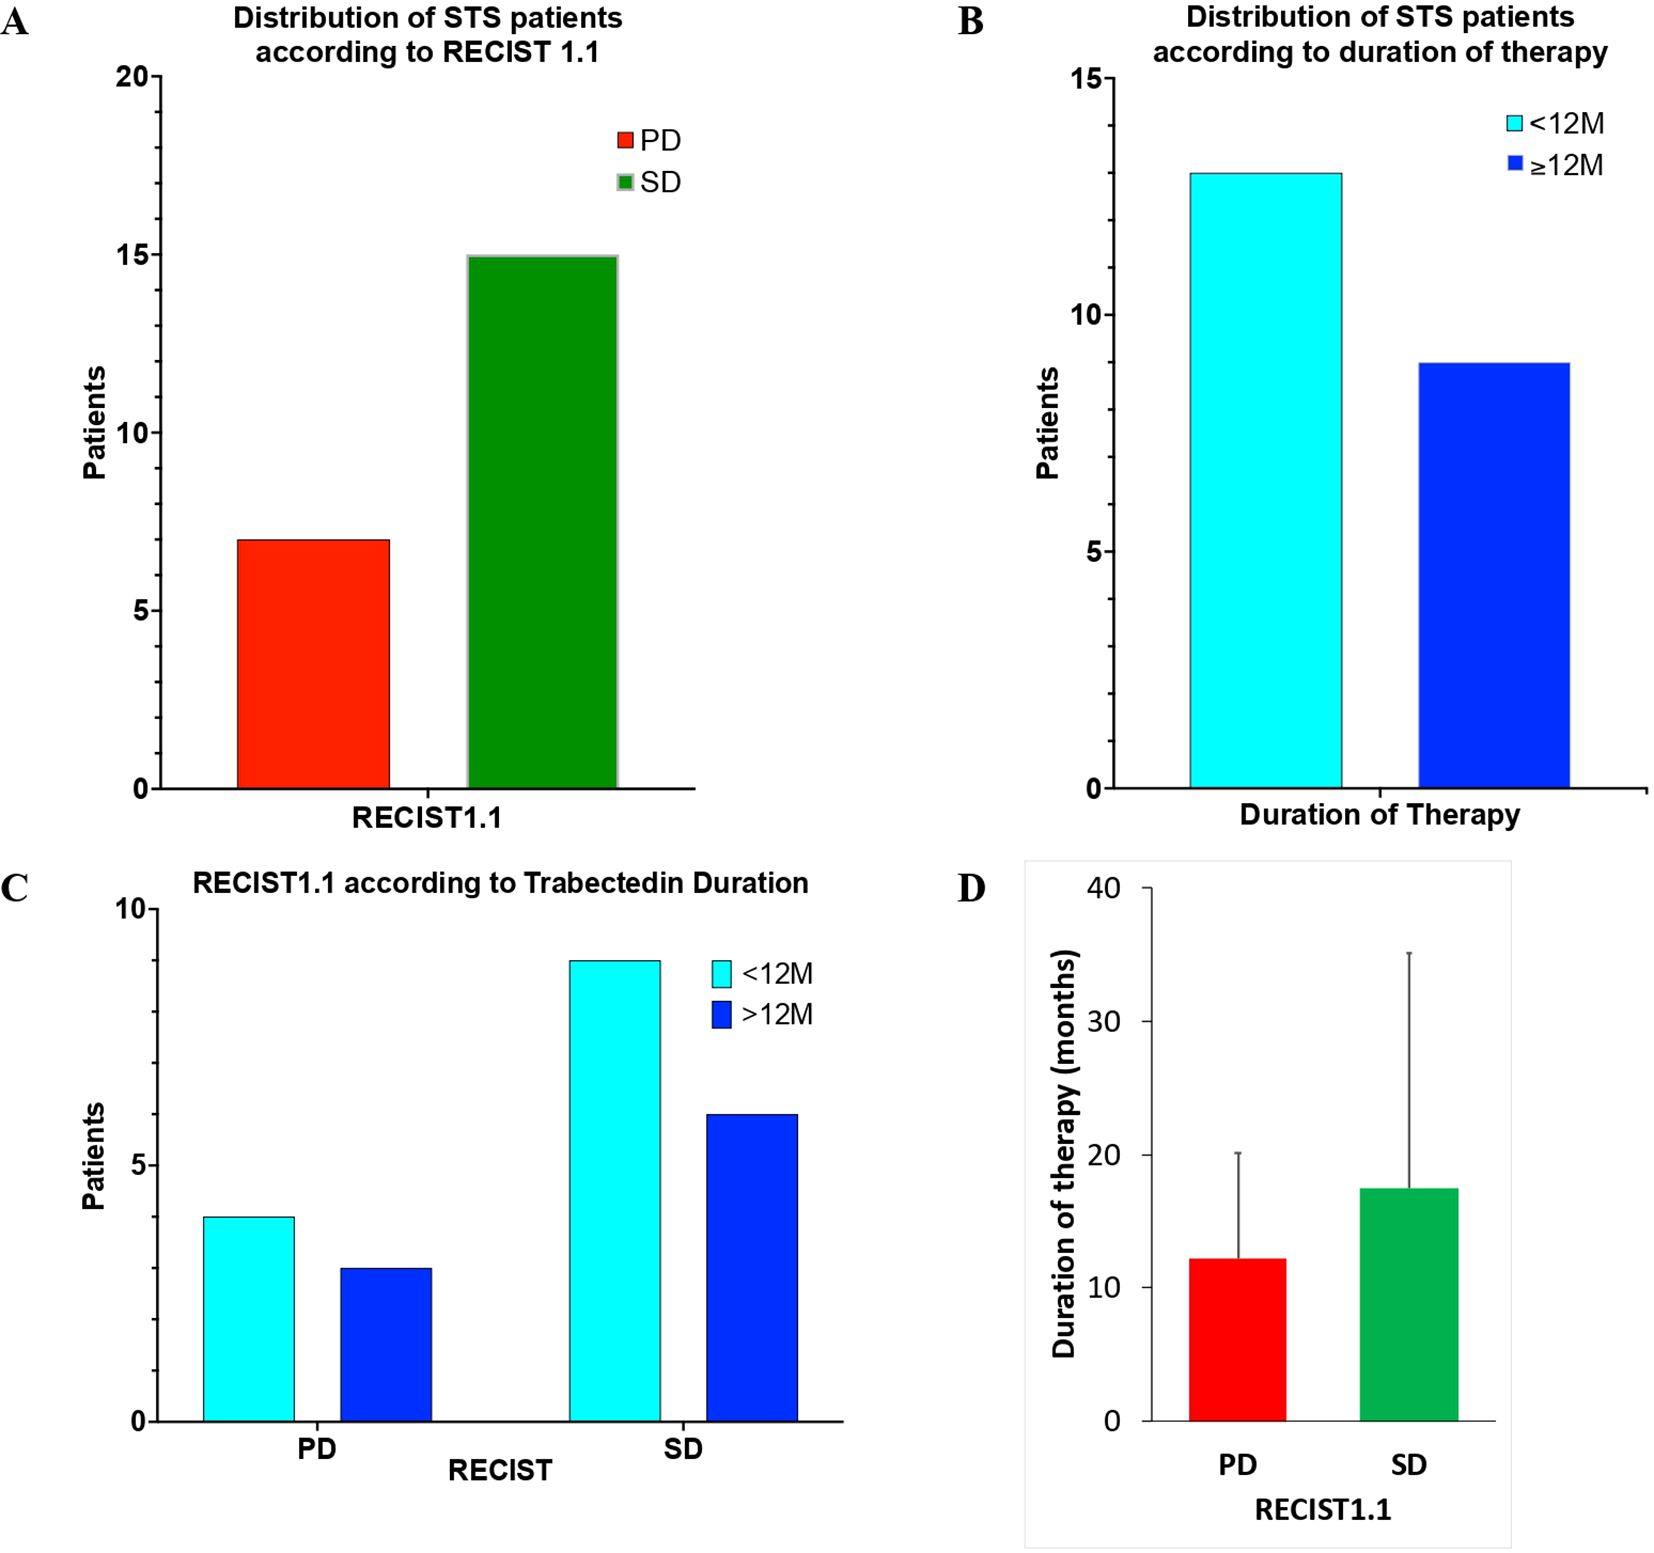
Figure 2. Distribution of Soft Tissue Sarcoma patients of the study according to RECIST1.1 (A); duration of trabectedin therapy (B); RECIST1.1 according to duration of Trabectedin therapy (C); and duration of trabectedin therapy (in months) according to RECIST1.1 (D).
In addition, the duration of Trabectedin was also analyzed (Figure 2B). Patients with less than 12 months (<12M) of Trabectedin therapy represented 59.1% (13/22) and those with 12 or more months (≥12M) were 40.9% (9/22).
The analysis of the combined distribution of RECIST1.1 and duration of Trabectedin therapy is presented in Figures 2C, D. No statistically significant difference (two-sided Mann-Whitney test, p=0.6667) was observed for RECIST1.1 according to duration of Trabectedin therapy.
Progression-free survival (PFS), as measured by RECIST1.1 is present in Figure 3. A significant increase (p=0.0154) is observed for STS patients that achieve stable disease (SD) under Trabectedin therapy when compared with those that were classified with progression disease (PD).
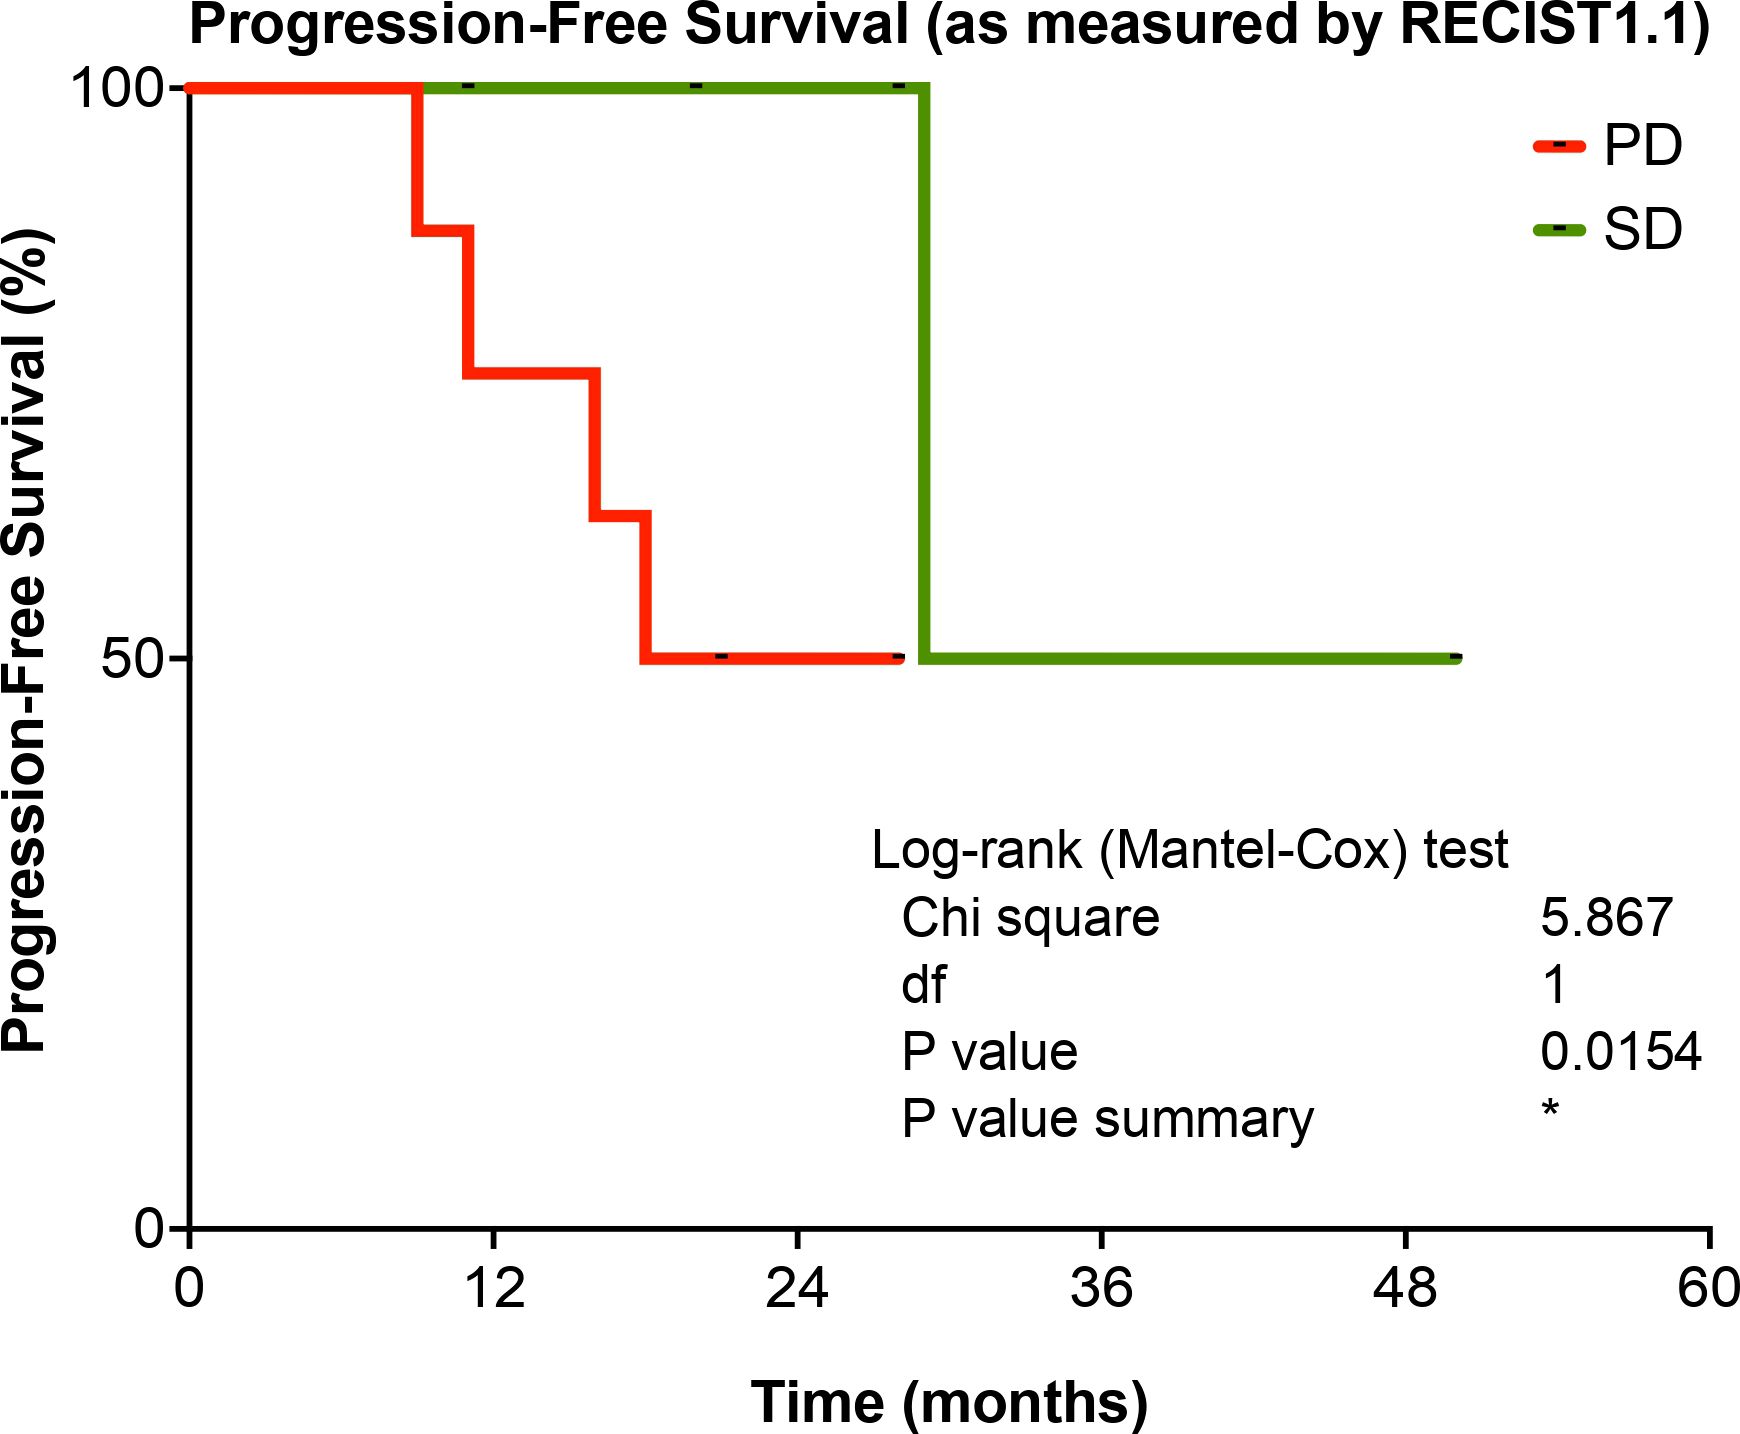
Figure 3. Progression-Free Survival (PFS) according to therapy response according to RECIST1.1, for STS patients in the study. PD, Progression Disease; SD, Stable Disease. *p-value < 0.05.
PFS according to duration of Trabectedin therapy is present in Figure 4. No significant difference (p=0.5433) was observed for STS patients according to duration of Trabectedin therapy, when comparing those with less than 12 months (<12M) with STS patients that underwent treatment for 12 months or more (≥12M).
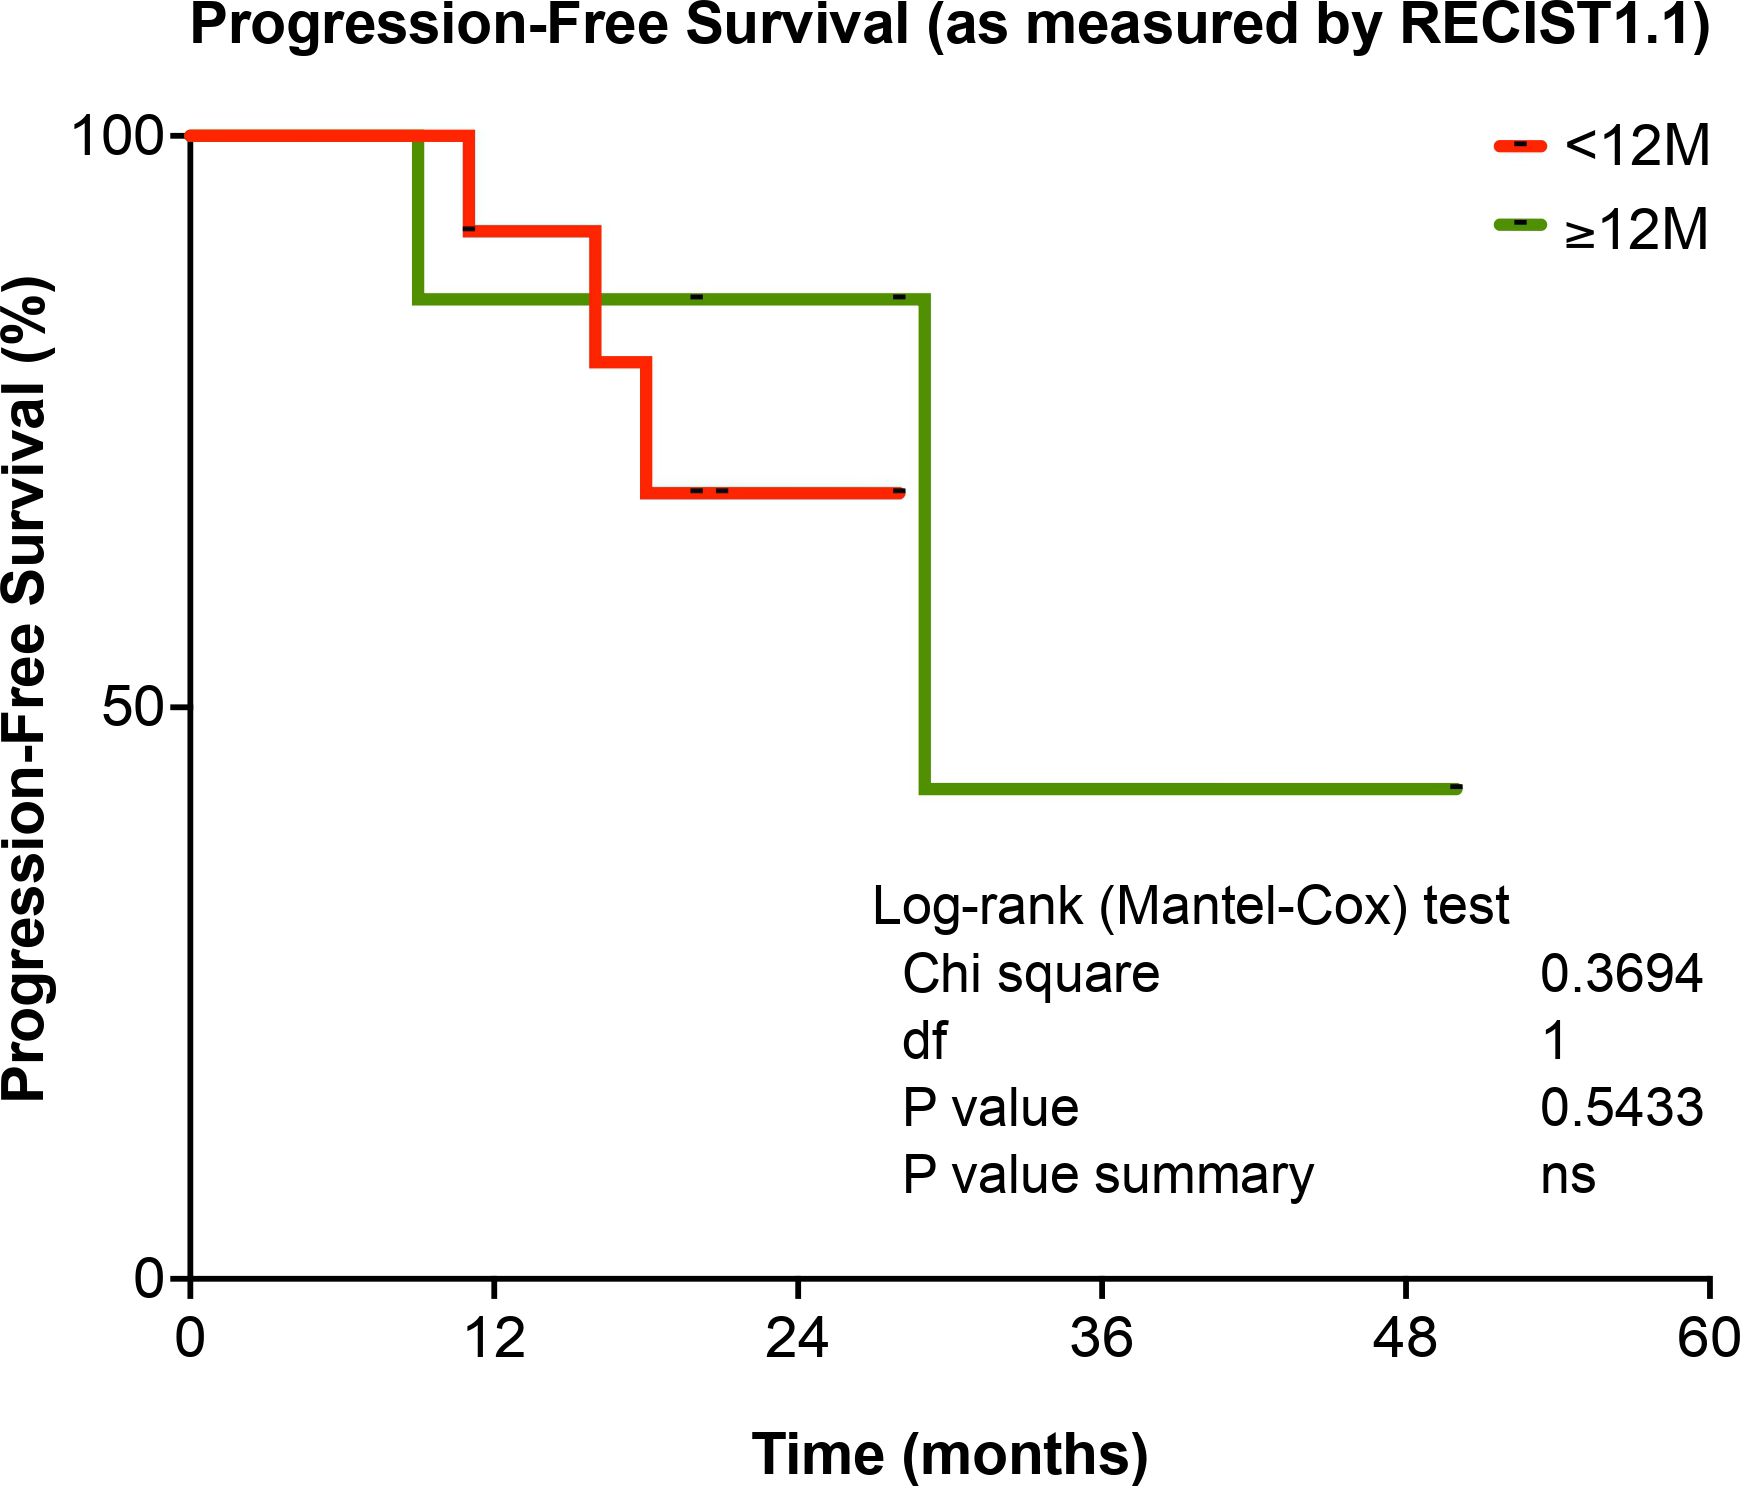
Figure 4. Progression-Free Survival (PFS), according to duration of Trabectedin therapy, for STS patients in the study. <12M, Trabectedin therapy for less than 12 months; ≥12M, Trabectedin therapy for 12 or more months. ns, non-significant.
3.2 Immune monitoring of trabectedin therapy in refractory soft tissue sarcoma patients
In the present study, one of the aims was the immune monitoring of Trabectedin therapy in refractory STS patients to establish additional efficacy parameters of different therapeutic strategies.
Using complementary approaches to characterize the peripheral immune response of STS patients to Trabectedin therapy, deep immunophenotyping (more than 200 immune cell parameters), immune-related gene expression profiling (103 genes), and soluble proteome analysis (99 analytes including cytokines, chemokines, growth factors, and soluble immune checkpoints) were performed for this study.
3.2.1 Immune monitoring of trabectedin therapy and progression-free survival
A scatterplot (volcano plot) was used to quickly identify changes in the large data set composed of replicate data obtained with this project. In Figure 5, a volcano plot of STS patients, according to RECIST1.1, shows the significance vs. fold change (mean rank difference) on the y and x axes, respectively. Comparisons of PD vs. SD are presented for complete blood count (CBC), immunophenotyping (IPT), immune-related gene expression (GXP), and soluble proteome (xMAP).
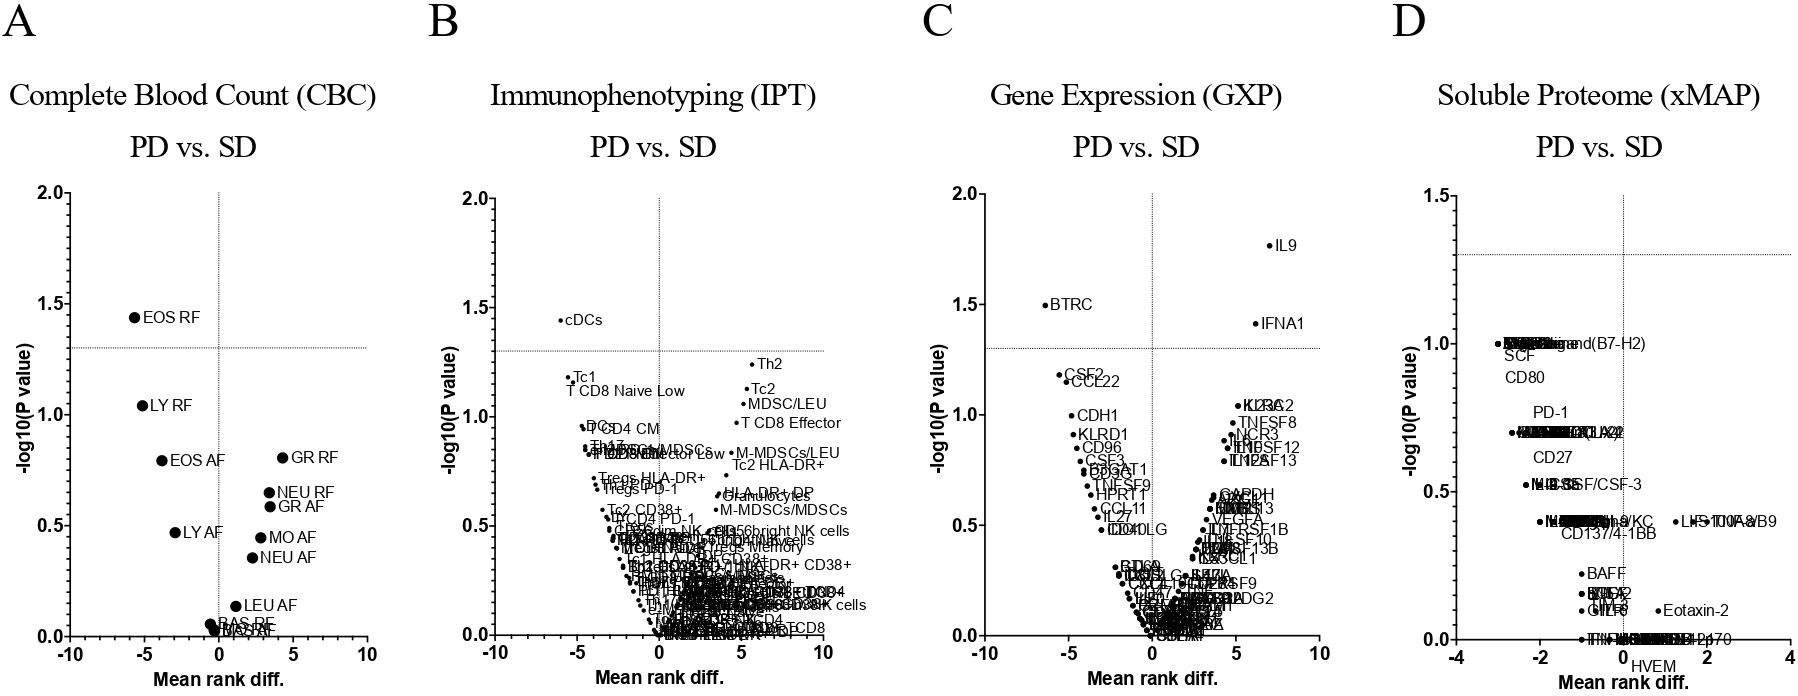
Figure 5. Volcano plots of Soft Tissue Sarcoma patients according to RECIST1.1. Comparisons of PD vs. SD for Complete Blood Count (A), Immunophenotyping (B) Immune-Related Gene Expression (C) and Soluble Proteome (D). CBC, Complete Blood Count; IPT, Immunophenotyping; GXP, Gene Expression; xMAP, x Multi-Analyte Profiling; PD, Progression Disease; SD, Stable Disease.
Complete Blood Count revealed that the relative frequency of eosinophils was found significantly decrease (p <0.05) in PD patients when compared to SD patients (Figure 5A).
Immunophenotyping (Figure 5B) showed an increase (p=0.0576) for type 2 helper T cells (Th2) (Figure 6A) and a decrease (p=0.0362) for cDCs (Figure 6B).
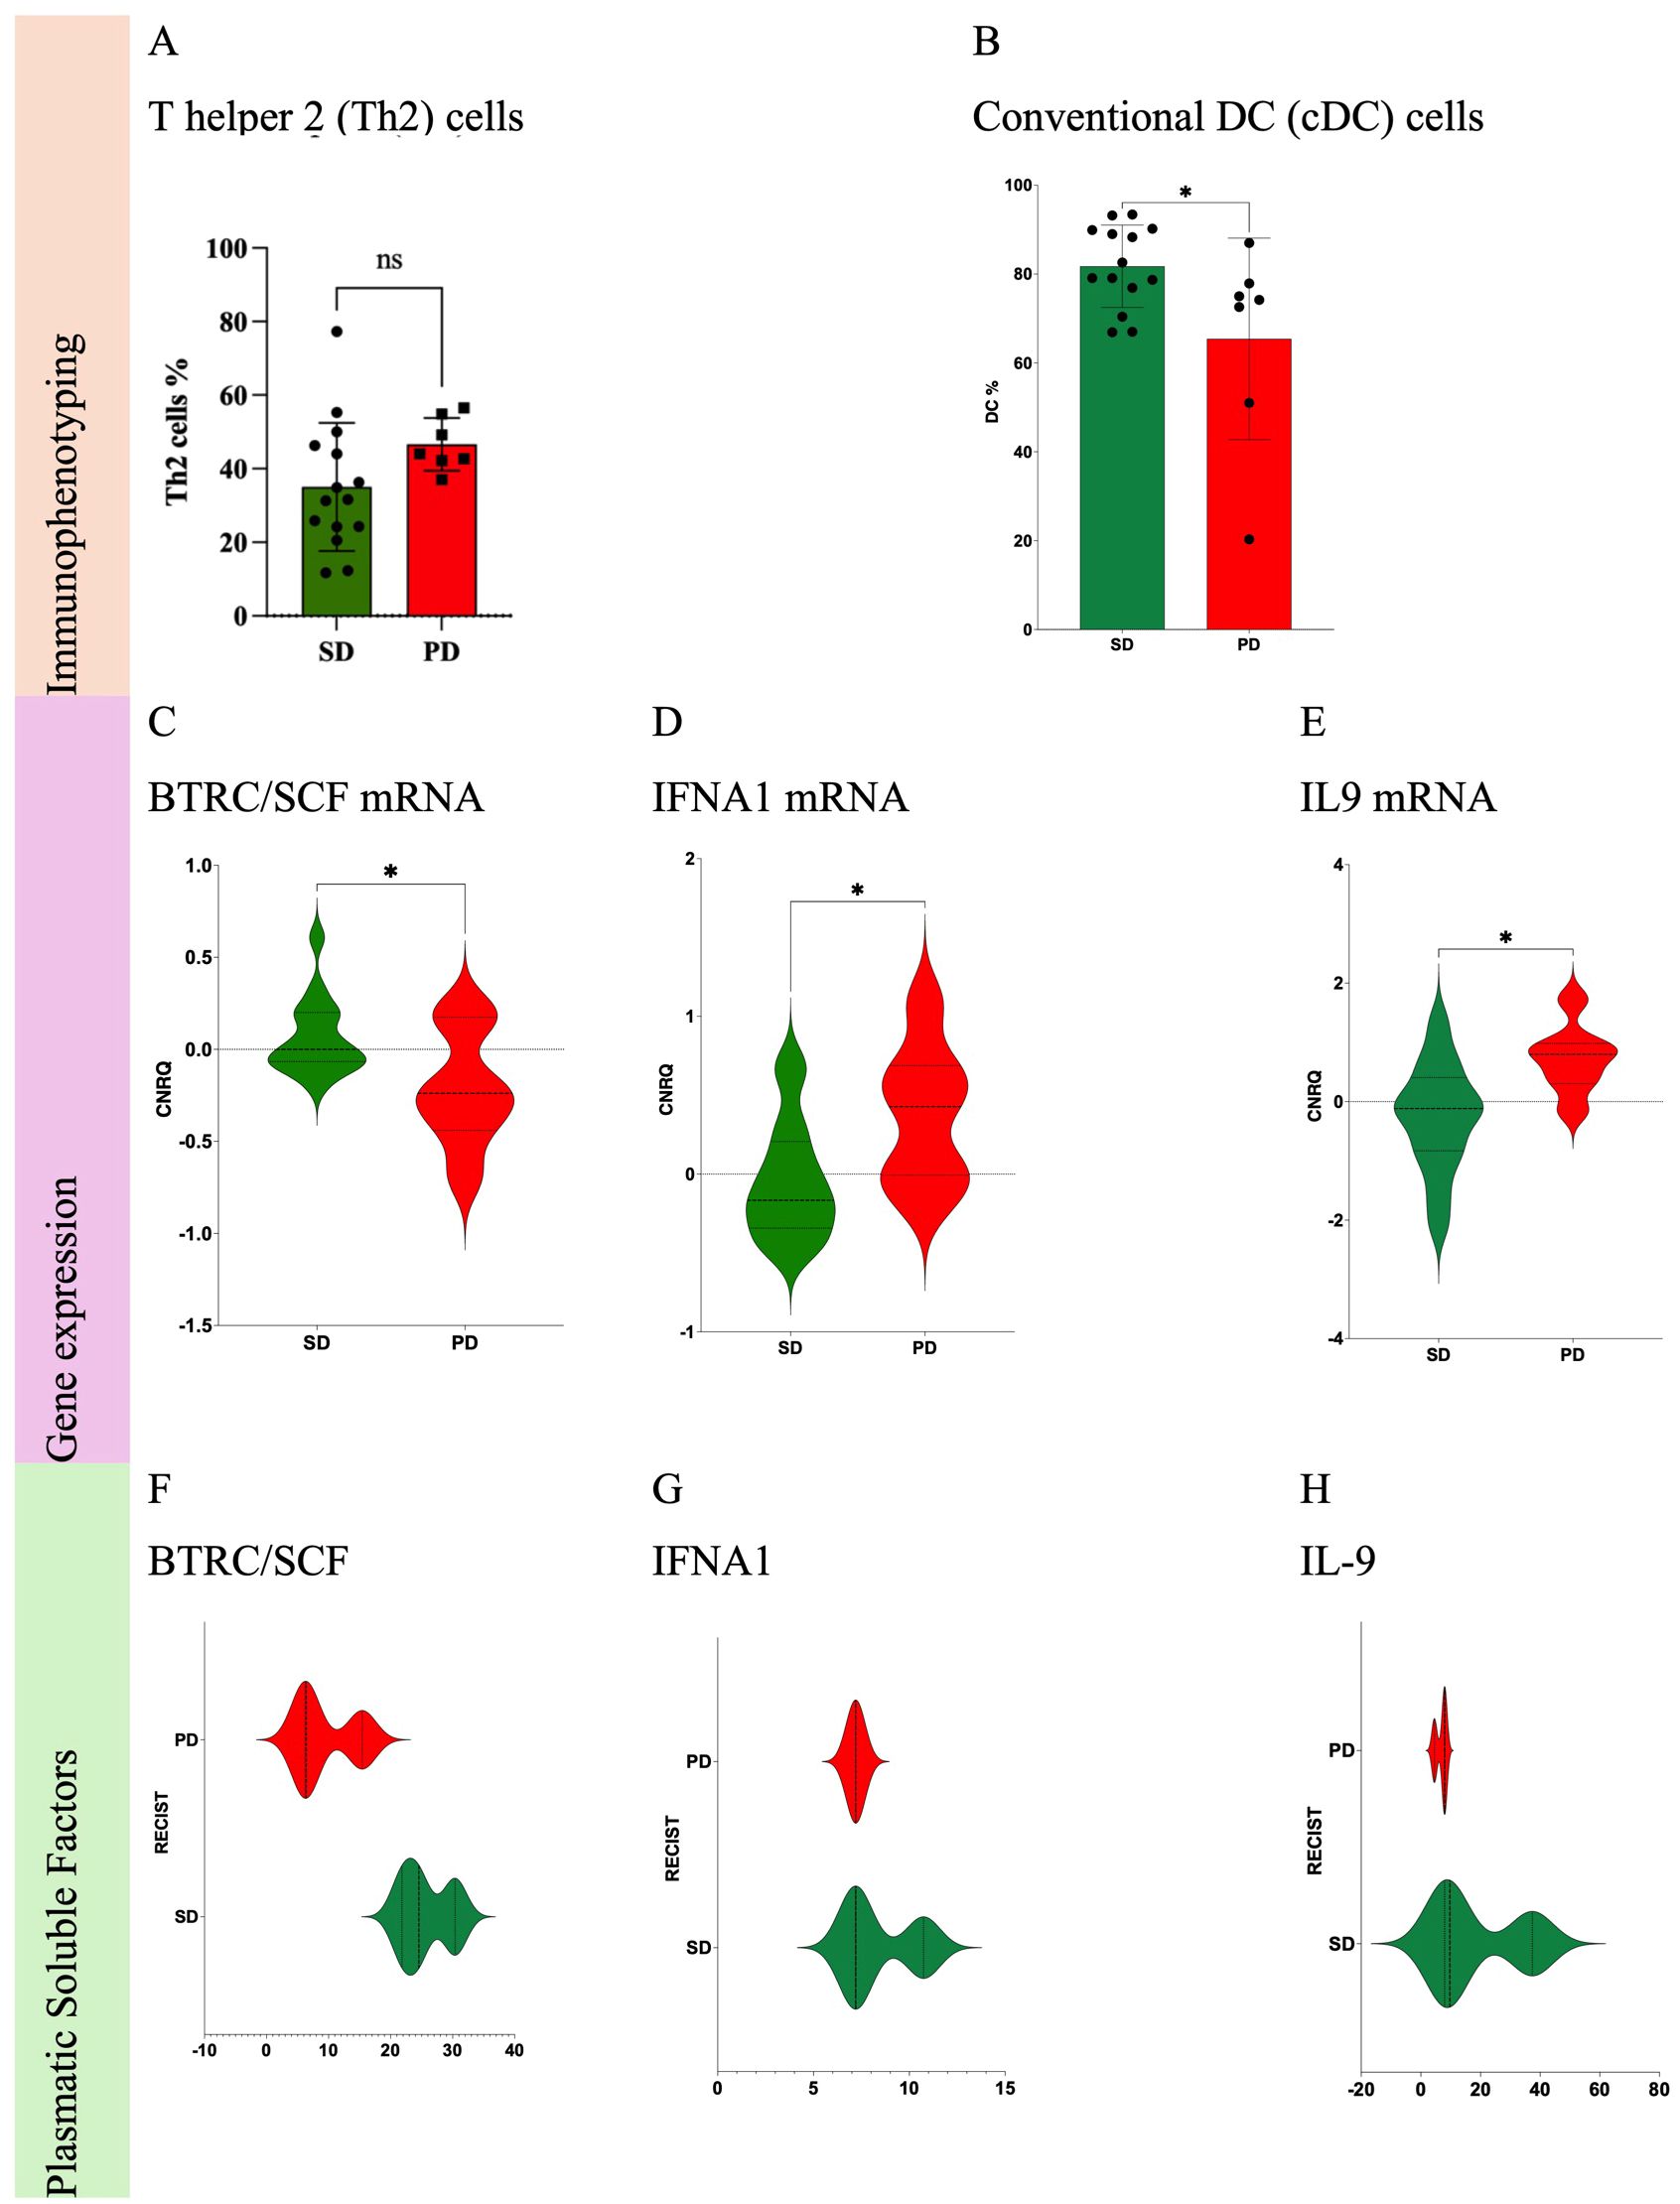
Figure 6. Statistically significant differences of immune cells from Soft Tissue Sarcoma patients according to RECIST1.1. Comparisons of PD vs. SD for immune cells: Th2 cells (A) and cDC (B). Comparisons of PD vs. SD for immune-related gene expression: BTRC/SCF mRNA (C), IFNA1 mRNA (D) and IL9 mRNA (E). Comparisons of PD vs. SD for plasmatic soluble factors: BTRC/SCF (F), IFNA1 (G) and IL9 (H). PD, Progression Disease; SD, Stable Disease; *p-value < 0.05. ns, non-significant.
Immune-related gene expression profiling (Figure 5C) allowed the identification of 3 genes with significant differences (p <0.05) when comparing PD vs. SD patients: decrease of beta-transducin repeat containing (BTRC) gene, Figure 6C; increase of interferon alpha-1 (IFNA1), Figure 6D; and interleukin 9 (IL9) genes, Figure 6E.
Soluble proteome analysis (Figure 5D) disclosed any association (Figures 6F-H) of the 99 targets with PFS, as measured by RECIST1.1.
3.2.2 Immune monitoring and duration of trabectedin therapy
In Figure 7, a volcano plot compares STS patients treated with Trabectedin therapy for less than 12 months (<12M) with those with 12 months or more (≥12M) for complete blood count (CBC), immunophenotyping (IPT), immune-related gene expression (GXP), and soluble proteome (xMAP).
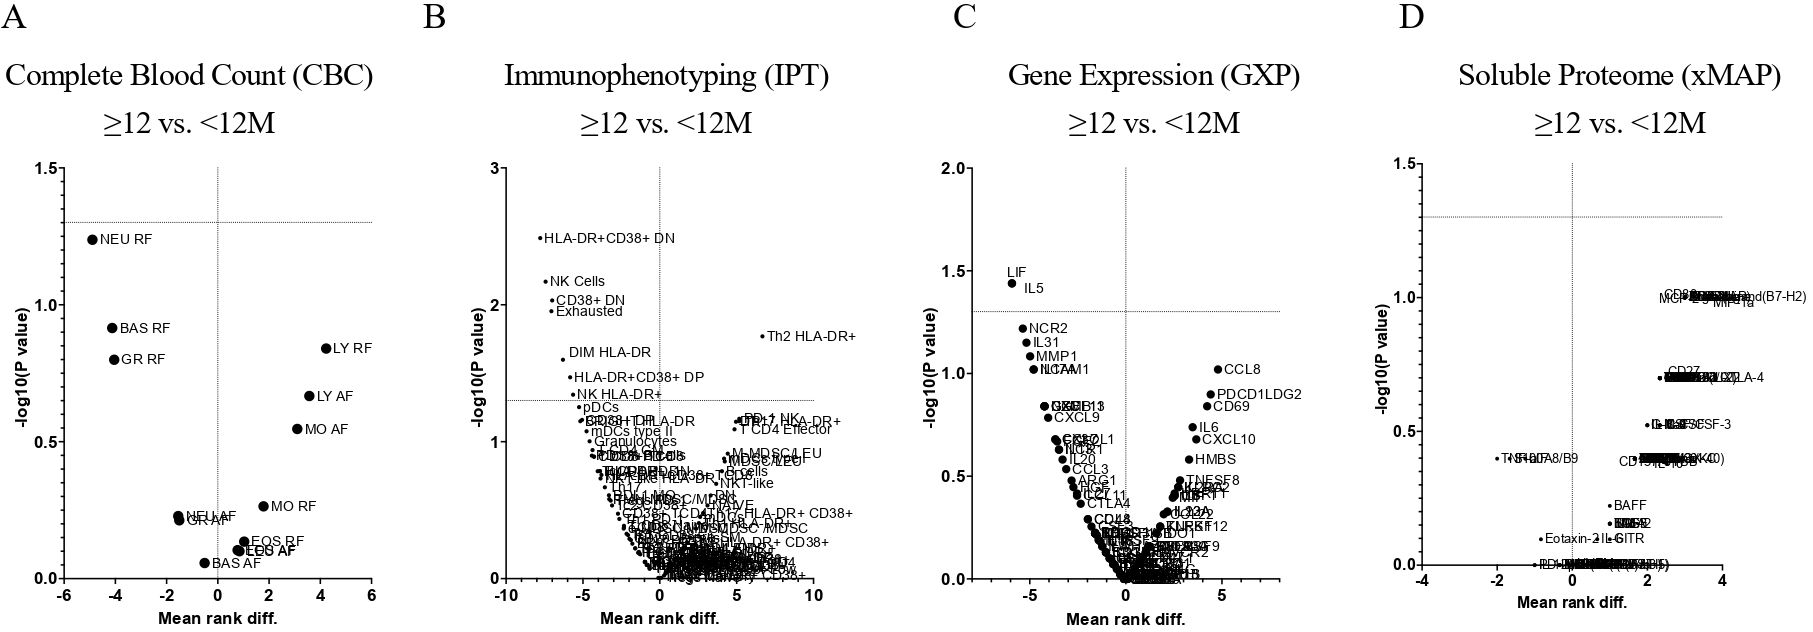
Figure 7. Volcano plots of Soft Tissue Sarcoma patients according to Trabectedin therapy duration in months. Comparisons of <12M vs. ≥12M for Complete Blood Count (A), Immunophenotyping (B) Immune-Related Gene Expression (C) and Soluble Proteome (D). CBC, Complete Blood Count; IPT, Immunophenotyping; GXP, Gene Expression; xMAP, x Multi-Analyte Profiling; <12M, Trabectedin therapy for less than 12 months; ≥12M, Trabectedin therapy for 12 or more months.
Complete Blood Count revealed (Figure 7A) no significant decrease (p > 0.05) in STS patients treated with Trabectedin for less than 12 months (<12M) when compared to those with 12 or more months (≥12M).
Immunophenotyping (Figure 7B) showed a significant decrease (p <0.05) for exhausted B cells, CD19+ CD20+ IgD- CD27-, (Figure 8A), activated CD38 double-negative (DN) T cells, CD3+ CD4- CD8- CD38+, (Figure 8B), activated HLA-DR CD38 DN T cells, CD3+ CD4- CD8- HLA-DR+ CD38+, (Figure 8C), Natural Killer (NK) cells, CD3- CD56+, (Figure 8D), activated HLA-DR NK cells, HLA-DR+ CD3- CD56+, (Figure 8E), activated HLA-DR CD56dim NK cells, HLA-DR+ CD3- CD56 dim, (Figure 8F), and activated HLA-DR CD38 double-positive (DP) T cells, CD3+ CD4+ CD8+ HLA-DR+ CD38+, (Figure 8H), and a significant increase of activated HLA-DR Th2 cells, HLA-DR+ CD3+ CXCR3- CCR6-, (Figure 8G) when comparing STS patients treated ≥12M with Trabectedin with those with <12M.
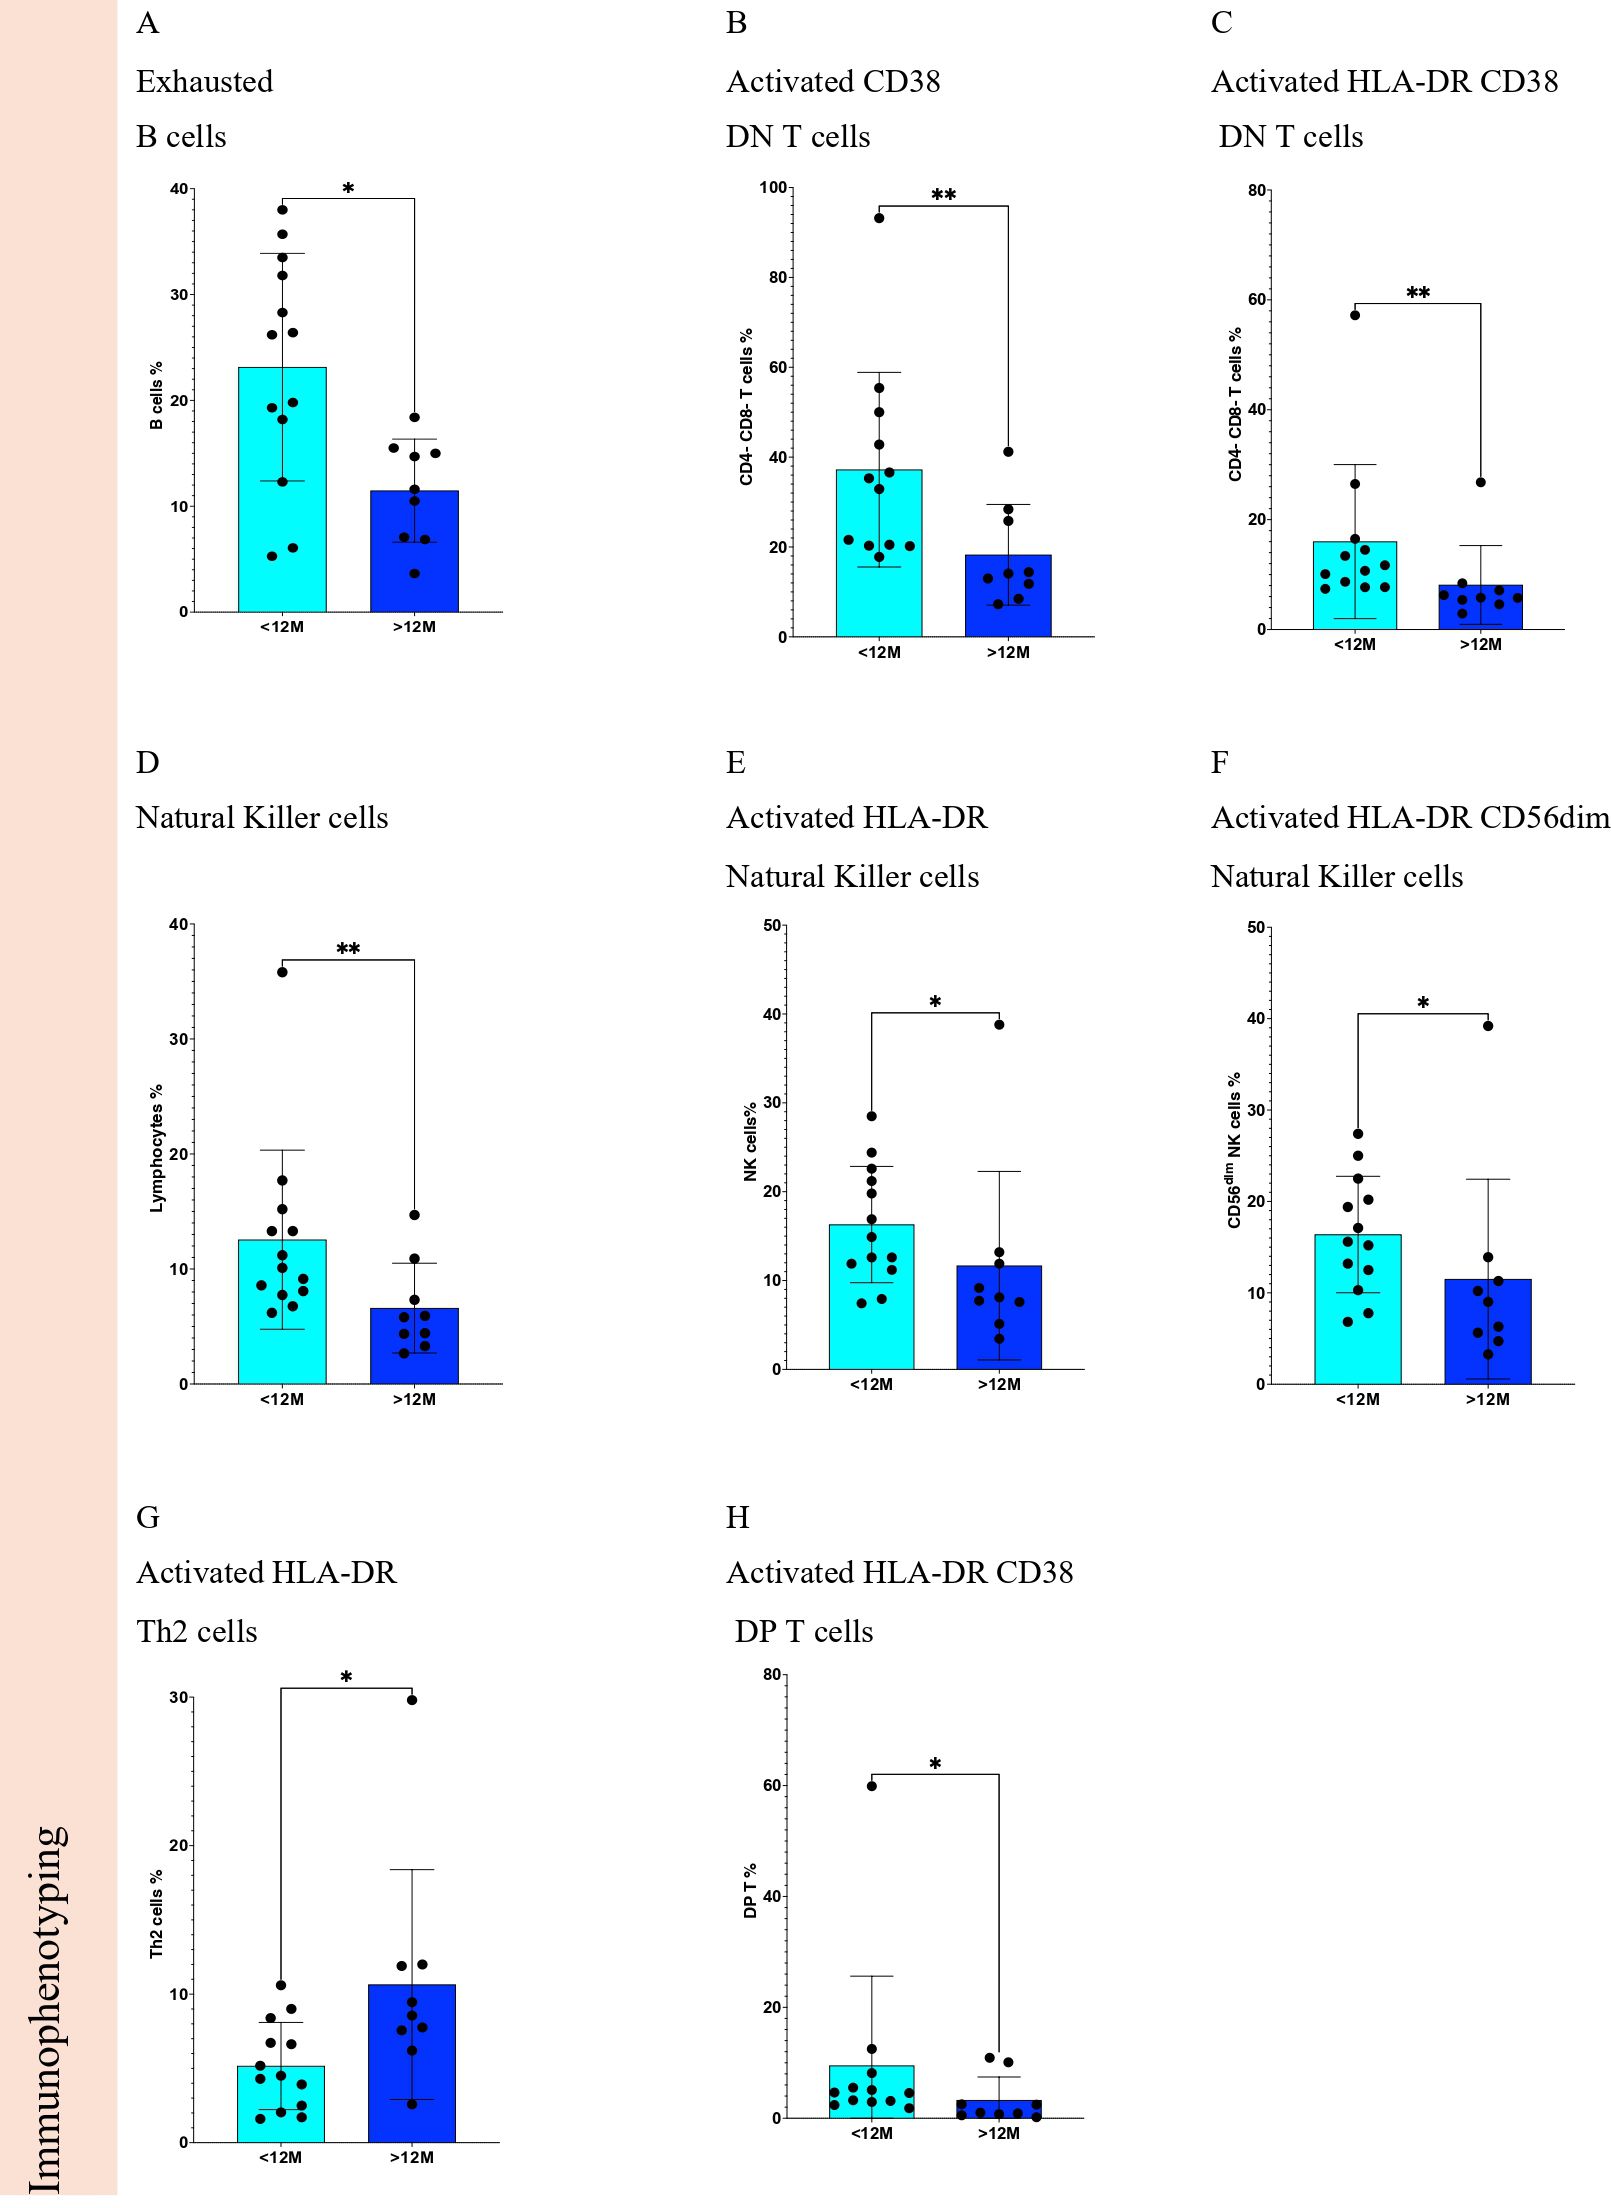
Figure 8. Statistically significant differences of immune cells from Soft Tissue Sarcoma patients according to Trabectedin therapy duration in months. Comparisons of <12M vs. ≥12M for Immunophenotyping for (A) exhausted B cells, (B) activated CD38 DN T cells, (C) activated HLA-DR CD38 DN T cells, (D) Natural killer cells, (E) activated HLA-DR Natural killer cells, (F) activated HLA-DR CD56dim Natural killer cells, (G) activated HLA-DR Th2 cells, and (H) activated HLA-DR CD38 DP T cells. <12M, Trabectedin therapy for less than 12 months; ≥12M, Trabectedin therapy for 12 or more months. *p-value < 0.05; **p-value < 0.01.
Immune-related gene expression profiling (Figure 7C) allowed the identification of 2 genes with significant differences (p <0.05) when comparing <12M vs. ≥12M STS patients: decrease of interleukin 5 (IL5) gene (Figure 9A) and leukemia inhibitory factor (LIF) gene (Figure 9B).
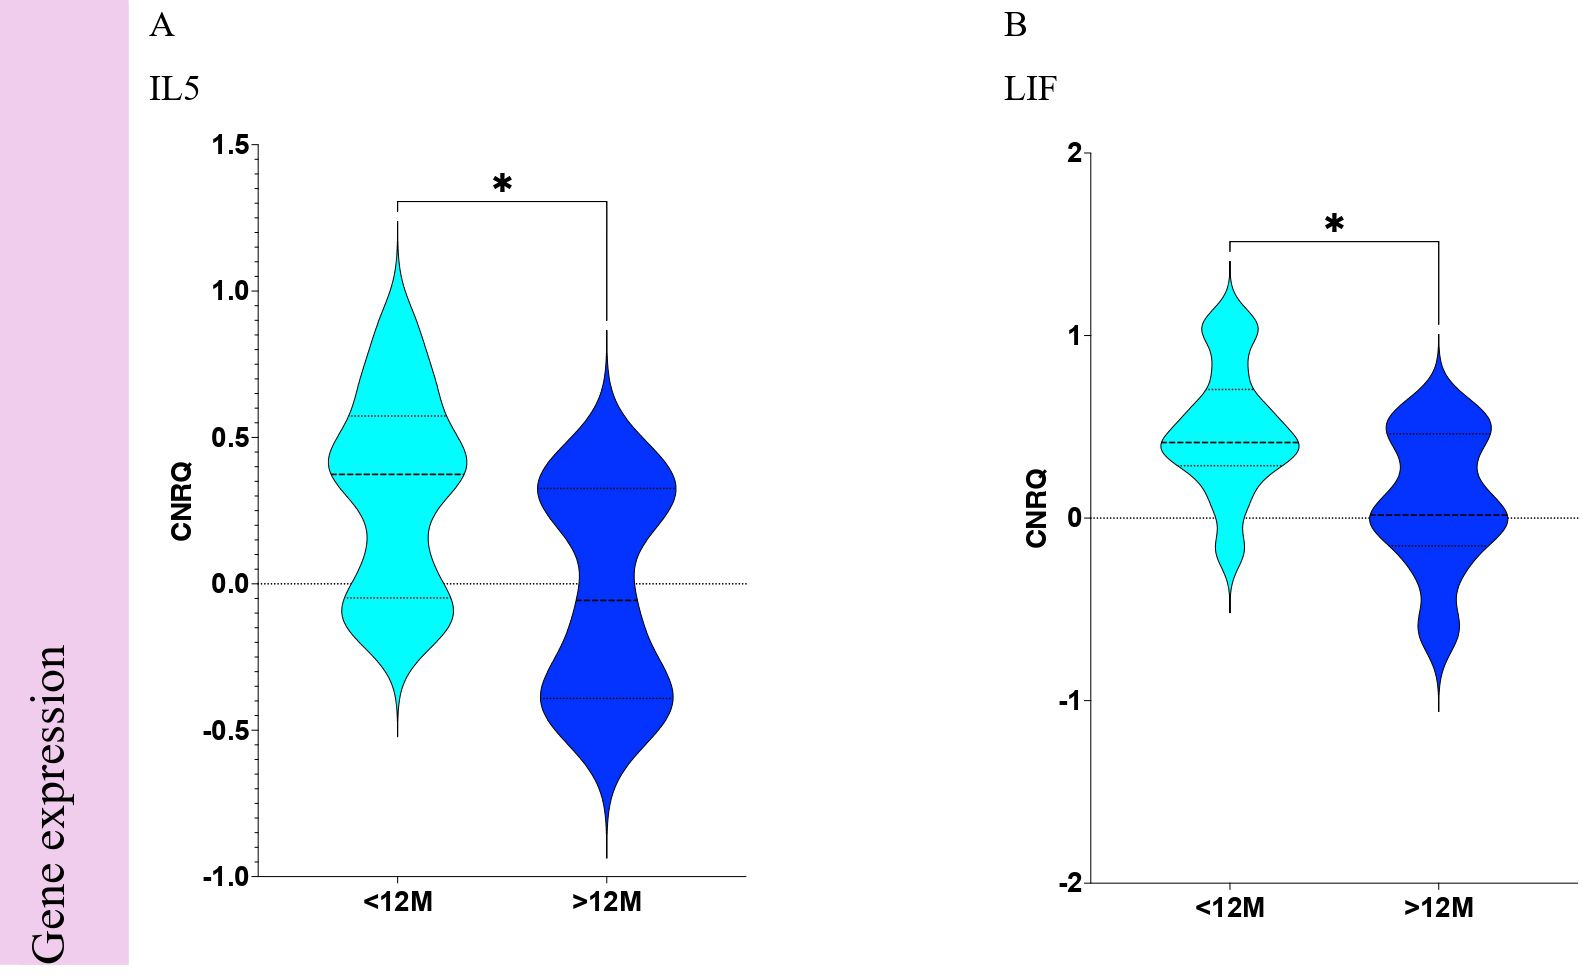
Figure 9. Statistically significant differences of immune-related gene expression from Soft Tissue Sarcoma patients according to Trabectedin therapy duration in months. Comparisons of <12M vs. ≥12M for immune-related gene expression of (A) IL5 and (B) LIF. <12M, Trabectedin therapy for less than 12 months; ≥12M, Trabectedin therapy for 12 or more months. *p-value < 0.05.
Soluble proteome analysis disclosed any association (Figures 7D) of the 99 targets when comparing <12M vs. ≥12M STS patients. The equivalent proteins for genes that revealed associations are presented for IL-5 (Figure 10A) and LIF (Figure 10B).
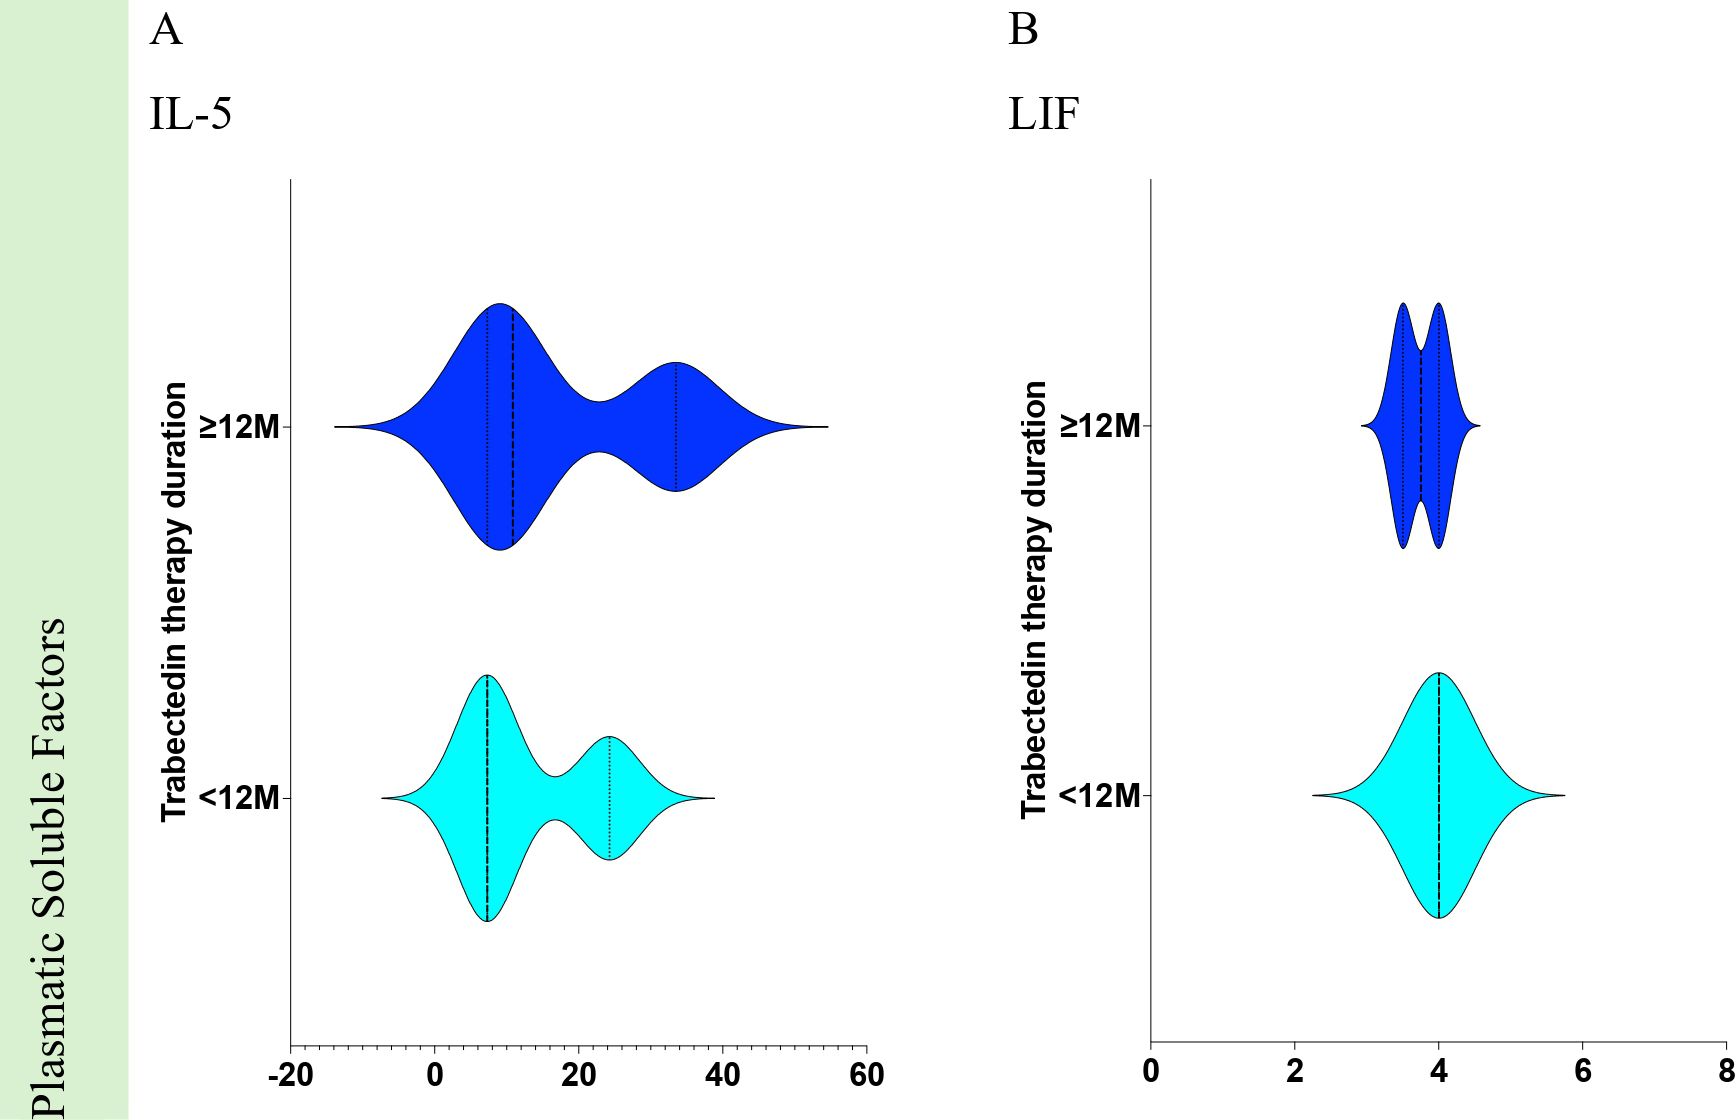
Figure 10. Statistically significant differences of plasmatic soluble factors from Soft Tissue Sarcoma patients according to Trabectedin therapy duration in months. Comparisons of <12M vs. ≥12M for plasmatic soluble factors for (A) IL-5 and (B) LIF. <12M, Trabectedin therapy for less than 12 months; ≥12M, Trabectedin therapy for 12 or more months.
3.3 Combined analysis of progression-free survival and trabectedin therapy duration
Principal Component Analysis (PCA) was performed to correlate PFS with the duration of Trabectedin therapy using immunophenotyping, immune-related gene expression, and soluble proteome analysis data (Figure 11).
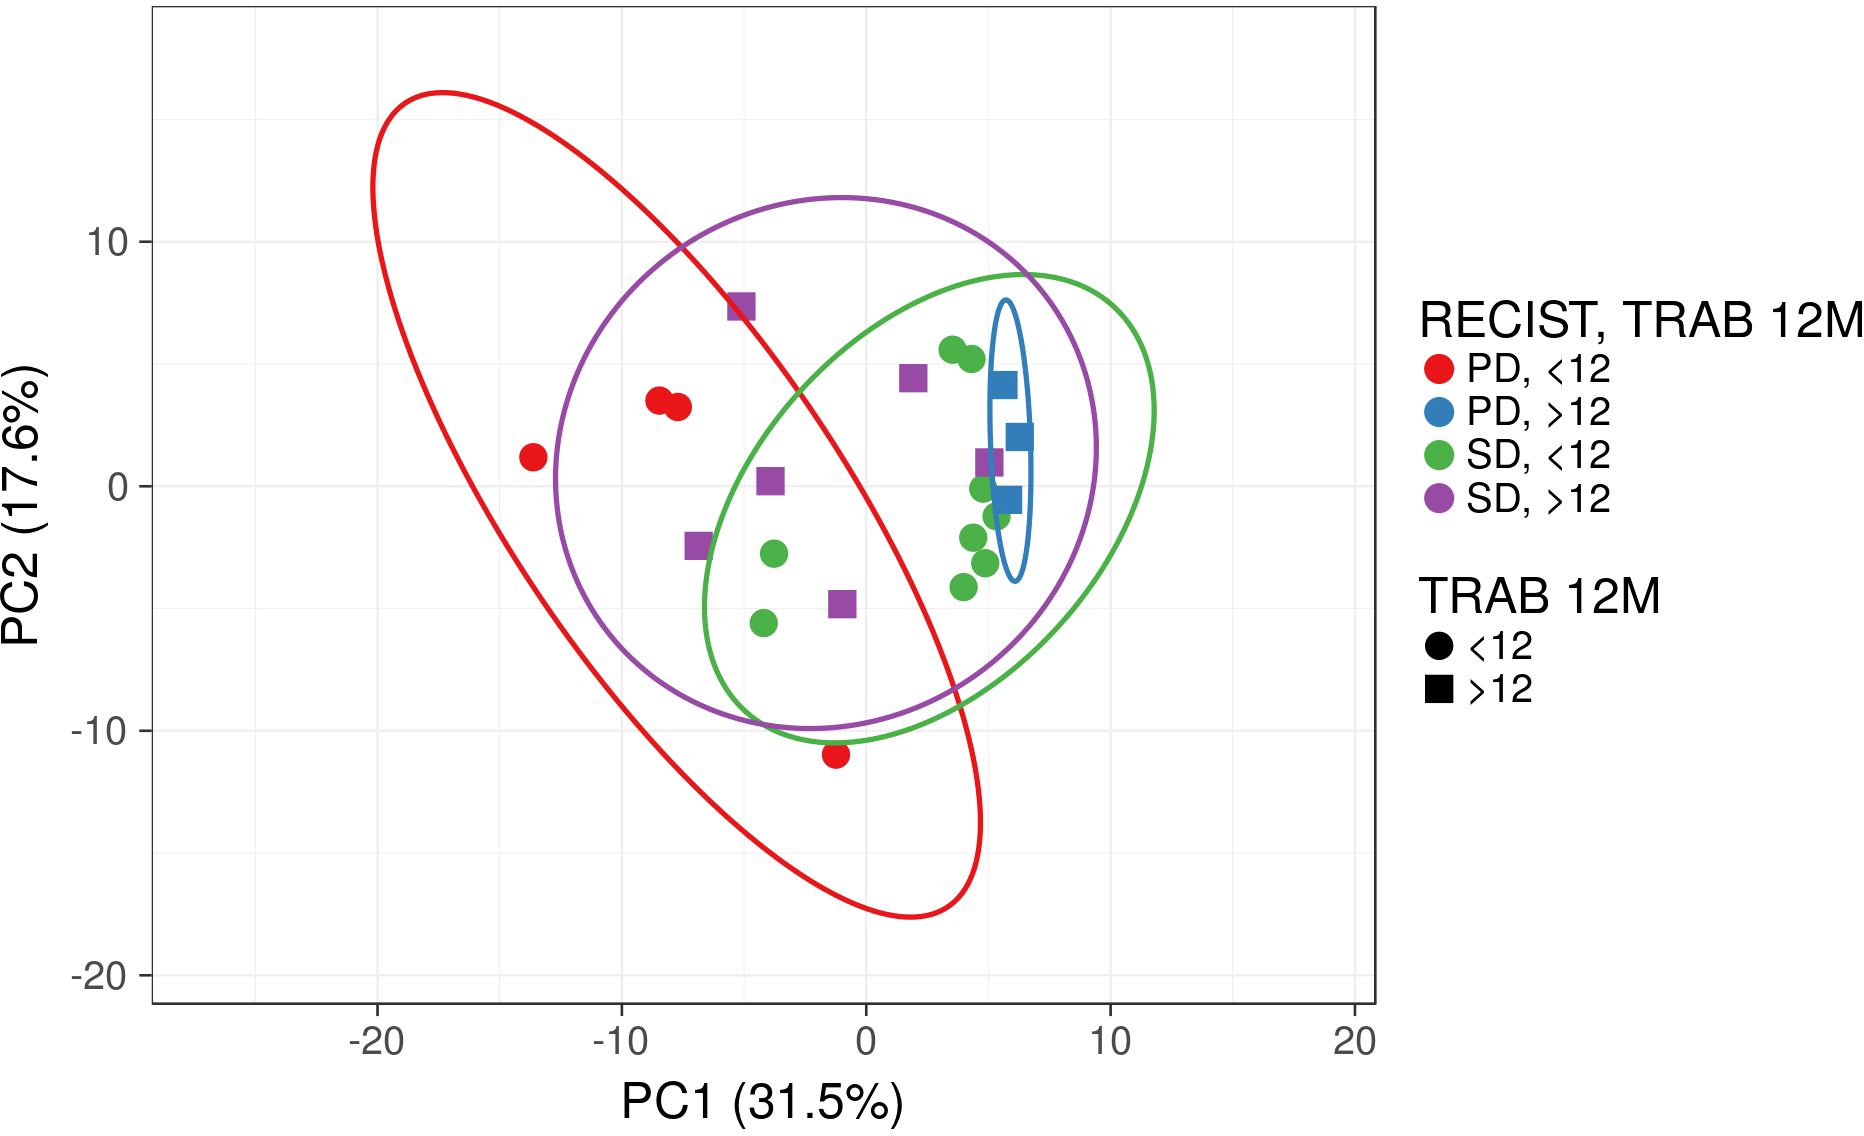
Figure 11. Principal Component Analysis (PCA) for Soft Tissue Sarcoma patients according to RECIST1.1 and duration of Trabectedin therapy. PD, Progression Disease; SD, Stable Disease; <12M, Trabectedin therapy for less than 12 months; ≥12M, Trabectedin therapy for 12 or more months.
Although no clusters were separated from the other combinations, STS patients that progress disease (PD) with less than 12 months (<12M, in red) are distinct from those with 12 or more months (≥12M, in blue) of Trabectedin therapy.
STS patients with stable disease after Trabectedin therapy are similar in terms of the duration of Trabectedin therapy (green vs. purple).
A segregated analysis of RECIST1.1 and therapy duration for immunophenotyping data (Figure 12A) revealed significant differences for patients with SD according to therapy duration: increased DN T cells and decrease of CD8 T cells and activated HLA-DR CD56dim NK cells (Figure 12B). Similarly, significant differences were observed for patients with <12M of therapy (Figure 12C) and ≥12M of trabectedin (Figure 12D) according to RECIST1.1.
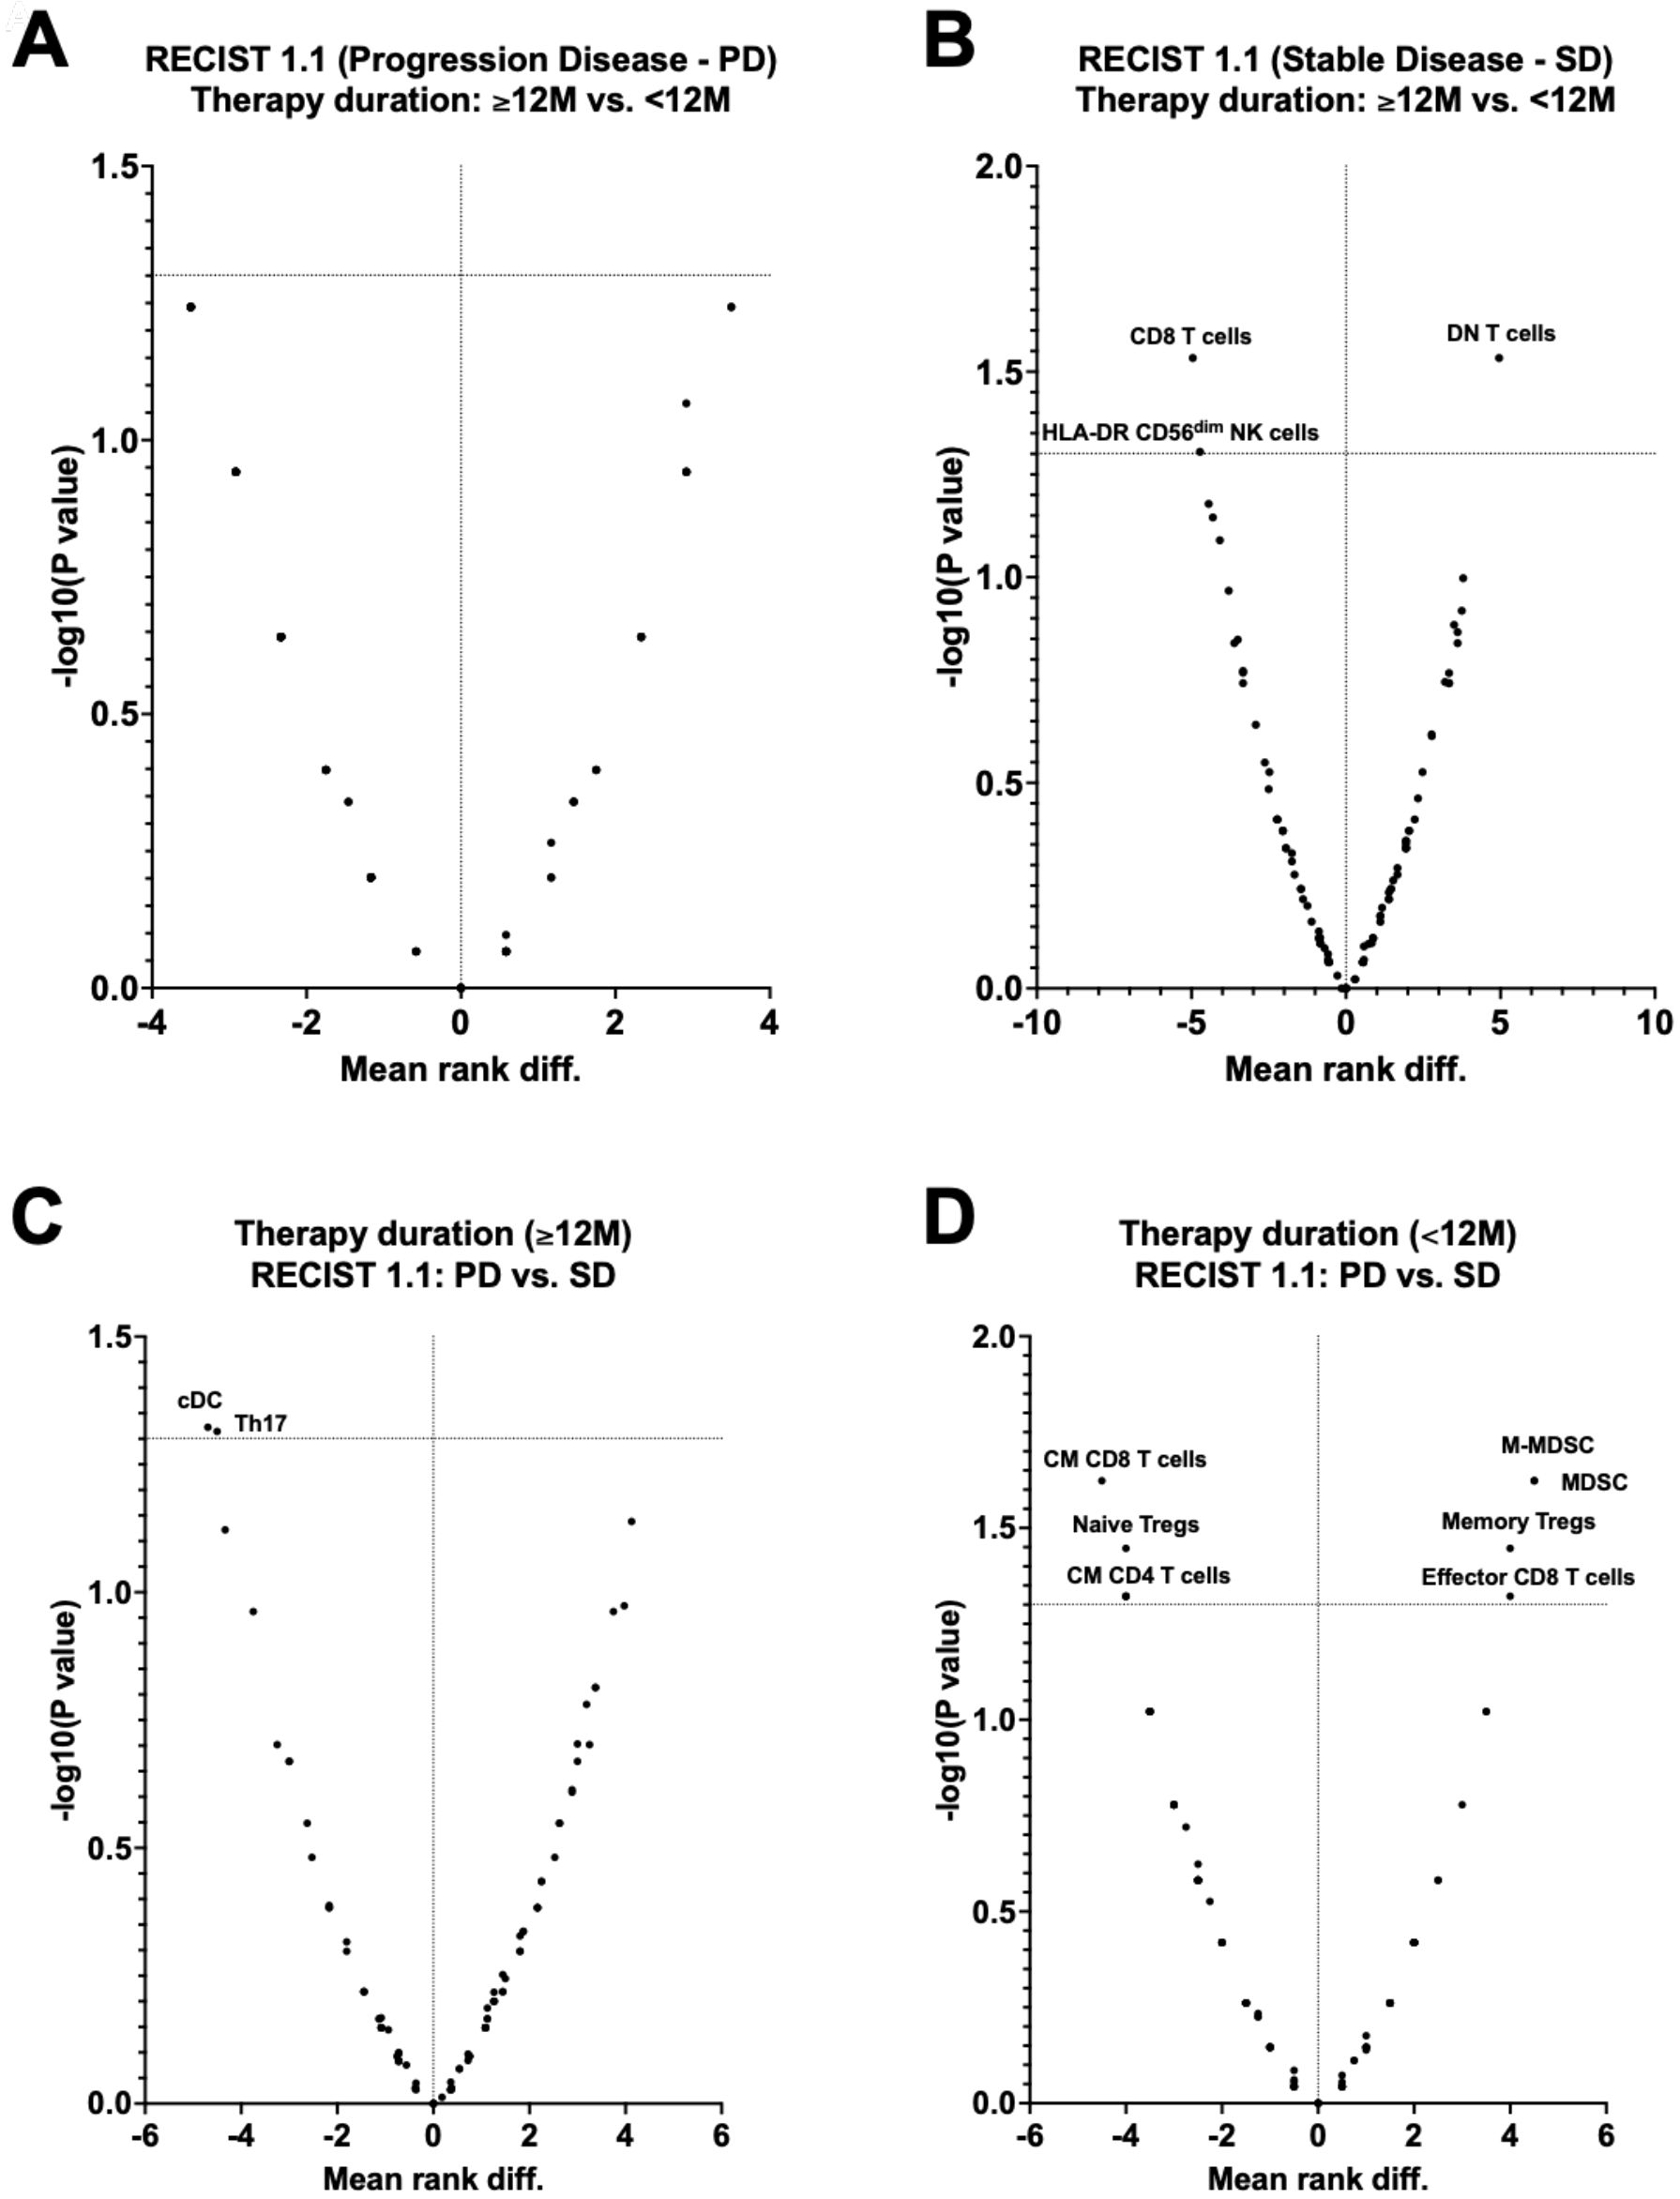
Figure 12. Volcano plots of immunophenotyping data of Soft Tissue Sarcoma patients according to RECIST1.1 and duration of Trabectedin therapy. (A) RECIST1.1 (Progression disease – PD) according to Therapy duration (≥12 vs. <12M); (B) RECIST1.1 (Stable disease - SD) according to Therapy duration (≥12 vs. <12M); (C) Therapy duration (<12M) according to RECIST1.1 (PD vs SD); (D) Therapy duration (≥12M) according to RECIST1.1 (PD vs SD). PD, Progression Disease; SD, Stable Disease; <12M, Trabectedin therapy for less than 12 months; ≥12M, Trabectedin therapy for 12 or more months.
The ClustVis hierarchical clustering method (34) was applied to dimensions and observations resulted from the above immune-related parameters analyzed for STS patients in this study (Figure 13).
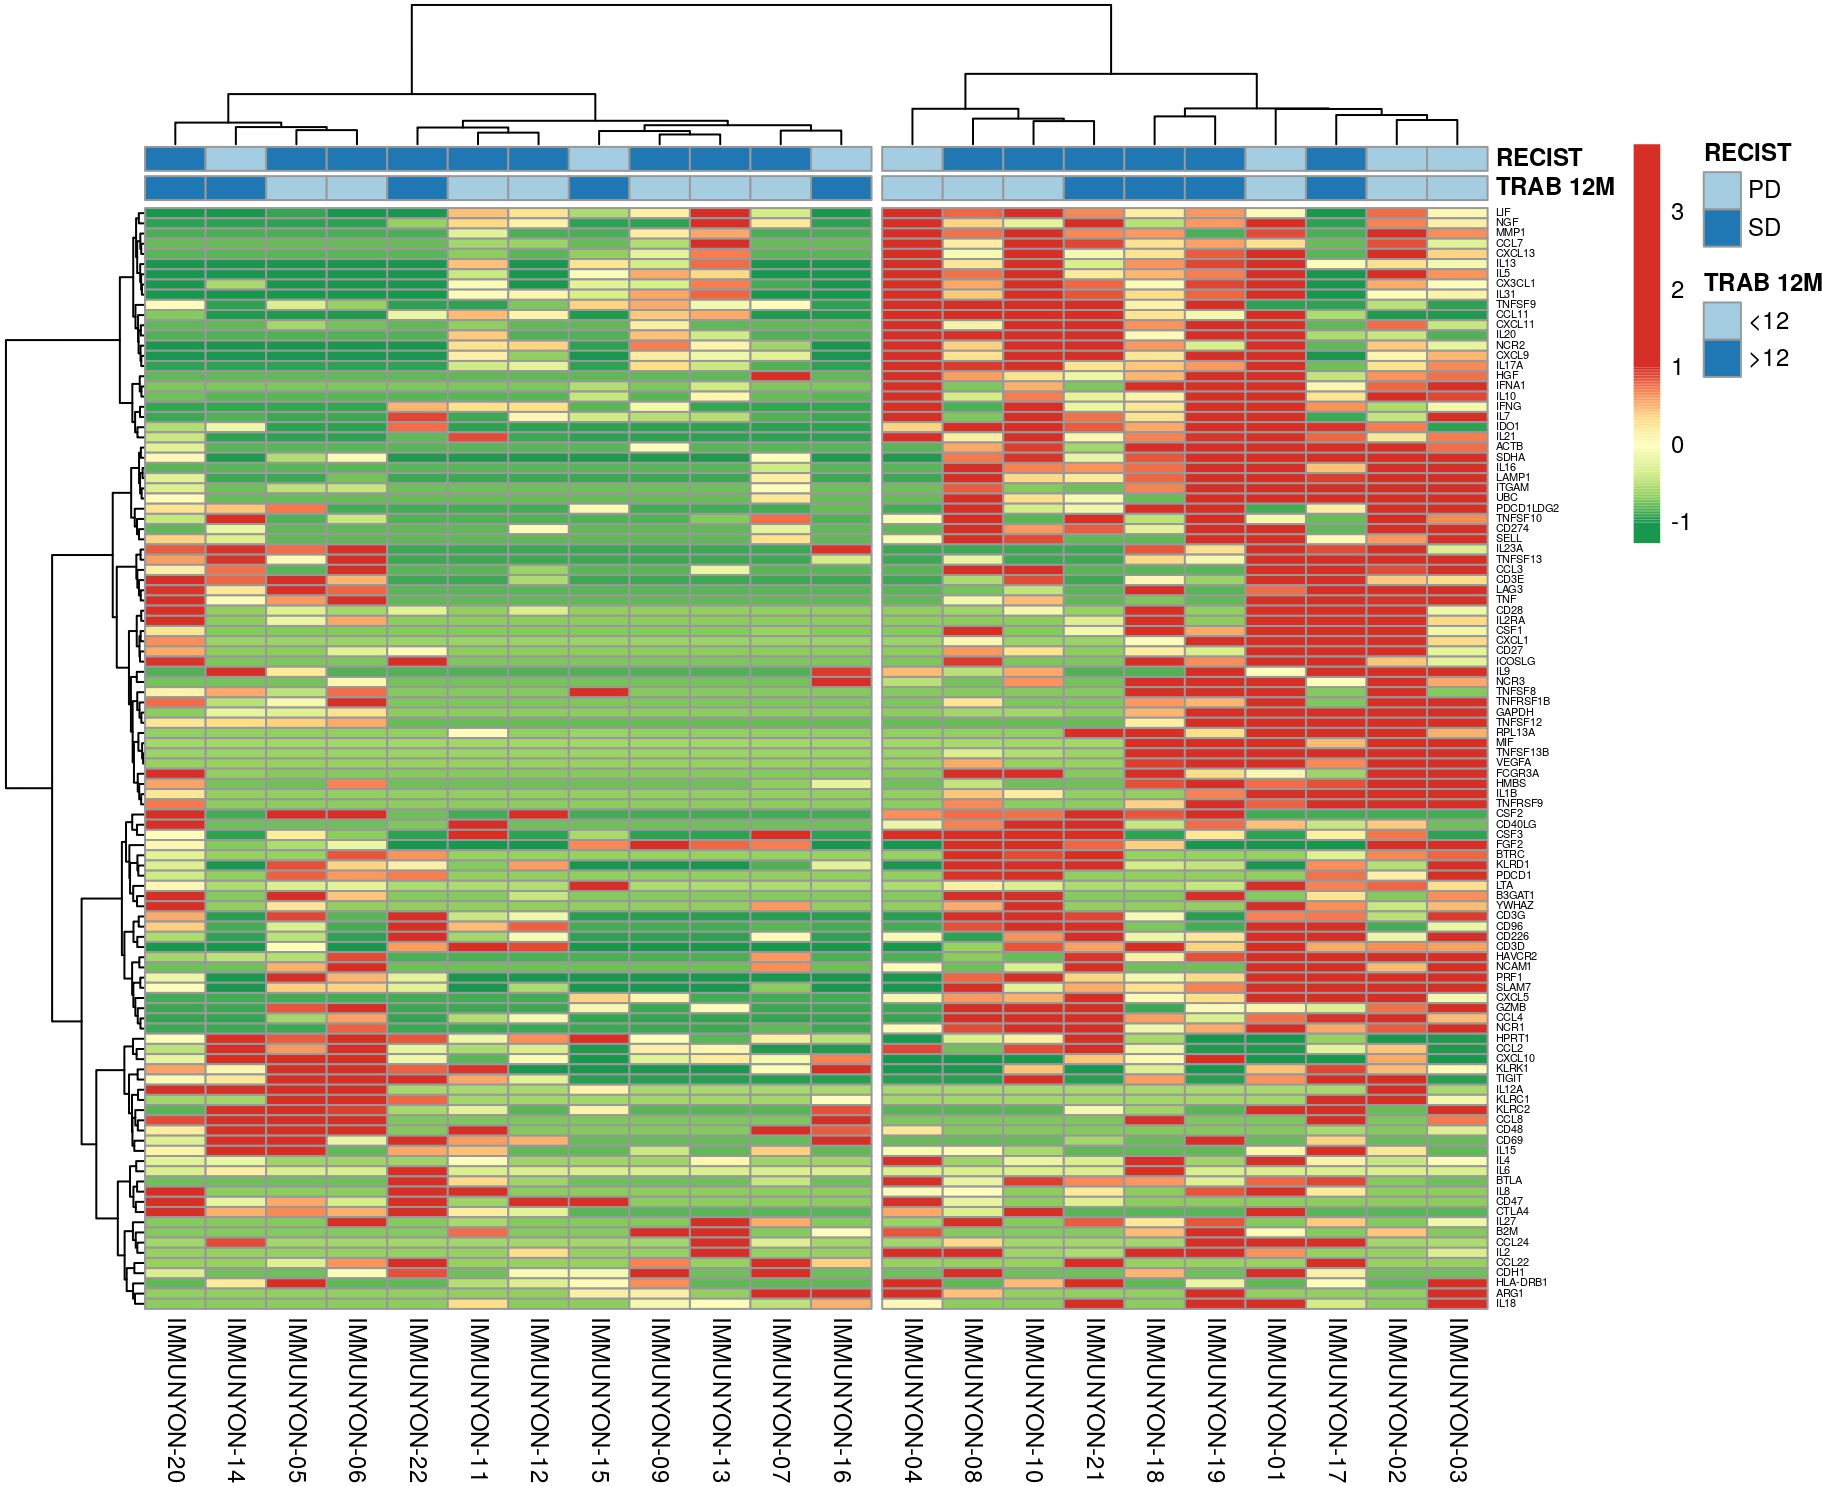
Figure 13. Heatmap of unsupervised clustering analysis for Soft Tissue Sarcoma patients according to RECIST1.1 and duration of Trabectedin therapy. PD, Progression Disease; SD, Stable Disease; <12M, Trabectedin therapy for less than 12 months; ≥12M, Trabectedin therapy for 12 or more months.
A heatmap clustering the multivariate data resulted in an unbiased identification of 2 clusters according to the immunophenotyping, immune-related gene expression, and soluble proteome analysis data with annotated RECIST1.1 and Trabectedin therapy duration.
3.4 Differential gene expression of BTRC, IFNA1, IL5, IL9 and LIF and survival in TCGA sarcoma cohort
We evaluated the prognostic biomarkers suggested in this study for predictive power by accessing public databases. The sarcoma dataset originated from the genomic and expression analysis of 206 sarcoma samples within the TCGA Adult Soft Tissue Sarcomas cohort. A total of 174 samples with all relevant data available were selected for analysis. The gene characterized by the highest number of genomic or transcriptomic alterations (Figure 14A) was IFNA1 (altered in 8% of patients), followed by IL9 (altered in 2.9% of patients), IL5 (altered in 2.3% of patients) and BTRC (altered in 0.6% of patients). The most frequent IFNA1 alteration was deep deletion. Due to the limited number of sarcoma samples treated with trabectedin, which precluded a meaningful analysis, we shifted focus to examining differences in the expression levels of the five identified genes within the TCGA sarcoma cohort to explore potential correlations with survival outcomes. The expression levels of BTRC, IFNA1, IL5, IL9 and LIF genes were not significantly related to OS (Figure 14B). We found a significant relation between IFNA1 (Log-rank; p=0.02), IL5 (Log-rank; p=0.01), and IL9 (Log-rank; p=0.014) expression levels and disease-free survival (Figure 14C).
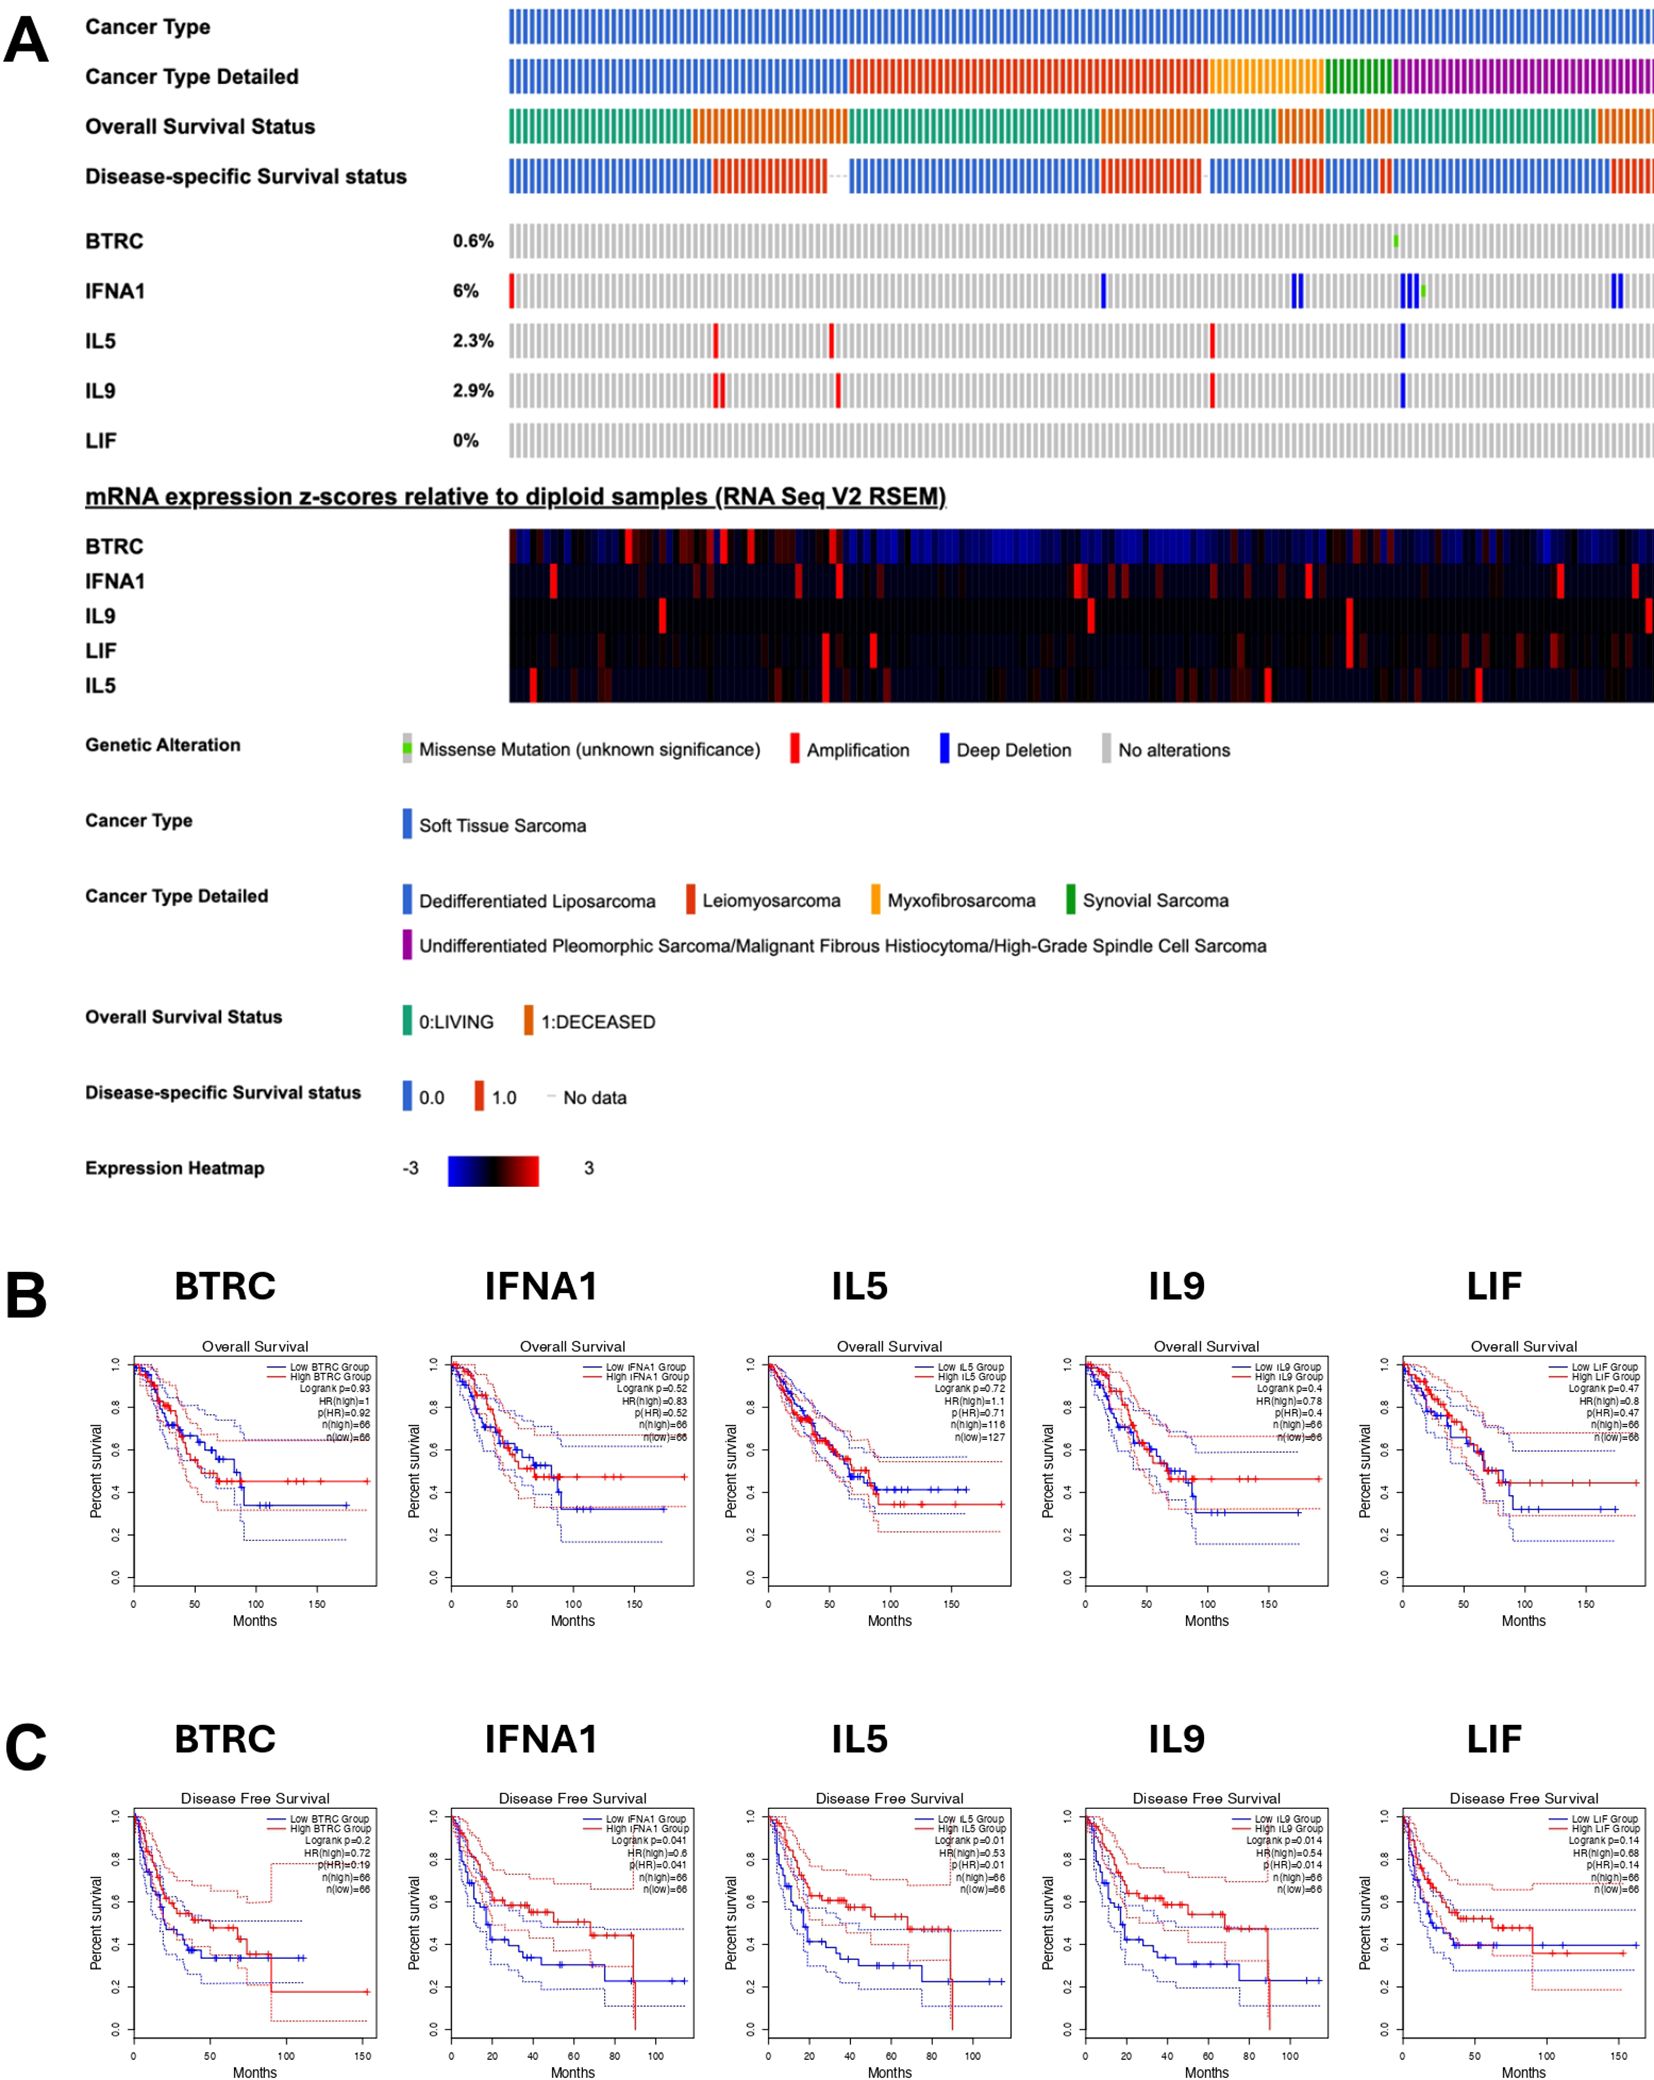
Figure 14. Oncoprint of clinical and genomic features of soft tissue sarcoma patients derived from TCGA sarcoma. (A) Oncoprint including mRNA expression z-scores relative to diploid samples (B) Overall survival and (C) PFS for BTRC, IFNA1, IL5, IL9 and LIF mRNAs from TCGA sarcoma dataset.
4 Discussion
This was a non-interventional study. The primary objective was to assess PFS in STS patients treated with trabectedin as measured by RECIST1.1 criteria. Immune monitoring of Trabectedin therapy in refractory STS patients aimed at the establishment of additional efficacy parameters of different therapeutic strategies.
More than one-third of STS patients achieved SD after Trabectedin therapy, in accordance with other studies (37). In this study, almost 40% of the patients receiving Trabectedin were analyzed for 12 or more months. Duration of Trabectedin therapy does not demonstrate a significant impact in PFS.
Regarding the immune monitoring associated with PFS, a significant decrease in eosinophils , increase of type 2 helper T cells (Th2) and decrease conventional dendritic cells (cDC) was associated with progression disease (PD) when compared to stable disease (SD). As far as the authors are aware, there is no description of those associations in the literature analyzing Trabectedin therapy in STS.
In this study, decreased beta-transducin repeat containing (BTRC) and increased interferon alpha-1 (IFNA1) and interleukin 9 (IL9) gene expression were significantly associated with a worse response to Trabectedin therapy. Several authors associated the pathways involving BTRC with osteosarcoma (38–40), but no studies described its involvement in STS. One study (41) referred to an enrichment of anti-tumor immune regulatory mechanisms, including interferon-gamma (IFN-γ) and interferon-alpha (IFN-α) responses in Ewing sarcoma. The studies analyzing IL-9 are scarce and result from side observations in cancer cell lines (42–44).
No soluble factors were found associated with PFS in STS patients treated with trabectedin in this study. Other investigators (45) described the chemokine CCL-2 and the cytokine IL-6 remarkedly reduced by Yondelis® in monocytes, macrophages, TAM, and freshly isolated ovarian cells. The chemokine CCL2 is the major determinant of monocyte recruitment at tumor sites, whereas IL-6 is a growth factor for ovarian tumors.
The duration of Trabectedin therapy was also evaluated in this study. Although no significant alterations were observed in the complete blood count (CBC), several lymphocytes’ populations were significantly decreased in the first year of treatment, including exhausted B cells and activated T and NK cells. Again, this is the first study to describe this association in peripheral blood to trabectedin therapy.
Immune-related gene expression profiling revealed that LIF and IL5 mRNAs were significantly increased for the first 12 months of Trabectedin therapy. LIF was described as a super-enhancer-controlled regulator of stem cell-like properties in osteosarcoma (46). Another study on benign enchondromas and malignant chondrosarcomas (47) described also the presence of LIF, in contrast with its absence in control tissue.
Again, no soluble factors were found associated with duration of trabectedin therapy in this study.
Finally, Principal Component Analysis identified separated clusters of STS patients with PD according to the duration of Trabectedin therapy. An heatmap also revealed two clusters/signatures without discrimination of PFS (PD vs. SD) or duration of Trabectedin therapy (<12M vs. ≥12M).
In conclusion, the present study measured the impact of Trabectedin therapy in PFS by RECIST1.1. Several immune parameters (immune cells, immune-related genes, and soluble proteome) were associated with a better response to Trabectedin therapy. This study also allowed us to identify the short-term (<12M) and long-term (≥12M) effects of Trabectedin therapy. Early effects of Trabectedin (<12M) include the exhaustion of B cells, activation of T and NK cells, and increase of LIF gene expression associated with control of stemness properties of sarcoma cells.
The findings of this study must be interpreted within the context of several limitations. One of the primary limitations is the relatively small sample size, which may reduce the statistical power of the results and limit the generalizability of the findings. Additionally, the heterogeneity of the histotypes included in the study further complicates the interpretation of the results, as the immune response to trabectedin could vary across different sarcoma subtypes. The inclusion of diverse histological types may have introduced variability in treatment response and immune profile, potentially masking specific biomarkers or immune signatures that could be relevant for particular STS subgroups. While these limitations must be considered, the study provides valuable preliminary insights into the immune-related parameters associated with trabectedin therapy in STS. These findings lay the groundwork for future studies with larger, more homogeneous patient populations to validate the identified biomarkers and further elucidate their role in predicting treatment efficacy.
Data availability statement
The raw data supporting the conclusions of this article will be made available by the authors, without undue reservation.
Ethics statement
The studies involving humans were approved by Ethical Committee of the Coimbra Hospital and Universitary Centre (CHUC), Coimbra, Portugal. The studies were conducted in accordance with the local legislation and institutional requirements. The participants provided their written informed consent to participate in this study.
Author contributions
PR-S: Conceptualization, Data curation, Formal analysis, Funding acquisition, Investigation, Methodology, Project administration, Resources, Supervision, Validation, Visualization, Writing – original draft, Writing – review & editing. JSA: Investigation, Writing – review & editing. LMS: Investigation, Writing – review & editing. PC: Investigation, Writing – review & editing. AM: Investigation, Writing – review & editing. JR: Investigation, Writing – review & editing. RF: Investigation, Writing – review & editing. MS-R: Investigation, Writing – review & editing. PF-T: Investigation, Writing – review & editing. JMC: Conceptualization, Funding acquisition, Investigation, Project administration, Resources, Supervision, Validation, Writing – review & editing.
Funding
The author(s) declare financial support was received for the research, authorship, and/or publication of this article. This work was supported by the European Regional Development Fund (ERDF), through the Centro 2020 Regional Operational Program and through the COMPETE 2020-Operational Programme for Competitiveness and Internationalization and Portuguese national funds via FCT-Fundação para a Ciência e a Tecnologia, under the projects POCI-01-0145-FEDER-007440, UIDB/04539/2020 and UIDP/04539/2020. JA was supported by the PhD Grant (SFRH/BD/148007/2019) from the Portuguese Science and Technology Foundation (FCT), through the European Social Fund from the European Union. This work was also partially supported by Pharma Mar SA.
Acknowledgments
The investigators thank the support of Isabel Carreira, Ana Bela Sarmento, Ana Paula Parreira and Inês Cravo from CIMAGO, and Fernando Fonseca and Fernando Balocas from UTAL-CHUC.
Conflict of interest
The authors declare that the research was conducted in the absence of any commercial or financial relationships that could be constituted as a potential conflict of interest.
The author(s) declared that they were an editorial board member of Frontiers, at the time of submission. This had no impact on the peer review process and the final decision.
Generative AI statement
The author(s) declare that no Generative AI was used in the creation of this manuscript.
Publisher’s note
All claims expressed in this article are solely those of the authors and do not necessarily represent those of their affiliated organizations, or those of the publisher, the editors and the reviewers. Any product that may be evaluated in this article, or claim that may be made by its manufacturer, is not guaranteed or endorsed by the publisher.
Supplementary material
The Supplementary Material for this article can be found online at: https://www.frontiersin.org/articles/10.3389/fimmu.2025.1516793/full#supplementary-material
References
1. Tseng WW, Somaiah N, Engleman EG. Potential for immunotherapy in soft tissue sarcoma. Hum Vaccin Immunother. (2014) 10:3117–24. doi: 10.4161/21645515.2014.983003
2. Mohindra N, Agulnik M. Targeted therapy and promising novel agents for the treatment of advanced soft tissue sarcomas. Expert Opin Investig Drugs. (2015) 24:1409–18. doi: 10.1517/13543784.2015.1076792
3. Wisdom AJ, Mowery YM, Riedel RF, Kirsch DG. Rationale and emerging strategies for immune checkpoint blockade in soft tissue sarcoma. Cancer. (2018) 124:3819–29. doi: 10.1002/cncr.31517
4. von Mehren M, Kane JM, Bui MM, Choy E, Connelly M, Dry S, et al. NCCN guidelines insights: soft tissue sarcoma, version 1.2021. J Natl Compr Canc Netw. (2020) 18:1604–12. doi: 10.6004/jnccn.2020.0058
5. de Juan Ferré A, Álvarez Álvarez R, Casado Herráez A, Cruz Jurado J, Estival González A, Martín-Broto J, et al. SEOM Clinical Guideline of management of soft-tissue sarcoma (2020). Clin Transl Oncol. (2021) 23:922–30. doi: 10.1007/s12094-020-02534-0
6. Cojocaru E, Napolitano A, Fisher C, Huang P, Jones RL, Thway K. What's the latest with investigational drugs for soft tissue sarcoma? Expert Opin Investig Drugs. (2022) 31:1239–53. doi: 10.1080/13543784.2022.2152324
7. Grignani G, Le Cesne A, Martín-Broto J. Trabectedin as second-line treatment in advanced soft tissue sarcoma: quality of life and safety outcomes. Future Oncol. (2022) 18:13–22. doi: 10.2217/fon-2022-0518
8. Nakamura T, Sudo A. The role of trabectedin in soft tissue sarcoma. Front Pharmacol. (2022) 13:777872. doi: 10.3389/fphar.2022.777872
9. Smrke A, Wang Y, Simmons C. Update on systemic therapy for advanced soft-tissue sarcoma. Curr Oncol. (2020) 27:25–33. doi: 10.3747/co.27.5475
10. Carvalho C, Santos R, Cardoso S, Correia S, Oliveira P, Santos M, et al. Doxorubicin: the good, the bad and the ugly effect. Curr Med Chem. (2009) 16:3267–85. doi: 10.2174/092986709788803312
11. Varela-López A, Battino M, Navarro-Hortal MD, Giampieri F, Forbes-Hernández TY, Romero-Márquez JM, et al. An update on the mechanisms related to cell death and toxicity of doxorubicin and the protective role of nutrients. Food Chem Toxicol. (2019) 134:110834. doi: 10.1016/j.fct.2019.110834
12. Cuevas C, Francesch A. Development of yondelis® (Trabectedin, ET-743). A semisynthetic process solves the supply problem. Nat Prod Rep. (2009) 26:322–37. doi: 10.1039/b808331m
13. D’Incalci M, Galmarini CM. A review of trabectedin (ET-743): A unique mechanism of action. Mol Cancer Ther. (2010) 9:2157–63. doi: 10.1158/1535-7163.MCT-10-0263
14. Germano G, Frapolli R, Belgiovine C, Anselmo A, Pesce S, Liguori M, et al. Role of macrophage targeting in the antitumor activity of trabectedin. Cancer Cell. (2013) 23(2):249–62. doi: 10.1016/j.ccr.2013.01.008
15. Martín Broto J, le Cesne A, Reichardt P. The importance of treating by histological subtype in advanced soft tissue sarcoma. Future Oncol. (2017) 13:23–31. doi: 10.2217/fon-2016-0500
16. Yen CC, Chen TWW. Next frontiers in systemic therapy for soft tissue sarcoma. Chin Clin Oncol. (2018) 7:43. doi: 10.21037/cco.2018.08.04
17. Petitprez F, de Reyniès A, Keung EZ, Chen TWW, Sun CM, Calderaro J, et al. B cells are associated with survival and immunotherapy response in sarcoma. Nature. (2020) 577:556–60. doi: 10.1038/s41586-019-1906-8
18. Abeshouse A, Adebamowo C, Adebamowo SN, Akbani R, Akeredolu T, Ally A, et al. Comprehensive and integrated genomic characterization of adult soft tissue sarcomas. Cell. (2017) 171:950–965.e28. doi: 10.1016/j.cell.2017.10.014
19. Mirili C, Paydas S, Guney IB, Ogul A, Gokcay S, Buyuksimsek M, et al. Assessment of potential predictive value of peripheral blood inflammatory indexes in 26 cases with soft tissue sarcoma treated by pazopanib: A retrospective study. Cancer Manag Res. (2019) 11:3445–53. doi: 10.2147/CMAR.S191199
20. Szkandera J, Gerger A, Liegl-Atzwanger B, Absenger G, Stotz M, Friesenbichler J, et al. The lymphocyte/monocyte ratio predicts poor clinical outcome and improves the predictive accuracy in patients with soft tissue sarcomas. Int J Cancer. (2014) 135:362–70. doi: 10.1002/ijc.28677
21. García-Ortega DY, Álvarez-Cano A, Sánchez-Llamas LA, Caro-Sanchez CH, Martínez-Said H, Luna-Ortiz K, et al. Neutrophil/lymphocyte ratio is associated with survival in synovial sarcoma. Surg Oncol. (2018) 27(3):551–5. doi: 10.1016/j.suronc.2018.07.012
22. Fausti V, De Vita A, Vanni S, Ghini V, Gurrieri L, Riva N, et al. Systemic inflammatory indices in second-line soft tissue sarcoma patients: focus on lymphocyte/monocyte ratio and trabectedin. Cancers (Basel). (2023) 15(4):1080. doi: 10.3390/cancers15041080
23. Bücklein V, Adunka T, Mendler AN, Issels R, Subklewe M, Schmollinger JC, et al. Progressive natural killer cell dysfunction associated with alterations in subset proportions and receptor expression in soft-tissue sarcoma patients. OncoImmunology. (2016) 5:e1178421. doi: 10.1080/2162402X.2016.1178421
24. Judge SJ, Darrow MA, Thorpe SW, Gingrich AA, O’Donnell EF, Bellini AR, et al. Analysis of tumor-infiltrating NK and T cells highlights IL-15 stimulation and TIGIT blockade as a combination immunotherapy strategy for soft tissue sarcomas. J Immunother Cancer. (2020) 8:e001355. doi: 10.1136/jitc-2020-001355
25. Kim Y, Kobayashi E, Suehara Y, Ito A, Kubota D, Tanzawa Y, et al. Immunological status of peripheral blood is associated with prognosis in patients with bone and soft-tissue sarcoma. Oncol Lett. (2021) 21:212. doi: 10.3892/ol.2021.12473
26. Liu G, Ke L, Sun S. Prognostic value of pretreatment neutrophil-to-lymphocyte ratio in patients with soft tissue sarcoma. Medicine. (2018) 97:e12176. doi: 10.1097/MD.0000000000012176
27. Jiang L, Jiang S, Situ D, Lin Y, Yang H, Li Y, et al. Prognostic value of monocyte and neutrophils to lymphocytes ratio in patients with metastatic soft tissue sarcoma. Oncotarget. (2015) 6:9542–50. doi: 10.18632/oncotarget.3283
28. Almeida JS, Sousa LM, Couceiro P, Andrade TF, Alves V, Martinho A, et al. Peripheral immune profiling of soft tissue sarcoma: perspectives for disease monitoring. Front Immunol. (2024) 15:1391840. doi: 10.3389/fimmu.2024.1391840
29. Li LQ, Bai ZH, Zhang LH, Zhang Y, Lu XC, Zhang Y, et al. Meta-analysis of hematological biomarkers as reliable indicators of soft tissue sarcoma prognosis. Front Oncol. (2020) 10:30. doi: 10.3389/fonc.2020.00030
30. Eisenhauer EA, Therasse P, Bogaerts J, Schwartz LH, Sargent D, Ford R, et al. New response evaluation criteria in solid tumours: revised RECIST guideline (version 1.1). Eur J Cancer. (2009) 45:228–47. doi: 10.1016/j.ejca.2008.10.026
31. Maecker HT, McCoy JP, Nussenblatt R. Standardizing immunophenotyping for the Human Immunology Project [published correction appears in Nat Rev Immunol. 2012 Jun;12(6):471. Nat Rev Immunol. (2012) 12:191–200. doi: 10.1038/nri3158
32. Bronte V, Brandau S, Chen SH, Colombo MP, Frey AB, Greten TF, et al. Recommendations for myeloid-derived suppressor cell nomenclature and characterization standards. Nat Commun. (2016) 7:12150. doi: 10.1038/ncomms12150
33. Vandesompele J, De Preter K, Pattyn F, Poppe B, Roy N, De Paepe A, et al. Accurate normalization of real-time quantitative RT-PCR data by geometric averaging of multiple internal control genes. Genome Biol. (2002) 3:RESEARCH0034. doi: 10.1186/gb-2002-3-7-research0034
34. Metsalu T, Vilo J. ClustVis: a web tool for visualizing clustering of multivariate data using Principal Component Analysis and heatmap. Nucleic Acids Res. (2015) 43:W566–70. doi: 10.1093/nar/gkv468
35. Gao J, Aksoy BA, Dogrusoz U, Dresdner G, Gross B, Sumer SO, et al. Integrative analysis of complex cancer genomics and clinical profiles using the cBioPortal. Sci Signal. (2013) 6(269):pl1. doi: 10.1126/scisignal.2004088
36. Cancer Genome Atlas Research Network. Electronic address:ZWxpemFiZXRoLmRlbWljY29Ac2luYWloZWFsdGhzeXN0ZW0uY2E=; Cancer Genome Atlas Research Network. Comprehensive and Integrated Genomic Characterization of Adult Soft Tissue Sarcomas. Cell. (2017) 171:950–965.e28. doi: 10.1016/j.cell.2017.10.014
37. Grünwald V, Pink D, Egerer G, Schalk E, Augustin M, Deinzer CKW, et al. Trabectedin for patients with advanced soft tissue sarcoma: A non-interventional, prospective, multicenter, phase IV trial. Cancers. (2022) 14:5234. doi: 10.3390/cancers14215234
38. Yang Y, Zhang Y, Qu X, Xia J, Li D, Li X, et al. Identification of differentially expressed genes in the development of osteosarcoma using RNA-seq. Oncotarget. (2016) 7:87194–205. doi: 10.18632/oncotarget.13554
39. Schuster AJ, Kager L, Reichardt P, Baumhoer D, Csóka M, Hecker-Nolting S, et al. High-grade osteosarcoma of the foot: presentation, treatment, prognostic factors, and outcome of 23 cooperative osteosarcoma study group COSS patients. Sarcoma. (2018) 2018:1632978. doi: 10.1155/2018/1632978
40. Li S, Zeng M, Yang L, Tan J, Yang J, Guan H, et al. Lnc-SELPLG-2:1 enhanced osteosarcoma oncogenesis via hsa-miR-10a-5p and the BTRC cascade. BMC Cancer. (2022) 22:1044. doi: 10.1186/s12885-022-10040-5
41. Qasim SL, Sierra L, Shuck R, Kurenbekova L, Patel TD, Rajapakshe K, et al. p21-activated kinases as viable therapeutic targets for the treatment of high-risk Ewing sarcoma. Oncogene. (2021) 40(6):1176–90. doi: 10.1038/s41388-020-01600-9
42. Van Damme J, Uyttenhove C, Houssiau F, Put W, Proost P, Van Snick J. Human growth factor for murine interleukin (IL)-9 responsive T cell lines: co-induction with IL-6 in fibroblasts and identification as LIF/HILDA. Eur J Immunol. (1992) 22:2801–8. doi: 10.1002/eji.1830221108
43. Demoulin JB, Uyttenhove C, Van Roost E, DeLestré B, Donckers D, Van Snick J, et al. A single tyrosine of the interleukin-9 (IL-9) receptor is required for STAT activation, antiapoptotic activity, and growth regulation by IL-9. Mol Cell Biol. (1996) 16:4710–6. doi: 10.1128/MCB.16.9.4710
44. Bauer JH, Liu KD, You Y, Lai SY, Goldsmith MA. Heteromerization of the gammac chain with the interleukin-9 receptor alpha subunit leads to STAT activation and prevention of apoptosis. J Biol Chem. (1998) 273:9255–60. doi: 10.1074/jbc.273.15.9255
45. Allavena P, Signorelli M, Chieppa M, Erba E, Bianchi G, Marchesi F, et al. Anti-inflammatory properties of the novel antitumor agent yondelis (trabectedin): inhibition of macrophage differentiation and cytokine production. Cancer Res. (2005) 65:2964–71. doi: 10.1158/0008-5472.CAN-04-4037
46. Lu B, He Y, He J, Wang L, Liu Z, Yang J, et al. Epigenetic profiling identifies LIF as a super-enhancer-controlled regulator of stem cell-like properties in osteosarcoma. Mol Cancer Res. (2020) 18:57–67. doi: 10.1158/1541-7786.MCR-19-0470
Keywords: soft tissue sarcoma, trabectedin, immunophenotyping, gene expression profiling, soluble factors, immune checkpoints, progression free survival
Citation: Rodrigues-Santos P, Almeida JS, Sousa LM, Couceiro P, Martinho A, Rodrigues J, Fonseca R, Santos-Rosa M, Freitas-Tavares P and Casanova JM (2025) Immune monitoring of trabectedin therapy in refractory soft tissue sarcoma patients - the IMMUNYON study. Front. Immunol. 16:1516793. doi: 10.3389/fimmu.2025.1516793
Received: 24 October 2024; Accepted: 07 January 2025;
Published: 11 February 2025.
Edited by:
Alessandro De Vita, Scientific Institute of Romagna for the Study and Treatment of Tumors (IRCCS), ItalyCopyright © 2025 Rodrigues-Santos, Almeida, Sousa, Couceiro, Martinho, Rodrigues, Fonseca, Santos-Rosa, Freitas-Tavares and Casanova. This is an open-access article distributed under the terms of the Creative Commons Attribution License (CC BY). The use, distribution or reproduction in other forums is permitted, provided the original author(s) and the copyright owner(s) are credited and that the original publication in this journal is cited, in accordance with accepted academic practice. No use, distribution or reproduction is permitted which does not comply with these terms.
*Correspondence: Paulo Rodrigues-Santos, cGF1bG8uc2FudG9zQGZtZWQudWMucHQ=