 Ameth N. Garrido1
 Rohan Machhar1Omar F. Cruz-Correa1
 Darshini Ganatra1Sarah Q. Crome2,3
 Joan Wither3,4,5Igor Jurisica6,7,8
 Dafna D. Gladman1,4,5*
- 1Gladman-Krembil PsA Research Program, Schroeder Arthritis Institute, Krembil Research Institute, University Health Network, Toronto, ON, Canada
- 2Ajmera Transplant Centre, Toronto General Hospital Research Institute, University Health Network, Toronto, ON, Canada
- 3Department of Immunology, Faculty of Medicine, University of Toronto, Toronto, ON, Canada
- 4Schroeder Arthritis Institute, Krembil Research Institute, University Health Network, Toronto, ON, Canada
- 5Division of Rheumatology, Faculty of Medicine, University of Toronto, Toronto, ON, Canada
- 6Osteoarthritis Research Program, Division of Orthopedic Surgery, Schroeder Arthritis Institute and Data Science Discovery Centre for Chronic Diseases, Krembil Research Institute, University Health Network, Toronto, ON, Canada
- 7Departments of Medical Biophysics and Computer Science, and Faculty of Dentistry, University of Toronto, Toronto, ON, Canada
- 8Institute of Neuroimmunology, Slovak Academy of Sciences, Bratislava, Slovakia
Objective: To identify biomarkers that distinguish psoriatic arthritis (PsA) from cutaneous psoriasis without arthritis (PsC) and healthy controls (HC) using single cell RNA sequencing (scRNA-seq).
Method: Peripheral blood mononuclear cell samples from three patients with PsA fulfilling CASPAR criteria, three patients with PsC and two HC were profiled using scRNA-seq. Differentially expressed genes (DEGs) identified through scRNA-seq were validated on classical monocytes, and CD4+ and CD8+ T cell subsets derived from an independent cohort of patients using the NanoString nCounter® platform. Protein expression was measured in CD4+ and CD8+ T cells by immunoblotting.
Results: A total of 18 immune cell population clusters were identified. Across 18 cell clusters, we identified 234 DEGs. NFKBIA and TNFAIP3 were overexpressed in PsA vs HC and PsC patients. Immunoblotting of the proteins encoded in these genes (IκBα and A20, respectively) showed higher levels in PsA CD4+ T cells compared to HC. Conversely, lower levels were observed in PsA CD8+ T cell lysates compared to HC for both proteins.
Conclusion: These results suggest that translation of TNFAIP3 and NFKBIA may be inhibited in PsA CD8+ T cells. This study provides insight into the cellular heterogeneity of PsA, showing that non-cell type specific expression of genes associated with the disease can be dysregulated through different mechanisms in distinct cell types.
Introduction
Psoriatic Arthritis (PsA) is an immune mediated inflammatory musculoskeletal disease that adversely impacts quality of life (1–3). It is characterized by asymmetric joint involvement and concomitant psoriasis (4). Comorbidities associated with PsA include depression, cardiovascular disease, and diabetes (5–7). The etiology of PsA remains unknown (8). Risk factors for PsA include a clinical diagnosis of psoriasis, family members with psoriatic disease, obesity, smoking, and HLA-B27 positivity (9, 10). A diagnosis of PsA is heavily reliant on clinical expertise due to the heterogeneous nature of the disease (11). While numerous studies investigated diagnostic, disease activity and treatment response biomarkers for PsA, none have been validated for point of care use (12).Single-cell RNA sequencing (scRNA-seq) studies have found clonal expansions of CD8+ T Cells in synovial tissue of PsA patients compared to peripheral blood (13), display an enriched pro-inflammatory Th17 cell transcriptomic signature (14), and enrichment of Tregs and dendritic cells (15).
To get better mechanistic insights into PsA, we aimed to investigate the transcriptional landscape of PsA patients in peripheral blood mononuclear cells (PBMC) to identify potential susceptibility factors for disease. Here we combined scRNA-seq with T cell Receptor (TCR) immune profiling to capture potential clonal expansions of PsA and compare their immune landscape directly to psoriasis and healthy controls. Herein we also provide for the first-time evidence of translation inhibition of two important transcripts associated with inflammation NFKBIA and TNFAIP3 in PsA CD8+ T Cells.
Patients and methods
Patient selection
All study participants were recruited from the Psoriatic Disease Program at the Toronto Western Hospital, Toronto, Canada. PsA patients satisfied the ClASsification for Psoriatic Arthritis (CASPAR) criteria, had at least one actively inflamed joint and were not on any biologic treatment. Psoriasis without arthritis (PsC) patients had psoriasis diagnosis confirmed by a dermatologist and absence of arthritis by a rheumatologist. Healthy participants declared an absence of any disease or family history of psoriatic disease.
Three PsA patients and three PsC patients matched for age, sex, and psoriasis duration, and two healthy controls (HC) matched by age and sex, were selected for the discovery phase, while an independent cohort of 14 PsA patients, 17 PsC patients and 14 HC were selected for the validation phase (Table 1). All PsA patients fulfilled the CASPAR criteria and PsC patients were confirmed by a dermatologist to have psoriasis and by a rheumatologist not to have PsA. PASI was not controlled for, as this was an exploratory analysis entered on differences between PsA and PsC and not between cutaneous psoriasis disease severity. Race and ethnicity were self-reported; all patients were white. None of the patients had any history of other autoimmune diseases. The study was approved by the University Health Network Research Ethics Board (#18-5357) and all participants provided written informed consent.
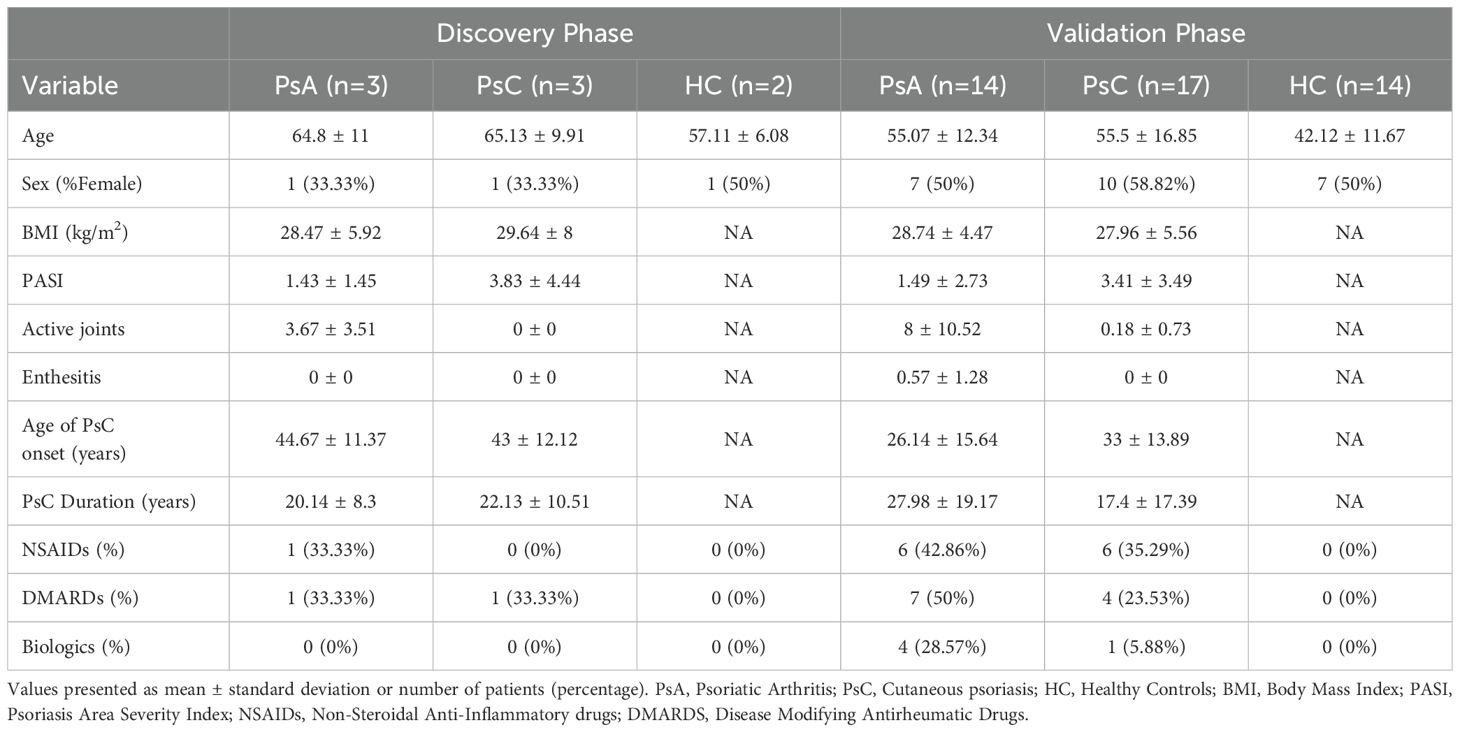
Table 1. Demographics and clinical information of the study groups selected for the discovery phase (scRNA-seq and TCR immune profiling) and the validation phase (gene expression in classical monocytes, CD4+ and CD8+ T cell subsets and immunoblotting).
Single-cell RNA-sequencing
10x Genomics 5’ scRNA-seq v2 with TCR immune profiling was performed at the Princess Margaret Genomics Centre (PMGC, Toronto, Canada) on frozen unsorted PBMCs isolated by ficoll-paque™ (GE Healthcare) using a standard protocol. Sample preparation and library construction was carried out following the manufacturer’s recommendations and scRNA-seq was performed on an Illumina HiSeq 2500 instrument at a depth of 50,000 reads per cell for gene expression libraries and 5,000 reads per cell for V(D)J TCR enriched libraries.
scRNA-seq data processing
The sequencing raw base call files were converted to FASTQ files and aligned to the GRCh38 reference human transcriptome using Cell Ranger v.3.1.0. Barcode-feature matrices were imported into R v.3.6.3 for analysis. Cells containing over 2.5 median absolute deviations (MADs) of mitochondrial content, ± 2.5 MADs library size and unique detected genes per cell were removed using Scater v.1.14.0. Normalization was performed using the scran package v.1.14.0 (16). Seurat v.3 (17) was used for dimensional reduction and clustering. In clusters where it was difficult to discern cell type, PanglaoDB v.27/03/2020 was used to detect cell markers for annotation (18). DEGs were detected across the three groups in a pairwise comparison. Pathway enrichment analysis of significant DEGs in each cell-type was performed using pathDIP v.4.0 (19), restricting the analysis to literature-curated pathways and experimentally detected interactions at a threshold of 0.99. Bonferroni correction was used to control for multiple testing.
scRNA-seq TCR immune profiling analysis
Cell Ranger v.3.1.0 was used to generate paired alpha and beta chain V(D)J single cell sequences. Secondary analysis was conducted in R v.4.0.1 using the following packages: scRepertoire v.1.4.0 (20), immunarch v.0.6.7, dunn.test v.1.3.5 and Seurat v.4 (21). Antigen specificity of expanded clonotypes was predicted using the VDJdb 2022 database (22).
Isolation of immune cells
CD8+ T cells, CD4+ T cells and classical monocytes were isolated from peripheral blood using positive selection with CD8 MicroBeads (Milteny Biotec, 130-045-201) and CD4 MicroBeads (Miltenyi Biotec, 130-045-101) and subsequently using the Classical Monocyte Isolation kit (Miltenyi Biotec, 130-117-337) via negative selection, following the manufacturers’ recommendations.
Immunoblotting
A total of 25ug of proteins was loaded into each well and SDS-PAGE was carried out. Proteins were transferred onto a PVDF membrane using the wet transfer method. Once complete, SYPRO® Ruby Protein Blot Stain (BIO-RAD) was added to perform downstream total protein normalization. Primary antibody incubation for IκBα (mouse mAb #4814, CST®) or A20/TNFAIP3 (rabbit mAb #5630, CST®) was performed overnight at 40C for 16 hours. Horse-Radish Peroxidase (HRP) linked IgG mouse or rabbit (CST®) secondary antibodies were incubated with the blot for 90 minutes at RT under agitation. Cytvia Amersham™ ECL™ Prime Western Blotting Detection Reagent was used to develop the blot.
Protein normalization and band detection was conducted on ImageLab (BIO-RAD). A multi-channel image was created which consisted of the bands for A20, IκBα and SYPRO® Ruby protein blot stain for total protein normalization. In all blots, HaCaT and THP cell lysates (Abcam) were loaded as positive controls. Band intensities were imported into R version v.4.0.1 and a Wilcoxon rank sum test was used to compare protein expression between the groups, when the difference was significant (p<0.05) follow-up pairwise Dunn tests were performed.
NanoString nCounter® assay
A custom nCounter® CodeSet probe panel (Supplementary Table 1) was designed to target differentially expressed genes (DEG) identified by scRNA-seq in the discovery phase. In addition to positive and negative hybridization controls, three housekeeping genes were included: Beta 2 Microglobulin (B2M), Glyceraldehyde 3-phosphate dehydrogenase (GAPDH) and Beta Actin (ACTB). NanoString® assays were carried out at the PMGC on the nCounter® platform using 100 ng total RNA input isolated using TRIzol®. RNA was hybridized with probes, loaded onto an nCounter® cartridge well and immobilized prior to being digitally analyzed. Normalized gene expression levels were used for DEG analysis using the three housekeeping genes. A Wilcoxon rank sum test was used to compare the gene expression of all three groups, if p<0.05, pair wise comparisons were made using a Dunn test.
Results
Cell types in scRNA-seq dataset
scRNA-seq was performed on three PsC, three PsA and two HC PBMC samples with 18 cell clusters being identified based on unique gene expression profiles (Supplementary Results). This included multiple T cell lineages, classical and non-classical monocytes, Natural Killer (NK) cells, B cells, and other populations such as myeloid dendritic cells (Figure 1, Supplementary Figure 1).
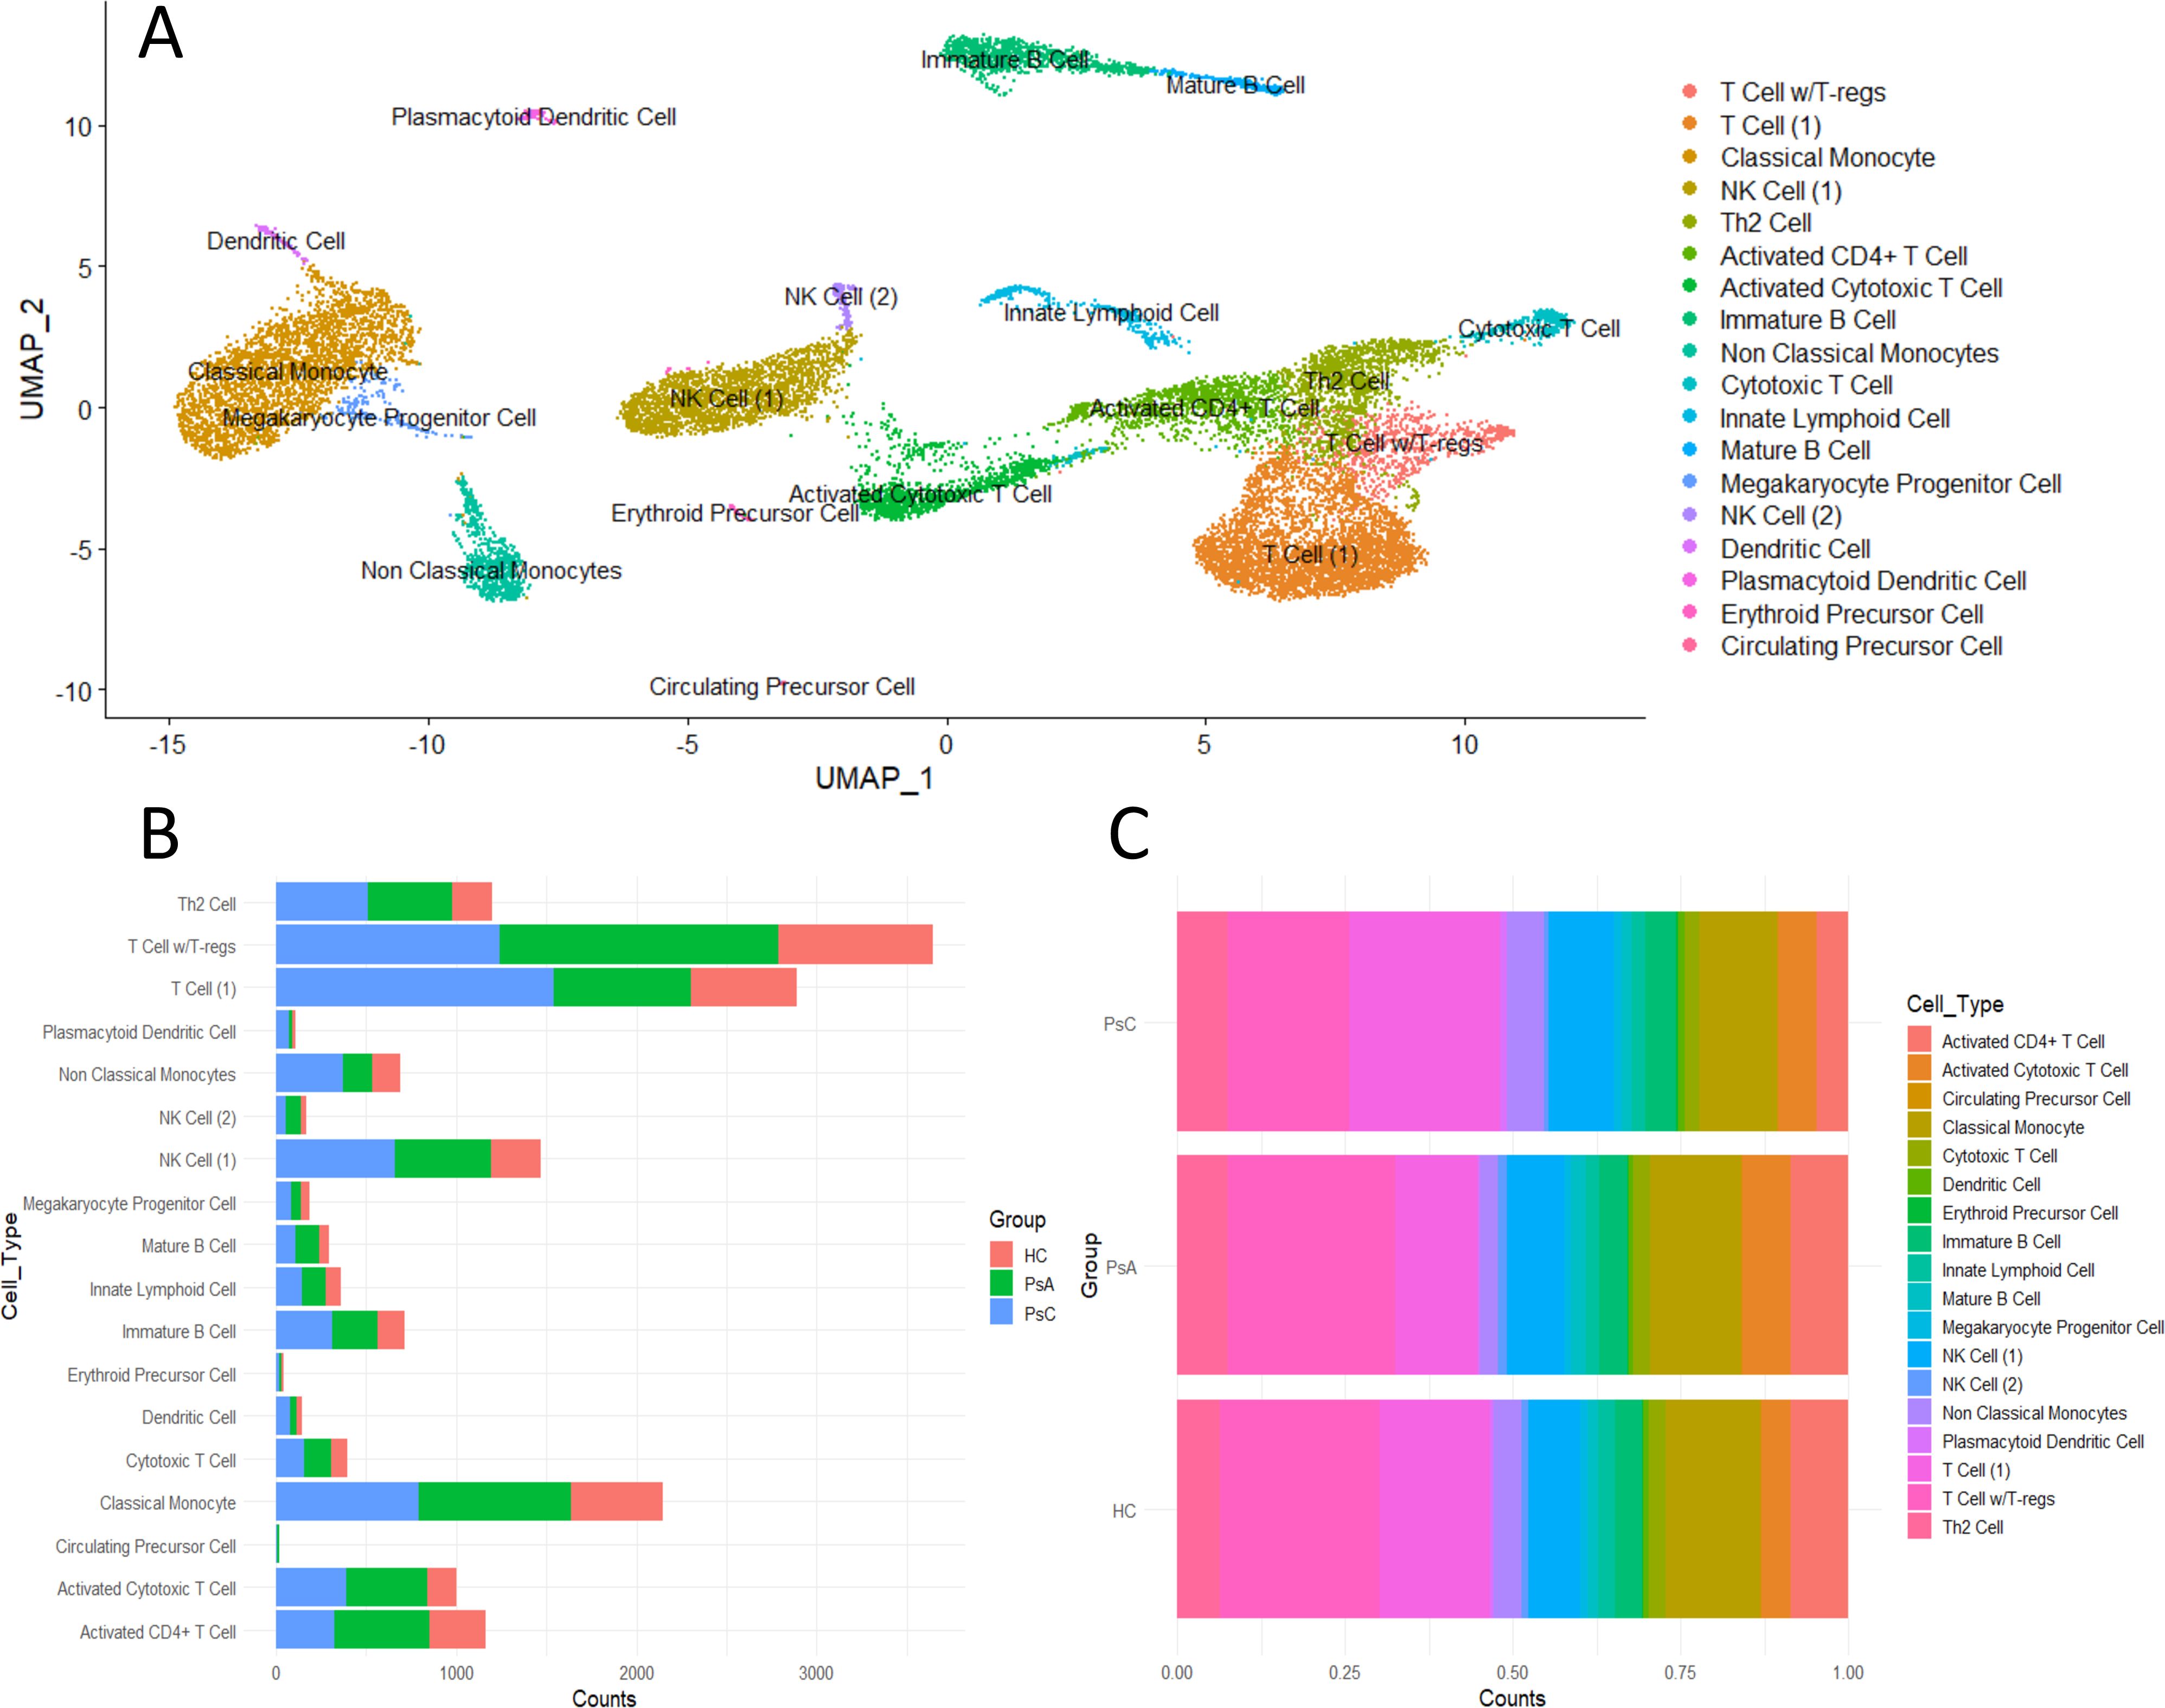
Figure 1. Immune landscape of scRNA-seq PBMC dataset containing 3PsA, 3PsC and 2 HC samples. (A) UMAP plot of identified cell clusters. (B) Detected cell counts in each cluster per group. (C) Proportion of cell clusters by group.
scRNA-seq differential gene expression analysis
Classical Monocyte
The pro-inflammatory genes, TNF, IL-1B, CCL3, and CCL4, were upregulated in PsC patients versus HC and PsA (Figure 2A). Of note, anti-inflammatory genes NFKBIA and TNFAIP3 were elevated in PsC patients as well. SNPs in both coding and non-coding regions of these genes have been associated with psoriasis through GWAS studies (23). Genes responsive to type-I interferons MNDA, IFITM3, IFI30, and IFI6 were upregulated in PsA compared to both PsC and HC. Pathway enrichment analysis found interferon signaling to be significantly over-represented in the PsA vs PsC comparison only (q-value= 3.15 x10⁻³). Pathways perturbed in PsC patients included NFκB signalling network (PsA vs PsC q-value = 2.69 x10⁻⁷, PsC vs HC q-value = 5.41 x10⁻¹⁷), IL-17 signaling (PsA vs PsC q-value = 1.18 x10⁻⁴, PsC vs HC q-value = 3.47 x10⁻⁷) and human cytomegalovirus infection (PsA vs PsC q-value = 1.14 x10⁻⁶ and PsC vs HC q-value = 4.48 x10⁻⁶).
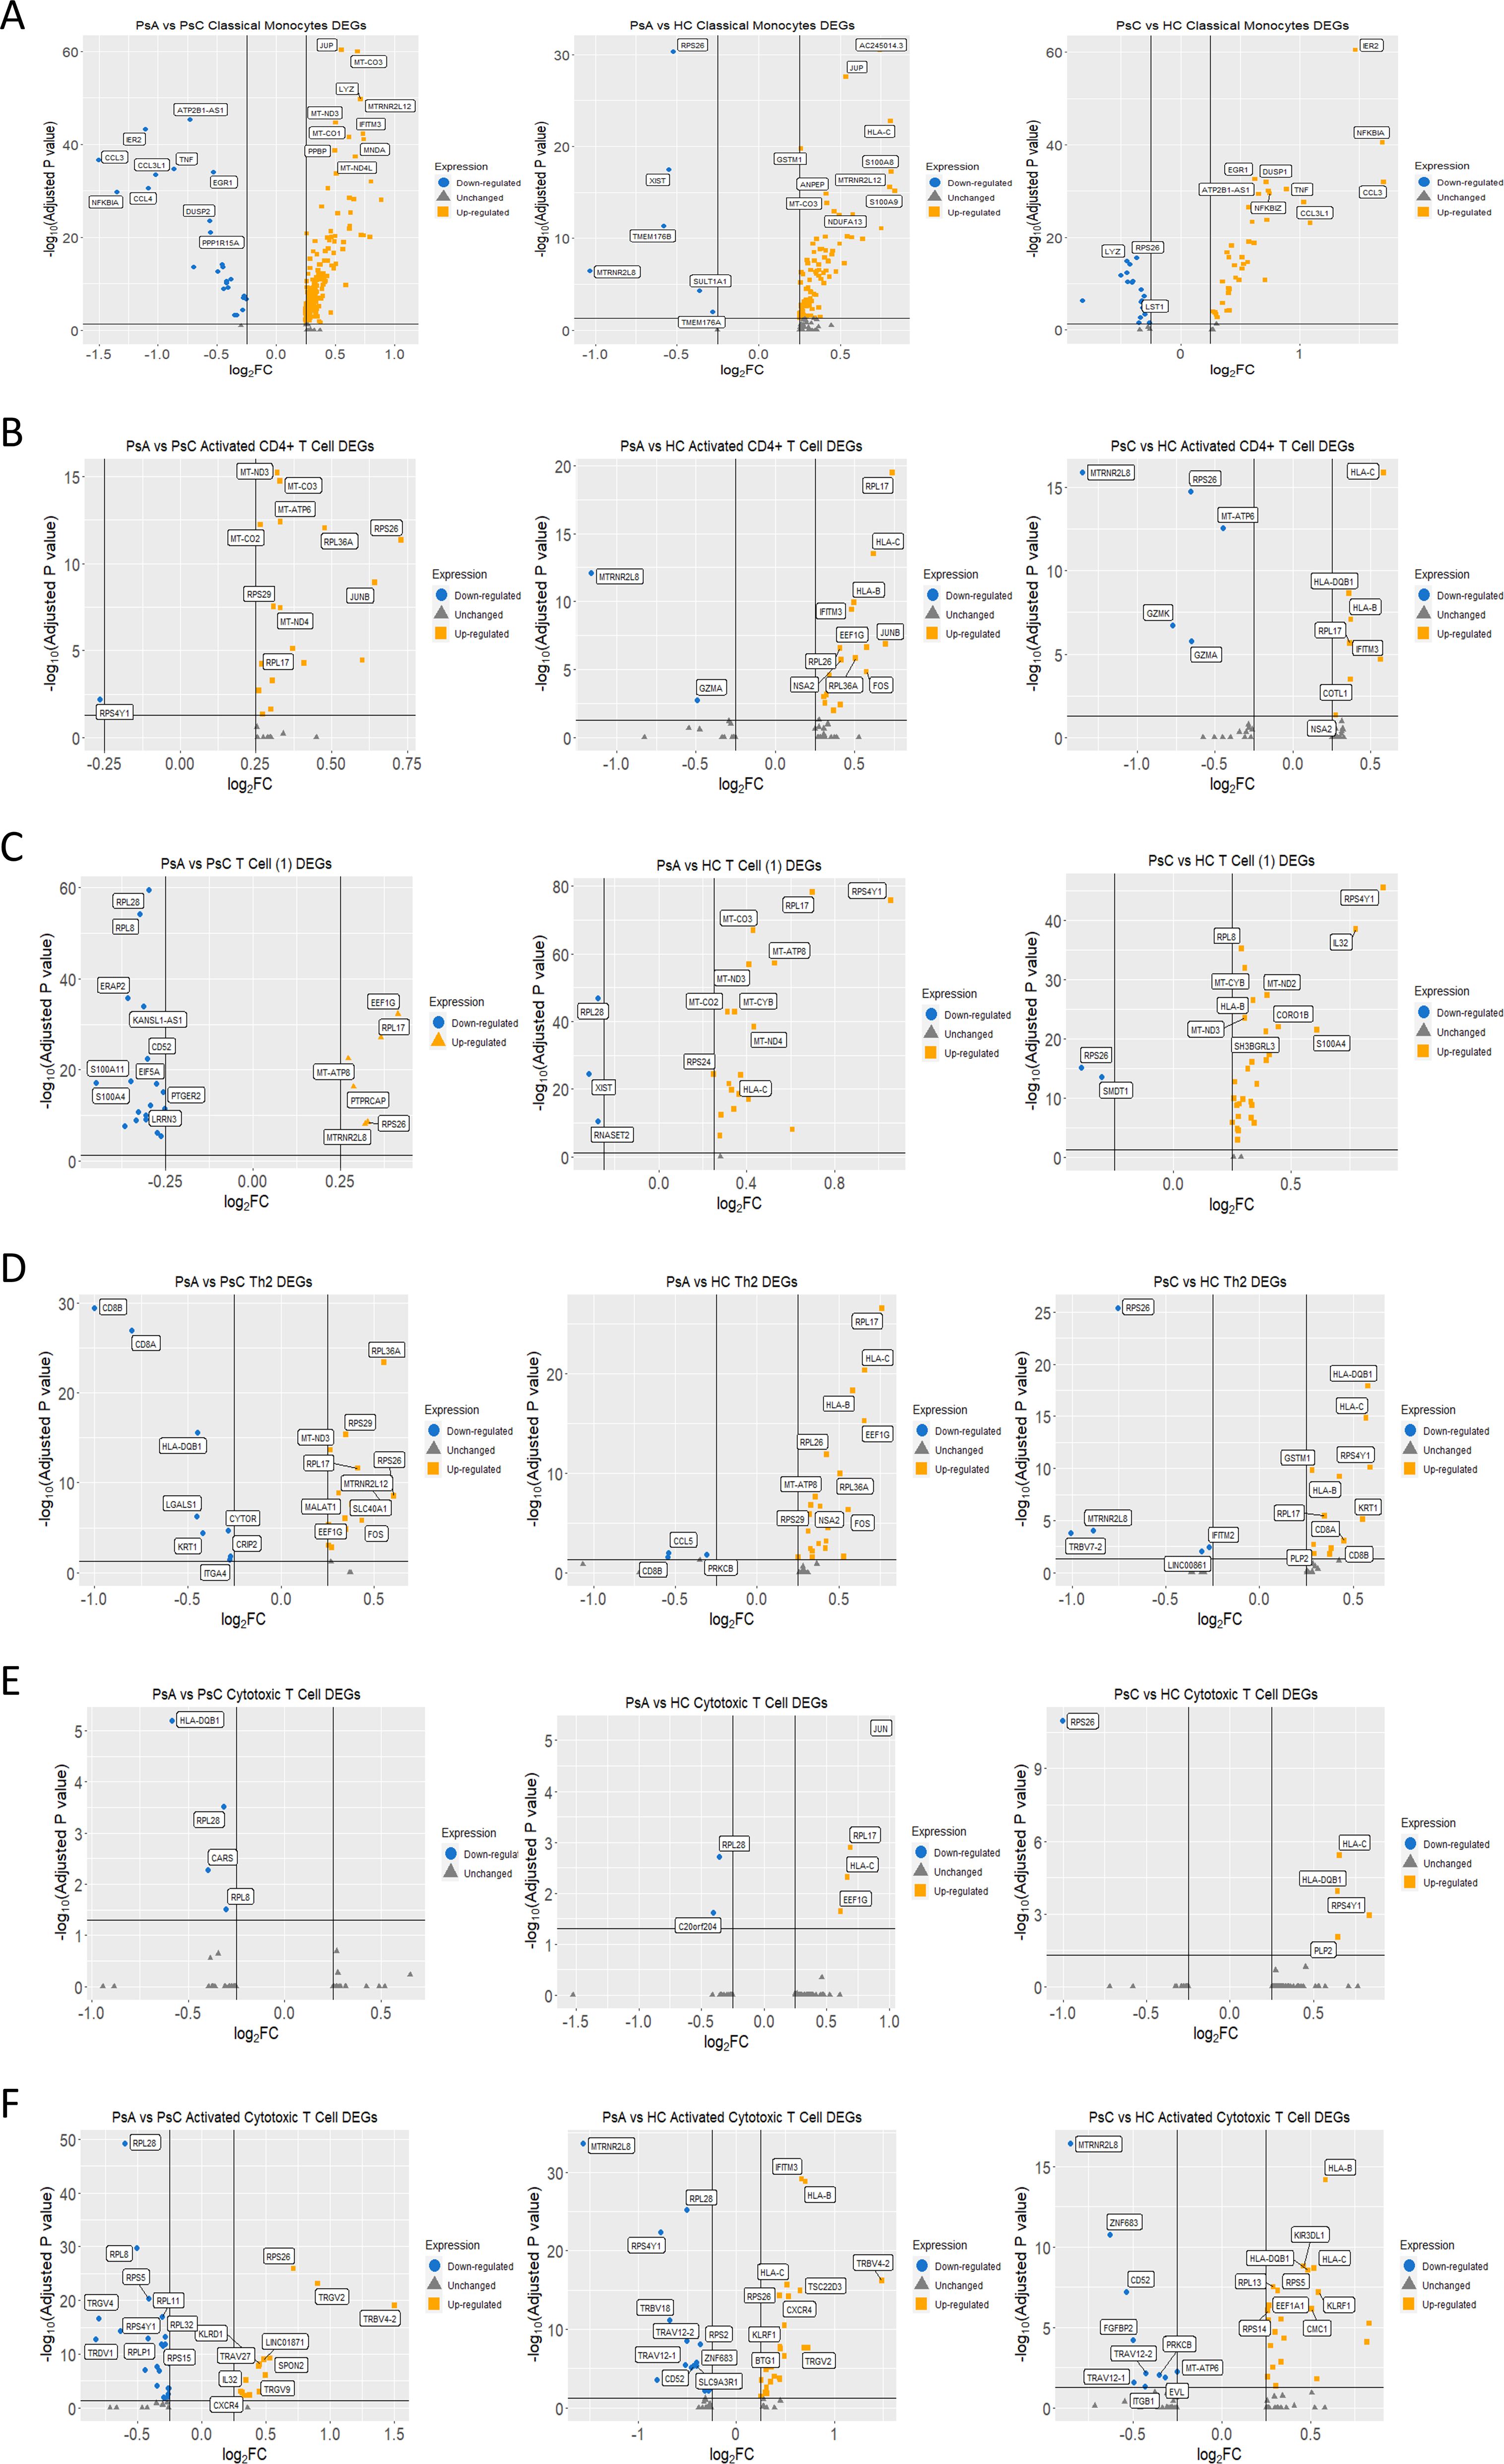
Figure 2. Differentially expressed genes from the scRNA-seq analysis. (A-F) Volcano plots comparing between groups by cluster. Genes labeled in yellow were upregulated, and genes labeled in blue were downregulated considering a logFC threshold of |0.25|.
Activated CD4+ T cell
JUNB and FOS, members of the AP-1 transcription factor family, were upregulated in PsA compared to HC and PsC (Figure 2B). The most significant over-represented pathway for PsA patients was nonsense mediated decay (NMD) independent of the exon-exon junction complex (EJC) (PsA vs PsC q-value = 5.49 x10⁻⁹, PsA vs HC q-value = 1.68 x10⁻⁵). Ribosomal genes RPL17, RPL26, RPL36A, RPS17, RPS26, RPS29, and RPS4Y1 contributed to this pathway. These genes were upregulated in PsA patients except RPS4Y1 (LOG2FC= -0.27, padj = 0.006), which was downregulated when compared to PsC (Figure 2B).
T Cell (1)
This global T Cell cluster had ribosomal and mitochondrial genes primarily overexpressed in PsA patients when compared to HC (Figure 2C) resulting in enrichment of metabolic pathways pertaining to oxidative phosphorylation (PsA vs HC q-value = 9.13 x 10⁻⁸) and the electron transport chain (q-value = 1.49 x 10⁻⁸). In the PsA vs PsC comparison, the ribosomal genes contributed to the enrichment of the NMD independent of EJC pathway (q-value = 0.012). The PsC vs HC comparison followed a similar trend, with most pathways that were significantly over-represented being related to translation or metabolic pathways, e.g., electron transport chain (OXPHOS system in mitochondria, q-value = 8.59 x10⁻⁴).
Th2 Cell
The DEGs in the PsA vs PsC comparison were enriched for pathways related to translation, including the NMD independent of EJC pathway (q-value = 3.18 x10⁻⁶). In the PsA vs PsC comparison, the antigen processing and presentation (q-value = 3.14 x10⁻³), IL12- mediated signaling events (q-value = 1.59 x10⁻³), and CD4 T cell receptor signaling -JNK cascade (q-value = 4.52 x10⁻²) were enriched with the genes CD8A (LOG2FC = -0.80, padj = 1.1 x10⁻²⁷), CD8B (LOG2FC = -1.00, padj= 4.06 x10⁻³⁰) and CD4 (LOG2FC = 0.26, padj = 5.04 x10⁻⁶) contributing mainly to the first two pathways. However, only 6.2% of cells in this cluster expressed CD8A in PsA patients whereas 37.5% expressed it in PsC. Similar proportions were observed for CD8B, expressed by 6.7% of cells in PsA and 35.1% of cells in PsC. In the PsC vs HC comparison the most significant enriched pathways were cell adhesion molecules (CAMs, q-value = 7.84 x10⁻⁷) and antigen processing and presentation (q-value = 2.17 x10⁻⁶). Several pathways related to autoimmunity, including: type I diabetes mellitus (q-value = 2.14 x10⁻³), graft-versus-host disease (q-value = 1.85 x10⁻³), allograft rejection (q-value = 1.35 x10⁻³), and autoimmune thyroid disease (q-value = 3.80 x10⁻³) were also enriched. In the PsA vs HC comparison the most significantly enriched pathways were the NMD independent of EJC pathway (q-value = 3.70 x10⁻⁷) and various pathways related to translation. Enrichment of AP-1 transcription factor network (q-value = 7.58 x10⁻³), TLR signaling (q-value = 3.49 x10⁻²), and TNF signaling (q-value = 4.52 x10⁻²) was found driven by DUSP1 (LOG2FC = 0.45, padj = 4.08 x10⁻⁶), JUN (LOG2FC = 0.42, padj =7.00 x10⁻⁴), JUNB (LOG2FC = 0.53, padj = 0.02), FOS (LOG2FC = 0.56, padj = 4.99 x10⁻⁷), and CCL5 (LOG2FC = -0.54, padj =9.48x10⁻³) (Figure 2D).
Cytotoxic T Cell
There was no significantly over-represented pathway for PsA vs HC after Bonferroni correction. In the PsA vs PsC comparison (Figure 2E), enriched pathways were related to protein translation, including the NMD independent of the EJC pathway (q-value = 4.62 x10⁻²). In the PsC vs HC (Figure 2E) comparison autoimmune thyroid disease (q-value = 7.52 x10⁻³) and type I diabetes mellitus (q-value = 5.12 x10⁻³) were significantly enriched.
Activated Cytotoxic T cell
PsA was characterized by significantly upregulated variable beta and alpha chains such as TRAV27 (LOG2FC = 0.45, padj= 1.69 x10⁻⁸) and TRBV4-2 (LOG2FC = 1.50, padj = 8.43 x10⁻²⁰) when compared to PsC (Figure 2F). PsA expression of TRBV4-2 when compared to HC was elevated as well (LOG2FC = 1.48, padj= 6.23 x10⁻¹⁷), suggesting a possible expansion of activated cytotoxic T cells. In both PsC and PsA patients, when compared to HC, IFITM3 expression was elevated. Pathways that were over-represented in PsA vs HC were the NMD independent of EJC (q-value = 1.17 x10⁻³), translation pathways, and human cytomegalovirus infection (q-value = 3.49 x 10⁻²). The NMD independent of EJC pathway (q-value = 2.69 x10⁻⁹) was also over-represented in the PsC vs HC comparison. In PsA vs PsC, NMD independent of EJC (q-value = 1.29 x10⁻²³) and other pathways related to translation were enriched, including viral mRNA translation (q-value = 6.15 x10⁻²²).
TCR immune profiling
Clonal expansion varied in the 3 groups. PsC patients did not show the same degree of clonal expansion as PsA patients (Supplementary Figure 2). To identify the cellular source of the T cell expansions, clonotype information was superimposed onto the cellular clusters. The clonotypes showing a large expansion were primarily restricted to the Activated Cytotoxic T Cell cluster (Supplementary Figure 3). Of note, the two highest clonotypes in PSA3 might represent the same hyper expansion in response to antigen (Supplementary Figure 2C, Supplementary Table 2).
Activated Cytotoxic T Cell subclusters
Sub-clustering of the activated cytotoxic T cell cluster was performed using five principal components (Supplementary Figure 4). All individuals in the dataset contributed cells to each of the six subclusters (Supplementary Figure 4B). Marker genes defining the cellular subtypes included GZMK, GZMB, GZMH, ZNF683, CD3D, CD8A, CD8B and TRGV2 (Supplementary Figure 4C). The largest subcluster was defined by having high GZMK expression with moderate expression of other granzymes GZMB and GZMH. The NK cell phenotype subcluster was defined by low expression of CD3D, CD3G, CD8A and CD8B, but high expression of granzymes GZMK, GZMB, GZMH and granulysin (GNLY) (Supplementary Figure 4C). Clonotype overlap coefficients were high amongst subclusters with low cell numbers (Supplementary Figure 5B). The subclusters with the largest clonal expansions were the ZNF683+ and GZMH & GZMB HIGH, TRGV2 LOW subclusters (Supplementary Figure 5C).
Identifying the Cellular Identity of the top 5 clonotypes
Four of the top five clonotypes were found in PsA patients (Supplementary Figure 2D). To assess the cellular identity of these five clonotypes, the amino acid sequence of each clonotype was used to subset the cellular subcluster identities visualized on a UMAP plot (Figure 3). Clonotypes from PsA patients were found in cells with heterogeneous transcriptional profiles (Figures 3A–C, E). Whereas the clonotype from HC2 was found only in cells of the ZNF683+ subcluster (Figure 3D). The two most abundant clonotypes were found in the same patient, across multiple cell subclusters, but primarily in the GZMH & GZMB HIGH, TRGV2 LOW subcluster supporting the notion that these two clonotypes are likely the same and represent a hyper expansion in response to an antigen.
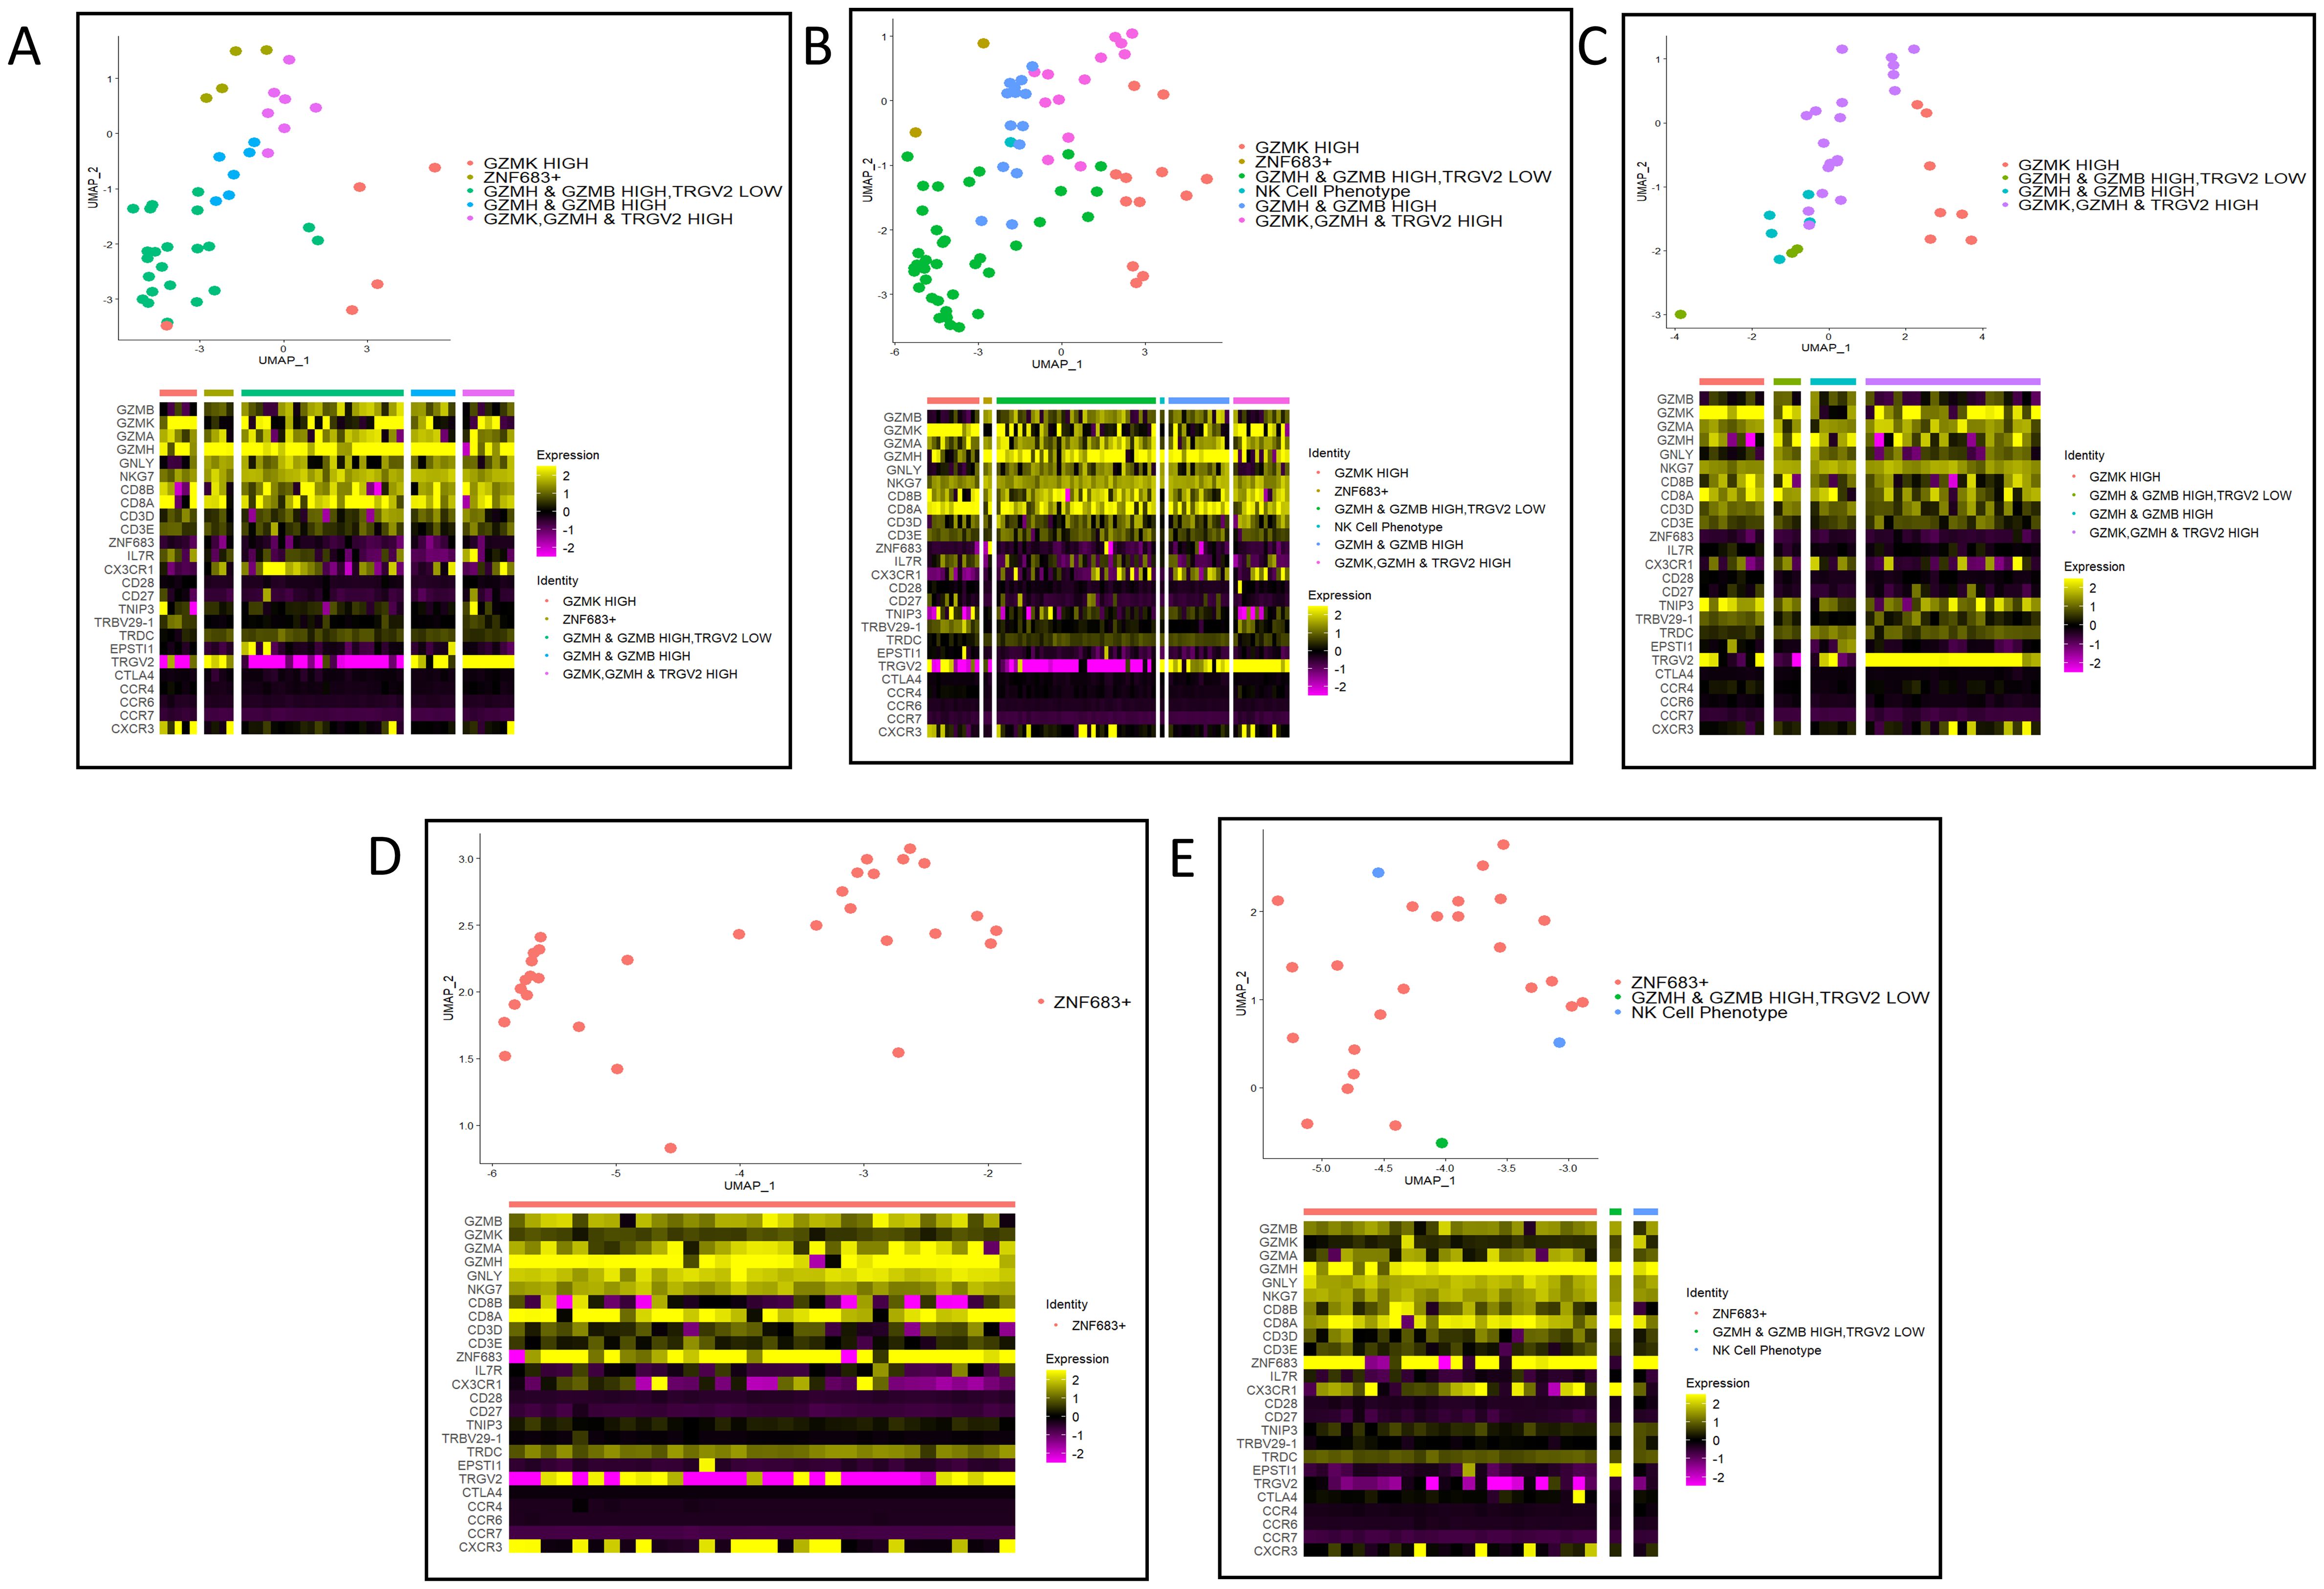
Figure 3. Cellular subcluster identities of the top five expanded clonotypes. (A) NA_CASSQDVWGGWSTGELFF clonotype from PSA3. (B) CAGGNSGNTPLVF_CASSQDVWGGWSTGELFF clonotype from PSA3. (C) CAAPSYNNARLMF_ CASSLDGWDYNEQFF clonotype from PSA1. (D) CAVDNFNKFYF_CASSPTMNTEAFF clonotype from HC2. (E) CILMDGGATNKLIF_ CASSLEGGTFYTEAFF clonotype from PSA1.
NanoString nCounter® DEGs
A custom panel was derived from DEGs identified in the scRNA-seq dataset. A total of 8 HC, 12 PsA and 11 PsC patients were included in the Classical Monocyte experiment. A Kruskal Wallis test comparing the three groups found no gene significantly differentially expressed (p > 0.05) in these cells. In the CD4+ T cell assay 8 HC, 13 PsA and 11 PsC patients were included. C-FOS (p-value = 0.04), JUNB (p-value < 0.01), NFKBIA (p-value = 0.01), CXCL8 (p-value = 0.02), C-JUN (p-value = 0.04), and TNFAIP3 (p-value = 0.01) were significantly DEGs according to a Kruskal Wallis test (Supplementary Figure 6). In the CD8+ T cell assay 6 HC, 13 PsA and 11 PsC patients were included. Four genes were DEGs across the three groups: TNFAIP3 (p-value = 0.03), C-JUN (p-value = 0.04), JUNB (p-value = 0.01) and NFKBIA (p-value = 0.04) (Supplementary Figure 7).
Immunoblotting of IκBα and NFKBIA transcript levels
10 HC, 11 PsA and 12 PsC patients were included in the CD4+ immunoblotting assays, while 13 HC, 12 PsA and 17 PsC patients were included in the CD8+ assays. In CD4+ T cell lysates PsA patients had higher relative levels of IκBα compared to HC and PsC patients (Figures 4A, B). PsA patients also had higher NFKBIA transcript levels than HC in CD4+ T- cells (Figure 4C). In CD8+ T cell lysates PsA patients had significantly lower levels of IκBα than HC (Figures 4D, E). PsC patients also had lower levels of IκBα in CD8+ T cell lysates compared to HC (Figure 4E). This contrasts with the NFKBIA transcript levels, which were higher in PsA compared to HC (Figure 4F). IκBα levels in CD4+ T cell lysates compared to IκBα levels in CD8+ T cell lysates in PsA patients were higher (Figure 4G). This was discordant to the pattern observed in HC, where CD8+ T cell lysates had higher IκBα levels than CD4+ T cell lysates (Figure 4H). Whereas IkBa levels were similar in both cell types in the PsC cohort (Figure 4I).

Figure 4. IκBα and NFKBIA expression. Representative immunoblot, IκBα band intensities and NFKBIA transcript levels in CD4+ T cell lysates (A-C) and CD8+ T cell lysates (D-F), respectively). Comparison of IκBα band intensities in CD4+ T and CD8+ T cell lysates in (G) PsA patients, (H) healthy controls and (I) PsC patients. THP and HaCaT cell lysates are used as positive controls. ns non-significant, * p-value < 0.05 & ** p-value <0.01 according to a pairwise Wilcoxon Rank Sum test.
Immunoblotting of A20 and TNFAIP3 transcript levels
10 HC, 11 PsA and 12 PsC patients were included in the CD4+ immunoblotting assays, while 13 HC, 12 PsA and 17 PsC patients were included in the CD8+ assays. In PsA CD4+ T cell lysates, A20 levels were higher compared to HC (Figures 5A, B). PsA patients had higher TNFAIP3 transcript levels than HC in CD4+ T cells (Figure 5C). In CD8+ T cell lysates the expression of A20 was lower in PsA patients compared to HC (Figures 5D, E). TNFAIP3 levels in CD8+ T cells were higher in PsA compared to HC (Figure 5F). PsA patients had lower A20 levels in CD8+ T cell lysates than CD4+ T cell lysates (Figure 5G). A20 levels in CD4+ and CD8+ T cell lysates in HC and PsC were similar (Figures 5H, I). A20 was decreased in PsA CD8+ T cell lysates compared to PsA CD4+ T cell lysates (Supplementary Figure 8).
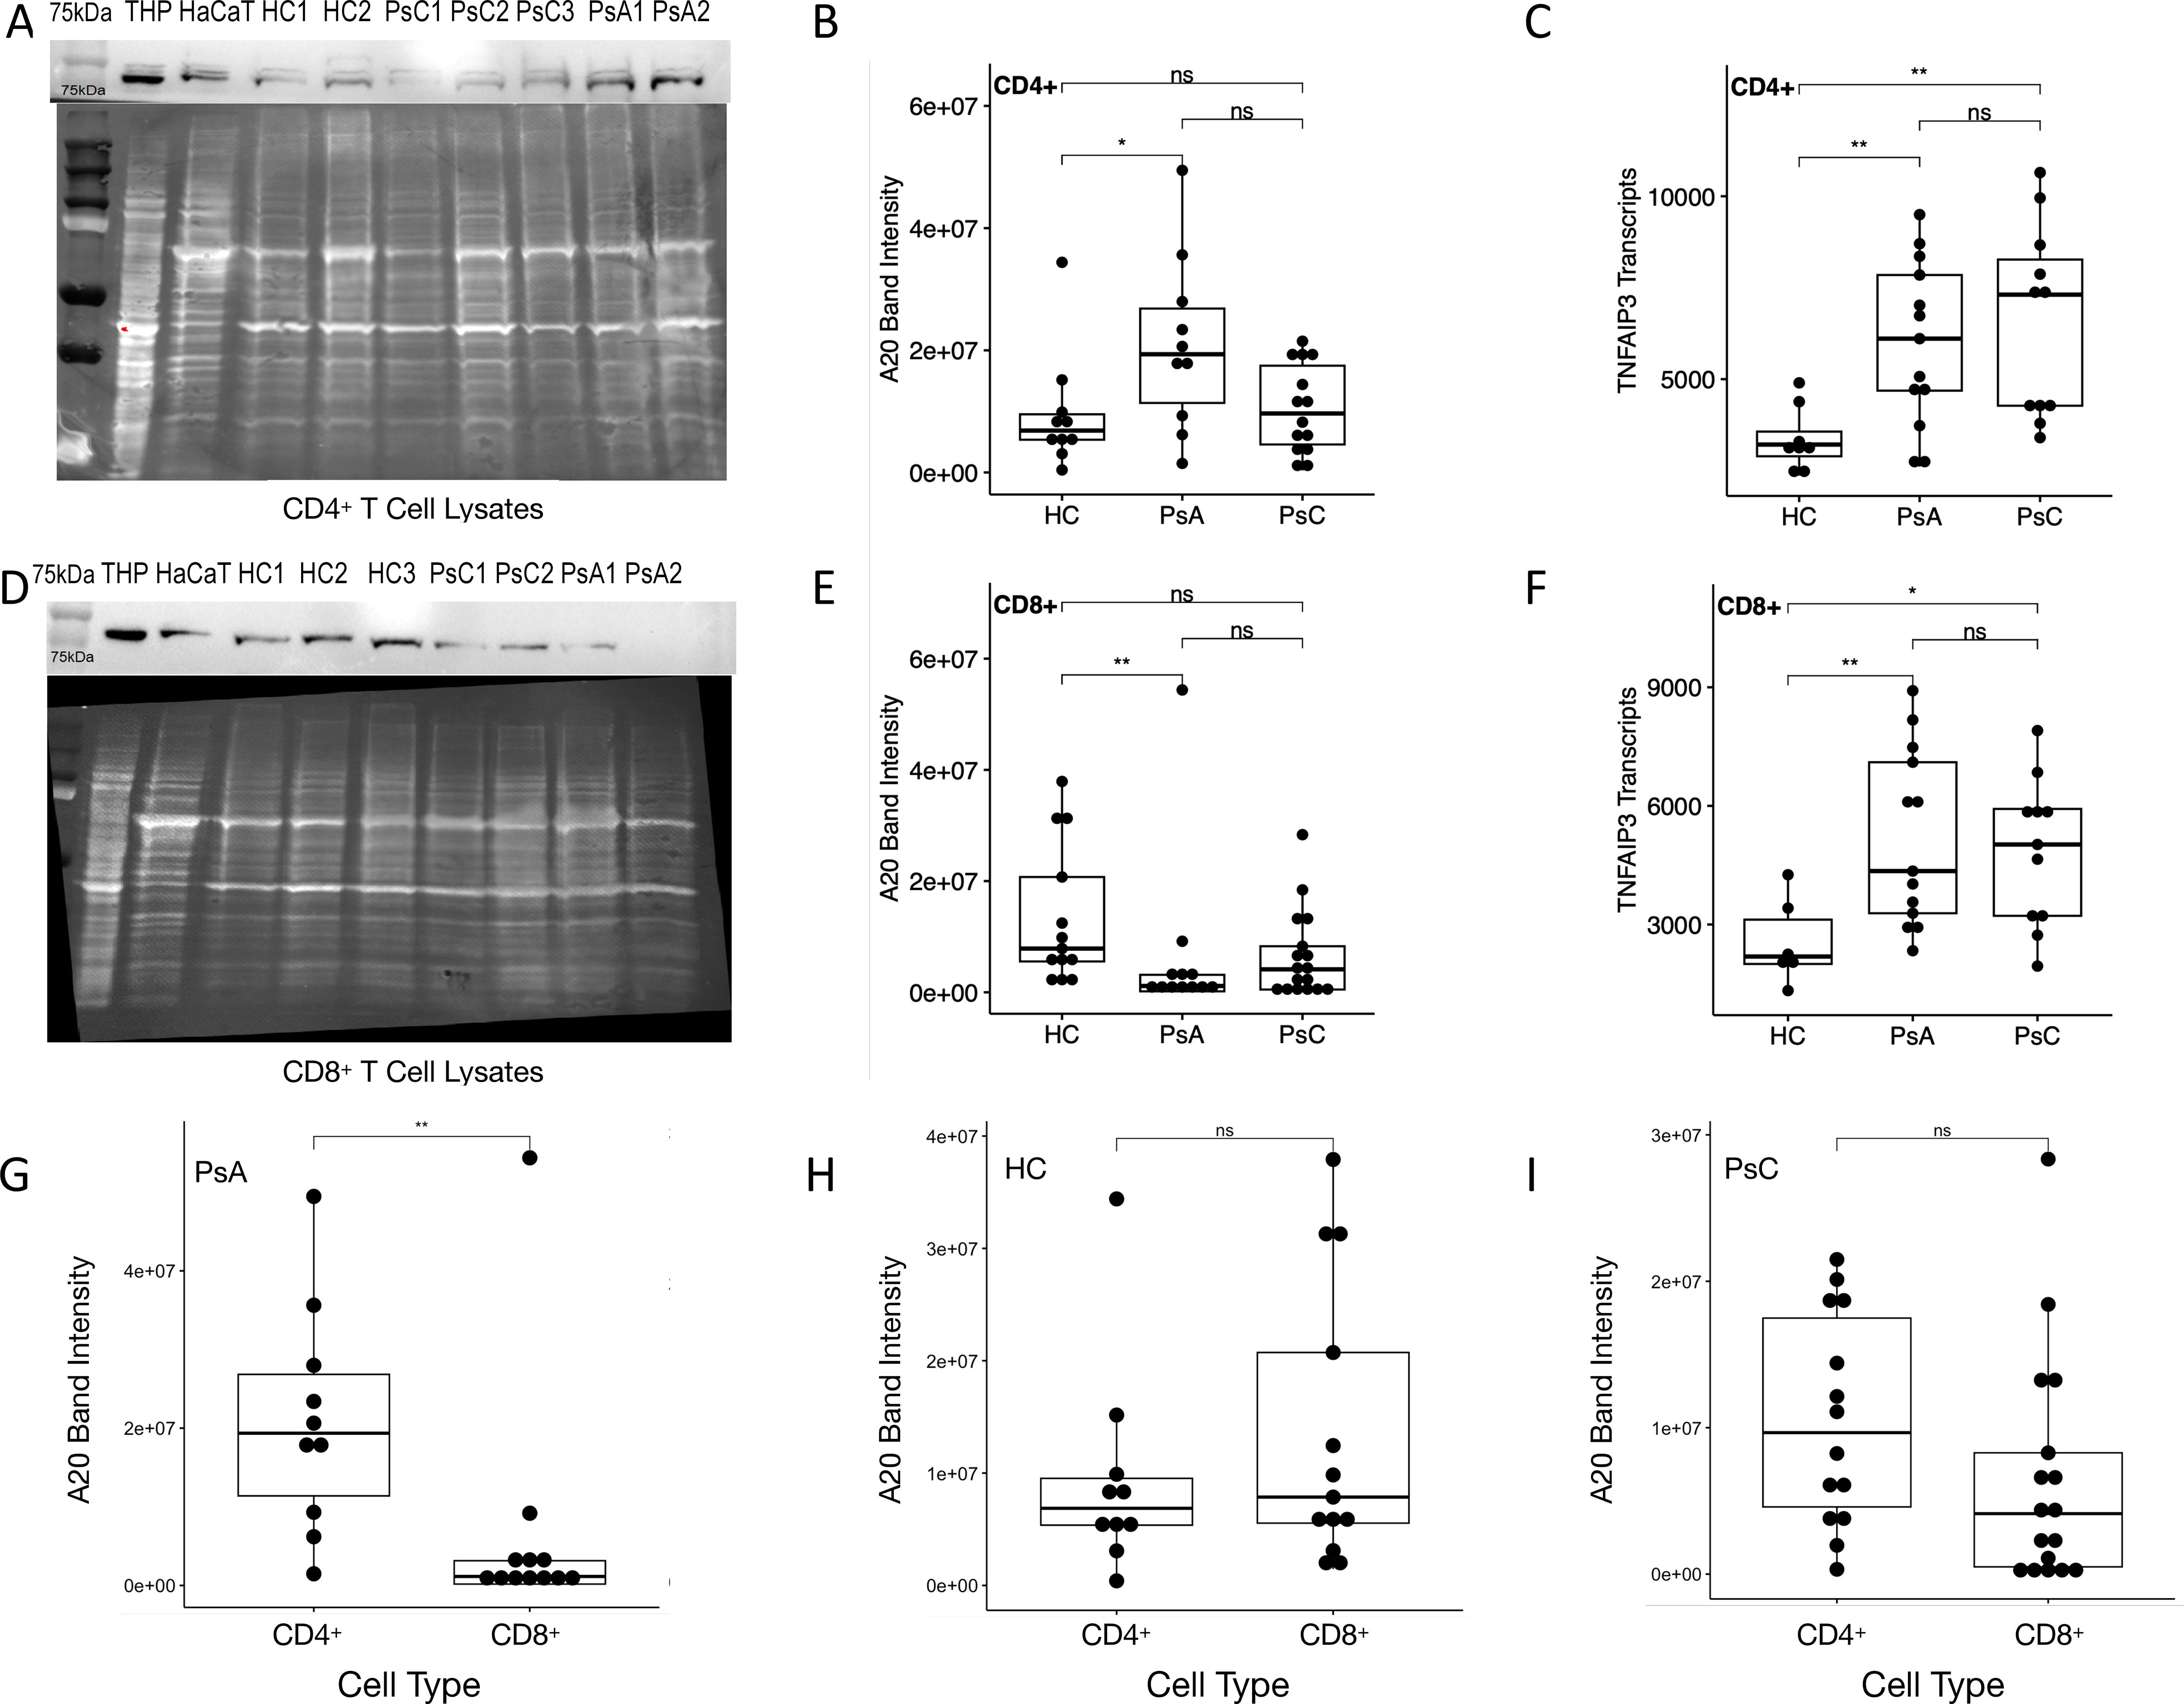
Figure 5. A20 and TNFAIP3 expression. Representative immunoblot, A20 band intensities and TNFAIP3 transcript levels in CD4+ T cell lysates (A-C) and CD8+ T cell lysates (D-F), respectively). Comparison of A20 band intensities in CD4+ T and CD8+ T cell lysates in (G) PsA patients, (H) healthy controls and (I) PsC patients. THP and HaCaT cell lysates are used as positive controls. ns non-significant, * p-value < 0.05 & ** p-value <0.01 according to a pairwise Wilcoxon rank sum test.
Discussion
Here, we harnessed scRNA-seq to identify potential susceptibility factors for psoriatic disease. Of note, a previous single-cell sequencing report found significant deregulation of ribosomal protein genes in PsA patients when compared to psoriasis across cell types, and deregulation of AP-1 transcription factors in T cell and NK cell clusters. These findings are partially supported by our own observations in the Activated CD4+ T cell cluster. The role of classical monocytes in psoriasis pathology is largely unknown. We observed monocyte DEGs were enriched for pathways related to TNF, Interferon, NFκB and IL-17 signaling as well as osteoclast differentiation. All these pathways have previously been associated with psoriatic disease (24–27). Polymorphisms in the TNF gene, specifically the 238 (G➔A) variant, are risk factors for PsA (28). TNF and other pro-inflammatory genes such as CCL3, CCL4, and IL1B were upregulated in PsC patients compared to PsA and HC. However, these genes are generally associated with intermediate monocytes (29). On the other hand, anti-inflammatory genes NFKBIA and TNFAIP3 were elevated in PsC patients as well. We sought to validate the DEGs identified in the Classical Monocyte cluster on the NanoString nCounter® platform but could not replicate the findings in an independent cohort. This was possibly due to our scRNA-seq DEGs being driven by one individual in the PsC group of our scRNA-seq dataset, which may have been a result of TLR stimulation (30) in the Classical Monocyte cluster (Supplemntary Figure 8). However, given the interesting set of DEGs in the monocyte cluster, we decided to investigate them in a separate cohort of patients in CD8+ and CD4+ T cells using a custom NanoString nCounter® gene panel.
At the bulk RNA level PsA patients had upregulated TNFAIP3 and NFKBIA compared to HC in both CD4+ and CD8+ T cells. PsC patients showed the same upregulation in CD4+ and CD8+ T cells for TNFAIP3, while NFKBIA was upregulated only in CD4+ cells compared to HC. Both genes encode proteins, A20 and IκBα respectively, that can negatively regulate inflammation (31, 32). TNFAIP3 transcripts are lower in lesional epidermis of psoriasis patients than in uninvolved epidermis, and that of HC, indicating an inflammatory state in keratinocytes (33). In contrast to our findings, others have shown that TNFAIP3 transcripts were lower in whole blood of psoriasis patients compared to healthy controls, and that A20 levels were lower in psoriatic skin biopsies compared to HC skin (34). In our dataset, PsA patients showed higher expression of A20 in CD4+ T cells compared to both HC and PsC, which is consistent with the nCounter® data, where PsA patients only had elevated TNFAIP3 transcripts compared to HC. However, CD8+ T cell PsA lysates had lower expression of A20 compared to HC, which contrasts the nCounter® findings. This may suggest that TNFAIP3 transcripts are not being translated into A20 in PsA CD8+ T cells or that the protein is being degraded.
Translational blocking in CD8+ T cells could be due to miRNA silencing. One of many miRNAs that target TNFAIP3 is miR-125b-5p, which was recently found to be an important regulator of IL-1B induced inflammation in synovial osteochondrocytes in osteoarthritis (35). miRNA sequencing experiments of isolated cell subsets from PsA patients would be needed to clarify if TNFAIP3 translation is repressed by miRNA. Alternatively, translation of TNFAIP3 may be reduced due to a dysfunctional NMD pathway. The NMD independent of the EJC pathway was the most significantly enriched pathway in our scRNA-seq dataset across all clusters and pairwise comparisons, largely attributed to differential expression of ribosomal protein genes. Recently, increased expression of ribosomal proteins in PBMCs of PsA patients was identified when compared to psoriasis and healthy controls (36). Cell specific NMD pathway dysfunction in mice produces a variety of disease phenotypes (37). No canonical member of the NMD pathway was deregulated in our scRNA-seq dataset, however the ribosomal proteins that make up the UPF1:eRF3 complex on translated mRNA in the NMD pathway were altered at the transcript level (38). A dysfunctional 60s or 40s ribosomal unit may lead to aberrant activity of the UPF1:erf3 complex and subsequently lead to translation inhibition. Measuring phosphorylated UPF1 in CD8+ T cells of PsA patients would enable assessment of NMD pathway activity since phosphorylation of UPF1 precedes transcript degradation but is intimately involved in translational repression (39). Interestingly, in a study that tried to classify psoriasis patients, healthy controls and PsA patients using single-cell transcriptomics and cell surface epitopes, differential expression of both mitochondrial (MT-CO3, MT-ND1, MT-ND3) and ribosomal protein (RPS26) genes were detected across most cell types when comparing PsA to psoriasis or healthy controls (15).
IκBα also exhibited a similar pattern of expression to A20: elevated NFKBIA transcripts in PsA CD8+ T cells and decreased IκBα in PsA CD8+ T cells. As previously mentioned, translation inhibition and even transcript degradation could be due to aberrant miRNA activity in CD8+ T cells by miR-300 or four other miRNAs that target NFKBIA – miR-381-3p, miR-624-5p, miR-4687-3p and miR-6802-3p (40).
The T cell immune profiling data provided evidence of possible antigenic selection occurring in PsA. Notably all expanded clonotypes were observed in the activated cytotoxic T cell cluster. This finding is consistent with a recent study that performed scRNA-seq on paired PsA synovial fluid and peripheral blood showing that pronounced T cell clonal expansions were CD8+ T cells and were more expanded in the synovial fluid than in the peripheral blood (13). They did not, however, use a control cohort to compare the PsA T cell expansions observed in the peripheral blood. We observed varying transcriptional states among activated cytotoxic T cells within the top five clonotypes in our dataset.
The one HC expansion was characterized by a ZNF683+ phenotype whereas PsA was characterized by most cells having different types and degrees of granzyme gene expression. ZNF683+ CD8+ T cells are considered long lived effector-type T cells that are essential in combating CMV infection (41). CMV infects about 50% of all adults by the age of 40 and generally remains latent in myeloid cells throughout one’s lifetime, and these T cells have been shown to combat the CMV reactivation phase (42). The high expression of GZMB in the expanded PsA CD8+ T cells is indicative of effector cytotoxic T cells as GZMB exists in cytotoxic granules and is used to kill virally infected cells (43). In our dataset we found two clonotypes which likely represent the same expansion, making up 10% of the TCR repertoire for one PsA patient. This clonotype was found across effector-like cells characterized broadly by high GZMH and GZMB expression. HLA-typing information on this patient allowed us to predict antigen specificity using the VDJdb database (22). The predicted epitope was IE1 from CMV. Psoriasis is more severe in CMV seropositive individuals (44). In PsA, CMV DNA was found to be present in 3/6 synovial tissues analyzed by DNA in situ hybridization (45). Two of six specimens demonstrated CMV early antigen positivity indicative of a replicative state of the CMV virus (45). Recently, a review reported that CMV likely plays a role in the inflammation status of RA but is protective of bone erosions (46). CMV has been proposed as a potential trigger of multifactorial components that ultimately lead to the onset of PsA and autoimmune diseases.
One of the limitations of this study is the small sample size of the scRNA-seq and Nanostring dataset. PsA and PsC patients selected for scRNA-seq had low disease activity. Patients with higher disease activity could provide better signals associated with disease. However, PsA patients with the highest disease activity are more likely to be on systemic biological therapies, which alters genetic signatures across whole blood in RA patients (47), and likely does the same in PsA patients making them ineligible for studies of this nature. Additionally, patients were matched for the scRNA-seq dataset, but not for the NanoString nCounter® experiment. Age was significantly different among the three groups. Another limitation is potential imperfect isolation of CD4+ and CD8+ T cells in our nCounter® experiment, which may obscure expression patterns unique to each cell type. All these factors may have contributed to the significant DEGs being identified in the experiments.
Further studies may include patients with PsC prior to development of PsA including collection of PBMCs over time, since in most cases psoriasis precedes the onset of PsA (48). Capturing the biological changes of PBMCs in a PsC to PsA conversion would help elucidate the etiology of disease. However, this type of study is viable but logistically difficult due to the average annual conversion rate of PsC patients to PsA being only 2.7% (49).
Given that TNFAIP3 and NFKBIA are important in regulating inflammation and our study demonstrates translational inhibition, it would be interesting to explore if inhibiting these inflammation pathways are viable therapeutic options for PsA (32, 50). These results contribute to a growing body of literature linking CD8+ Cytotoxic T-cells to the pathogenesis of PsA, which is regarded as an MHC Class I mediated disease (13, 51, 52).
Data availability statement
The original contributions presented in the study are included in the article/Supplementary Material. Further inquiries can be directed to the corresponding author/s.
Ethics statement
The studies involving humans were approved by University Health Network Research Ethics Board. The studies were conducted in accordance with the local legislation and institutional requirements. The participants provided their written informed consent to participate in this study.
Author contributions
AG: Investigation, Project administration, Formal analysis, Visualization, Writing – original draft, Writing – review & editing, Conceptualization, Methodology. RM: Conceptualization, Writing – original draft, Writing – review & editing, Investigation. OC: Investigation, Writing – original draft, Writing – review & editing, Data curation, Methodology. DG: Writing – review & editing, Data curation. SC: Investigation, Writing – original draft, Writing – review & editing, Data curation, Methodology. JW: Investigation, Writing – original draft, Writing – review & editing, Data curation, Methodology. IJ: Investigation, Writing – original draft, Writing – review & editing, Formal analysis, Validation. DDG: Conceptualization, Data curation, Formal analysis, Funding acquisition, Investigation, Methodology, Project administration, Resources, Software, Supervision, Validation, Visualization, Writing – original draft, Writing – review & editing.
Funding
The author(s) declare financial support was received for the research, authorship, and/or publication of this article. This study was partially funded by a grant from the Canadian Institutes of Health Research (Grant number 23-5177). The Psoriatic Disease Research Program is funded by a grant from the Krembil Foundation.
Conflict of interest
Work done by Rohan Machhar was conducted prior to any industry affiliation. The authors declare that the research was conducted in the absence of any commercial or financial relationships that could be construed as a potential conflict of interest.
Publisher’s note
All claims expressed in this article are solely those of the authors and do not necessarily represent those of their affiliated organizations, or those of the publisher, the editors and the reviewers. Any product that may be evaluated in this article, or claim that may be made by its manufacturer, is not guaranteed or endorsed by the publisher.
Supplementary material
The Supplementary Material for this article can be found online at: https://www.frontiersin.org/articles/10.3389/fimmu.2025.1483393/full#supplementary-material
References
1. Gudu T, Gossec L. Quality of life in psoriatic arthritis. Expert Rev Clin Immunol. (2018) 14(5):405–17. doi: 10.1080/1744666X.2018.1468252
2. Freites Nuñez D, Madrid-García A, Leon L, Candelas G, Núñez M, Bello N, et al. Factors associated with health-related quality of life in psoriatic arthritis patients: a longitudinal analysis. Rheumatol Ther. (2021) 8(3):1341–54.
3. Rosen CF, Mussani F, Chandran V, Eder L, Thavaneswaran A, Gladman DD. Patients with psoriatic arthritis have worse quality of life than those with psoriasis alone. Rheumatology. (2011) 51(3):571–6.
4. Merola JF, Espinoza LR, Fleischmann R. Distinguishing rheumatoid arthritis from psoriatic arthritis. RMD Open. (2018) 4(2):e000656. doi: 10.1136/rmdopen-2018-000656
5. Daugaard C, Iversen L, Hjuler KF. Comorbidity in Adult Psoriasis: Considerations for the Clinician. Psoriasis (Auckl). (2022) 12:139–50.
6. Bu J, Ding R, Zhou L, Chen X, Shen E. Epidemiology of Psoriasis and Comorbid Diseases: A Narrative Review. Front Immunol. (2022) 13. doi: 10.3389/fimmu.2022.880201
7. Shiba M, Kato T, Izumi T, Miyamoto S, Nakane E, Haruna T, et al. Risk of myocardial infarction in patients with psoriasis: A cross-sectional patient-population study in a Japanese hospital. J Cardiol. (2019) 73(4):276–9. doi: 10.1016/j.jjcc.2018.10.008
8. Liu JT, Yeh HM, Liu SY, Chen KT. Psoriatic arthritis: Epidemiology, diagnosis, and treatment. World J Orthop. (2014) 5(4):537–43. doi: 10.5312/wjo.v5.i4.537
9. Ogdie A, Gelfand JM. Clinical risk factors for the development of psoriatic arthritis among patients with psoriasis: A review of available evidence. Curr Rheumatol Rep. (2015) 17(10):64. doi: 10.1007/s11926-015-0540-1
10. Zabotti A, De Lucia O, Sakellariou G, Batticciotto A, Cincinelli G, Giovannini I, et al. Predictors, risk factors, and incidence rates of psoriatic arthritis development in psoriasis patients: a systematic literature review and meta-analysis. Rheumatol Ther. (2021) 8(4):1519–34. doi: 10.1007/s40744-021-00378-w
11. Dures E, Bowen C, Brooke M, Lord J, Tillett W, McHugh N, et al. Diagnosis and initial management in psoriatic arthritis: a qualitative study with patients. Rheumatol Adv Pract. (2019) 3(2). doi: 10.1093/rap/rkz022
12. Chandran V. Pathway to biomarker discovery in psoriatic arthritis. Expert Rev Clin Immunol. (2020) 16(5):471–8. doi: 10.1080/1744666X.2020.1752667
13. Penkava F, Velasco-Herrera MDC, Young MD, Yager N, Nwosu LN, Pratt AG, et al. Single-cell sequencing reveals clonal expansions of pro-inflammatory synovial CD8 T cells expressing tissue-homing receptors in psoriatic arthritis. Nat Commun. (2020) 11(1):4767. doi: 10.1038/s41467-020-18513-6
14. Povoleri GAM, Durham LE, Gray EH, Lalnunhlimi S, Kannambath S, Pitcher MJ, et al. Psoriatic and rheumatoid arthritis joints differ in the composition of CD8+ tissue-resident memory T-cell subsets. Cell Rep. (2023) 42(5). doi: 10.1016/j.celrep.2023.112514
15. Liu J, Kumar S, Hong J, Huang Z-M, Paez D, Castillo M, et al. Combined single cell transcriptome and surface epitope profiling identifies potential biomarkers of psoriatic arthritis and facilitates diagnosis via machine learning. Front Immunol. (2022) 13. doi: 10.3389/fimmu.2022.835760
16. Lun AT L, Bach K, Marioni JC. Pooling across cells to normalize single-cell RNA sequencing data with many zero counts. Genome Biol. (2016) 17(1):75. doi: 10.1186/s13059-016-0947-7
17. Stuart T, Butler A, Hoffman P, Hafemeister C, Papalexi E, Mauck WM III, et al. Comprehensive integration of single-cell data. . Cell. (2019) 177(7):1888–902.e21. doi: 10.1016/j.cell.2019.05.031
18. Franzén O, Gan L-M, Björkegren JLM. PanglaoDB: a web server for exploration of mouse and human single-cell RNA sequencing data. Database. (2019) 2019:baz046. doi: 10.1093/database/baz046
19. Rahmati S, Abovsky M, Pastrello C, Kotlyar M, Lu R, Cumbaa CA, et al. pathDIP 4: an extended pathway annotations and enrichment analysis resource for human, model organisms and domesticated species. Nucleic Acids Res. (2020) 48(D1):D479–d88.
20. Borcherding N, Bormann N. scRepertoire: An R-based toolkit for single-cell immune receptor analysis [version 1; peer review: 2 approved with reservations]. F1000Research. (2020) 9(47). doi: 10.12688/f1000research.22139.1
21. Hao Y, Hao S, Andersen-Nissen E, Mauck WM III, Zheng S, Butler A, et al. Integrated analysis of multimodal single-cell data. Cell. (2021) 184(13):3573–87.e29. doi: 10.1016/j.cell.2021.04.048
22. Goncharov M, Bagaev D, Shcherbinin D, Zvyagin I, Bolotin D, Thomas PG, et al. VDJdb in the pandemic era: a compendium of T cell receptors specific for SARS-CoV-2. Nat Methods. (2022) 19(9):1017–9. doi: 10.1038/s41592-022-01578-0
23. Hébert HL, Ali FR, Bowes J, Griffiths CEM, Barton A, Warren RB. Genetic susceptibility to psoriasis and psoriatic arthritis: implications for therapy. Br J Dermatol (1951). (2012) 166(3):474–82. doi: 10.1111/j.1365-2133.2011.10712.x
24. Mylonas A, Conrad C. Psoriasis: classical vs. paradoxical. the yin-yang of tnf and type i interferon. Front Immunol. (2018) 9. doi: 10.3389/fimmu.2018.02746
25. Mosca M, Hong J, Hadeler E, Hakimi M, Liao W, Bhutani T. The Role of IL-17 Cytokines in Psoriasis. Immunotargets Ther. (2021) 10:409–18. doi: 10.2147/ITT.S240891
26. Goldminz AM, Au SC, Kim N, Gottlieb AB, Lizzul PF. NF-κB: an essential transcription factor in psoriasis. J Dermatol Sci. (2013) 69(2):89–94. doi: 10.1016/j.jdermsci.2012.11.002
27. Kovács OT, Tóth E, Ozohanics O, Soltész-Katona E, Marton N, Buzás EI, et al. Proteomic changes of osteoclast differentiation in rheumatoid and psoriatic arthritis reveal functional differences. . Front Immunol. (2022) 13. doi: fimmu.2022.892970
28. Rahman P, Siannis F, Butt C, Farewell V, Peddle L, Pellett F, et al. TNFalpha polymorphisms and risk of psoriatic arthritis. Ann rheumatic diseases. (2006) 65(7):919–23. doi: 10.1136/ard.2005.039164
29. Kapellos TS, Bonaguro L, Gemünd I, Reusch N, Saglam A, Hinkley ER, et al. Human monocyte subsets and phenotypes in major chronic inflammatory diseases. Front Immunol. (2019) 10:2035–. doi: 10.3389/fimmu.2019.02035
30. Boyette LB, Macedo C, Hadi K, Elinoff BD, Walters JT, Ramaswami B, et al. Phenotype, function, and differentiation potential of human monocyte subsets. PloS One. (2017) 12(4):e0176460. doi: 10.1371/journal.pone.0176460
31. Shembade N, Harhaj E. A20 inhibition of NFκB and inflammation: targeting E2:E3 ubiquitin enzyme complexes. Cell Cycle. (2010) 9(13):2481–2. doi: 10.4161/cc.9.13.12269
32. Wang X, Peng H, Huang Y, Kong W, Cui Q, Du J, et al. Post-translational modifications of IκBα: The state of the art. Front Cell Dev Biol. (2020) 8. doi: 10.3389/fcell.2020.574706
33. Devos M, Mogilenko DA, Fleury S, Gilbert B, Becquart C, Quemener S, et al. Keratinocyte expression of A20/TNFAIP3 controls skin inflammation associated with atopic dermatitis and psoriasis. J Invest Dermatol. (2019) 139(1):135–45. doi: 10.1016/j.jid.2018.06.191
34. Sahlol NY, Mostafa MS, Madkour LAE-F, Salama DM. Low TNFAIP3 expression in psoriatic skin promotes disease susceptibility and severity. PloS One. (2019) 14(5):e0217352. doi: 10.1371/journal.pone.0217352
35. Rasheed Z, Rasheed N, Abdulmonem WA, Khan MI. MicroRNA-125b-5p regulates IL-1β induced inflammatory genes via targeting TRAF6-mediated MAPKs and NF-κB signaling in human osteoarthritic chondrocytes. Sci Rep. (2019) 9(1):6882. doi: 10.1038/s41598-019-42601-3
36. Zhu J, Han L, Liu R, Zhang Z, Huang Q, Fang X, et al. Identification of proteins associated with development of psoriatic arthritis in peripheral blood mononuclear cells: a quantitative iTRAQ-based proteomics study. J Transl Med. (2021) 19(1):331–. doi: 10.1186/s12967-021-03006-x
37. Nickless A, Bailis JM, You Z. Control of gene expression through the nonsense-mediated RNA decay pathway. Cell Bioscience. (2017) 7(1):26. doi: 10.1186/s13578-017-0153-7
38. Rahmati S, Abovsky M, Pastrello C, Jurisica I. pathDIP: an annotated resource for known and predicted human gene-pathway associations and pathway enrichment analysis. Nucleic Acids Res. (2017) 45(D1):D419–D26. doi: 10.1093/nar/gkw1082
39. Isken O, Kim YK, Hosoda N, Mayeur GL, Hershey JWB, Maquat LE. Upf1 phosphorylation triggers translational repression during nonsense-mediated mRNA decay. Cell. (2008) 133(2):314–27. doi: 10.1016/j.cell.2008.02.030
40. Tokar T, Pastrello C, Rossos AEM, Abovsky M, Hauschild A-C, Tsay M, et al. mirDIP 4.1-integrative database of human microRNA target predictions. Nucleic Acids Res. (2018) 46(D1):D360–D70.
41. Braun J, Frentsch M, Thiel A. Hobit and human effector T-cell differentiation: The beginning of a long journey. Eur J Immunol. (2015) 45(10):2762–5. doi: 10.1002/eji.201545959
42. Al Mana H, Yassine HM, Younes NN, Al-Mohannadi A, Al-Sadeq DW, Alhababi D, et al. The current status of cytomegalovirus (cmv) prevalence in the MENA region: A systematic review. Pathogens. (2019) 8(4):213. doi: 10.1002/eji.2015.45.issue-10
43. Salti SM, Hammelev EM, Grewal JL, Reddy ST, Zemple SJ, Grossman WJ, et al. Granzyme B regulates antiviral CD8+ T cell responses. J Immunol (Baltimore Md 1950). (2011) 187(12):6301–9. doi: 10.4049/jimmunol.1100891
44. Weitz M, Kiessling C, Friedrich M, Prösch S, Höflich C, Kern F, et al. Persistent CMV infection correlates with disease activity and dominates the phenotype of peripheral CD8+ T cells in psoriasis. Exp Dermatol. (2011) 20(7):561–7. doi: 10.1111/j.1600-0625.2011.01250.x
45. Mehraein Y, Lennerz C, Ehlhardt S, Remberger K, Ojak A, Zang KD. Latent Epstein–Barr virus (EBV) infection and cytomegalovirus (CMV) infection in synovial tissue of autoimmune chronic arthritis determined by RNA- and DNA-in situ hybridization. Modern Pathology. (2004) 17(7):781–9. doi: 10.1038/modpathol.3800119
46. Davignon J-L, Combe B, Cantagrel A. Cytomegalovirus infection: friend or foe in rheumatoid arthritis? Arthritis Res Ther. (2021) 23(1):16.
47. Oswald M, Curran ME, Lamberth SL, Townsend RM, Hamilton JD, Chernoff DN, et al. Modular analysis of peripheral blood gene expression in rheumatoid arthritis captures reproducible gene expression changes in tumor necrosis factor responders. Arthritis Rheumatol. (2015) 67(2):344–51. doi: 10.1002/art.38947
48. Busse K, Liao W. Which psoriasis patients develop psoriatic arthritis? Psoriasis Forum. (2010) 16(4):17–25.
49. Eder L, Haddad A, Rosen CF, Lee KA, Chandran V, Cook R, et al. The Incidence and Risk Factors for Psoriatic Arthritis in Patients With Psoriasis: A Prospective Cohort Study. Arthritis Rheumatol. (2016) 68(4):915–23. doi: 10.1002/art.39494
50. Chen J, Ma Y, Yang Z, Lan H, Liu G, Zhang Y, et al. TNFAIP3 ameliorates the degeneration of inflammatory human nucleus pulposus cells by inhibiting mTOR signaling and promoting autophagy. Aging (Albany NY). (2020) 12(23):24242–54. doi: 10.18632/aging.104160
51. FitzGerald O, Haroon M, Giles JT, Winchester R. Concepts of pathogenesis in psoriatic arthritis: genotype determines clinical phenotype. Arthritis Res Ther. (2015) 17(1):115. doi: 10.1186/s13075-015-0640-3
Keywords: psoriatic arthritis, psoriasis, scRNA-seq, TNFAIP3, NFKBIA
Citation: Garrido AN, Machhar R, Cruz-Correa OF, Ganatra D, Crome SQ, Wither J, Jurisica I and Gladman DD (2025) Single-cell RNA sequencing of circulating immune cells supports inhibition of TNFAIP3 and NFKBIA translation as psoriatic arthritis biomarkers. Front. Immunol. 16:1483393. doi: 10.3389/fimmu.2025.1483393
Received: 19 August 2024; Accepted: 20 January 2025;
Published: 07 February 2025.
Edited by:
Janine Lamb, The University of Manchester, United KingdomReviewed by:
Paul Martin, The University of Manchester, United KingdomWei Li, Sichuan University, China
Copyright © 2025 Garrido, Machhar, Cruz-Correa, Ganatra, Crome, Wither, Jurisica and Gladman. This is an open-access article distributed under the terms of the Creative Commons Attribution License (CC BY). The use, distribution or reproduction in other forums is permitted, provided the original author(s) and the copyright owner(s) are credited and that the original publication in this journal is cited, in accordance with accepted academic practice. No use, distribution or reproduction is permitted which does not comply with these terms.
*Correspondence: Dafna D. Gladman, ZGFmbmEuZ2xhZG1hbkB1dG9yb250by5jYQ==