 Benedictor Alexander Nguchu
 Yu Lu
Yu Lu Yifei Han
 Yanming Wang
 Jiaojiao Liu
 Hongjun Li
 Peter Shaw
- 1Oujiang Laboratory (Zhejiang Lab for Regenerative Medicine, Vision, & Brain Health), Wenzhou Medical University, Wenzhou, Zhejiang, China
- 2School of Ophthalmology and Optometry and Eye Hospital, Wenzhou Medical University, Wenzhou, China
- 3Center for Biomedical Imaging, University of Science and Technology of China, Hefei, Anhui, China
- 4Department of Radiology, Beijing Youan Hospital, Capital Medical University, Beijing, China
Introduction: Understanding the specific timing of cART initiation, its effectiveness, and failures, as well as assessing how well the current cART regimens control viral replication and rebound, enhance immune function, and repair or curb early injury in the central nervous system (CNS), is crucial to improving the livelihood of people living with HIV.
Methods: Here, we use an animal model to provide controlled environments to understand how the bodies of Chinese-origin rhesus monkeys, both the immune system and CNS, respond to a combination of emtricitabine (EMTBL/FTC), dolutegravir (DTG), and tenofovir disoproxil fumarate (TDF) following the induction of Simian Immunodeficiency Virus (SIV). We injected the rhesus monkeys with a dose of SIVmac239 (i.e., TCID50—a 50-fold half-tissue culture infective dose) through brachial veins and conducted seven follow-ups at baseline, day 10, day 35, day 84, day 168, day 252, and day 336 for MRI imaging and blood/CSF assays of SIV copies and immunity levels.
Results and discussion: Our experimental data demonstrate that the immune system is compromised as early as 7 days after infection, with a rapid rise of SIV copies in ml and a significant drop of CD4/CD8 ratio below ~1 within the first 14 days of infection. The alterations in the extracellular environments, manifesting as increased free water volume fraction (FW-VF) in MRI data and changes in the diffusivity properties of fiber tissues appearing in FW-corrected FA and FW-corrected MD, occur in parallel with an compromised immune system, suggesting that SIV enters the brain parenchyma in the early days of infection via a weakened brain defense system, causing inflammatory processes affecting the CNS. Our findings demonstrate that our current FTC+TDF+DTG regimen can enhance the immune system, suppress SIV replication, and slow damage to the intra- and extracellular environments. However, it is still ineffective in controlling viral rebound and experiences resistance in some rhesus monkeys, which may lead to further damage to the CNS. Our findings also provide the first SIVmac239-based evidence that extracellular FW-VF may be a more reliable biomarker of abnormal inflammatory processes, thus providing a better understanding of SIV disease progression than previously anticipated.
1 Introduction
Experimental limitations posed by human experiments can be easily addressed through controlled environments of animal models. Evidence shows that key pathological mechanisms observed in humans— such as viral replication, immune response, and neuroinflamation— can be replicated in animal models (1–4). Here, we inject rhesus monkeys with simian immunodeficiency virus (SIV) to investigate how SIV infection influences the distribution of extracellular (ex) free water (exFW) along the major fiber pathways during the initial and later stages of infection. The insights obtained from this investigation are crucial for understanding the ramifications of human deficiency virus (HIV), which is well studied through SIV in animal models. We further examine whether changes in the distribution of exFW can be reversed or exacerbated further when macaques are subjected to a treatment regimen. Through this, we can gain a deeper understanding of how drugs impact biological reactions and uncover the potential drawbacks linked to the current therapeutic regimens, the information which is pivotal in refining the medication strategies for better outcomes.
To this end, we specifically designed two sets of rhesus monkeys, each group consisting of five members (N=5/group), and exposed them to distinct conditions. For the first group, we injected the rhesus monkeys with only a SIVmac239 dose and monitored its progression over time. This group serves as the control group, allowing us to study potential variations in the brain’s extracellular milieu after SIV infection. For the second group, after injecting the rhesus monkeys with a dose of SIVmac239, we administered a dose of emtricitabine (EMTBL/FTC) + tenofovir disoproxil fumarate (TDF) + dotutegravir (DTG) 40 days after SIV infection. Using this group, we observe the potential effects of this dosage in rectifying the detrimental impact of SIV on the extracellular environment and preventing further damage to the brain. In particular, we carry out 7-stage follow-up study design to investigate five distinct biological aspects in a cohort of 10 rhesus monkeys. First, we seek to determine the SIV entry into the CNS compartment as early as 7 days post-inoculation. Second, we investigate when the effects of SIV begin to manifest in extracellular environment and test whether or not the effects occur in parallel to immune deterioration. Third, we investigate the extent of injury to which the extracellular environment could sustain over extended period of time when the rhesus monkeys are not administered to ant-SIV regimen. Fourth, we test whether or not the combination of emtricitabine (EMTBL/FTC) + dotutegravir (DTG) + tenofovir disoproxil fumarate (TDF) could repair the extracellular damage induced by SIV. Here, we specifically investigate the timeframe that may be perfect for treatment initiation to achieve better outcomes and— how long this regimen could take to achieve full recovery. We also investigate whether the regimen exacerbates the detrimental effects of SIV on the brain to a certain extent. Lastly, we determine whether the improvement observed in the immune system, if it exists, is in parallel to the improvement in the intra-and-extracellular milieu of the brain.
Evaluation of extracellular free water content is one of the approaches to studying alterations in the extracellular environment (5–8). Here we use a multi-shell two-compartment model (9, 10), also known as a bi-tensor model (11–13), to obtain information about a fast-diffusing component, free water, in the extracellular space of rhesus monkeys using diffusion tensor images. At each voxel of the rhesus monkey brain, we separate components of extracellular space from those of intracellular space, consistent with previous studies (8, 14, 15), and compute the free water volume fraction (FW-VF) and the free water-eliminated diffusion properties of the tissues, such as the free water corrected fractional anisotropy (FW-FA), mean diffusivity (FW-MD), axial diffusivity (FW-AD), and radial diffusivity (FW-RD) (8). Greater free water volume has been identified in the early stages of neurological disorders such as schizophrenia, and researchers of extracellular water imaging have associated such increasing extracellular free water with the acute neuroinflammatory process (6, 16). Given that HIV is an inflammatory disease, the data from this study of extracellular water content are likely to answer the question in further details. We validate whether inflammation processes are likely at the core of free water volume changes by examining the fluctuations in free water volume during the initial phases of inflammatory SIVmac239 infection.
2 Materials and methods
2.1 Animal experimental setups and preparations
The experiments of this study were conducted at Beijing You An Hospital, the Capital Medical Hospital. The study received approval from the ethical committee of the Beijing Municipal Science and Technology Commission, the University of Science and Technology of China, and Wenzhou Medical University. The study complied with the code of ethics of the World Medical Association for animal experiments. The study involved ten male rhesus Monkeys of Chinese origin. We initially evaluated our animals to determine their health status. We conducted an indirect immunoassay (IFA) to identify and exclude the rhesus monkeys with simian immunodeficiency virus (SIV), Simian type D retrovirus (SRV), herpes B virus, or Simian T cell lymphotropic virus (STLV-1). All rhesus monkeys were in good health at the time of recruitment. We housed our rhesus Monkeys at the Institute of Laboratory Animal Sciences, Peking Union Medical College, while maintaining the optimal conditions—a temperature range of 16 to 26 degrees Celsius (°C), a humidity level between 40% and 70%, and a light/dark cycle of 12 hours each (light/dark =12hr/12hr). We gave the rhesus monkeys food twice a day without any restrictions on their diet, and we exposed them to unrestricted water access (water ad libitum).
2.2 Animal longitudinal experiments and designs
Figure 1 shows a full experimental setup and design, including regimen combinations, laboratory tests involved, housing conditions, and procedures during blood/CSF/MRI data collections. The details of the specific days or weeks on which each examination was performed are summarized in Table 1. Briefly, to accomplish our objective, which involves the identification of early inflammatory-related changes in the extracellular environment following SIVmac239 infection and the potential restorative effects of the TDF+EMTBL+DTG regimen, we designed and conducted a series of follow-up experiments for 48 weeks (336 days). We acquired MRI images at 7 stages, i.e., at the baseline, and on day 10, day 28, day 84, day 168, day 252, and day 336 following SIVmac239 infection (Figure 1B). MRI imaging closely followed the experiments for blood sample collection and assays, which were conducted at 7 stages as well, i.e., at the baseline, and on day 7, day 35, day 84, day 168, day 252, and day 336 after infection. Step by step description of the experiments is as follows. Briefly, at the baseline, i.e., before injecting rhesus monkeys with SIVmac239 dose, we set protocols for data collection. We collected blood samples from the forelimbs (specifically, from the brachial and inguinal veins) and the hindlimbs (specifically, from the saphenous vein). From the blood samples, we quantified the primary biomarkers of immunity levels. We first quantified the number of CD4 T-cells present in 1 μl of the blood collected from the same site for each monkey. We next quantified the number of CD8 T-cells present in 1 μl of the blood. We later calculated the ratio of the number of CD4 T-cells to the number of CD8 T-cells in 1 μl of the blood— this ratio reflects the stability of the immune system and is commonly referred to as the CD4/CD8 ratio. We then gave all monkeys intramuscular injections of anesthetic drugs, Ketamine hydrochloride (5 -10 ml) —and scanned their brains with T1-and diffusion-weighted protocols.
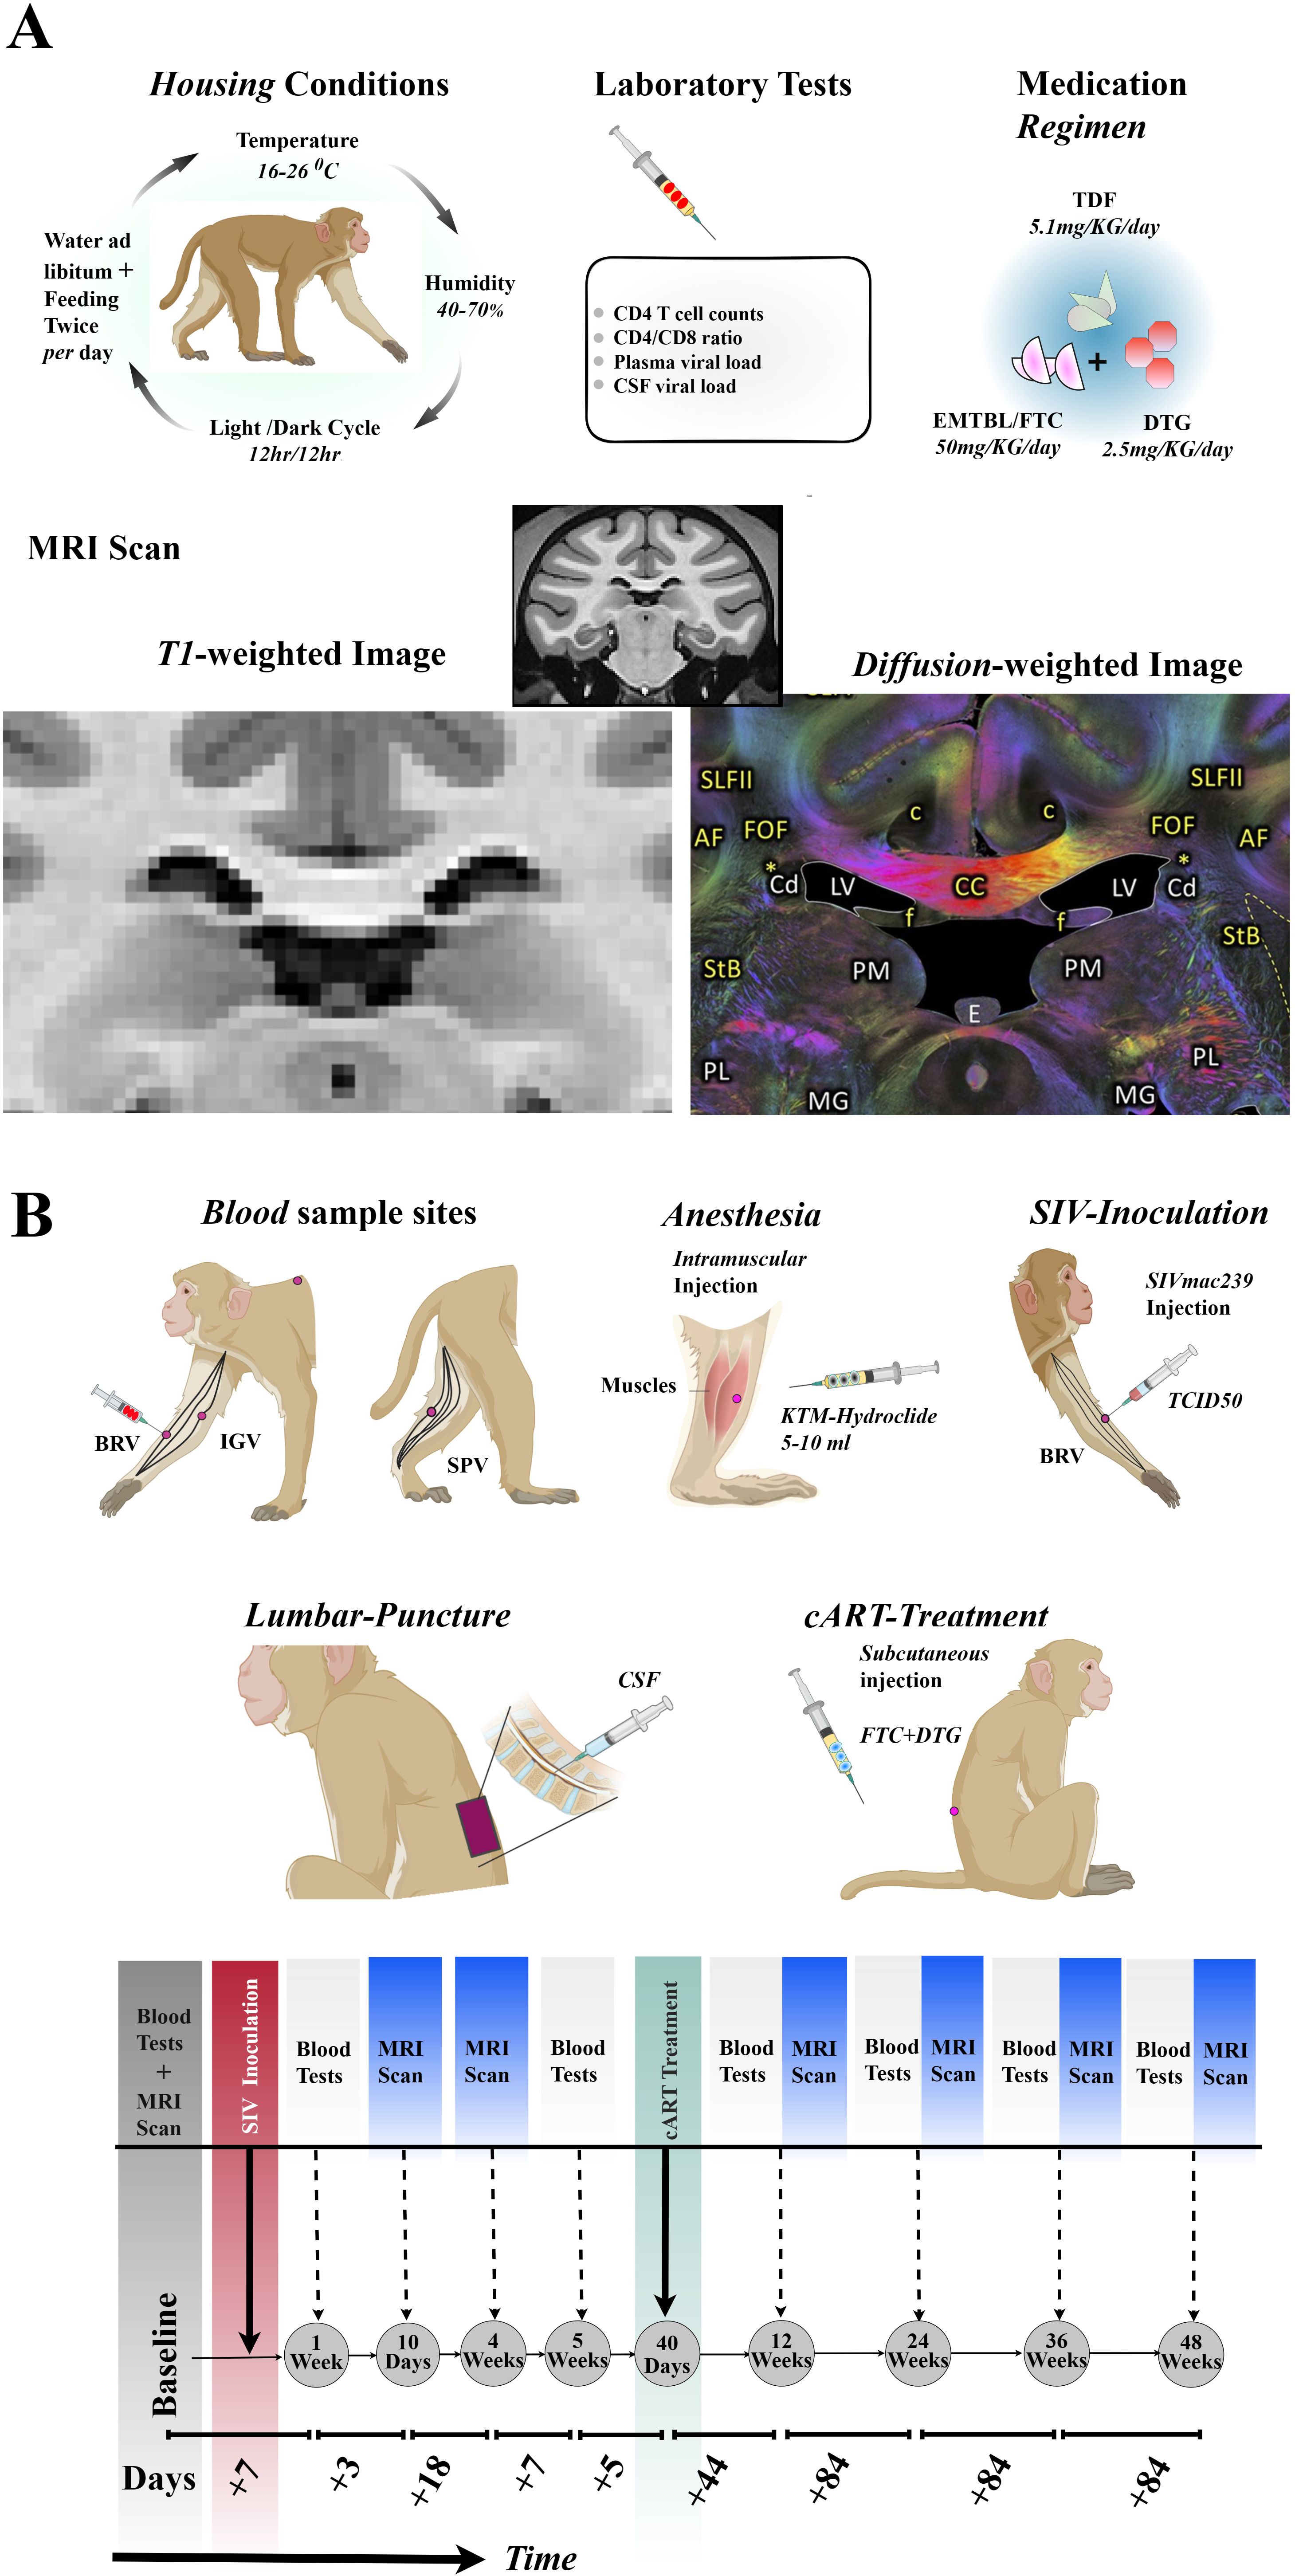
Figure 1. Experimental setups and designs. (A) Rhesus monkeys were housed in 16-26°C, 40-70 % humidity, 12hr/12hr light/dark cycle, and fed twice a day with libitum. Laboratory tests including CD4 T-cell count, CD4/CD8 ratio, plasma and CSF viral load were examined before and after SIVmac239 infection. 5 out of 10 Chinese-origin rhesus monkeys were administered with 5.1 mg of TDF, 50 mg of EMTBL/FTC, and 2.5 mg of DTG. Follow up examinations were conducted at 7 stages, with MRI Scanning involving T1-weighted images and diffusion-weighted images. (B) The SIVmac239 injection was administered through the brachial veins of the forelimb. The rhesus monkeys were anesthetized with an intramuscular injection of 5-10 ml of KTM-hydrochloride before the collection of CSF samples from lumbar puncture for CSF-SIV copy assays and before MRI scanning. Blood samples for immune level and disease progression assays were collected from the brachial (BRV) and inguinal (IGV) veins of the forelimbs, and the saphenous vein (SPV) of the hind limbs. Part of the cART (FTC+DTG) was administered via subcutaneous injection, while other doses were consumed through diet. The seven follow-up stages included baseline through day 336. TDF, tenofovir disoproxil fumarate; DTG, dotutegravir; EMTBL/FTC, the combination of emtricitabine; SIV, simian immunodeficiency virus; CSF, cerebrospinal fluid; KTM, Ketamine; MRI, magnetic resonance imaging.
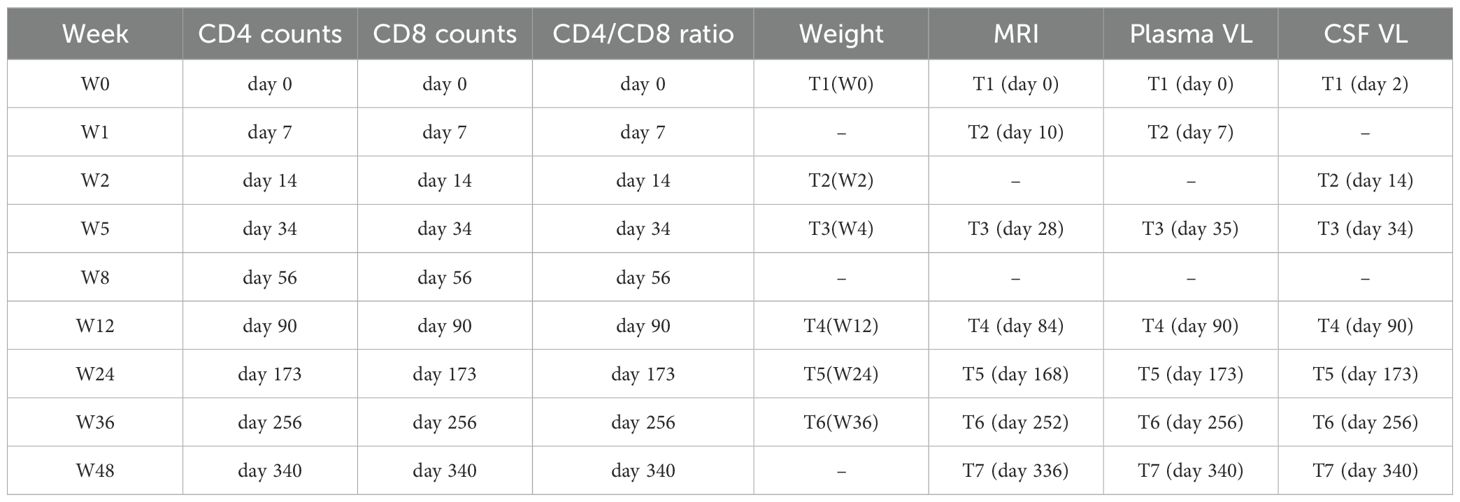
Table 1. Schedule for experimental examinations.
2.2.1 SIV239 infection and follow-up
We next gave the rhesus monkeys injections of SIVmac239 (i.e., a 50 fold half-tissue culture infective dose) through brachial veins. The TCID50 of SIVmac239 was later transformed to SIV. Seven (7) days later, we took blood samples from the monkeys. We also obtained CSF samples of the rhesus monkeys from the lumbar spineous space. We next quantified the number of copies of SIV virus in 1 ml of blood samples and CSF samples from macaques, representing the viral load in plasma and CSF, respectively. We used quantitative PCR (qPCR) for this test. The number of copies of the SIV provides information on disease progression. We then counted the number of CD4 T-cells and CD8 T-cells in 1 μl of blood samples to track the level of the immune system and response. Three (3) days later, we gave all monkeys intramuscular injections of anesthetic drugs, Ketamine hydrochloride (5 -10 ml) —and scanned their brains with T1-and diffusion-weighted protocols. Follow-up MRI and blood experiments were carried out on day 28 (MRI only) and day 35 (blood and CSF only) before the cART initiation.
2.2.2 cART intervention and follow-up
After forty (40) days of SIVmac239 infection (i.e., 4 weeks+5 days), we gave 5 of 10 rhesus monkeys suppressive cART regimen. We subcutaneously injected the rhesus monkeys with emtricitabine (FTC, 50 ml per day) and tenofovir disoproxil fumarate (TDF, 5.1 ml per day). We also mixed dotutegravir (DTG, 2.5 mg/kg daily) into their diet. After forty-four (44) days of suppressive cART (i.e., on the 84th day of SIVmac239 infection), we collected blood, CSF, and image samples from these animals and assessed the body’s response to the FTC+TDF+DTG regimen. We further investigated the impact of this regimen on intracellular and extracellular damage repair. Additional follow-up experiments were conducted on days168, 252, and 336 (post inoculation).
2.3 Macaque neuroimaging protocols
Neuroimaging of the brains of rhesus monkeys was performed on a Siemens 3T MRI Scanner (Siemens, Tim TRIO, and Germany Erlangen, Germany) at Beijing You An Hospital, the capital Medical hospital. The number of MRI scanning experiments conformed to the details shown in Figure 1B. We set protocols for the two imaging sequences—3D-T1-weighted anatomical and diffusion-weighted images. We used the following settings for 3D-T1-weighted imaging: TR/TE = 1,800 ms/4.12 ms, field of view (FOV) = 18.9 mm × 18.9 mm x 7.2 mm, Data matrix (matrix size) = 192 × 192 x 72, flip Angle = 90, slice thickness = 1 mm, and voxel size =0.984 mm × 0.984 mm × 1 mm; whereas we set the following parameters for diffusion-weighted imaging: Echo planar, 120 diffusion-encoded (60, b = 1,000 s/mm2; 60, b = 2,000 s/mm2), 2 references (b = 0 s/mm2), TR/TE = 5200 ms/100 ms, field of view (FOV) = 15.2 mm × 15.2 mm x 8.0 mm, Data matrix (matrix size) = 76 x 76 x 40, flip Angle = 900, slice thickness =2 mm, and voxel size =2 mm × 2 mm × 2 mm; time points = 122 volumes; oblique = 15.8720.
2.4 Processing of Macaque neuroimaging data
Macaque MRI data processing was in accordance with earlier studies (6, 17). We first preprocessed the data in the procedures that involve five steps. We began by extracting the monkey brains from the raw T1-WI and DWI data using three different approaches: (1) ‘3dSkullStrip’ tool with ‘monkey’ flag implemented in AFNI (AFNI, v23.1.08, https://afni.nimh.nih.gov/) (18); (2) ‘bet4animal’ tool implemented in FMRIB Software Library (Oxford, UK, FSL, v6.0.6.6, http://www.fmrib.ox.ac.uk/fsl/); and (3) ‘U-net model for brain extraction’ tool implemented in DeepBet-U-Net (DeepBetv1.0, https://github.com/HumanBrainED/NHP-BrainExtraction) (19). DeepBet extracts the brains of non-human primates using deep learning models. These models previously received initial training on human brains, and they were later updated with the brains of non-human primates by Wang et al. We further cross-trained one of the models with the brains of our rhesus monkeys. Here we used the ‘Site-All-T-epoch-36-update-with-Site-6-plus-7-epoch-09’ model, which was initially updated by Wang et al. with brains of 19 macaques from 13 sites specified by PRIDE-DE. Our two experts, Dr. BA. N and Dr. Y.L, conducted a thorough visual inspection for quality assessment of brain extraction performed by each of the three approaches. They then voted for the approach with the best performance on our data. Experts found DeepBet’s results sufficient for subsequent processing steps due to better smoothing and fine-area delineation (See Supplementary Figure S1A for the results of AFNI-3dSkullStrip and FSL-bet4animal, and Supplementary Figure S1B for the results of DeepBet-U-Net). We next corrected for eddy-current induced distortion and head-motion artifact using FSL’s ‘eddy-current’ tool (20). Before computing for water molecules (FW) diffusing freely in the extracellular space, we first fitted the DWI data using the standard FLS’s ‘DTI-FIT’ to obtain DTIFIT-derived raw FA maps. We then non-linearly registered the DTIFIT-derived raw FA map to a standard space defined by UWDTIRhesusWM template, using FSL’s registration tools (FLIRT/FNIRT). Then, the multi shell DWIs data encoded in 60 directions for b = 1000 s/mm2 and 60 directions for b = 2000 s/mm2 were again put into Python code to calculate FW, and FA and MD corrected for FW (FW-FA, FW-MD). Briefly, our code uses a bi-tensor model to split a single voxel information into extracellular FW and tissue compartments. We particularly used an optimized version of the model proposed by Hoy et al. (11), originally described by Pasternak et al. (21) in its expanded form: Where g and b are diffusion gradient direction and weighted, S(g,b) is the diffusion-weighted signal measured, is the signal in a measurement with no diffusion weighting, D is the diffusion tensor, f is the volume fraction of the free water component, and is the isotropic value of the free water diffusion(normally set to The generated new metrics, FW-VF, FA-FW, and MD-FW, were further transformed into standard space using the transformation matrix obtained during the transformation of the DTI-derived raw FA map to a standard space defined by UWDTIRhesusWM template. Our two experienced neurologists (X.W. and B.N., with 10 and 6 years of experience, respectively) visually inspected our data for registration quality validation. It is important to note that the UWDTIRhesusWM template used here is rhesus macaque white matter based, developed using high-quality brain scans of 271 rhesus monkeys (https://www.nitrc.org/projects/rmdtitemplate/) (22). The template accounts for signal and spatial variability across species. It also addresses the previously identified challenges of low signal contrast, low signal-to-noise ratio, low sharpness, and low visibility of fine white matter structures and spatial features of other templates (22).
3 Statistical analysis
We performed statistical analyses for metrics from the MRI images and measures from blood and CSF samples on R v4.2.0 (23). Briefly, we applied mixed-effect models (ANOVA models) to determine the effects of SIV and time, and the impact of FTC/EMTBL+TDF+ DTG regimen on the brain, particularly on the extracellular environment as quantified by FW, and on the WM integrity as quantified by FW-FA and FW-MD metrics. Prior to these analyses of effects, we checked if our data met the assumption of normality using Shapiro Wilk Test and the assumption of homogeneity of variance using Levene’s Test. The data that met these assumptions received the ANOVA tests, followed by independent t-test (student t-test) or paired sample t-test in the post-hoc analyses. Otherwise, the data violated these assumptions underwent the Welch’s test and Wilcoxon Rank sum Test (Mann Whitney U Tests). Of note is that, for analyses of effects (ANOVA), the Between-Subject factor had two levels, SIV+cART- and SIV+cART+. The SIV+cART- denotes rhesus SIV-infected macaques without suppressive cART, whereas the SIV+cART+ denotes rhesus SIV-infected macaques with initiated suppressive cART. Within-subject factor for our analyses of effects (ANOVA) was time with 7 levels (7 time-points). The seven levels were the baseline, day 10, day 28, day 84, day 168, day 252, and day 336 following the SIVmac239 infection. We performed further statistical tests for identification of potential relationship between clinical measures (CD4 T-cells, CD4/CD8 ratio, viral load) and MRI metrics of extracellular disruption and microstructural tissue damage. To this end, we used Pearson’s correlation method and Spearman’s correlation method, depending on whether the data met the assumptions of normality, linearity, and homoscedasticity. Statistical errors that arose due to multiple comparisons were corrected using false discovery rate (FDR) technique. Statistical measures for the analyses of effects and correlations involved β coefficients, F, r, and P values—with cut-off set at p <.05 for significance.
4 Results
4.1 Macaque’s demographics
Briefly, all 10 rhesus monkeys were male, of Chinese origin, and aged 3.8 ± 0.3 years. At the time of recruitment, the rhesus monkeys were all healthy, with an average weight of 4.72 ± 0.58 kg. The ranges of their CD4 T-cell count, CD8 T-cell count, and CD4/CD8 ratio were 566—2342, 235—881, 0.97—3.0, respectively.
4.2 CSF and blood assays after SIV239 injection
Before injections of TCID5O for SIVmac239 infection, the average scores of CD4 T-cell count, CD8 T-cell count, and CD4/CD8 ratio were 1120.79 ± 514.25, 605.81 ± 201.47, and 1.96 ± 0.78, respectively. After 7 days of TCID5O injection, the SIVmac239 transformed into SIV infection. The number of SIV copies per ml increased from 0 to 6.89 ± 0.44 on day 7 (P < 0.0001, in plasma, Table 2) and continued to rise to 6.92 ± 0.40 on day 14 (P < 0.0001, in CSF, Table 2) and to 7.17 ± 0.51 on day 34 (P < 0.0001, in plasma). For CD4 T-cells (Table 3), there was no significant change in their number by day 7 (1187.68 ± 468.95 cells/µL, paired t-test, P = 0.6000). A statistically significant change in CD4 T-cells was first detected on day 14; the CD4 T-cells dropped to 756.29 ± 404.44 cells/µL (P = 0.0022). As the disease progressed to day 34, the CD4 T-cells continued to remain below < 1000 (837.66 ± 351.59 cells/µL, day 34, P = 0.0495). The CD8 T-cells, on the other hand, began to manifest change by day 7; they increased from 605.81 ± 201.47 cells/µL at baseline to 871.01 ± 467.53 cells/µL, although this increase was not statistically significant (P = 0.0907). By day 14, the change in CD8 T-cells was more evident, increasing to 1012.38 ± 237.49 cells/µL, P = 0.0010). This increase in CD8 T-cells persisted through day 34 (1114.42 ± 234.84 cells/µL, P = 0.0009) as the viral infection continued. For the CD4/CD8 ratio, we started to observe a trend of decline by day 7; the ratio decreased to 1.65 ± 0.93 from 1.96 ± 0.78 at baseline. However this change was not statistically significant (P = 0.1782). An intensified change in the CD4/CD8 ratio for our rhesus monkeys manifested on day 14 (dropped to 0.78 ± 0.40, P < 0.0001)—and this reduction in CD4/CD8 ratio progressed as the disease advanced (0.77 ± 0.36, P < 0.0001, day 34). These results suggest that a significant reduction in immunity levels—CD4 T-cells and CD4/CD8 ratio—begins as early as the first 14 days (two weeks) of infection and persists as the disease advances. The reduction in immunity levels and the increase in CD8 T-cell proliferation and differentiation coincided with a rise in the number of SIV copies.
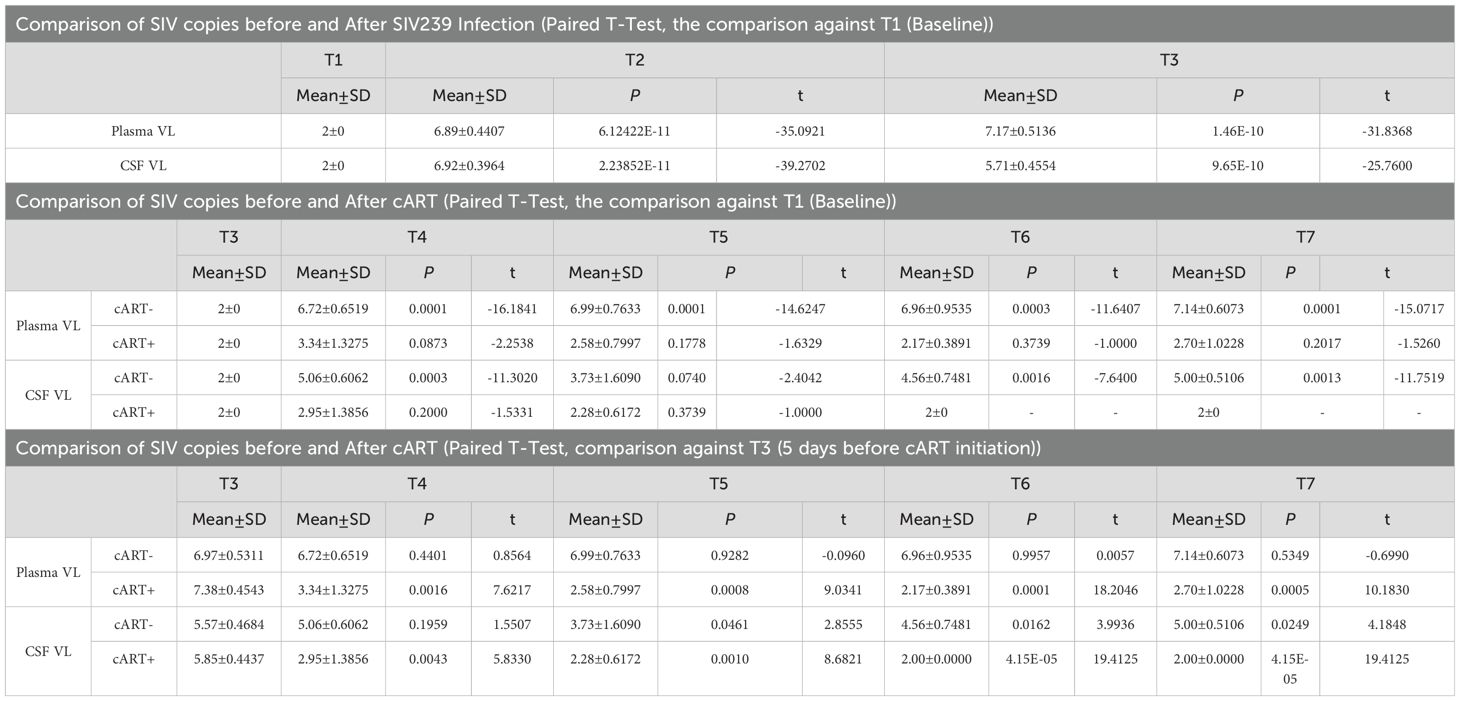
Table 2. SIV viral record in rhesus monkeys after SIV239 infection and suppressive cART drugs.
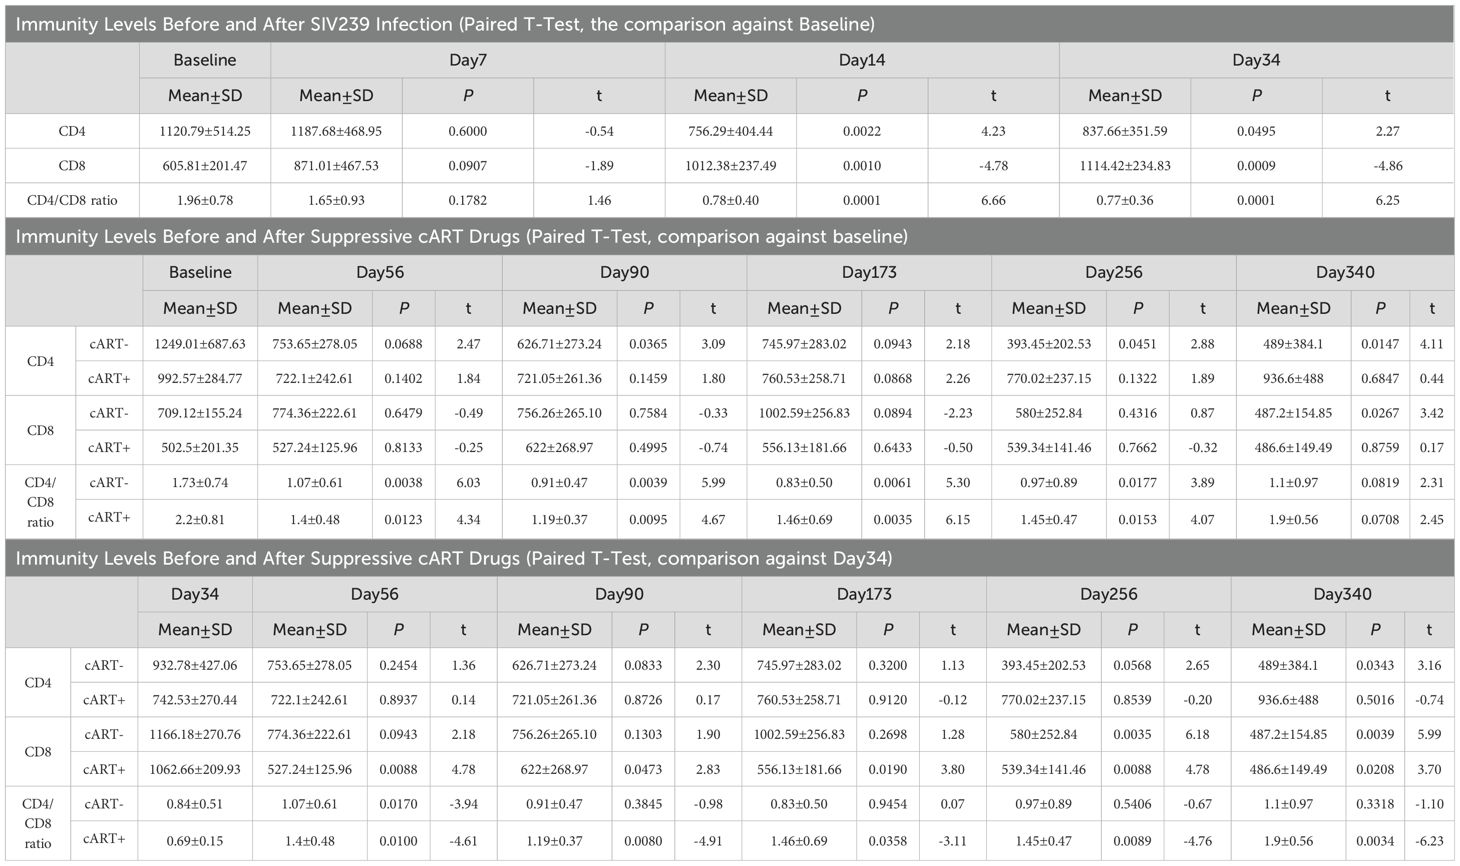
Table 3. Immunity Levels Before and After SIV239 Infection and Suppressive cART Drugs.
4.3 CSF and blood assays after suppressive cART drugs
On day 40 of SIVmac239 infection, 5 of 10 rhesus monkeys were initiated by injection and through diet with suppressive cART drugs [FTC/EMTBL+TDF+ DTG]. Five days before cART initiation (day 40 of SIV infection), these specific five rhesus monkeys had an average CD4 T-cell count of 742.53 ± 270.44, a CD8 T-cell count of 1062.66 ± 209.93, and a CD4/CD8 ratio of 0.69 ± 0.15. Their average number of SIV copies per ml was 7.38 ± 0.45 in plasma and 5.85 ± 0.44 in CSF. After treatment, the viral suppressive effects of our regimens began to manifest within the first 44 days of progressive cART (see Table 2, bottom panel). By day 44(50) of the suppressive drug treatment, the number of SIV copies significantly declined; the number of plasma SIV copies reduced by 75.09%, dropping from 7.38 ± 0.45 to 3.34 ± 1.33, P = 0.0016). The SIV copies in CSF dropped as well from 5.85 ± 0.44 to 2.95 ± 1.39 (P = 0.0043). Our drug suppressive effects continued progressively over time. In short, 60% (3 of 5), 80% (4 of 5), and 100% (5 of 5) of rhesus macaques achieved a total virosuppression by day 44, day 128, and day 212, respectively. For immunity levels, we detected the immune-boosting effects of our drugs by day 16 of suppressive drug treatment (see Table 3). The CD4/CD8 ratio of the treated rhesus monkeys increased from 0.69 ± 0.15 to 1.4 ± 0.48 (P = 0.0100) by day 16 of suppressive drug treatment and continued to improve, reaching 1.9 ± 0.56 by day 212 (P = 0.0034). Meanwhile, the number of CD8 T cells was significantly reduced to 527.24 ± 125.96 (P = 0.0088) by day 16 and to 486.6 ± 149.49 (P = 0.0208) by day 212, from 1062.66 ± 209.93 before cART initiation. (See Tables 2, 3 for statistics on the progression of immunity levels and SIV viral copies as the disease progresses, as well as with cART intervention; also see Figure 2; Supplementary Table S1 for overall comparisons before and after treatment).
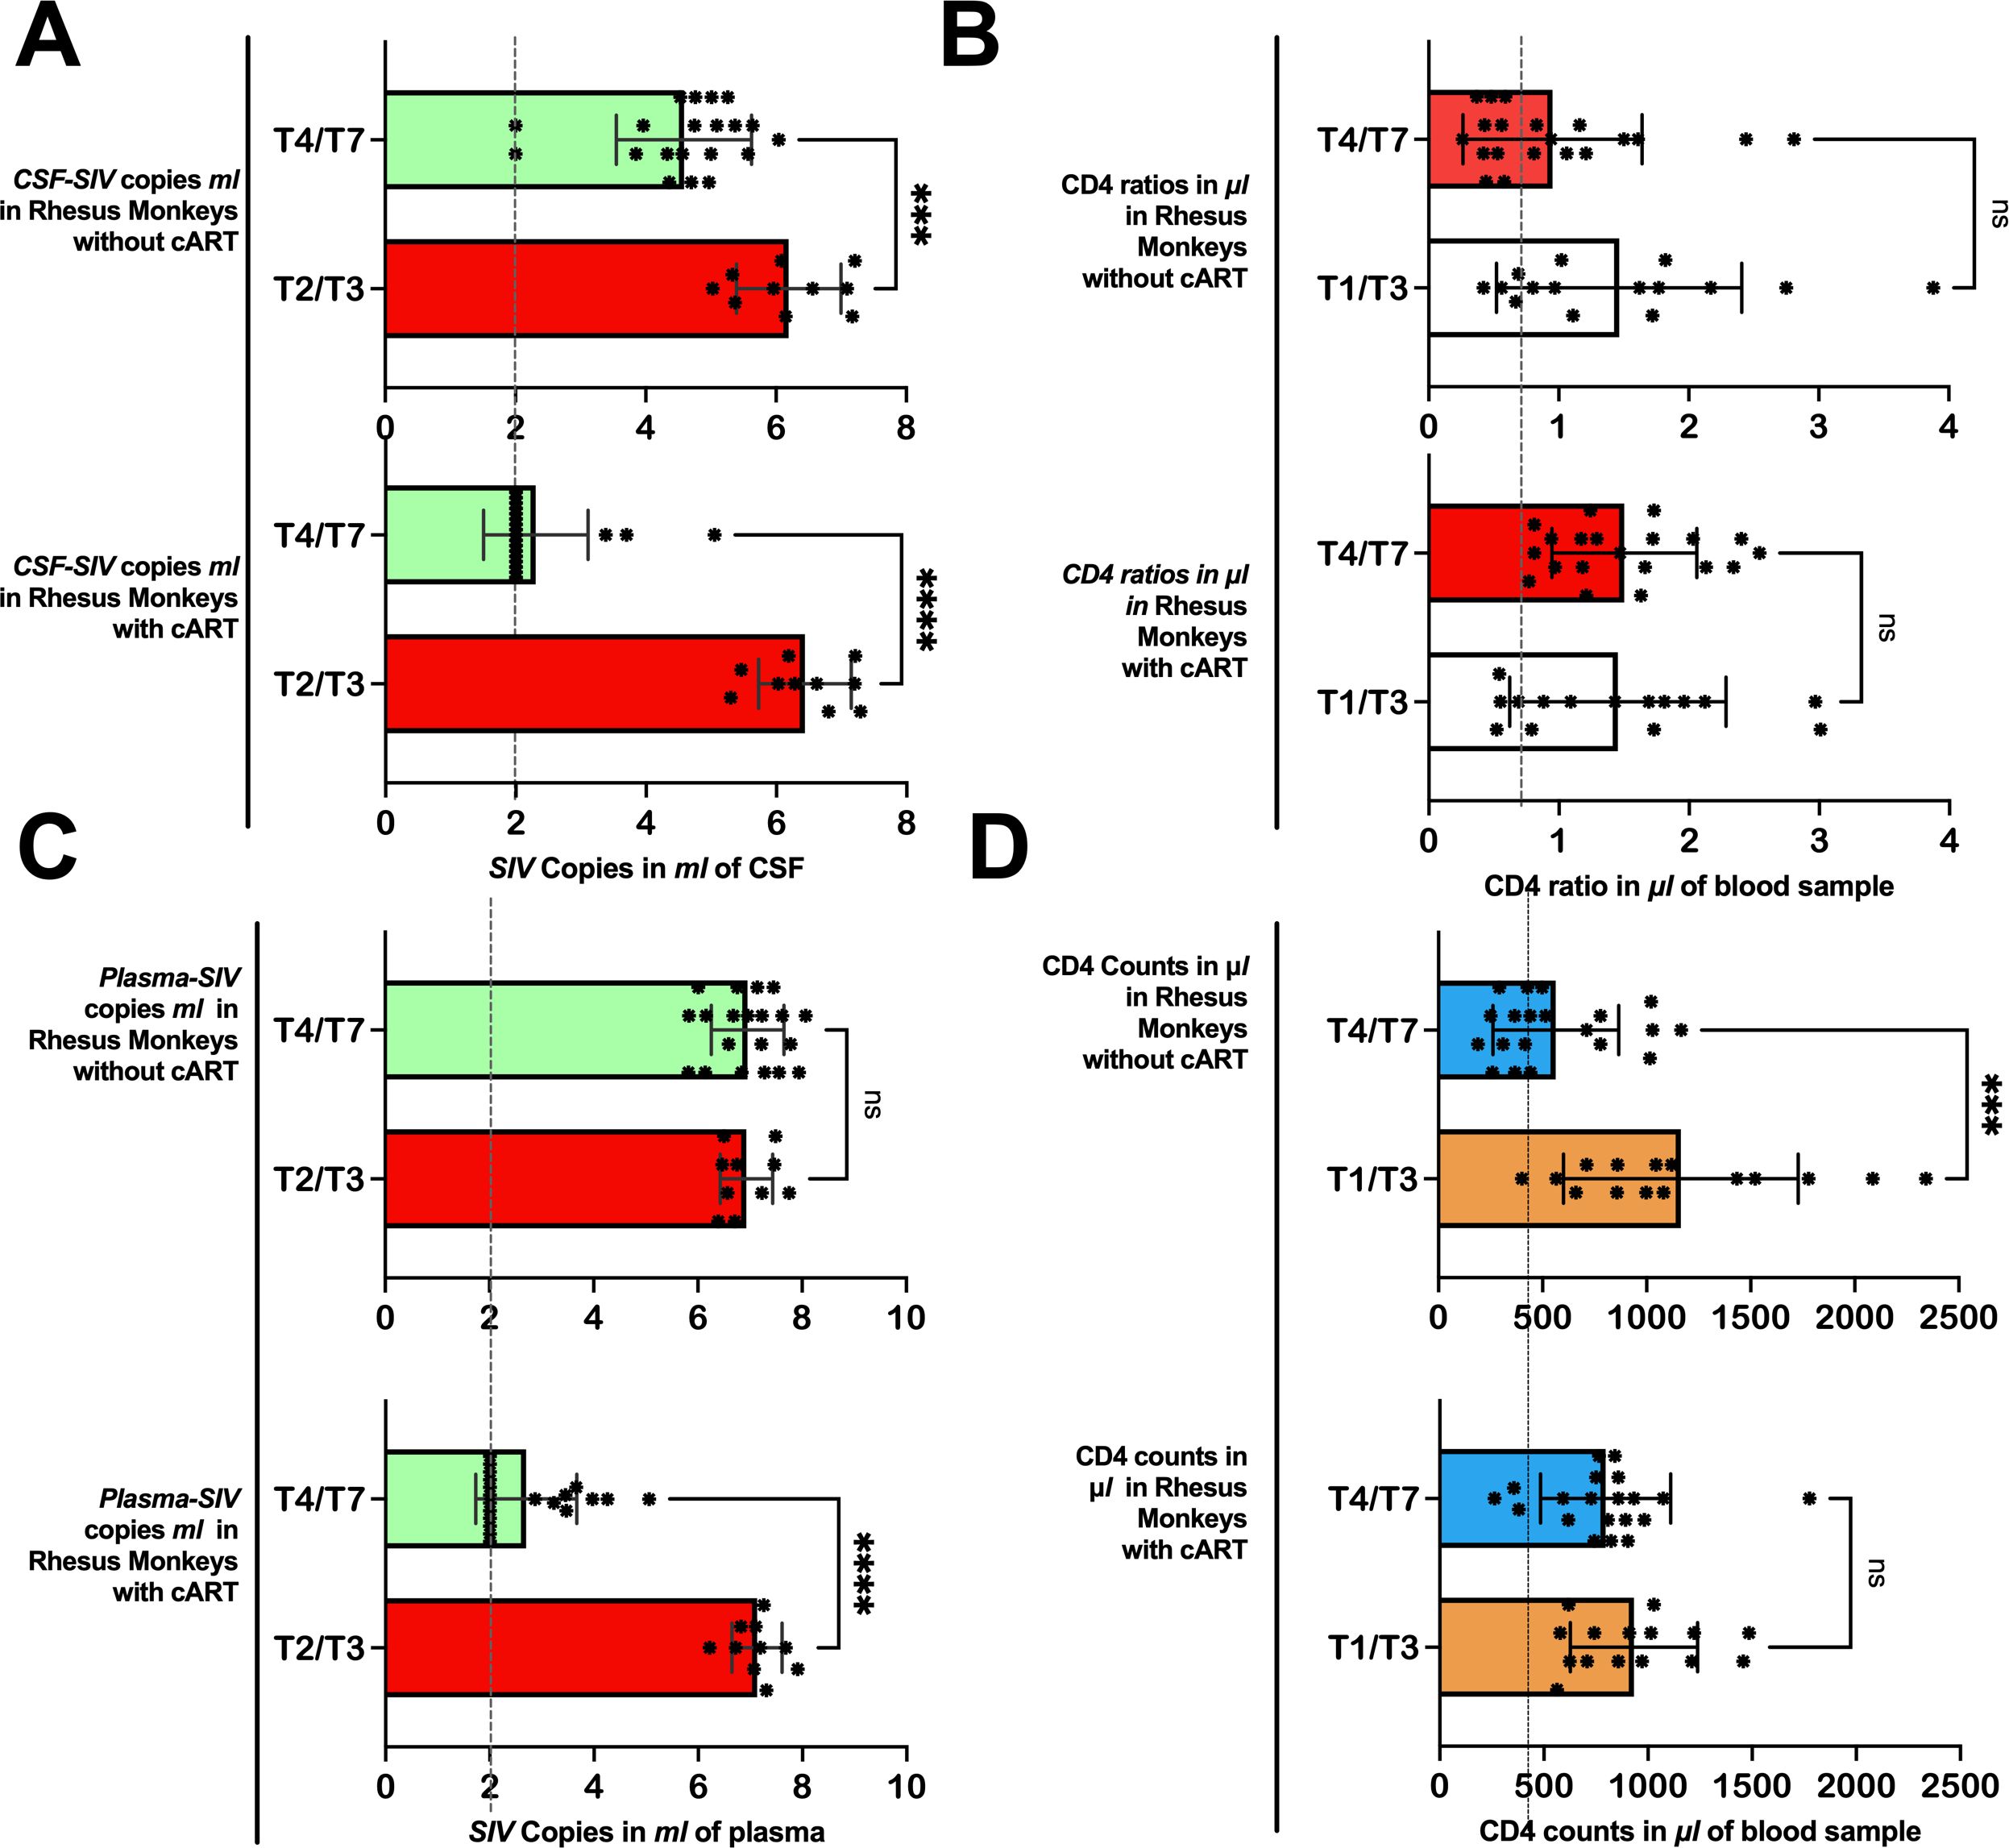
Figure 2. Immunity levels and SIV viral copies as the disease progresses in Chinese-origin rhesus monkeys with and without treatment. In 5 out of 10 rhesus monkeys, the cART treatment was introduced before T4 (at day 40). In rhesus monkeys without treatment, the number of SIV copies in ml of CSF (A) and plasma (C) remained relatively higher from T4 through T7, while those with treatment achieved viral suppression. Similarly, those with treatment succeeded in improving or maintaining their CD4/CD8 ratio (B) and CD4 T-cell counts (D) after treatment, but those without treatment continued to have relatively low CD4 ratios and CD4 T-cell counts. Also see Supplementary Table S1 for further statistics. CSF-SIV, cerebrospinal fluid- simian immunodeficiency virus; T2/T3, time point including T2 and T3; T4/T7, time points including T4, T5, T6, and T7. ***P < 0.001, ****P < 0.0001. The expanded form of “ns” is a non-significant value at a threshold of 0.05, in other words, P > 0.05.
On the other hand, the rhesus monkeys (5 out of 10) that did not receive cART intervention on day 40 continued to have elevated SIV copies on later days, similar to the levels seen on day 35 or earlier. On day 35, the plasma levels of SIV copies were 6.97 ± 0.53 cells/µL (P = 0.4401 vs. Baseline) and persisted on the follow-up days: day 90 (6.72 ± 0.65 cells/µL, P = 0.4401 vs. day 34), day 173 (6.99 ± 0.76 cells/µL, P = 0.9282 vs. day 34), day 256 (6.96 ± 0.95 cells/µL, P = 0.9957 vs. day 35), and day 340 (7.14 ± 0.61 cells/µL, P = 0.5349 vs. day 34). These untreated rhesus monkeys continued to experience severely worsened immunity levels as the disease advanced. Their CD4/CD8 ratio remained low(< 1) during the early days of infection, i.e., 0.76± 0.49 on day 14 (P = 0.0027 vs. baseline) and 0.84± 0.51 on day 34 (P = 0.0053 vs. baseline) —and continued to be low in later days: 1.07 ± 0.61 on day 56 (P = 0.0038 vs. baseline; P = 0.0170 vs. day 34), 0.91 ± 0.47 on day 90 (P = 0.0039 vs. baseline; P = 0.3845 vs. day 34), 0.83 ± 0.50 on day 173 (P = 0.0061 vs. baseline; P = 0.9454 vs. day 34), 0.97 ± 0.89 on day 256(P = 0.0177 vs. baseline; P = 0.5406 vs. day 34), and 1.1 ± 0.97 on day 340 (P = 0.0819 vs. baseline; P = 0.3318 vs. day 34). The number of CD4 T-cells declined progressively (below 1000) from the baseline (1120.01 ± 687.63) as the disease advanced. By day 34, the CD4 T-cells dropped to 932.78± 0.427(P = 0.0974 vs. baseline). After day 40 (when those in the other group were receiving cART), the CD4 T-cells of the untreated rhesus monkeys continued to decline to 753.65± 278.05 (P = 0.0688 vs. baseline; P = 0.2454 vs. day 34), 626.71 ± 273.24 (P = 0.0365 vs. baseline; P = 0.0833 vs. day 34), 745.97 ± 283.02 (P = 0.0943 vs. baseline; P = 0.3200 vs. day 34), 393.45 ± 202.53 (P = 0.0451 vs. baseline; P = 0.0568 vs. day 34), and 489 ± 384.1 cells/µL (P = 0.0147 vs. baseline; P = 0.0343 vs. day 34) by day 56, day 90, day 173, and day 340, respectively.
4.4 Animal weights before and after SIV239 injection or cART
Before the injection of TCID5O, the average weight rhesus monkeys was 4.72 ± 0.58 kg. After 14 days of infection, they lost 6% of their weight (from 4.72 ± 0.58 to 4.45 ± 0.55 kg, P = 0.0145, Paired t-test, see Supplementary Table S2). By day 28 of progressive diet, they regained the 6% of the lost weight (to 4.68 ± 0.58, P = 0.6882). Over time, the weight continued to increase (to 4.81 ± 0.781 by day 96). We did not find strong evidence of group effects on weights after the cART intervention (P > 0.5); both rhesus monkeys, with and without cART, gained weight over time. However, those who did not receive cART intervention demonstrated a more pronounced weight gain trend than those who received it, especially from days 14 to 28 (cART-, 4.64 ± 0.72 to 4.9 ± 0.75, P = 0.0004; cART+, 4.26 ± 0.26 to 4.46 ± 0.26, P = 0.0217) and days 84 to 168 (cART-, 4.92 ± 0.65 to 5.28 ± 0.75, P = 0.0288; cART+, 4.18 ± 0.29 to 4.33 ± 0.49, P = 0.2344).
4.5 Early brain alterations in the extracellular spaces and diffusion properties in 10 rhesus monkeys, within the first 28 days of SIV239 infection
As early as within the first 28 days of SIV239 infection, both the extracellular water volumes and the diffusion of fiber tissues of the rhesus monkeys demonstrated changes (see Table 4). Briefly, free water volumes increased significantly for extracellular spaces surrounding the fiber tissues of the internal capsule (anterior, posterior and retrolenticular limbs), corona radiata (right and left anterior), thalamic radiata (right posterior), sagittal striatum (right), external capsule (right and left), longitudinal fasciculus (right and left superior), uncinate fasciculus(right), prefrontal WM(right and left of both dorsal and ventral parts), frontal gyrus WM(left inferior), temporal gyrus WM(left superior), and cingulate WM(left anterior). This increase was more pronounced (survived FDR-corrections for multiple comparisons) in the internal capsule (left anterior limb), corona radiata (left anterior), thalamic radiation (right posterior), external capsule (left), longitudinal fasciculus (left superior), uncinate fasciculus (right), and prefrontal WM (left ventral). Exceptionally, for the cerebellar peduncles (right and left, inferior and superior) and the tapetum (right), the extracellular FW volume decreased. An intensified decrease (surviving FDR corrections for multiple comparisons) was observed in the right inferior cerebellar peduncle and the left superior cerebellar peduncle.
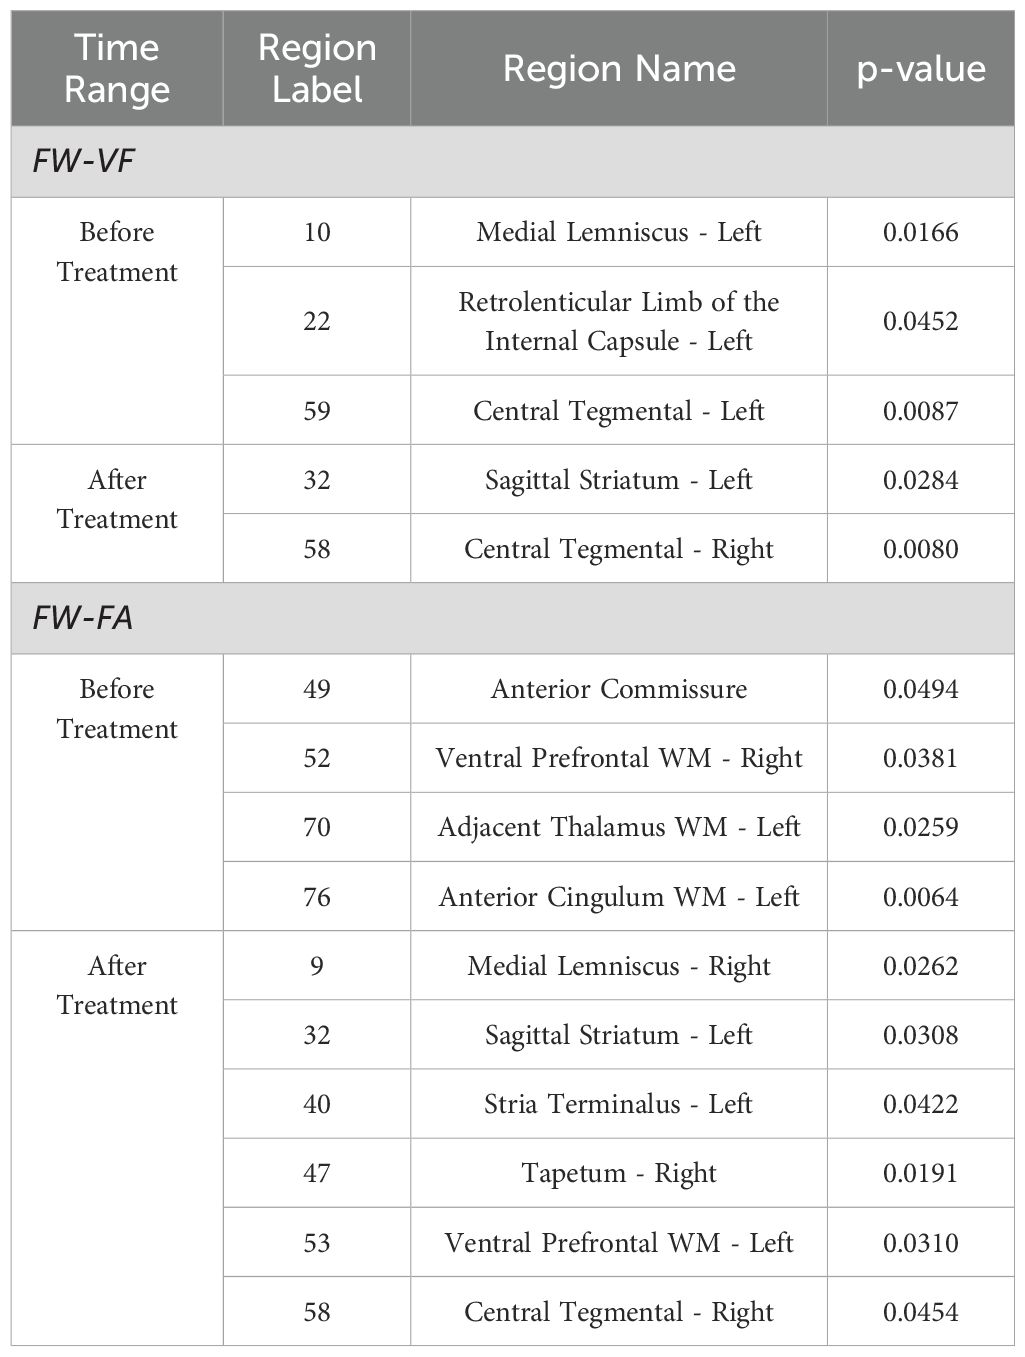
Table 4. Significant regions of FW-VF and FW-FA with time point and Group.
Meanwhile, early alterations to the diffusion properties, i.e., FA and MD corrected for FW, were also observed within this 28-day period of SIV239 infection. Briefly, the values of FW-FA decreased progressively in several fiber tissues, particularly in the corticospinal tract (left), corona radiata (right superior), cingulum (left superior), central tegmental (left), pyramidal tracts, and temporal gyrus WM (left superior). The decrease was more severe (survived FDR-corrections for multiple comparisons) in the left central tegmental. Meanwhile, two fibers, the cerebellar peduncle (middle) and uncinate fasciculus (right and left), displayed abnormal pattern of increased FW-FA values in the early days of SIV infection, with the uncinate fasciculus fiber tissues demonstrating an intensified increase (survived FDR-corrections for multiple comparisons). Most fibers of rhesus monkeys demonstrated changes in FW-MD values— at these early stages of SIV infection. Notably, there was an increase in FW-MD values in two major fibers— the cerebellar peduncle (right and left inferior, and left superior) and the internal capsule (retrolenticular limb), whereas decreased FW-MD values were detected in 15 other fiber tissues. Such fiber tissues with decreased FW-MD values include the corpus callosum (the genu, body and splenium), fornix, internal capsule (right and left anterior limb, and left posterior limb), corona radiata (right and left anterior), sagittal striatum (left), external capsule (right and left), Stria terminalus (right and left), uncinate fasciculus (right), commissure (anterior), prefrontal WM(both right and left, dorsal and ventral), pyramidal tracts frontal gyrus WM(right and left inferior), temporal gyrus WM (right middle), midbrain WM(right), and cingulum WM(right and left anterior). 70% of these WM fiber structures had an intensified FW-MD decrease (survived FDR correction for multiple comparisons) (See Table 4).
4.6 Extracellular content of rhesus monkeys following cART intervention (TFG+TDF+DTG)
From the analysis of interactive effects, we found MRI evidence of changes in the extracellular environment in rhesus monkeys following SIVmac239 infection and cART intervention. Briefly, there were interactive effects of cART treatment and time on the FW-VF of the extracellular spaces crossed by two fiber tracts—the left Sagittal Striatum (SS-L) and the right Central Tegmental Fiber Tract (CTFT-R) (Figure 3, also see Table 4). The FW-VF of these fiber tracts increased significantly over time for the rhesus monkeys that received cART intervention. Such an increase was significantly slowed in those who received a TFG+TDF+DTG regimen on day 40. It is important to highlight that, prior to cART intervention on day 40, all rhesus monkeys (from all groups/sets) had a similar trend of increasing FW-VF, with minimal variations (nearly negligible). The differences in extracellular FW-VF between the two groups of rhesus monkeys began to unfold after day 40 of cART intervention. The greatest differences in FW-VF (cART- vs. cART+, see Figure 3; Supplementary Table S8 for statistics) were identified on day 336 (time point 7) of MRI scanning (296 days after cART intervention).The analyses of independent effects revealed independent effects of time (arguably reflecting the impact of SIV239 infection) on the extracellular FW-VF in SIV-infected rhesus monkeys, independent of cART status (see Figure 4, also see Supplementary Table S3). Fourteen (14) fiber tracts were identified with independent effects of time. Two patterns of FW-VF attenuation were identified within these fibers. The first pattern of FW-VF disruption was characterized by a continuous and progressive increase in extracellular FW-VF over time. This pattern was observed in eight(8) fiber tissues, including the superior cerebellar peduncle, medial longitudinal fasciculus, central tegmental, adjacent amygdala WM, fornix, Strial terminalus right, Strial terminalus left, and sagittal striatum. The second pattern of FW-VF disruption unfolded as a progressive decline in FW-VF and was more evident in four fiber tracts, i.e., the pontine crossing tract, the splenium of the corpus callosum, the superior corona radiata, and the superior fronto-occipital fasciculus. While we generally observed these two patterns of changes over time, we also found time-specific, region-specific, sharp, and excessive changes in FW-VF in the early days of SIV239 infection. In particular, there was a sharp increase in FW-VF in the extracellular spaces surrounding the superior corona radiata, fornix, and superior fronto-occipital fasciculus on day 28 following the infection of SIVmac239. Conversely, a sharp decrease in FW-VF was observed in the extracellular spaces surrounding the superior cerebellar peduncle and adjacent amygdala WM.
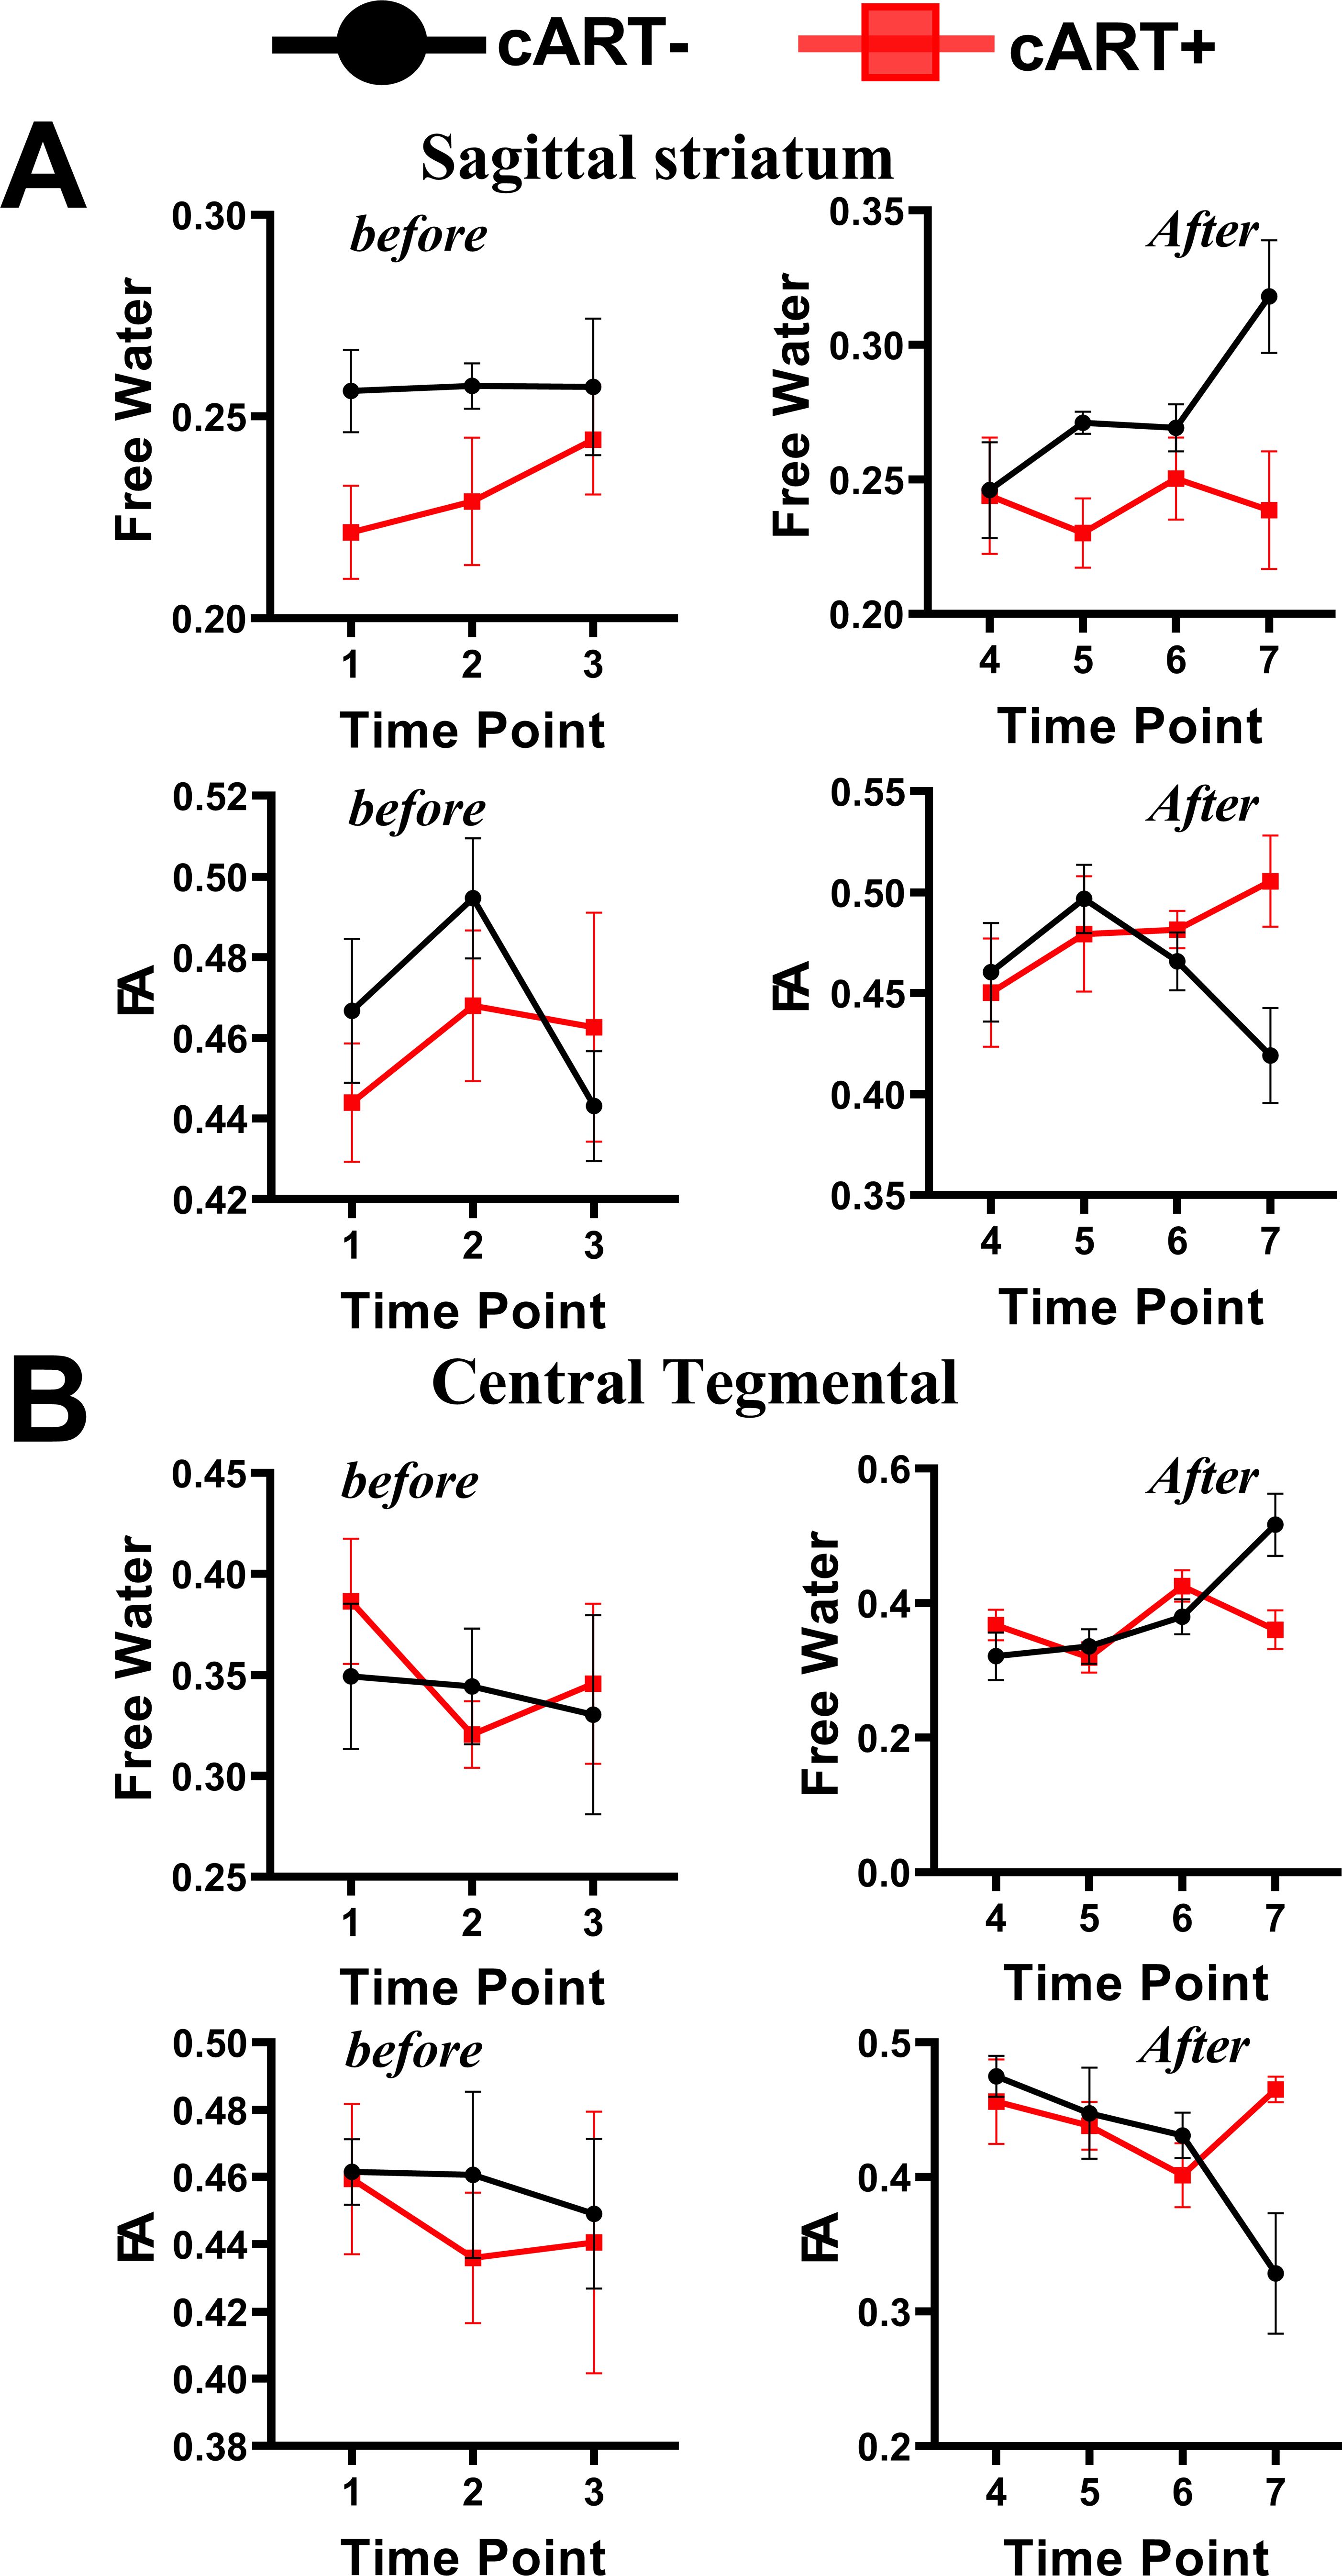
Figure 3. Interactive effects of cART regimen and time on extracellular FW-VF and FW-FA. The Chinese-origin rhesus monkeys exhibit interactive effects of cART over time, such that those without cART demonstrated a significant increase in FW-VF and a reduction in FW-FA over time across the sagittal striatum (A) and central tegmental area (B), particularly at T7. FW-FA, free water corrected FA values; T7, time point 7; cART, combination of antiretroviral therapy.
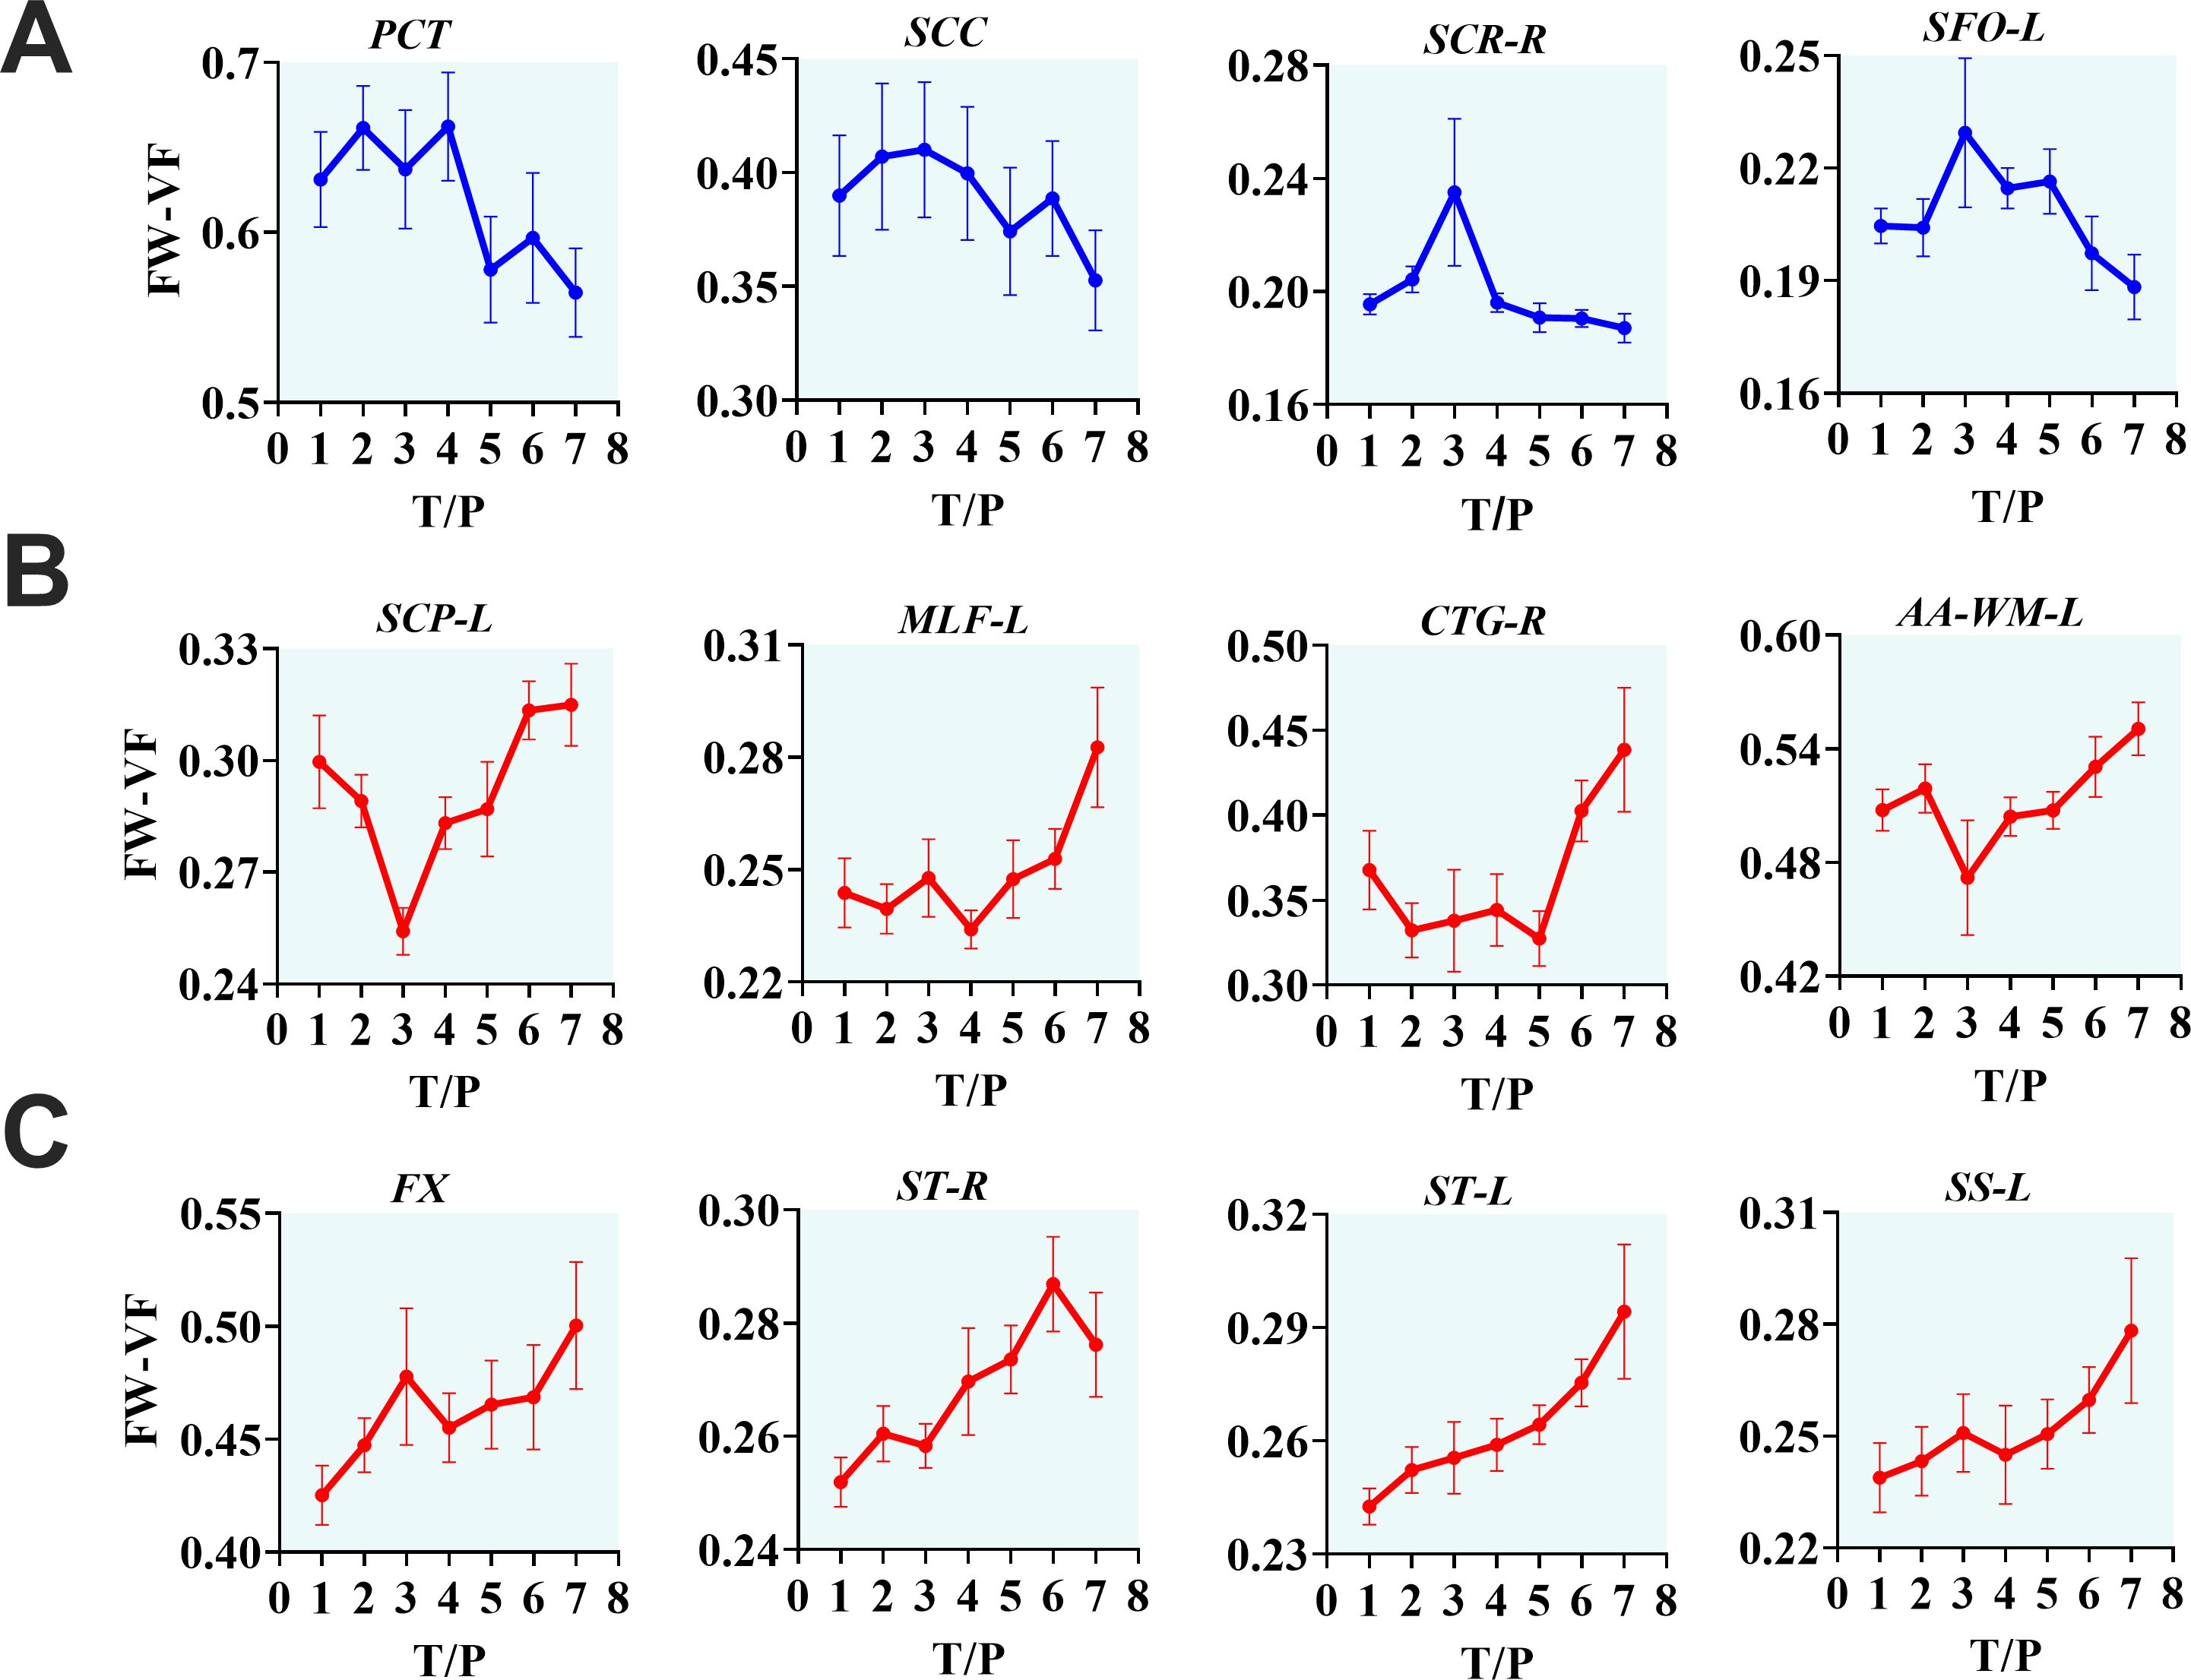
Figure 4. The progressive effects of SIVmac239 on extracellular environment over time, independent of cART status. The longitudinal effects of SIV infection on the extracellular environment appear in three forms. They may manifest as decreasing FW-VF in some fiber tissues, especially in PCT, SCC, SCR-R, and SFO-L, with intermediate fluctuations before descending to low levels of FW-VF (A). However, in the majority of fiber tissues, changes in the extracellular space induced by inflammatory activities of SIV result in increasing FW-VF, with two noticeable trends (B, C), but leading to the same endpoint. PCT, pontine crossing tract; SCC, splenium of corpus callosum; SCR-R, right superior corona radiata; SFO-L, left superior fronto-occipital fasciculus; SCP-L, left superior cerebellar peduncle; MLF-L, left medial longitudinal fasciculus; CTG-R, right central tegmental; AA-WM-L, left adjacent amygdala white matter; FX, fornix; ST-R, right stria terminalus; ST-L, left stria terminalus; SS-L, left sagittal striatum.
4.7 FW-corrected diffusion properties of rhesus monkeys following cART intervention (TFG+TDF+DTG)
The interactive effects of cART treatment and time were also found in the FW-corrected diffusion properties of the two fiber tracts (see Figure 3, Table 4). Those who received cART intervention showed a progressive increase in FW-corrected FA values over time, while those who did not receive it exhibited a decreasing pattern, particularly in the left sagittal striatum and right central tegmental fiber tracts. A post-hoc analysis revealed that the most apparent differences in FW-FA were exhibited on day 336 of MRI scanning, i.e., 296 days after cART intervention (cART-, vs. cART+ at T7, Supplementary Table S8). We also identified independent effects of time on FW-FA for several fiber tissues (see Figure 5, also see Supplementary Table S4). Ten (10) fiber tracts demonstrated a significant reduction in FW-FA values over time, independent of cART status. These fiber tracts include the dorsal prefrontal WM, adjacent thalamus WM, genu of corpus callosum, perihippocampal cingulum, central tegmental, anterior cingulum WM, external capsule, adjacent amygdala WM, and midbrain WM.
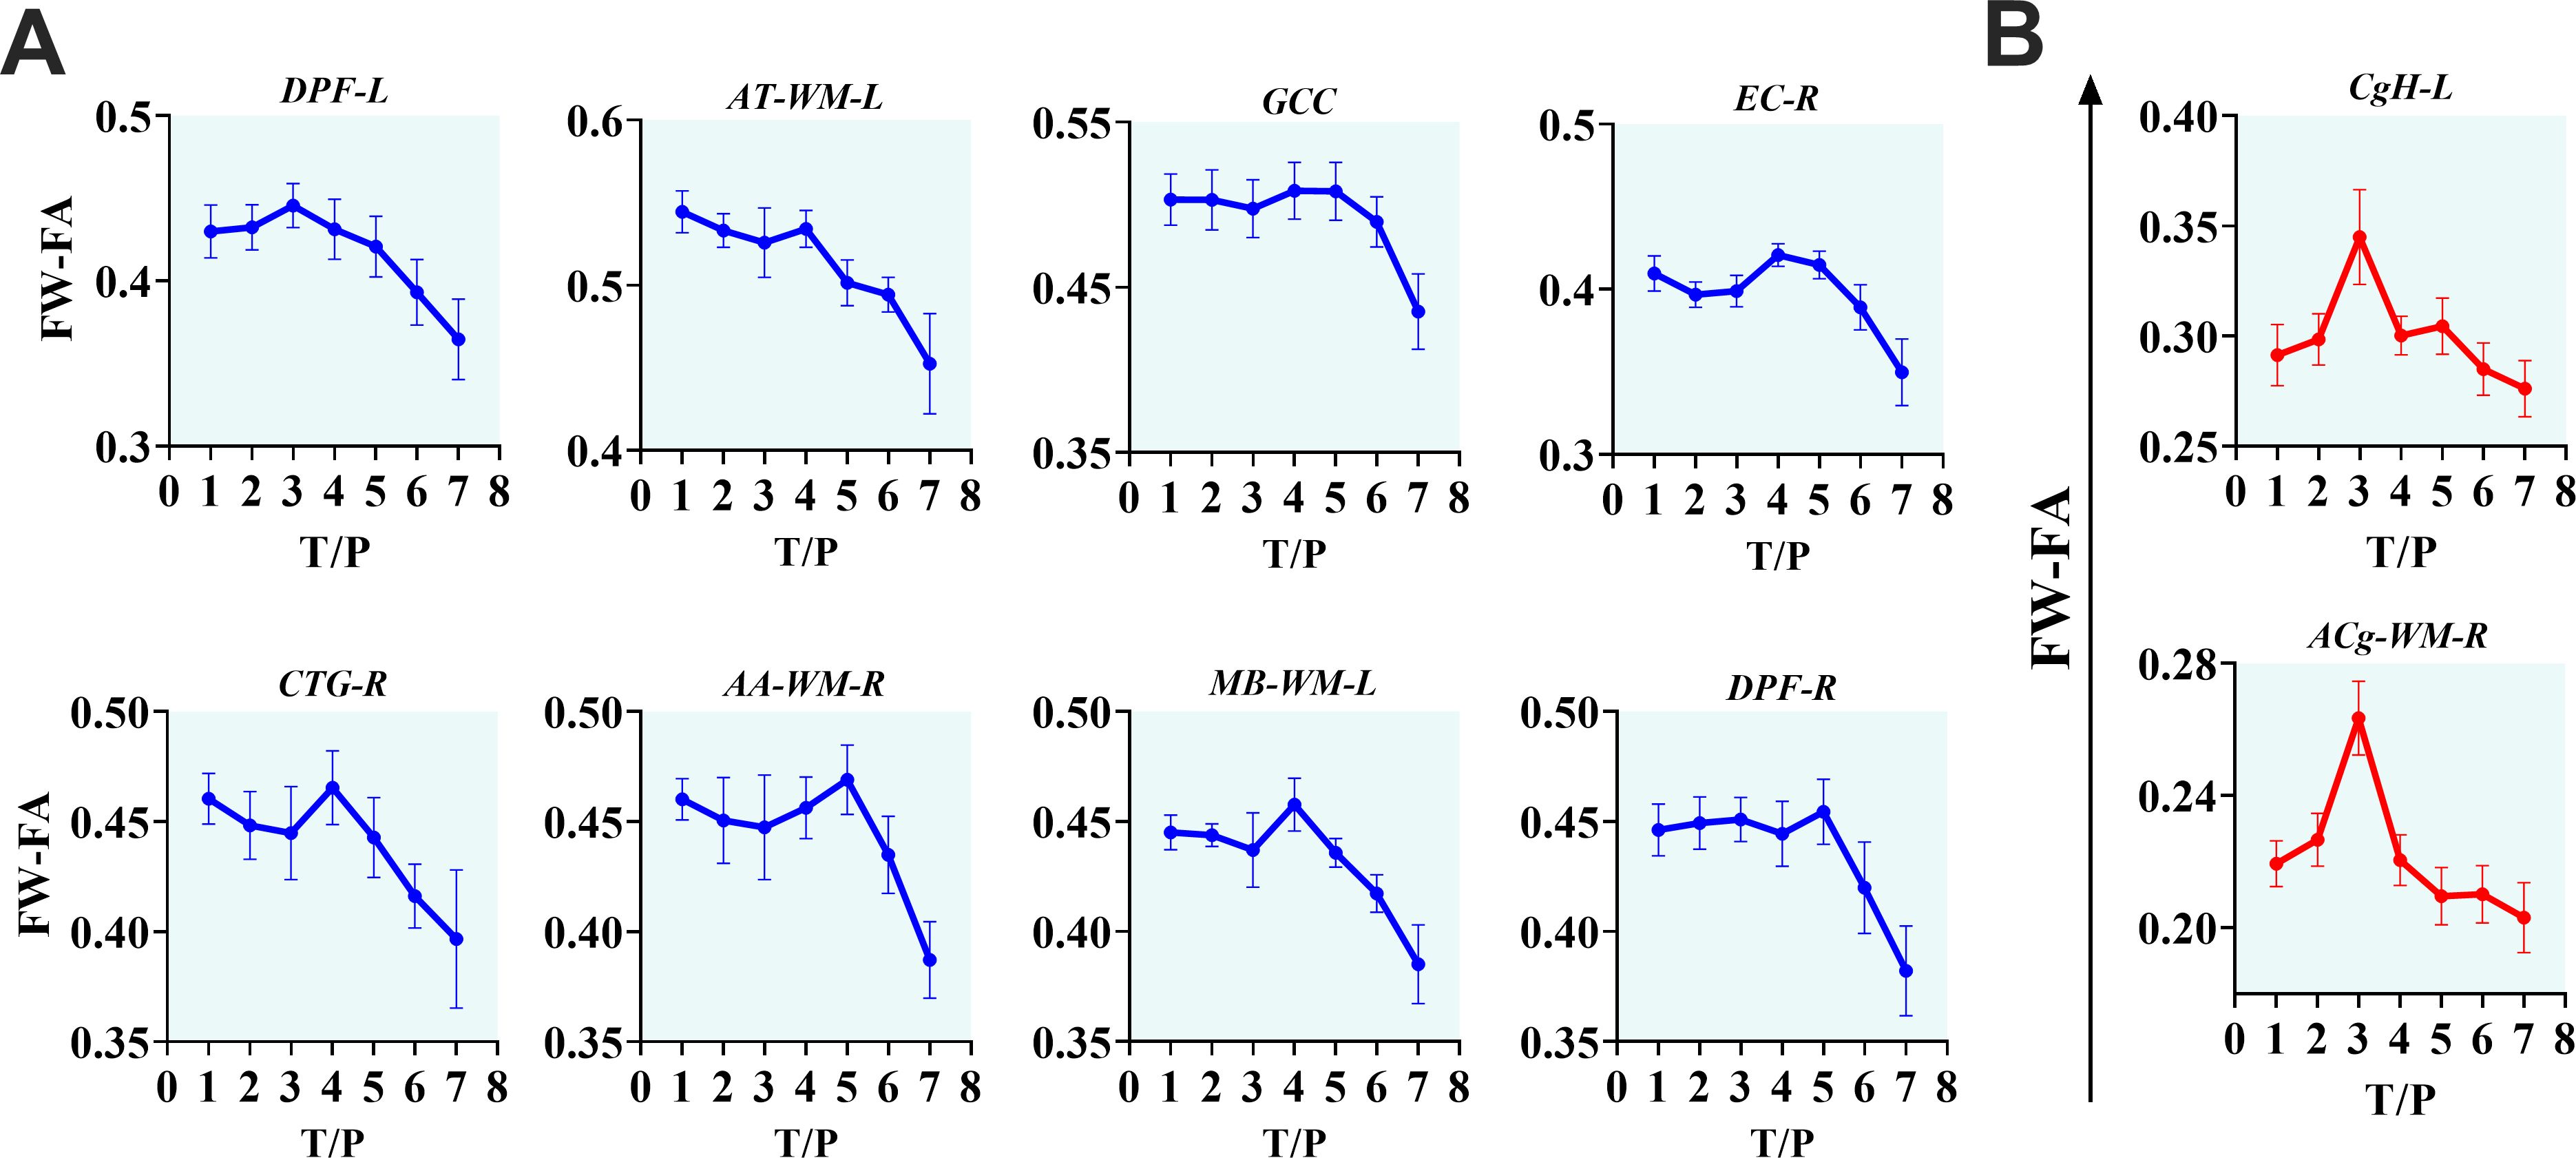
Figure 5. The progressive effects of SIVmac239 on FW-FA over time, independent of cART status. (A, B) The longitudinally independent effects of SIV infection on FW-FA are more apparent within fiber tissues of DPF-L, AT-WM-L, GCC, EC-R, CTG-R, AA-WM-R, MB-WM-L, DPF-R, CgH-L, and ACg-WM-R. Two (B) of the ten fiber tissues exhibit a unique intermediate rise in FW-FA before completely declining. DPF-L, left dorsal prefrontal white matter; AT-WM-L, left adjacent thalamus white matter; GCC, genu of corpus callosum; EC-R, right external capsule; CTG-R, right central tegmental; AA-WM-R, right adjacent amygdala white matter; MB-WM-L, left midbrain white matter; DPF-R, right dorsal prefrontal white matter; CgH-L, left perihippocampal cingulum; ACg-WM-R, right anterior cingulum white matter.
4.8 Associations of extracellular measures and diffusion properties with the clinical measures
The association between clinical measurements (i.e., SIV copies, CD4 T-cells, and CD4/CD8 ratio) and brain markers is shown in Figures 6–8. A progressive increase in viral load (SIV copies per mL) and a continuous decline in the immune system (indicated by lower CD4 T-cells and CD4/CD8 ratio) occurred in parallel with changes in the extracellular spaces and diffusion properties of brain fiber tissues. In fact, a low CD4/CD8 ratio was associated with increased extracellular FW-VF across fiber tissues of the ACR-L, PTR-R, DPF-L, VPF-L, and IFG-L (Figure 6A). Similarly, decreased CD4 T-cell counts were strongly associated with increased FW-VF across the ACR-L, SS-L, CgH-L, VPF-L, and MTG-WM-R (Figure 6C). Conversely, an increased number of SIV copies, reflecting disease progression, was highly associated with increased FW-VF in the fiber tissues, particularly the SLF-L, DPF-R, PT, and MTG-WM-L (Figure 6D)(Also see Supplementary Table S5 for statistics). For diffusion properties, we found significant associations between compromised immunity, increased SIV copies, and the diffusion properties of the fiber tissues (Figure 7). In particular, a low CD4/CD8 ratio was associated with reduced FW-FA values; this was more apparent in the fiber tissues of ACR-L, SFO-R, and ACg-WM-L (Figure 7A). Decreased CD4 T-cells were also associated with reduced FW-FA values across multiple fiber tissues, especially the BCC, FX, SS-R, VPF-R, and VPF-L (Figure 7C). Conversely, increased SIV viral copies per ml were associated with reduced FW-FA values in the CgH-R and increased FW-FA values in the SLF-R (Figure 7B) (Also see Supplementary Table S6 for statistics of these results). On the other hand, the analysis of associations with FW-MD revealed that a low CD4/CD8 ratio was independently associated with reduced FW-MD values across the ACR-R, SS-L, CgH-L, IFG-WM-R, IFG-WM-L, and ACg-WM-R (Figure 8A). Additionally, decreased CD4 T-cells were associated with reduced FW-MD values for fiber tissues of BCC, FX, CgH-L, SLF-L, IFG-WM-R, and ACg-WM-R (Figure 8C), whereas increased viral copies as the disease advances was associated with reduced FW-MD values in the DPF-R fiber tissues (Figure 8B) (Also see Supplementary Table S7 for statistics of these results). Further analysis using correlation techniques to support the findings of this section is summarized in Supplementary Table S9. And the most interesting results were in Supplementary Table S10, where the rate of changes in CD4 T-cells over time was significantly correlated with the rate of changes in FW-VF, FV-FA, and FW-MD.
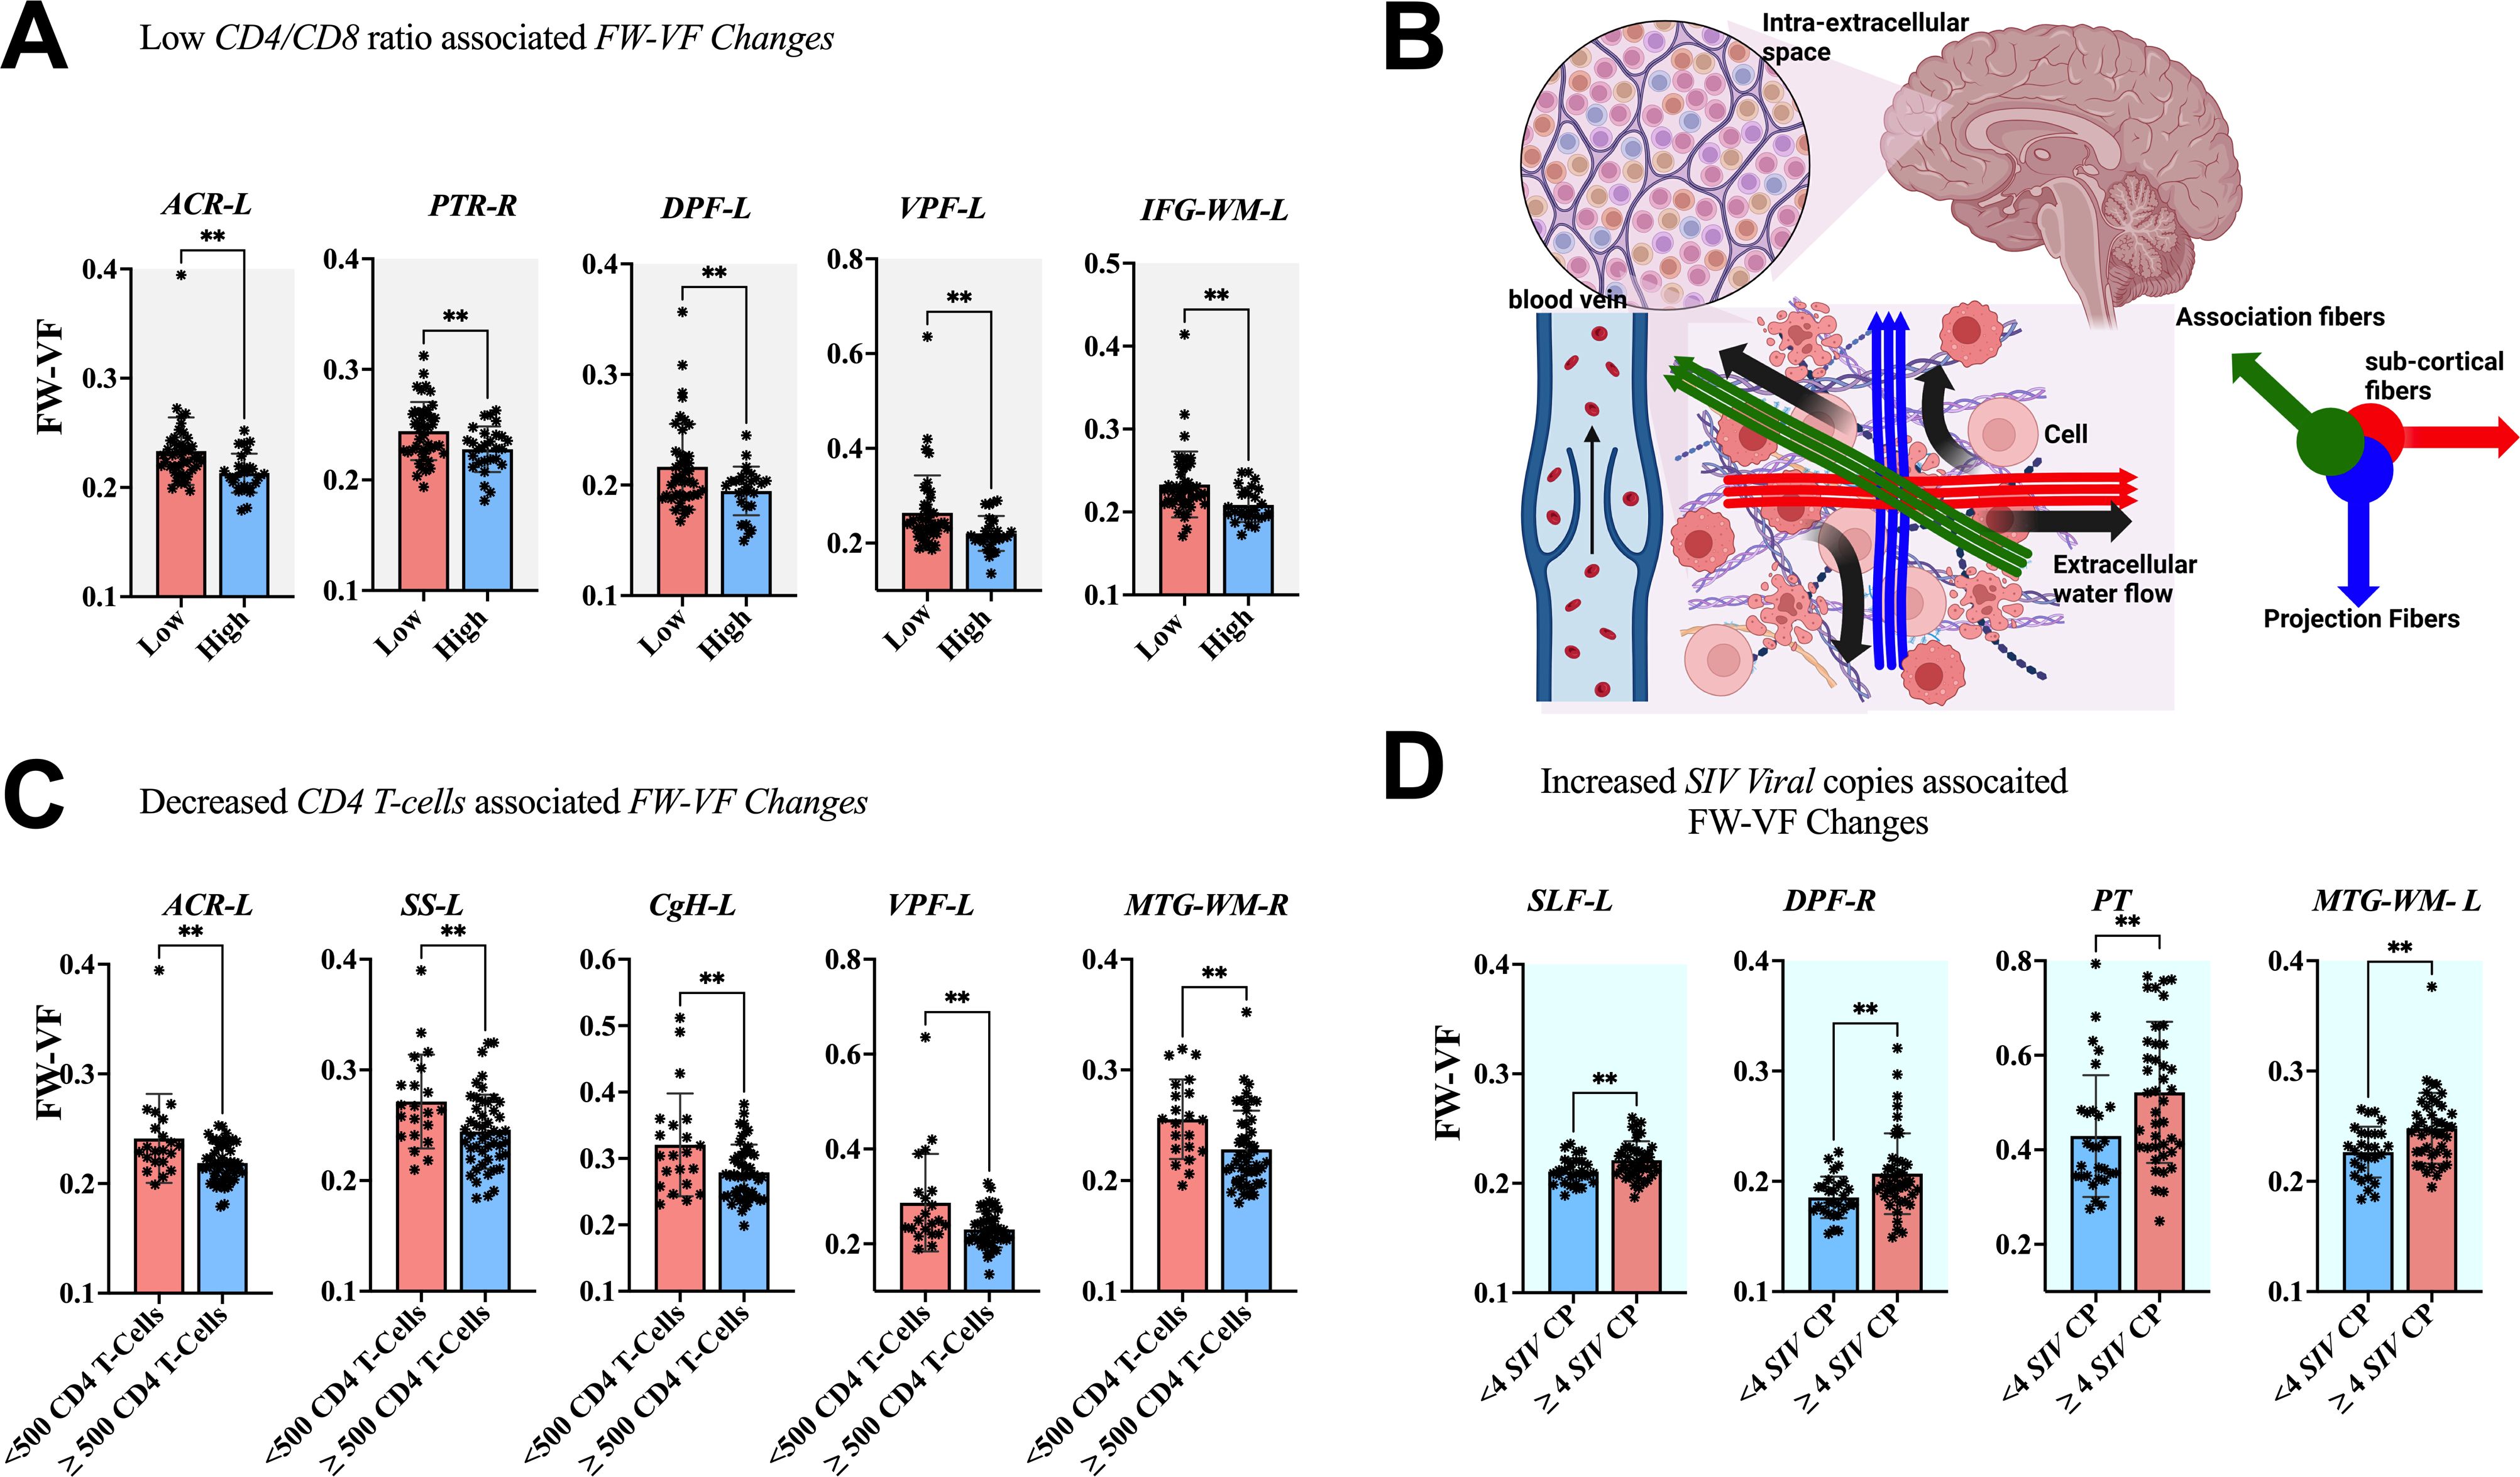
Figure 6. Association between immunological markers and changes in extracellular spaces. The low CD4/CD8 ratio (A), decreased CD4 T-cell count (C), and increased number of SIV viral copies (D) were associated with increased free water volume fraction (FW-VF). (B) Shows the pathways of extracellular FW in the brain parenchyma and in the proximity of fiber tissues. ACR-L, left anterior corona radiata; PTR-R, right posterior thalamic radiation; DPF-L, left dorsal prefrontal white matter; VPF-L, left ventral prefrontal white matter; IFG-WM-L, left inferior frontal gyrus white matter; ACR-L, left anterior corona radiata; SS-L, left sagittal striatum; CgH-L, left perihippocampal cingulum; VPF-L, left ventral prefrontal white matter; MTG-WM-R, right middle temporal gyrus white matter; SLF-L, left superior longitudinal fasciculus; DPF-R, right dorsal prefrontal white matter; PT, pyramidal tracts; MTG-WM-L, left middle temporal gyrus white matter. **P < 0.01.
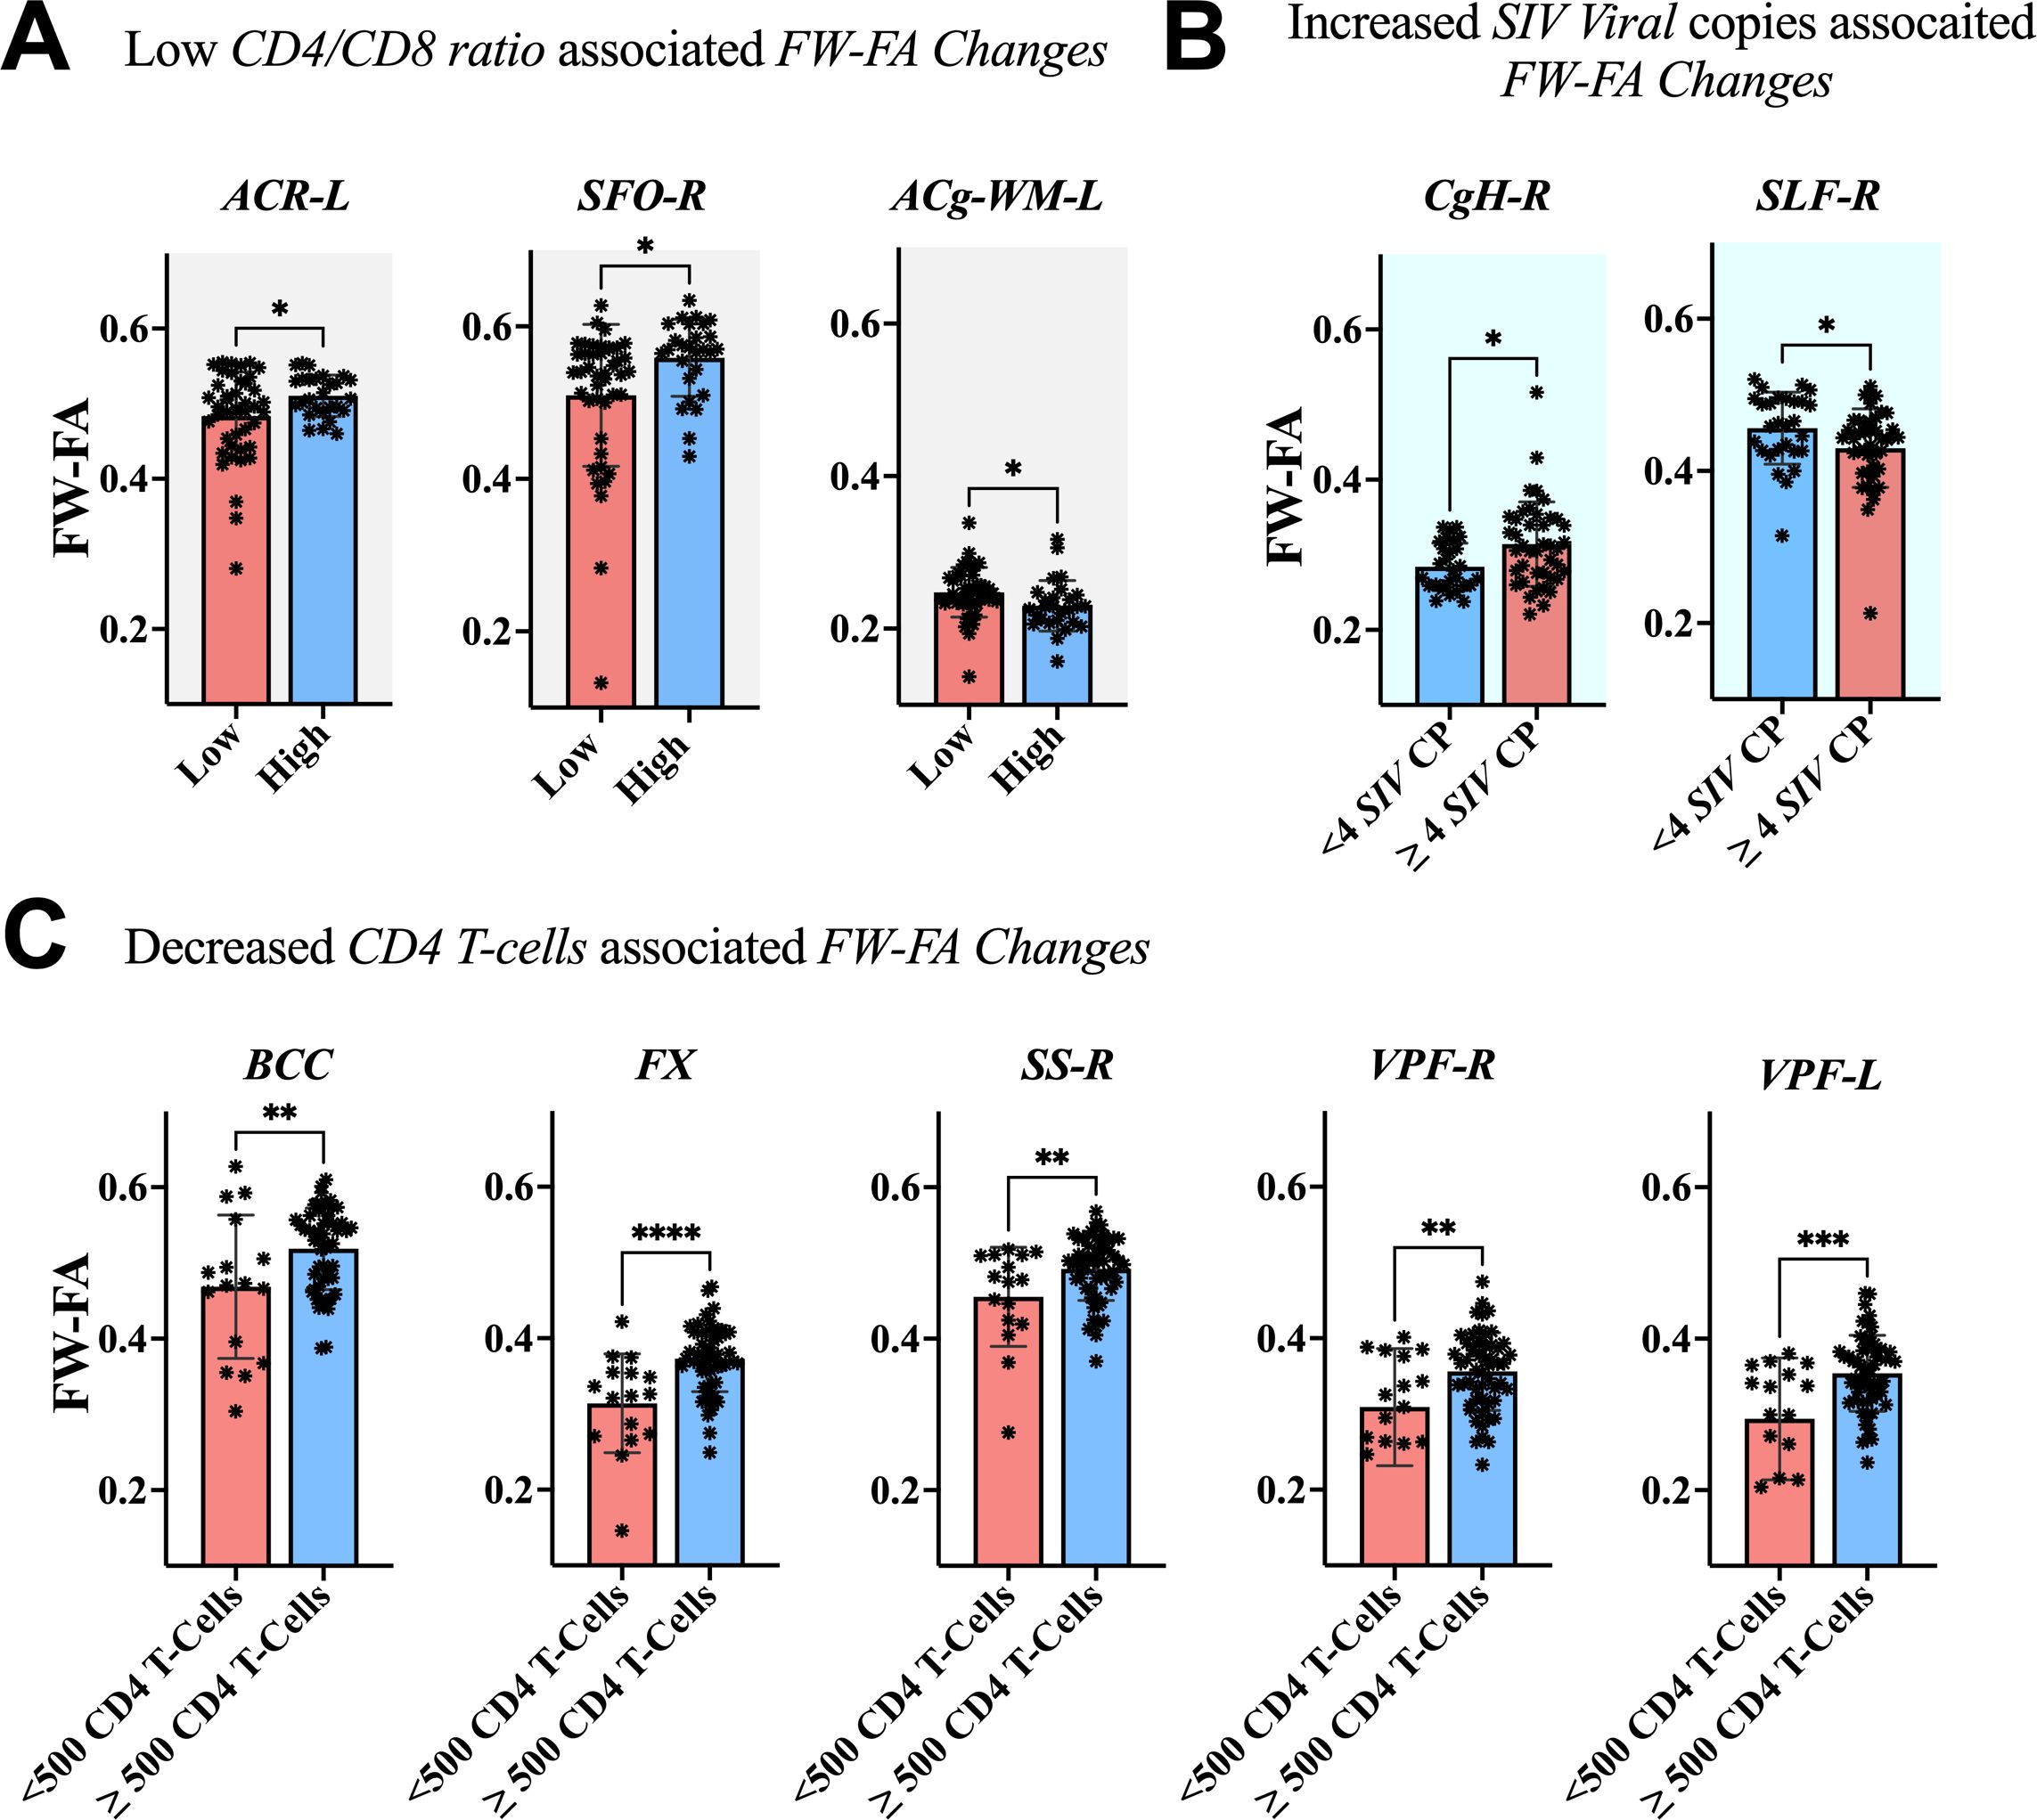
Figure 7. Association between immunological markers and changes in FW-FA of fiber tissues. The low CD4/CD8 ratio (A), decreased CD4 T-cell count (C), and increased number of SIV viral copies (B) were associated with decreased FW-FA across fiber tissues, with exception of CgH-R and ACg-WM-L presented increased FW-FA with increased number of SIV viral copies and low CD4/CD8 ratio, respectively. ACR-L, left anterior corona radiata; SFO-R, right superior fronto-occipital fasciculus; ACg-WM-L, left anterior cingulum white matter; CgH-R, right perihippocampal cingulum; SLF-R, right superior longitudinal fasciculus; BCC, body of corpus callosum; FX, fornix; SS-R, right sagittal striatum; VPF-R, right ventral prefrontal white matter; VPF-L, left ventral prefrontal white matter. *P < 0.05, **P < 0.01, ***P < 0.001, ****P < 0.0001.
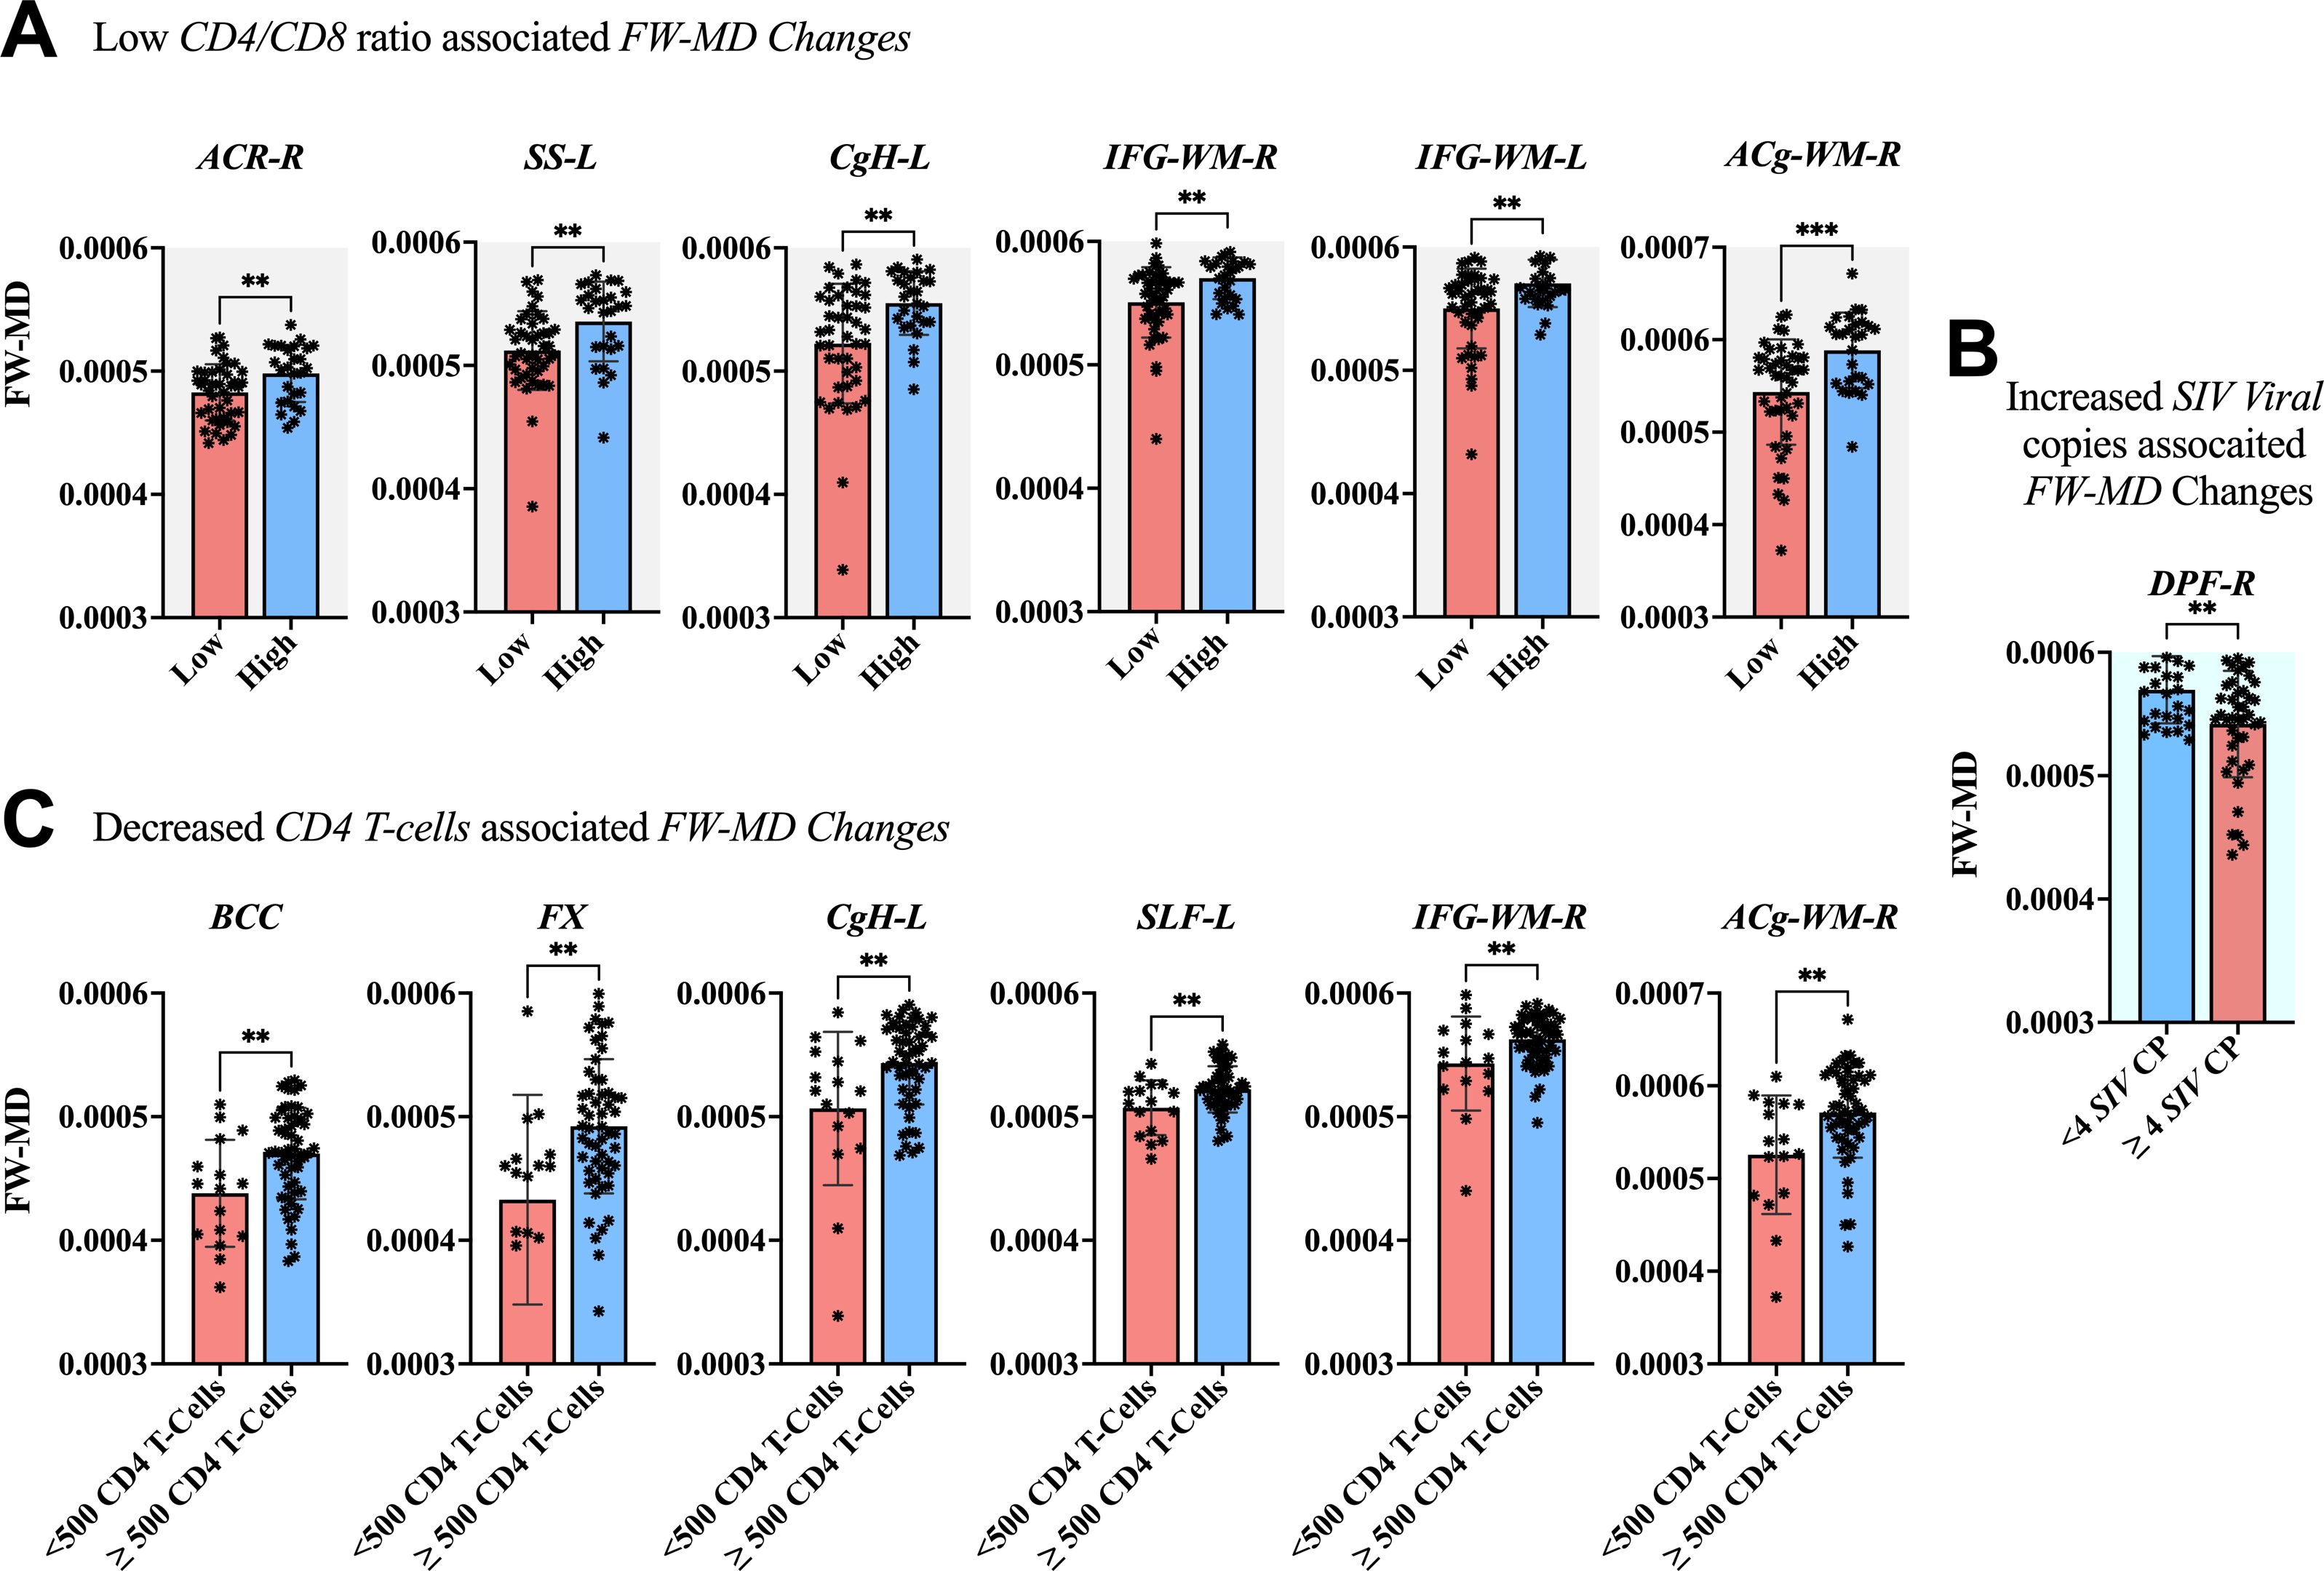
Figure 8. Association between immunological markers and changes in FW-MD of fiber tissues. The low CD4/CD8 ratio (A), decreased CD4 T-cell count (C), and increased number of SIV viral copies (C) were associated with decreased FW-MD values across fiber tissues. ACR-R, right anterior corona radiata; SS-L, left sagittal striatum; CgH-L, left perihippocampal cingulum; IFG-WM-R, right inferior frontal gyrus white matter; IFG-WM-L, left inferior frontal gyrus white matter; ACg-WM-R, right anterior cingulum white matter; BCC, body of corpus callosum; FX, fornix; CgH-L, right perihippocampal cingulum; SLF-L, left superior longitudinal fasciculus; IFG-WM-R, right inferior frontal gyrus white matter; ACg-WM-R, right anterior cingulum white matter; DPF-R, right dorsal prefrontal white matter. *P < 0.05, **P < 0.01, ***P < 0.001.
5 Discussion
Here, to gather evidence from animal models to answer the seven key questions of interest, we injected rhesus monkeys with Simian Immunodeficiency Virus (SIV). The first question was to determine the SIV entry into the CNS compartment of Chinese-origin rhesus monkeys as early as 7 days post-inoculation. Second, we focused on investigating the time at which the effects of SIV begin to manifest in the extracellular environment and observed whether these effects occur in parallel with immune deterioration. Third, we investigated the spectrum of injury to the extracellular environment when the rhesus monkeys are not initiated with suppressive antiretroviral therapy over an extended period of time. Forth, we examined whether or not our combination of the emtricitabine (EMTBL/FTC) + dotutegravir (DTG) + tenofovir disoproxil fumarate (TDF) could repair the extracellular damage induced by SIV. Fifth, we focused on investigating whether our regimen exacerbates, to a certain extent, the detrimental effects of SIV on some brain regions. Sixth, we examined whether the improvement in the immune system, if it exists after taking the regimen, is parallel to the improvement in the intra- and extracellular milieu of the brain. Lastly, we gathered evidence to validate whether inflammatory processes are likely or partly at the core of changes in free water volume.
In line with the first question, our data demonstrate the immunity level does not drop immediately after the infection but may manifest deficiency within the first 7 days after infection. Within this period, the number of SIV copies per ml increases rapidly from 0 to 6.89 ± 0.44 in plasma, or to 6.92 ± 0.40 in CSF. This rise of viral number signals the constant attacks of the immune system by SIV. The CD4/CD8 ratio begins to drop by 17.5% from 2.00± 0.77 at baseline to 1.65 ± 0.93 on day 7 following the infection. A continuous attack of the immune system causes a significant fall in the number CD4 T-cells below 1000 cells/μl and a further decline of CD4/CD8 ratio below ~1 within the first 14 days of infection. This marked effects on the immune system observed within the first 14 days after infection continue getting worse if no intervention is made as early as day 35 to 40 after infection. At this rate, the number of SIV copies/ml in plasma rises from 6.89 to 7.17 copies/ml. An early deficiency in the immune system seen in the first 14 days is accompanied by a 6% weight loss in rhesus monkeys; however, the animals regain their weight by day 28 and continue to show a progressive increase over time with a consistent, progressive diet.
Regarding to whether the SIV effects in the extracellular spaces and diffusion properties occur in parallel with immune deterioration, we found that increased SIV copies and impaired immune system (declined cd4 T-cell counts and reduced CD4/CD8 ratio) in rhesus monkeys occur in parallel with SIV-induced brain alterations in extracellular environment and diffusion properties of major fiber tissues. Both increased viral copies of SIV and impaired immune system are directly associated with increased changes in extracellular spaces (increased FW-VF) and reduced white matter integrity (reduced FW-FA values). Our findings of early deficiency in the immune system post-infection, which correspond to changes within the brain, are consistent with those of Gopalakrishnan et al., who detected increased IL-6 expression and other proinflammatory responses in the brain as early as 7 days of SIV infection, possibly indicating that the early SIV infection in the brain is characterized by significant macrophage infiltration and astrocyte activation (24). These activities are likely to contribute to increased levels of extracellular vesicles and elevate the levels of miR-21 in extracellular vesicles, leading to necroptosis via TLR7 signaling (25).
In addition to these previous studies, our experimental findings provide a clearer evidence that it takes about 28 days or less for the SIV effects on the brains of the Chinese-origin rhesus monkeys rhesus to surface and manifest, at least to a level detectable by MRI imaging. After SIV entry to the brain, the extracellular FW volumes of various fiber tissues are likely to exhibit disturbance within the period of 28 days. The changes in the extracellular spaces is probably the aftermaths of viral impact to the immune system (weakened immune system and brain defense system). This includes weakened brain-blood barrier (BBB), thereby allowing the SIV filtration to the parenchymal environment of the brain (26, 27). The entry of the SIV into the brain parenchyma may induce significant changes in both the extracellular and intracellular spaces. Our data show that we can capture these changes using MRI within the first 28 days of infection. Largely, SIV infection appear to cause excess free water content in the extracellular spaces, and this excess free water is largely seen within the fiber tissues of the internal and external capsules, corona radiata, thalamic radiation, longitudinal fasciculus, uncinate fasciculus and the prefrontal WM. The other possible changes that manifest within this period following SIV infection include alterations in the FW-corrected diffusion properties (FW-FA and FW-MD) of the fiber tissues. Based on our experiment, the FW-FA values decrease progressively after infection in a number of fiber tissues and such a decrease was more severe in the left central tegmental, at least within this period of 28 days after infection. The identified changes in FW-MD within period are prevalent across several fiber tissues, with two major fibers — the cerebellar peduncle (right and left inferior, and left superior) and the internal capsule (retrolenticular limb) indicating significant increases in FW-MD values.
Regarding the extent of injury to which the extracellular environment could sustain when the rhesus monkeys are left untreated over extended period of time, our data reveal that SIV would likely continue to disrupt the extracellular environment over time, thereby increasing the fractional volumes of the FW in extracellular spaces of the left sagittal striatum and the right tegmental fiber tract. As the CD4/CD8 ratio and CD4 T-cell number keep dropping, and SIV viral copies keep increasing, the extracellular FW-VF surrounding several fiber tissues are likely to be affected, including the left anterior corona radiata, right posterior thalamic radiation, left dorsal prefrontal WM, left ventral prefrontal WM, left inferior frontal gyrus WM, left perihippocampal cingulum, right middle temporal gyrus WM, left superior longitudinal fasciculus, and pyramidal tracts. As the infection progresses, some of these fiber tissues and others may start to display changes in their FW-FA values, suggesting a severe threat to their microstructural integrity. The fiber tissues likely to undergo such modifications include the left anterior corona radiata, right superior fronto-occipital fasciculus, left anterior cingulum WM, right perihippocampal cingulum, right superior longitudinal fasciculus, body of the corpus callosum, fornix, right sagittal striatum, and left/right ventral prefrontal WM. On the other hand, the FW-corrected MD values of these fiber tissues indicate changes. The more notable changes in MD values start to appear in the body of the corpus callosum, fornix, left perihippocampal cingulum, left superior longitudinal fasciculus, left/right inferior frontal white matter, right anterior cingulum white matter, right anterior corona radiata, and left sagittal striatum. Meanwhile our findings admit that the rhesus monkey may exhibit different spectrum of injury on the extracellular environment and fiber tissues, which may depend on the variations in the trajectory of disease progression, partially dependent on the levels of immunity deterioration and nadir CD4 T-cell counts, among other factors.
Whether the spread of SIV injury in the extracellular spaces or across fiber tissues follows specific physical pathways or is promoted by certain physical organization of tissues in relation to their proximity to the vasculature or CSF pathways requires further investigation. However, what we know so far is that the central tegmental and sagittal striatum fiber tissues, whose surrounding extracellular FW-VF has been attenuated, have consistently been linked to HIV pathology (28–30). For example, a study of a 52-year-old male with HIV and a history of hypertension and cocaine abuse detected abnormal WM lesions on the bilateral central tegmental fiber tract and a subacute infarct of the posterior limb of the right internal capsule (28). The central tegmental fiber tissue and other white matter tracts such as longitudinal fascicules and anterior commissure of patients with AIDS have been identified with a large and localized accumulation of dense cytoplasm and myelin balloons—the vacuoles in myelin sheaths after HIV infection (31). Such pathogenic features in WM tracts are accommodated in the spaces between myelin lamellae, or arise from the space between axon surface and inner most myelin wrap (32), indicating focal spongy myelin damage or vacuolar myelin damage, caused by HIV-induced inflammation and neurotoxins (31). Studies pointed out that HIV injury also appear in sagittal striatum fiber tissues as alterations in FA, MD, or AD values, reflecting axon damage or demyelination (29, 30, 33), or as WMH lesions (34). Therefore, our findings, which show an excessive increase in extracellular FW-VF and alterations in FW-FA and FW-MD values in various fiber tissues, including the sagittal striatum and central tegmental, in SIV-infected rhesus monkeys untreated with cART, may provide additional MRI-based evidence of earlier reports of brain injury after infection. The findings also offer further evidence of how the injury progresses across other fibers when the rhesus monkeys are left untreated.
Our data indicate that the FTC+TDF+DTG regimen not only enhances the immune system and suppresses SIV replication but also promotes the repair of extracellular damage caused by SIV. Within the first 44 days of progressive cART the number of SIV copies in cART-treated rhesus monkeys was significantly reduced by 75.09%, with 60%(3 of 5), 80%(4 of 5), and 100% (5 of 5) of rhesus macaques achieving a total viral suppression by day 44, day 128, and day 212, respectively. The immunity level was maintained to nearly 1.5 (CD4/CD8 ratio) from day 16 through day 212 following cART initiation, and significantly restored to 1.9 on day 310 of suppressive cART. Our observations revealed that these rhesus monkeys who responded positively to suppressive drugs (i.e., attaining viral suppression and improving immune system), demonstrated an improved extracellular environment as quantified by FW-VF as well as improved white matter integrity as quantified by FW-FA. These findings cement that enhancements in the immune system post regimen initiation align with positive alterations in both the intra- and extracellular environments of the brain. This underscores the critical importance of early commencement of cART to manage viral replication or limit viral reservoir effectively (3, 35), thereby playing a crucial role in averting further harm to the brain. Our data do not provide sufficient evidence to indicate an increase in detrimental effects of suppressive antiretroviral therapy on the damage caused by SIV. We observed improved FA and reduced FW-VF over time in most fiber tissues following the initiation of suppressive antiretroviral therapy. However, there are main effects of time on rhesus monkeys following the infection with three different patterns of trends of across fibers. The first trend indicated a decrease in FW-VF as time progressed, whereas the other two trends displayed a consistent increase in FW-VF over time, regardless of the treatment administered to the monkeys.
Our experimental findings likely suggest the occurrence of modifications in the extracellular milieu post-infection in inflammatory diseases, underscoring the impact of inflammatory processes on modulating extracellular spaces and functions. This conclusively addresses the early conjectures associating inflammatory disorders such as Parkinson’s disease with changes in extracellular volume (6, 16). The presence of inflammatory cytokines and inducible nitric oxide synthase (iNOS) in the brains of SIV-infected monkeys and increased levels of nitric oxide (NO) in the cerebrospinal fluid (CSF) (36) underscores the ongoing inflammation and immune activation, which may underlie changes in extracellular environment, including FW-VF. Our research provides further evidence for the possibility that elevated extracellular FW-VF serves as a reliable biomarker for neuroinflammation in neurodegenerative conditions, aligning with early studies (37), and we further cement that an impairment in glymphatic function by neuroinflammation can further exacerbate the abnormal accumulation of cerebrospinal fluid (CSF) and extracellular fluid in the brain, progressively leading to alterations in the white matter integrity, cellular signaling, and homeostatic balance of the brain tissues (38).
5.1 Limitations
There are several limitations worth-mentioning in this study. First, while we generally agree that HIV or SIV can be considered neuroinflammatory diseases due to HIV or SIV-triggered activation of microglia, NLRP3 inflammasome, and caspase-1, as well as the release of IL-1β (39–41), the absence of a study-specific histopathological assessment may limit our conclusions. Second, although we applied several exclusion criteria to our rhesus monkeys to screen out those with conditions such as herpes B virus, STLV-I, and SRV, which may affect the brain, further studies are needed to account for other potential factors, such as early inflammation status, which is likely to affect the DTI-derived metrics. The current study design did not include a control cohort for comparison, which could have strengthened our findings. Thus, a control cohort is warranted to broaden the scope of our findings.
6 Conclusion
Our findings show that the immunity level is compromised as early as 7 days after SIV infection, with a rapid increase in SIV copies per mL and a significant drop in the CD4/CD8 ratio within the first 14 days of infection. The compromise in the immune system occurs in parallel with alterations in the extracellular environment and diffusion properties of fiber tissues, possibly suggesting that SIV enters the brain parenchyma in the very early days of infection via a weakened brain defense system. Our experimental findings provide direct and longitudinal evidence of the benefits of early initiation of FTC+TDF+DTG in enhancing the immune system, suppressing SIV replication, and repairing and curbing further damage to the intra- and extracellular environment. And such benefits may be more apparent as early as the first 44 days of cART initiation. Lastly, our findings provide the first SIVmac239-based evidence that extracellular FW-VF may be a reliable biomarker of increased inflammatory processes in neurological disorders, and as thus this information may be valuable to development of therapeutic strategies.
Data availability statement
The original contributions presented in the study are included in the article/Supplementary Material. Further inquiries can be directed to the corresponding author.
Ethics statement
The animal study was approved by the ethical committee of the Beijing Municipal Science and Technology Commission, the University of Science and Technology of China, and Wenzhou Medical University. The study was conducted in accordance with the local legislation and institutional requirements.
Author contributions
BN: Conceptualization, Data curation, Formal analysis, Investigation, Methodology, Project administration, Resources, Software, Supervision, Validation, Visualization, Writing – original draft, Writing – review & editing. YL: Conceptualization, Data curation, Formal analysis, Investigation, Methodology, Resources, Software, Validation, Visualization, Writing – original draft, Writing – review & editing. YH: Conceptualization, Data curation, Formal analysis, Investigation, Methodology, Resources, Software, Validation, Visualization, Writing – original draft, Writing – review & editing. YW: Conceptualization, Data curation, Formal analysis, Investigation, Resources, Software, Validation, Visualization, Writing – original draft, Writing – review & editing. JL: Conceptualization, Data curation, Formal analysis, Investigation, Methodology, Resources, Validation, Visualization, Writing – original draft, Writing – review & editing. HL: Conceptualization, Data curation, Formal analysis, Funding acquisition, Investigation, Methodology, Project administration, Resources, Software, Supervision, Validation, Visualization, Writing – original draft, Writing – review & editing. PS: Conceptualization, Data curation, Formal analysis, Funding acquisition, Investigation, Methodology, Project administration, Resources, Software, Supervision, Validation, Visualization, Writing – original draft, Writing – review & editing.
Funding
The author(s) declare that financial support was received for the research, authorship, and/or publication of this article. This work was supported in part by the Science Foundation of Oujiang Laboratory [OJQD2022005 (to PS)]; the National Natural Science Foundation of China (61936013 (to HL); the Ministry of Science and Technology of China [SQ2019YF013267 (to HL)], and the China Primary Health Care Foundation-Youan Foundation of Liver Disease and AIDS [BJYAYY-CY2019-04 (to HL)]; the Beijing Natural Science Foundation [7212051 (to HL)]. This work was also supported by Biomedical Big Data Intelligent Computing Center of Oujiang Lab.
Conflict of interest
The authors declare that the research was conducted in the absence of any commercial or financial relationships that could be construed as a potential conflict of interest.
Publisher’s note
All claims expressed in this article are solely those of the authors and do not necessarily represent those of their affiliated organizations, or those of the publisher, the editors and the reviewers. Any product that may be evaluated in this article, or claim that may be made by its manufacturer, is not guaranteed or endorsed by the publisher.
Supplementary material
The Supplementary Material for this article can be found online at: https://www.frontiersin.org/articles/10.3389/fimmu.2025.1463434/full#supplementary-material
References
1. Liu P-T, Keele BF, Abbink P, Mercado NB, Liu J, Bondzie EA, et al. Origin of rebound virus in chronically SIV-infected Rhesus monkeys following treatment discontinuation. Nat Commun. (2020) 11:5412. doi: 10.1038/s41467-020-19254-2
2. Nadeau JH, Auwerx J. The virtuous cycle of human genetics and mouse models in drug discovery. Nat Rev Drug Discovery. (2019) 18:255–72. doi: 10.1038/s41573-018-0009-9
3. Whitney JB, Lim S-Y, Osuna CE, Kublin JL, Chen E, Yoon G, et al. Prevention of SIVmac251 reservoir seeding in rhesus monkeys by early antiretroviral therapy. Nat Commun. (2018) 9:5429. doi: 10.1038/s41467-018-07881-9
4. Xiong Y, Mahmood A, Chopp M. Animal models of traumatic brain injury. Nat Rev Neurosci. (2013) 14:128–42. doi: 10.1038/nrn3407
5. Lesh TA, Iosif A-M, Tanase C, Vlasova RM, Ryan AM, Bennett J, et al. Extracellular free water elevations are associated with brain volume and maternal cytokine response in a longitudinal nonhuman primate maternal immune activation model. Mol Psychiatry. (2023) 5:1–10. doi: 10.1038/s41380-023-02213-w
6. Lyall AE, Pasternak O, Robinson DG, Newell D, Trampush JW, Gallego JA, et al. Greater extracellular free-water in first-episode psychosis predicts better neurocognitive functioning. Mol Psychiatry. (2018) 23:701–7. doi: 10.1038/mp.2017.43
7. Madelin G, Kline R, Walvick R, Regatte RR. A method for estimating intracellular sodium concentration and extracellular volume fraction in brain in vivo using sodium magnetic resonance imaging. Sci Rep. (2014) 4:4763. doi: 10.1038/srep04763
8. Samani ZR, Parker D, Wolf R, Hodges W, Brem S, Verma R. Distinct tumor signatures using deep learning-based characterization of the peritumoral microenvironment in glioblastomas and brain metastases. Sci Rep. (2021) 11:14469. doi: 10.1038/s41598-021-93804-6
9. Di Biase MA, Cetin-Karayumak S, Lyall AE, Zalesky A, Cho KIK, Zhang F, et al. White matter changes in psychosis risk relate to development and are not impacted by the transition to psychosis. Mol Psychiatry. (2021) 26:6833–44. doi: 10.1038/s41380-021-01128-8
10. Steventon J, Chandler H, Foster C, Dingsdale H, Germuska M, Massey T, et al. Changes in white matter microstructure and MRI-derived cerebral blood flow after 1-week of exercise training. Sci Rep. (2021) 11:22061. doi: 10.1038/s41598-021-01630-7
11. Hoy AR, Koay CG, Kecskemeti SR, Alexander AL. Optimization of a free water elimination two-compartment model for diffusion tensor imaging. Neuroimage. (2014) 103:323–33. doi: 10.1016/j.neuroimage.2014.09.053
12. Sepehrband F, Cabeen RP, Choupan J, Barisano G, Law M, Toga AW, et al. Perivascular space fluid contributes to diffusion tensor imaging changes in white matter. Neuroimage. (2019) 197:243–54. doi: 10.1016/j.neuroimage.2019.04.070
13. Uddin MN, Faiyaz A, Wang L, Zhuang YC, Murray KD, Descoteaux M, et al. A longitudinal analysis of brain extracellular free water in HIV infected individuals. Sci Rep. (2021) 11:8273. doi: 10.1038/s41598-021-87801-y
14. Archer DB, Moore EE, Pamidimukkala U, Shashikumar N, Pechman KR, Blennow K, et al. The relationship between white matter microstructure and self-perceived cognitive decline. Neuroimage-Clinical. (2021) 32:102794. doi: 10.1016/j.nicl.2021.102794
15. Jeon T, Mishra V, Uh J, Weiner M, Hatanpaa KJ, White CL, et al. Regional changes of cortical mean diffusivities with aging after correction of partial volume effects. Neuroimage. (2012) 62:1705–16. doi: 10.1016/j.neuroimage.2012.05.082
16. Ogawa T, Hatano T, Kamagata K, Andica C, Takeshige-Amano H, Uchida W, et al. White matter and nigral alterations in multiple system atrophy-parkinsonian type. NPJ Parkinsons Dis. (2021) 7:96. doi: 10.1038/s41531-021-00236-0
17. Pieciak T, París G, Beck D, Maximov II, Tristán-Vega A, de-Luis-García R, et al. Spherical means-based free-water volume fraction from diffusion MRI increases non-linearly with age in the white matter of the healthy human brain. Neuroimage. (2023) 279:120324. doi: 10.1016/j.neuroimage.2023.120324
18. Cox RW. AFNI: Software for analysis and visualization of functional magnetic resonance neuroimages. Comput Biomed Res. (1996) 29:162–73. doi: 10.1006/cbmr.1996.0014
19. Wang X, Li X-H, Cho JW, Russ BE, Rajamani N, Omelchenko A, et al. U-net model for brain extraction: Trained on humans for transfer to non-human primates. Neuroimage. (2021) 235:118001. doi: 10.1016/j.neuroimage.2021.118001
20. Jenkinson M, Beckmann CF, Behrens TE, Woolrich MW, Smith SM. Fsl. NeuroImage. (2012) 62:782–90. doi: 10.1016/j.neuroimage.2011.09.015
21. Pasternak O, Sochen N, Gur Y, Intrator N, Assaf Y. Free water elimination and mapping from diffusion MRI. Magnetic Resonance Medicine: Off J Int Soc Magnetic Resonance Med. (2009) 62:717–30. doi: 10.1002/mrm.22055
22. Zakszewski E, Adluru N, Tromp DPM, Kalin N, Alexander AL. A diffusion-tensor-based white matter atlas for rhesus macaques. PloS One. (2014) 9:e107398. doi: 10.1371/journal.pone.0107398
23. R Core Team. (2019). R: A Language and Environment for Statistical Computing. (Vienna, Austria: R Foundation for Statistical Computing).
24. Gopalakrishnan RM, Aid M, Mercado NB, Davis C, Malik S, Geiger E, et al. Increased IL-6 expression precedes reliable viral detection in the rhesus macaque brain during acute SIV infection. JCI Insight. (2021) 6:e152013. doi: 10.1172/jci.insight.152013
25. Yelamanchili SV, Lamberty BG, Rennard DA, Morsey BM, Hochfelder CG, Meays BM, et al. Correction: MiR-21 in extracellular vesicles leads to neurotoxicity via TLR7 signaling in SIV neurological disease. PloS Pathog. (2015) 11:e1005131. doi: 10.1371/journal.ppat.1005131
26. Bohannon DG, Okhravi HR, Kim J, Kuroda MJ, Didier ES, Kim W-K. A subtype of cerebrovascular pericytes is associated with blood-brain barrier disruption that develops during normal aging and simian immunodeficiency virus infection. Neurobiol Aging. (2020) 96:128–36. doi: 10.1016/j.neurobiolaging.2020.08.006
27. Chakrabarti L, Hurtrel M, Maire M, Vazeux R, Dormont D, Montagnier L, et al. Early viral replication in the brain of SIV-infected rhesus monkeys. Am J Pathol. (1991) 139:1273.
28. Behzadi F, Fiester PJ, Rao D. Bilateral hypertrophic olivary degeneration following brainstem insult: a retrospective review and examination of causative pathology. Neurosci Insights. (2021) 16:26331055211007445. doi: 10.1177/26331055211007445
29. Hoare J, Fouche J-P, Spottiswoode B, Sorsdahl K, Combrinck M, Stein DJ, et al. White-matter damage in clade C HIV-positive subjects: a diffusion tensor imaging study. J neuropsychiatry Clin Neurosci. (2011) 23:308–15. doi: 10.1176/jnp.23.3.jnp308
30. Qi Y, Li R-L, Wang Y-Y, Wang W, Liu X-Z, Liu J, et al. Characteristics of brain white matter microstructure in HIV male patients with primary syphilis co-infection. Front Neurol. (2022) 12:776818. doi: 10.3389/fneur.2021.776818
31. Schmidbauer M, Huemer M, Cristina S, Trabattoni G, Budka H. Morphological spectrum, distribution and clinical correlation of white matter lesions in AIDS brains. Neuropathology Appl Neurobiol. (1992) 18:489–501. doi: 10.1111/j.1365-2990.1992.tb00816.x
32. Granados-Durán P, López-Ávalos MD, Cifuentes M, Pérez-Martín M, Fernández-Arjona M, d. M, et al. Microbial neuraminidase induces a moderate and transient myelin vacuolation independent of complement system activation. Front Neurol. (2017) 8:78. doi: 10.3389/fneur.2017.00078
33. Li R-l, Sun J, Tang Z-c, Zhang J-j, Li H-j. Axonal chronic injury in treatment-naïve HIV+ adults with asymptomatic neurocognitive impairment and its relationship with clinical variables and cognitive status. BMC Neurol. (2018) 18:1–12. doi: 10.1186/s12883-018-1069-5
34. Watson C, Busovaca E, Foley JM, Allen IE, Schwarz CG, Jahanshad N, et al. White matter hyperintensities correlate to cognition and fiber tract integrity in older adults with HIV. J Neurovirology. (2017) 23:422–9. doi: 10.1007/s13365-016-0509-5
35. Byrareddy SN, Arthos J, Cicala C, Villinger F, Ortiz KT, Little D, et al. Sustained virologic control in SIV+ macaques after antiretroviral and α4β7 antibody therapy. science. (2016) 354:197–202. doi: 10.1126/science.aag1276
36. Lane TE, Buchmeier MJ, Watry DD, Fox HS. Expression of inflammatory cytokines and inducible nitric oxide synthase in brains of SIV-infected rhesus monkeys: applications to HIV-induced central nervous system disease. Mol Med. (1996) 2:27–37. doi: 10.1007/BF03402200
37. Pasternak O, Westin C-F, Bouix S, Seidman LJ, Goldstein JM, Woo T-UW, et al. Excessive extracellular volume reveals a neurodegenerative pattern in schizophrenia onset. J Neurosci. (2012) 32:17365–72. doi: 10.1523/JNEUROSCI.2904-12.2012
38. Pfefferbaum A, Sullivan EV. Disruption of brain white matter microstructure by excessive intracellular and extracellular fluid in alcoholism: evidence from diffusion tensor imaging. Neuropsychopharmacology. (2005) 30:423–32. doi: 10.1038/sj.npp.1300623
39. Chivero ET, Guo M-L, Periyasamy P, Liao K, Callen SE, Buch S. HIV-1 Tat primes and activates microglial NLRP3 inflammasome-mediated neuroinflammation. J Neurosci. (2017) 37:3599–609. doi: 10.1523/JNEUROSCI.3045-16.2017
40. Li G, Makar T, Gerzanich V, Kalakonda S, Ivanova S, Pereira EF, et al. HIV-1 VPR-induced proinflammatory response and apoptosis are mediated through the SUR1-TRPM4 channel in astrocytes. Mbio. (2020) 11:10–1128. doi: 10.1128/mbio.02939-02920
Keywords: 7-stage SIV follow-up study, Chinese-origin rhesus monkeys, simian immunodeficiency virus, EMTBL/FTC + DTG + TDF regimen, viral rebound, drug resistance, extracellular free water volume fraction, diffusivity properties of fiber tissues
Citation: Nguchu BA, Lu Y, Han Y, Wang Y, Liu J, Li H and Shaw P (2025) Modulation and distribution of extracellular free water and tract deficits in rhesus macaques before and after the initiation of emtricitabine + tenofovir disoproxil fumarate + dotutegravir treatment. Front. Immunol. 16:1463434. doi: 10.3389/fimmu.2025.1463434
Received: 11 July 2024; Accepted: 06 February 2025;
Published: 28 February 2025.
Edited by:
H. Douglas (Doug) Morris, Uniformed Services University of the Health Sciences, United StatesReviewed by:
Govind Nair, National Institutes of Health (NIH), United StatesJoelle Sarlls, National Institutes of Health (NIH), United States
Copyright © 2025 Nguchu, Lu, Han, Wang, Liu, Li and Shaw. This is an open-access article distributed under the terms of the Creative Commons Attribution License (CC BY). The use, distribution or reproduction in other forums is permitted, provided the original author(s) and the copyright owner(s) are credited and that the original publication in this journal is cited, in accordance with accepted academic practice. No use, distribution or reproduction is permitted which does not comply with these terms.
*Correspondence: Hongjun Li, bGlob25nanVuMDAxMTNAY2NtdS5lZHUuY24=; Peter Shaw, cGV0ZXJzaGF3QG9qbGFiLmFjLmNu
†These authors have contributed equally to this work