
94% of researchers rate our articles as excellent or good
Learn more about the work of our research integrity team to safeguard the quality of each article we publish.
Find out more
ORIGINAL RESEARCH article
Front. Immunol., 10 February 2025
Sec. Cytokines and Soluble Mediators in Immunity
Volume 16 - 2025 | https://doi.org/10.3389/fimmu.2025.1441981
This article is part of the Research TopicAdenine Nucleotides in Immunity and InflammationView all 17 articles
 Mercedes Zubiaur1*†
 Laura C. Terrón-Camero2
 Fernando Gordillo-González2
 Eduardo Andrés-León2
 Alicia Barroso-del Jesús3
 Luz María Canet-Antequera3
 María M. Pérez Sánchez-Cañete4
 África Martínez-Blanco1
 Marilú Domínguez-Pantoja1
 María Botia-Sánchez1
 Sonia Pérez-Cabrera1
 Nerea Bello-Iglesias1Antonio Alcina1
 Ana-Clara Abadía-Molina5Fuencisla Matesanz1
 Esther Zumaquero6Ramón Merino7
 Jaime Sancho1*†
This study aimed to elucidate the transcriptomic signatures and dysregulated pathways associated with the autoimmune response in Cd38-/- mice compared to wild-type (WT) mice within the bm12 chronic graft-versus-host disease (cGVHD) lupus model. We conducted bulk RNA sequencing on peritoneal exudate cells (PECs) and spleen cells (SPC) at two and four weeks following adoptive cell transfer. We also analyzed cells from healthy, untreated mice. These analyses revealed a sustained upregulation of a transcriptional profile of purinergic receptors and ectonucleotidases in cGVHD WT PECs, which displayed a coordinated expression with several type I interferon-stimulated genes (ISGs) and with key molecules involved in the cyclic GMP-AMP synthase-stimulator of interferon genes (cGAS-STING) signaling pathway, two hallmarks in the lupus pathology. A second purinergic receptor transcriptomic profile, which included P2rx7 and P2rx4, showed a coordinated gene expression of the components of the NLRP3 inflammasome with its potential activators. These processes were transcriptionally less active in cGVHD Cd38-/- PECs than in WT PECs. We have also shown evidence of a distinct enrichment in pathways signatures that define processes such as Ca2+ ion homeostasis, cell division, phagosome, autophagy, senescence, cytokine/cytokine receptor interactions, Th17 and Th1/Th2 cell differentiation in Cd38-/- versus WT samples, which reflected the milder inflammatory and autoimmune response elicited in Cd38-/- mice relative to WT counterparts in response to the allogeneic challenge. Last, we have shown an intense metabolic reprogramming toward oxidative phosphorylation in PECs and SPC from cGVHD WT mice, which may reflect an increased cellular demand for oxygen consumption, in contrast to PECs and SPC from cGVHD Cd38-/- mice, which showed a short-lived metabolic effect at the transcriptomic level. Overall, these findings support the pro-inflammatory and immunomodulatory role of CD38 during the development of the cGVHD-lupus disease.
Systemic lupus erythematosus (SLE) is a female dominant autoimmune disease in which the autoreactive immune system causes inflammation and damage in multiple organs and tissues (1). CD38 expression on CD4+, CD8+, and CD25+ T cells was increased in SLE T cells and correlated with disease activity (2–5). Increased CD38 expression in T cells from patients with SLE may contribute to lupus pathogenesis because T cells produce Th1 and Th2 inflammatory cytokines when they are stimulated with CD38 antibodies (5). Increased CD38 expression greatly affects cellular metabolism by lowering intracellular NAD+ levels and decreasing NAD-dependent deacetylation performed by sirtuins (6). Thus, high levels of CD38 lead to decreased CD8 T-cell-mediated cytotoxicity and increased propensity to infections in patients with SLE (7). Moreover, CD38 reduces CD8+ T cell function by negatively affecting mitochondrial fitness (8). The relevance of these findings to lupus is that abnormal NAD-dependent deacetylation could be reverted pharmacologically or with anti-CD38 therapy (5, 9–11). Transcriptome analysis in a large number of SLE patients supported the prospect of CD38 inhibition for the treatment of SLE, corroborating the central role of plasma cells in SLE pathogenesis (12). In lupus models, this could also be approached by analyzing the functional effect of CD38 deficiency (13–16). Using the pristane lupus model, we have demonstrated the crucial role of CD38 in promoting aberrant inflammation and lupus-like autoimmunity via an apoptosis-driven mechanism, which requires TRPM2 expression (13). CD38 deficiency may improve lupus disease through an increase of IL-10-producing splenic regulatory B cells, which may cause a reduction of plasmacytoid dendritic cells and IFN-α production in the peritoneal cavity (14).
A chronic graft-versus-host reaction (cGVHD) induced in non-autoimmune C57BL/6 mice (B6) by the adoptive transfer of Ia-incompatible bm12 spleen cells results in a syndrome that closely resembles SLE in the spectrum of autoantibodies and immunopathology (17). In a previous paper we have shown that the absence of CD38 had a strong effect in the development of the bm12 cGVHD lupus model (18). Thus, there was a significant amelioration of the signs of the disease, including decreased expansion of T follicular helper (Tfh) cells, germinal center (GC) B cells, plasma cells, and Tbet+CD11chi B cells, while the expansion of regulatory T (Treg) cells and T follicular regulatory (Tfr) cells was normal, suggesting a defective response of Cd38-/- B cells to allogeneic help from CD38-suficient bm12 CD4+ T cells (18). Dysregulation of several cytokines and decreased protein abundance of STAT1 were also detected (18). Chronic autoimmune diseases such as SLE develop through positive feedback from inflammation. Among the cells involved in the inflammatory process, monocytes/macrophages could participate via a number of mechanisms. In this sense, CD38 expression in non-classical monocytes was recently linked to severe active SLE disease in a small group of patients (19). Moreover, it has been observed that lupus nephritis (LN) patients have an increased number of macrophages, whose CD38 expression is specifically activated and up-regulated, suggesting that CD38 might contribute to the regulation of LN development and progression by influencing immune responses (20). Therefore, it was of interest to analyze the transcriptomes of peritoneal exudate cells and spleen cells from cGVHD Cd38-/- mice vs WT mice to reveal the transcriptomic signatures and dysregulated pathways that are behind the distinct autoimmune response elicited in Cd38-/- mice vs WT mice (mild versus severe lupus disease). Transcriptomes of cGVHD affected mice along time were also compared with the transcriptomes of healthy controls to better understand the disease-state in a more dynamic approach, and to test whether in CD38-deficient mice there were signs of a faster resolution of the disease as suggested in our previous study. This approach has revealed a potential transcriptome signature in PECs that connects purinergic receptors with transcriptome signatures strongly associated with lupus such as the transcriptome signature of type I interferon-regulated genes, the cyclic GMP-AMP synthase-stimulator of interferon genes the cGAS-STING signaling pathway, and the NLRP3 inflammasome. This study also reveals a strong transcriptional reprogramming of metabolic pathways such as oxidative phosphorylation and thermogenesis in both PECs and spleen cells from cGVHD mice that may be related with the requirements for fast cell proliferation and cell differentiation in this lupus model.
C57BL/6J (B6) (RRID: IMSR_JAX:000664) WT female mice were from Charles River. B6(C)-H2-Ab1bm12/KhEgJ (bm12) (RRID: IMSR_JAX:001162) female mice were from the Jackson Laboratory. B6.129P2-Cd38tm1Lnd/J (Cd38−/−) (RRID: IMSR_JAX:003727) female mice were backcrossed for 12 generations to the C57BL/6 J (B6) background and were provided by Dr. Frances Lund (UAB, Birmingham, USA). Cd38−/− mice were bred and maintained under specific pathogen-free conditions at the IPBLN-CSIC Animal Facility in Granada, Spain. The experimental procedures in animals at IPBLN-CSIC, Spain were approved by the Institutional Animal Care and Use Committee. The procedures follow the ARRIVE guidelines (21), and in accordance with the U.K. Animals (Scientific Procedures, Act, 1986) and associated guidelines (EU Directive 2010/63/EU for animal experiments and RD53/2013); and further revisions (Commission Delegated Directive, EU 2024/1262), and with the National Institutes of Health guide for the care and use of Laboratory animals (NIH Publications No. 8023, revised 1978).
In this model donor CD4+ T cells react to host B cells triggering the polyclonal activation of autoreactive B cells, and eventually, lupus-like syndrome (22). The procedure was described previously (18). We adapted the bm12 transfer model, as originally described by Morris et al. (23), and modified by Klarquist and Jansen (24). Eight to eighteen weeks-old B6 WT or Cd38−/− female mice were injected i.p. with 70-100 × 106 isolated spleen cells from bm12 female mice as described (24). Both WT and Cd38-/- mice were adoptively transferred with bm12 CD38-sufficient spleen cells that contain an average of 20% of allo-reactive donor bm12 CD4+ T cells, which were fully functional (18, 24). Although experiments reported in the first description of the bm12 model found no significant difference in any disease parameter between male→male and female→female transfers (23), only female were used because SLE is a female dominant autoimmune disease (7, 25).
Spleen and PECs were harvested from mice after the sacrifice by inhalation of CO2, under sterile conditions, at 2 and 4 weeks post a chronic graft-versus-host reaction (cGVHD) induced in non-autoimmune C57BL6 (B6) female mice WT or Cd38-/-, by the adoptive transfer of Ia-incompatible bm12 spleen cells that results in a syndrome that closely resembles SLE in the spectrum of autoantibodies and immunopathology (17). PECs were obtained after i.p. injection of 5-6 ml of 1x Ca2+ and Mg2+ free PBS, pH 7.6, 0.5% BSA, 2 mM EDTA, 0.22 μm sterile filtered; followed by a gentle massage of the abdominal cavity. We collected peritoneal exudates (PE) containing PECs from the abdominal cavity by means of a small incision, with p1000-pipette sterile tips, into separate 15 ml sterile Falcon type tubes for each mouse. 15 ml-tubes were kept on ice, next they were spun down at 360 x g, 4˚C for 5 min, to isolate PECs in the cellular pellet. The spleens were obtained and SPC prepared as described (24). Cellular pellets containing either SPC or PECs were treated (1:2, v:v) with Ammonium Chloride Solution (STEMCELL Technologies, Ammonium Chloride 07850_07800), 5 min on ice; followed by 8.5 ml of DMEM complete medium, containing 5% heat inactivate Fetal Bovine Serum (FBS), pen: strep, 100 units/ml/10 microg/ml; 10 mM Hepes, 1X L glutamax, 2mM EDTA and 0.22 μm sterile filtered. SPC were spun down at 400 x g, 4˚C for 5 min, and PECs were spun down at 360 x g, 4˚C for 5 min. The supernatants were aspirated and a fresh DMEM complete medium was added to resuspend the cellular pellets. The experiments were repeated minimum three times. Three to 5 mice WT or Cd38-/- were included accordingly in each experiment. Isolated SPC and PECs were count and viability was analyzed on a hemocytometer with 1:1 Trypan blue solution (Sigma-Aldrich Cat# T8154). Spleen cells and PECs were washed thoroughly three times with cold 1x Ca2+ and Mg2+ free PBS, pH 7.6, 2 mM EDTA (filter sterilized in 0.22 mm filter); by centrifugation as indicated above (26).
Single cell suspensions of WT and Cd38-/- PECs were stained with the indicated anti-mouse antibodies (Supplementary Table S1) separated in different panels after blocking nonspecific binding with anti-mouse CD16/32 (BD Biosciences Cat# 553142, RRID: AB_394657), 1:200 dilution for 30-60 min, on ice, in staining media (1x PBS, w/o calcium or magnesium, 0.5% BSA, 2 mM EDTA, sterilized by means of 0.22 μm filter). Panel #2 (CD45R/B220-PE; CD11b-APC; CD4-BV480, and CD5-PerCP) was used to identify B1 cells, B2 cells, CD4+ T cells and macrophages. Panel #4 (F4/80-APC; CD11b-FITC, Ly6C-PE, and Ly6G-PerCP-Cy5.5) was used to identify large and small macrophages, Ly6Chi monocytes and neutrophils. Each analyzed PEC sample corresponds to an individual mouse, either WT or Cd38-/-, from the corresponding experiment. Flow cytometry analyses at IPBLN-CSIC were performed as previously described (13). Ten thousand to 200.000 events per sample were acquired either in a FACSCalibur flow cytometer (BD Biosciences, RRID: SCR_000401), FACSaria III, or FACS Symphony (BD Biosciences) and analyzed with FlowJo software v10.10.0 (BD Biosciences) (FlowJo, RRID: SCR_008520). In each experiment, single cell suspensions of bm12 spleen cells were stained with panel #1 (TCR-β-FITC; CD4-PerCP-Cy5.5; CXCR5-biotin; Streptavidin-PE, and PD1-APC) to evaluate the numbers of allo-reactive donor bm12 CD4+ T cells that were adoptively to transferred to WT and Cd38-/- mice respectively, as previously described (18). Statistical analyses were performed using the GraphPad Prism 9 and 10.1.1 software (GraphPad Prism, https://www.graphpad.com/), using statistical tests as indicated in the text. Statistical significance was visualized as follows: ns = not significant (P > 0.05), * = P < 0.05, ** = P < 0.01, *** = P < 0.001, **** = P < 0.0001. All experiments have been done using three or more mice and representative images have been chosen for the figures.
RNA purification, library preparation and Illumina sequencing were carried out at the IPBLN Genomics Facility (CSIC, Granada, Spain). 5-10 x106 washed and pelleted PECs and SPC, respectively, were lysed with RLT buffer (Qiagen, Cat number7926, Hilden, Germany) containing 1% beta-mercaptoethanol and following manufacturer guidelines. Cell lysates were immediately frozen in dry ice and kept at -80°C. Automated total RNA extraction was performed using RNeasy® kit reagents and QIAcube® robot (Qiagen). The RNA quality was evaluated by Bioanalyzer RNA 6000 Nano chip electrophoresis (Agilent Technologies) for a total of 62 RNA samples. Based on RNA quality and yield, 35 RNA samples were chosen, with RIN values of 10.51+/- 1.66 (mean +/- sem). Selected samples (Supplementary Table S2) included three biological replicates for every condition except for PECs from WT mice 4 weeks after the adoptive transfer of bm12 lymphocytes with two biological replicates. Each analyzed SPC sample corresponded to an individual mouse spleen, while each PEC sample was a pool of 2 or 3 mice from the corresponding experiment. RNA-seq libraries were prepared using Illumina mRNA stranded ligation kit (Illumina®) from 200 ng of input total RNA. Quality and size distribution of PCR-enriched libraries were validated through Bioanalyzer High Sensitivity DNA assay and concentration was measured on the Qubit® fluorometer (Thermo). Final libraries were pooled in an equimolecular manner and then diluted and denatured as recommended by Illumina NextSeq® 500 library preparation guide. The 72x2 nt paired-end sequencing was conducted on a NextSeq 500® system with a final total output of 196 Gb and a quality score (Q30) of 91%.
The miARma-Seq pipeline, as detailed by Andres-Leon et al. (27, 28), was employed for the analysis of transcriptomic samples. This comprehensive workflow encompasses all stages from raw data processing to the calculation of differentially expressed genes (DEGs). Initially, the quality of raw data was assessed using FastQC software (29) to evaluate read quality. Following sample filtering, an average guanine-cytosine content of 51% and an average of 17M reads per sample were obtained, with no observed adapter accumulation or poor quality reads (q<30). Subsequently, Seqtk software (30) was utilized to standardize the number of reads per sample.
In the subsequent stage, miARma-Seq employed STAR (31) to align all sequences, resulting in 90.45% of properly aligned reads. For this purpose, the Mus musculus Gencode version M28 genome-build: mmGRCm28.p6 was utilized. Following alignment, featureCounts software (32) as utilized to map sequence reads to genes using reference gene annotation obtained from Gencode, based on the same assembly and genome build.
Differential expression analysis was conducted using the edgeR package (33). Genes that showed no expression (0 aligned reads across all samples) were removed, and the remaining genes were normalized using the trimmed mean of M-values (TMM) method (34). Additionally, reads per kilobase per million mapped reads (RPKM), counts per million (CPM), and log2-counts per million (log-CPM) were calculated for each gene in every sample (33). To assess the replicability of the samples, Principal Component Analysis (PCA) and Hierarchical Clustering of normalized samples were employed to provide a comprehensive overview of the similarity among RNA-sequencing samples (35, 36) (See Supplementary Figure S1). Differential expression analysis was performed between genes with a False Discovery Rate (FDR) value <0.05 were identified as DEGs. Additionally, the log2-fold change (log2FC) was utilized to assess the significance and magnitude of gene expression alterations between the two sample types. Several R packages are used to visualize our data effectively. Specifically, we used ‘ggplot2’ to create a Volcano plot in addition to the pheatmap and heatmaply packages taking advantage of their capabilities to generate heat maps with clustering settings. Data presented in the study are available at the Sequence Read Archive (SRA), BioProject PRJNA1118233.
Gene ontology (GO) enrichment analyses were evaluated for biological process ontology terms, molecular functions, and cellular components using the R clusterprofiler package (37). To identify the most relevant GO terms, the “Revigo” tool was used, using the R package rrvigo (38), which simplifies the visualization of functional enrichment results. For pathways analyses, Kyoto Encyclopedia of Genes and Genomes (KEGG; https://www.kegg.jp) canonical pathway database was used (39). To visualize shared and unique KEGG pathways for the different comparatives, Venn diagrams were generated using the online application Venny 2.1 (40). The heat-map displays the mean log2FC (logarithmic fold change) values calculated using edgeR, based on RNA-seq analysis of differential expression between experimental conditions log2FC values calculated using edgeR. The log2FC values were computed as the log2 ratio of normalized counts between the compared conditions. Each row represents a differentially expressed gene, while each column corresponds to one of the indicated pairwise comparisons performed. The values shown are the averages for each experimental condition (n is the number of biological replicates per condition, see Supplementary Table S2). Otherwise indicated, only genes with a log2FC greater than 2 or less than -2, in at least one comparison were represented in the heat-maps. The color scale reflects the magnitude and direction of gene expression changes: Red: Significant upregulation (positive log2FC values), Blue: Significant downregulation (negative log2FC values). Rows (genes) and columns (comparisons) are hierarchically clustered using Euclidean distance and the complete linkage method, grouping genes and conditions with similar expression patterns. This visualization highlights biologically meaningful changes associated with the specific GO or KEGG functional term under investigation.
We found Cd38 gene expression values in the count array of the Cd38-deficient samples, therefore, we decided to represent the alignment of the Cd38 gene to check the coverage of these samples for this gene. We confirmed for CD38-deficient samples that no coverage was detected for exons 2 and 3 of the gene (Supplementary Figure S2), in comparison with the coverage of WT samples (Supplementary Figure S2, last track). As previously reported by other authors, these were the 2 exons deleted in the Cd38-/- mouse strain (41). Therefore, the expression of the Cd38 gene in the CD38-deficient samples may come from the residual expression of the non-deleted exons of Cd38 and, consequently, it does not lead to the functional production of the gene.
In a previous paper we have shown that in the absence of CD38 there was a significant amelioration of the signs of the disease in the cGVHD-lupus model, including decreased expansion of Tfh cells, GC B cells, plasma cells, and Tbet+CD11chi B cells, while the expansion of Treg cells and Tfr cells was normal, suggesting a defective response of Cd38-/- B cells to allogeneic help from bm12 CD4+ T cells (18). Therefore, it was of interest to test whether these features had a distinct gene expression profile. RNA sequencing was used to analyze the transcriptome of PECs and SPC from Cd38-/- mice and WT mice 2, and 4 weeks after the induction of the disease (see workflow in Figure 1A).
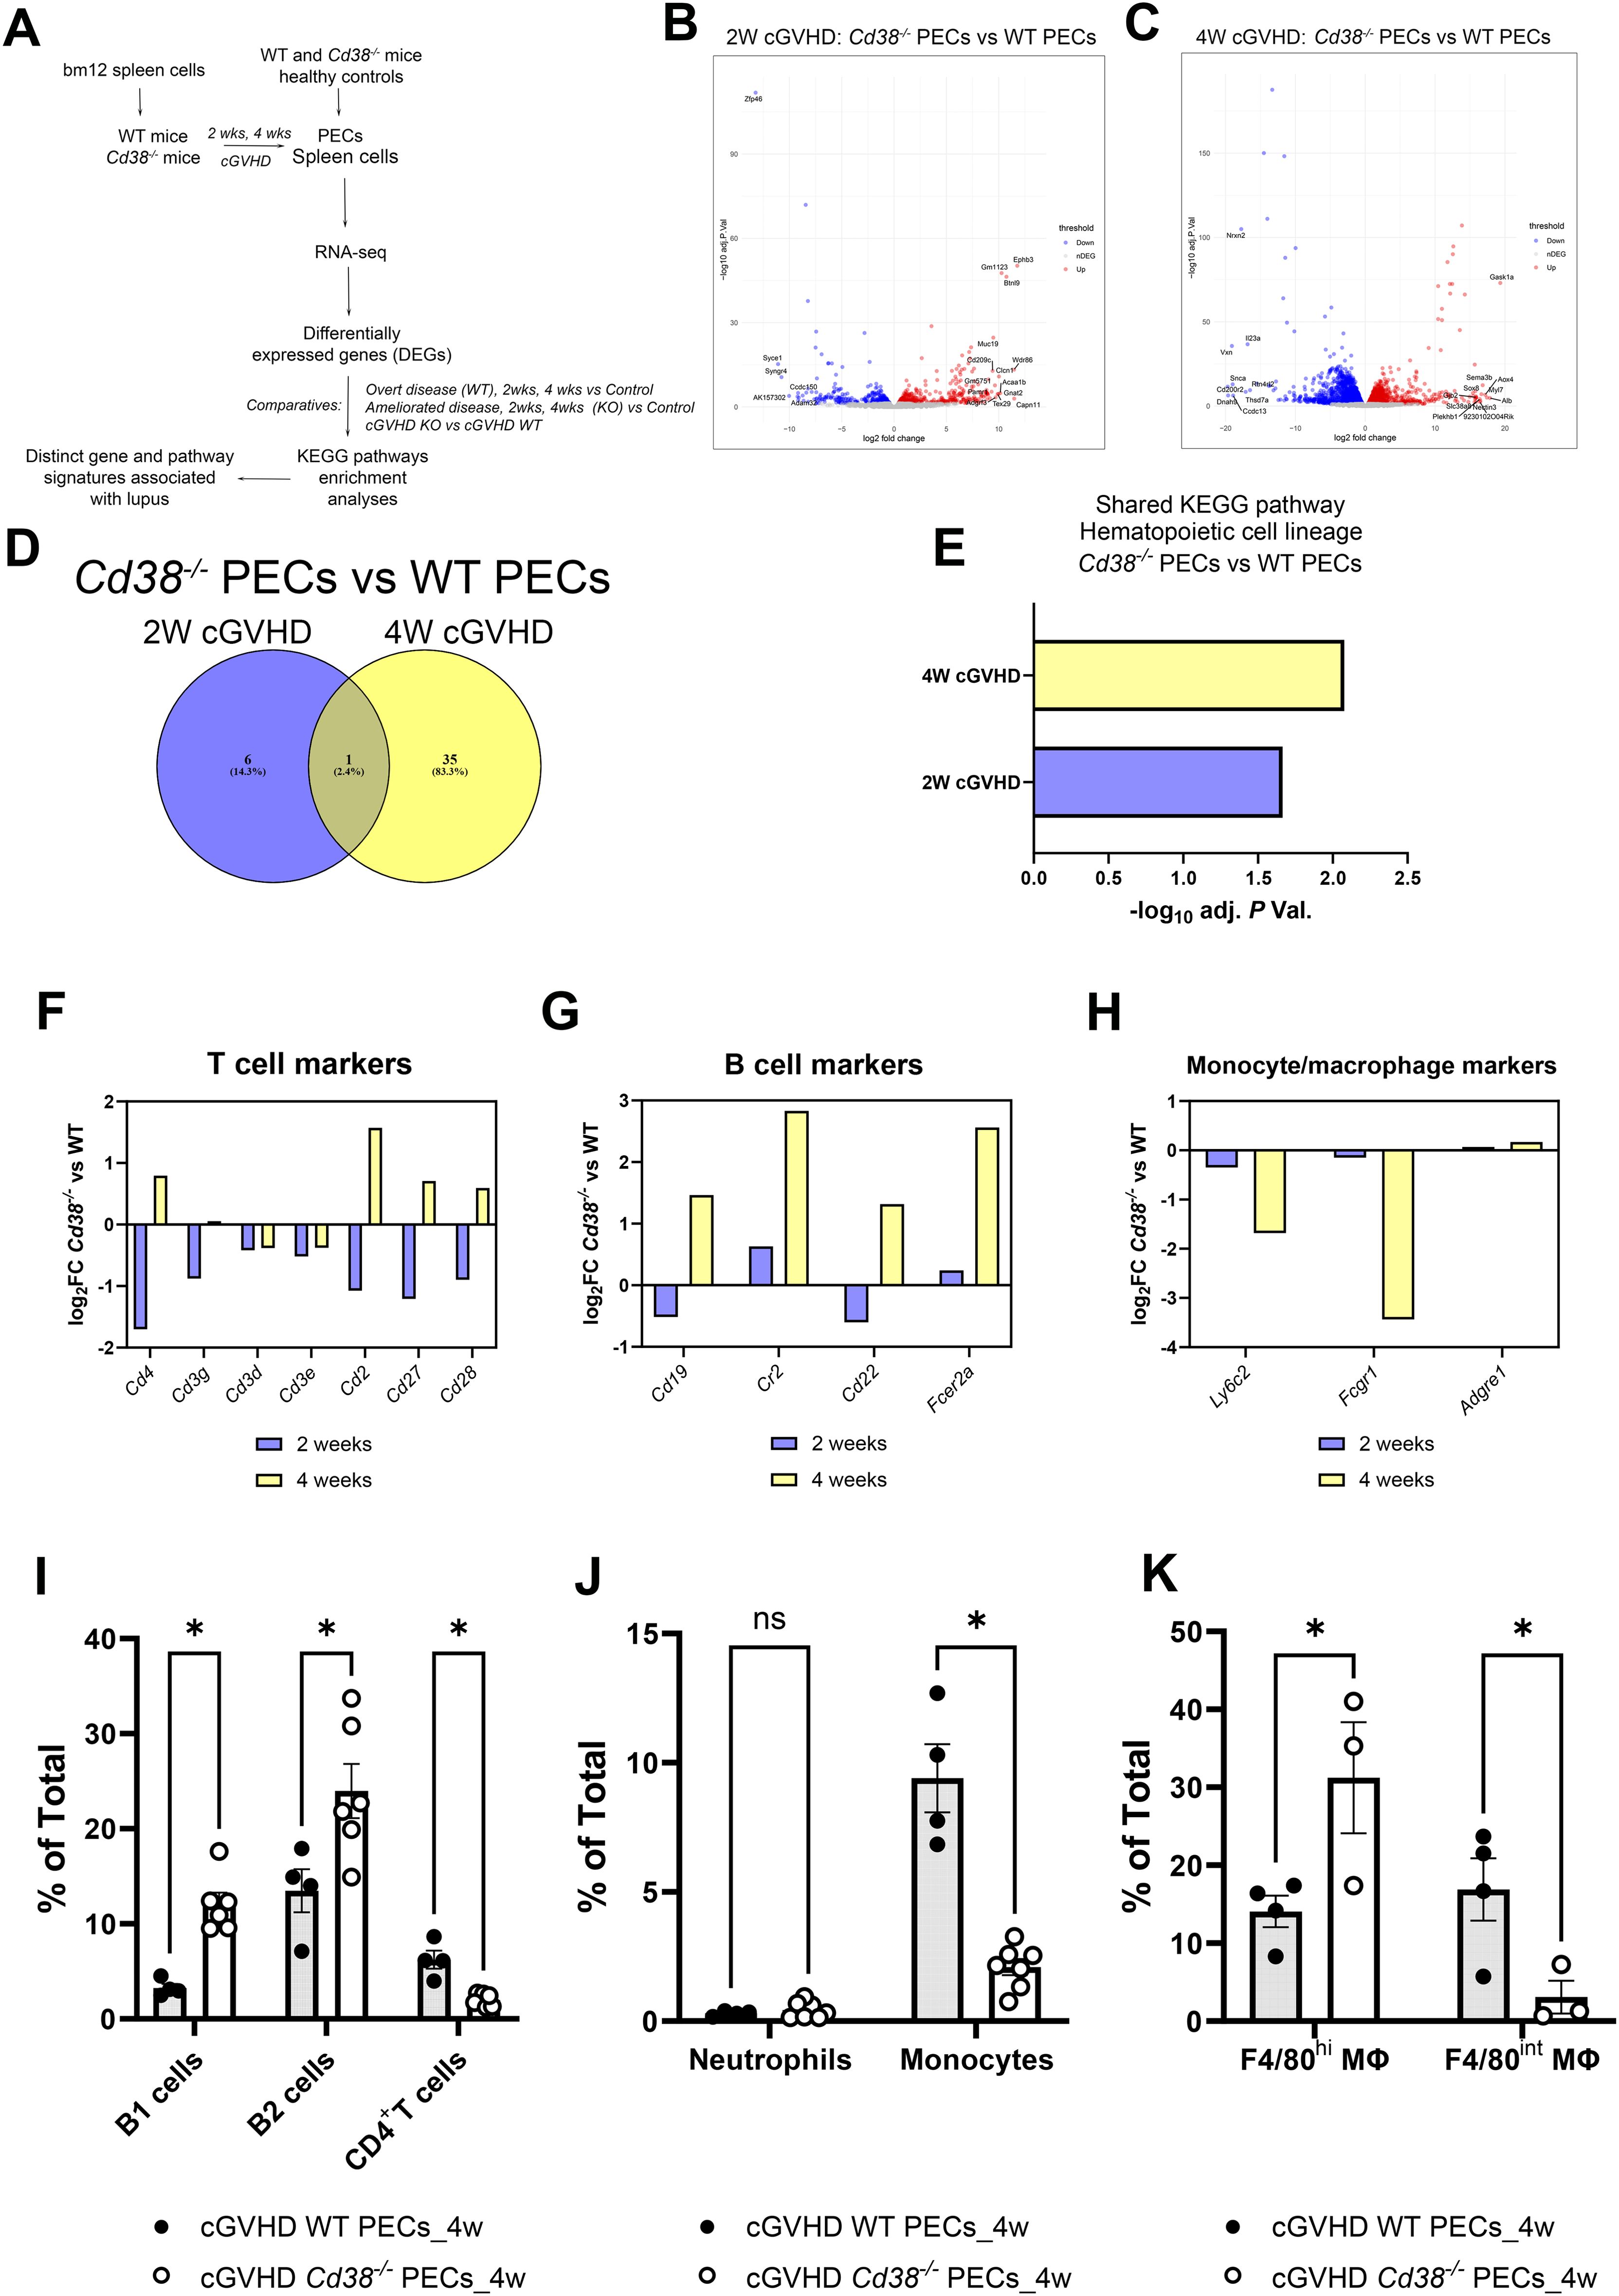
Figure 1. (A) Workflow of the experiments and analyses performed in this study. (B) Volcano plots showing upregulated DEGs (red dots) and downregulated DEGs (blue dots) of the 2-week comparative in PECs from cGVHD Cd38-/- vs cGVHD WT mice. (C) Volcano plot showing upregulated DEGs (red dots) and downregulated DEGs (blue dots) of the 4-week comparative in PECs from cGVHD Cd38-/- vs cGVHD WT mice. In both panels gene names are displayed for top DEGs. (D) Venn diagram showing the number of enriched KEGG pathways shared by the 2 comparatives, and those that were exclusively enriched at 2 weeks, or at 4 weeks of the allogeneic challenge. (E) Histograms represent the statistical significance of the hematopoietic cell lineage KEGG pathway shared by the 2 comparatives. (F) Log2 fold-changes in the expression of T cell markers genes in PECs at 2 weeks (violet bars) and 4 weeks (yellow bars) of the allogeneic challenge. (G) The same as in the (F) for B cell markers. (H) The same as in (F, G) for monocyte/macrophages markers. (I) Frequencies of B1 cells, B2 cells and CD4+ T cells in PECs from cGVHD WT mice and cGVHD Cd38-/- mice, 4 weeks after the allogeneic challenge. (J) Frequencies of neutrophils and pro-inflammatory Ly6Chi monocytes in PECs of the same comparative as in (I). (K) Frequencies of F4/80high and F4/80int macrophages in PECs of the same comparative as in (I). Samples in (I–K) were analyzed by flow cytometry with specific markers as described in materials and methods. In (I–K): ns, not significant (P > 0.05), * = P < from 0.01 to 0.05.
Two weeks after the adoptive transfer of bm12 into mice, 1727 DEGs were identified between Cd38-/- PECs and WT PECs (Figure 1B, Supplementary Table S3). Four weeks after the adoptive transfer, the number of DEGs increased up to 7301 (Figure 1C, Supplementary Table S4), indicating increased divergence in their transcription profile between Cd38-/- PECs and WT PECs. This increased divergence was even more evident when these DEGs were subjected to various enrichment analyses. Thus, there were 7 enriched KEGG pathways at 2 weeks, which increased up to 36 KEGG pathways at 4 weeks (Supplementary Tables S5, S6). Venn diagrams showed that only one pathway was shared between the 2 comparatives (Figure 1D). This was hematopoietic cell lineage (Figure 1E), which at 2 weeks showed decreased expression of genes such as Cd4, Cd7, Cd5, Il5, Cd3g, Cd2, Cd36, and Cd44 in Cd38-/- vs WT PECs (Supplementary Table S5), many of them are T cells markers (Figure 1F). In this sense, decreased frequencies and numbers of CD11b-B220-CD4+ cells were observed by flow cytometry analysis (data not shown). To note is that, although not included in this KEGG pathway, we also observed significant decreased expression of Cd28, and Cd27 genes in the 2-week comparative (Figure 1F). CD27 is expressed on both naïve and activated effector T cells, as well as on NK cells or activated B cells and plasma cells, and its expression is altered in SLE patients in various cell subsets (42–46). CD28 is one of the proteins expressed on T cells that provide co-stimulatory signals required for T cell activation and survival. In SLE patients lack of CD28 expression in specific T cell subsets may define their functional capabilities (47–50). Overall, these data may be indicative of decreased numbers of activated CD4+ T cells, and another unidentified CD4+ T cell subsets in the 2-week comparative.
In the 4-week comparative the hematopoietic cell lineage pathway showed 21 upregulated genes in Cd38-/- vs 17 in WT PECs, which made uncertain to predict any preponderance (Supplementary Table S6). A closer examination of the pathway indicated that gene markers of the T cell lineage, such as Cd4, Cd2, Cd27, Cd28 (Figure 1F), and of the B cell lineage, such as Cd19, Cr2, Cd22, and Fcer2 (Figure 1G) were upregulated in Cd38-/- PECs.
To better identify the major immune cell subsets from the lymphoid and myeloid lineages present in the peritoneal cavity after the allogeneic challenge, we used different multicolor flow cytometry antibody panels. We were able to identify the following subsets: B1 cells, B2 cells, macrophages (large and small), neutrophils, Ly6Chi monocytes, Ly6Clo monocytes, and CD4+ T cells (Supplementary Figures S3, S4).
In this sense, we observed by flow cytometry analysis increased proportions of B1 and B2 cells in Cd38-/- PECs vs WT PECs (Figure 1I, Supplementary Figure S3). In contrast, the proportion and numbers of CD4+ T cells were significantly lower in Cd38-/- PECs vs WT PECs (Figure 1I, Supplementary Figure S3, and data not shown), in apparent contradiction with the upregulated Cd4 gene expression (Figure 1F). Therefore, Cd4 gene expression in Cd38-/- PECs relative to WT PECs did not reflect its protein abundance or distribution within the CD4+ T cells detected by flow cytometry. We speculated that other cell subsets, such as a CD4+DEC-205loCD11bhi splenic DC subpopulation, which express high levels of CD4 RNA transcripts, and protein on its surface (51) might be present in PECs, although this required further investigation.
To note is that the proportion and numbers of pro-inflammatory Ly6Chi monocytes were significantly lower in Cd38-/- PECs than in WT PECs 4 weeks after cGVHD induction (Figure 1J, Supplementary Figure S4, and data not shown), which was in agreement with the decreased expression of Ly6c2, the gene that encodes the Ly6C protein (Figure 1H). Other gene markers, which are predominant in monocytes/macrophages, and neutrophils, were downregulated (Fcgr1, Tnf, Anpep, Il3ra, Il1r1, Il6ra), or not differentially expressed (Adgre1) (Figure 1H, Supplementary Table S6). Although the proportion of macrophages in Cd38-/- PECs was not significantly different to that in WT PECs, we asked whether there were significant differences in the proportion of large peritoneal macrophages (LPMs), and small peritoneal macrophages (SPMs) (52). The LPM subset expresses high levels of the canonical macrophage surface markers, F4/80 and CD11b, while the SPM subset expresses substantially lower levels of CD11b and F4/80 (52). In our study, the proportion of F4/80hi LPMs was significantly higher in Cd38-/- PECs than in WT PECs, while the proportion of F4/80int SPMs was significantly lower (Figure 1K, Supplementary Figure S4). Since SPMs are originated from recruited pro-inflammatory Ly6Chi monocytes to the peritoneal cavity during inflammatory conditions (52, 53), and both Ly6Chi monocytes and SPMs are significantly augmented in the peritoneal cavity of WT mice relative to Cd38-/- mice 4 weeks after the cGVHD induction, our data are compatible with the induction of a stronger inflammatory response in the peritoneal cavity of WT mice than in Cd38-/- mice.
One of the KEGG pathways that was enriched in the 2-week comparative was the oxytocin signaling pathway (Figure 2A, Supplementary Table S5), where key elements were downregulated in Cd38-/- vs WT, including ryanodine receptors 2 and 3 (Ryr2 and Ryr3), that together with decreased expression of Cacna2d2, Plcb1 and Itpr1, are molecules involved in Ca2+ homeostasis and Ca2+-dependent signaling pathways (54–59). Some of the other enriched pathways such as salivary secretion, vascular smooth muscle contraction, and adrenergic signaling in cardiomyocytes shared many of these genes related with Ca2+-mediated signaling, either RyR-mediated or IP3-dependent mechanisms, or both (Figure 2A). In this sense, 4 out of the 8 GO BP enriched terms were related with calcium ion homeostasis and calcium-mediated signaling (data not shown). CD38 has been identified as an essential component for the rise in intracellular Ca2+ and oxytocin secretion (60, 61).
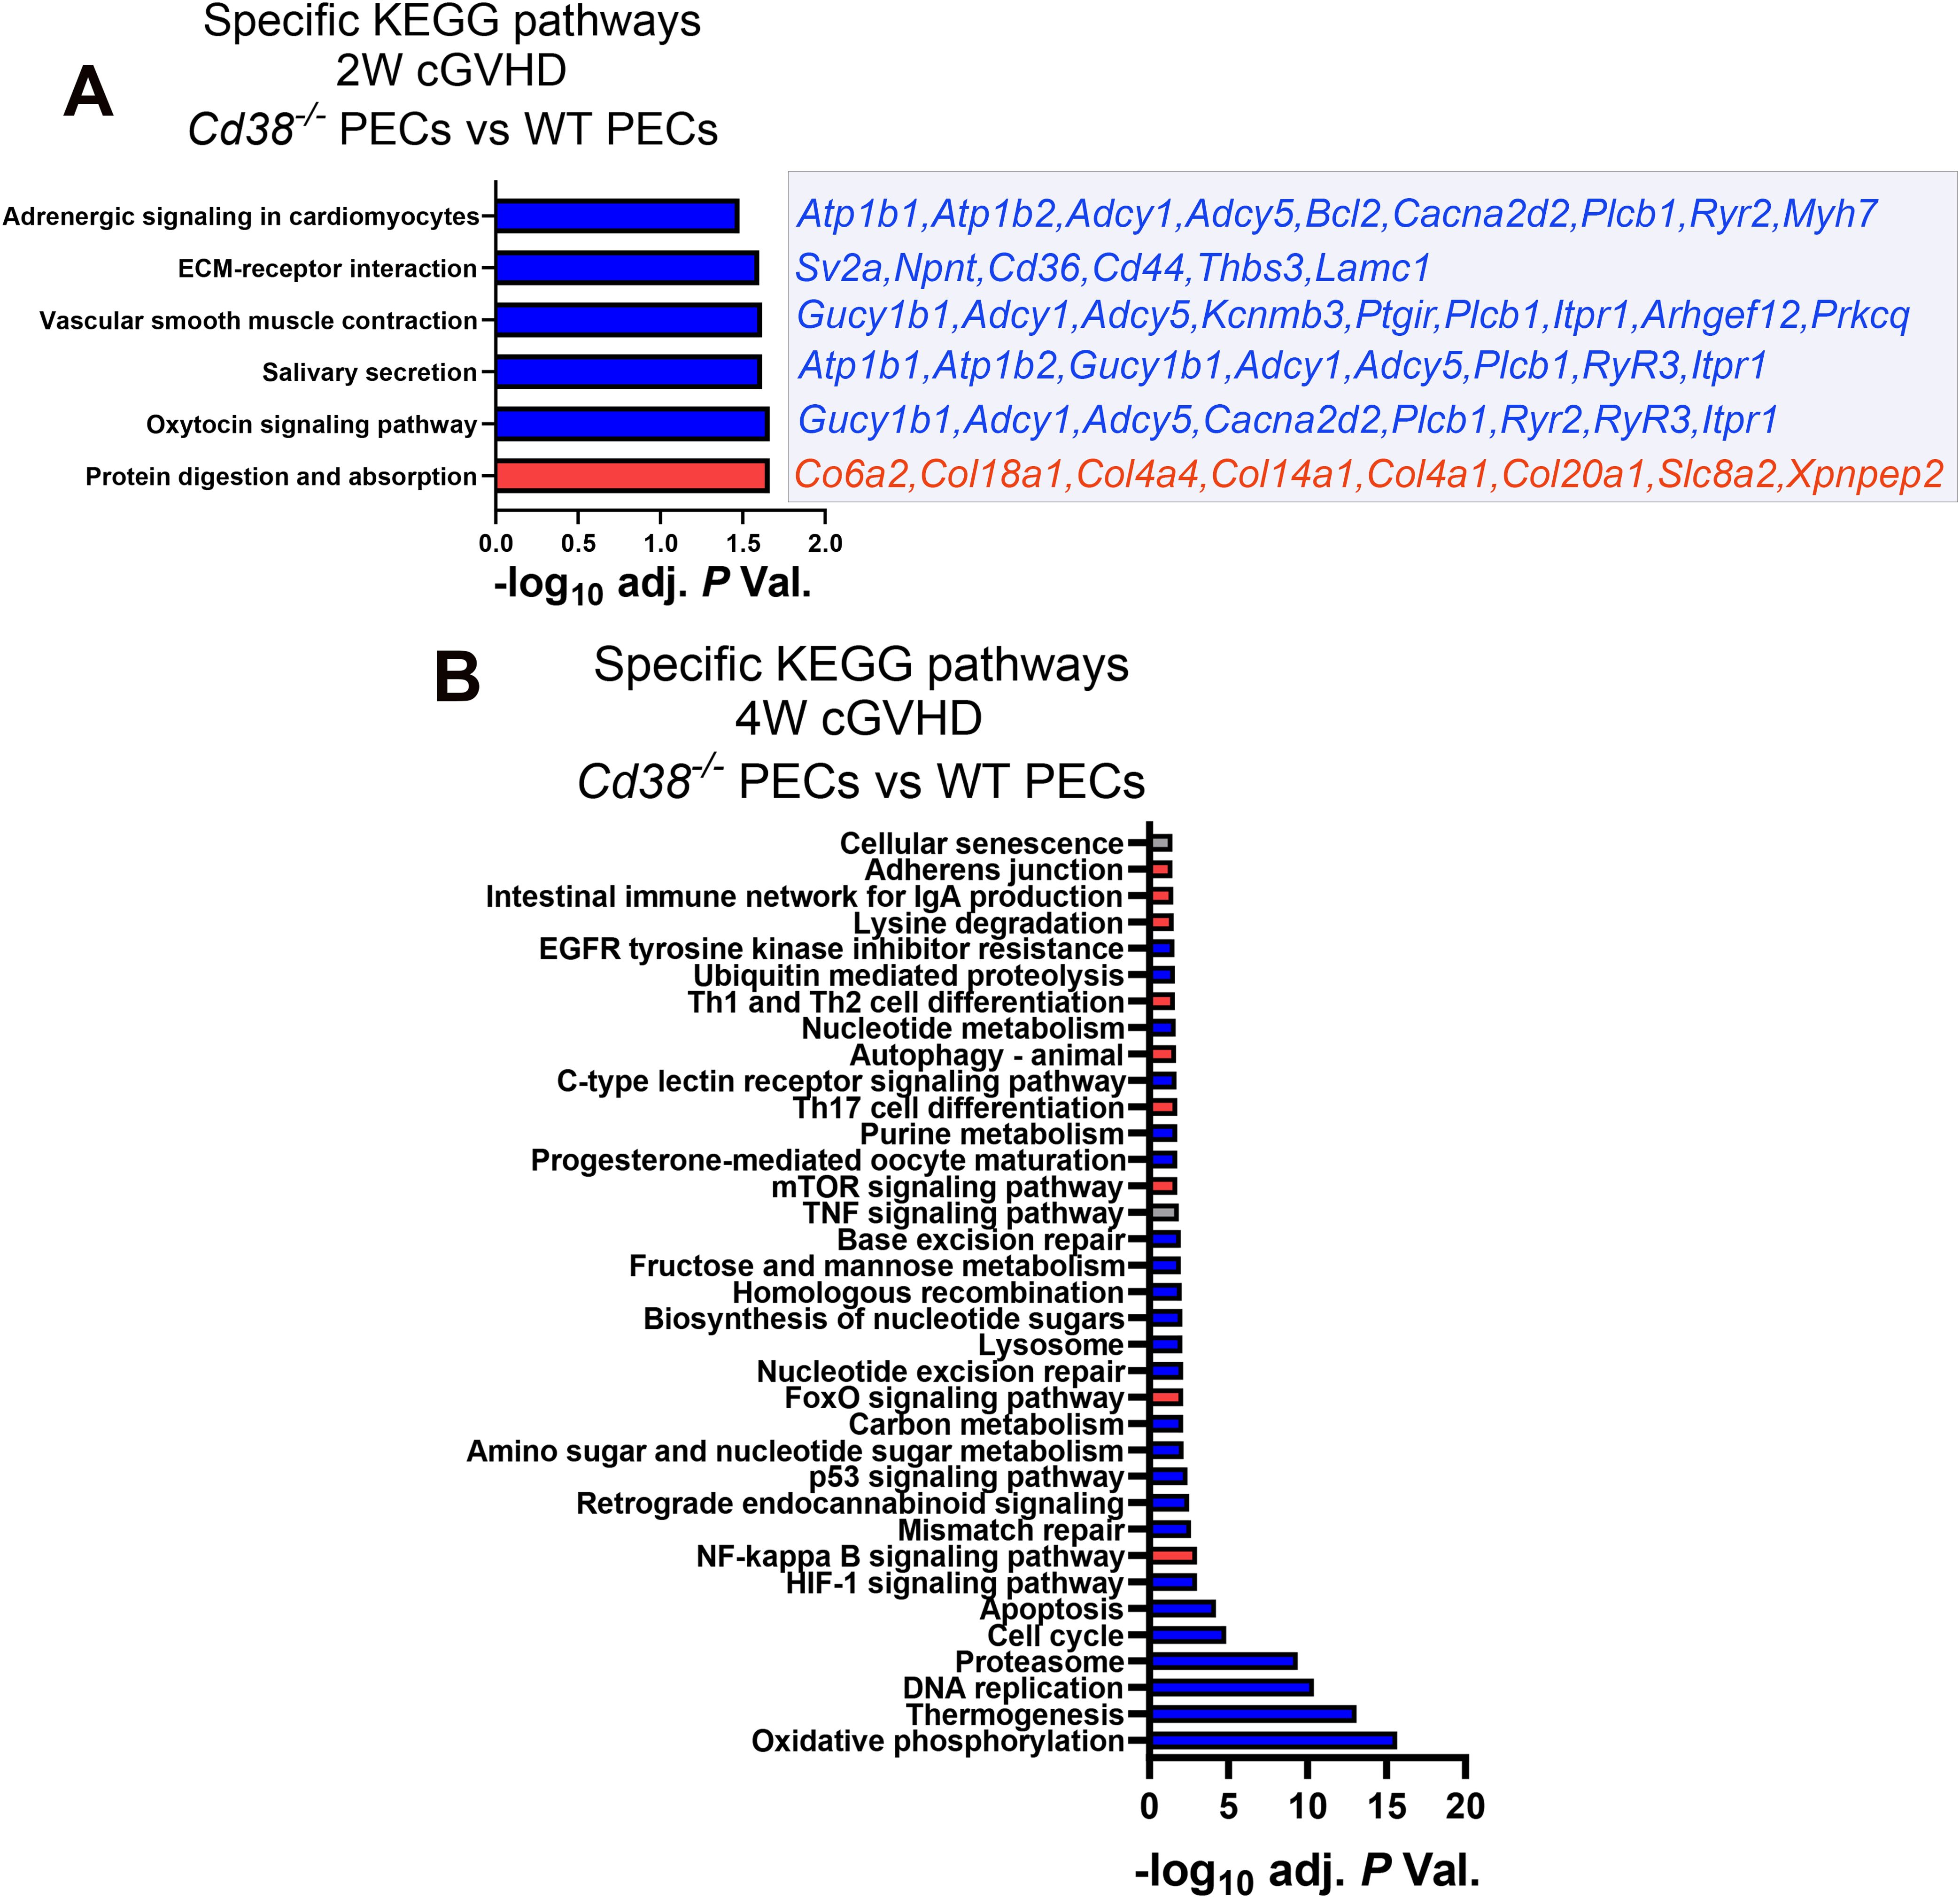
Figure 2. (A) Specific KEGG pathways of the 2-week comparative in PECs from cGVHD Cd38-/- vs cGVHD WT mice. Blue bars indicate pathways with ≥ 55% of downregulated genes. Red bars indicate pathways with ≥ 55% upregulated genes. Downregulated (blue) or upregulated (red) DEGs contributing to each pathway are listed on the right side of each bar. (B) Specific pathways of the 4-week comparative in PECs from cGVHD Cd38-/- vs cGVHD WT mice. In both panels blue bars indicate pathways with ≥ 55% of downregulated genes, and red bars indicate pathways with ≥ 55% upregulated genes. Grey bars in (B) indicate pathways with both upregulated and downregulated genes ≤ 54%, X axis represent the level of statistical significance (-log10 adjusted P value).
At 4 weeks, a larger number of genes related with oxidative phosphorylation, thermogenesis, DNA replication, proteasome, cell cycle, apoptosis, HIF-1, and p53 signaling pathways were downregulated in Cd38-/- relative to WT PECs, whereas a larger number of genes related with NF-κB, FOXO and mTOR signaling pathways were upregulated in Cd38-/- compared with WT PECs, together with genes involved in Th17 cell differentiation, autophagy, and Th1/Th2 cell differentiation (Figure 2B, Supplementary Table S6). Within the Th1/Th2 cell differentiation pathway, genes related with Th2 cell differentiation were upregulated in Cd38-/- PECs (Jak1, Stat6, Gata3), while Th1-related genes were downregulated (Ifng, Ifngr2, Jak1/2, Stat1), suggesting differential transcriptional regulation of these T cell subsets in Cd38-/- PECs vs WT PECs. Regarding Th17 cell differentiation, upregulated expression of Rora and Rorc genes was observed in Cd38-/- PECs relative to WT PECs. The proteins encoded by these genes, RORα and RORγt are essential for Th17 cell differentiation (62, 63). In contrast, Il12rb1, Il23a, Foxp3, Stat1, Il27, Ifngr2, Ifng, Rxrg, Il21r, and Fos genes, which are important for long-term Th17 cell survival and expansion (64–68), were downregulated in Cd38-/- PECs relative to WT PECs, which may be indicative of diminished survival capacity of Cd38-/- Th17-derived cells upon cGVHD induction.
Another interesting enriched KEGG pathway in the 4-week comparative was cellular senescence (Figure 2B). In Cd38-/- PECs, 30 out of 62 genes were upregulated and 32 genes were downregulated, which made difficult to assign this process to Cd38-/- or to WT (Supplementary Table S6). According with KEGG pathway database (https://www.kegg.jp/entry/mmu04218), in this pathway converged several signaling pathways. Therefore, it was of interest to search for differences in gene expression within each of these more specific pathways (Supplementary Table S6). Thus, genes associated to FOXO and mTOR signaling pathways were significantly upregulated in Cd38-/- PECs relative to WT PECs, while genes associated to calcium and p53 signaling pathways, cell cycle arrest, senescence-associated heterochromatin foci (SAHFs), and to senescence-associated secretory phenotype (SASP) were downregulated. The p53 signaling pathway elicits cell cycle arrest, and transcriptional activation of SAHF and SASP are key factors in senescence-associated inflammation (69, 70). Thus, significant decreased expression of Il1a, Ccl2, Tnf, and Serpine1 genes, which are representative members of SASP components, was observed in Cd38-/- PECs relative to WT PECs (Supplementary Tables S4, S6). In contrast, Tgfb2, Tgfbr2, and Cdkn2b genes were upregulated. Tgfb2 encodes TGF-β, and Tgfbr2 encodes its receptor. TGF-β potently inhibits cell cycle progression at the G1 phase. Cdkn2b expression is induced by TGF-β, and encodes the cyclin-dependent kinase 4 inhibitor (p15) that is a potent inhibitor of cell cycle (71). In contrast, another inhibitor of cell cycle, Cdkn1a, which encodes p21, was downregulated. p21 is capable of inactivating all cyclin-dependent kinases (CDKs), thereby inhibiting cell cycle progression (72). To note is the downregulation of several cyclins, and CDKs, as well as the growth arrest and DNA damage inducible alpha (Gadd45a) and gamma Gadd45g), which are key elements in the control of cell cycle arrest via the p53-p21 pathway. Gene expression of other members of the p53-p21 pathway, such as E2f, Mybl2, Foxm1, and Ln9 was downregulated, while Rbl2, which a potent inhibitor of E2F-trans-activation was upregulated (73). Likewise, increased Sirt1 gene expression was detected in this 4-week comparative in Cd38-/- PECs, which is associated with protection from senescence via deactivation of p53 signaling (74). Therefore, the transcriptional data were compatible with an expected decreasing occurrence of cellular senescence in Cd38-/- PECs relative to WT PECs in cGVHD mice.
At 4 weeks of the cGVHD induction several metabolic pathways, including purine metabolism, and nucleotide metabolism appeared downregulated in Cd38-/- PECs relative to WT PECs (Figure 2B). Regarding the purine metabolism pathway, several genes encoding nucleotide-metabolizing ectoenzymes, which are involved in the extracellular metabolism of purines, were differentially expressed, including the ectonucleotide triphosphate diphosphohydrolase 5, Entpd5, which showed increased expression in this comparative, the ectonucleotide pyrophosphatase/phosphodiesterase family member 4, Enpp4, and adenosine deaminase, Ada, which both showed decreased expression (Supplementary Table S6). Since signaling through purinergic receptors is controlled by nucleotide-metabolizing ecto-enzymes, which regulate the availability of extracellular nucleotides, these findings prompted us to assess the differential expression of other genes related with purine metabolism, which are not included in the KEGG pathway, but are important key-players in inflammatory/anti-inflammatory processes (75). We focused our interest in the gene expression of P2X and P2Y purinergic receptors (P2rx and P2ry), adenosine receptors (Adora), ectoenzymes, including ecto-nucleoside triphosphate diphosphohydrolases (Entpd, CD39 family), 5’ ectonucleotidases (Nt5, CD73 family), ecto-nucleotide pyrophosphatase/phosphodiesterases (Enpp, CD203a family), ADP-ribosyltransferases (Art2a and Art2b), Cd38, and Ada. Last, we included in this search a number of genes encoding down-stream molecules which may be involved in purinergic receptor signaling. As shown in Figure 3A, unsupervised hierarchical heat-map representation of the log2FC of the selected genes in 12 comparatives showed a major cluster of 27 genes, which included 9 purinergic receptor genes such as P2ry14, P2rx1, P2ry1, P2ry2, P2rx7, P2rx4, P2ry12, P2ry6, and P2ry13; the ectonucleotidases Entpd1, Entpd3, Enpp2, Enpp4, Enpp5, Entpd7, Enpp6, and Nt5e; and other 5’-nucleotidases located in the cytosol or mitochondria such as Nt5dc2, Nt5c3a, and Nt5m; the adenosine receptors Adora2b and Adora3; the Adenosine deaminase, Ada; the T-cell ecto-ADP-ribosyltransferases Art2a and Art2b, and the signaling molecules, Cgas, Sting1, Isg15 and Irf7, suggesting a similar pattern of expression. Moreover, this cluster showed upregulated expression in cGVHD PECs samples relative to Controls, in particular in WT PECs. In contrast, in SPC, this cluster of genes showed a more heterogeneous response, with less numbers of upregulated purinergic receptors, ectonucleotidases, and signaling molecules, but with increased expression of specific genes with clearly different kinetics than in PECs, which suggested a distinct pattern of expression.
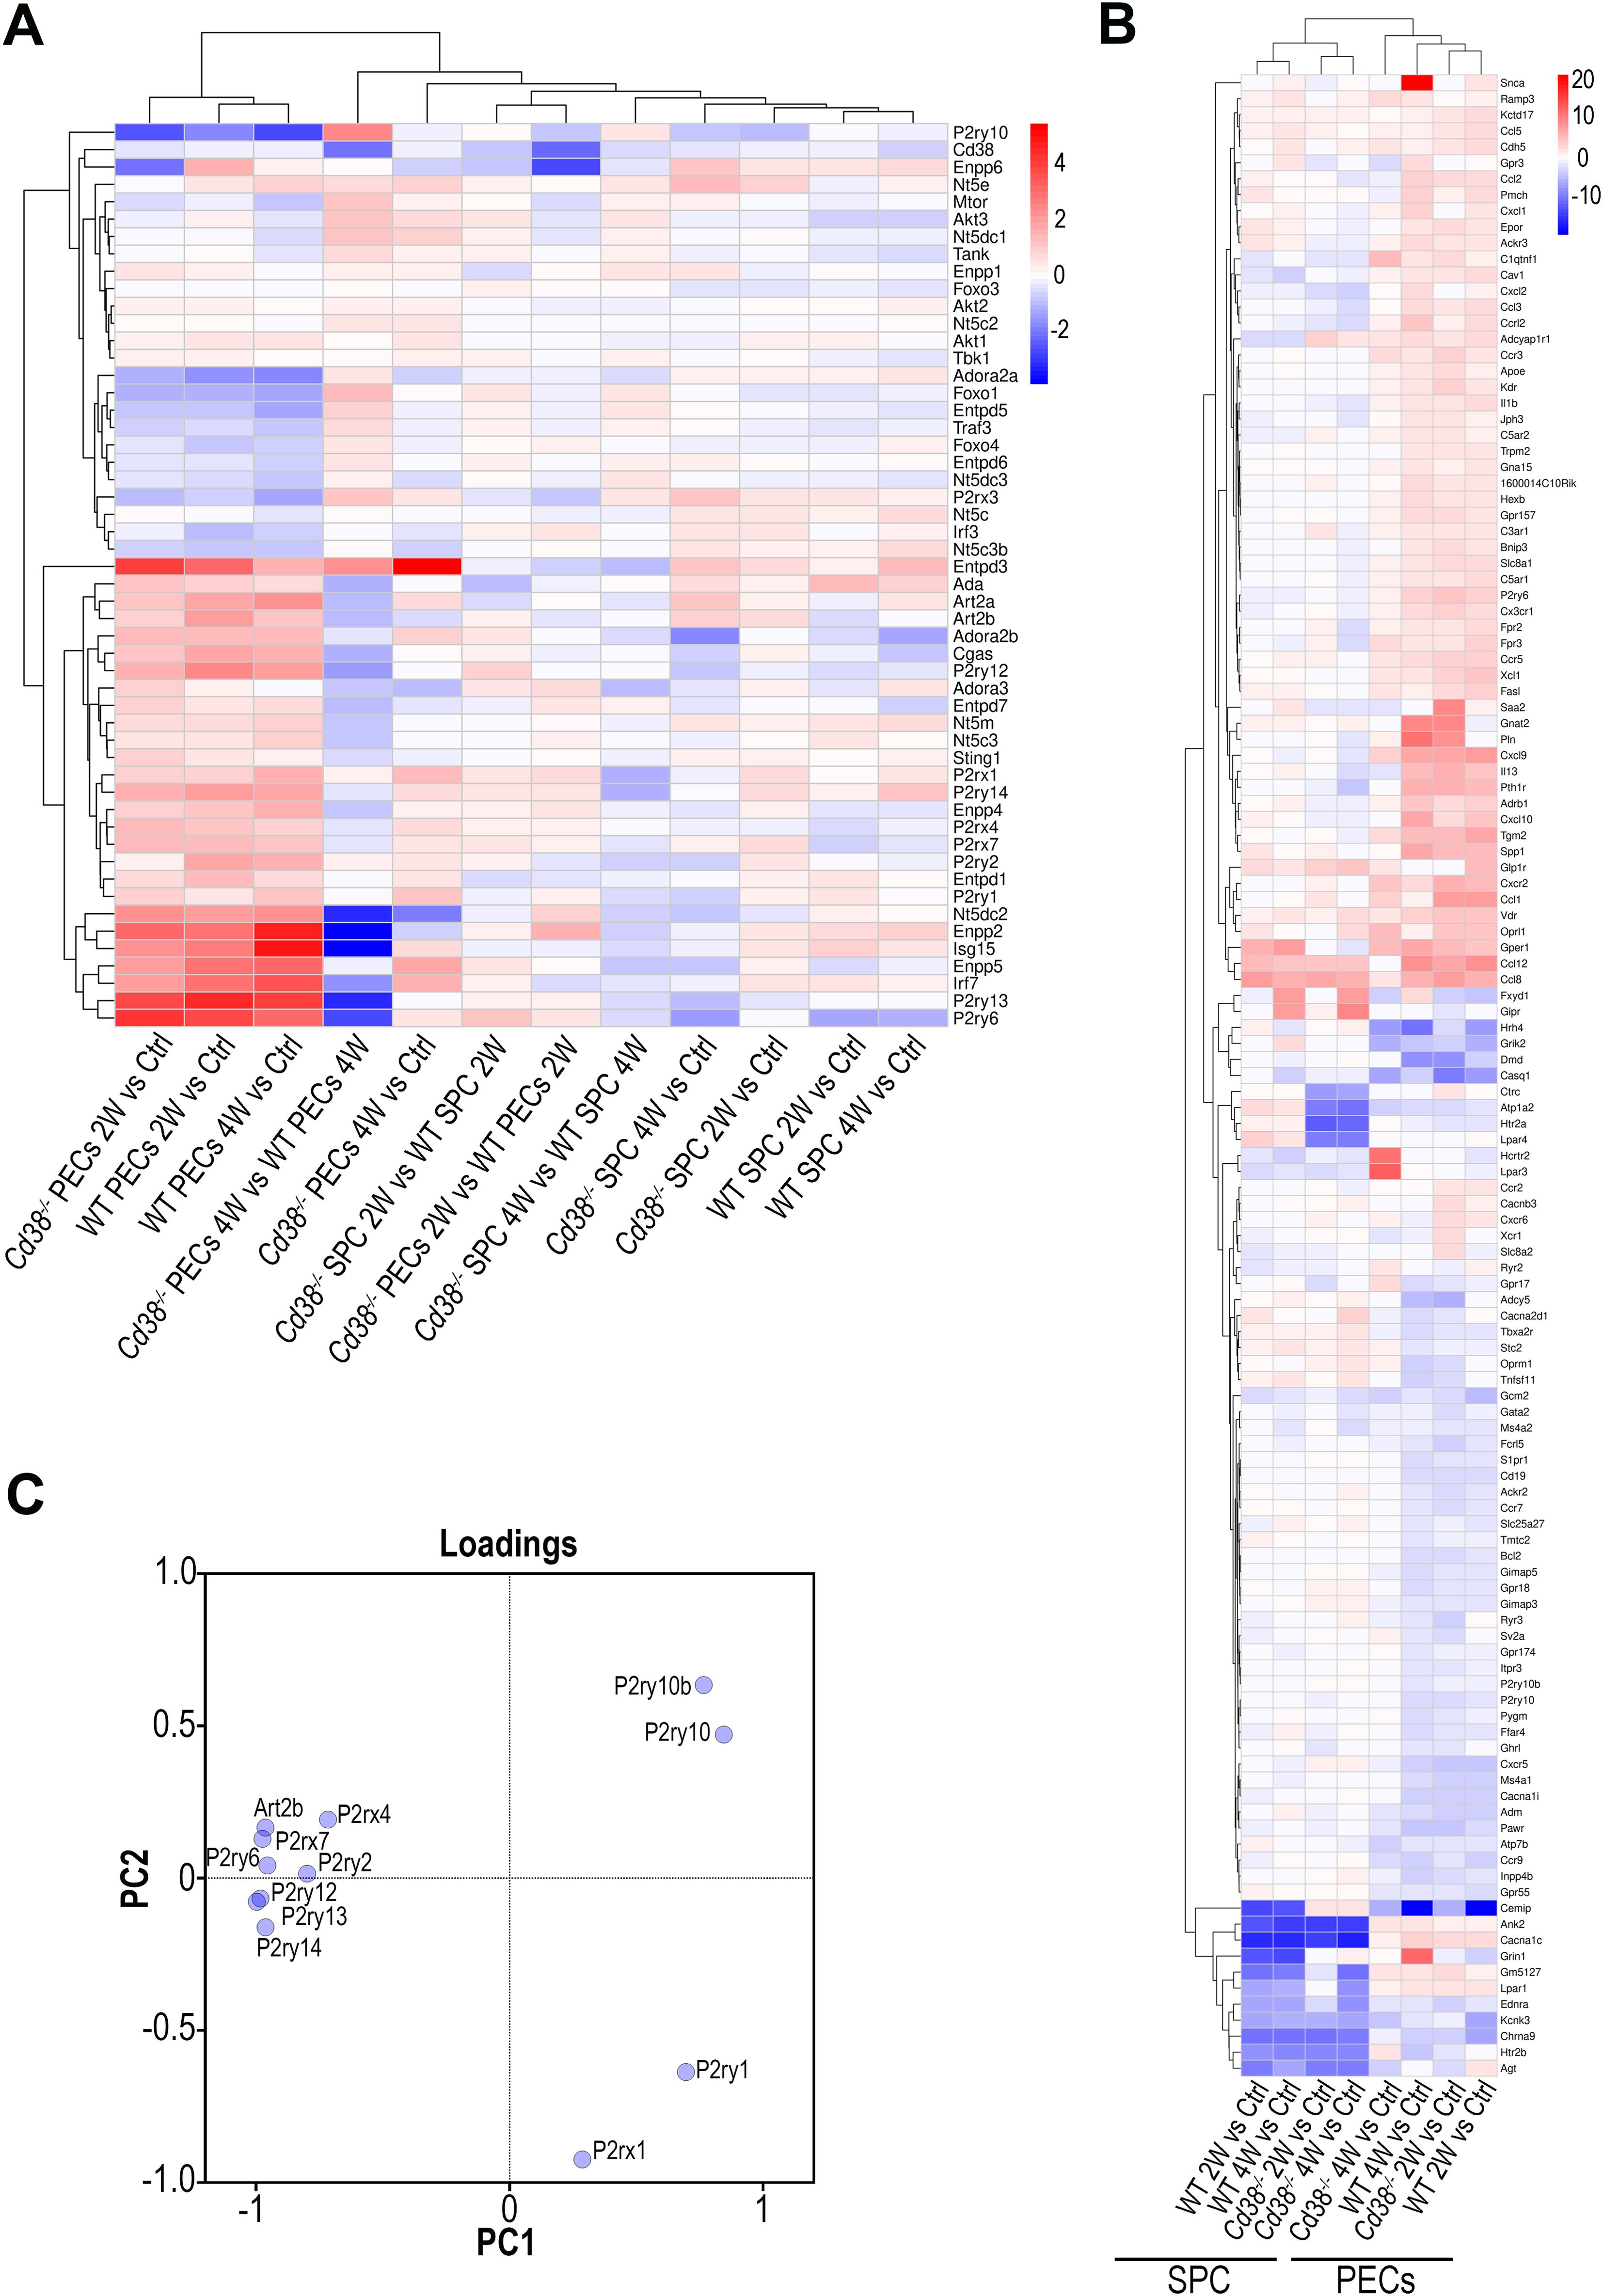
Figure 3. (A) Unsupervised hierarchical heat-map plot of the log2FC of the relative expression of the selected genes in the 12 comparatives indicated in the X-axis. (B) Unsupervised hierarchical heat-map plot of the log2FC of the relative expression of the genes associated with the GO term, Ca2+ ion homeostasis (GO:0055074), which was enriched in several comparatives. For this GO term, only DEGs with a log2FC ≥ 2, or log2FC ≤ -2 are represented, using as a reference the sample or samples where the GO term was enriched. The eight comparatives are indicated at the bottom. There was a perfect clustering of PECs samples separated from the spleen samples. (C) Loading plot of the 12 genes analyzed by PCA according with their differences in gene expression (log2FC, FDR ≤0.05, see Table 1) in the 4 comparatives tested (2-week and 4-week comparatives of cGVHD WT or cGVHD Cd38-/- PECs versus their respective controls from healthy untreated mice).
To note is that increased P2rx7 and P2rx4 expression was clearly observed in most cGVHD PECs vs control comparatives, with a more sustained response in WT than in Cd38-/-. In contrast, in the spleen cells comparatives, P2rx4 expression appeared downregulated, while P2rx7 was upregulated, although to a lesser extent than in the Cd38-/- PECs 2W vs Control comparative (Figure 3A).
The transcriptional profile of this gene cluster may define a distinct transcriptional signature that connects purinergic signaling genes in combination with genes belonging to the so-called type I interferon transcriptome signature and genes of the cGAS-STING signaling pathway, which are key players in the SLE pathology (76). In summary, there were a number of purinergic receptors and other ectonucleotidases that participate in purinergic signaling, which were differentially expressed at transcriptional level in Cd38-/- PECs and spleen cells relative to their WT counterparts after cGVHD induction.
It is known that purinergic signaling is connected to Ca2+ signaling. Thus, upon T cell receptor/CD3 stimulation, ATP release is increased and leads to autocrine activation of both P2X4 and P2X7 receptors, the amplification of the initial Ca2+ microdomain formation, and regulation of subsequent downstream responses (77, 78). Performing GO enrichment analyses of DEGs from cGVHD PECs vs Control PECs comparatives we noticed that many GO BP enriched terms were related with calcium ion homeostasis and calcium-mediated signaling. Therefore, we asked whether P2rx4, P2rx7, and other purinergic receptors genes were included within the gene set comprising the GO term, Ca2+ ion homeostasis (GO:0055074), which was enriched in several PECs comparatives. As shown in Figure 3B and Supplementary Figure S5, P2rx7 and P2rx4, together with P2rx1, P2ry6, P2ry10, P2ry10b, P2ry1 and P2ry2 were selected. Only P2ry10 appeared downregulated in both cGVHD Cd38-/- and cGVHD WT PECs relative to their respective healthy controls, while the others purinergic receptors genes showed upregulated expression, in particular P2ry6, and to a lesser extent P2rx1, P2rx7, P2rx4, P2ry1, and P2ry2. In PECs P2ry6 formed part of a subcluster of strongly upregulated genes including a number of chemokines and chemokine receptors such as Ccl1, Ccl12, Ccl8, Cxcl9, Cx3cr1, and Cxcr2 (Figure 3B). The heat-map representation showed that PECs samples were clearly segregated from spleen cells samples, and that there were several clusters of genes that seemed to have a coordinated expression as judged by their similar transcriptomic profiles. Within PECs, dendograms showed that the comparative of Cd38-/- PECs 4W relative to its control was more separated from the other 3 PECs samples, while in spleen cells the two Cd38-/- samples clustered separately from the two WT samples (Figure 3B).
We observed that P2rx1 and P2ry1 genes exhibited a sustained increase in expression across the 4-time series samples when comparing the log2FC in gene expression values of cGVHD PECs to their respective healthy PECs controls (see Table 1). In contrast, the expression of the other 9 differentially expressed purinergic receptor genes declined exclusively in the 4-week comparison of cGVHD Cd38-/- PECs versus controls (see Table 1). To further identify the purinergic receptors genes that best discriminate between cGVHD WT mice and cGVHD Cd38-/- PECs, we employed a principal component analysis (PCA) multivariate statistical approach. We included the Art2b gene as a positive control, knowing the functional and physical interaction of ART2.2 and P2X7 in murine T cells (79). Figure 3C displays a loading plot showing the distribution of the 12 genes according with the variance in their relative expression profiles projected onto the first two principal components. Seven purinergic receptors - P2rx4, P2rx7, P2ry2, P2ry6, P2ry12, P2ry13, P2ry14 -, and Art2b clustered in a relatively small area near the PC2 axis. Meanwhile, P2ry10 and P2ry10b clustered in the upper right quadrant, and P2rx1 and P2ry1 were found in the lower right quadrant, close to the PC1 axis. This clustering confirmed and expanded upon the heat-map data (Figure 3B, Supplementary Figure S5), indicating that the tested genes were distributed in distinct areas corresponding to their differential expression in the four matched sets (2-week and 4-week comparative analyzed in WT and Cd38-/- mice). This pattern is consistent with a fundamentally different autoimmune and inflammatory response to the allogeneic challenge.
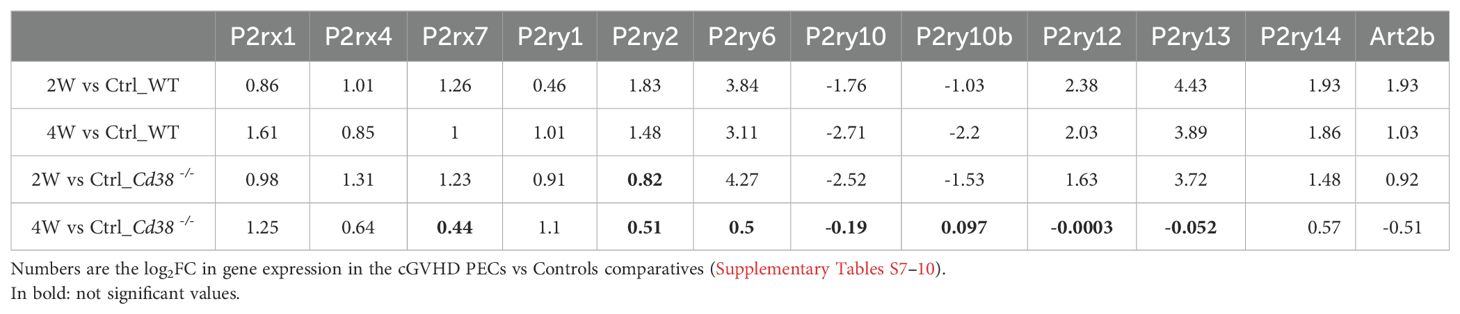
Table 1. Differential gene expression of selected 99purinergic receptors in PECs.
Transcriptomes of cGVHD affected mice along time were also compared with the transcriptomes of healthy controls to better understand the disease-state in a more dynamic approach, and to test whether in CD38-deficient mice there were signs of a faster resolution of the disease, as suggested in our previous study.
Volcano plots showed that 8562 genes were differentially expressed in Cd38-/- PECs 2 weeks after the adoptive transfer of bm12 spleen cells into the peritoneal cavity relative to control PECs from unchallenged mice (Figure 4A, Supplementary Table S7). The number of DEGs were reduced to 4157 4 weeks after the adoptive transfer (Figure 4B, Supplementary Table S8), suggesting a drastic reduction in the transcriptome response. In contrast, 9751 genes were differentially expressed in WT PECs at 2 weeks of the allogeneic challenge relative to controls (Figure 4C, Supplementary Table S9), and a similar number of genes, 9472, were differentially expressed at 4 weeks (Figure 4D, Supplementary Table S10), suggesting a similar transcriptome response.
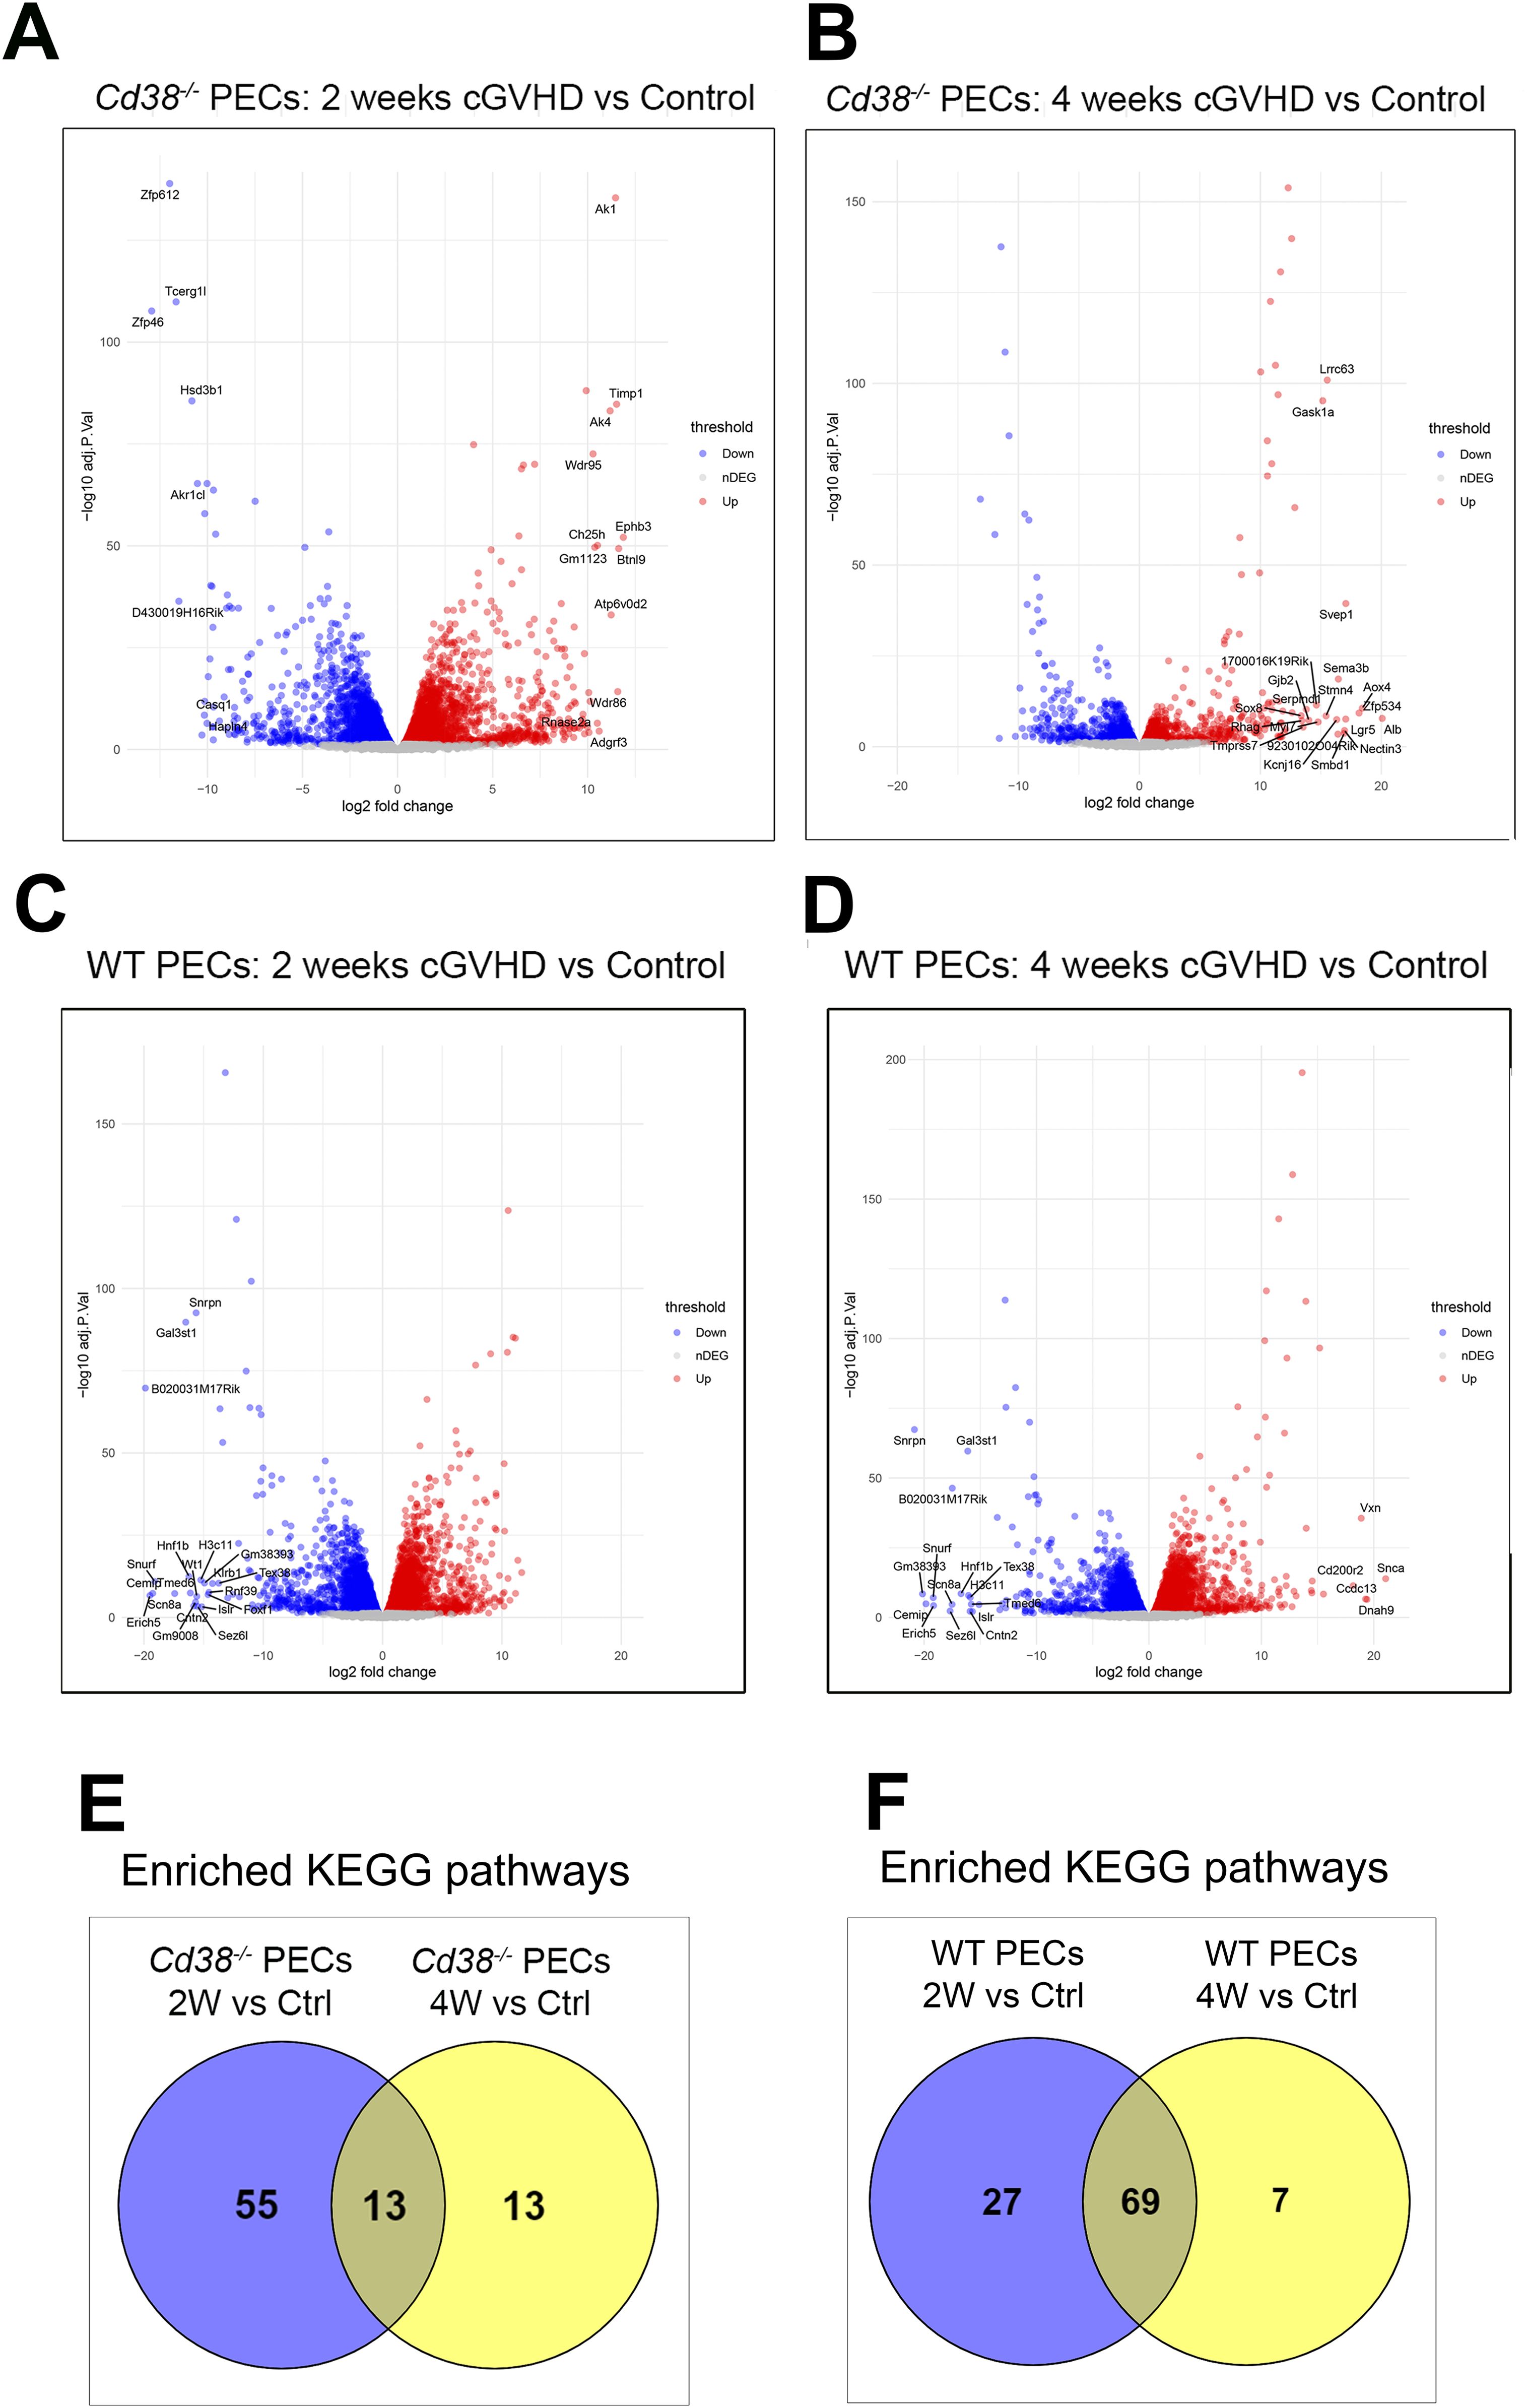
Figure 4. (A) Volcano plot showing upregulated DEGs (red dots) and downregulated DEGs (blue dots) in cGVHD Cd38-/- PECs 2 weeks after the adoptive transfer of bm12 cells vs Control Cd38-/- PECs from non-treated mice. (B) Volcano plot showing upregulated DEGs (red dots) and downregulated DEGs (blue dots) in cGVHD Cd38-/- PECs 4 weeks after the bm12 cells adoptive transfer vs Control Cd38-/- PECs from non-treated mice. (C) Volcano plot showing upregulated DEGs (red dots) and downregulated DEGs (blue dots) in WT PECs 2 weeks after the adoptive transfer of bm12 cells vs Control Cd38-/- PECs from non-treated mice. (D) Volcano plots showing upregulated DEGs (red dots) and downregulated DEGs (blue dots) in WT PECs 4 weeks after the adoptive transfer of bm12 cells vs Control Cd38-/- PECs from non-treated mice. (E) Venn diagram showing the number of shared and unique enriched KEGGs for the indicated comparatives. (F) Venn diagram showing the number of shared and unique enriched KEGGs for the indicated comparatives.
To gain insight into the molecular pathways associated with the differences in autoimmune response between Cd38-/- and WT mice, enrichment analyses in KEGG pathways were performed in our comparative experiments along the time. In Cd38-/- PECs, 68 KEGG pathways were significantly enriched 2 weeks after the allogeneic challenge relative to controls (Supplementary Table S11). In contrast, only 26 KEGG pathways were enriched at 4 weeks (Supplementary Table S12), which was a drastic reduction relative to the 2 weeks-comparative. In WT PECs, at 2 weeks of the allogeneic challenge, 96 KEGG pathways were significantly enriched (Supplementary Table S13), and 76 at 4 weeks (Supplementary Table S14).
Venn diagrams showed that in Cd38-/- PECs only 13 enriched KEGG pathways were shared at both 2 and 4 weeks relative to controls (Figure 4E), while most enriched pathways belonged to the 2-week_vs_Ctrl comparative, where the bulk of the transcriptional response seemed to be concentrated. In contrast, Venn diagrams in WT PECs showed that 69 of these pathways were shared between both time points (Figure 4F), which suggested a more sustained transcriptional response than in Cd38-/- PECs.
To better understand the differences and similarities in the transcriptional response between Cd38-/- PECs and WT PECs, the enriched KEGG pathways of these 4-time series were matched and visualized using UpSet plots (80). In Figure 5A, three different set intersections are highlighted. The first highlighted intersection corresponded to the 10 pathways shared between all 4-time series. The second intersection corresponded to the 43 pathways shared by Cd38-/- PECs 2W_vs_Ctrl, WT PECs 2W_vs_Ctrl, and WT PECs 4W_vs_Ctrl, but not with Cd38-/- PECs 4W_vs_Ctrl. Finally, the third intersection corresponded to the 14 pathways shared by WT PECs 2W_vs_Ctrl and WT PECs 4W_vs_Ctrl.
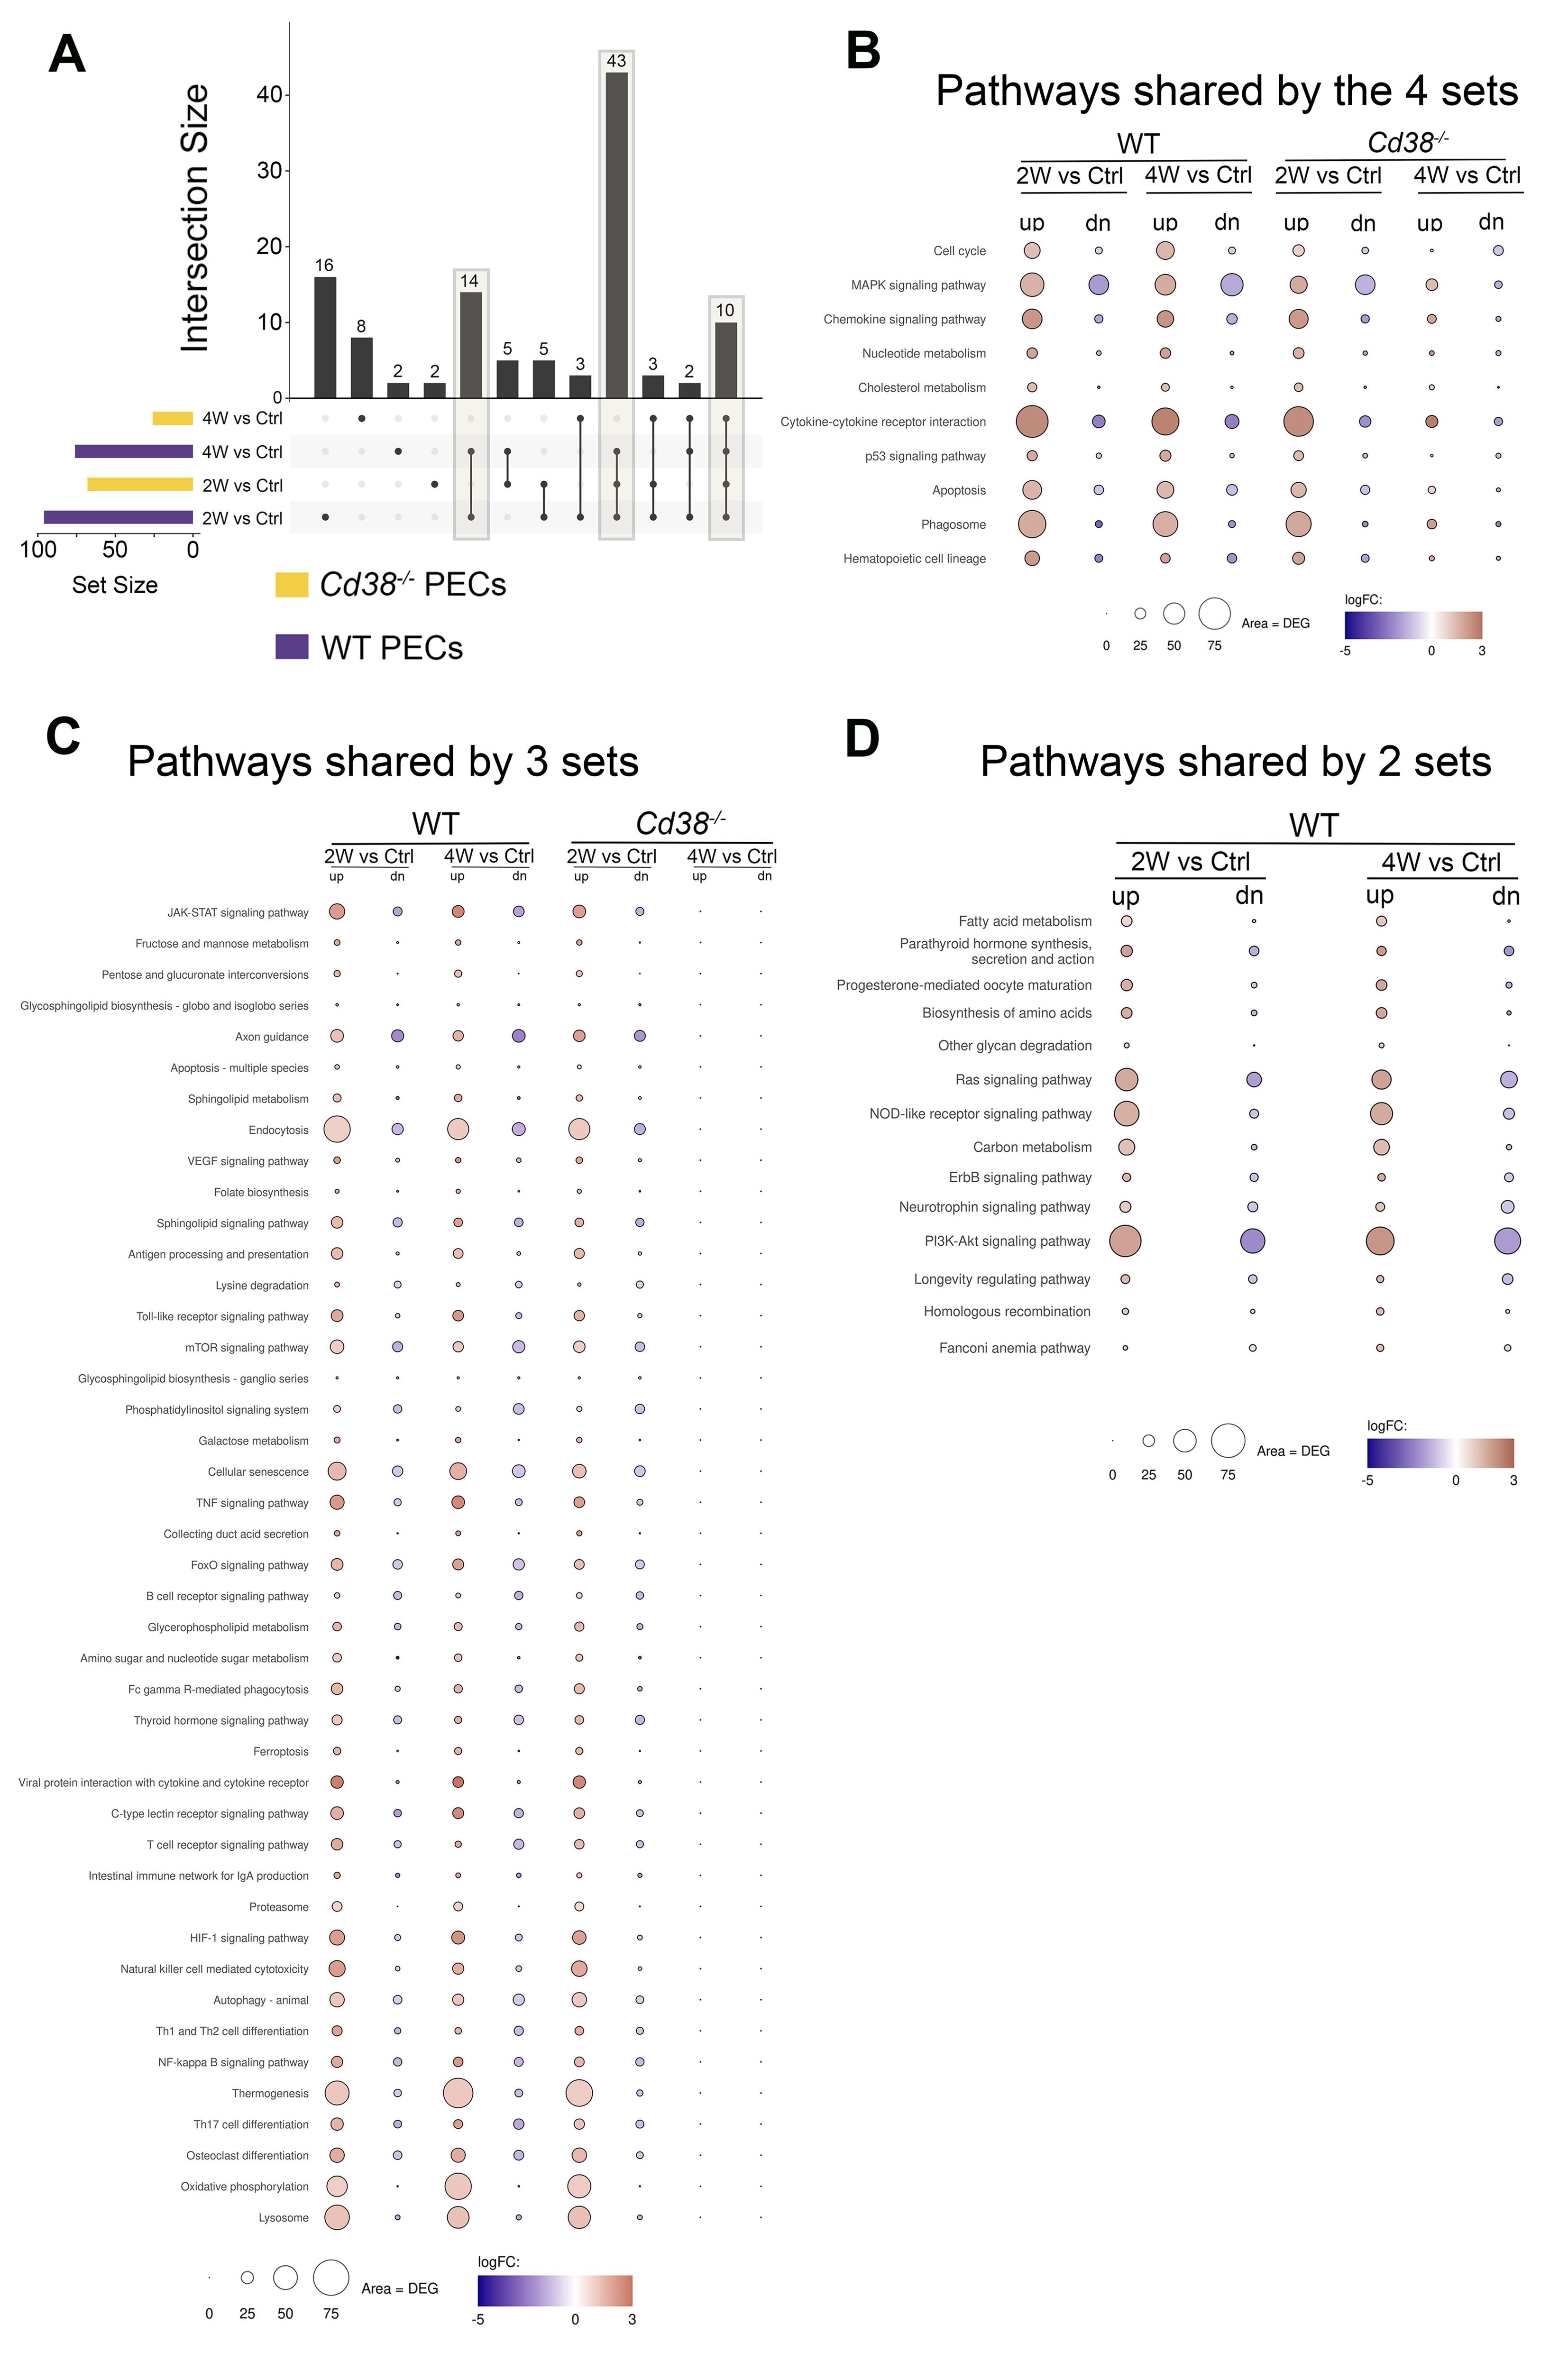
Figure 5. (A) The enriched KEGG pathways of these 4-time series or sets of PECs comparatives were matched and visualized using UpSet plots. Three different set intersections are highlighted. (B) The first highlighted intersection corresponded to the 10 pathways shared between all 4-time series. (C) The second intersection corresponded to the 43 pathways shared by Cd38-/- PECs 2W_vs_Ctrl, WT PECs 2W_vs_Ctrl, and WT PECs 4W_vs_Ctrl, but not with Cd38-/- PECs 4W_vs_Ctrl. (D) The third intersection corresponded to the 14 pathways shared by WT PECs 2W_vs_Ctrl and WT PECs 4W_vs_Ctrl. The mean log2FC of the upregulated DEGs (red circles) versus the mean log2FC of the downregulated DEGs (blue circles) per pathway were represented graphically. In this representation, the size of the circles was indicative of the number of upregulated or downregulated DEGs, and the intensity of the colors indicate the differences in log2FC.
To assess the intensity of the transcriptome response to the allogeneic challenge, the mean log2FC of the upregulated DEGs versus the mean log2FC of the downregulated DEGs per pathway were represented graphically. In this representation, the size of the circles was indicative of the number of upregulated or downregulated DEGs. From the 10 pathways shared between the 4 comparatives, cytokine-cytokine receptor interaction, phagosome, MAPK signaling pathway, chemokine signaling pathway, and apoptosis were the pathways with most upregulated DEGs involved, with a distinct pattern in Cd38-/- PECs (Figure 5B). Thus, in these comparatives, the number of upregulated DEGs corresponding to these pathways peaked at 2 weeks, declining sharply at 4 weeks. To note is that at 4 weeks the term cell cycle showed increased number of downregulated DEGs in Cd38-/- PECs, with no upregulated DEGs. This is better appreciated in a heat-map representation of the pathways cytokine-cytokine receptor interaction and cell cycle (Figures 6A, B, Supplementary Figures S6A, S6B). For these two pathways, dendograms showed that the Cd38-/-PECs_4W sample differed from the other three PECs samples, and it was closer to the gene profiling of spleen samples (Figures 6A, B, Supplementary Figures S6A, S6B).
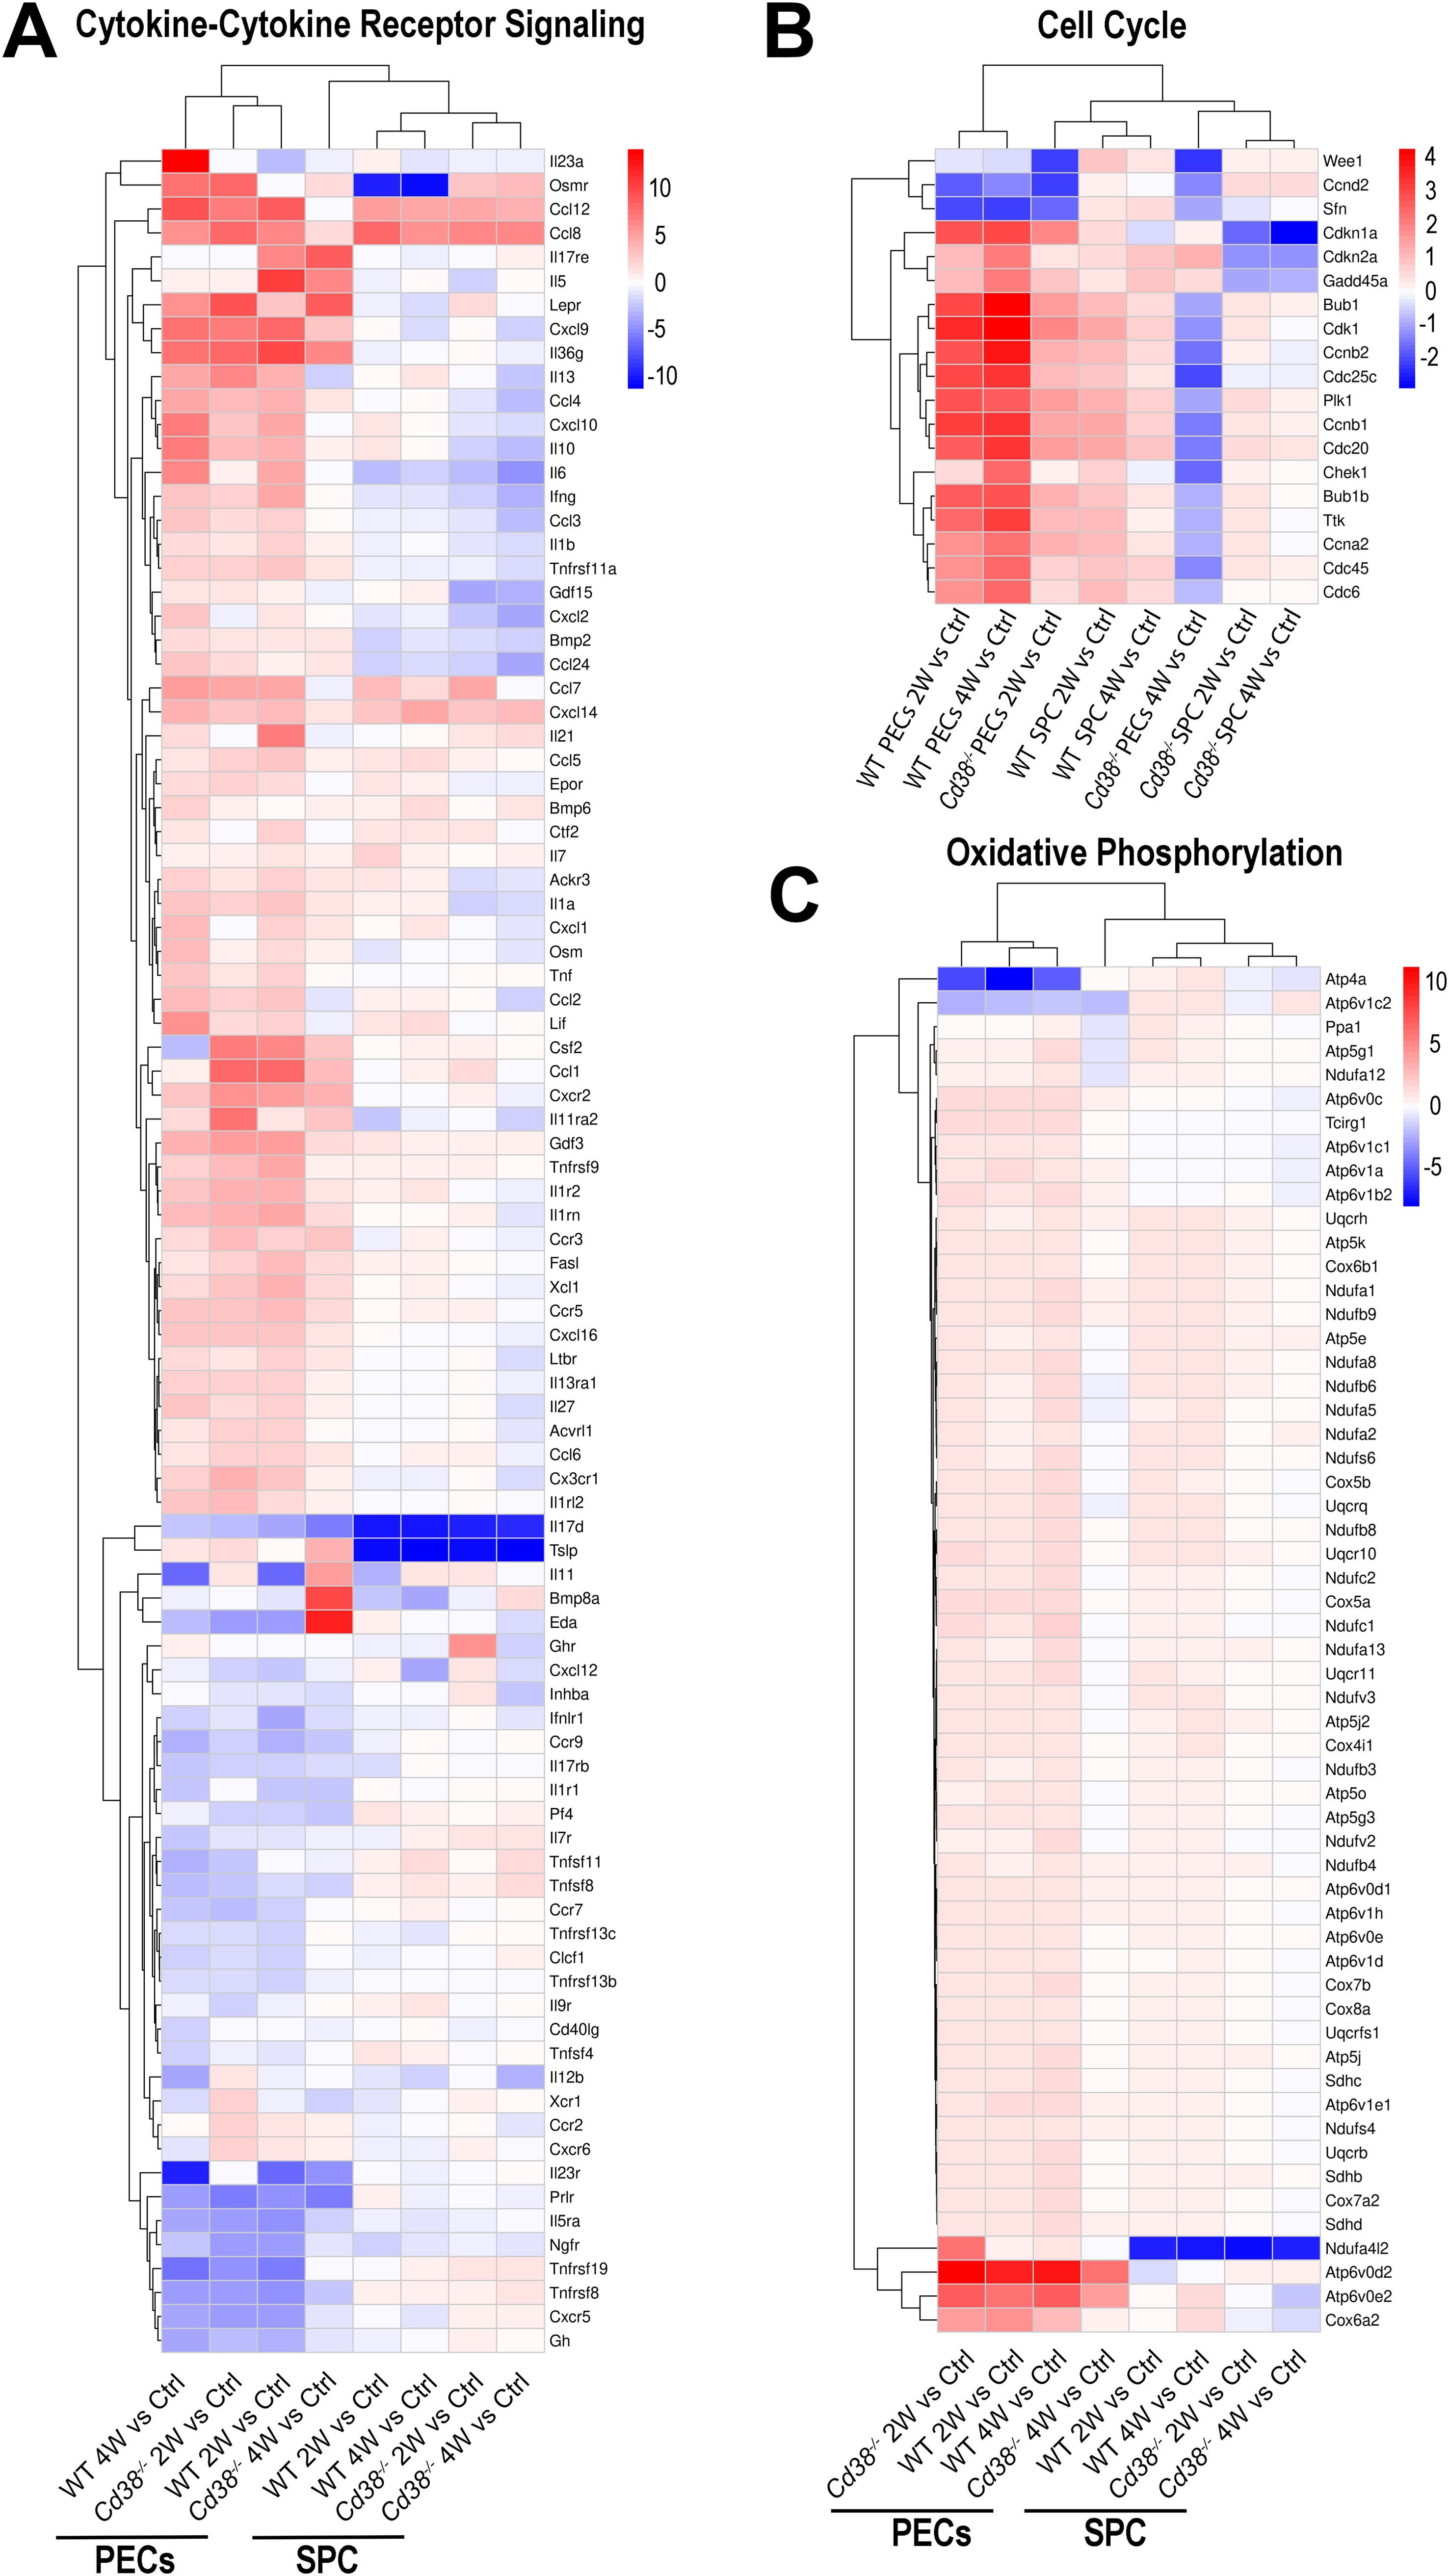
Figure 6. Unsupervised heat-map plot of the log2 fold changes of DEGs contributing to the indicated KEGG pathways: (A) Cytokine-Cytokine receptor signaling. (B) Cell Cycle process. (C) Oxidative phosphorylation. In panels (A, B), only DEGs with a log2FC ≥ 2, or log2FC ≤ -2 are represented, using as a reference the sample or samples where the pathways were enriched. In panel (C), only DEGs with a log2FC ≥ 1, or log2FC ≤ -1 are represented. The 8-time comparatives are indicated to the bottom of each panel. Vertical bars at the right of each panel represent the range of log2FC values. Red indicates upregulated gene expression. Blue indicates downregulated gene expression. Color intensity of the targeted genes indicates log2FC changes. The heat-maps of these three pathways, which include all DEGs, are shown in Supplementary Figure S6A–C.
In Cd38-/-PECs, differences in the kinetics of upregulated vs downregulated DEGs of the MAPK signaling pathway were observed with a peak of downregulated DEGs at 2 weeks. In contrast, in WT PECs, the maximum of downregulated DEGs associated with the MAPK signaling pathway occurred at 4 weeks. For most of the other pathways, including cell cycle, the number of upregulated DEGs remained stable at 2 and 4 weeks after the cGVHD induction, with a significant increase in the mean log2FC relative to that of the downregulated DEGs (Figure 5B). These findings were indicative of clear differences in the kinetics of activation of these pathways in Cd38-/- PECs versus WT PECs.
This distinctive gene profile was even more dramatically shown in 43 pathways that were significantly enriched in Cd38-/- PECs in the 2-week vs control comparative but not in the 4-week vs control, while in WT PECs the enrichments were observed in both comparatives (Figure 5C). The 10-top most significant pathways in Cd38-/- PECs 2-week vs control comparative were lysosome, oxidative phosphorylation, osteoclast differentiation, Th17 cell differentiation, thermogenesis, NF-κB signaling pathway, Th1 and Th2 cell differentiation, autophagy, NK cell mediated signaling pathway and HIF-1 signaling pathway. To note is that in WT PECs, for some pathways, such as oxidative phosphorylation and thermogenesis, the number of upregulated DEGs was higher at 4 weeks than at 2 weeks, resulting in enrichments with higher statistical significances (see Figure 6C, Supplementary Figure S6C, for a heat-map visualization of the changes in gene expression related with oxidative phosphorylation). Likewise, other pathways such as cellular senescence, TNF signaling pathway, and JAK-STAT signaling pathway, which are particularly interesting in the context of the lupus pathology, showed a stronger statistical significance in WT PECs than in Cd38-/- PECs in the 2-week vs control comparatives, and remained upregulated in the 4-week comparative in WT, and not in Cd38-/-.
We selected a number of known gene markers of cellular senescence, to evaluate more quantitatively the extent of this increased transcriptional activity related with this pathway (Table 2). Thus, in Cd38-/- PECs, Cdkn1a, IL1a, Nampt, E2f1, Serpine1, and to a lesser extent Il6, were significantly upregulated in the 2-week comparative and not in the 4-week comparative. In contrast, there was an upregulation of Tgfb2 in the 4-week comparative and not in the 2-week comparative. Although, TGF-β plays an important role in senescence via inducing upregulation of Cdkn2b expression (71), it also a marker of the anti-inflammatory SASP, while IL-6, IL-1α, and IL-1β are markers of pro-inflammatory SASP (81, 82). As shown in Table 2, in WT PECs, the increased gene expression of selected senescence markers was quite stable with similar log2FC in the 2-week and 4-week comparatives, in contrast with the decline observed in the 4-week comparative of Cd38-/- PECs. To note is the significant increased expression of Il6, and decreased expression of Sirt1, a putative protector of senescence (74). The relative increase in Tgfb2 expression at 4 weeks did not reach statistical significance (FDR = 0.09417).
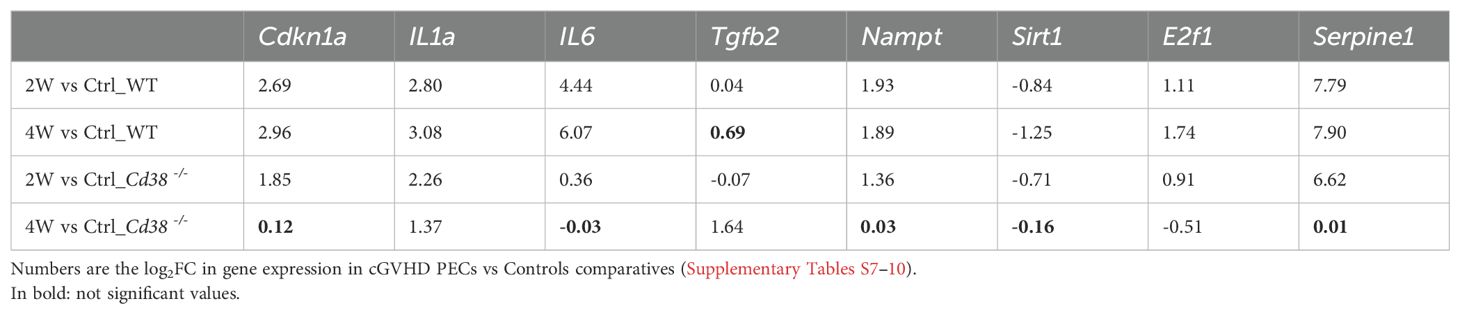
Table 2. Differential gene expression of selected senescence markers.
To note is that 14 pathways were exclusively enriched in WT PECs and not in Cd38-/- PECs, including Ras signaling pathway, NOD-like receptor signaling pathway, fatty acid metabolism and the PI3K-Akt signaling pathway (Figure 5D). Regarding the NOD-like receptor (NLR) signaling pathway, there is a connection of cytosolic NLRs with inflammatory and autoimmune disorders, including lupus (83, 84). These innate immune pattern recognition molecules are essential for controlling inflammatory mechanisms through induction of cytokines, chemokines, and anti-microbial genes (84, 85). As shown in Figure 7A, and Supplementary Figure S6D, 2 weeks and 4 weeks after cGVHD induction in WT PECs there was increased expression of the NLR-encoding genes: Nlrp3, Nod1 (Nlrc1), Nlrp1a, Nlrp1b, Nlrx1, Nlrc3, and Ifi204 in comparison to control non-treated WT PECs (see also Supplementary Tables S9, S10). In contrast, Nlrc4 expression was downregulated during cGVHD induction, while Mefv, which encodes the protein Pyrin, showed increased expression only at 2 weeks (Supplementary Figure S6D). All these NLRs are the cytosolic sensor components of distinct inflammasome complexes, which are assembled with the proteins encoded by Pycard and Casp1, and that were overexpressed in WT PECs after cGVHD induction (Figure 7A, Supplementary Figure S6D). Inflammasomes activate Caspase-1, which in turn cleaves pro-IL1β and pro-IL-18, allowing their secretion as mature IL-1β and IL-18. Il1b was also overexpressed in WT PECs upon the allogeneic challenge. Moreover, P2rx7, Trpm2, and Tlr4 genes were upregulated, which are genes encoding potential activators of the NLRP3-inflammasome complex (86, 87).
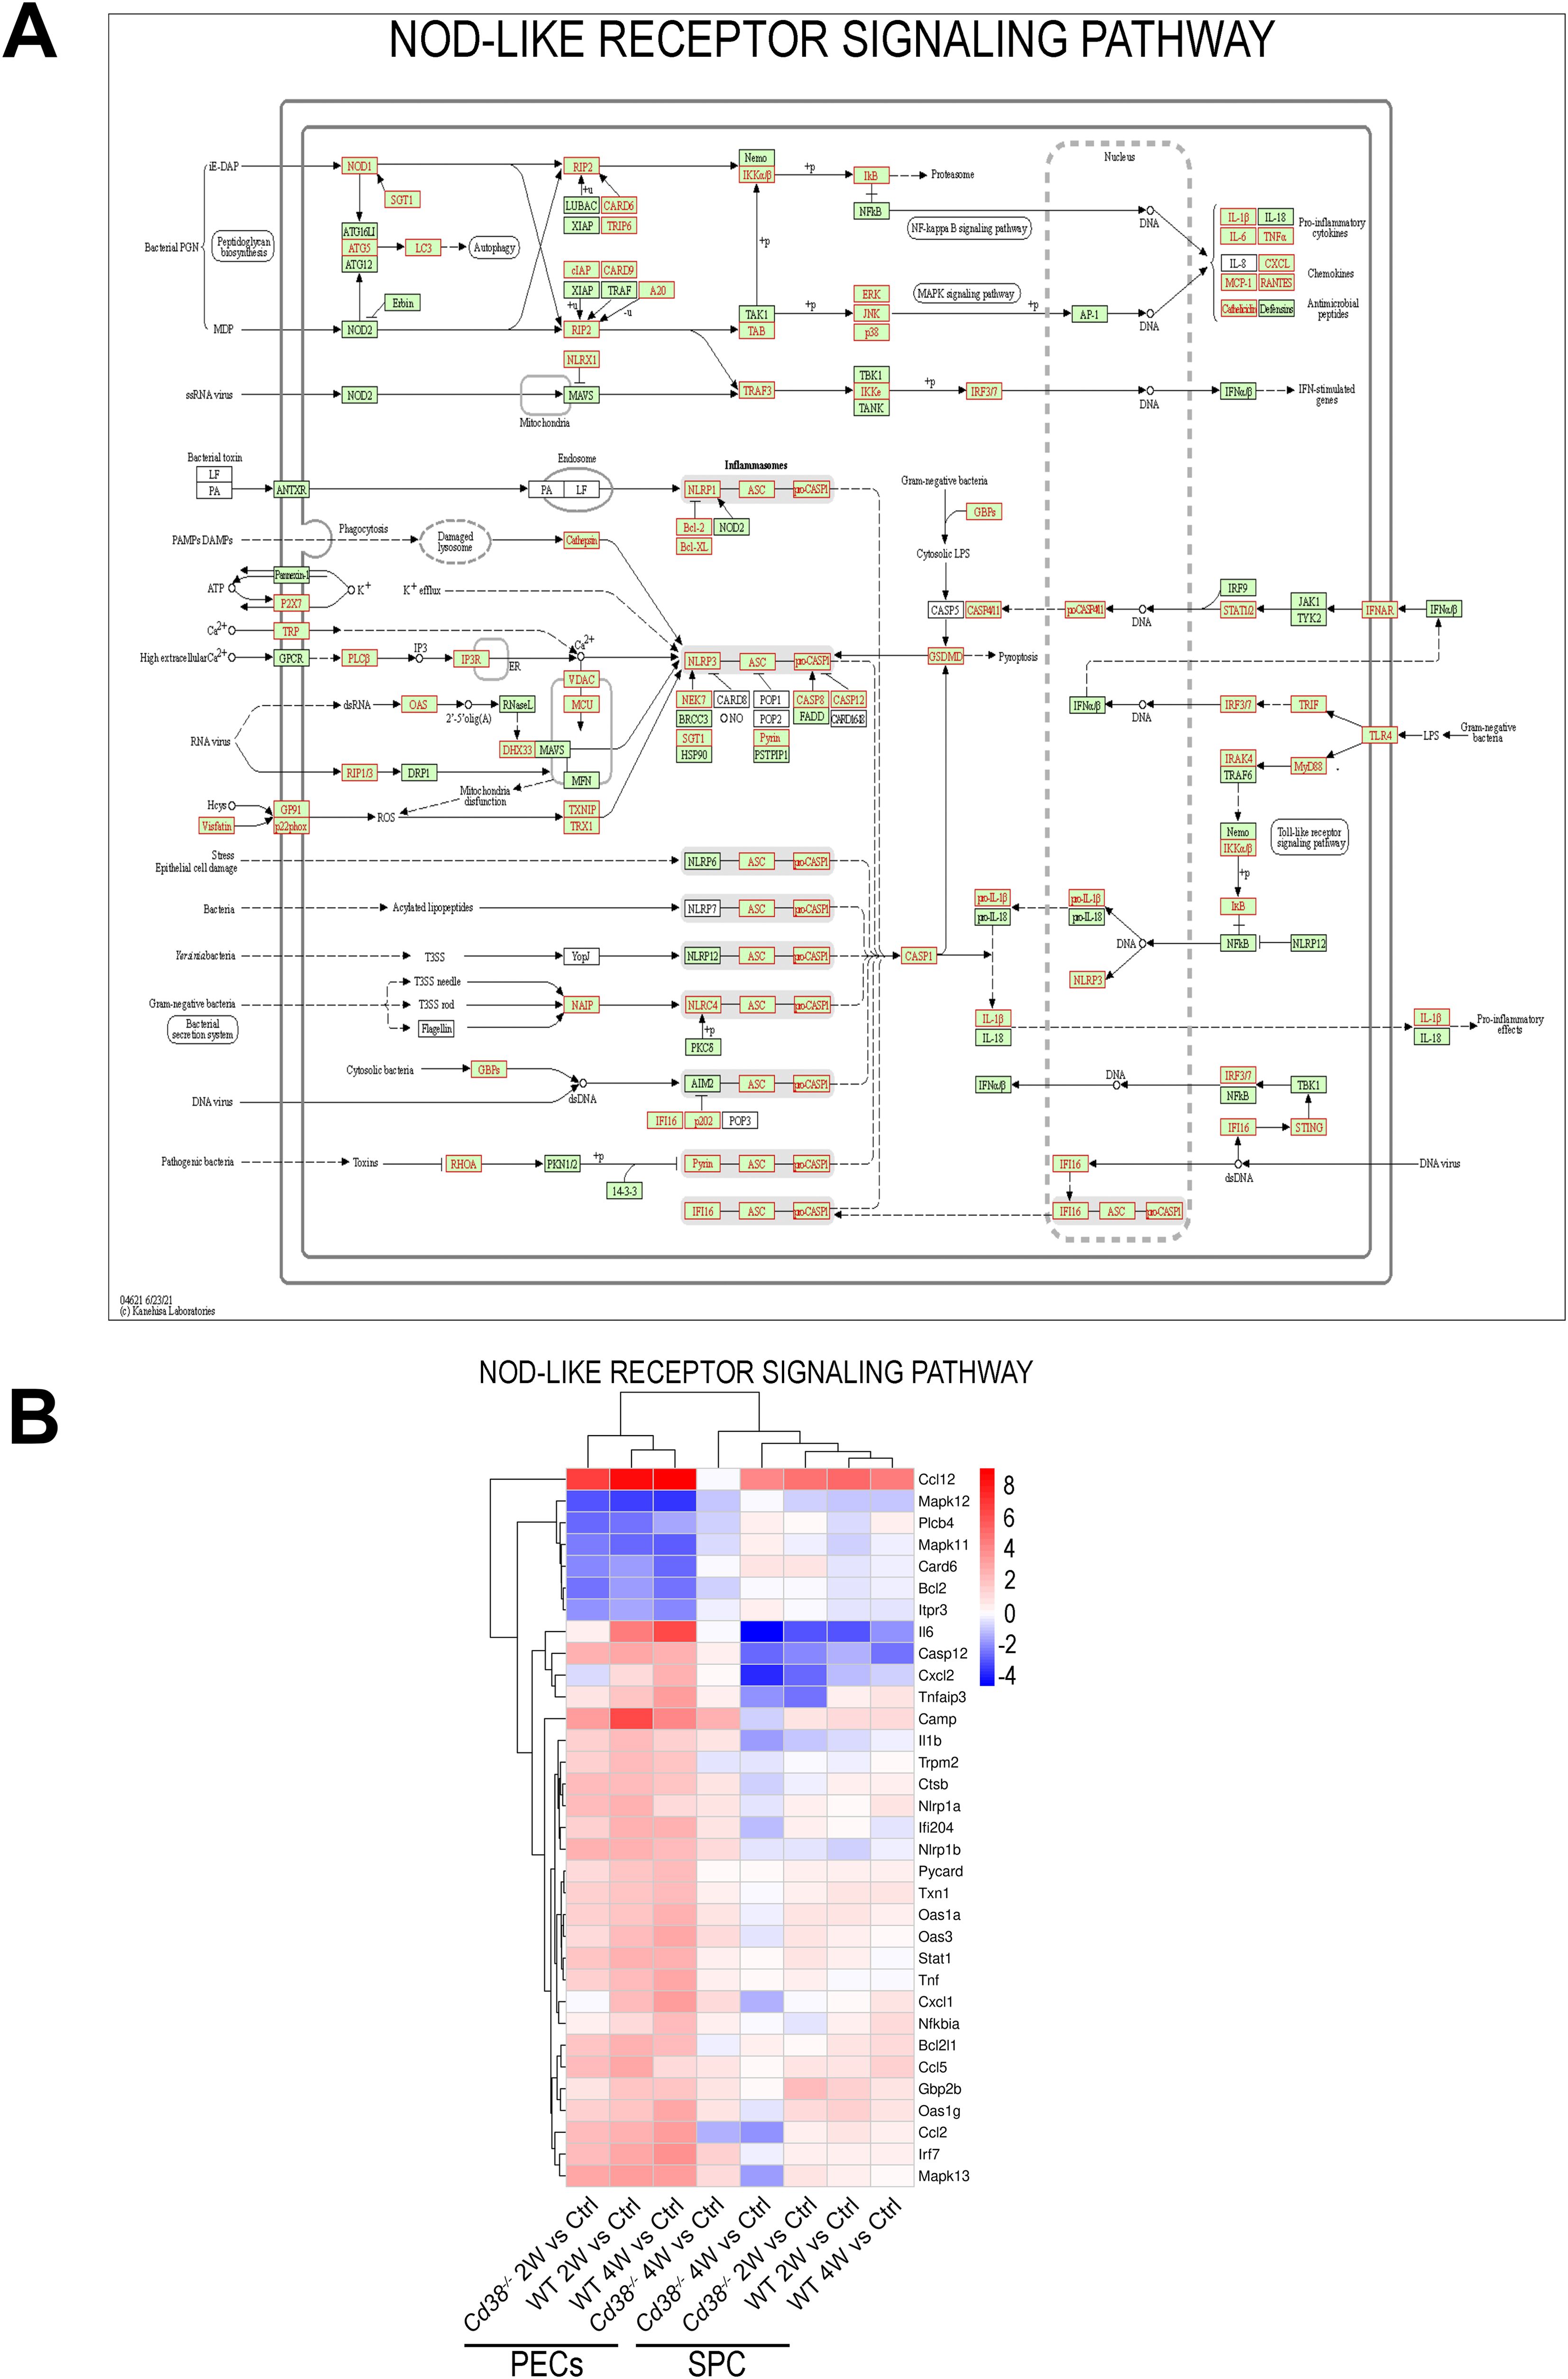
Figure 7. (A) NOD-like receptor signaling pathway reference KEGG map 04621 highlighting (in red) DEGs detected in the cGVHD WT PECs 2W vs Ctrl WT PECs comparative. Similar results were obtained in the cGVHD WT PECs 4W vs Ctrl WT PECs comparative, but not in the respective Cd38-/- comparatives (data not shown). (B) Unsupervised heat-map plot of the log2 fold changes of DEGs contributing to NOD-like receptor signaling. DE gene names are shown to the right of each heat-map panel. Only DEGs with a log2FC ≥ 2, or log2FC ≤ -2 are represented, using as a reference the sample or samples where the KEGG pathway was enriched. The 8-time comparatives are indicated to the bottom of each panel. Vertical bar at the right of the panel represents the range of log2FC values. Red indicates upregulated gene expression. Blue indicates downregulated gene expression. Color intensity of the targeted genes indicates log2FC changes. The heat-map of this pathway, which includes all DEGs, is shown in Supplementary Figure S6D. Permission to use the KEGG map04621 has been granted by Kanehisa laboratories.
To note is the increased and stable expression of Nampt in WT PECs after cGVHD induction, while in Cd38-/- PECs occurred only in the 2-week vs Control comparative (Supplementary Figure S6D, bottom). NAMPT is a key enzyme in the NAD+ biosynthesis, and extracellular NAMPT acts as a cytokine that modulates the immune and inflammatory response (88). Moreover, inhibition of NAMPT activity by FK866 has been shown to decrease inflammatory cytokine release, which was mechanistically linked with altered monocyte/macrophage biology and skewed macrophage polarization, by reducing CD86, CD38, MHC-II and IL-6 expression and promoting CD206, Egr2 and IL-10, which can be used to attenuate acute intestinal inflammation (89).
In WT PECs other nucleotide sensors were upregulated, including Cgas and Sting1, main components of the cGAS-STING signaling pathway, and a number of downstream genes associated with the in vivo type I IFN response such as Ifnar2, Stat1, Stat2, Irf7, Isg15, Mx1, Oas1a, Oas1g, Oas2, and Oas3. Most of these ISGs showed gene expression changes of more than two-fold (Figures 3A, 7B).
Nlrp1a, Nlrp1b, and Ifi204 showed the highest increased expression among the NLR-encoding genes (log2FC > 2, Figure 7B). Ifi204 encodes the interferon-γ-inducible protein (Ifi-204), the murine orthologous gene of human IFI16. As shown in Figure 7A, IFI16/Ifi-204 may act at different levels within the NOD-like receptor signaling pathway. IFI16 is known as a cytosolic DNA sensor, which forms an inflammasome in response to herpesviruses, lentiviruses and intracellular DNA, leading to caspase-1 activation and pyroptosis (90–92). Moreover, IFI16 and Ifi-204 proteins mediate type I IFN induction via recruiting STING (90, 91).
In contrast, another DNA sensor, Tlr9, that also induces type I IFN responses, was downregulated in both WT and Cd38-/- PECs (Supplementary Figure S6D, Figure 7B). In this sense, SLE B cells show higher expression of interferon regulated genes and nucleic acid sensors than healthy B cells (76).
Pro-inflammatory cytokines such as Il6, and Tnf; and chemokines such as Ccl2, Ccl5, Ccl12, Cxcl1, and Cxcl2, which have chemotactic activity for monocytes, neutrophils and other cell-types, and are expressed at sites of inflammation, also showed sustained upregulated gene expression in WT PECs in response to the allogeneic challenge, with log2FC > 2 (Figure 7B, Supplementary Tables S9, S10).
The above results strongly suggested that Cd38-/- PECs responded to the adoptive transfer of bm12 cells with a peak of transcriptional activity at 2 weeks, and a sharp decline thereafter, while in WT PECs the response was more intense and long-lasting. It was of interest to test whether this phenomenon also occurred in a secondary lymphoid organ such as the spleen where the allogeneic immune response is generated, and altered metabolic pathways are likely to occur (93).
First, we asked whether there were differences in gene expression in Cd38-/- spleen cells relative to WT spleen cells 2 weeks and 4 weeks upon the adoptive transfer of bm12 cells. 867 DEGs were identified at 2 weeks (Figure 8A, Supplementary Table S15), and 1410 DEGs at 4 weeks after the adoptive transfer (Figure 8B, Supplementary Table S16). At 2 weeks there were not enriched KEGG pathways, while at 4 weeks 10 out of the 18 enriched KEGG pathways were related with immune or inflammatory responses (Supplementary Table S17, Figure 8C). To note is that Siglech, which is marker of plasmacytoid DCs, the major producers of type I IFNs, was downregulated in Cd38-/- relative to WT spleen cells. Likewise, T cell markers such as Cd3d, and Cd3g were downregulated, whereas Ms4a1, which encodes the B cell marker CD20, and Cr2, which encodes CD21, also known as complement receptor type 2, were upregulated (Supplementary Table S16). Expression of CD21 is decreased on B lymphocytes of SLE patients, and on B cells from MRL/lpr lupus mice (94). All KEGG pathways showed a higher percentage of downregulated genes in Cd38-/- relative to WT (Supplementary Table S17). The metabolic pathways such as pentose and glucoronate interconversions, and drug metabolism-cytochrome P450, were also downregulated in Cd38-/- vs WT. These pathways involved a number of UDP-ribosyl transferases isoenzymes, and, to a lesser extent, glutathione transferases, which have direct antioxidant activity. In summary, the major transcriptional differences between Cd38-/- spleen cells and WT spleen cells were observed 4 weeks after the cGVHD induction, with a strong down-regulation of genes involved in inflammatory, and immune response related pathways, as well in key metabolic pathways.

Figure 8. (A) Volcano plot of the DEGs upregulated (red circles), and downregulated (blue circles) in Cd38-/- vs WT spleen cells 2 weeks after the bm12 cell transfer. (B) Volcano plots of the DEGs upregulated (red circles), and downregulated (blue circles) in Cd38-/- vs WT spleen cells 4 weeks after the bm12 cell transfer. (C) KEGG pathways enriched in the 4-week comparative. Histograms represent the level of significance as ‐log10 of the P adjusted value. Pathways related with immune response are highlighted in orange.
Second, we asked whether there were differences in the kinetics of the transcriptional activity elicited in Cd38-/- spleen cells vs WT spleen cells along the course of the disease. In Cd38-/- spleen cells, 1439 DEGs were detected 2 weeks after the adoptive cell transfer of bm12 cells into Cd38-/- mice relative to control spleen cells from non-treated Cd38-/- mice (Figure 9A, Supplementary Table S18). The number of DEGs increased to 3708 4 weeks after the adoptive transfer relative to healthy non-treated control Cd38-/- spleen cells (Figure 9B, Supplementary Table S19). In WT spleen cells, 3622 DEGs were detected at 2 weeks (Figure 9C, Supplementary Table S20), and 4769 DEGs at 4 weeks of the adoptive transfer of bm12 cells into WT mice, relative to control spleen cells from non-treated WT mice (Figure 9D, Supplementary Table S21).
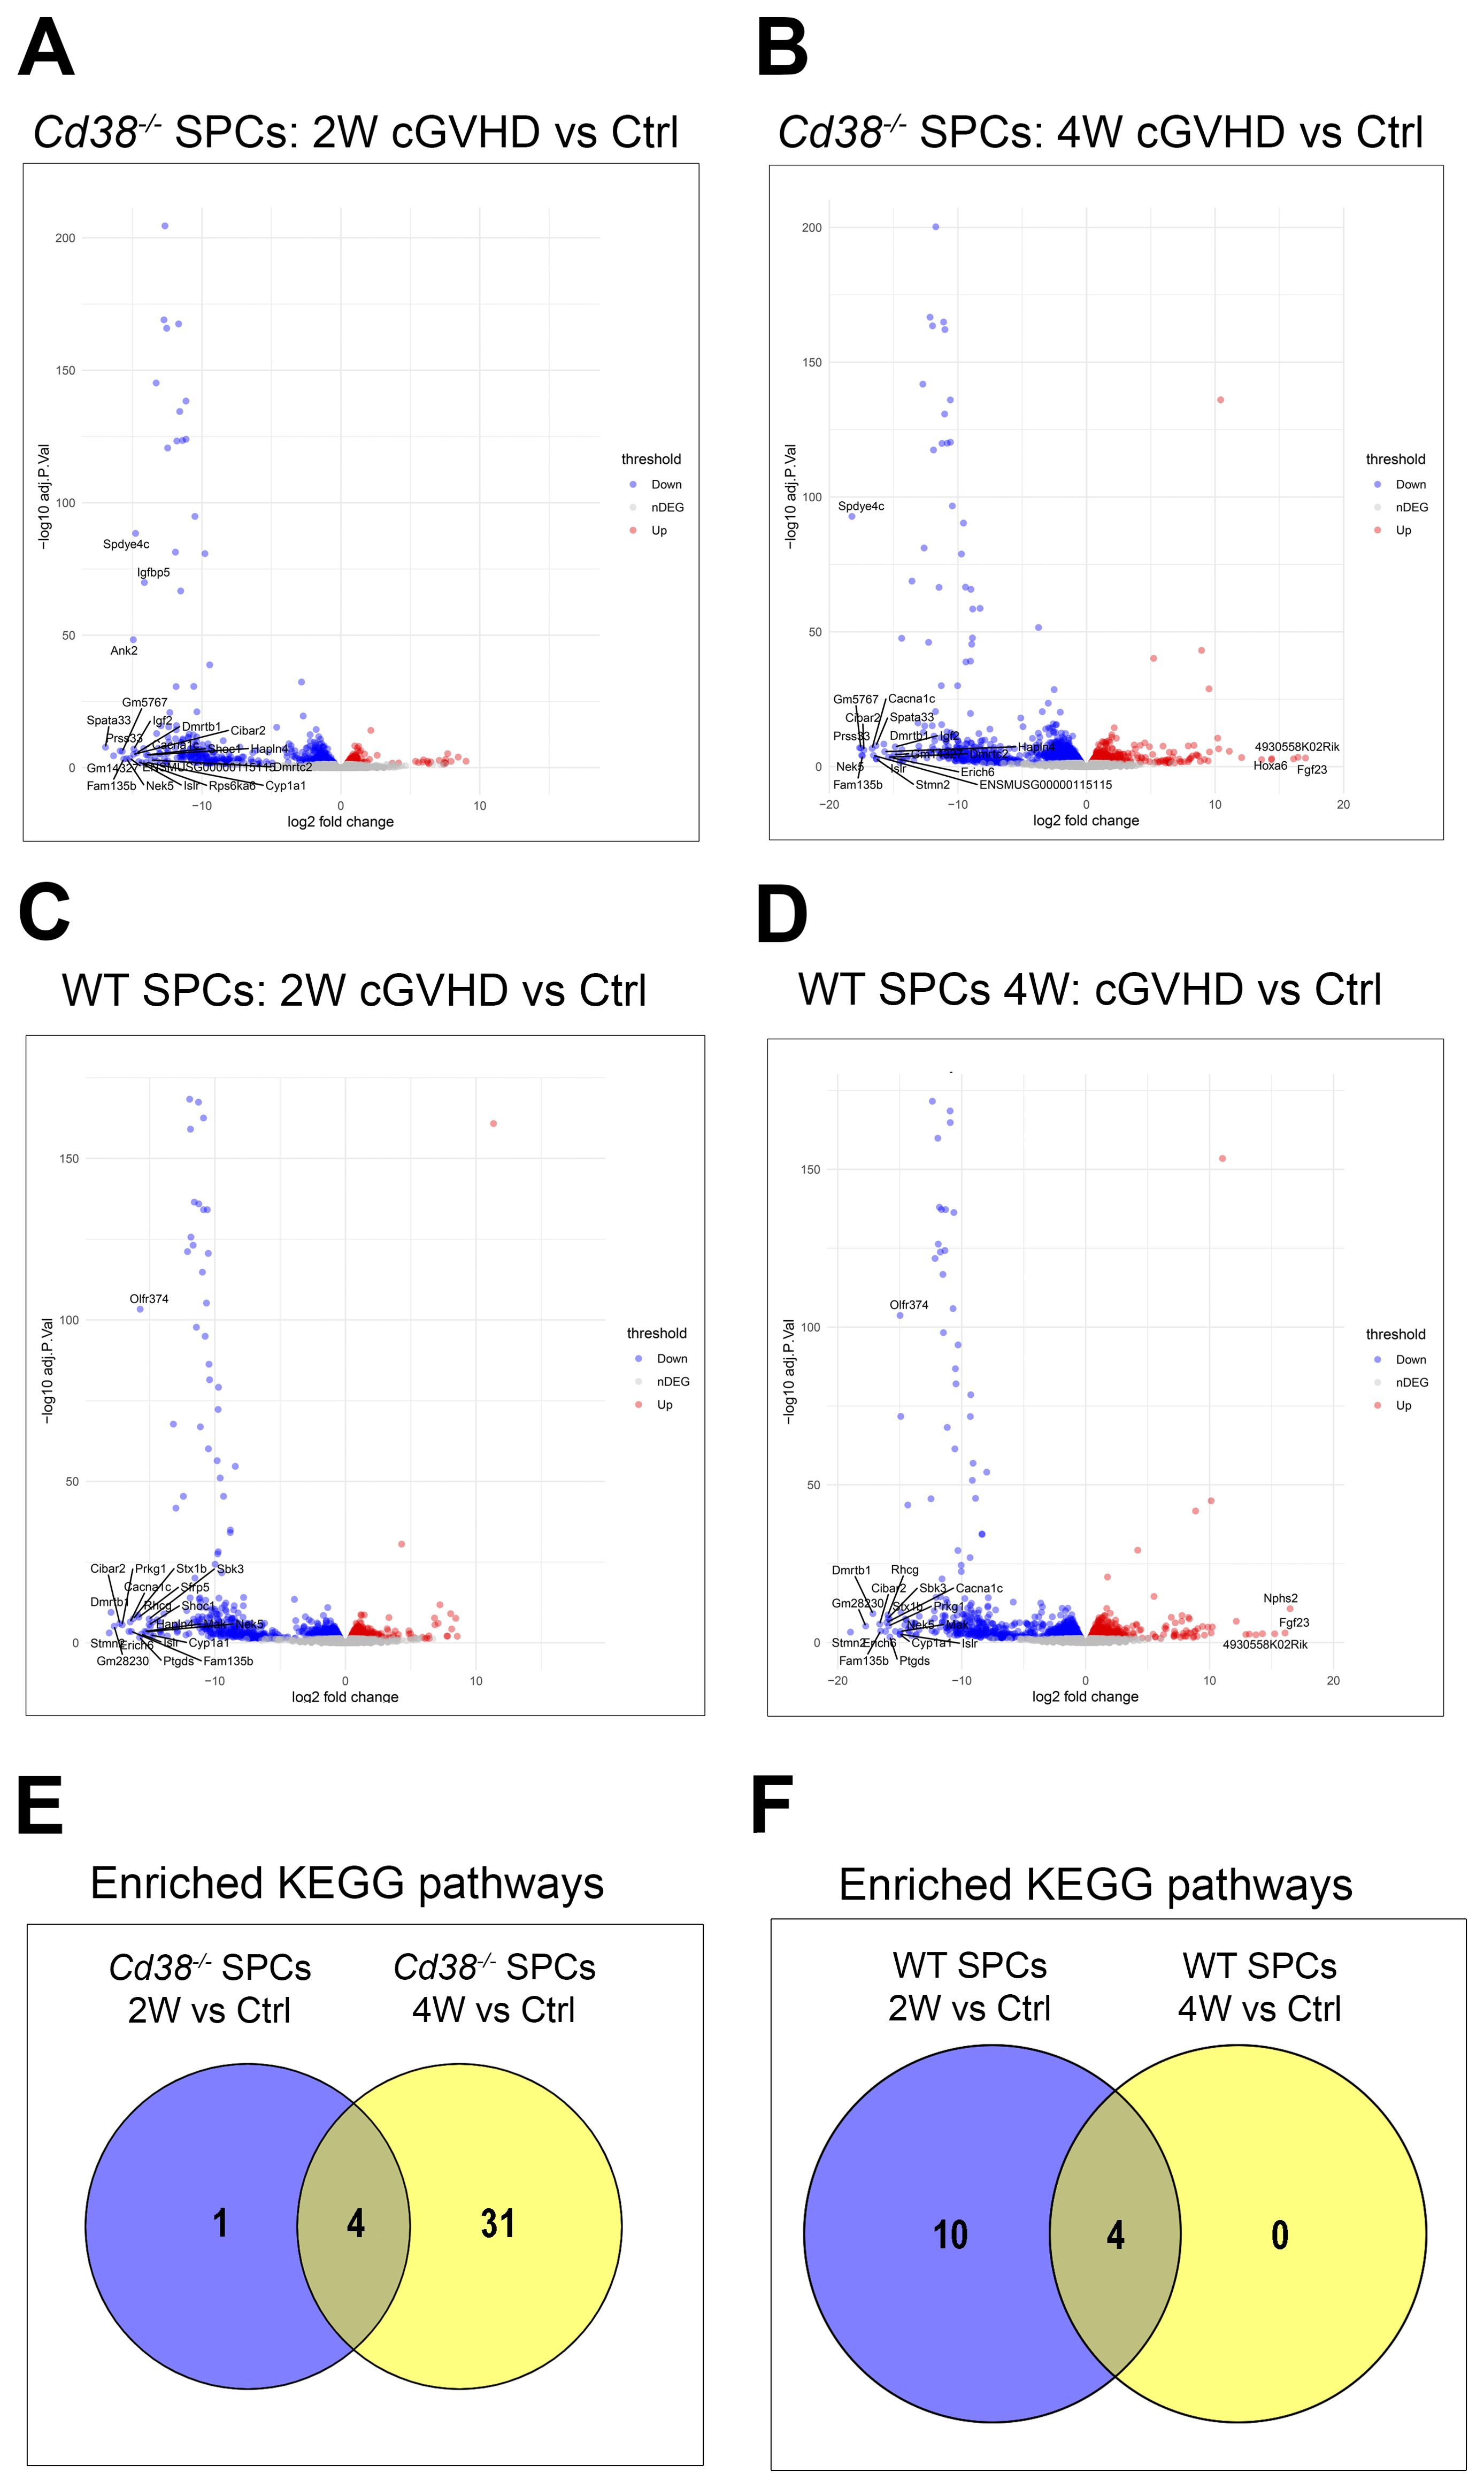
Figure 9. (A) Volcano plot of the DEGs upregulated (red circles), and downregulated (blue circles) in Cd38-/- spleen cells 2 weeks after the bm12 cell transfer vs Control spleen cells from healthy untreated mice. (B) Volcano plot of the DEGs upregulated (red circles), and downregulated (blue circles) in Cd38-/- spleen cells 4 weeks after the bm12 cell transfer vs Control spleen cells from healthy untreated mice. (C) Volcano plots of the DEGs upregulated (red circles), and downregulated (blue circles) in WT spleen cells 2 weeks after the bm12 cell transfer vs Control spleen cells from healthy untreated mice. (D) Volcano plots of the DEGs upregulated (red circles), and downregulated (blue circles) in WT spleen cells 4 weeks after the bm12 cell transfer vs Control spleen cells from healthy untreated mice. (E) Venn diagram showing the number of shared and unique enriched KEGGs for the indicated comparatives. (F) Venn diagram showing the number of shared and unique enriched KEGGs for the indicated comparatives.
5 KEGG pathways were enriched in Cd38-/- spleen cells 2 weeks after the adoptive transfer relative to control cells (Supplementary Table S22). The number of enriched KEGG pathways increased up to 36 at 4 weeks (Supplementary Table S23). Venn diagrams showed that 4 pathways were shared by these comparatives, and 31 pathways showed altered transcriptional activity exclusively at 4 weeks of the adoptive transfer (Figure 9E). 14 KEGG pathways were significantly enriched in WT spleen cells at 2 weeks after the allogeneic challenge relative to controls (Supplementary Table S24), while only 4 KEGG pathways were significantly enriched in WT spleen cells at 4 weeks relative to controls (Supplementary Table S25). These 4 pathways were shared with the 2-week comparative (Figure 9F).
When the enriched KEGG pathways of these 4-time series were matched using UpSet plots, there were not pathways shared by the 4 comparatives or sets (Figure 10A). Five different set intersections are highlighted, a, b, c, d, and e. The intersection a, corresponded to the 5 pathways shared between WT 2-week vs Control and Cd38-/- 4-week vs Control sets (Figure 10B, upper part). The enriched pathways in this intersection, nucleotide metabolism, p53 signaling pathway, and biosynthesis of cofactors, showed significant gene upregulation in WT spleen cells at 2 weeks and not at 4 weeks, while in Cd38-/- spleen cells a relatively lower number of upregulated genes was only observed at 4 weeks of the allogeneic challenge. Moreover, in Cd38-/- spleen cells, the number of downregulated genes was higher than the number of upregulated genes, further suggesting a delayed and defective activation of these pathways relative to WT.
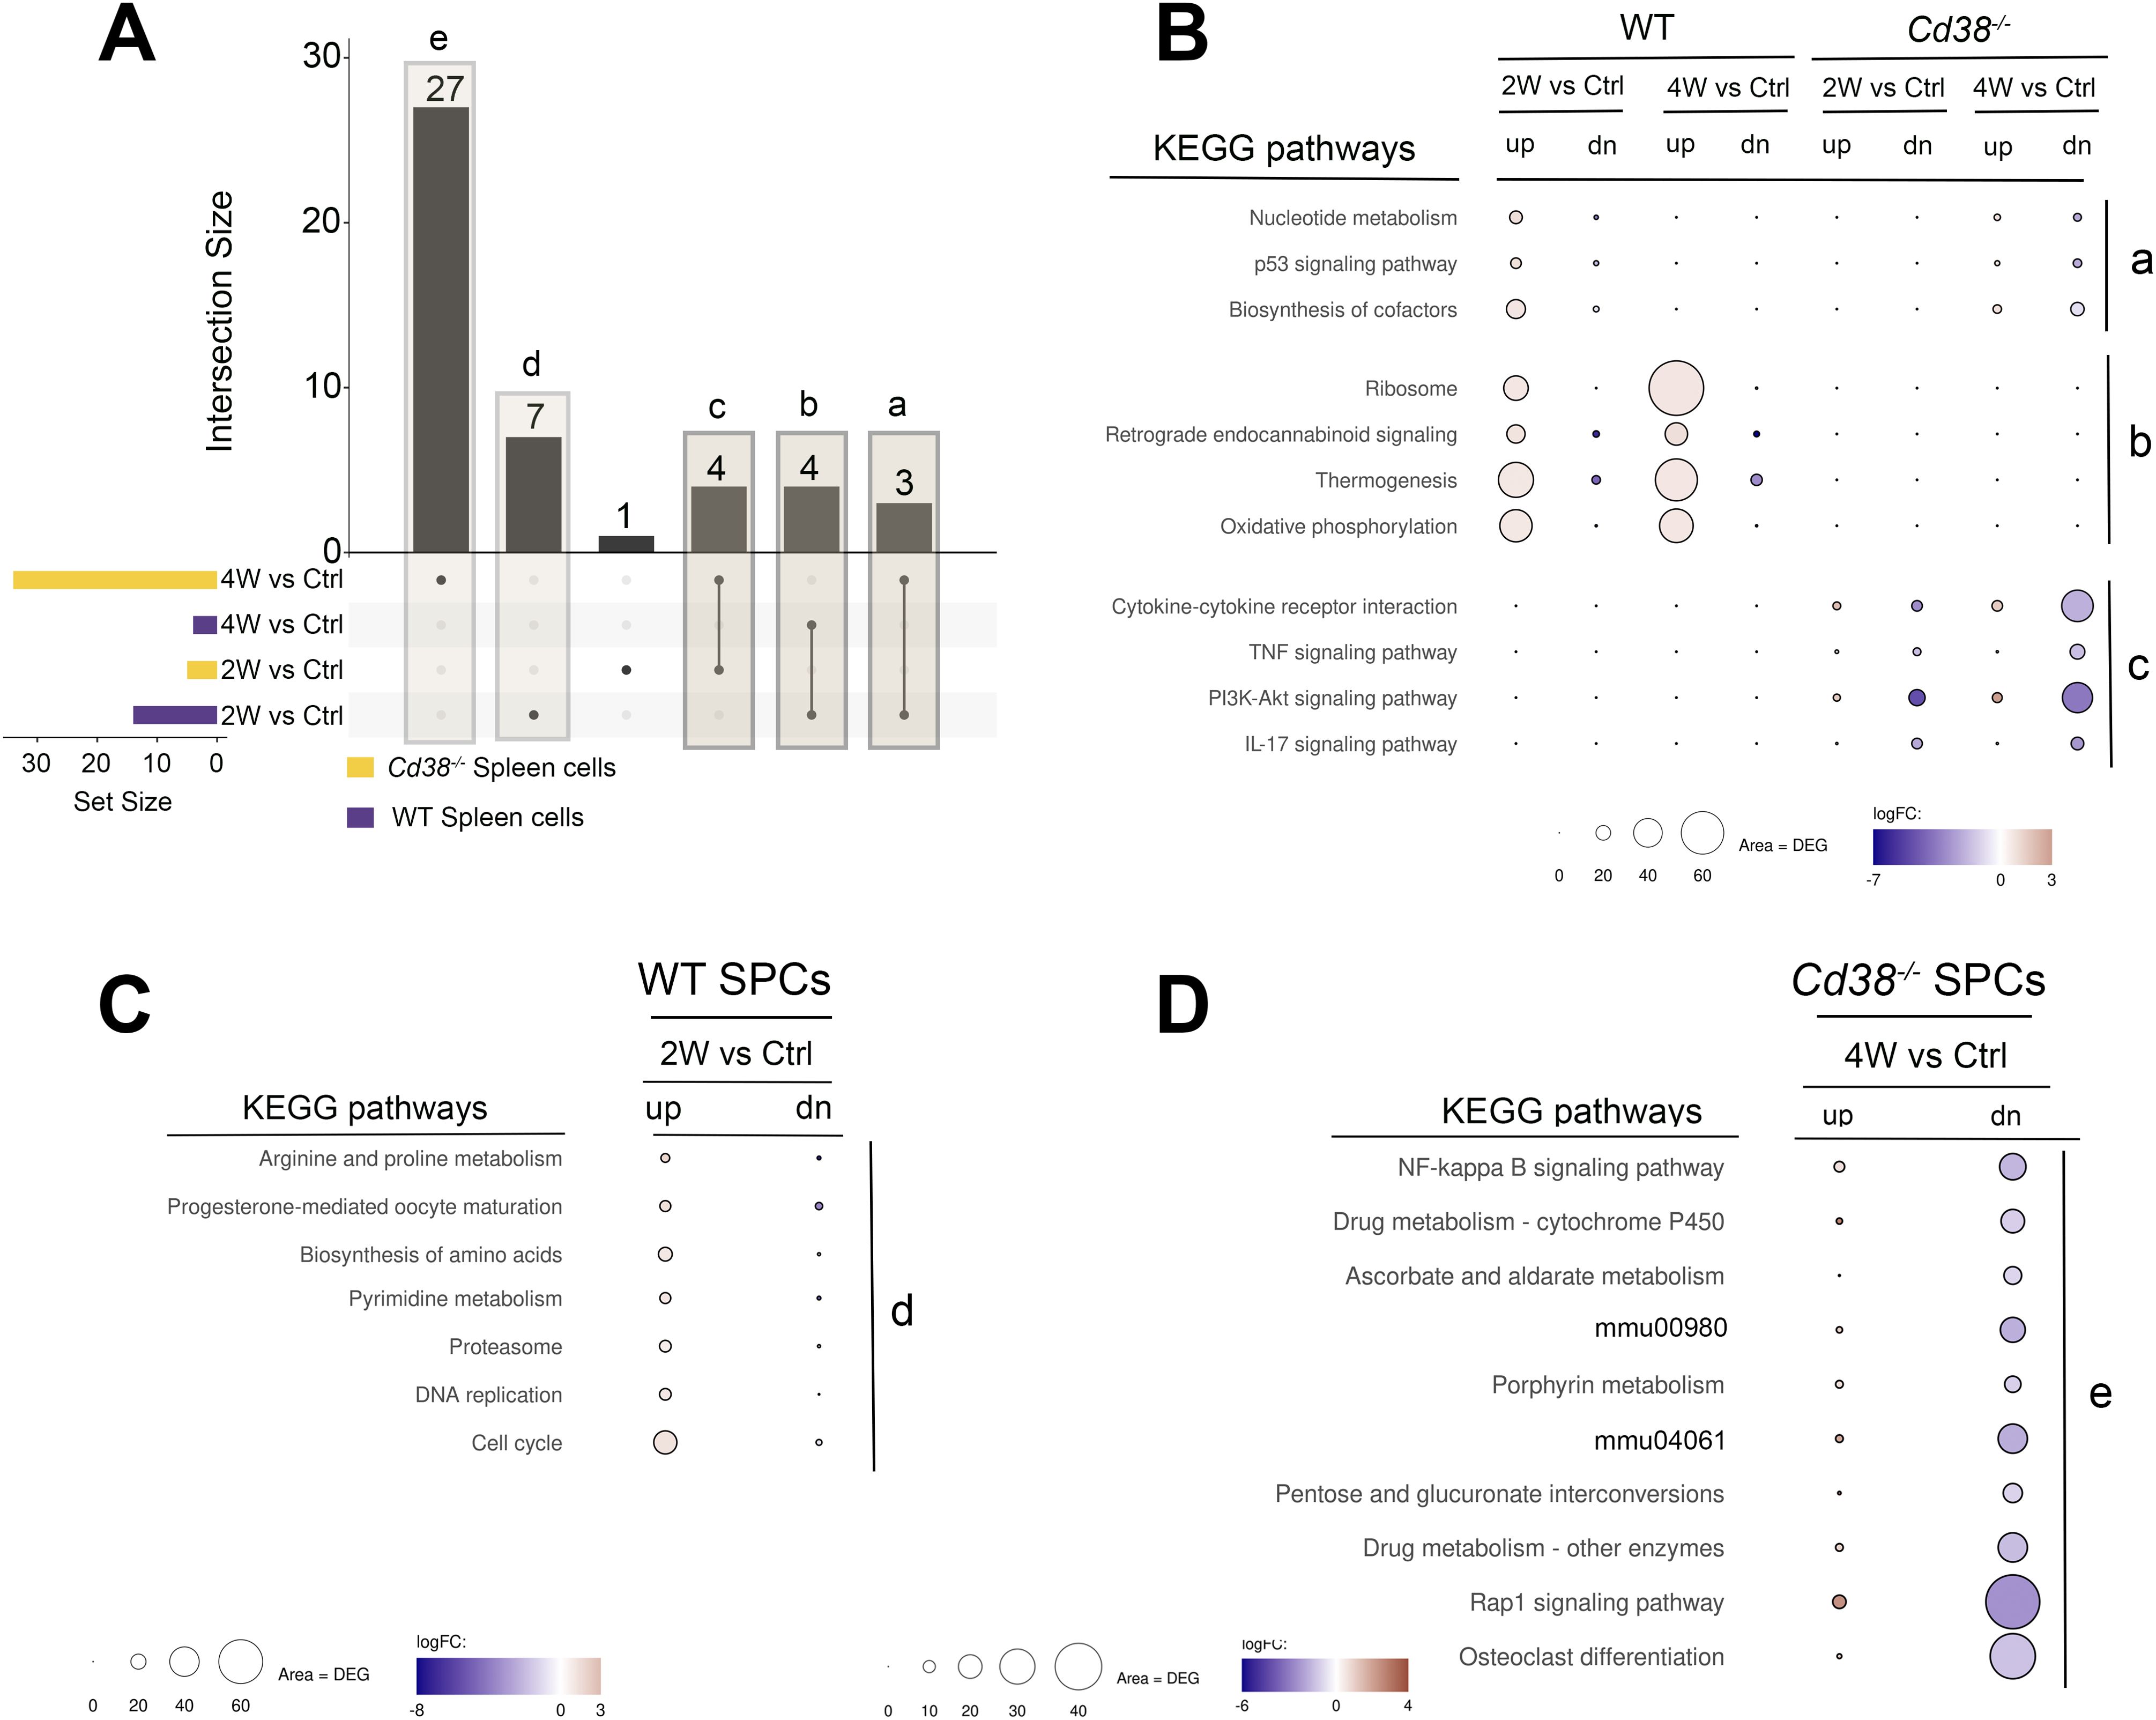
Figure 10. (A) The enriched KEGG pathways of these 4-time series or sets of spleen cells comparatives were matched and visualized using UpSet plots. There were not pathways shared by the 4 sets. Five different set intersections are highlighted, a, b, c, d, and e. (B) Representation of the KEGG pathways corresponding to the a, b, and c intersections. The intersection a, corresponds to the 3 pathways shared between WT 2-week vs Control and Cd38-/- 4-week vs Control sets. The intersection b, corresponds to the 4 pathways shared by the 2 WT sets, and the intersection c corresponds to the 4 pathways shared by the 2 Cd38-/- sets. (C) KEGG pathways corresponding to the intersection d, which are exclusively enriched in the WT 2-week vs Control comparative. (D) The 10-top out of 27 KEGG pathways exclusively enriched in the Cd38-/- 4-week vs Control comparative. The mean log2FC of the upregulated DEGs (red circles) versus the mean log2FC of the downregulated DEGs (blue circles) per pathway were represented graphically. In this representation, the size of the circles was indicative of the number of upregulated or downregulated DEGs, and the intensity of the colors indicate the differences in log2FC.
The intersection b, corresponded to the 4 pathways shared by WT 2-week vs Control and WT 4-week vs Control sets, but not with any of the Cd38-/- sets (Figure 10B, middle). The 4 enriched pathways were ribosome, retrograde endocannabinoid signaling, thermogenesis, and oxidative phosphorylation, and showed larger numbers of upregulated genes than downregulated genes at the two sets, in particular at 4-week vs Control set, which was indicative of a long-lasting activation of these pathways in WT spleen cells.
The intersection c corresponded to the 4 pathways shared by the two Cd38-/- sets, which included cytokine cytokine-receptor interaction, and the TNF, PI3K-Akt, and IL-17 signaling pathways (Figure 10B, bottom). Closer examination of the DEGs associated with these terms showed that there were higher numbers of downregulated genes than upregulated genes, in particular at 4 weeks after the initiation of the allogeneic challenge, phenomenon that was not observed in WT spleen cells.
The intersection d corresponded to the 7 KEGG pathways, which were only enriched in the WT 2-week vs control set (Figure 10A). As shown in Figure 10C, this intersection included pathways involved in cell proliferation such as cell cycle, DNA replication, pyrimidine metabolism, and nucleotide metabolism, and pathways involved in protein synthesis and degradation such as biosynthesis of amino acids and proteasome. Regarding the p53 signaling pathway, there was not increased expression of the cyclin-dependent kinase inhibitors Cdkn1a, and Cdkn2a, which are the inhibitors most commonly expressed by senescent cells (Supplementary Table S24).
The intersection e corresponded to the 27 enriched KEGG pathways exclusive to the Cd38-/- 4-week vs control set (Figure 10A). The top-10 pathways are shown in Figure 10D. All these pathways comprised a larger number of downregulated genes than upregulated genes, which may be indicative of inhibition of these pathways rather than activation.
Overall, the time series results showed long-lasting downregulated expression of key signaling pathways in cGVHD Cd38-/- spleen cells relative to control healthy spleen cells from non-treated mice, while in cGVHD WT spleen cells there was an initial increase in transcriptomic activity related with proliferation and a long-lasting transcriptional activity in energy-related metabolic pathways, including oxidative phosphorylation and thermogenesis.
In this study RNA sequencing was used to analyze the transcriptome of PECs and spleen cells from Cd38-/- and WT B6 mice at 2 and 4 weeks of the induction of the cGVHD lupus-like disease, and of PECs and spleen cells from healthy untreated WT and Cd38-/- mice used as controls. Comparative analysis of these transcriptomes identified a number of pathways associated with the distinct immune and inflammatory response elicited in Cd38-/- vs WT mice by the transfer of allogeneic bm12 cells, which may be indicative of the transcriptomic differences between the severe lupus disease developed in WT mice versus the milder lupus disease developed in Cd38-/- mice (18). Another major finding is that the massive transcriptomic reprogramming induced by the allogeneic challenge involves genes related with mitochondria metabolism (oxidative phosphorylation, thermogenesis), with regulated cell death (autophagy, pyroptosis, apoptosis), and with inflammatory reactions elicited by mitochondrial DAMPs (cGAS-STING signaling, inflammasome signaling, senescence), which are indicative of mitochondrial dysfunction (95).
Moreover, we have identified in PECs a distinct transcriptomic profile of purinergic receptors and ectoenzymes involved in the metabolism of the purines in the extracellular space, which were differentially expressed in Cd38-/- PECs and spleen cells relative to their WT counterparts upon cGVHD induction. Extracellular ATP may function as a DAMP upon binding to cognate receptors expressed on myeloid cells, such as purinergic receptors P2RY2 and P2RX7 (96, 97). The induction of P2ry2 expression upon bm12 CD4+ T cell transfer in Cd38-/- PECs was significantly lower than in WT PECs. The purinergic receptor P2Y2 binds ATP and stimulates chemotaxis of various cells including macrophages, neutrophils, eosinophils, and others, and global P2Y2 knockout mice exhibit impaired myeloid cell chemotaxis and are protected in various models of acute inflammation (75, 96). Likewise, P2ry12 increased expression was short-lived in Cd38-/- PECs, while sustained in WT PECs. Its activation induces rapid chemotaxis in response to tissue injury (75), and plays a critical role in the regulation of Th17 differentiation and EAE pathogenesis (98). Within the purinergic receptor family, P2ry6 and P2ry13 are the most strongly upregulated genes in WT PECs, and to a lesser extent in Cd38-/- PECS upon cGVHD induction. P2RY13 is highly expressed in spleen, lymph nodes and bone marrow, is structurally related to P2RY12 sharing a high affinity for ADP (99), and P2RY13-mediated signaling protects against metabolic dysfunctions associated with obesity (100). P2RY6 protein responds to extracellular UPD, which acts as an “eat-me” signal for P2Y6R, and performs its response through phospholipase C signaling pathway triggering IP3, which then induces a steady accumulation of intracellular Ca2+ levels (101), and may also participate in the regulation of inflammation (102–105). On the other hand, the adoptive-transfer-dependent upregulation of P2rx4, and P2rx7 expression seemed to be more stable and interconnected with various signaling pathways such as Ca2+-mediated signals (Figure 3B), and NLRP3 activation. On the same line, P2RX1 and P2RX4 localized to the immune synapse close to mitochondria, and trigger a localized Ca2+ influx that stimulates OXPHOS and propagates TCR-induced signaling, culminating in cytokine secretion and T cell proliferation (106). In our study, we have shown that in PECs, the differential expression of 11 purinergic receptors genes in response to an allogeneic challenge, may constitute a transcriptomic signature that discriminate between severe lupus and mild lupus disease. Moreover, most of these receptors seem to be downregulated in cGVHD spleen cells relative to control cells, highlighting the importance of the purinergic receptors signaling in the peritoneal cavity, where a significant proportion of inflammatory Ly6Chi monocytes are present in cGVHD WT mice relative to cGVHD Cd38-/- mice.
P2RX7 is a bifunctional receptor for extracellular ATP that, depending on the level of activation, forms a cation-selective channel or a large conductance nonselective pore. P2X7 has a strong pro-apoptotic activity but can also support growth (107). Extracellular NAD+ induces the ATP-independent activation of P2X7 in murine T cells via ADP-ribosylation of P2X7 catalyzed by ART2.2 (108). P2X7R activation by ART2.2 triggers calcium flux, phosphatidylserine exposure, L-selectin (CD62L) shedding, loss of the mitochondrial membrane potential and pore formation, resulting in cell death (108). In the cGVHD lupus model Art2b, which encodes ART2.2, is upregulated in WT PECs, and to a lesser extent in Cd38-/- PECs. Art2a encodes ART2.1, which in C57BL/6 mice is considered a pseudogene, because a polymorphism creates a premature stop codon at position 161 that produces a truncated protein that is not functional (109). P2RX7 also has a substantial role in the expansion, metabolic reprogramming and effector functions of CD8+ memory T cells (110).
Nlrp3 encodes NLRP3, which forms inflammasome complexes to activate Capase-1, which in turn cleaves pro-IL1β and pro-IL-18, allowing their secretion as mature IL-1β and IL-18 and the consequent induction of inflammation. Il1b and the other two components of the inflammasome, Pycard, and Casp1 were also overexpressed in WT PECs upon the allogeneic challenge. Moreover, P2rx7, Trpm2, and Tlr4 were upregulated, which are genes encoding potential activators of the NLRP3-inflammasome complex (86, 87). On the basis of studies in mouse macrophages, activation of the NLRP3 inflammasome is thought to require two signals. The first signal can be provided by TLR stimulation and triggers the synthesis of pro-IL-1β and NLRP3. The second signal can be mediated by stimulation of P2RX7 by ATP resulting in K+ efflux, Ca2+ influx, and other signals that activate the inflammasome (75). ATP released from dying cancer cells activate P2X7 receptors on DCs leading to activation of the NLRP3 inflammasome, IL-1β release and priming of IFN-γ-producing tumor antigen-specific CD8+ T cells (97). Therefore, inflammasome activation can establish a link between the innate (inflammatory) and the acquired (cognate) immune responses, because IL-1β produced by DCs is required for the priming of T cells (97). Whether this mechanism is operative in the cGVHD lupus model, where donor bm12 CD4+ T cells activated by host MHC II provide cognate help for host B cells to initiate lupus (17, 22), requires further investigation.
The cGAS-STING signaling pathway is known to trigger type I IFN responses after free cytosolic DNA binds to the cytoplasmic dsDNA sensor cGAS leading to the production of a second messenger cGAMP, which binds to and activates STING, resulting in downstream TBK1 activation, and increased type I IFN production (111). In this study, WT PECs showed a strong and persistent increase in the gene expression of Cgas, and a number of downstream ISGs associated with the in vivo type I IFN response, while in Cd38-/- PECs increased expression of these genes peaked at 2 weeks, with a strong decline at 4 weeks after the allogeneic challenge. Any DNA released or leaked from the nucleus and mitochondria into the cytoplasm might trigger the cGAS-STING pathway (112). Alternatively, Ifi-204 protein, which is another cytosolic DNA sensor, which its gene is strongly upregulated in WT PECs after cGVHD induction, may mediate type I IFN induction via recruiting STING (90, 91). IFI16, the human orthologous of Ifi-204, is a SLE autoantigen that bind neutrophil extracellular traps and elicits anti-IFI16 auto-antibodies (113).
In contrast, gene expression of Tlr9, another DNA sensor that stimulates type I IFN, was downregulated in both WT and Cd38-/- PECs. Recently it has been reported that CD38 can inhibit extracellular cGAMP activity through its direct binding (114). The authors speculated that given the fact that CD38 exists in two opposite configurations on the cell membrane, facing either the extracellular or the intracellular environment (115), part of the decoy activity of CD38 toward cGAMP may occur in the intracellular space (114), where the cGAMP concentration is in the micromolar range (116). In this scenario, in cells that highly express CD38 such as B cells, intracellular CD38 may regulate STING activation.
In the bm12-cGVHD lupus model, apoptosis is one of the most significant enriched KEGG pathways shown in WT PECs at both time points, and in Cd38-/- PECs 2 weeks after the allogeneic challenge. Accumulated apoptotic-derived molecules, including self-DNA, may serve as autoantigens, and drive autoantibody production. Alternatively, another mode of cell death, ferroptosis, which was also an enriched KEG pathway in WT PECs, could contribute to the release of autoantigens, including dsDNA, providing additional stimuli to autoreactive B cells and pDCs to produce autoantibodies and type I IFNs, respectively. In this sense, STING regulates CD4+ T cell and B cell responses in the cGVHD lupus model (117). Given that the transferred bm12-CD4+ T cells were STING sufficient, these data further support the role for Ag-presenting, cell-intrinsic STING in the induction of adaptive immune responses to dying cell-derived antigens (117). STING mediates lupus via the activation of conventional dendritic cell maturation and plasmacytoid dendritic cell differentiation in the Fcgr2b-deficient lupus mice (118), and increased cGAS expression and cGAMP in a proportion of SLE patients indicated that the cGAS/cGAMP pathway may play a role in disease expression (119). Moreover, apoptosis-derived membrane vesicles drive the cGAS-STING pathway and enhance type I IFN production in SLE (120).
Regarding the mechanisms that regulate the SASP phenotype in cellular senescence, NAD+ metabolism supports metabolic changes and signaling that leads to the activation of NF-κB signaling and the expression of genes associated with high pro-inflammatory SASP by upregulating NAMPT expression (81). In our study, Nampt gene expression is upregulated in the same samples were cellular senescence and NOD-like receptor signaling pathways are enriched. NAMPT can exert a number of functions as an extracellular cytokine, including activation of the NLRP3 inflammasome (121) and premature senescence in endothelial cells (122). Whether any of these mechanisms are activated in the cGVHD lupus model requires further investigation. Genetic deletion of CD38 rescued age-related changes in gene expression in ovaries of middle-aged mice, particularly genes related to the senescence pathway (123). Cellular senescence in immune cells, also known as immunosenescence (124, 125), often occurs in the setting of chronic inflammation. In this sense, it has been shown that CD38 is a transcriptional target of the nuclear receptor liver X receptor (LXR), which is activated by derivatives of cholesterol metabolism (126), and recently published data describes a mechanism whereby cholesterol promotes macrophage senescence by NAD+ depletion via LXR/CD38 signaling (127). Moreover, inflammatory mediators and LXRs synergistically induced the expression of the multifunctional protein CD38 (128).
Our data on enrichment in metabolic pathways related with energy expenditure suggests that in Cd38-/- spleen cells the adoptive transfer of bm12 cells into the peritoneal cavity causes a down-regulation of genes involved in the regulation of the glycolytic pathway without an apparent increase in the genes involved in oxidative phosphorylation. In contrast, in WT spleen cells there was a strong metabolic reprogramming 2 weeks upon the adoptive transfer of bm12 cells relative to that in WT spleen cells from healthy untreated mice, with increased expression of genes involved in the generation of ATP via oxidative phosphorylation.
The kinetics of this metabolic reprogramming differs in Cd38-/- PECs. Thus, the time series results show strong upregulation of genes related with oxidative phosphorylation in Cd38-/- PECs 2 weeks after the adoptive transfer of bm12 cells, which is no longer maintained at 4 weeks. In contrast, in WT PECs upregulation of oxidative phosphorylation-related genes is more robust and sustained in time, with many transcripts associated with the conversion of NADH to NAD+ and ADP to ATP. To note is that upregulation of genes related with glycolysis/gluconeogenesis and fatty acid oxidation is exclusively found in WT PECs at 2 weeks, which strongly suggests that alternative sources of energy are used by WT PECs upon allogeneic challenge.
We have previously shown in cGVHD lupus model the failure of host Cd38-/- B cells to fully activate and expand CD38-sufficient donor bm12 T cells (18). In this setting the cognate interaction occurs between CD4+ T cells that are CD38 sufficient, and B cells, which are CD38 negative, and unable of providing a strong signal to maintain and expand the donor T cells, and recipient B cells. It is likely that fully expansion of these cells, as it occurs in WT cGVHD mice, would require an initial fast source of energy provided by aerobic glycolysis and fatty acid oxidation, followed by a prolonged energy expenditure, which could be provided mainly via oxidative phosphorylation. In this sense, Yin et al. (129) reported that glycolysis and mitochondrial oxidative metabolism are elevated in cells from SLE patients as well as in mouse models of disease, including the cGVHD model. Moreover, inhibitors of these pathways currently in the clinic—2-deoxy-d-glucose (2DG) and metformin—normalize T cell metabolism and decrease markers of SLE in animal models as well as in cells from SLE patients (93).
On the other hand, there is now evidence that many aspects of metabolic regulation are cell-specific (93, 130), and in our study some of the results obtained in the time series comparatives may reflect the expansion of monocytes/macrophages in both the peritoneal cavity (this study), and in the spleen in response to the allogeneic challenge (18). Alternatively, metabolic reprogramming may occur as consequence of inflammatory and host defense mechanisms (131). Thus, in our system TLR and NOD-like receptor agonists and cytokines can influence the balance of anabolic to catabolic metabolism leading to mitochondrial biogenesis and increased oxidative phosphorylation, which may be critical for the long-term survival of immune cells and the persistence vs resolution of the autoimmune and inflammatory process (131).
In this study RNA sequencing was used to analyze the transcriptome of PECs and spleen cells from Cd38-/- and WT B6 mice at 2 and 4 weeks after the induction of the cGVHD lupus-like disease, and of PECs and spleen cells from healthy untreated WT and Cd38-/- mice used as controls (see Figure 11 for a summary of the major findings). Comparative analysis of these transcriptomes identified a number of pathways associated with the distinct immune and inflammatory response elicited in Cd38-/- vs WT mice by the transfer of allogeneic bm12 cells. For most of them, these transcriptomic profiles were tissue-specific, and the transcriptional activity was more intense and long-lasting in WT than in Cd38-/- samples. Thus, in PECs we have identified a distinct transcriptomic profile of purinergic receptors and purinergic ectoenzymes involved in the purines metabolism in the extracellular space. The transcriptomic expression profile of these receptors and ectoenzymes seemed to be coordinately expressed with genes of cGAS-STING signaling pathway and a number of interferon stimulated genes, two hallmarks in the lupus pathology. A second purinergic receptor transcriptomic profile showed an apparent coordinated gene expression of the components of the NLRP3 inflammasome with its potential activators. These processes were transcriptionally less active in Cd38-/- PECs than in WT PECs upon the allogeneic challenge, and to our knowledge, it has not been previously reported in the literature. In this study we have also shown evidence of a distinct enrichment in pathways signatures that define processes such as Ca2+ ion homeostasis, cell division, phagosome, autophagy, senescence, cytokine/cytokine receptor interactions, Th17 and Th1/Th2 cell differentiation in Cd38-/- vs WT samples, which reflected the milder inflammatory and autoimmune response elicited in Cd38-/- mice relative to WT counterparts in response to the allogeneic challenge (Figure 11). Last, we have shown a strong metabolic reprogramming toward oxidative phosphorylation in spleen cells and PECs from WT cGVHD mice, which it may reflect an increased cellular demand for oxygen consumption, in contrast to spleen cells, and PECs from Cd38-/- cGVHD mice, which showed a short-lived metabolic effect at transcriptomic level. Although we have not done functional experiments to corroborate these findings, our data are in agreement with other authors that have suggested that chronic T cell activation by autoantigens (as it occurs in SLE) is supported by oxidative phosphorylation, whereas aerobic glycolysis supports acute activation induced by foreign antigens, or in vitro supra-physiological TCR stimulation (93).
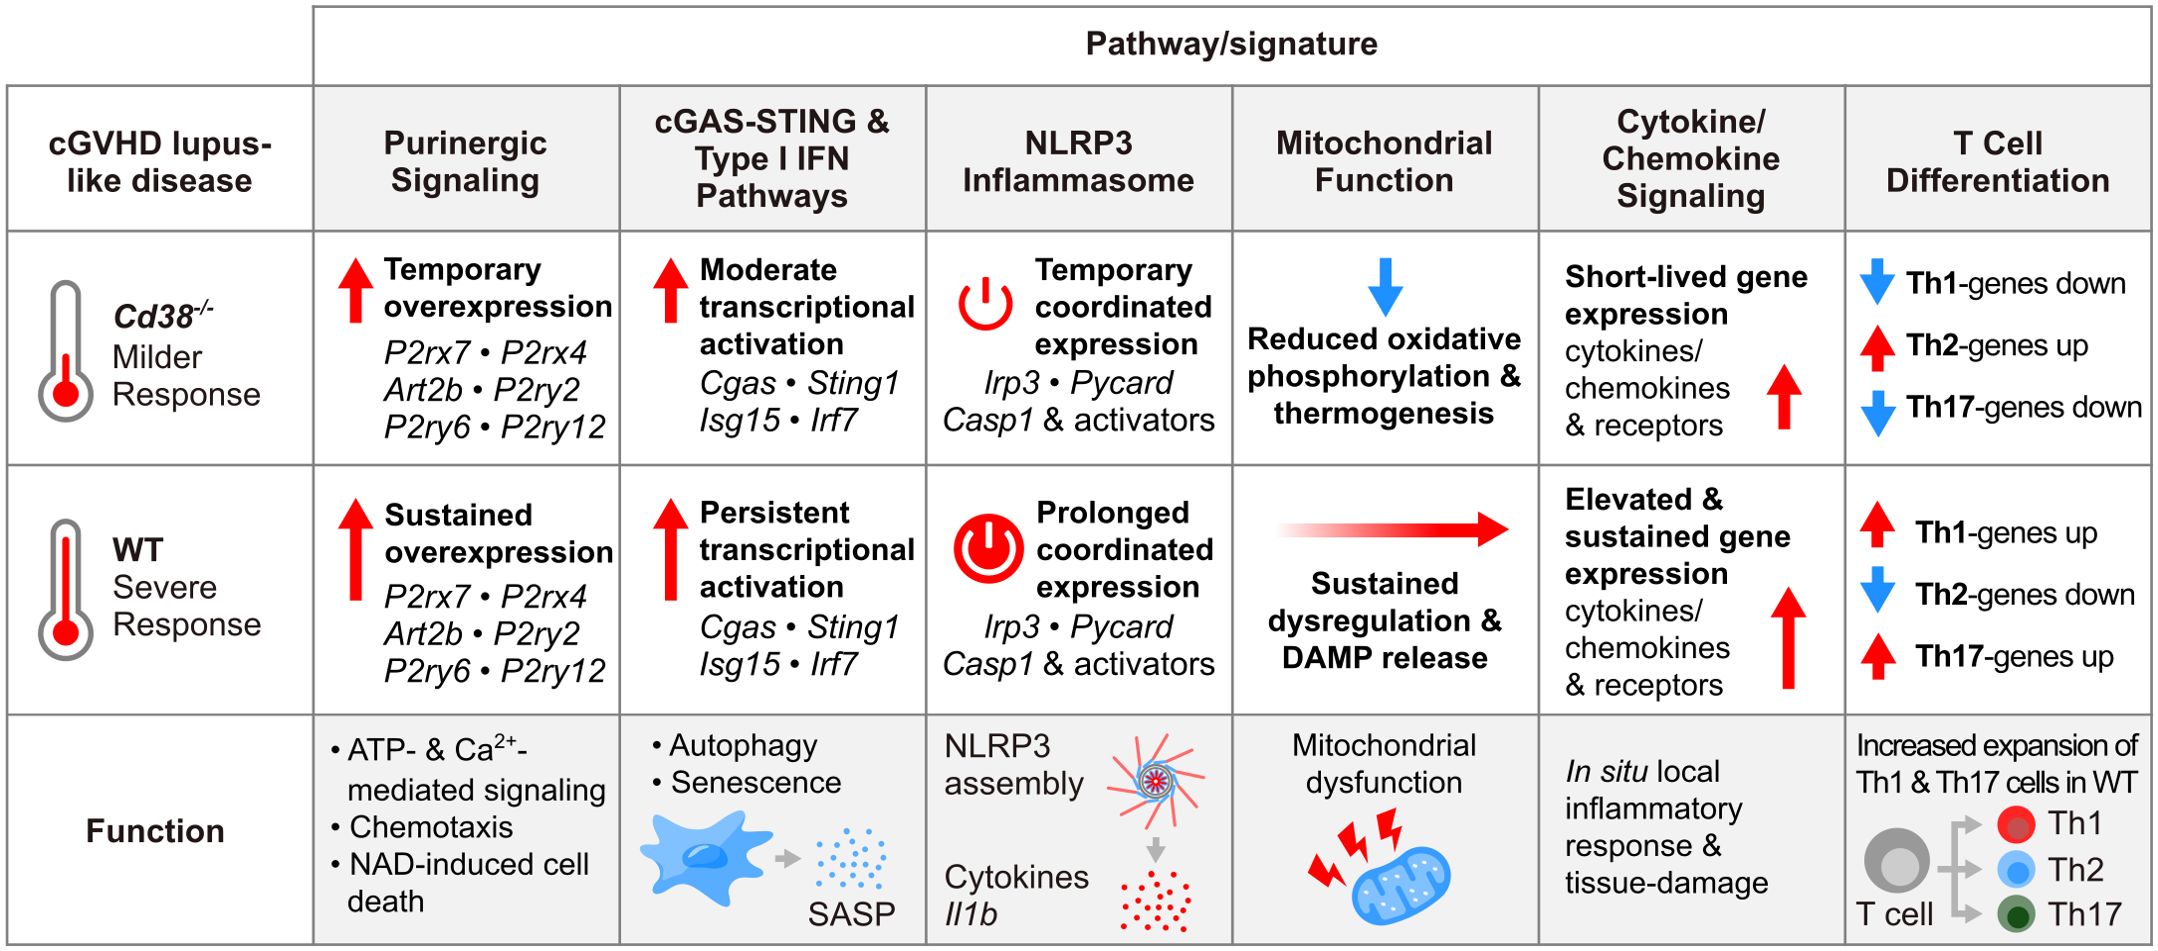
Figure 11. Summary of the major findings in this study, and associated functions. Design: NorArte Visual Science (https//norarte.es).
The data presented in the study are available at SRA, BioProject PRJNA1118233.
The animal study was approved by Bioethical Committee of the Consejo Superior de Investigaciones Científicas (CSIC). The study was conducted in accordance with the local legislation and institutional requirements.
MZ: Conceptualization, Data curation, Formal analysis, Funding acquisition, Investigation, Methodology, Project administration, Writing – review & editing, Writing – original draft, Supervision. LT-C: Formal analysis, Software, Visualization, Methodology, Data curation, Writing – review & editing. FG-G: Formal analysis, Software, Visualization, Methodology, Data curation, Writing – review & editing. EA-L: Formal analysis, Software, Visualization, Methodology, Data curation, Writing – review & editing. AB-dJ: Formal analysis, Investigation, Methodology, Data curation, Writing – review & editing. LC-A: Formal analysis, Investigation, Methodology, Data curation, Writing – review & editing. MP-C: Data curation, Formal analysis, Methodology, Writing – review & editing. ÁM-B: Investigation, Methodology, Writing – review & editing. MD-P: Investigation, Methodology, Writing – review & editing. MB-S: Investigation, Methodology, Writing – review & editing. SP-C: Investigation, Methodology, Writing – review & editing. NB-I: Investigation, Methodology, Writing – review & editing. AA: Project administration, Resources, Supervision, Writing – review & editing, Funding acquisition. A-CA-M: Methodology, Writing – review & editing, Resources. FM: Funding acquisition, Project administration, Supervision, Writing – review & editing, Resources. EZ: Investigation, Methodology, Visualization, Writing – review & editing. RM: Conceptualization, Funding acquisition, Project administration, Resources, Supervision, Writing – review & editing. JS: Conceptualization, Data curation, Formal analysis, Funding acquisition, Investigation, Methodology, Project administration, Resources, Supervision, Writing – original draft, Writing – review & editing, Visualization.
The author(s) declare that financial support was received for the research, authorship, and/or publication of this article. JS and MZ received financial support through SAF2017–89801-R. RM received financial support through: Projects: PID2020-119567RB-I00 and PID2023-151370OB-100. AA and FM received financial support through: PID2019-110487RB-C21 and PID2022-138400OB-C21.The stay of MD-P in Sancho’s lab was supported by a 1-year postdoctoral fellowship (Reference No. 502492) from the Consejo Nacional de Ciencia y Tecnología (CONACYT) of México. LT-C was recipient of a postdoctoral fellowship from the regional Andalusian Government (POSTDOC_21 _00394). FG-G was recipient of a contract “Garantía Juvenil, Programa Operativo Empleo Juvenil 2014-20, Fondo Social Europeo, Junta de Andalucía and Ministerio de Trabajo”. LC-A was recipient of a contract co-financed by the Spanish Ministry of Science and Innovation with funds from the European Union “NextGenerationEU” (PRTR-C17.I1) and the Regional Ministry of University, Research and Innovation of the Autonomous Community of Andalusia within the framework of the “Biotechnology Plan applied to Health”.
We thank to Dr. Frances E. Lund (Department of Microbiology, University of Alabama at Birmingham (UAB), AL, USA), for the gift of the Cd38-/- mice. We thank to Clara Sánchez-González, Jorge Huertas-Latorre, Francisco Ferrer-Gamarra and Lina María Orrego-Zapata for their contribution with the mice experimental procedures at the IPBLN-CSIC Animal Facility, Granada, Spain. We thank to Dr. Alberto Cornet-Gomez, Parasitology Department, UGR and Maria Torres-Sáez, Biotechnology Grade Graduate at UGR, for their contribution to the success of preliminary experiments. We thank to Dr. Juan Francisco López-Giménez, IPBLN-CSIC, Granada, Spain for his support to the mice experiments. FGG, present address, Computational Biomedicine Laboratory, Principe Felipe Research Center (CIPF), Valencia, Spain. We thank to NorArte Visual Science for the design of Figure 11. We thank to Kanehisa laboratories for the permission to reproduce KEGG map04621 (Figure 7A).
The authors declare that the research was conducted in the absence of any commercial or financial relationships that could be construed as a potential conflict of interest.
All claims expressed in this article are solely those of the authors and do not necessarily represent those of their affiliated organizations, or those of the publisher, the editors and the reviewers. Any product that may be evaluated in this article, or claim that may be made by its manufacturer, is not guaranteed or endorsed by the publisher.
The Supplementary Material for this article can be found online at: https://www.frontiersin.org/articles/10.3389/fimmu.2025.1441981/full#supplementary-material
1. Tsokos GC. The immunology of systemic lupus erythematosus. Nat Immunol. (2024) 25(8):1332–43. doi: 10.1038/s41590-024-01898-7
2. Alcocer-Varela J, Alarcon-Riquelme M, Laffon A, Sanchez-Madrid F, Alarcon-Segovia D. Activation markers on peripheral blood T cells from patients with active or inactive systemic lupus erythematosus. Correlation with proliferative responses and production of il-2. J Autoimmun. (1991) 4:935–45. doi: 10.1016/0896-8411(91)90056-I
3. Erkeller-Yuksel FM, Lydyard PM, Isenberg DA. Lack of nk cells in lupus patients with renal involvement. Lupus. (1997) 6:708–12. doi: 10.1177/096120339700600905
4. Pavon EJ, Munoz P, Navarro MD, Raya-Alvarez E, Callejas-Rubio JL, Navarro-Pelayo F, et al. Increased association of cd38 with lipid rafts in T cells from patients with systemic lupus erythematosus and in activated normal T cells. Mol Immunol. (2006) 43:1029–39. doi: 10.1016/j.molimm.2005.05.002
5. Pavon EJ, Zumaquero E, Rosal-Vela A, Khoo KM, Cerezo-Wallis D, Garcia-Rodriguez S, et al. Increased cd38 expression in T cells and circulating anti-cd38 igg autoantibodies differentially correlate with distinct cytokine profiles and disease activity in systemic lupus erythematosus patients. Cytokine. (2013) 62:232–43. doi: 10.1016/j.cyto.2013.02.023
6. Hogan KA, Chini CCS, Chini EN. The multi-faceted ecto-enzyme cd38: roles in immunomodulation, cancer, aging, and metabolic diseases. Front Immunol. (2019) 10:1187. doi: 10.3389/fimmu.2019.01187
7. Katsuyama E, Suarez-Fueyo A, Bradley SJ, Mizui M, Marin AV, Mulki L, et al. The cd38/nad/sirtuin1/ezh2 axis mitigates cytotoxic cd8 t cell function and identifies patients with sle prone to infections. Cell Rep. (2020) 30:112–23.e4. doi: 10.1016/j.celrep.2019.12.014
8. Chen PM, Katsuyama E, Satyam A, Li H, Rubio J, Jung S, et al. Cd38 reduces mitochondrial fitness and cytotoxic T cell response against viral infection in lupus patients by suppressing mitophagy. Sci Adv. (2022) 8:eabo4271. doi: 10.1126/sciadv.abo4271
9. Cole S, Walsh A, Yin X, Wechalekar MD, Smith MD, Proudman SM, et al. Integrative analysis reveals cd38 as a therapeutic target for plasma cell-rich pre-disease and established rheumatoid arthritis and systemic lupus erythematosus. Arthritis Res Ther. (2018) 20:85. doi: 10.1186/s13075-018-1578-z
10. Ostendorf L, Burns M, Durek P, Heinz GA, Heinrich F, Garantziotis P, et al. Targeting cd38 with daratumumab in refractory systemic lupus erythematosus. N Engl J Med. (2020) 383:1149–55. doi: 10.1056/NEJMoa2023325
11. Roccatello D, Fenoglio R, Caniggia I, Kamgaing J, Naretto C, Cecchi I, et al. Daratumumab monotherapy for refractory lupus nephritis. Nat Med. (2023) 29:2041–7. doi: 10.1038/s41591-023-02479-1
12. Lindblom J, Toro-Domínguez D, Carnero-Montoro E, Beretta L, Borghi MO, Castillo J, et al. Distinct gene dysregulation patterns herald precision medicine potentiality in systemic lupus erythematosus. J Autoimmun. (2023) 136:103025. doi: 10.1016/j.jaut.2023.103025
13. Garcia-Rodriguez S, Rosal-Vela A, Botta D, Cumba Garcia LM, Zumaquero E, Prados-Maniviesa V, et al. Cd38 promotes pristane-induced chronic inflammation and increases susceptibility to experimental lupus by an apoptosis-driven and trpm2-dependent mechanism. Sci Rep. (2018) 8:3357. doi: 10.1038/s41598-018-21337-6
14. Burlock B, Richardson G, García-Rodríguez S, Guerrero S, Zubiaur M, Sancho J. The role of cd38 on the function of regulatory B cells in a murine model of lupus. Int J Mol Sci. (2018) 19:2906. doi: 10.3390/ijms19102906
15. Viegas MS, Silva T, Monteiro MM, do Carmo A, Martins TC. Knocking out of cd38 accelerates development of a lupus-like disease in lpr mice. Rheumatology. (2011) 50:1569–77. doi: 10.1093/rheumatology/ker178
16. Dominguez-Pantoja M, Lopez-Herrera G, Romero-Ramirez H, Santos-Argumedo L, Chavez-Rueda AK, Hernandez-Cueto A, et al. Cd38 protein deficiency induces autoimmune characteristics and its activation enhances il-10 production by regulatory B cells. Scandinavian J Immunol. (2018) 87:e12664. doi: 10.1111/sji.12664
17. Morris SC, Cheek RL, Cohen PL, Eisenberg RA. Autoantibodies in chronic graft versus host result from cognate T-B interactions. J Exp Med. (1990) 171:503–17. doi: 10.1084/jem.171.2.503
18. Martinez-Blanco A, Dominguez-Pantoja M, Botia-Sanchez M, Perez-Cabrera S, Bello-Iglesias N, Carrillo-Rodriguez P, et al. Cd38 deficiency ameliorates chronic graft-versus-host disease murine lupus via a B-cell-dependent mechanism. Front Immunol. (2021) 12:713697. doi: 10.3389/fimmu.2021.713697
19. Amici SA, Young NA, Narvaez-Miranda J, Jablonski KA, Arcos J, Rosas L, et al. Cd38 is robustly induced in human macrophages and monocytes in inflammatory conditions. Front Immunol. (2018) 9:1593. doi: 10.3389/fimmu.2018.01593
20. Chen Z, Xu Q, Shou Z. Application of cd38 monoclonal antibody in kidney disease. Front Immunol. (2024) 15:1382977. doi: 10.3389/fimmu.2024.1382977
21. Percie du Sert N, Hurst V, Ahluwalia A, Alam S, Avey MT, Baker M, et al. The arrive guidelines 2.0: updated guidelines for reporting animal research. PloS Biol. (2020) 18:e3000410. doi: 10.1371/journal.pbio.3000410
22. Eisenberg RA, Via CS. T cells, murine chronic graft-versus-host disease and autoimmunity. J Autoimmun. (2012) 39:240–7. doi: 10.1016/j.jaut.2012.05.017
23. Morris SC, Cohen PL, Eisenberg RA. Experimental induction of systemic lupus erythematosus by recognition of foreign ia. Clin Immunol Immunopathology. (1990) 57:263–73. doi: 10.1016/0090-1229(90)90040-W
24. Klarquist J, Janssen EM. The bm12 inducible model of systemic lupus erythematosus (Sle) in C57bl/6 mice. J visualized experiments: JoVE. (2015) 105):e53319. doi: 10.3791/53319
25. Crawford JD, Wang H, Trejo-Zambrano D, Cimbro R, Talbot CC Jr., Thomas MA, et al. The xist lncrna is a sex-specific reservoir of tlr7 ligands in sle. JCI Insight. (2023) 8:e169344. doi: 10.1172/jci.insight.169344
26. Zubiaur M, Izquierdo M, Terhorst C, Malavasi F, Sancho J. Cd38 ligation results in activation of the raf-1/mitogen-activated protein kinase and the cd3-zeta/zeta-associated protein-70 signaling pathways in jurkat T lymphocytes. J Immunol. (1997) 159:193–205. doi: 10.4049/jimmunol.159.1.193
27. Andres-Leon E, Nunez-Torres R, Rojas AM. Miarma-seq: A comprehensive tool for mirna, mrna and circrna analysis. Sci Rep. (2016) 6:25749. doi: 10.1038/srep25749
28. Andres-Leon E, Rojas AM. Miarma-seq, a comprehensive pipeline for the simultaneous study and integration of mirna and mrna expression data. Methods. (2019) 152:31–40. doi: 10.1016/j.ymeth.2018.09.002
29. Kainth P, Andrews B. Illuminating transcription pathways using fluorescent reporter genes and yeast functional genomics. Transcription. (2010) 1:76–80. doi: 10.4161/trns.1.2.12328
31. Dobin A, Davis CA, Schlesinger F, Drenkow J, Zaleski C, Jha S, et al. Star: ultrafast universal rna-seq aligner. Bioinformatics. (2013) 29:15–21. doi: 10.1093/bioinformatics/bts635
32. Liao Y, Smyth GK, Shi W. Featurecounts: an efficient general purpose program for assigning sequence reads to genomic features. Bioinformatics. (2014) 30:923–30. doi: 10.1093/bioinformatics/btt656
33. Nikolayeva O, Robinson MD. Edger for differential rna-seq and chip-seq analysis: an application to stem cell biology. Methods Mol Biol. (2014) 1150:45–79. doi: 10.1007/978-1-4939-0512-6_3
34. Robinson MD, Oshlack A. A scaling normalization method for differential expression analysis of rna-seq data. Genome Biol. (2010) 11:R25. doi: 10.1186/gb-2010-11-3-r25
35. Reeb PD, Bramardi SJ, Steibel JP. Assessing dissimilarity measures for sample-based hierarchical clustering of rna sequencing data using plasmode datasets. PloS One. (2015) 10:e0132310. doi: 10.1371/journal.pone.0132310
36. Ritchie ME, Phipson B, Wu D, Hu Y, Law CW, Shi W, et al. Limma powers differential expression analyses for rna-sequencing and microarray studies. Nucleic Acids Res. (2015) 43:e47. doi: 10.1093/nar/gkv007
37. Wu T, Hu E, Xu S, Chen M, Guo P, Dai Z, et al. Clusterprofiler 4.0: A universal enrichment tool for interpreting omics data. Innovation (Camb). (2021) 2:100141. doi: 10.1016/j.xinn.2021.100141
38. Supek F, Bosnjak M, Skunca N, Smuc T. Revigo summarizes and visualizes long lists of gene ontology terms. PloS One. (2011) 6:e21800. doi: 10.1371/journal.pone.0021800
39. Kanehisa M, Sato Y, Kawashima M, Furumichi M, Tanabe M. Kegg as a reference resource for gene and protein annotation. Nucleic Acids Res. (2016) 44:D457–62. doi: 10.1093/nar/gkv1070
40. Oliveros JC, Venny. An interactive tool for comparing lists with venn’s diagrams (2015). Available online at: https://bioinfogp.cnb.csic.es/tools/venny/index.html (Accessed May 15, 2024).
41. Cockayne DA, Muchamuel T, Grimaldi JC, Muller-Steffner H, Randall TD, Lund FE, et al. Mice deficient for the ecto-nicotinamide adenine dinucleotide glycohydrolase cd38 exhibit altered humoral immune responses. Blood. (1998) 92:1324–33. doi: 10.1182/blood.V92.4.1324
42. Wei C, Anolik J, Cappione A, Zheng B, Pugh-Bernard A, Brooks J, et al. A new population of cells lacking expression of cd27 represents a notable component of the B cell memory compartment in systemic lupus erythematosus. J Immunol. (2007) 178:6624–33. doi: 10.4049/jimmunol.178.10.6624
43. Xiong H, Tang Z, Xu Y, Shi Z, Guo Z, Liu X, et al. Cd19(+)Cd24(High)Cd27(+) B cell and interleukin 35 as potential biomarkers of disease activity in systemic lupus erythematosus patients. Adv Rheumatol. (2022) 62:48. doi: 10.1186/s42358-022-00279-8
44. Yang DH, Chang DM, Lai JH, Lin FH, Chen CH. Significantly higher percentage of circulating cd27(High) plasma cells in systemic lupus erythematosus patients with infection than with disease flare-up. Yonsei Med J. (2010) 51:924–31. doi: 10.3349/ymj.2010.51.6.924
45. Zhang L, Du F, Jin Q, Sun L, Wang B, Tan Z, et al. Identification and characterization of cd8(+) cd27(+) cxcr3(-) T cell dysregulation and progression-associated biomarkers in systemic lupus erythematosus. Adv Sci (Weinh). (2023) 10:e2300123. doi: 10.1002/advs.202300123
46. Zhang W, Wang YF, Hu FL, Lu FA, Wu T, Feng YL, et al. Dysfunction of cd27(+)Igd(+) B cells correlates with aggravated systemic lupus erythematosus. Clin Rheumatol. (2022) 41:1551–9. doi: 10.1007/s10067-022-06051-z
47. Bortoluzzi A, Chighizola CB, Fredi M, Raschi E, Bodio C, Privitera D, et al. The immense study: the interplay between immune and endothelial cells in mediating cardiovascular risk in systemic lupus erythematosus. Front Immunol. (2020) 11:572876. doi: 10.3389/fimmu.2020.572876
48. Kaneko H, Saito K, Hashimoto H, Yagita H, Okumura K, Azuma M. Preferential elimination of cd28+ T cells in systemic lupus erythematosus (Sle) and the relation with activation-induced apoptosis. Clin Exp Immunol. (2003) 106:218–29. doi: 10.1046/j.1365-2249.1996.d01-849.x
49. Kosmaczewska A, Ciszak L, Stosio M, Szteblich A, Madej M, Frydecka I, et al. Cd4(+)Cd28(Null) T cells are expanded in moderately active systemic lupus erythematosus and secrete pro-inflammatory interferon gamma, depending on the disease activity index. Lupus. (2020) 29:705–14. doi: 10.1177/0961203320917749
50. López P, Rodríguez-Carrio J, Martínez-Zapico A, Caminal-Montero L, Suarez A. Senescent profile of angiogenic T cells from systemic lupus erythematosus patients. J Leukocyte Biol. (2015) 99:405–12. doi: 10.1189/jlb.5HI0215-042R
51. Vremec D, Pooley J, Hochrein H, Wu L, Shortman K. Cd4 and cd8 expression by dendritic cell subtypes in mouse thymus and spleen1. J Immunol. (2000) 164:2978–86. doi: 10.4049/jimmunol.164.6.2978
52. Ghosn EE, Cassado AA, Govoni GR, Fukuhara T, Yang Y, Monack DM, et al. Two physically, functionally, and developmentally distinct peritoneal macrophage subsets. Proc Natl Acad Sci United States America. (2010) 107:2568–73. doi: 10.1073/pnas.0915000107
53. Cassado Ados A, D’Império Lima MR, Bortoluci KR. Revisiting mouse peritoneal macrophages: heterogeneity, development, and function. Front Immunol. (2015) 6:225. doi: 10.3389/fimmu.2015.00225
54. Bruzzone S, Franco L, Guida L, Zocchi E, Contini P, Bisso A, et al. A self-restricted cd38-connexin 43 cross-talk affects nad+ and cyclic adp-ribose metabolism and regulates intracellular calcium in 3t3 fibroblasts. J Biol Chem. (2001) 276:48300–8. doi: 10.1074/jbc.M107308200
55. Galione A, Morgan AJ, Arredouani A, Davis LC, Rietdorf K, Ruas M, et al. Naadp as an intracellular messenger regulating lysosomal calcium-release channels. Biochem Soc Trans. (2010) 38:1424–31. doi: 10.1042/BST0381424
56. Partida-Sanchez S, Cockayne DA, Monard S, Jacobson EL, Oppenheimer N, Garvy B, et al. Cyclic adp-ribose production by cd38 regulates intracellular calcium release, extracellular calcium influx and chemotaxis in neutrophils and is required for bacterial clearance in vivo. Nat Med. (2001) 7:1209–16. doi: 10.1038/nm1101-1209
57. Partida-Sánchez S, Iribarren P, Moreno-García ME, Gao J-L, Murphy PM, Oppenheimer N, et al. Chemotaxis and calcium responses of phagocytes to formyl peptide receptor ligands is differentially regulated by cyclic adp ribose. J Immunol. (2004) 172:1896–906. doi: 10.4049/jimmunol.172.3.1896
58. Zocchi E, Daga A, Usai C, Franco L, Guida L, Bruzzone S, et al. Expression of cd38 increases intracellular calcium concentration and reduces doubling time in hela and 3t3 cells. J Biol Chem. (1998) 273:8017–24. doi: 10.1074/jbc.273.14.8017
59. Guse AH, Gil Montoya DC, Diercks B-P. Mechanisms and functions of calcium microdomains produced by orai channels, D-myo-inositol 1,4,5-trisphosphate receptors, or ryanodine receptors. Pharmacol Ther. (2021) 223:107804. doi: 10.1016/j.pharmthera.2021.107804
60. Jin D, Liu HX, Hirai H, Torashima T, Nagai T, Lopatina O, et al. Cd38 is critical for social behaviour by regulating oxytocin secretion. Nature. (2007) 446:41–5. doi: 10.1038/nature05526
61. Zhong J, Amina S, Liang M, Akther S, Yuhi T, Nishimura T, et al. Cyclic adp-ribose and heat regulate oxytocin release via cd38 and trpm2 in the hypothalamus during social or psychological stress in mice. Front Neurosci. (2016) 10:304. doi: 10.3389/fnins.2016.00304
62. Ivanov II, McKenzie BS, Zhou L, Tadokoro CE, Lepelley A, Lafaille JJ, et al. The orphan nuclear receptor rorγt directs the differentiation program of proinflammatory il-17+ T helper cells. Cell. (2006) 126:1121–33. doi: 10.1016/j.cell.2006.07.035
63. Wang R, Campbell S, Amir M, Mosure SA, Bassette MA, Eliason A, et al. Genetic and pharmacological inhibition of the nuclear receptor rorα Regulates th17 driven inflammatory disorders. Nat Commun. (2021) 12:76. doi: 10.1038/s41467-020-20385-9
64. Parham C, Chirica M, Timans J, Vaisberg E, Travis M, Cheung J, et al. A receptor for the heterodimeric cytokine il-23 is composed of il-12rβ1 and a novel cytokine receptor subunit, il-23r1. J Immunol. (2002) 168:5699–708. doi: 10.4049/jimmunol.168.11.5699
65. Mus AMC, Cornelissen F, Asmawidjaja PS, van Hamburg JP, Boon L, Hendriks RW, et al. Interleukin-23 promotes th17 differentiation by inhibiting T-bet and foxp3 and is required for elevation of interleukin-22, but not interleukin-21, in autoimmune experimental arthritis. Arthritis Rheumatism. (2010) 62:1043–50. doi: 10.1002/art.27336
66. Wines BD, Yap ML, Powell MS, Tan P-S, Ko KK, Orlowski E, et al. Distinctive expression of interleukin-23 receptor subunits on human th17 and Γδ T cells. Immunol Cell Biol. (2017) 95:272–9. doi: 10.1038/icb.2016.93
67. Wilson NJ, Boniface K, Chan JR, McKenzie BS, Blumenschein WM, Mattson JD, et al. Development, cytokine profile and function of human interleukin 17–producing helper T cells. Nat Immunol. (2007) 8:950–7. doi: 10.1038/ni1497
68. Muranski P, Borman Zachary A, Kerkar Sid P, Klebanoff Christopher A, Ji Y, Sanchez-Perez L, et al. Th17 cells are long lived and retain a stem cell-like molecular signature. Immunity. (2011) 35:972–85. doi: 10.1016/j.immuni.2011.09.019
69. Di Micco R, Krizhanovsky V, Baker D, d’Adda di Fagagna F. Cellular senescence in ageing: from mechanisms to therapeutic opportunities. Nat Rev Mol Cell Biol. (2021) 22:75–95. doi: 10.1038/s41580-020-00314-w
70. Laberge RM, Sun Y, Orjalo AV, Patil CK, Freund A, Zhou L, et al. Mtor regulates the pro-tumorigenic senescence-associated secretory phenotype by promoting il1a translation. Nat Cell Biol. (2015) 17:1049–61. doi: 10.1038/ncb3195
71. Massagué J, Blain SW, Lo RS. Tgfβ Signaling in growth control, cancer, and heritable disorders. Cell. (2000) 103:295–309. doi: 10.1016/S0092-8674(00)00121-5
72. Wade Harper J, Adami GR, Wei N, Keyomarsi K, Elledge SJ. The P21 cdk-interacting protein cip1 is a potent inhibitor of G1 cyclin-dependent kinases. Cell. (1993) 75:805–16. doi: 10.1016/0092-8674(93)90499-G
73. Kumari R, Jat P. Mechanisms of cellular senescence: cell cycle arrest and senescence associated secretory phenotype. Front Cell Dev Biol. (2021) 9:645593. doi: 10.3389/fcell.2021.645593
74. Huang W, Hickson LJ, Eirin A, Kirkland JL, Lerman LO. Cellular senescence: the good, the bad and the unknown. Nat Rev Nephrol. (2022) 18:611–27. doi: 10.1038/s41581-022-00601-z
75. Linden J, Koch-Nolte F, Dahl G. Purine release, metabolism, and signaling in the inflammatory response. Annu Rev Immunol. (2019) 37:325–47. doi: 10.1146/annurev-immunol-051116-052406
76. Jenks SA, Cashman KS, Zumaquero E, Marigorta UM, Patel AV, Wang X, et al. Distinct effector B cells induced by unregulated toll-like receptor 7 contribute to pathogenic responses in systemic lupus erythematosus. Immunity. (2018) 49:725–39 e6. doi: 10.1016/j.immuni.2018.08.015
77. Brock VJ, Wolf IMA, Er-Lukowiak M, Lory N, Stähler T, Woelk L-M, et al. P2x4 and P2x7 are essential players in basal T cell activity and ca2+ Signaling milliseconds after T cell activation. Sci Adv. (2022) 8:eabl9770. doi: 10.1126/sciadv.abl9770
78. Brock VJ, Lory NC, Möckl F, Birus M, Stähler T, Woelk L-M, et al. Time-resolved role of P2x4 and P2x7 during cd8+ T cell activation. Front Immunol. (2024) 15:1258119. doi: 10.3389/fimmu.2024.1258119
79. Hubert S, Rissiek B, Klages K, Huehn J, Sparwasser T, Haag F, et al. Extracellular nad+ Shapes the foxp3+ Regulatory T cell compartment through the art2-P2x7 pathway. J Exp Med. (2010) 207:2561–8. doi: 10.1084/jem.20091154
80. Conway JR, Lex A, Gehlenborg N. Upsetr: an R package for the visualization of intersecting sets and their properties. Bioinformatics. (2017) 33:2938–40. doi: 10.1093/bioinformatics/btx364
81. Nacarelli T, Lau L, Fukumoto T, Zundell J, Fatkhutdinov N, Wu S, et al. Nad+ Metabolism governs the proinflammatory senescence-associated secretome. Nat Cell Biol. (2019) 21:397–407. doi: 10.1038/s41556-019-0287-4
82. Acosta JC, Banito A, Wuestefeld T, Georgilis A, Janich P, Morton JP, et al. A complex secretory program orchestrated by the inflammasome controls paracrine senescence. Nat Cell Biol. (2013) 15:978–90. doi: 10.1038/ncb2784
83. Saleh M. The machinery of nod-like receptors: refining the paths to immunity and cell death. Immunol Rev. (2011) 243:235–46. doi: 10.1111/j.1600-065X.2011.01045.x
84. Saxena M, Yeretssian G. Nod-like receptors: master regulators of inflammation and cancer. Front Immunol. (2014) 5:327. doi: 10.3389/fimmu.2014.00327
85. Chou W-C, Jha S, Linhoff MW, Ting JPY. The nlr gene family: from discovery to present day. Nat Rev Immunol. (2023) 23:635–54. doi: 10.1038/s41577-023-00849-x
86. Pelegrin P. P2x7 receptor and the nlrp3 inflammasome: partners in crime. Biochem Pharmacol. (2021) 187:114385. doi: 10.1016/j.bcp.2020.114385
87. Zhong Z, Zhai Y, Liang S, Mori Y, Han R, Sutterwala FS, et al. Trpm2 links oxidative stress to nlrp3 inflammasome activation. Nat Commun. (2013) 4:1611. doi: 10.1038/ncomms2608
88. Audrito V, Messana VG, Deaglio S. Nampt and naprt: two metabolic enzymes with key roles in inflammation. Front Oncol. (2020) 10:358. doi: 10.3389/fonc.2020.00358
89. Gerner RR, Klepsch V, Macheiner S, Arnhard K, Adolph TE, Grander C, et al. Nad metabolism fuels human and mouse intestinal inflammation. Gut. (2018) 67:1813–23. doi: 10.1136/gutjnl-2017-314241
90. Unterholzner L, Keating SE, Baran M, Horan KA, Jensen SB, Sharma S, et al. Ifi16 is an innate immune sensor for intracellular DNA. Nat Immunol. (2010) 11:997–1004. doi: 10.1038/ni.1932
91. Jakobsen MR, Bak RO, Andersen A, Berg RK, Jensen SB, Jin T, et al. Ifi16 senses DNA forms of the lentiviral replication cycle and controls hiv-1 replication. Proc Natl Acad Sci. (2013) 110:E4571–E80. doi: 10.1073/pnas.1311669110
92. Monroe KM, Yang Z, Johnson JR, Geng X, Doitsh G, Krogan NJ, et al. Ifi16 DNA sensor is required for death of lymphoid cd4 T cells abortively infected with hiv. Science. (2014) 343:428–32. doi: 10.1126/science.1243640
93. Morel L. Immunometabolism in systemic lupus erythematosus. Nat Rev Rheumatol. (2017) 13:280–90. doi: 10.1038/nrrheum.2017.43
94. Takahashi K, Kozono Y, Waldschmidt TJ, Berthiaume D, Quigg RJ, Baron A, et al. Mouse complement receptors type 1 (Cr1;Cd35) and type 2 (Cr2;Cd21): expression on normal B cell subpopulations and decreased levels during the development of autoimmunity in mrl/lpr mice. J Immunol. (1997) 159:1557–69. doi: 10.4049/jimmunol.159.3.1557
95. Marchi S, Guilbaud E, Tait SWG, Yamazaki T, Galluzzi L. Mitochondrial control of inflammation. Nat Rev Immunol. (2023) 23:159–73. doi: 10.1038/s41577-022-00760-x
96. Elliott MR, Chekeni FB, Trampont PC, Lazarowski ER, Kadl A, Walk SF, et al. Nucleotides released by apoptotic cells act as a find-me signal to promote phagocytic clearance. Nature. (2009) 461:282–6. doi: 10.1038/nature08296
97. Ghiringhelli F, Apetoh L, Tesniere A, Aymeric L, Ma Y, Ortiz C, et al. Activation of the nlrp3 inflammasome in dendritic cells induces il-1β–dependent adaptive immunity against tumors. Nat Med. (2009) 15:1170–8. doi: 10.1038/nm.2028
98. Qin C, Zhou J, Gao Y, Lai W, Yang C, Cai Y, et al. Critical role of P2y12 receptor in regulation of th17 differentiation and experimental autoimmune encephalomyelitis pathogenesis. J Immunol. (2017) 199:72–81. doi: 10.4049/jimmunol.1601549
99. Communi D, Gonzalez NS, Detheux M, Brézillon S, Lannoy V, Parmentier M, et al. Identification of a novel human adp receptor coupled to gi*. J Biol Chem. (2001) 276:41479–85. doi: 10.1074/jbc.M105912200
100. Duparc T, Gore E, Combes G, Beuzelin D, Pires Da Silva J, Bouguetoch V, et al. P2y13 receptor deficiency favors adipose tissue lipolysis and worsens insulin resistance and fatty liver disease. JCI Insight. (2024) 9:e175623. doi: 10.1172/jci.insight.175623
101. Anwar S, Pons V, Rivest S. Microglia purinoceptor P2y6: an emerging therapeutic target in cns diseases. Cells. (2020) 9:1595. doi: 10.3390/cells9071595
102. Nagai J, Balestrieri B, Fanning LB, Kyin T, Cirka H, Lin J, et al. P2y6 signaling in alveolar macrophages prevents leukotriene-dependent type 2 allergic lung inflammation. J Clin Invest. (2019) 129:5169–86. doi: 10.1172/jci129761
103. Li Z, He C, Zhang J, Zhang H, Wei H, Wu S, et al. P2y6 deficiency enhances dendritic cell–mediated th1/th17 differentiation and aggravates experimental autoimmune encephalomyelitis. J Immunol. (2020) 205:387–97. doi: 10.4049/jimmunol.1900916
104. Nagai J, Lin J, Boyce JA. Macrophage P2y6 receptor signaling selectively activates nfatc2 and suppresses allergic lung inflammation. J Immunol. (2022) 209:2293–303. doi: 10.4049/jimmunol.2200452
105. Timmerman R, Zuiderwijk-Sick EA, Bajramovic JJ. P2y6 receptor-mediated signaling amplifies tlr-induced pro-inflammatory responses in microglia. Front Immunol. (2022) 13:967951. doi: 10.3389/fimmu.2022.967951
106. Woehrle T, Yip L, Elkhal A, Sumi Y, Chen Y, Yao Y, et al. Pannexin-1 hemichannel-mediated atp release together with P2x1 and P2x4 receptors regulate T-cell activation at the immune synapse. Blood. (2010) 116:3475–84. doi: 10.1182/blood-2010-04-277707
107. Adinolfi E, Callegari MG, Ferrari D, Bolognesi C, Minelli M, Wieckowski MR, et al. Basal activation of the P2x7 atp receptor elevates mitochondrial calcium and potential, increases cellular atp levels, and promotes serum-independent growth. Mol Biol Cell. (2005) 16:3260–72. doi: 10.1091/mbc.E04-11-1025
108. Seman M, Adriouch S, Scheuplein F, Krebs C, Freese D, Glowacki G, et al. Nad-induced T cell death: adp-ribosylation of cell surface proteins by art2 activates the cytolytic P2x7 purinoceptor. Immunity. (2003) 19:571–82. doi: 10.1016/S1074-7613(03)00266-8
109. Hong S, Brass A, Seman M, Haag F, Koch-Nolte F, Dubyak GR. Basal and inducible expression of the thiol-sensitive art2.1 ecto-adp-ribosyltransferase in myeloid and lymphoid leukocytes. Purinergic Signalling. (2009) 5:369–83. doi: 10.1007/s11302-009-9162-2
110. Borges da Silva H, Peng C, Wang H, Wanhainen KM, Ma C, Lopez S, et al. Sensing of atp via the purinergic receptor P2rx7 promotes cd8(+) trm cell generation by enhancing their sensitivity to the cytokine tgf-B. Immunity. (2020) 53:158–71.e6. doi: 10.1016/j.immuni.2020.06.010
111. Decout A, Katz JD, Venkatraman S, Ablasser A. The cgas-sting pathway as a therapeutic target in inflammatory diseases. Nat Rev Immunol. (2021) 21:548–69. doi: 10.1038/s41577-021-00524-z
112. Chen Q, Sun L, Chen ZJ. Regulation and function of the cgas–sting pathway of cytosolic DNA sensing. Nat Immunol. (2016) 17:1142–9. doi: 10.1038/ni.3558
113. Antiochos B, Trejo-Zambrano D, Fenaroli P, Rosenberg A, Baer A, Garg A, et al. The DNA sensors aim2 and ifi16 are sle autoantigens that bind neutrophil extracellular traps. eLife. (2022) 11:e72103. doi: 10.7554/eLife.72103
114. Cuollo L, Di Cristofano S, Sandomenico A, Iaccarino E, Oliver A, Zingoni A, et al. Cd38 restrains the activity of extracellular cgamp in a model of multiple myeloma. iScience. (2024) 27:109814. doi: 10.1016/j.isci.2024.109814
115. Zhao YJ, Lam CM, Lee HC. The membrane-bound enzyme cd38 exists in two opposing orientations. Sci Signal. (2012) 5:ra67. doi: 10.1126/scisignal.2002700
116. Carozza JA, Cordova AF, Brown JA, AlSaif Y, Bohnert V, Cao X, et al. Enpp1’s regulation of extracellular cgamp is a ubiquitous mechanism of attenuating sting signaling. Proc Natl Acad Sci United States America. (2022) 119:e2119189119. doi: 10.1073/pnas.2119189119
117. Klarquist J, Hennies CM, Lehn MA, Reboulet RA, Feau S, Janssen EM. Sting-mediated DNA sensing promotes antitumor and autoimmune responses to dying cells. J Immunol. (2014) 193:6124–34. doi: 10.4049/jimmunol.1401869
118. Thim-Uam A, Prabakaran T, Tansakul M, Makjaroen J, Wongkongkathep P, Chantaravisoot N, et al. Sting mediates lupus via the activation of conventional dendritic cell maturation and plasmacytoid dendritic cell differentiation. iScience. (2020) 23:101530. doi: 10.1016/j.isci.2020.101530
119. An J, Durcan L, Karr RM, Briggs TA, Rice GI, Teal TH, et al. Expression of cyclic gmp-amp synthase in patients with systemic lupus erythematosus. Arthritis Rheumatol. (2017) 69:800–7. doi: 10.1002/art.40002
120. Kato Y, Park J, Takamatsu H, Konaka H, Aoki W, Aburaya S, et al. Apoptosis-derived membrane vesicles drive the cgas-sting pathway and enhance type I ifn production in systemic lupus erythematosus. Ann rheumatic Dis. (2018) 77:1507–15. doi: 10.1136/annrheumdis-2018-212988
121. Romacho T, Valencia I, Ramos-González M, Vallejo S, López-Esteban M, Lorenzo O, et al. Visfatin/enampt induces endothelial dysfunction in vivo: A role for toll-like receptor 4 and nlrp3 inflammasome. Sci Rep. (2020) 10:5386. doi: 10.1038/s41598-020-62190-w
122. Villalobos LA, Uryga A, Romacho T, Leivas A, Sánchez-Ferrer CF, Erusalimsky JD, et al. Visfatin/nampt induces telomere damage and senescence in human endothelial cells. Int J Cardiol. (2014) 175:573–5. doi: 10.1016/j.ijcard.2014.05.028
123. Yang Q, Chen W, Cong L, Wang M, Li H, Wang H, et al. Nadase cd38 is a key determinant of ovarian aging. Nat Aging. (2024) 4:110–28. doi: 10.1038/s43587-023-00532-9
124. Mittelbrunn M, Kroemer G. Hallmarks of T cell aging. Nat Immunol. (2021) 22:687–98. doi: 10.1038/s41590-021-00927-z
125. Liu Z, Liang Q, Ren Y, Guo C, Ge X, Wang L, et al. Immunosenescence: molecular mechanisms and diseases. Signal Transduction Targeted Ther. (2023) 8:200. doi: 10.1038/s41392-023-01451-2
126. Matalonga J, Glaria E, Bresque M, Escande C, Carbo JM, Kiefer K, et al. The nuclear receptor lxr limits bacterial infection of host macrophages through a mechanism that impacts cellular nad metabolism. Cell Rep. (2017) 18:1241–55. doi: 10.1016/j.celrep.2017.01.007
127. Terao R, Lee TJ, Colasanti J, Pfeifer CW, Lin JB, Santeford A, et al. Lxr/cd38 activation drives cholesterol-induced macrophage senescence and neurodegeneration via nad+ Depletion. Cell Rep. (2024) 43:114102. doi: 10.1016/j.celrep.2024.114102
128. Glaría E, Rodríguez Martínez P, Font-Díaz J, de la Rosa JV, Castrillo A, Crawshaw DJ, et al. Liver X receptors and inflammatory-induced C/ebpb selectively cooperate to control cd38 transcription. J Innate Immun. (2024) 17(1):56–77. doi: 10.1159/000543274
129. Yin Y, Choi S-C, Xu Z, Perry DJ, Seay H, Croker BP, et al. Normalization of cd4+ T cell metabolism reverses lupus. Sci Trans Med. (2015) 7:274ra18–ra18. doi: 10.1126/scitranslmed.aaa0835
130. Robinson GA, Wilkinson MGL, Wincup C. The role of immunometabolism in the pathogenesis of systemic lupus erythematosus. Front Immunol. (2021) 12:806560. doi: 10.3389/fimmu.2021.806560
Keywords: CD38, purinergic-signaling, cGAS-STING, NLRP3-inflammasome, type I IFN signature, cGVHD lupus model, senescence, transcriptome signature
Citation: Zubiaur M, Terrón-Camero LC, Gordillo-González F, Andrés-León E, Barroso-del Jesús A, Canet-Antequera LM, Pérez Sánchez-Cañete MM, Martínez-Blanco Á, Domínguez-Pantoja M, Botia-Sánchez M, Pérez-Cabrera S, Bello-Iglesias N, Alcina A, Abadía-Molina A-C, Matesanz F, Zumaquero E, Merino R and Sancho J (2025) CD38 deficiency leads to a defective short-lived transcriptomic response to chronic graft-versus-host disease induction, involving purinergic signaling-related genes and distinct transcriptomic signatures associated with lupus. Front. Immunol. 16:1441981. doi: 10.3389/fimmu.2025.1441981
Received: 31 May 2024; Accepted: 20 January 2025;
Published: 10 February 2025.
Edited by:
Christa Elisabeth Müller, University of Bonn, GermanyReviewed by:
Fabio Malavasi, University of Turin, ItalyCopyright © 2025 Zubiaur, Terrón-Camero, Gordillo-González, Andrés-León, Barroso-del Jesús, Canet-Antequera, Pérez Sánchez-Cañete, Martínez-Blanco, Domínguez-Pantoja, Botia-Sánchez, Pérez-Cabrera, Bello-Iglesias, Alcina, Abadía-Molina, Matesanz, Zumaquero, Merino and Sancho. This is an open-access article distributed under the terms of the Creative Commons Attribution License (CC BY). The use, distribution or reproduction in other forums is permitted, provided the original author(s) and the copyright owner(s) are credited and that the original publication in this journal is cited, in accordance with accepted academic practice. No use, distribution or reproduction is permitted which does not comply with these terms.
*Correspondence: Mercedes Zubiaur, bXp1YmlhdXJAaXBiLmNzaWMuZXM=; Jaime Sancho, Z3JhbmFkYUBpcGIuY3NpYy5lcw==
†These authors have contributed equally to this work and share senior authorship
Disclaimer: All claims expressed in this article are solely those of the authors and do not necessarily represent those of their affiliated organizations, or those of the publisher, the editors and the reviewers. Any product that may be evaluated in this article or claim that may be made by its manufacturer is not guaranteed or endorsed by the publisher.
Research integrity at Frontiers
Learn more about the work of our research integrity team to safeguard the quality of each article we publish.