
94% of researchers rate our articles as excellent or good
Learn more about the work of our research integrity team to safeguard the quality of each article we publish.
Find out more
ORIGINAL RESEARCH article
Front. Immunol. , 27 January 2025
Sec. Vaccines and Molecular Therapeutics
Volume 15 - 2024 | https://doi.org/10.3389/fimmu.2024.1502458
This article is part of the Research Topic Unraveling Systemic Immune Responses Through Multi-Omics Integration View all 4 articles
 Thomas E. Hickey1†Uma Mudunuri2†Heidi A. Hempel1
 Troy J. Kemp1
 Nancy V. Roche1Keyur Talsania2Brian A. Sellers3James M. Cherry3
 Ligia A. Pinto1*
Introduction: The first vaccines approved against SARS-CoV-2, mRNA-1273 and BNT162b2, utilized mRNA platforms. However, little is known about the proteomic markers and pathways associated with host immune responses to mRNA vaccination. In this proof-of-concept study, sera from male and female vaccine recipients were evaluated for proteomic and immunologic responses 1-month and 6-months following homologous third vaccination.
Methods: An aptamer-based (7,289 marker) proteomic assay coupled with traditional serology was leveraged to generate a comprehensive evaluation of systemic responsiveness in 64 and 68 healthy recipients of mRNA-1273 and BNT162b2 vaccines, respectively.
Results: Sera from female recipients of mRNA-1273 showed upregulated indicators of inflammatory and immunological responses at 1-month post-third vaccination, and sera from female recipients of BNT162b2 demonstrated upregulated negative regulators of RNA sensors at 1-month. Sera from male recipients of mRNA-1273 showed no significant upregulation of pathways at 1-month post-third vaccination, though there were multiple significantly upregulated proteomic markers. Sera from male recipients of BNT162b2 demonstrated upregulated markers of immune response to doublestranded RNA and cell-cycle G(2)/M transition at 1-month. Random Forest analysis of proteomic data from pre-third-dose sera identified 85 markers used to develop a model predictive of robust or weaker IgG responses and antibody levels to SARS-CoV-2 spike protein at 6-months following boost; no specific markers were individually predictive of 6-month IgG response. Thirty markers that contributed most to the model were associated with complement cascade and activation; IL-17, TNFR pro-apoptotic, and PI3K signaling; and cell cycle progression.
Discussion: These results demonstrate the utility of proteomics to evaluate correlates or predictors of serological responses to SARS-CoV-2 vaccination.
The global response to the SARS-CoV-2 pandemic of 2020 ushered in a new chapter in vaccinology with the development and wide-spread use of mRNA-based vaccines (1). However, evidence is mounting that a more individualized approach may be needed as the COVID-19 landscape continues to evolve. The 2 original mRNA vaccines to SARS-CoV-2, BNT162b2 (Pfizer) and mRNA-1273 (Moderna) both target immune responses to full-length viral spike protein and have been highly successful in preventing severe COVID-19 disease, hospitalization, and death on the population level (2–5). However, the 2 vaccine types include different concentrations of mRNA per dose and have demonstrated differences in immunogenicity in different patient groups and between sexes assigned at birth (2–4, 6–10). In addition, multiple studies have shown that the circulating vaccine induced antibody levels decline rapidly in most recipients within a couple of months of primary series vaccination (7, 8, 11–13), and the Centers for Disease Control and Prevention (CDC) has since recommended additional vaccination doses and vaccines to develop sustainable and effective humoral responses (14). To add complexity, new viral variants routinely emerge and often escape neutralization, resulting in high numbers of breakthrough infections (15, 16). These observations support the CDC recommendation of booster immunizations for all recipients (17), however there are no known correlates of protection and it is not clear which patients will have robust versus weaker responses that may be strengthened through the administration of additional doses.
Established correlates of protection against SARS-CoV-2 infection or disease would be extremely valuable to inform recommendations for booster vaccinations. The mRNA-based SARS-CoV-2 vaccines are believed to impart protection through neutralizing antibody responses (as in other infections such as with Human Papillomavirus), as well as cell-mediated immune responses, and both responses result in distinct protein expression patterns (18–22). Proteomic changes in serum may consequently prove to be indicative, or even predictive, of vaccine immunogenicity and efficacy, and could inform new vaccine recommendations and developments.
The recent evolution of proteomic affinity-capture platforms into large comprehensive screening tools (23) provide a unique opportunity to evaluate broad spectrum protein responses in easily accessible, small volume serum samples (24). However, it remains to be demonstrated whether protein markers can be realistically used to predict serological immune responses. In this proof-of-concept study, a 7,289-proteome assay was used to evaluate human protein markers pre- and post-homologous third dose of mRNA-1273 or BNT162b2 in healthy vaccine recipients and then the results were compared with humoral response. Specifically, serum antibodies to SARS-CoV-2 spike, proteins, and impacted cellular pathways were analyzed in samples collected 1-month and 6-months after a third dose of vaccine and compared to pre-third dose samples. Influence of vaccine type and sex assigned at birth were also evaluated for differing antibody and proteomic profiles. In addition, pre-third dose sera were evaluated for proteomic markers that could be predictors of either higher or lower vaccine-induced serum IgG antibody content and used to develop a model predictive of 6-month antibody levels.
Serum samples were collected from healthy vaccine recipients by Feinstein-Northwell Institute for Medical Research, Manhasset, NY (Institutional Review Board #20-1007) and by the National Institutes of Health’s Occupational Safety and Health Office located at Ft. Detrick, MD under the Research Donor Protocol (RDP). RDP participants were healthy NCI-Frederick employees and other NIH staff that donated blood samples for in-vitro research at the NCI-Frederick laboratories. The protocol is listed under NIH protocol number OH99CN046 and NCT number NCT00339911. Blood donors ranged in age from 25-76 years and included 67 females and 65 males; demographics are presented in Table 1. Study participants were sampled 61-377 days after administration of the second dose of the same primary series vaccine (either BNT162b2 or mRNA-1273) serving as a pre-boost timepoint. Participants were then boosted with a homologous third dose, and then sampled at 1-month (15 to 45 days post-third vaccination) and at 6-months (165-195 days post-third vaccination). Blood samples were processed at the collection sites, sera were frozen and stored at -80°C and then shipped on dry ice to the NCI-Frederick Repository until requested for testing at the Vaccine, Immunity, and Cancer Directorate (VICD).
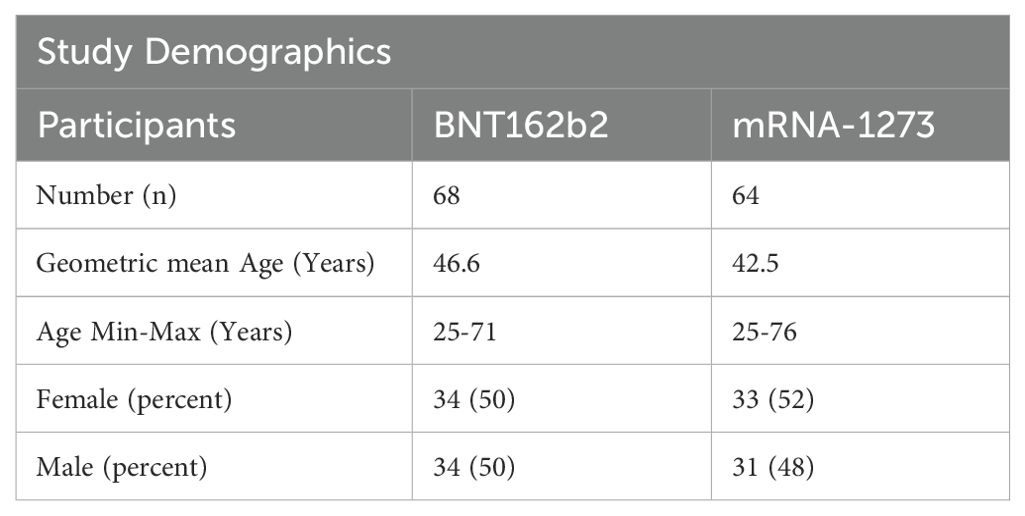
Table 1. Study demographics.
ELISA assays used to quantify human serum IgG antibodies to SARS-CoV-2 spike protein were performed at room temperature (RT) as follows: Maxisorp 96-well plates (Thermo-Scientific Cat# 439454) were coated with recombinant SARS-CoV-2 spike protein (SARS-CoV-2 S-2P (14-1213)-T4f-His6) sourced from the Protein Expression Laboratory (PEL) at Frederick National Laboratory for Cancer Research (FNLCR), (0.15 µg/mL in phosphate-buffered saline [PBS]). After coating for a minimum of 24 hours at 4°C, assay plates were washed with a PBS-Tween buffer and blocked with PBS-Tween 0.20% and 4.00% skim milk (BD, Cat# 232100) for 90 minutes. Following a plate wash, heat-inactivated samples were tested with appropriate in-well dilution series. Plates were incubated for 60 minutes with the samples, washed, and then incubated for an additional 60 minutes with an empirically determined dilution of goat anti-human IgG HRP-conjugate in PBS-Tween (Seracare, Cat# 5220-0390). The plates were washed and developed with tetramethylbenzidine (TMB) 2-component substrate (Seracare, Cat# 5120-0049, 5120-0038) for 25 minutes. Finally, the reaction in the plate wells was stopped with 0.36N sulfuric acid and read at 450nm and 620nm on a SpectraMax plate reader (Molecular Devices). Data analyses were performed using SoftMax Pro GxP 7.0.3. Reportable values for IgG quantitative ELISA are binding antibody units per milliliter (BAU/mL), based on a standard calibrated to the World Health Organization (WHO) International Standard (25).
Avidity ELISA assays (chaotrope assays) are based on standard ELISA tests for anti-SARS-CoV-2 spike protein IgG but include an additional step where the analyte (antibody) is exposed to a chaotropic agent that effectively breaks and elutes off weakly bound antibody species; a “bind and break” ELISA. Urea was used as the chaotropic agent due to its experimental range and minimal impact on assay plate coat integrity. Avidity ELISAs were performed on sample dilutions with optical densities (OD) between 0.50 to 1.30 OD units at 450nM; 1.00 was the target OD. Extensive assay development with multiple SARS-CoV-2 serum samples demonstrated highly reproducible (CV<10%) measurements in this range (13). Each assay plate tested 5 serum samples in duplicate. After each sample was incubated on the assay plate for 1 hour at 22°C (room temperature [RT]), the plates were washed and incubated with dilutions of urea ranging from 0 to 10M for 15 minutes at 22°C. After 4 washes with PBS-Tween, plates were developed as described above for the quantitative IgG assay. Serum avidity assessments are reported as Avidity Indices (AI20); the molar concentration (M) of chaotrope required to reduce the optical density of the sample to 80% that of untreated wells. Additionally, each assay plate contained 2 system suitability controls that were developed from well characterized serum samples: 1 control with a known low avidity index, the other a known high avidity index.
SomaLogic’s SomaScan v4.1 7K Assay platform was used to evaluate serum protein content longitudinally for significant changes in abundance at 1-month and 6-months following homologous third vaccination. Protein quantitated in sera collected pre-third dose set baseline values for each study participant. The SomaScan assay was performed on a Tecan Fluent 780 high throughput system according to manufacturer’s instructions at the NIH Center for Human Immunology. A complete list of the 7,289 targets analyzed is available at https://menu.somalogic.com. The data are reported in relative fluorescence units (RFU), a surrogate for protein concentration. The SomaScan Assay data were normalized using SomaLogic’s standardization procedure (26). In short, data were first normalized to correct for well-to-well variation in microarray hybridization steps. This was then followed by intraplate median signal normalization to correct for sample-to-sample differences that may be introduced due to technical assay effects. Plate scaling was applied to normalize global signal differences between plates, and calibration was applied to adjust for SOMAmer reagent-specific differences between tests. Finally, median signal normalization was performed via Adaptive Normalization by Maximum Likelihood (ANML) to harmonize data across multiple assay plates.
Serum IgG antibody to SARS-CoV-2 spike concentrations are reported as geometric mean binding antibody units per milliliter (BAU/mL) based on established serological WHO standards (27).
Proteomic data were stratified based on vaccine received and sex assigned at birth for these analyses. In total, data analyses were performed on 12 data subsets as follows: 2 vaccines assessed at 3 timepoints and against 2 sex assigned at birth stratifications.
Serum antibody levels and avidity are expressed as geometric mean concentrations (GMC) and geometric mean avidity levels (GMA), respectively, with corresponding 95% confidence intervals. A Mann-Whitney U test (Wilcoxon Rank Sum test) was used when comparing antibody content or avidity values between vaccine type, or between sex assigned at birth. A Wilcoxon Signed Rank test was used when serological tests were evaluated between timepoints. These tests were chosen because they do not have the requirement of a normal distribution of values, as in an unpaired or paired t-test, and work for smaller sample sizes; p<0.05 was considered significant.
Serum proteins were quantitated using the SomaScan v4.1 7K Assay platform (28, 29). The geometric mean value for each detectable protein within each cohort was quantitated in relative fluorescent units (RFU), and the magnitude of protein abundance change was expressed with the following formulas: log2(1-month value/pre-third-dose value) and log2(6-month value/pre-third-dose value). A 2-tailed t-test was performed to determine if the calculated geometric mean values were significantly different between the 2 timepoints. p-values in this assessment provided significance thresholds. Proteins having a p-value of <0.05 and a log protein abundance difference of >0.20 (significant increase) or <-0.20 (significant decrease) were identified as proteins that demonstrated significant differences in content.
Biological processes impacted by vaccination were evaluated through KEGG and REACTOME pathway functional enrichment analyses. Enrichment ratio and false discovery rate (FDR) were calculated for significant proteins using the WEB-based GEne SeT AnaLysis Toolkit (WebGestalt) 2 (30). EntrezGene was used to map proteins to gene identifiers. Background gene sets for enrichment analyses were created by selecting all unique EntrezGene names from all protein analytes detected in the SomaScan Assay.
As serological antibody responses to the 2 vaccines were largely analogous irrespective of vaccine or sex assigned at birth (Tables 2, 3), and because of the limited sizes of the vaccine recipient cohorts, the entire database was evaluated without segregation by sex assigned at birth or vaccine to identify pre-third-dose markers predicting 6-month antibody response levels. Attempts to develop predictive models specific for sex assigned at birth or vaccine were unsuccessful lacking sufficient predictive accuracy; larger sample sizes would be necessary to develop segregated models.
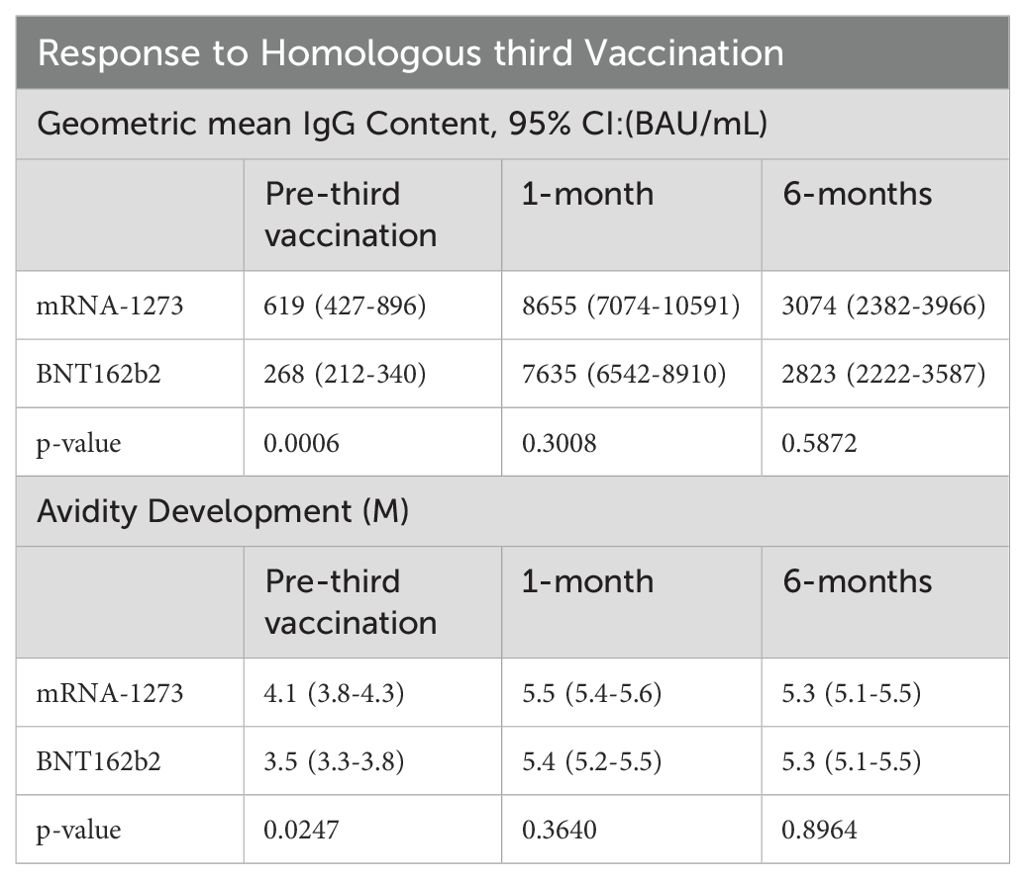
Table 2. Serology responses to vaccination, influence of vaccine type.
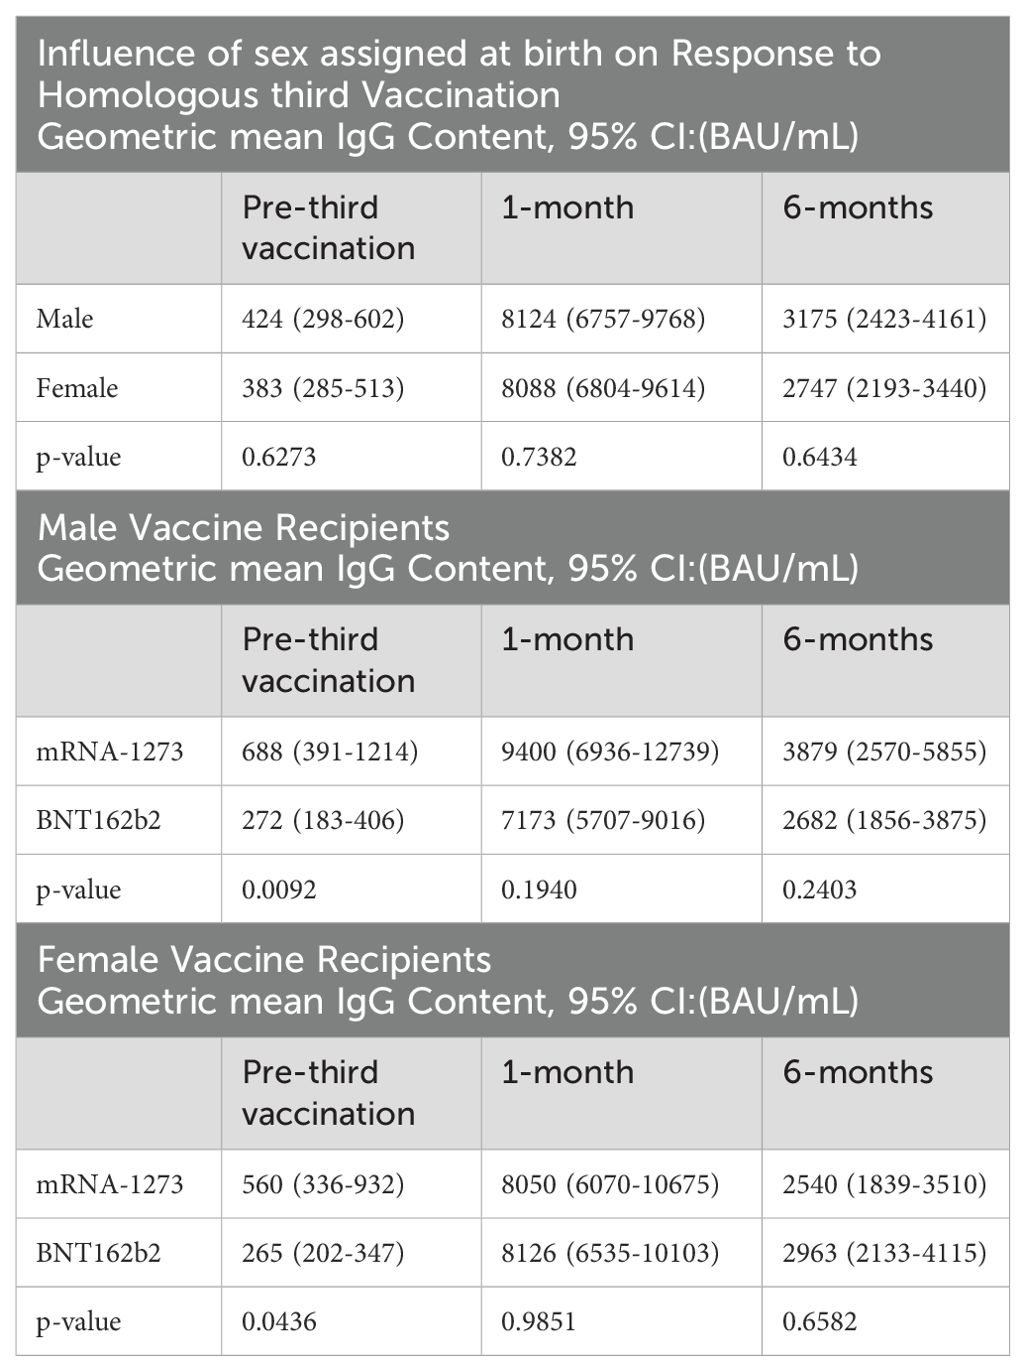
Table 3. Circulating IgG antibody content to SARS-CoV-2 Spike, Influence of sex assigned at birth.
A pilot machine learning model was developed (Figure 1) using Random Forest (RF) to predict antibody response levels at 6-months. Thirty-nine subjects were identified as higher responders (IgG > 5000 BAU/mL) and 44 subjects were identified as lower responders (IgG < 2000 BAU/mL) based on IgG levels at 6-months. A 2-tailed t-test was performed to determine if the calculated geometric mean values of the protein levels at pre-third dose for the 2 groups were significantly different from zero. One hundred and seven statistically significant markers were identified based on comparative changes between the extreme (higher or lower) responders (p<0.05). The markers were reduced to an 85-feature set by removing redundant predictors, or co-linear markers. The RF model was trained with data from 28 higher responders and 31 lower responders, and the model was tested on the remaining 11 higher responders and 13 lower responders and achieved a predictive accuracy of 79.17% on test data with an area under the curve (AUC) of 86.71%.
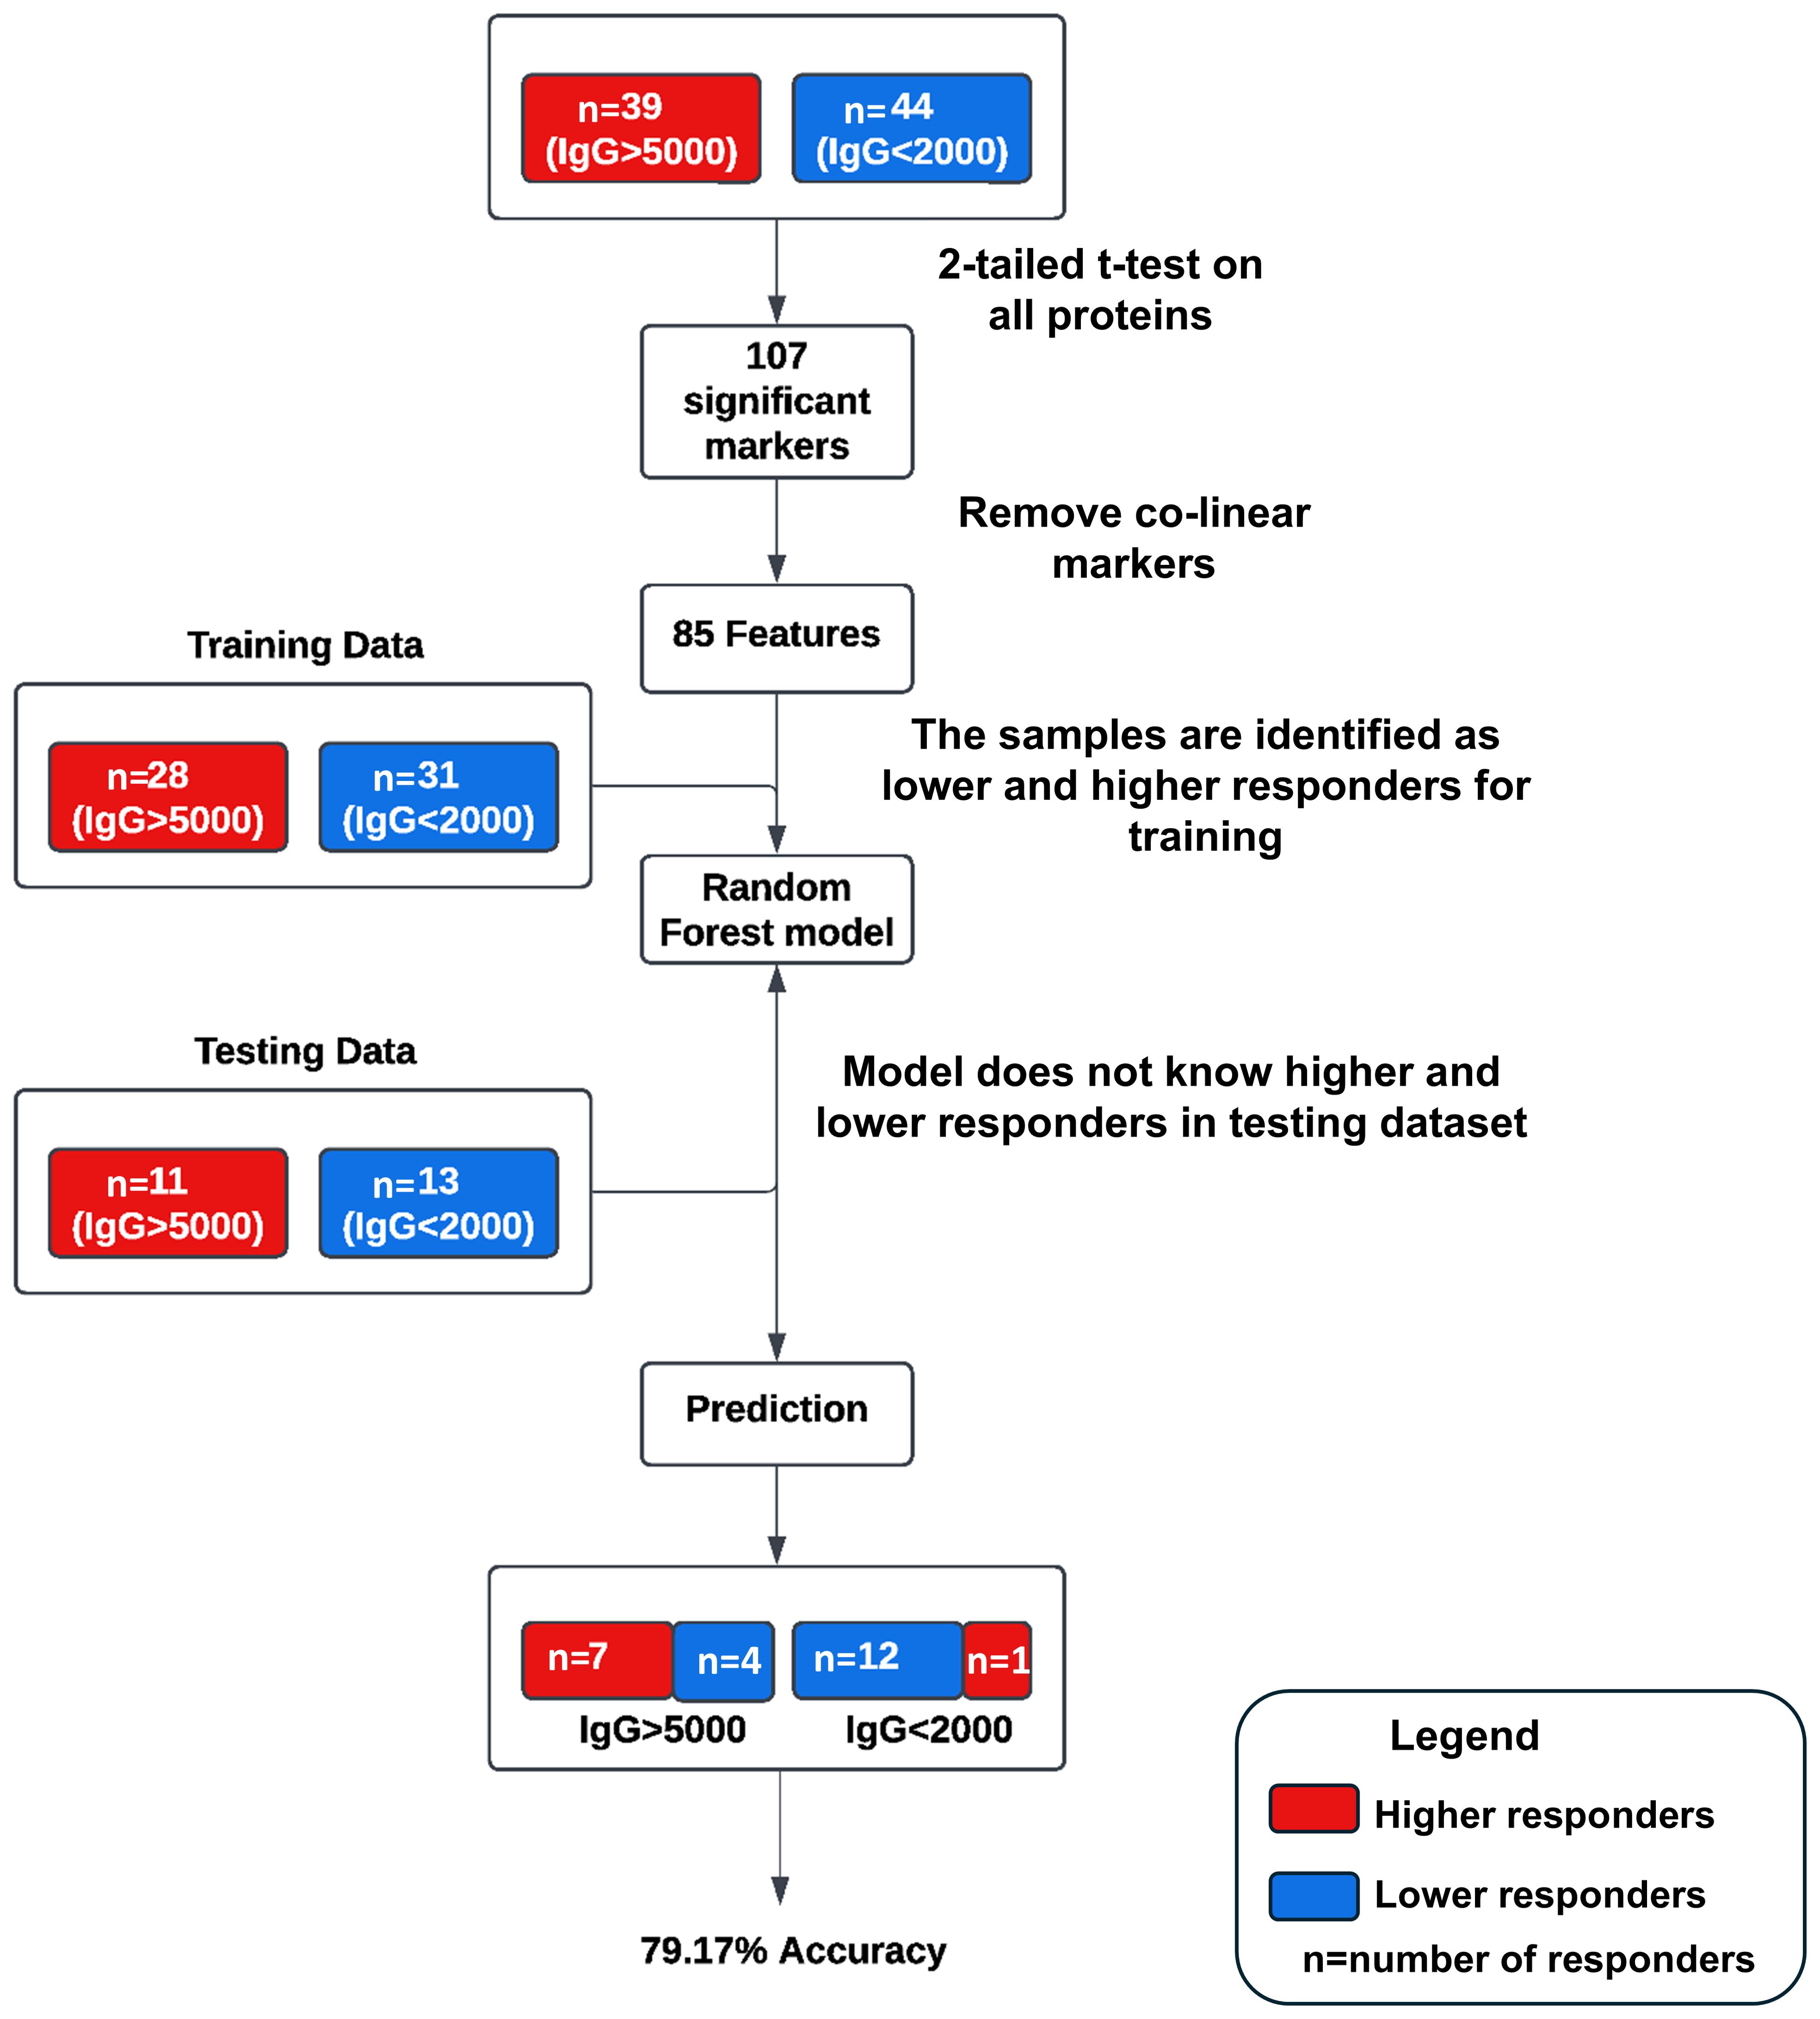
Figure 1. Schematic of the pilot machine learning model. Thirty-nine subjects were identified as higher responders (IgG > 5000 BAU/mL) and 44 subjects were identified as lower responders (IgG < 2000 BAU/mL) based on IgG levels at 6-months. One hundred and seven statistically significant markers were identified based on comparative changes between the extreme (higher or lower) responders (p<0.05). The markers were reduced to an 85-feature set by removing redundant predictors, or co-linear markers. The RF model was trained with data from 28 higher responders and 31 lower responders, and the model was tested on the remaining 11 higher responders and 13 lower responders and achieved a predictive accuracy of 79.17% on test data with an area under the curve (AUC) of 86.71%.
Assessments of vaccination responses were confounded with the observation that 18 mRNA-1273 and 19 BNT162b2 recipients had antibody reactive to SARS-CoV-2 nucleocapsid protein, despite no self-reports of infection indicating coronavirus infections or potential exposure. Moreover, 14 mRNA-1273 and 7 BNT162b2 vaccine recipients had positive nucleocapsid tests at 1-month and 6-month timepoints, possibly indicating subclinical infections. To evaluate the priming influence of the infections, the dataset was re-examined excluding vaccine-recipient samples that tested positive for coronavirus nucleocapsid. Evaluation of nucleocapsid-antibody negative sera did not significantly affect pre-third-dose predictive marker sets or pathways associated with higher or lower 6-month serology. Analyses of the nucleocapsid naïve dataset did produce 1 additional cellular process - mitophagy (selective degradation of defective mitochondria) -which contributed to model development (Data not shown).
The development of a predictive model of 6-month IgG antibody response levels from vaccination through proteomic assessments of sera required desegregated analyses due to study size. Consequently, we evaluated in-depth both the quality and robustness of the IgG responses by vaccine received and sex assigned at birth to assure validity of our desegregated assessment. Serological responses were comparable across both vaccine types and sexes assigned at birth at both 1-month and 6-months post-third vaccinations (Figures 2A, B; Tables 2, 3); the only significant differences were detected in pre-third-dose sera (mRNA-1273 primary vaccine recipients demonstrated statistically higher antibody and avidity levels to spike compared to recipients of BNT162b2, irrespective of sex assigned at birth [antibody levels: p=0.0006 vaccines, p=0.0092 males, p=0.0436 females; avidity: p=0.0247]) (Figures 2A, C, D; Table 2). Additionally, the mean time between primary series vaccination and third dose of vaccine was different in the 2 vaccine groups: 294 days (164-377) for mRNA-1273 recipients and 265 days (61-377) for BNT162b2 recipients (p<0.0001, Mann Whitney).
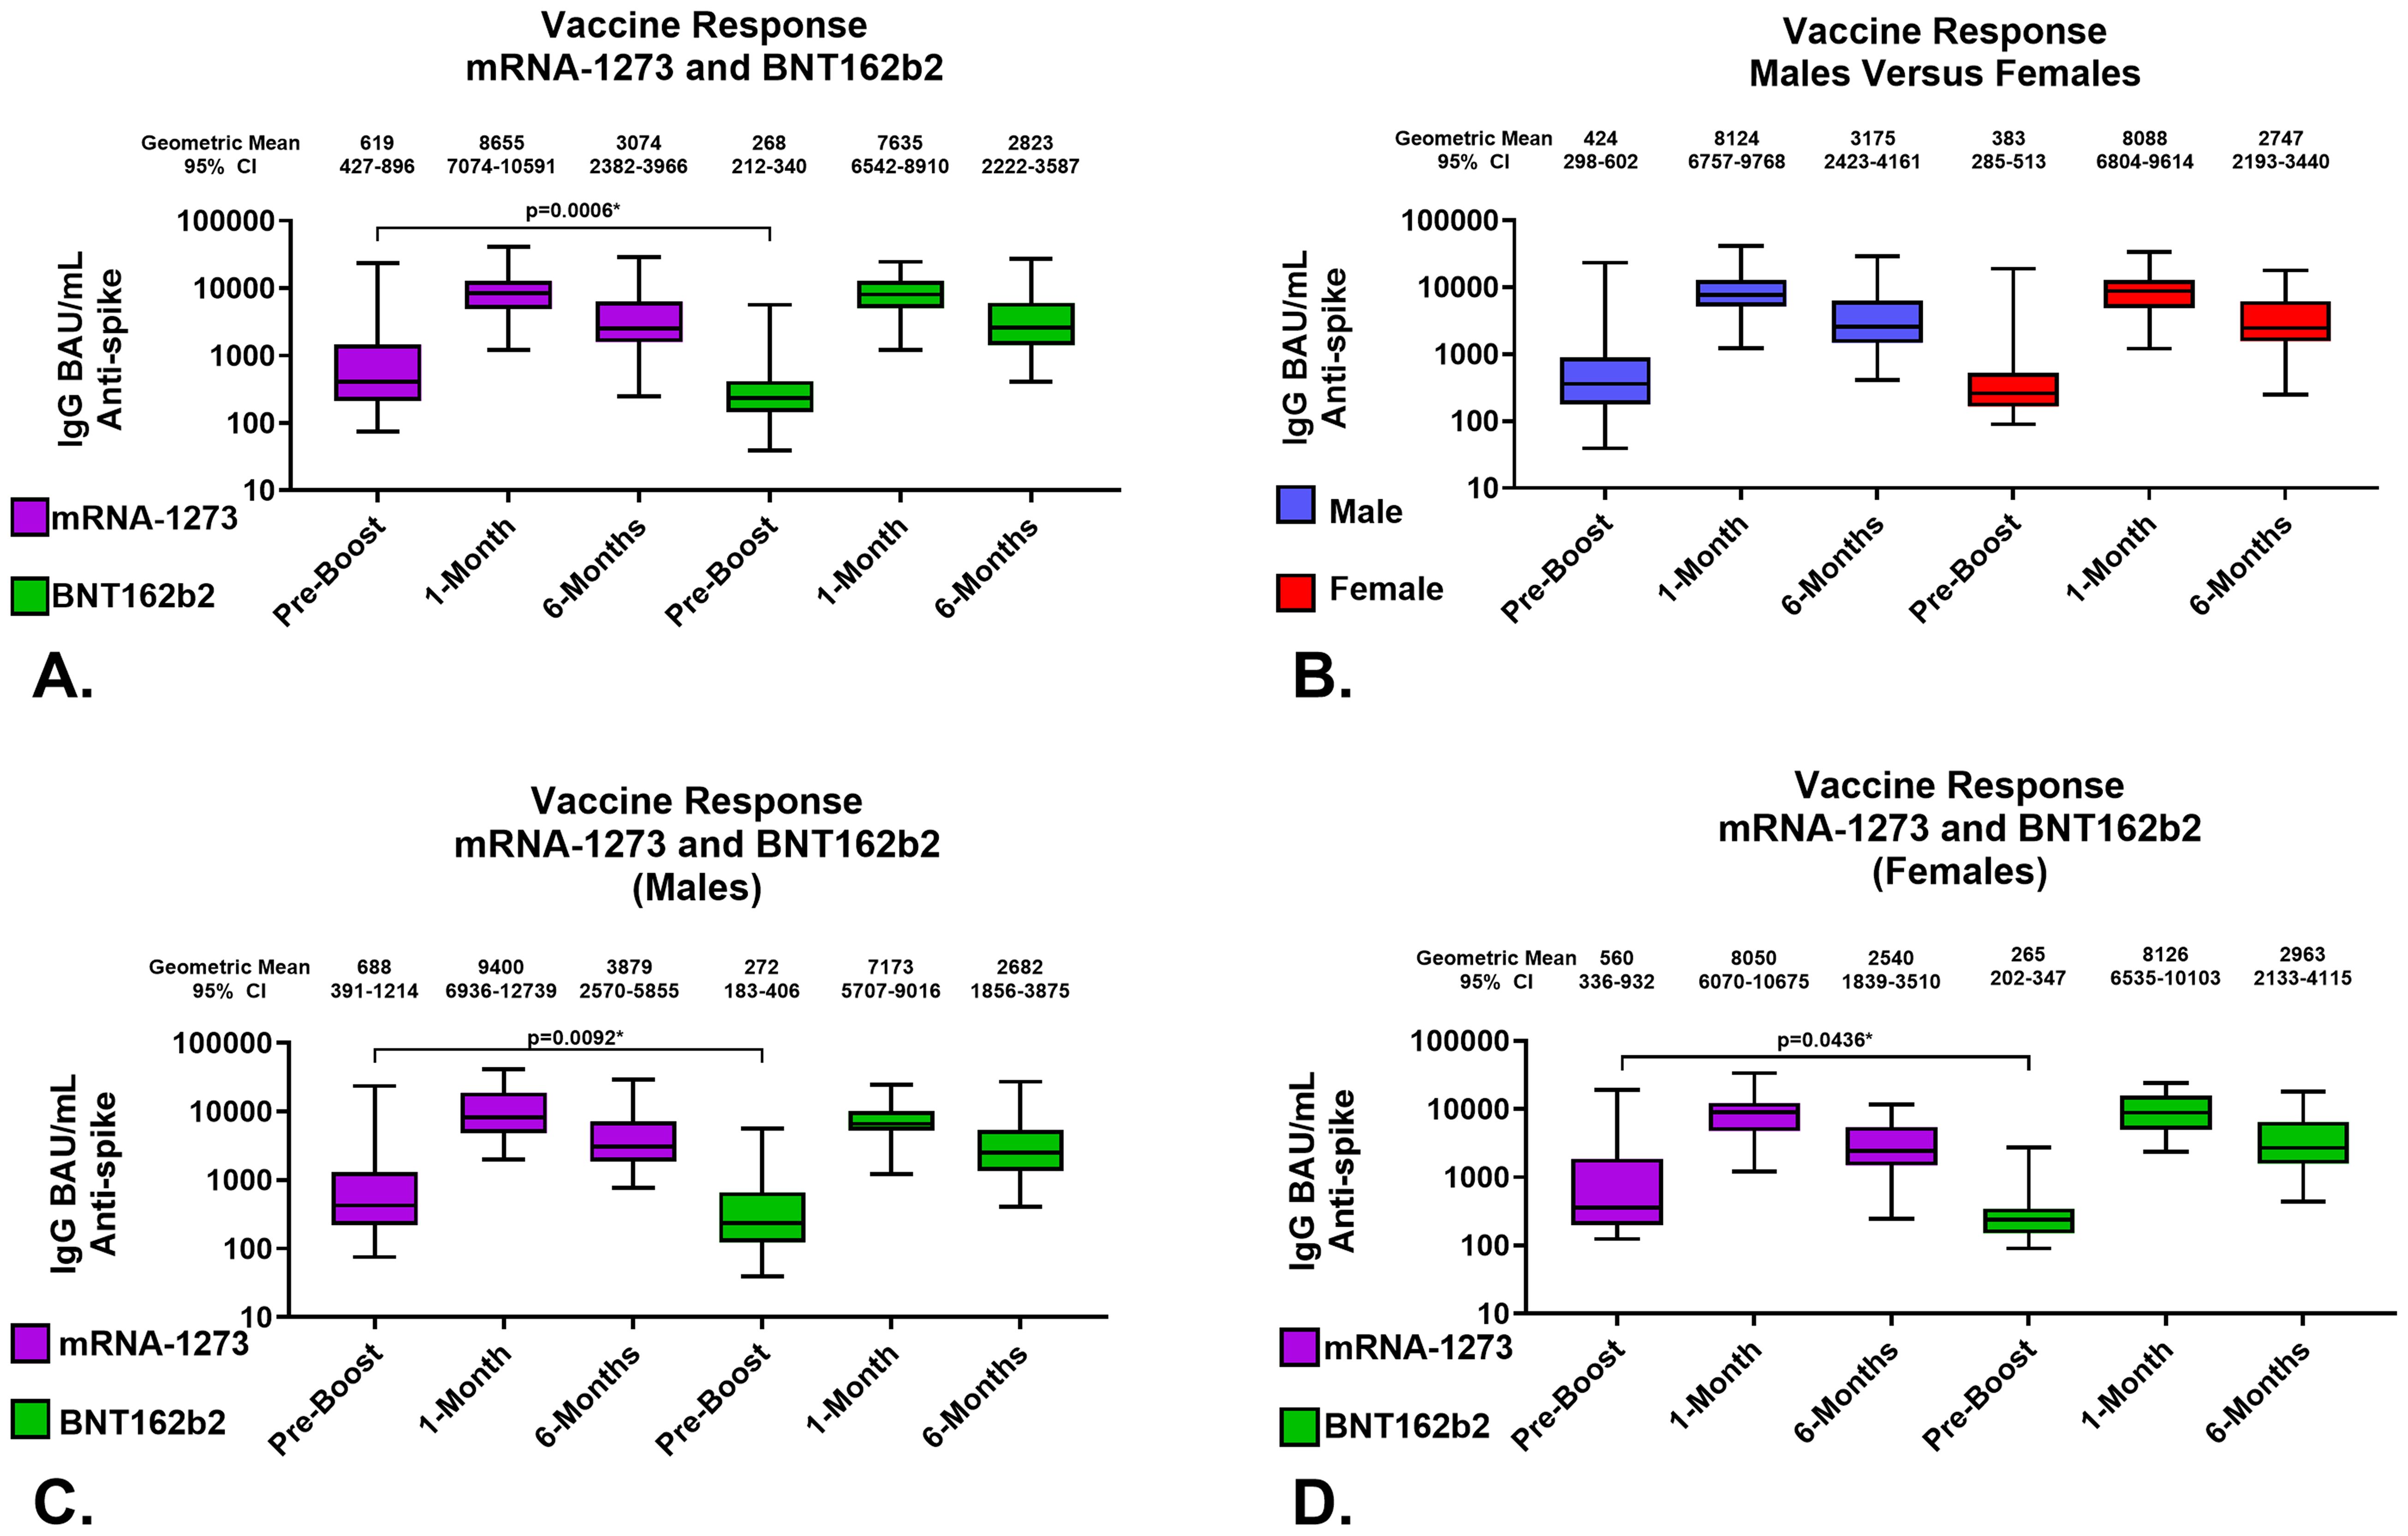
Figure 2. Serological Assessments of Responses to Homologous Third Vaccination. Assessments of IgG anti-SARS-CoV-2 Spike content of serum. (A) Comparison of serum antibody levels pre-boost and 1 and 6 months after vaccination. (B) Response to third vaccination by sex assigned at birth; male recipients (Blue), female recipients (Red). (C) Vaccine response to homologous third vaccination in sera from male recipients. (D) Vaccine response to homologous third vaccination in sera from female recipients. mRNA-1273 results are shown in purple, BNT162b2 in green. Group geometric mean vales are depicted by the bar graph horizontal line and listed above each bar with the 95 percent confidence interval of the geometric mean. Statistically significant comparisons are depicted with p values.
In detail, the geometric mean anti-SARS-CoV-2 spike IgG antibody levels in mRNA-1273 and BNT162b2 recipients at 1-month were 8655 (95% CI: 7074-10591) BAU/mL and 7635 (95% CI: 6542-8910) BAU/mL, respectively; p=0.3008 (Figure 2A; Table 2). The geometric mean antibody avidity levels at 1-month for mRNA-1273 and recipients BNT162b2 were 5.5 (95% CI: 5.4-5.6) M and 5.4 (95% CI: 5.2-5.5) M, respectively; p=0.3640 (Table 2). The 6-month geometric mean anti-SARS-CoV-2 levels for mRNA-1273 and BNT162b2 recipient sera were 3074 (95% CI: 2382-3966) BAU/mL and 2823 (95% CI: 2222-3587) BAU/mL, respectively; p=0.5872 (Figure 2A; Table 2). The geometric mean antibody avidity levels at 6-months for mRNA-1273 and BNT162b2 recipients were 5.3 (95% CI: 5.1-5.5) M and 5.3 (95% CI: 5.1-5.5) M, respectively; p=0.8964 (Table 2).
When serology responses were analyzed according to sex assigned at birth, male and female recipients had geometric mean serum antibody levels at 1-month of 8124 (95% CI: 6757-9768) BAU/mL and 8088 (95% CI: 6804-9614) BAU/mL, respectively; p=0.7382 (Figure 2B; Table 3). At 6-months, male and female recipients had geometric mean serum antibody levels of 3175 (95% CI: 2423-4161) BAU/mL and 2747 (95% CI: 2193-3440) BAU/mL, respectively; p=0.6434 (Figure 2B; Table 3). There were also no statistically significant serum avidity differences based on sex assigned at birth (data not shown).
Further analyzing according to both sex assigned at birth and vaccine, male recipients of mRNA-1273 and BNT162b2 at 1-month demonstrated geometric mean serum antibody levels of 9400 (95% CI: 6936-12739) BAU/mL and 7173 (95% CI: 5707-9016) BAU/mL, respectively; p=0.1940 (Figure 2C; Table 3). Female recipients of mRNA-1273 and BNT162b2 at 1-month had geometric mean serum antibody levels of 8050 (95% CI: 6070-10675) BAU/mL and 8126 (95% CI: 6535-10103) BAU/mL, respectively; p=0.9851 (Figure 2D; Table 3). At 6-months, male recipients of mRNA-1273 and BNT162b2 had geometric mean serum antibody levels of 3879 (95% CI: 2570-5855) BAU/mL and 2682 (95% CI: 1856-3875) BAU/mL, respectively; p=0.2403 (Figure 2C; Table 3). Finally, at 6-months female recipients of mRNA-1273 and BNT162b2 had geometric mean serum antibody levels of 2540 (95% CI: 1839-3510) BAU/mL and 2963 (95% CI: 2133-4115) BAU/mL, respectively; p=0.6582 (Figure 2D; Table 3).
Proteomic profiles in serum from each vaccine recipient were assessed with the SomaScan v4.1 7K Assay platform before the third vaccination (after completion of 2-dose primary vaccine series), and then at 1-month and 6-months post-third vaccination; summary of changes in protein marker expression profiles of the respective cohorts are presented in Supplementary Table S1A (downregulated markers) and Supplementary Table S1B (upregulated markers) and Figure 3. Significant proteins were selected based on p-value and average log abundance differences (Figure 4; Supplementary Tables S1A, B).
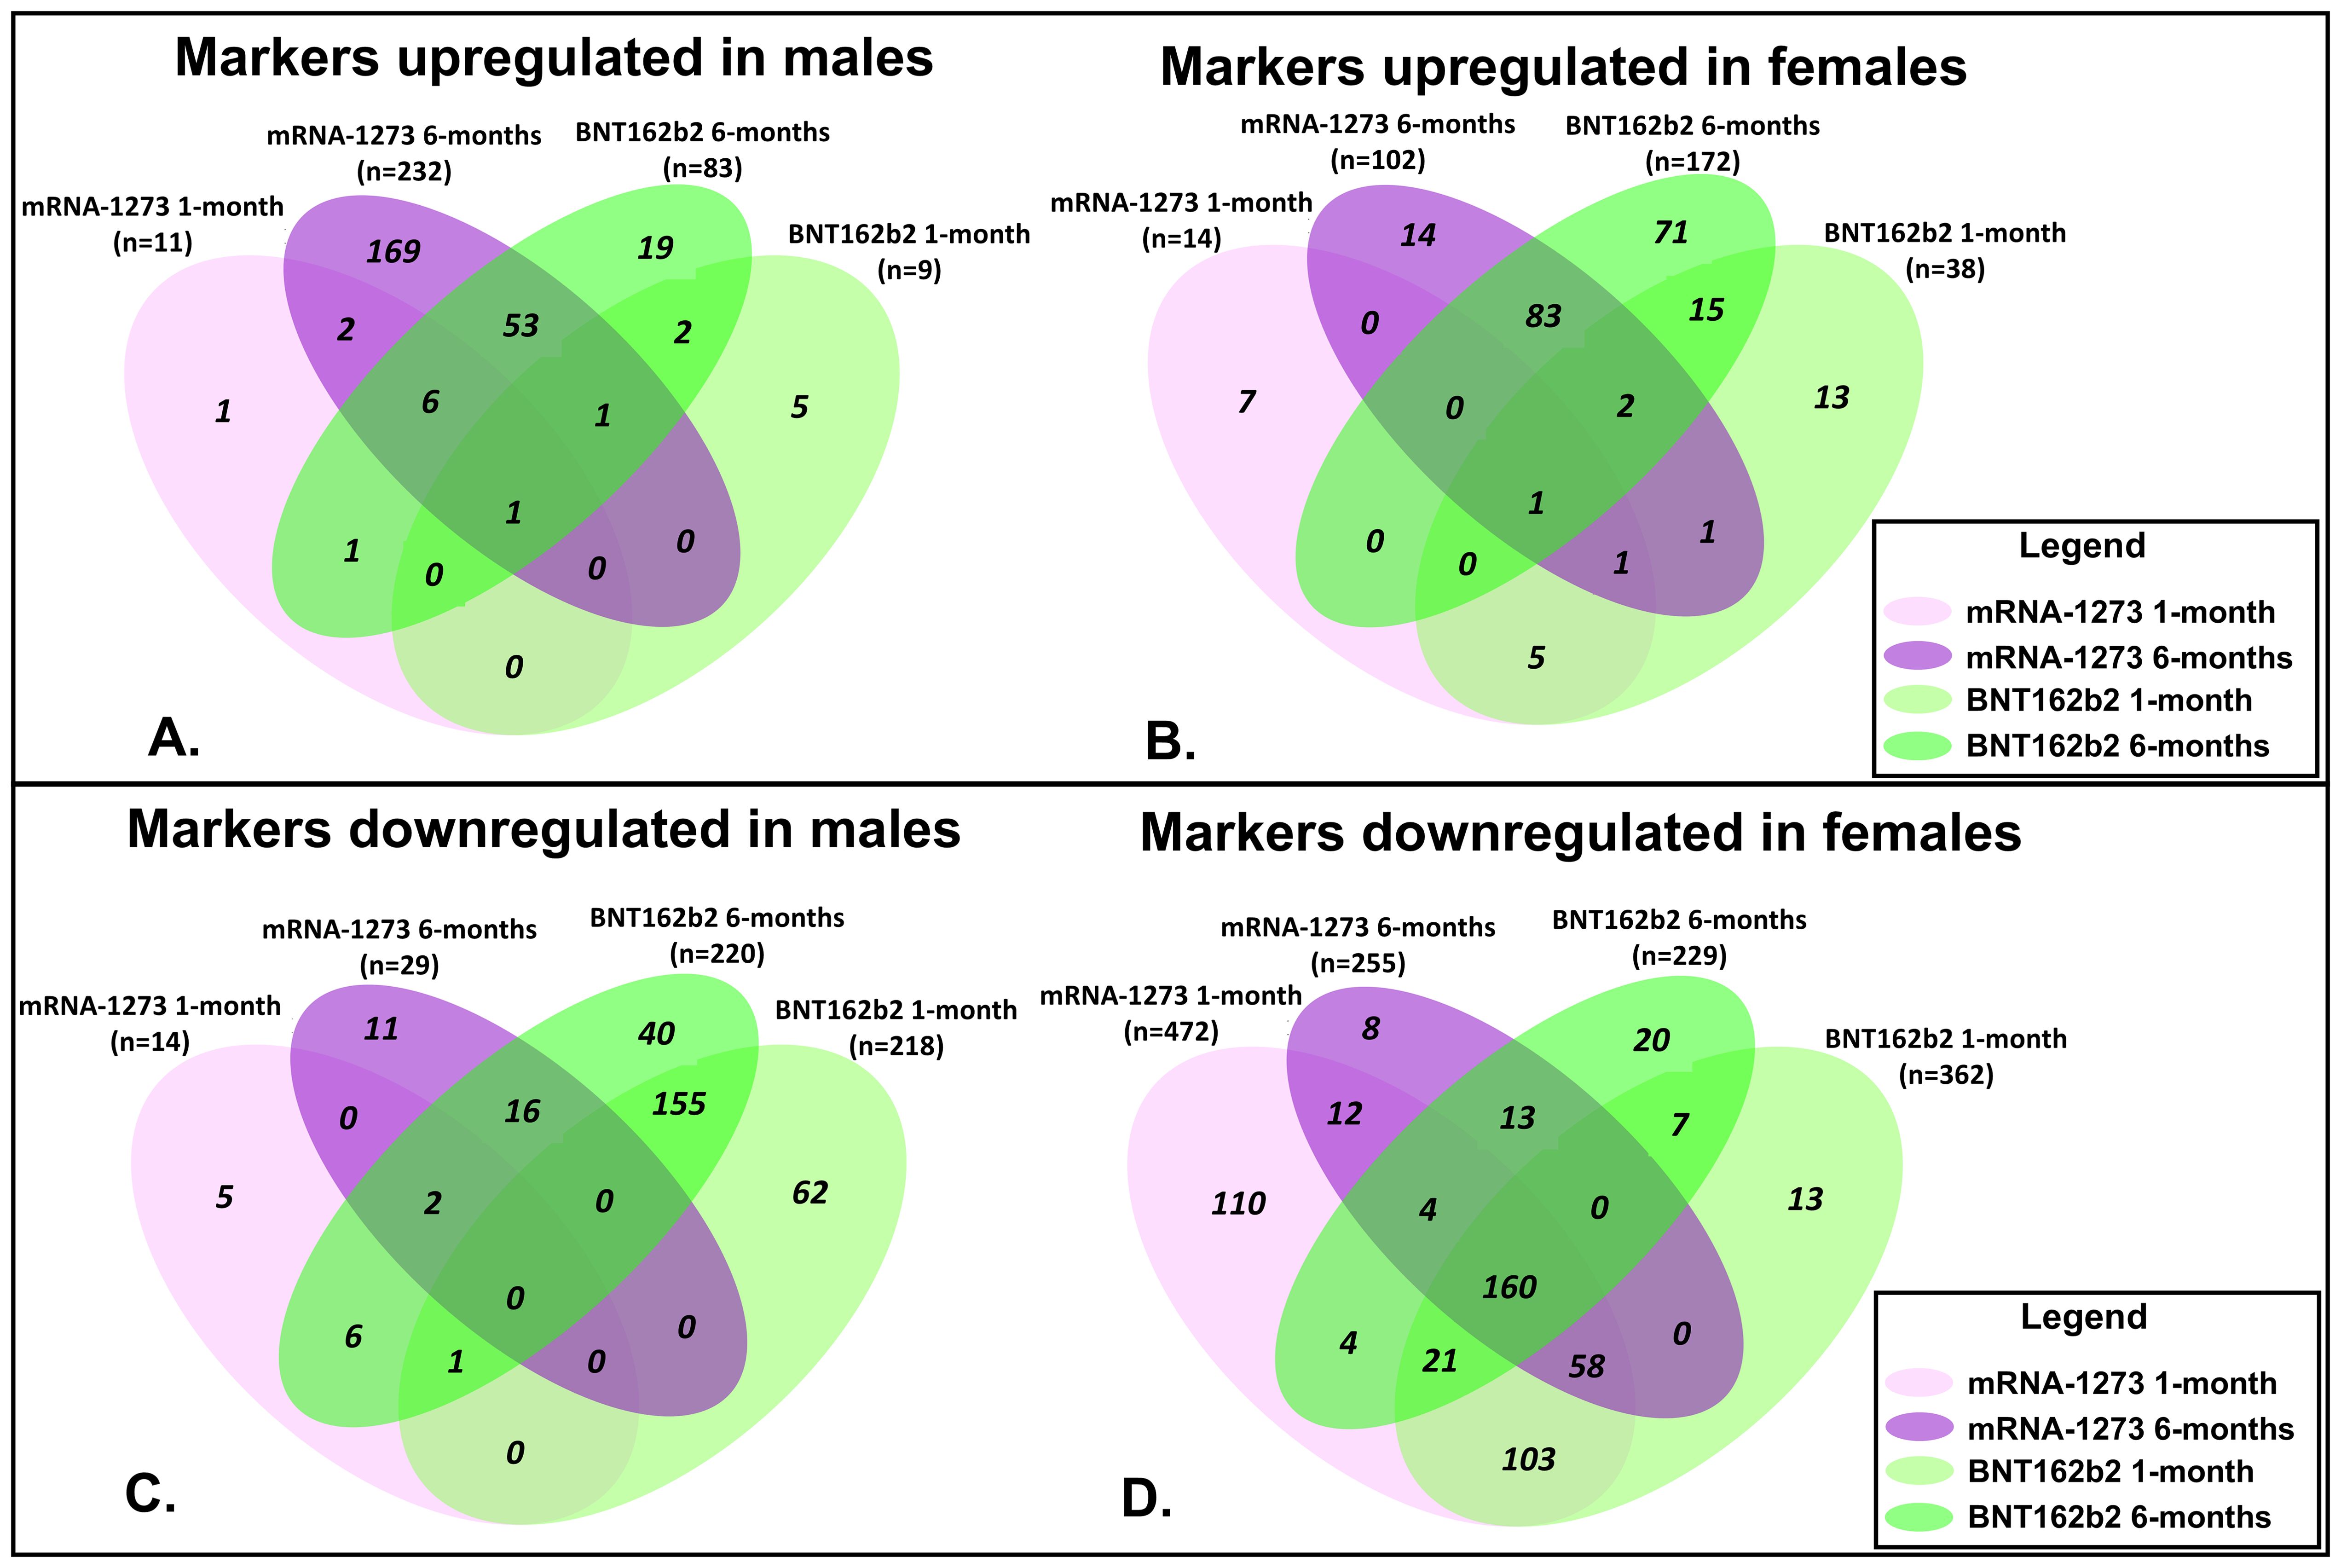
Figure 3. Assessment of Proteomic Marker Profiles by Vaccination Cohort and sex assigned at birth. Assessment of proteomic marker changes from baseline measurement. (A, B) are diagrams of assessment of markers upregulated at 1-month and 6-months in sera from male and female recipients (respectively); (C, D) are diagrams of assessment of markers downregulated at 1- and 6-months in sera from male and female recipients (respectively). mRNA-1273 vaccinated (1-month) light purple and (6-month) dark purple. BNT162b2 vaccinated (1-month) light green and (6-month) dark green.
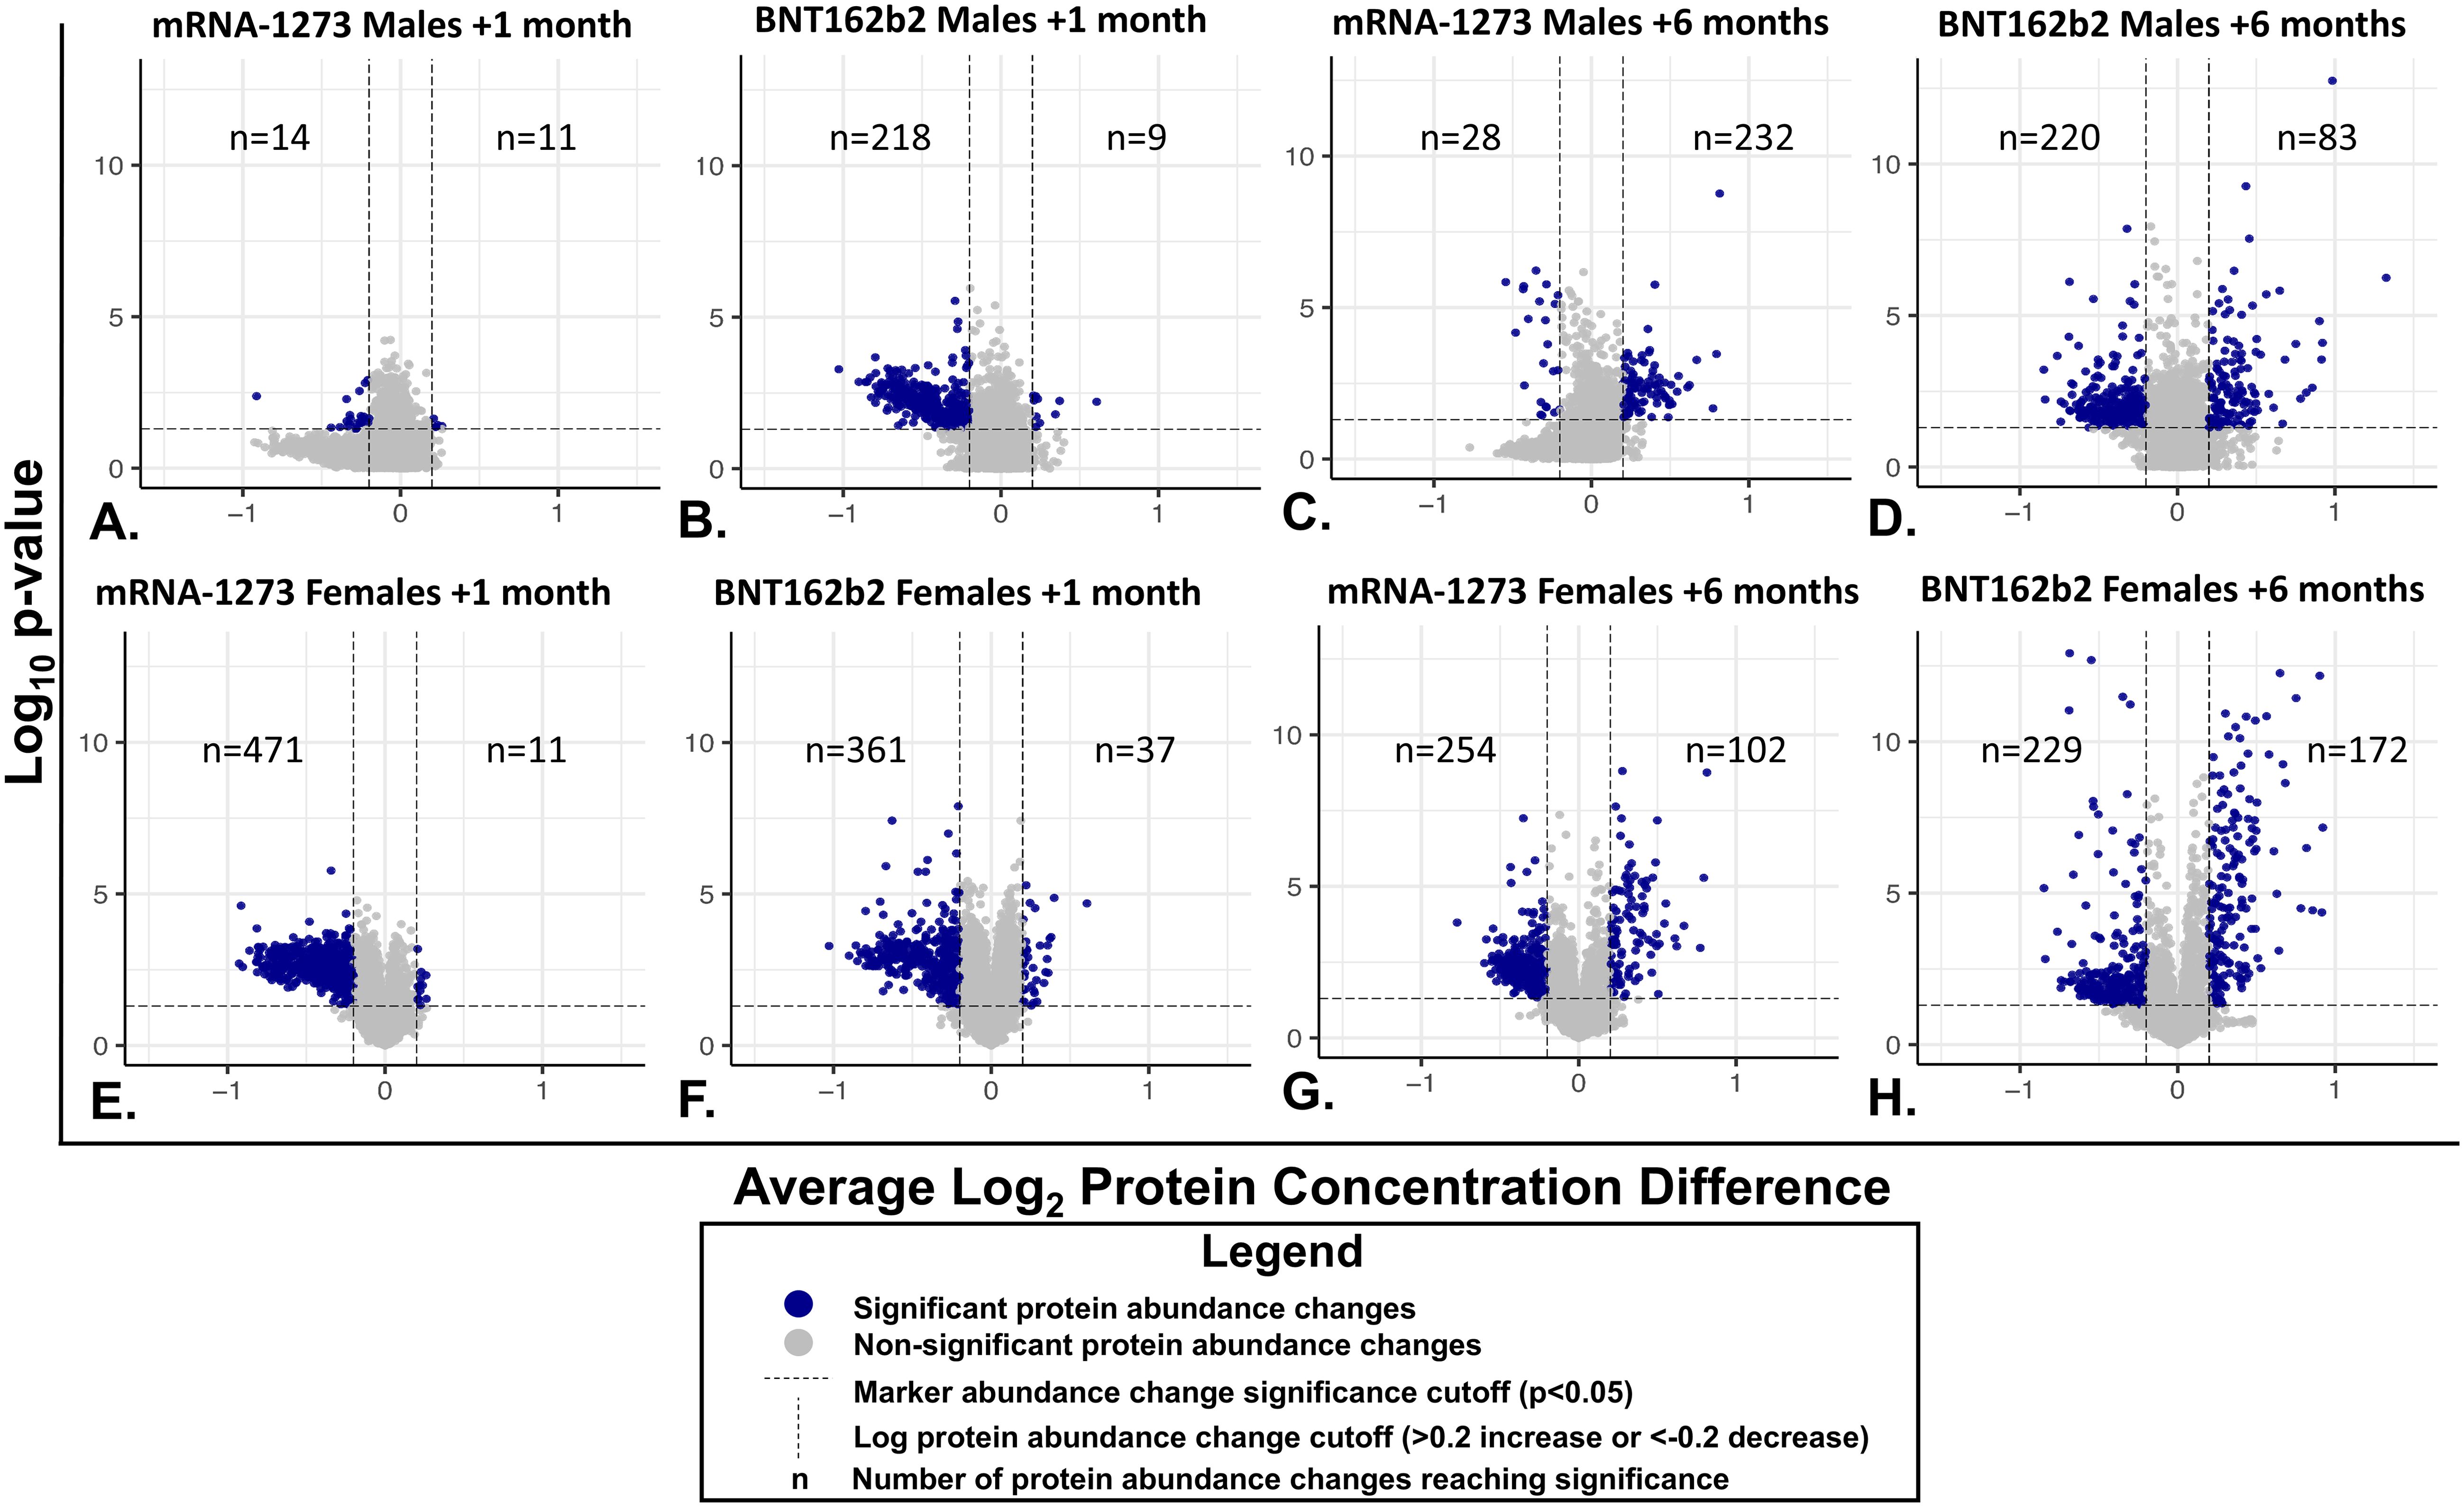
Figure 4. Individual Serum Protein Abundance Change and Statistical Significance at 1-month and 6-Months After Third Vaccination. Each graphed point represents a serum protein marker with detectable change from pre-vaccination levels. Statistical significance (P<0.05) is depicted on the y-axes and Log2 abundance change on the X-axes. Lines of significance (p<0.05 and abundance change <0.2 or >0.2 m) are depicted by dashed lines. Responses in sera from male recipients are shown in panels (A–D), responses in serum from female recipients are shown in the bottom panels (E–H). (A, B, E, F) Responses 1 month after vaccination. (C, D, G, H) 6-month responses. Significant marker changes are depicted with blue dots; grey dots depict marker abundance changes that did not reach significance. N values are listed in each quadrant for significant marker changes.
Sera collected from the male recipients of mRNA-1273 1 month post-third vaccination demonstrated upregulation of 11 markers and downregulation of 14, while sera from female recipients showed upregulation of 14 markers and downregulation of 472 (Figure 3; Supplementary Tables S1A, B). By 6 months, sera from the male recipients of mRNA-1273 showed upregulated 232 protein markers and downregulated 29, while the sera from the female recipient group demonstrated upregulated 102 markers and downregulated 255 (Figure 3; Supplementary Tables S1A, B).
The sera from the male recipients of BNT162b2 showed upregulation of 9 markers at 1-month and downregulation of 218 markers post-third vaccination, while sera from the female recipient cohort demonstrated upregulated 38 markers and downregulated 362 proteins (Figure 3; Supplementary Tables S1A, B). At 6-months post-third vaccination, sera from male recipients showed upregulated 83 markers and downregulated 220, while sera from female recipients demonstrated upregulated 172 markers and downregulated 229 (Figure 3; Supplementary Tables S1A, B).
When evaluated at the cohort level, sera from male recipients of either vaccine at 1-month post-third vaccination demonstrated 1 common upregulated marker (UB2D1/PolyUbiquitin K48), and 1 common downregulated marker (CXCL8, interleukin-8) (Figure 3). In sera from the female recipient cohorts, 7 markers were upregulated (UBE2D1|UBB, CHAC1, LEP, CST5, CST2, INS) and 342 markers downregulated (Figure 3). By 6-months, sera from male recipients of either vaccine upregulated 61 markers and downregulated 18, while sera from female recipients of either vaccine demonstrated upregulation of 86 markers and downregulation of 177 (Figure 3; Table 4; Supplementary Tables S1A, B). Upregulation of UB2D1/PolyUbiquitin K48 was common to sera from all recipient cohorts at 1-month after third vaccination, regardless of sex assigned at birth or vaccine received (Figure 3).
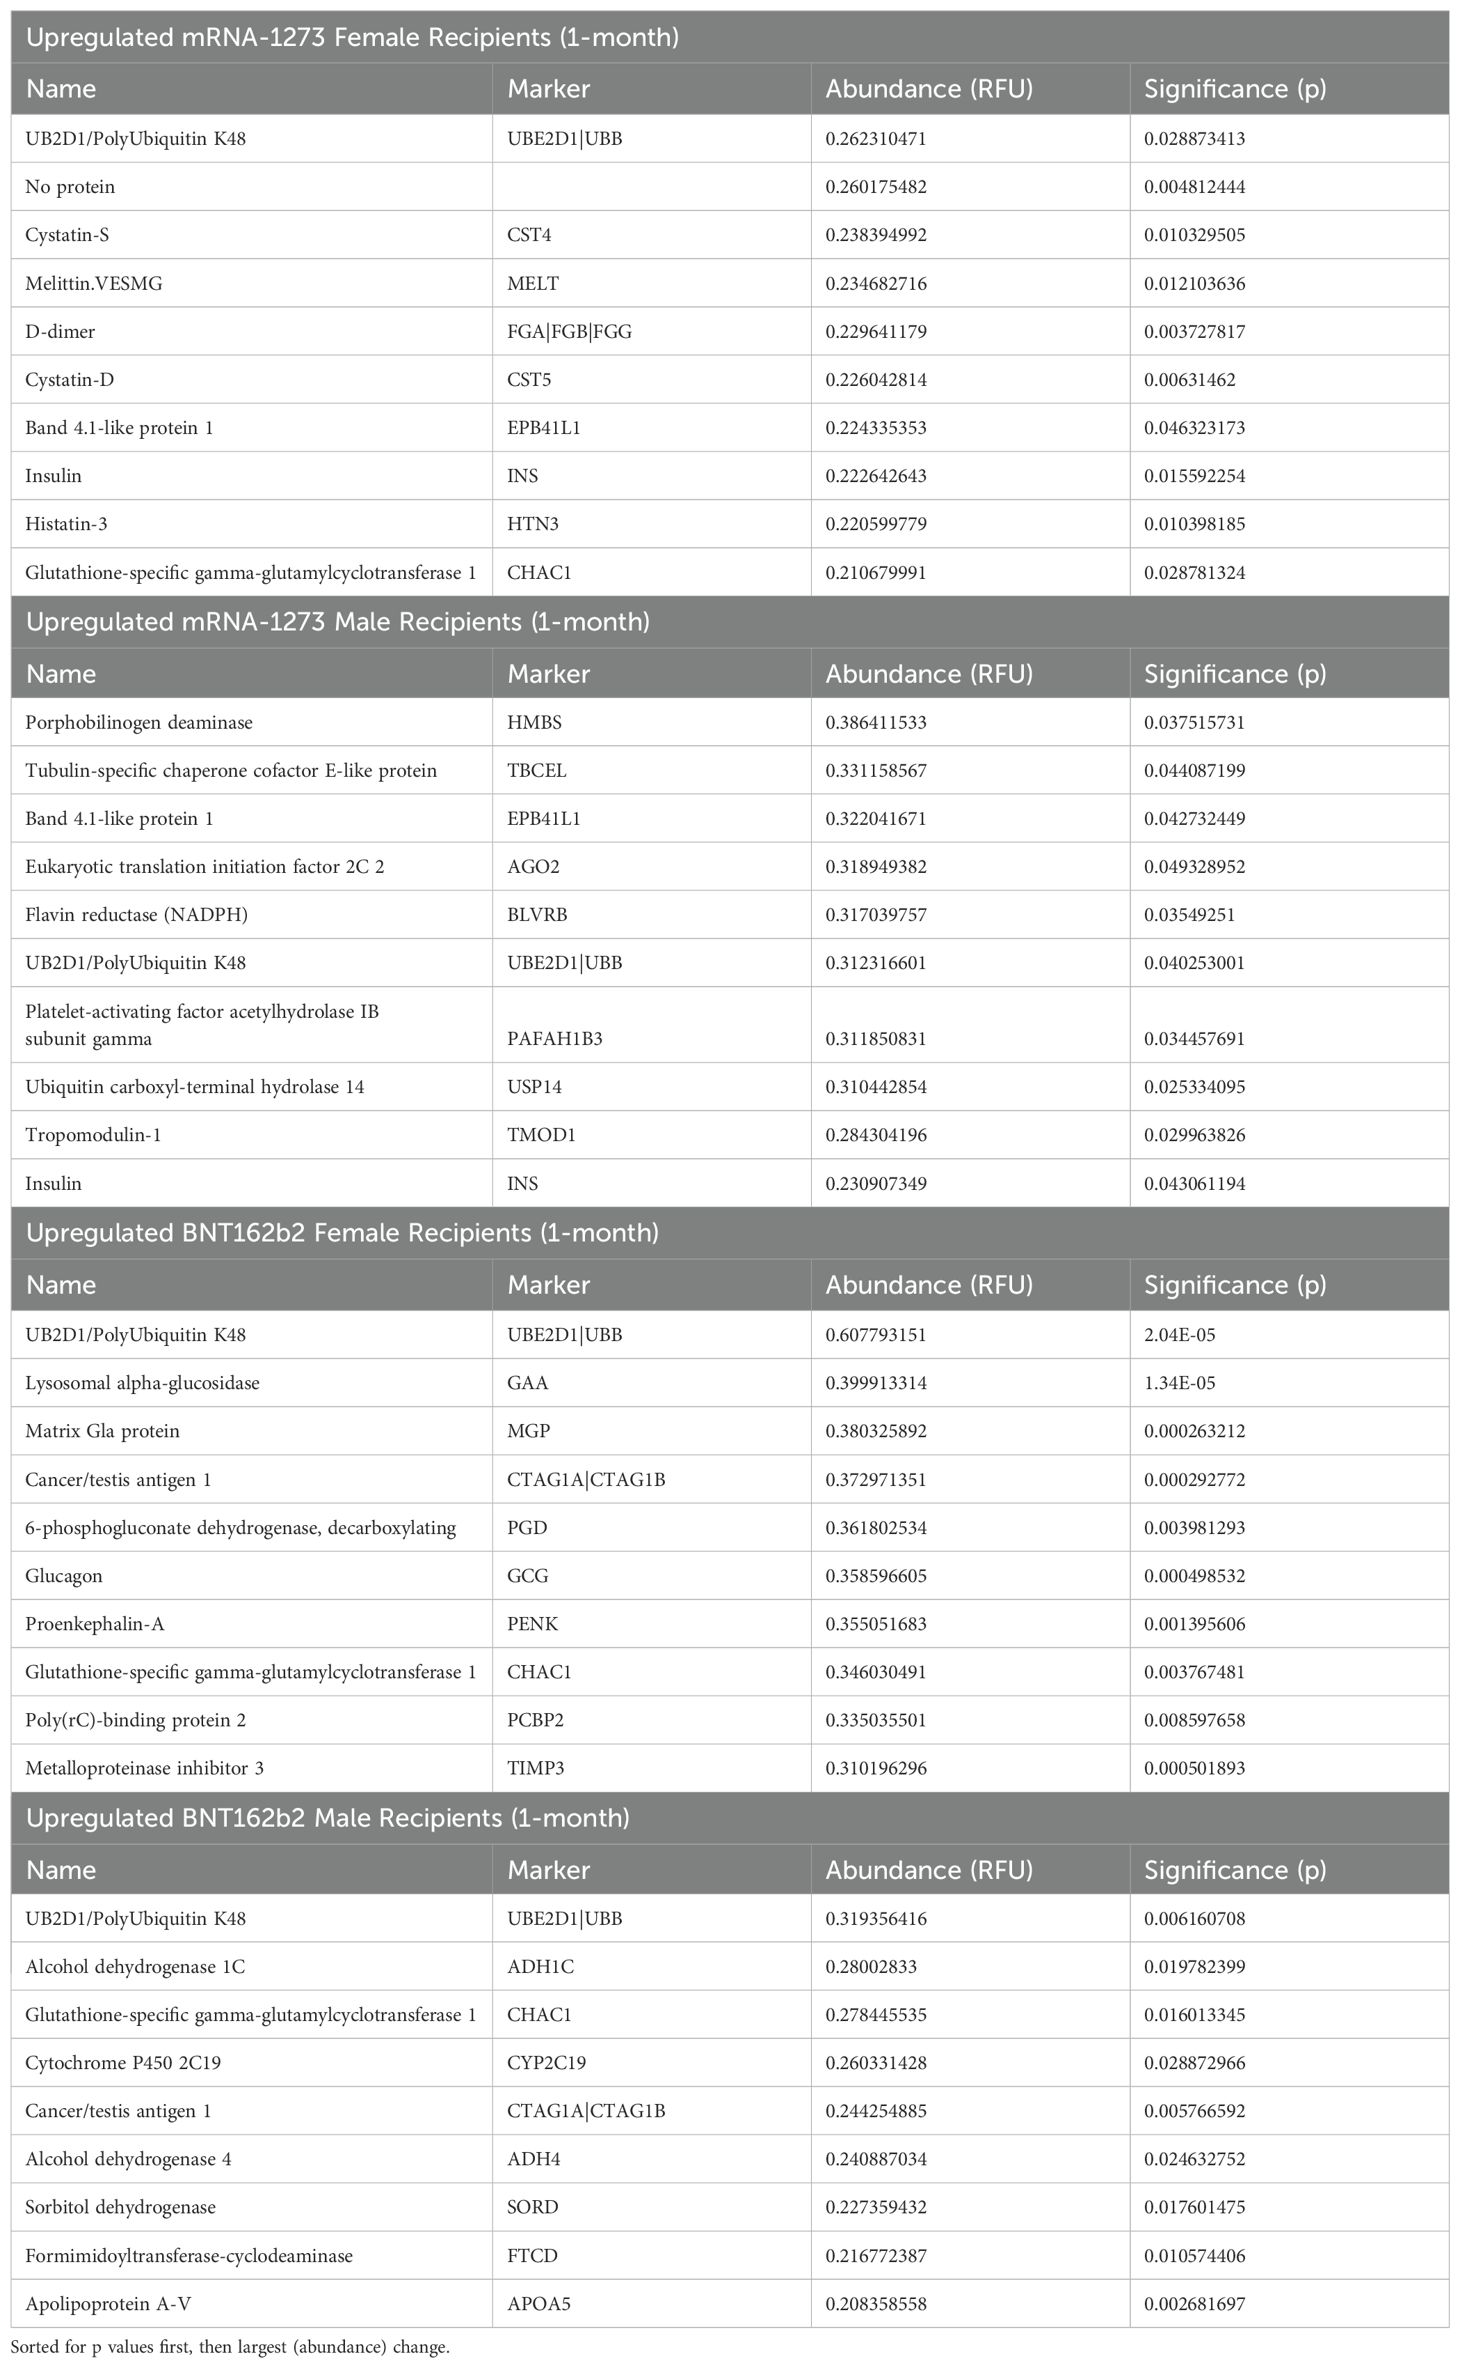
Table 4. Top 10 markers upregulated 1-month post-third vaccination.
Evaluation of the 10 most significant (highest statistical significance/abundance change) proteomic markers upregulated in sera at 1-month after the third dose of vaccine demonstrated that both vaccine groups modulated sets of vaccine-type associated markers, regardless of sex assigned at birth. Specifically, sera from both mRNA-1273 recipient cohorts showed upregulated UB2D1/PolyUbiquitin K48 (UBE2D1|UBB), Insulin (INS) and Band 4.1-like protein1 (EPB41L1), while sera from both BNT162b2 recipient cohorts showed upregulated UB2D1/PolyUbiquitin K48 (UBE2D1|UBB), Glutathione-specific gamma-glutamylcyclotransferase 1 (CHAC1), and Cancer/testis antigen 1 (CTAG1A|CTAG1B) (Table 4).
Biological pathways were assessed based on observed proteomic marker changes according to vaccine received and sex assigned at birth. Proteins with significant changes between pre-third dose and 1-month or 6-months after third dose of vaccine were assessed through REACTOME and KEGG databases to evaluate differential pathways and cellular processes impacted (31, 32). A complete accounting at the cohort level of pathways up- and downregulated in 6-month sera compared to pre-third-dose sera measurements are listed in Table 5.

Table 5. Cellular pathways and processes impacted by third vaccination.
Sera from male recipients of the mRNA-1273 vaccine demonstrated no significantly upregulated or downregulated pathways at 1-month, while sera from female recipients demonstrated an upregulation of 21 (including TLR signaling cascades, fibrin clot formation, and platelet aggregation) and downregulation of 132 pathways, (including membrane and vesical trafficking, platelet activation, and RNA transport) (Figure 5; Table 5; Supplementary Table S2).

Figure 5. Cellular Pathways and Processes Impacted by Third Vaccination. Assessment of pathways modulated by vaccination. Upregulated pathways and cellular processes are presented in panel (A), downregulated pathways in panel (B) Pathway assessments utilized both KEGG and REACTOME databases and identified processes are listed to the left of the figures. mRNA-1273 vaccination responses are indicated by purple, BNT162b2 indicated by green. Lighter colors indicate 1-month, darker colors 6-months. Common pathways between 1-month to 6-months and between BNT162b2 to mRNA-1273 vaccine recipient sera are indicated by the boxes.
At 6-months, sera from male recipients of mRNA-1273 demonstrated upregulation of 51 pathways (including class I antigen processing, metabolism of RNA, eucaryotic translation and peptide chain elongation) and downregulation of 4 (including complement activation, coagulation cascades, and peptide ligand receptors). Sera from female recipients of mRNA-1273 demonstrated upregulation of 30 pathways at 6-months (including class I antigen processing, metabolism of RNA, and peptide chain elongation) and downregulation of 25 (including endocytosis, membrane and vesicle trafficking and platelet activation) (Table 5; Figure 5; Supplementary Table S2).
One month after booster, the sera from male recipients of BNT162b2 demonstrated upregulation of 11 pathways (including APC-Cdc20 degradation and TICAM1 and RIP1 signaling) and downregulation of 30 (including platelet activation, membrane trafficking, and RNA transport), while sera from the female recipients demonstrated upregulation of 4 pathways (including TICAM1 and RIP1 mediated signaling) and downregulation of 67 (including membrane and vesical trafficking, platelet activation, and RNA transport) (Table 5; Figure 5; Supplementary Table S2). Upregulated pathways in sera from both male and female recipients of BNT162b2 included TICAM1, RIP1 mediated IKK signaling (Figure 5; Supplementary Table S2).
By 6-months post-third vaccination, sera from the male recipients of BNT162b2 showed upregulation of 17 pathways or processes associated with protein synthesis (mRNA processing and translation), regulation of cellular function (SLIT – ROBO pathway), and suppression of RIG-1 signaling pathway (DDX58/IFIH1) and downregulation of 19 (including membrane trafficking, endocytosis, and EGFR, RTK, MET, CD28, SCF-KIT, and ESCRT signaling). The sera from the female recipients of BNT162b2 demonstrated upregulation of 20 pathways and processes (including innate immune system activation, class I antigen processing, glycolysis and neddylation) and downregulation of 14 (including membrane and vesical trafficking, endocytosis, and platelet activation) (Table 5; Figure 5; Supplementary Table S2).
We evaluated common trends detected in pathways impacted by vaccination and found 17 pathways, including membrane trafficking, endocytosis and EGFR signaling pathways, were downregulated in sera from male recipients of BNT162b2 at 1-month and at 6-months, and 1 upregulated (metabolism) (Figure 6; Table 5). Likewise, sera from female recipients of BNT162b2 demonstrated 12 common pathways downregulated at 1-month and 6-months, most notably platelet activation, vesicle trafficking, endocytosis and signaling by RAB (Figure 6; Table 5). No comparisons were possible between sera from the male recipients of BNT162b2 and mRNA-1273 at 1-month because no significant pathway changes were noted in the mRNA-1273 group even though there were significant marker changes (Figure 6; Table 5). There was 1 common pathway upregulated in sera from female recipients of either vaccine at 1-month post-third vaccination: synthesis, secretion, and deacylation of Ghrelin (Figure 6; Table 5). Sera from recipients of either vaccine, regardless of sex assigned at birth (except male recipients of mRNA-1273), demonstrated upregulation of translation, peptide chain elongation and RNA metabolism and processing at 6-months (Figure 6; Table 5).
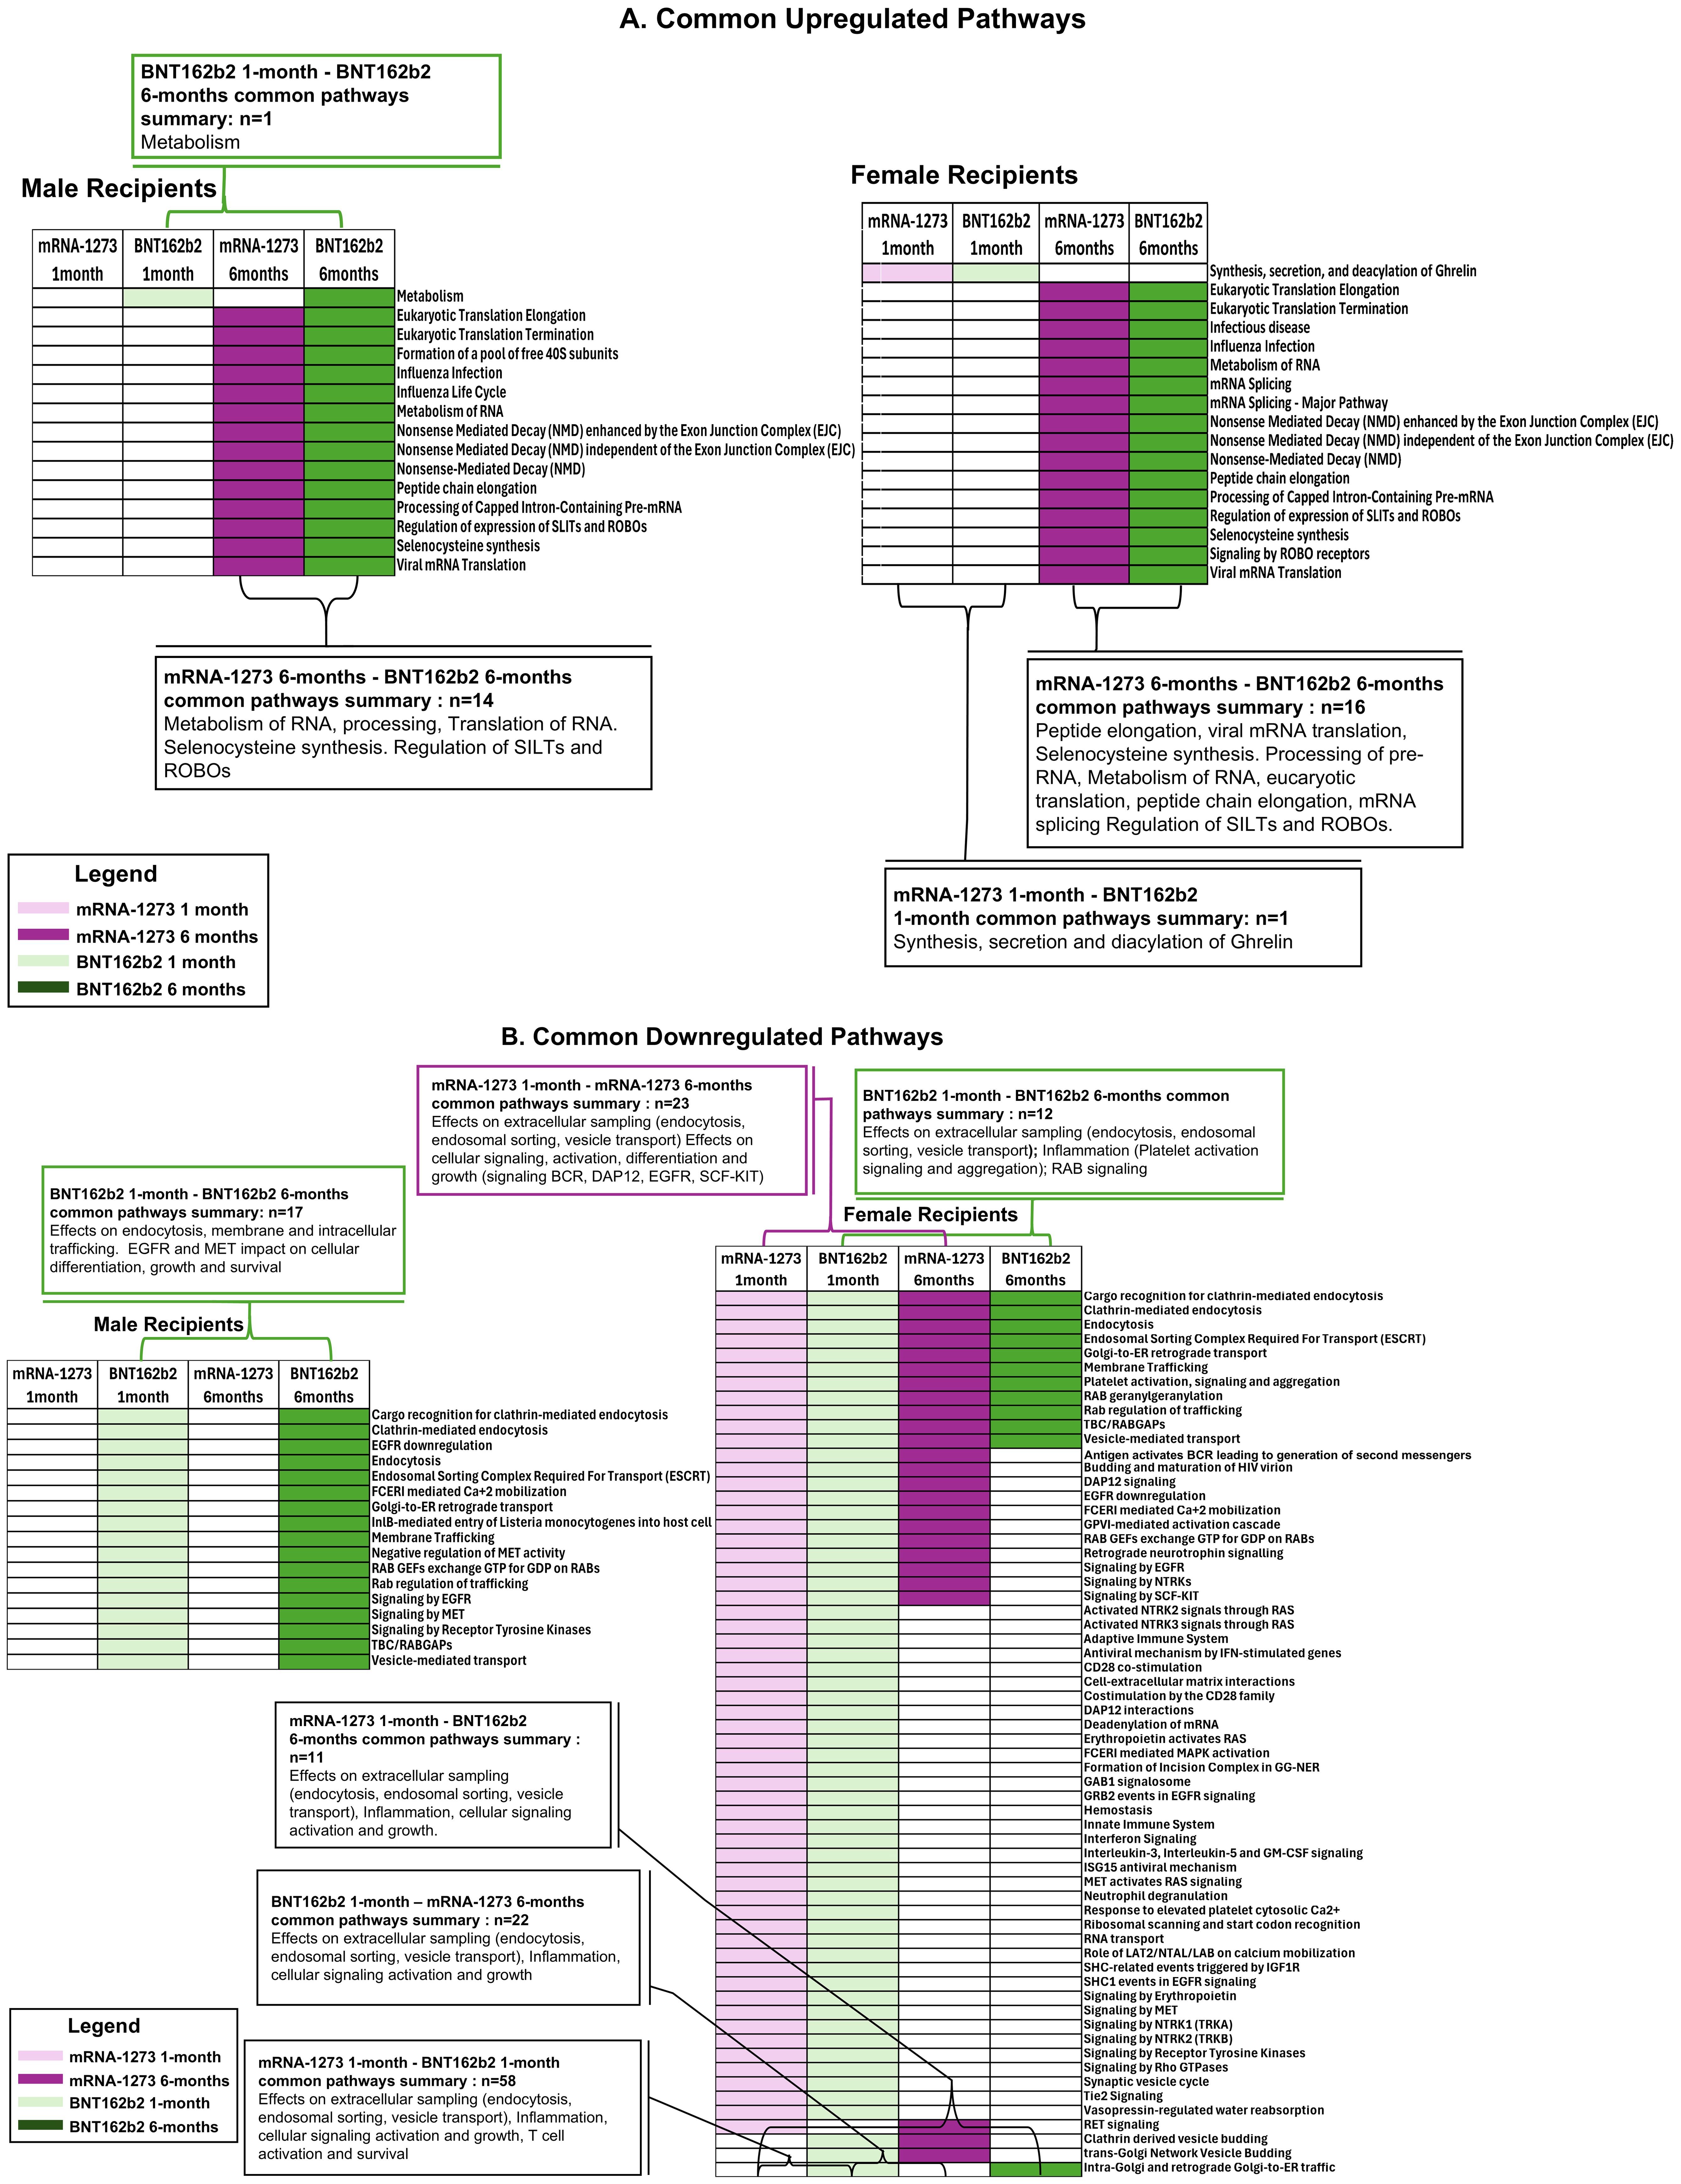
Figure 6. Common Pathways Modulated by Third Vaccination. Common cellular pathways and processes (A) upregulated or (B) downregulated according to BNT162b2 (green) and mRNA-1273 (purple) cohorts at 1-month (light green/purple) and 6-months (dark green/purple) after third vaccination. Number of common pathways (n) are indicated in the boxes.
The overarching goal of this study was to investigate the possibility of identifying proteomic markers in pre-boost sera that are predictive of humoral response robustness to vaccination at later timepoints. Predictive modeling was performed as a pilot effort to investigate the utility of machine learning to identify markers or develop models of vaccine responsiveness (Figure 1). Change in anti-spike IgG antibody levels (BAU/mL) in pre-third vaccination and 6-month post-third vaccination sera were analyzed to identify vaccine-recipient samples with either “higher” or “lower” antibody content. The predictive potential of proteomic markers of avidity responses were not analyzed due to the limited range of AI measurements. The sera with the lowest and highest quartile of antibody titers were identified as “lower” and “higher” responders (Figure 7). Specifically, 44 vaccine-recipients with 6-month serum IgG anti-SARS-CoV-2 Spike antibody less than 2000 BAU/mL (7 male and 11 female recipients of mRNA-1273, 13 male and 13 female recipients of BNT162b2) were identified as relatively “Lower” responders, and 39 vaccine-recipients with sera containing greater than 5000 BAU/mL (9 male and 10 female recipients of mRNA-1273, and 8 male and 12 female recipients of BNT162b2) were identified as relatively “Higher” responders (Figures 1, 7; Table 6). The demographics of these 2 populations were well-balanced concerning sex assigned at birth and vaccine-received (Table 6).
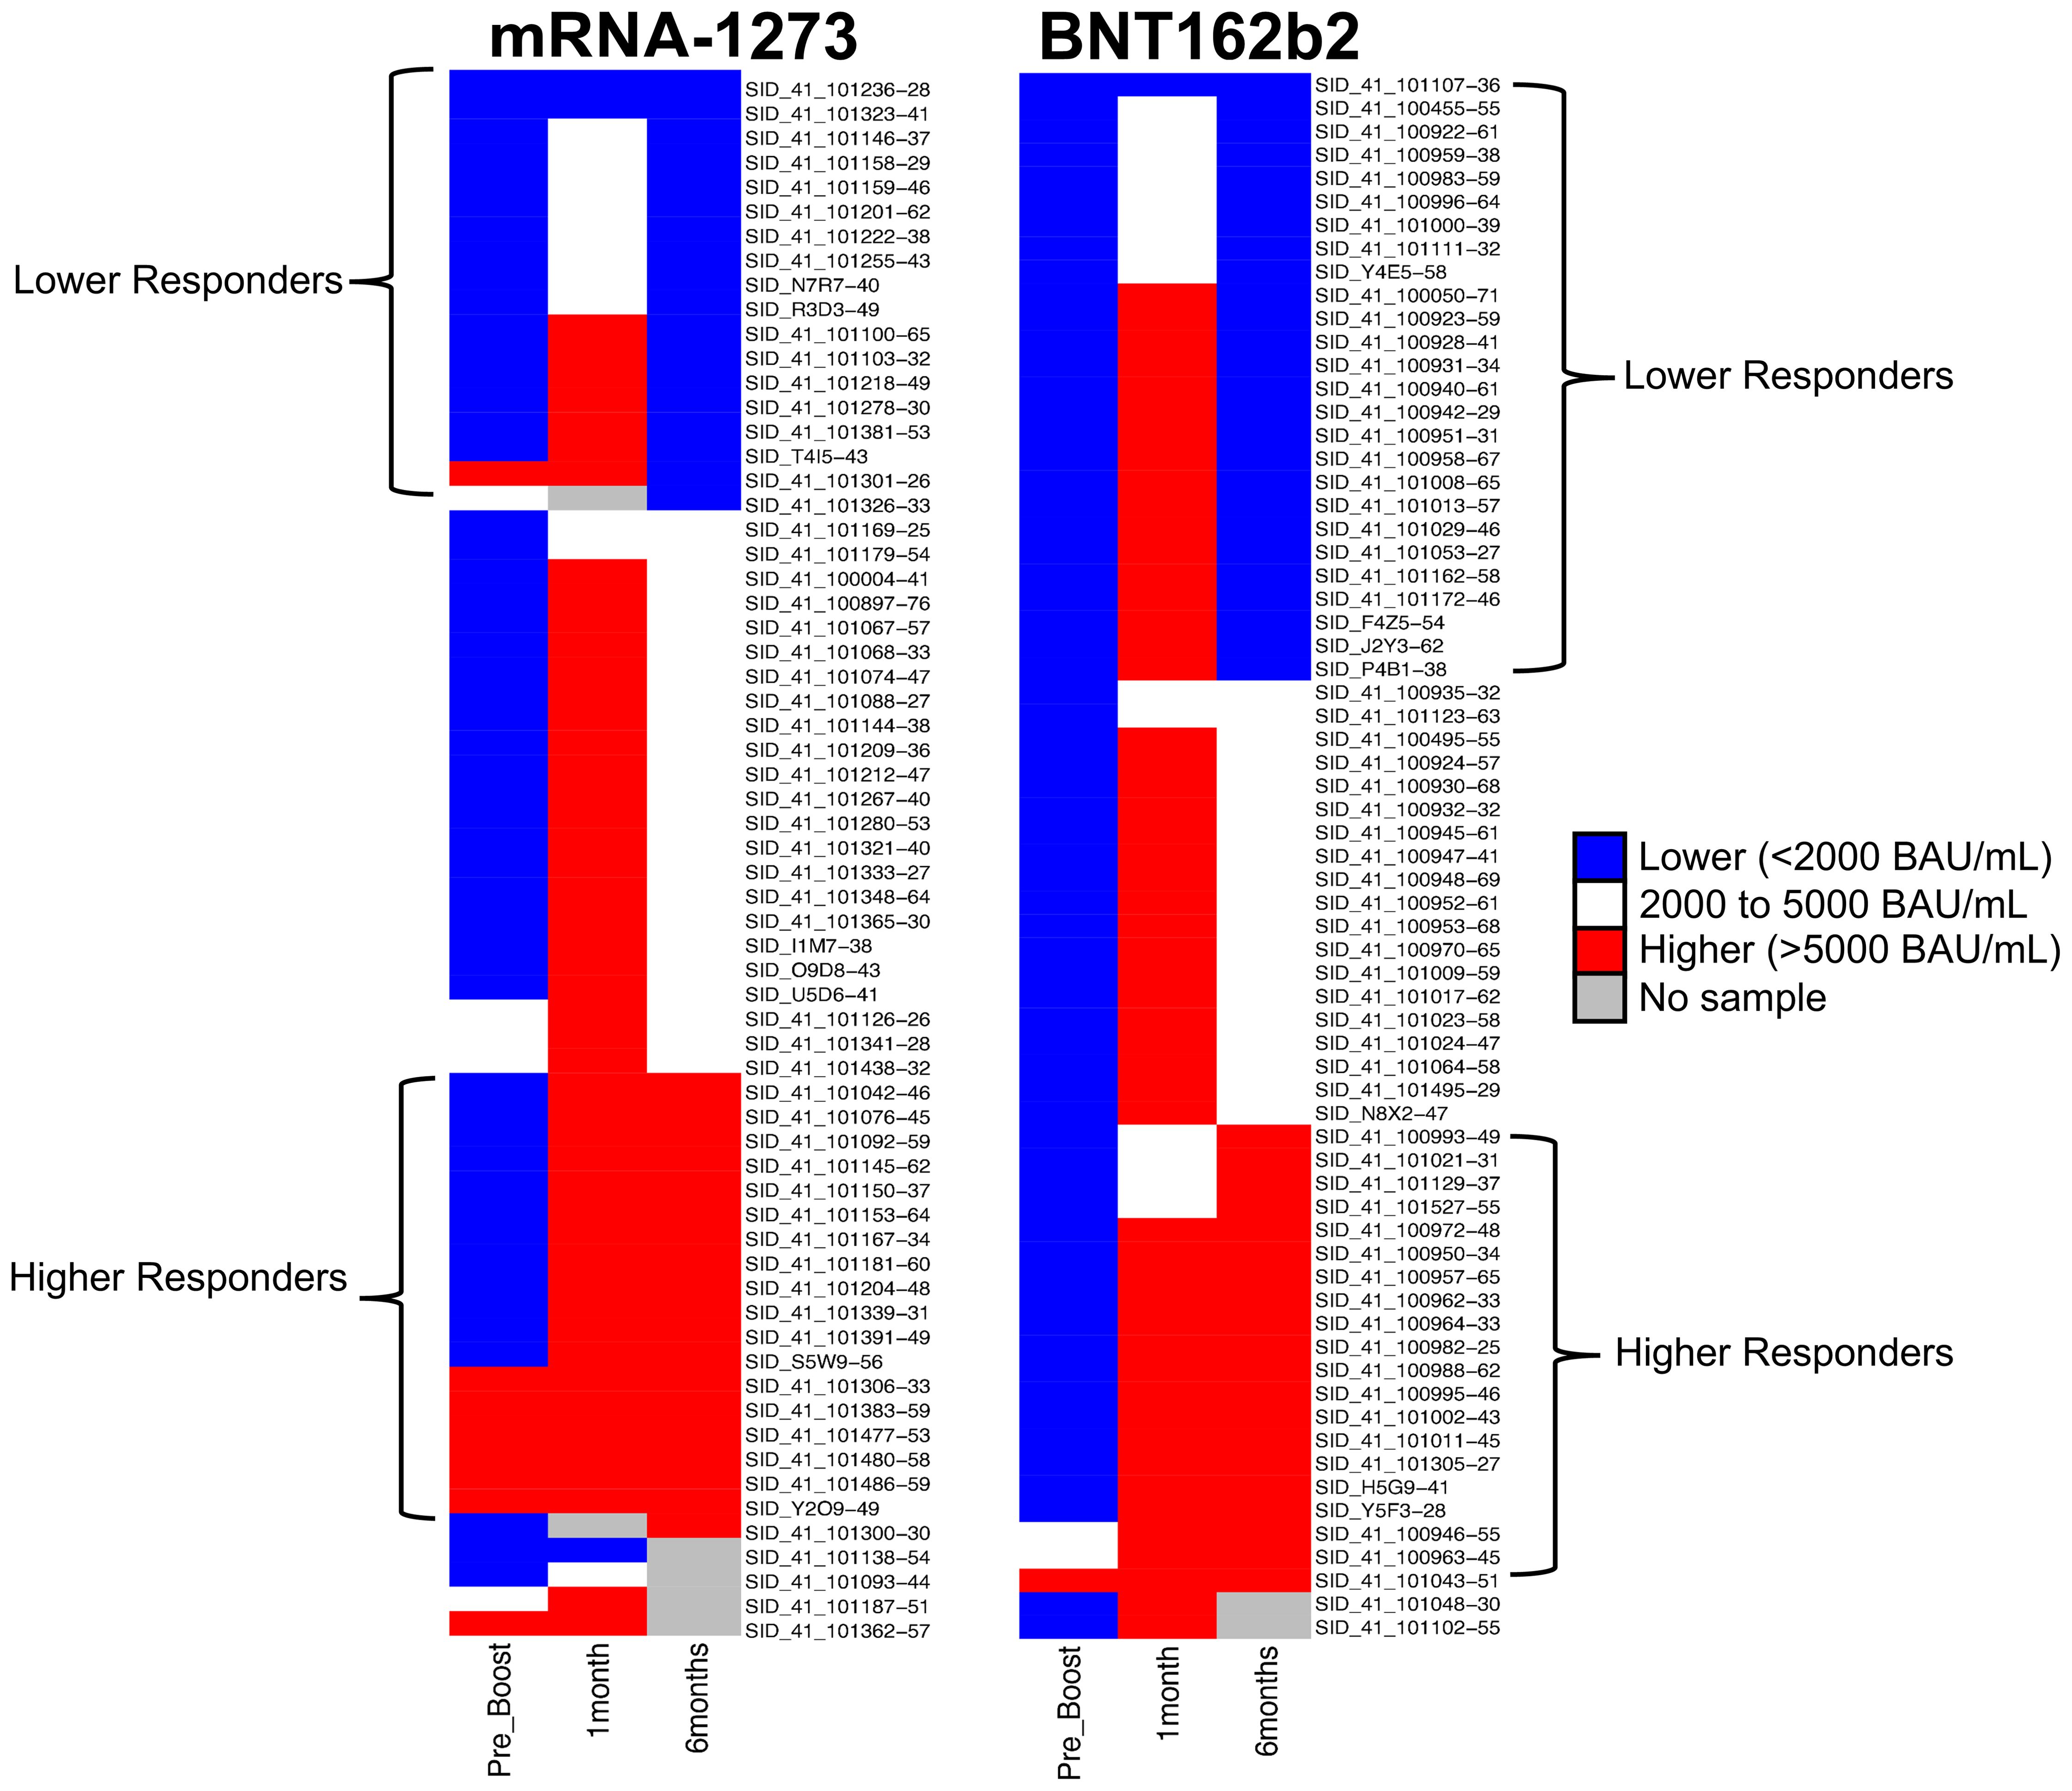
Figure 7. Serological Antibody Assessment of IgG to SARS-CoV-2 Spike S-2 Protein at Pre-Third Dose and 1, 6 Months after Homologous Third Vaccination. Serology Response (Antibody Content BAU/mL) Test Result Distribution. Test results are broken out into tertiles; Higher responses (red), lower responses (blue), middle responses (white). Grey indicates samples unavailable for testing and there are no data. Column 1: Pre-third vaccination; Column 2: 1-month; Column 3: 6-months. Column 4 lists vaccine-recipient identification numbers.
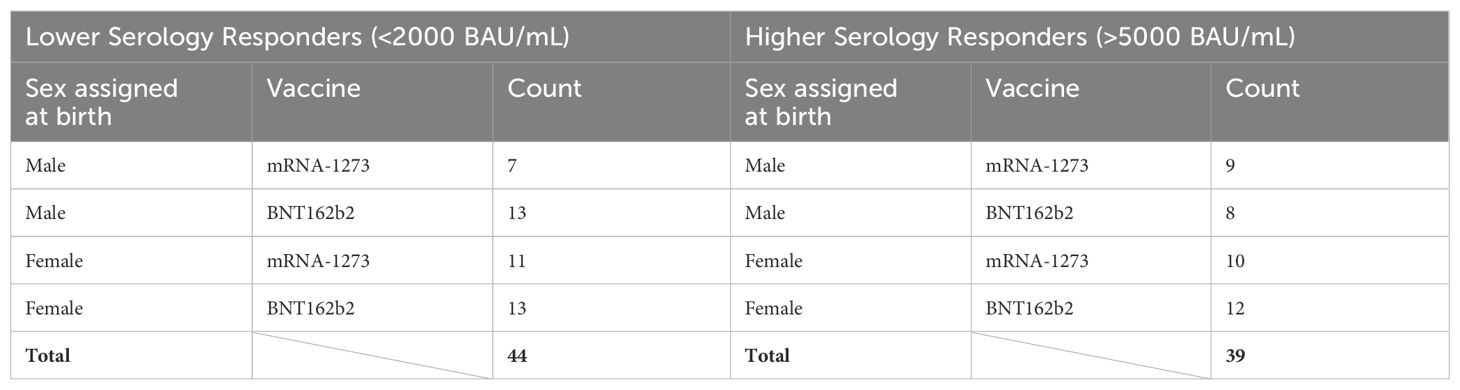
Table 6. Selected vaccine-recipient samples to develop model of 6-month post-third vaccination serology.
Random Forest (RF) modeling, which combines outputs of multiple “decision trees” to reach a single result, was used for predictive modeling. Attempts to develop predictive models restricted by vaccine or sex assigned at birth did not return results with sufficient power due to the limitations of small cohort sizes. However, evaluation of the entire dataset as a single cohort returned a productive model that was statistically different from random selection (Figure 1).
An RF model with 85 marker values from the pre-third vaccination sera could predict higher (>5,000 BAU/ml) and lower (<2,000 BAU/mL) responders at month-6 with 79.17% accuracy (Figure 1). The associated markers and comparative changes are listed in Supplementary Table S3 (Figure 7). Protein markers with the highest predictive power (i.e. markers that contributed the most to the model) were associated with complement cascade and activation, signaling by interleukins, tumor necrosis factor receptor (TNFR) apoptotic signaling, IL-17 signaling and phosphoinositide 3-kinase (PI3K) signaling (Table 7).
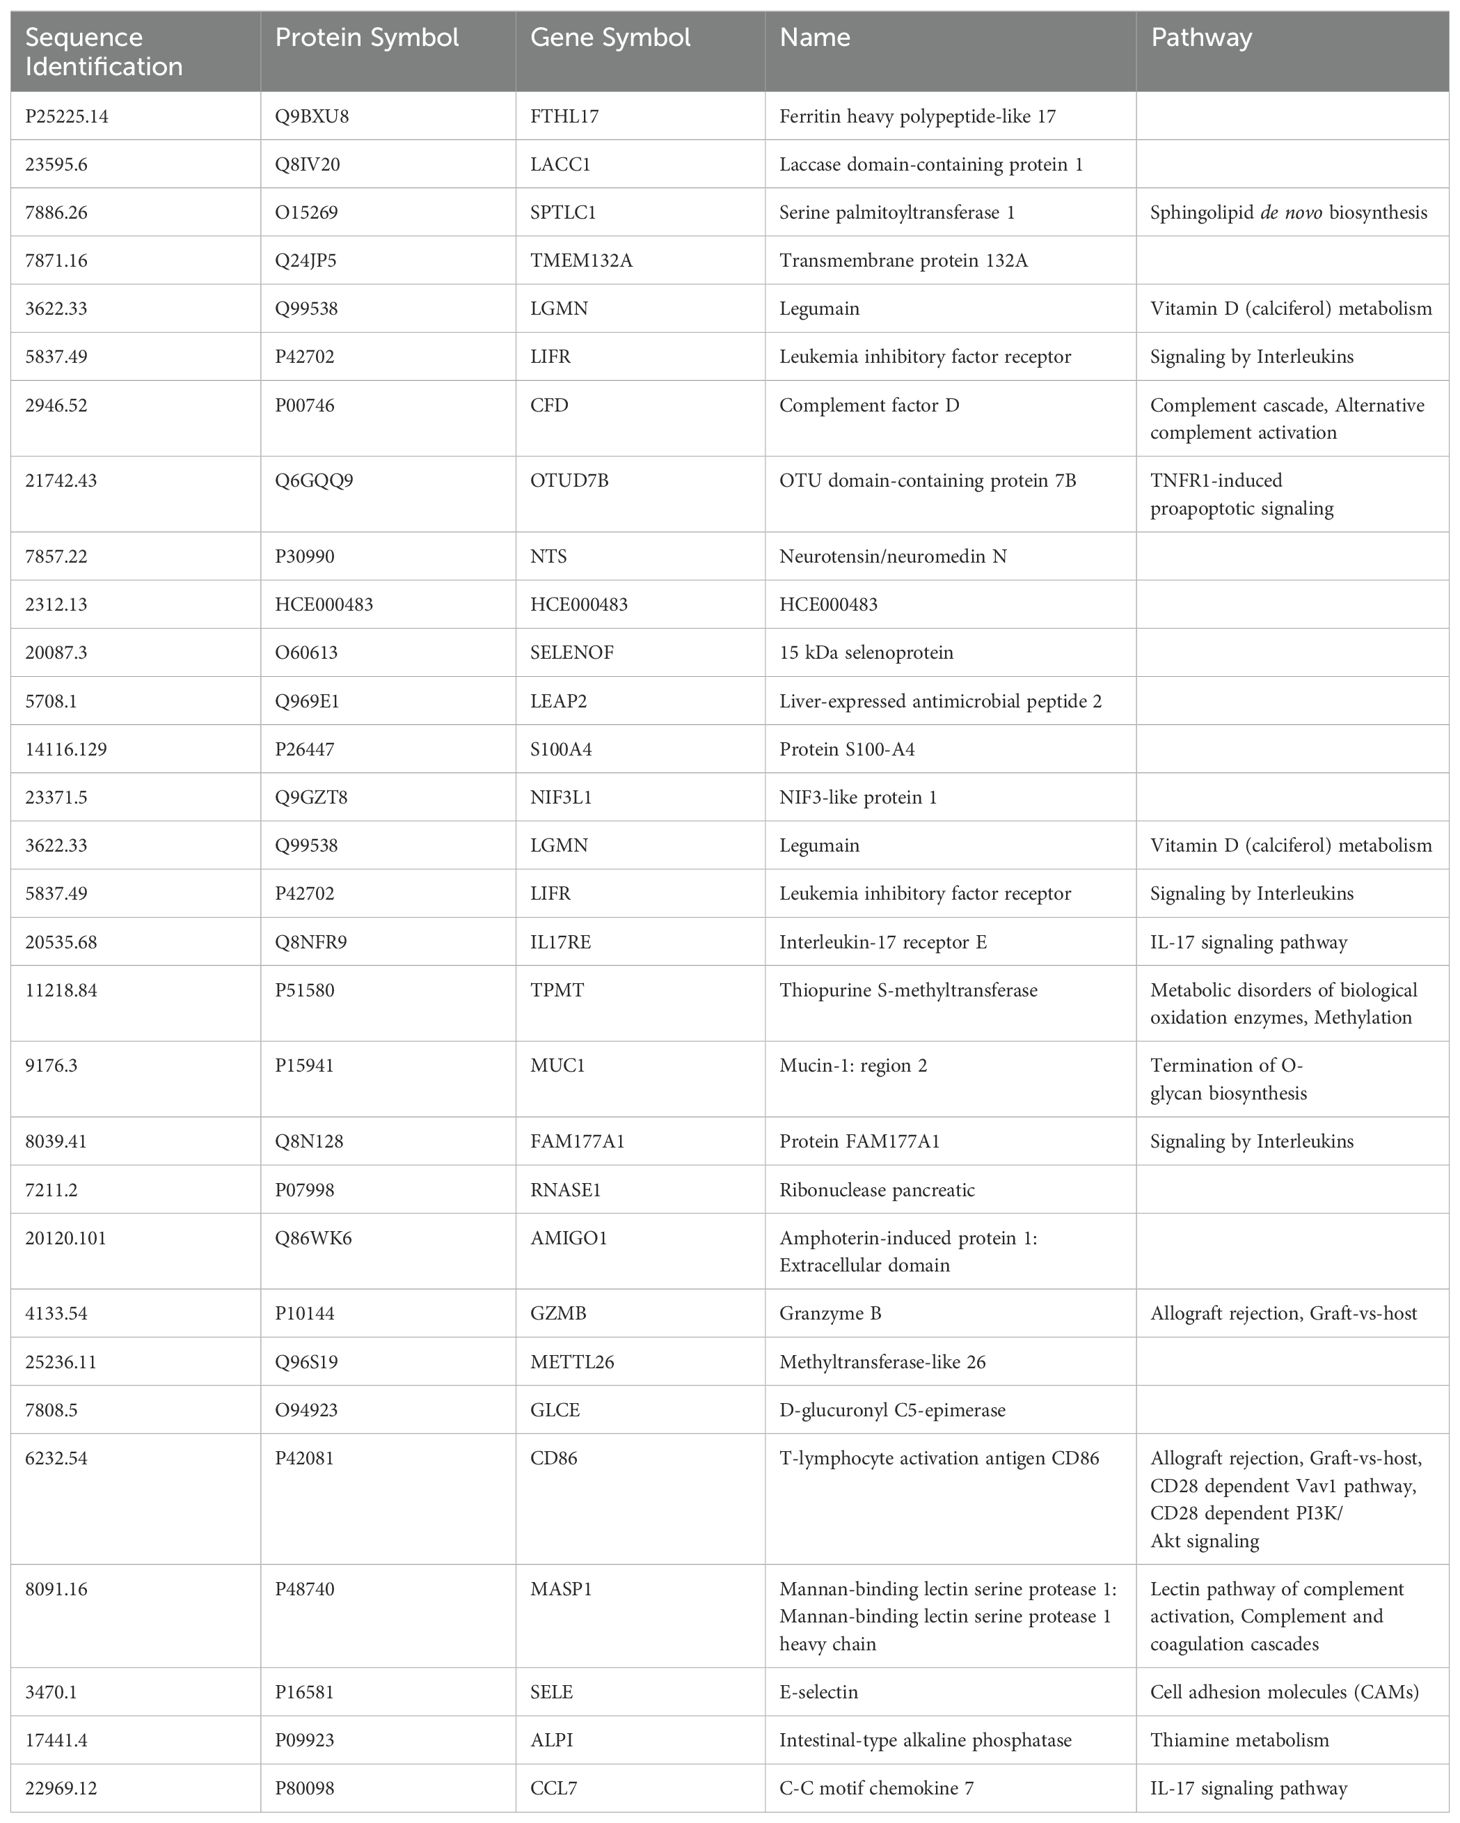
Table 7. Top 30 markers and pathways that contributed to the predictive model of 6-month post-third vaccination serology responses.
The SARS-CoV-2 pandemic fueled the development and wide administration of 2 novel mRNA vaccines: mRNA-1273 and BNT162b2. These new vaccines have proven to be both effective and versatile, allowing for protection against severe disease caused by SARS-CoV-2 as well as being easily amendable to rapid adjustment for targeting new viral variants on a large scale (33, 34). Precipitous decreases in antibody levels after primary vaccination and lack of vaccine effectiveness against rapidly emerging variants affected the longevity of vaccine-imparted immunity, leading to booster recommendations for all BNT162b2 and mRNA-1273 recipients (7, 8, 11–13, 16, 17). However, studies are suggesting differences in COVID-19 vaccine efficacy in different populations (2–4, 6–10). Consequently, correlate(s) of protection or immunity are needed to help determining which and when populations need additional doses.
Traditionally, studies have looked to binding or neutralizing antibody levels as surrogate correlates of protection against various pathogens (20). However, correlates of protection against SARS-CoV-2 infection or severe disease are not yet fully established (35). In addition, studies have not yet comprehensively investigated if detection of systemic proteomic changes in the blood after vaccination can predict longitudinal immune responses.
The SARS-CoV-2 mRNA vaccines are known to activate both adaptive and innate immune responses due to their complex nature (36, 37). The lipid delivery systems of mRNA vaccines may have strong inflammatory effects (38, 39), as lipid nanoparticles can be detected by TLR-4 and TLR-2 (37, 40, 41). The RNA components could also trigger a variety of innate sentry sensors (TLR receptors) such as TLR-3, TLR-7, and TLR-8 (37, 42). Repetitive vaccination with mRNA vaccines may also have additional effects, as studies have demonstrated that repeated vaccinations can correlate with upregulation of dendritic cell activation and TLR signaling; BNT162b2 vaccination induces a moderate innate immune response that increases notably with subsequent vaccinations (36).
In this proof-of-concept study, we explored the feasibility of using proteomics to further analyze COVID-19 vaccine immunogenicity according to vaccine type, recipient sex assigned at birth, and time since third vaccination. Protein marker expression in pre-third vaccination sera were analyzed for predictiveness of robustness/weakness of antibody responses to vaccination by 6-months post-third vaccination.
The measured serologic responses to third vaccination doses were comparable irrespective of vaccine or sex assigned at birth of the recipient, however the proteomic assessments differed extensively. Proteomics marker modulation and pathway functional enrichment analyses revealed significant marker changes and process differences at the cohort level based on sex assigned at birth, including pathways related to RNA processing, protein synthesis, and cell cycle regulation. Interestingly, pathways associated with innate and adaptive immunity and inflammation were particularly evident in the proteomics data.
Our cohort level analyses identified 3 upregulated markers common to sera from recipients of mRNA-1273 vaccine regardless of sex assigned at birth: UB2D1/PolyUbiquitin K48 (UBE2D1|UBB), Insulin (INS) and Band 4.1-like protein1 (EPB41L1). Insulin is a hormone product of the INS gene (43). Secreted by pancreatic-beta cells, the primary role of insulin is to regulate energy levels by acting in the muscle and adipose tissues to mediate blood glucose deposition and storage (43, 44). The Band 4.1-like protein1 (EPB41L1) is an erythrocyte membrane protein, an important membrane skeletal protein that provides a connective bridge between the actin cytoskeleton and numerous trans-membrane proteins that function in cellular adhesion, migration and invasion (45, 46). Loss of EPB41L1 expression is reported in multiple cancer types and may play an important role in metastasis (45, 46). There are no available reports describing Band 4.1-like protein1 increase in serum following third vaccination of any type. However, there have been case reports of pancreatitis or development or worsening of diabetes following COVID-19 infection and vaccination with BNT162b2 or mRNA-1273, both of which could affect plasma insulin levels (47–53).
Sera from BNT162b2 vaccine cohorts, regardless of sex assigned at birth, showed upregulation of 3 common markers at 1-month post-third vaccination: UB2D1/PolyUbiquitin K48 (UBE2D1|UBB), Glutathione-specific gamma-glutamylcyclotransferase 1 (CHAC1), and Cancer/testis antigen 1 (CTAG1A|CTAG1B). Glutathione-specific gamma-glutamylcyclotransferase 1 is a proapoptotic endoplasmic reticulum (ER) stress protein (54). Overexpression of the enzyme results in glutathione depletion, which adversely impacts the regulation of the cellular oxidative balance between reactive oxygen species and antioxidant defenses (55). Cancer-testis antigen are antigens identified in a variety of malignant tumors and are normally only expressed in testis tissues (56). However, testis antigens have been identified in cancer tissues in both male and female patients and can be a primary target of anti-cancer immune responses (56). To date, there are no searchable reports describing modulation of either Glutathione-specific gamma-glutamylcyclotransferase 1 proteins or cancer-testis antigens in sera associated with either SARS-CoV-2 infection or vaccination with either BNT161b2 or mRNA-1273.
UB2D1/PolyUbiquitin K48 was increased in all vaccine cohorts at 1-month regardless of sex assigned at birth. The protein accumulates early in the oxidative stress response and binds oxidized proteins that are then targeted for removal through the ubiquitin/proteasome system (57). Additionally, k48-linked proteins can be detected following DNA damage, suggesting a role in protein degradation in that pathway as well (58). There are no searchable reports describing upregulation of UB2D1/PolyUbiquitin K48 protein in serum following either vaccination for or infection with SARS-CoV-2. However, oxidative stress has been associated with inflammation (59) and the induction of cytokine storm and tissue damage caused by SARS-CoV-2 infection (60). The current mRNA vaccines do have a recognized inflammatory component as described above.
In sera from female recipients of either vaccine at 1-month post-third vaccination, 7 markers (UBE2D1|UBB, CHAC1, LEP, CST5, CST2, INS) were upregulated and 342 downregulated. Leptin (LEP) is a hormone produced in adipose tissue and is involved in regulation of appetite, neuroendocrine function and energy homeostasis (61). Leptin has been shown to amplify inflammatory immune responses through the innate immune system by promoting cellular proliferation and survival, mediating secretion of mediators of inflammation, and migration of innate effector cells (62). While there are no reports of vaccine induced serum Leptin increases, there are reports of elevated plasma Leptin in intensive care patients with COVID-19 compared to healthy study participants (63). CST5 (or cystatin D) and CST2 (cystatin SA) are members of the cystatin superfamily of related proteins (64, 65). CST5, specifically, has been shown to be inhibitory against coronavirus replication, while CST2 acts as a protease inhibitor (64, 66) that protects against allergen, viral and bacterial proteases that can have a role in inflammatory tissue remodeling (67).
Sera from both male and female recipients of BNT162b2 demonstrated upregulated TICAM1, RIP1 mediated IKK signaling at 1-month. TICAM-1 is a molecule that has a role in TLR-3 signaling following double-stranded RNA detection. It physically binds the TIR domain of TLR-3 and activates the IFN-beta promoter I in response to dsRNA (68). Receptor-interacting serine/threonine-protein kinase-1 (RIP1) is a cellular kinase at the crossroads of inflammation signaling and cellular death, regulating pro-survival NF-KB signaling and inflammation, or, upon modification, promoting cellular death by binding death receptors signaling apoptosis or necrosis (69–73). IkB kinases (IKK signaling) are multiprotein complexes that regulate a diverse array of biological processes including innate immunity and inflammation (74).
Sera from female recipients of mRNA-1273 showed upregulation of multiple pathways 1 month after a third vaccination associated with innate immune activation, including Toll-like receptor (TLR) surveillance, and processes such as fibrin clot formation, amyloid fiber formation, and platelet aggregation (75–78). In addition, mitosis regulation (Nek2A degradation) was upregulated in sera from female recipients of mRNA-1273 and sera from male recipients of BNT162b2 at the 1-month timepoint. Receptor signaling through MAPK, MAP2K and RAS was also notedly enhanced in sera from the female recipients of mRNA-1273 at 1-month. These signals may indicate oxidative stress, as both the MAPK - MAP2K and RAS signaling pathways interact with reactive oxygen ions to play a role in promoting or suppressing tumorigenesis (79, 80). Specifically, the Raf-Ras-MEK1/2-ERK1/2 signaling pathway can promote tumorigenesis while the p38 mitogen activated protein kinases pathway (MAPK) suppresses cancer through oncogene-induced senescence, inflammation-induced senescence, contact inhibition, and DNA damage responses (79, 80). There were no searchable reports describing Nek2A degradation following vaccination for, or infection with SARS-CoV-2. MAPK signaling is enhanced in COVID-19 acute respiratory syndrome (81, 82), but there were no searchable reports that indicated enhancement following vaccination with BNT162b2 or mRNA-1273. While sera from male recipients of mRNA-1273 at 1-month demonstrated marker modulation that was statistically significant, those findings could not be mapped to statistically significant changes in somatic pathways or processes (Figures 3, 5; Supplementary Figures S1, S3).
Proteomic assessments detected class I antigen processing and peptide chain elongation in sera from 6-months post-third vaccination in all cohorts irrespective of vaccine or sex assigned at birth (except in male recipients of BNT162b2), indicating antigen processing for CD8 T-cell activation (83). These observations are consistent with those of Zhang et al. (84), which demonstrated sustained T-cell responses 6 months after third vaccination with mRNA-1273 or BNT162b2 (84). In addition, sera from female recipients of BNT162b2 demonstrated innate immune system activation at 6-months. The activation of innate responses would be expected early after a third vaccination due to signaling through sentinel receptors like TLRs and RIG-I (85, 86), which would be unlikely at 6-months. It is important to note that as proteomic assessments are extremely sensitive and these results may have been reflective of normal immune surveillance encounters of “every-day” threats or pathogen associated molecular patterns (PAMP), and not specifically vaccine-associated events.
Our study results did not identify specific individual markers predictive of either robust or weaker IgG antibody responses at 6-months, but they did allow for the development of a predictive machine learning model. The small sample size limited the power of our results; assessments of protein marker abundances in pre-third vaccination sera to develop a working model were only productive when the entire dataset was evaluated irrespective of vaccine or sex assigned at birth. Assessments of pre-third vaccination serum protein markers identified 85 markers that predict SARS-CoV-2 spike IgG responses at 6-months with up to 79.17% accuracy (Supplementary Table S3). This data indicates that protein levels of these 85 markers in sera collected from individuals pre-third dose can be predictive of higher or lower immunological response at 6-months post-third-dose. Thirty of these markers were identified as top drivers of the predictive model, they were markers significantly associated with signaling by interleukins including, tumor necrosis factor receptor (TNFR), PI3 kinase, and IL-17. Additionally, there was a significant association with activation of the complement cascade. Complement cascade activation, TNFR pro-apoptotic, and IL-17 signaling are closely associated with inflammatory responses and may be the markers driving sub-optimal serology predictions by the model (87–89).
In this report, we investigate the utility of proteomic assessments of sera to evaluate or predict serologic vaccine responses. While our sample size is small and limits somewhat the analyses, we demonstrated that proteomic assessments have the potential to predict immunological response to third vaccination. Specifically, we were able to develop a model of vaccine responsiveness at 6-months even though we could not identify specific markers that were singularly predictive of the strength of the antibody response. While the serologic responses in male and female recipients of third vaccinations of mRNA vaccines were similar, the proteomic responses were clearly different, with sera from female recipients demonstrating higher responses compared to sera from male recipients. These differential responses were evident by the number, type, and abundance changes of protein markers and the associated molecular pathways and processes affected. This proof-of-concept study illustrates the utility of proteomics analyses in immunogenicity assessments to gain a better understanding of involved mechanisms. This study is small and observational, but also one of the first ones to assess proteomics changes observed following third vaccinations with either BNT162b2 or mRNA-1273 with the intent of modeling vaccine responsiveness. Further studies are needed to confirm the markers identified and reproduce these observations in larger populations to establish robust predictive models of immunity and protection.
Original datasets are available in a publicly accessible repository: https://doi.org/10.6084/m9.figshare.c.7586102.
Serum samples were collected from healthy consenting vaccine recipients at Feinstein-Northwell Institute for Medical Research, Manhasset, NY (Institutional Review Board #20-1007) and by the National Institutes of Health’s Occupational Safety and Health Office located at Ft. Detrick, MD. under the Research Donor Protocol (RDP). RDP participants were healthy NCI-Frederick employees and other NIH staff that donated blood samples for in-vitro research at the NCI-Frederick laboratories. The protocol is listed under NIH protocol number OH99CN046 and NCT number NCT00339911. The studies were conducted in accordance with the local legislation and institutional requirements.
TH: Conceptualization, Data curation, Formal analysis, Investigation, Methodology, Validation, Visualization, Writing – original draft, Writing – review & editing. UM: Conceptualization, Data curation, Formal analysis, Investigation, Methodology, Software, Validation, Visualization, Writing – original draft, Writing – review & editing. HH: Project administration, Visualization, Writing – original draft, Writing – review & editing. TK: Conceptualization, Supervision, Writing – review & editing. NR: Conceptualization, Project administration, Supervision, Writing – review & editing. KT: Data curation, Formal analysis, Methodology, Software, Validation, Visualization, Writing – review & editing. BS: Data curation, Formal analysis, Investigation, Methodology, Resources, Software, Validation, Writing – review & editing. JC: Conceptualization, Investigation, Supervision, Writing – review & editing. LP: Conceptualization, Supervision, Writing – review & editing.
The author(s) declare financial support was received for the research, authorship, and/or publication of this article. This project has been funded in whole or in part with federal funds from the National Cancer Institute, National Institutes of Health, under contract 75N91019D00024.
The authors would like to acknowledge Dr. Peter Gregersen, Mr. Michael Ryan and Ms. Elena Kowalsky at Northwell Health, Manhasset, NY. We would also like to thank the Occupational Health Services (OHS), National Cancer Institute (NCI), Frederick, MD. for their assistance in collection of samples.
TH owns Pfizer stock.
The remaining authors declare that the research was conducted in the absence of any commercial or financial relationships that could be construed as a potential conflict of interest.
The author(s) declare that no Generative AI was used in the creation of this manuscript.
All claims expressed in this article are solely those of the authors and do not necessarily represent those of their affiliated organizations, or those of the publisher, the editors and the reviewers. Any product that may be evaluated in this article, or claim that may be made by its manufacturer, is not guaranteed or endorsed by the publisher.
The content of this publication does not necessarily reflect the views or policies of the Department of Health and Human Services, nor does mention of trade names, commercial products, or organizations imply endorsement by the U.S. Government.
The Supplementary Material for this article can be found online at: https://www.frontiersin.org/articles/10.3389/fimmu.2024.1502458/full#supplementary-material
1. Rando HM, Lordan R, Kolla L, Sell E, Lee AJ, Wellhausen N, et al. The coming of age of nucleic acid vaccines during covid-19. mSystems. (2023) 8:e0092822. doi: 10.1128/msystems.00928-22
2. Crommelin DJA, Anchordoquy TJ, Volkin DB, Jiskoot W, Mastrobattista E. Addressing the cold reality of mrna vaccine stability. J Pharm Sci. (2021) 110:997–1001. doi: 10.1016/j.xphs.2020.12.006
3. Dickerman BA, Gerlovin H, Madenci AL, Kurgansky KE, Ferolito BR, Figueroa Muniz MJ, et al. Comparative effectiveness of bnt162b2 and mrna-1273 vaccines in U.S. Veterans. N Engl J Med. (2022) 386:105–15. doi: 10.1056/NEJMoa2115463
4. Naranbhai V, Garcia-Beltran WF, Chang CC, Berrios Mairena C, Thierauf JC, Kirkpatrick G, et al. Comparative immunogenicity and effectiveness of mrna-1273, bnt162b2, and ad26.Cov2.S covid-19 vaccines. J Infect Dis. (2022) 225:1141–50. doi: 10.1093/infdis/jiab593
5. Tenforde MW, Self WH, Adams K, Gaglani M, Ginde AA, McNeal T, et al. Association between mrna vaccination and covid-19 hospitalization and disease severity. Jama. (2021) 326:2043–54. doi: 10.1001/jama.2021.19499
6. Demonbreun AR, Sancilio A, Velez ME, Ryan DT, Pesce L, Saber R, et al. Covid-19 mrna vaccination generates greater immunoglobulin G levels in women compared to men. J Infect Dis. (2021) 224:793–7. doi: 10.1093/infdis/jiab314
7. Evans JP, Zeng C, Carlin C, Lozanski G, Saif LJ, Oltz EM, et al. Neutralizing antibody responses elicited by sars-cov-2 mrna vaccination wane over time and are boosted by breakthrough infection. Sci Transl Med. (2022) 14:eabn8057. doi: 10.1126/scitranslmed.abn8057
8. Hickey TE, Kemp TJ, Bullock J, Bouk A, Metz J, Neish A, et al. Sars-cov-2 igg spike antibody levels and avidity in natural infection or following vaccination with mrna-1273 or bnt162b2 vaccines. Hum Vaccin Immunother. (2023) 19:2215677. doi: 10.1080/21645515.2023.2215677
9. Pani A, Cento V, Vismara C, Campisi D, Di Ruscio F, Romandini A, et al. Results of the renaissance study: response to bnt162b2 covid-19 vaccine-short- and long-term immune response evaluation in health care workers. Mayo Clin Proc. (2021) 96:2966–79. doi: 10.1016/j.mayocp.2021.08.013
10. Richards NE, Keshavarz B, Workman LJ, Nelson MR, Platts-Mills TAE, Wilson JM. Comparison of sars-cov-2 antibody response by age among recipients of the bnt162b2 vs the mrna-1273 vaccine. JAMA Netw Open. (2021) 4:e2124331. doi: 10.1001/jamanetworkopen.2021.24331
11. Doria-Rose N, Suthar MS, Makowski M, O’Connell S, McDermott AB, Flach B, et al. Antibody Persistence through 6 Months after the Second Dose of Mrna-1273 Vaccine for Covid-19. N Engl J Med. (2021) 384:2259–61. doi: 10.1056/NEJMc2103916
12. Naaber P, Tserel L, Kangro K, Sepp E, Jurjenson V, Adamson A, et al. Dynamics of antibody response to bnt162b2 vaccine after six months: A longitudinal prospective study. Lancet Reg Health Eur. (2021) 10:100208. doi: 10.1016/j.lanepe.2021.100208
13. Bullock JL Jr., Hickey TE, Kemp TJ, Metz J, Loftus S, Haynesworth K, et al. Longitudinal assessment of bnt162b2- and mrna-1273-induced anti-sars-cov-2 spike igg levels and avidity following three doses of vaccination. Vaccines (Basel). (2024) 12:1-13. doi: 10.3390/vaccines12050516
14. Brito-Dellan N, Tsoukalas N, Font C. Thrombosis, cancer, and covid-19. Support Care Cancer. (2022) 30:8491–500. doi: 10.1007/s00520-022-07098-z
15. Ku JH, Sy LS, Qian L, Ackerson BK, Luo Y, Tubert JE, et al. Vaccine effectiveness of the mrna-1273 3-dose primary series against covid-19 in an immunocompromised population: A prospective observational cohort study. Vaccine. (2023) 41:3636–46. doi: 10.1016/j.vaccine.2023.04.075
16. Atmar RL, Lyke KE, Deming ME, Jackson LA, Branche AR, El Sahly HM, et al. Homologous and heterologous covid-19 booster vaccinations. N Engl J Med. (2022) 386:1046–57. doi: 10.1056/NEJMoa2116414
17. FDA. Coronavirus (Covid-19) update: fda takes additional actions on the use of a booster dose for covid-19 vaccines: food and drug administration (2021). Available online at: https://www.fda.gov/news-events/press-announcements/coronavirus-covid-19-update-fda-takes-additional-actions-use-booster-dose-covid-19-vaccines (Accessed April 10, 2024).
18. Gilbert PB, Donis RO, Koup RA, Fong Y, Plotkin SA, Follmann D. A covid-19 milestone attained - a correlate of protection for vaccines. N Engl J Med. (2022) 387:2203–6. doi: 10.1056/NEJMp2211314
19. Sadarangani M, Marchant A, Kollmann TR. Immunological mechanisms of vaccine-induced protection against covid-19 in humans. Nat Rev Immunol. (2021) 21:475–84. doi: 10.1038/s41577-021-00578-z
20. Pinto LA, Dillner J, Beddows S, Unger ER. Immunogenicity of hpv prophylactic vaccines: serology assays and their use in hpv vaccine evaluation and development. Vaccine. (2018) 36:4792–9. doi: 10.1016/j.vaccine.2017.11.089
21. Bournazos S, Wang TT, Dahan R, Maamary J, Ravetch JV. Signaling by antibodies: recent progress. Annu Rev Immunol. (2017) 35:285–311. doi: 10.1146/annurev-immunol-051116-052433
22. Dong C. Cytokine regulation and function in T cells. Annu Rev Immunol. (2021) 39:51–76. doi: 10.1146/annurev-immunol-061020-053702
23. Al-Amrani S, Al-Jabri Z, Al-Zaabi A, Alshekaili J, Al-Khabori M. Proteomics: concepts and applications in human medicine. World J Biol Chem. (2021) 12:57–69. doi: 10.4331/wjbc.v12.i5.57
24. Wang Y, Zhu Q, Sun R, Yi X, Huang L, Hu Y, et al. Longitudinal proteomic investigation of covid-19 vaccination. Protein Cell. (2023) 14:668–82. doi: 10.1093/procel/pwad004
25. Kemp TJ, Quesinberry JT, Cherry J, Lowy DR, Pinto LA, Miller MB. Selection, characterization, calibration, and distribution of the U.S. Serology standard for anti-sars-cov-2 antibody detection. J Clin Microbiol. (2022) 60:e0099522. doi: 10.1128/jcm.00995-22
26. Candia J, Cheung F, Kotliarov Y, Fantoni G, Sellers B, Griesman T, et al. Assessment of variability in the somascan assay. Sci Rep. (2017) 7:14248. doi: 10.1038/s41598-017-14755-5
27. NIBSC. Who international standard first who international standard for anti-sars-cov-2 immunoglobulin (Human) nibsc code: 20/136 instructions for use (Version 2.0, dated 17/12/2020). (2020) Medicines & Healthcare Products Regulatory Agency. Published by: National Institute for Biological Standards and Control, located at Potters Bar, Hertfordshire, EN6 3QG..
28. Han K, Singh K, Rodman MJ, Hassanzadeh S, Baumer Y, Huffstutler RD, et al. Identification and validation of nutrient state-dependent serum protein mediators of human cd4(+) T cell responsiveness. Nutrients. (2021) 13:1-19. doi: 10.3390/nu13051492
29. Hwang M, Assassi S, Zheng JM, Castillo J, Chavez R, Vanarsa K, et al. Quantitative proteomic screening uncovers candidate diagnostic and monitoring serum biomarkers of ankylosing spondylitis. Arthritis Res Ther. (2023) 25:57. doi: 10.1186/s13075-023-03044-4
30. Liao YX, Wang J, Jaehnig EJ, Shi ZA, Zhang B. Webgestalt 2019: gene set analysis toolkit with revamped uis and apis. Nucleic Acids Res. (2019) 47:W199–205. doi: 10.1093/nar/gkz401
31. Croft D, O’Kelly G, Wu G, Haw R, Gillespie M, Matthews L, et al. Reactome: A database of reactions, pathways and biological processes. Nucleic Acids Res. (2011) 39:D691–7. doi: 10.1093/nar/gkq1018
32. Kanehisa M, Goto S, Furumichi M, Tanabe M, Hirakawa M. Kegg for representation and analysis of molecular networks involving diseases and drugs. Nucleic Acids Res. (2010) 38:D355–D60. doi: 10.1093/nar/gkp896
33. Wu Z, Li T. Nanoparticle-mediated cytoplasmic delivery of messenger rna vaccines: challenges and future perspectives. Pharm Res. (2021) 38:473–8. doi: 10.1007/s11095-021-03015-x
34. Rijkers GT, Weterings N, Obregon-Henao A, Lepolder M, Dutt TS, van Overveld FJ, et al. Antigen presentation of mrna-based and virus-vectored sars-cov-2 vaccines. Vaccines (Basel). (2021) 9:1-17. doi: 10.3390/vaccines9080848
35. Feng S, Phillips DJ, White T, Sayal H, Aley PK, Bibi S, et al. Correlates of protection against symptomatic and asymptomatic sars-cov-2 infection. Nat Med. (2021) 27:2032–40. doi: 10.1038/s41591-021-01540-1
36. Arunachalam PS, Scott MKD, Hagan T, Li C, Feng Y, Wimmers F, et al. Systems vaccinology of the bnt162b2 mrna vaccine in humans. Nature. (2021) 596:410–6. doi: 10.1038/s41586-021-03791-x
37. Verbeke R, Hogan MJ, Lore K, Pardi N. Innate immune mechanisms of mrna vaccines. Immunity. (2022) 55:1993–2005. doi: 10.1016/j.immuni.2022.10.014
38. Moghimi SM, Simberg D. Pro-inflammatory concerns with lipid nanoparticles. Mol Ther. (2022) 30:2109–10. doi: 10.1016/j.ymthe.2022.04.011
39. Ndeupen S, Qin Z, Jacobsen S, Bouteau A, Estanbouli H, Igyarto BZ. The mrna-lnp platform’s lipid nanoparticle component used in preclinical vaccine studies is highly inflammatory. iScience. (2021) 24:103479. doi: 10.1016/j.isci.2021.103479
40. Lonez C, Bessodes M, Scherman D, Vandenbranden M, Escriou V, Ruysschaert JM. Cationic lipid nanocarriers activate toll-like receptor 2 and nlrp3 inflammasome pathways. Nanomed-Nanotechnol. (2014) 10:775–82. doi: 10.1016/j.nano.2013.12.003
41. Tanaka T, Legat A, Adam E, Steuve J, Gatot JS, Vandenbranden M, et al. Dic14-amidine cationic liposomes stimulate myeloid dendritic cells through toll-like receptor 4. Eur J Immunol. (2008) 38:1351–7. doi: 10.1002/eji.200737998
42. Uehata T, Takeuchi O. Rna recognition and immunity-innate immune sensing and its posttranscriptional regulation mechanisms. Cells. (2020) 9:1-21. doi: 10.3390/cells9071701
43. Tokarz VL, MacDonald PE, Klip A. The cell biology of systemic insulin function. J Cell Biol. (2018) 217:2273–89. doi: 10.1083/jcb.201802095
44. Stoy J, De Franco E, Ye H, Park SY, Bell GI, Hattersley AT. In celebration of a century with insulin - update of insulin gene mutations in diabetes. Mol Metab. (2021) 52:101280. doi: 10.1016/j.molmet.2021.101280
45. Liang TT, Sang SY, Shao Q, Chen C, Deng ZC, Wang T, et al. Abnormal expression and prognostic significance of epb41l1 in kidney renal clear cell carcinoma based on data mining. Cancer Cell Int. (2020) 20:356. doi: 10.1186/s12935-020-01449-8
46. Yuan X, Piao L, Wang L, Han X, Tong L, Shao S, et al. Erythrocyte membrane protein band 4.1-like 3 inhibits osteosarcoma cell invasion through regulation of snai1-induced epithelial-to-mesenchymal transition. Aging (Albany NY). (2020) 13:1947–61. doi: 10.18632/aging.202158
47. Cieślewicz A, Dudek M, Krela-Kaźmierczak I, Jabłecka A, Lesiak M, Korzeniowska K. Pancreatic injury after covid-19 vaccine—a case report. Vaccines. (2021) 9:576. doi: 10.3390/vaccines9060576
48. Ozaka S, Kodera T, Ariki S, Kobayashi T, Murakami K. Acute pancreatitis soon after covid-19 vaccination: A case report. Med (Baltimore). (2022) 101:e28471. doi: 10.1097/md.0000000000028471
49. Parkash O, Sharko A, Farooqi A, Ying GW, Sura P. Acute pancreatitis: A possible side effect of covid-19 vaccine. Cureus. (2021) 13:e14741. doi: 10.7759/cureus.14741
50. Sasaki H, Itoh A, Watanabe Y, Nakajima Y, Saisho Y, Irie J, et al. Newly developed Type 1 diabetes after coronavirus disease 2019 vaccination: A case report. J Diabetes Investig. (2022) 13:1105–8. doi: 10.1111/jdi.13757
51. Cacdac R, Jamali A, Jamali R, Nemovi K, Vosoughi K, Bayraktutar Z. Acute pancreatitis as an adverse effect of covid-19 vaccination. SAGE Open Med Case Rep. (2022) 10:2050313x221131169. doi: 10.1177/2050313x221131169
52. Bonora E, Rizzi C, Lesi C, Berra P, Coscelli C, Butturini U. Insulin and C-peptide plasma levels in patients with severe chronic pancreatitis and fasting normoglycemia. Dig Dis Sci. (1988) 33:732–6. doi: 10.1007/bf01540438
53. Ohneda A, Kai Y, Ishii S, Matsuda K, Horigome K. Insulin and glucagon response in patients with chronic pancreatitis. Tohoku J Exp Med. (1976) 120:287–98. doi: 10.1620/tjem.120.287
54. Perra L, Balloy V, Foussigniere T, Moissenet D, Petat H, Mungrue IN, et al. Chac1 is differentially expressed in normal and cystic fibrosis bronchial epithelial cells and regulates the inflammatory response induced by pseudomonas aeruginosa. Front Immunol. (2018) 9:2823. doi: 10.3389/fimmu.2018.02823
55. He S, Zhang M, Ye Y, Zhuang J, Ma X, Song Y, et al. Chac glutathione specific gamma-glutamylcyclotransferase 1 inhibits cell viability and increases the sensitivity of prostate cancer cells to docetaxel by inducing endoplasmic reticulum stress and ferroptosis. Exp Ther Med. (2021) 22:997. doi: 10.3892/etm.2021.10429
56. Yoshida N, Abe H, Ohkuri T, Wakita D, Sato M, Noguchi D, et al. Expression of the mage-A4 and ny-eso-1 cancer-testis antigens and T cell infiltration in non-small cell lung carcinoma and their prognostic significance. Int J Oncol. (2006) 28:1089–98. doi: 10.3892/ijo.28.5.1089
57. Manohar S, Jacob S, Wang J, Wiechecki KA, Koh HWL, Simoes V, et al. Polyubiquitin chains linked by lysine residue 48 (K48) selectively target oxidized proteins. Antioxidants Redox Signaling. (2019) 31:1133–49. doi: 10.1089/ars.2019.7826
58. Mallette FA, Richard S. K48-linked ubiquitination and protein degradation regulate 53bp1 recruitment at DNA damage sites. Cell Res. (2012) 22:1221–3. doi: 10.1038/cr.2012.58
59. Hussain T, Tan B, Yin Y, Blachier F, Tossou MC, Rahu N. Oxidative stress and inflammation: what polyphenols can do for us? Oxid Med Cell Longev. (2016) 2016:7432797. doi: 10.1155/2016/7432797
60. Georgieva E, Ananiev J, Yovchev Y, Arabadzhiev G, Abrashev H, Abrasheva D, et al. Covid-19 complications: oxidative stress, inflammation, and mitochondrial and endothelial dysfunction. Int J Mol Sci. (2023) 24:14876. doi: 10.3390/ijms241914876
61. Dornbush S, Aeddula NR. Physiology, leptin. In: Statpearls. StatPearls Publishing, Treasure Island (FL (2024).
62. Tsuchiya H, Fujio K. Emerging role of leptin in joint inflammation and destruction. Immunol Med. (2022) 45:27–34. doi: 10.1080/25785826.2021.1948689
63. Larsson A, Lipcsey M, Hultström M, Frithiof R, Eriksson M. Plasma leptin is increased in intensive care patients with covid-19—an investigation performed in the pronmed-cohort. Biomedicines. (2022) 10:4. doi: 10.3390/biomedicines10010004
65. Hill LJ, Di Pietro V, Hazeldine J, Davies D, Toman E, Logan A, et al. Cystatin D (Cst5): an ultra-early inflammatory biomarker of traumatic brain injury. Sci Rep. (2017) 7:5002. doi: 10.1038/s41598-017-04722-5
66. Collins AR, Grubb A. Cystatin D, a natural salivary cysteine protease inhibitor, inhibits coronavirus replication at its physiologic concentration. Oral Microbiol Immunol. (1998) 13:59–61. doi: 10.1111/j.1399-302x.1998.tb00753.x
67. Nocera AL, Mueller SK, Workman AD, Wu D, McDonnell K, Sadow PM, et al. Cystatin sn is a potent upstream initiator of epithelial-derived type 2 inflammation in chronic rhinosinusitis. J Allergy Clin Immunol. (2022) 150:872–81. doi: 10.1016/j.jaci.2022.04.034
68. Oshiumi H, Matsumoto M, Funami K, Akazawa T, Seya T. Ticam-1, an adaptor molecule that participates in toll-like receptor 3-mediated interferon-beta induction. Nat Immunol. (2003) 4:161–7. doi: 10.1038/ni886
69. Zhu G, Chen X, Wang X, Li X, Du Q, Hong H, et al. Expression of the rip-1 gene and its role in growth and invasion of human gallbladder carcinoma. Cell Physiol Biochem. (2014) 34:1152–65. doi: 10.1159/000366328
70. Festjens N, Vanden Berghe T, Cornelis S, Vandenabeele P. Rip1, a kinase on the crossroads of a cell’s decision to live or die. Cell Death Differentiation. (2007) 14:400–10. doi: 10.1038/sj.cdd.4402085
71. Li WJ, Yuan JY. Targeting ripk1 kinase for modulating inflammation in human diseases. Front Immunol. (2023) 14:1159743. doi: 10.3389/fimmu.2023.1159743
72. Mifflin L, Ofengeim D, Yuan JY. Receptor-interacting protein kinase 1 (Ripk1) as a therapeutic target. Nat Rev Drug Discovery. (2020) 19:553–71. doi: 10.1038/s41573-020-0071-y
73. Cusson-Hermance N, Khurana S, Lee TH, Fitzgerald KA, Kelliher MA. Rip1 mediates the trif-dependent toll-like receptor 3- and 4-induced nf-kappab activation but does not contribute to interferon regulatory factor 3 activation. J Biol Chem. (2005) 280:36560–6. doi: 10.1074/jbc.M506831200
74. Cui J, Chen Y, Wang HY, Wang RF. Mechanisms and pathways of innate immune activation and regulation in health and cancer. Hum Vaccin Immunother. (2014) 10:3270–85. doi: 10.4161/21645515.2014.979640
75. Aid M, Stephenson KE, Collier AY, Nkolola JP, Michael JV, McKenzie SE, et al. Activation of coagulation and proinflammatory pathways in thrombosis with thrombocytopenia syndrome and following covid-19 vaccination. Nat Commun. (2023) 14:6703. doi: 10.1038/s41467-023-42559-x
76. Bekal S, Husari G, Okura M, Huang CA, Bukari MS. Thrombosis development after mrna covid-19 vaccine administration: A case series. Cureus. (2023) 15:e41371. doi: 10.7759/cureus.41371
77. Bilotta C, Perrone G, Adelfio V, Spatola GF, Uzzo ML, Argo A, et al. Covid-19 vaccine-related thrombosis: A systematic review and exploratory analysis. Front Immunol. (2021) 12:729251. doi: 10.3389/fimmu.2021.729251
78. Leung W-Y, Wu HHL, Floyd L, Ponnusamy A, Chinnadurai R. Covid-19 infection and vaccination and its relation to amyloidosis: what do we know currently? Vaccines. (2023) 11:1-14. doi: 10.3390/vaccines11071139
79. Pan JS, Hong MZ, Ren JL. Reactive oxygen species: A double-edged sword in oncogenesis. World J Gastroenterol. (2009) 15:1702–7. doi: 10.3748/wjg.15.1702
80. Lee S, Rauch J, Kolch W. Targeting mapk signaling in cancer: mechanisms of drug resistance and sensitivity. Int J Mol Sci. (2020) 21:1-29. doi: 10.3390/ijms21031102
81. Batra R, Whalen W, Alvarez-Mulett S, Gomez-Escobar LG, Hoffman KL, Simmons W, et al. Multi-omic comparative analysis of covid-19 and bacterial sepsis-induced ards. PloS Pathog. (2022) 18:e1010819. doi: 10.1371/journal.ppat.1010819
82. Bouhaddou M, Memon D, Meyer B, White KM, Rezelj VV, Correa Marrero M, et al. The global phosphorylation landscape of sars-cov-2 infection. Cell. (2020) 182:685–712.e19. doi: 10.1016/j.cell.2020.06.034
83. Leone P, Shin EC, Perosa F, Vacca A, Dammacco F, Racanelli V. Mhc class I antigen processing and presenting machinery: organization, function, and defects in tumor cells. J Natl Cancer Inst. (2013) 105:1172–87. doi: 10.1093/jnci/djt184
84. Zhang Z, Mateus J, Coelho CH, Dan JM, Moderbacher CR, Gálvez RI, et al. Humoral and cellular immune memory to four covid-19 vaccines. Cell. (2022) 185:2434–51.e17. doi: 10.1016/j.cell.2022.05.022
85. Chow KT, Gale M Jr., Loo YM. Rig-I and other rna sensors in antiviral immunity. Annu Rev Immunol. (2018) 36:667–94. doi: 10.1146/annurev-immunol-042617-053309
86. Rehwinkel J, Gack MU. Rig-I-like receptors: their regulation and roles in rna sensing. Nat Rev Immunol. (2020) 20:537–51. doi: 10.1038/s41577-020-0288-3
87. Aggarwal BB. Signaling pathways of the tnf superfamily: A double-edged sword. Nat Rev Immunol. (2003) 3:745–56. doi: 10.1038/nri1184
88. Markiewski MM, Lambris JD. The role of complement in inflammatory diseases from behind the scenes into the spotlight. Am J Pathol. (2007) 171:715–27. doi: 10.2353/ajpath.2007.070166
Keywords: serology, proteomics, SARS-CoV-2, mRNA-1273, BNT162b2, vaccine response
Citation: Hickey TE, Mudunuri U, Hempel HA, Kemp TJ, Roche NV, Talsania K, Sellers BA, Cherry JM and Pinto LA (2025) Proteomic and serologic assessments of responses to mRNA-1273 and BNT162b2 vaccines in human recipient sera. Front. Immunol. 15:1502458. doi: 10.3389/fimmu.2024.1502458
Received: 26 September 2024; Accepted: 25 November 2024;
Published: 27 January 2025.
Edited by:
Ravi K. Patel, University of California, San Francisco, United StatesReviewed by:
James M. Kovacs, University of Colorado Colorado Springs, United StatesCopyright © 2025 Hickey, Mudunuri, Hempel, Kemp, Roche, Talsania, Sellers, Cherry and Pinto. This is an open-access article distributed under the terms of the Creative Commons Attribution License (CC BY). The use, distribution or reproduction in other forums is permitted, provided the original author(s) and the copyright owner(s) are credited and that the original publication in this journal is cited, in accordance with accepted academic practice. No use, distribution or reproduction is permitted which does not comply with these terms.
*Correspondence: Ligia A. Pinto, cGludG9sQG1haWwubmloLmdvdg==
†These authors have contributed equally to this work
Disclaimer: All claims expressed in this article are solely those of the authors and do not necessarily represent those of their affiliated organizations, or those of the publisher, the editors and the reviewers. Any product that may be evaluated in this article or claim that may be made by its manufacturer is not guaranteed or endorsed by the publisher.
Research integrity at Frontiers
Learn more about the work of our research integrity team to safeguard the quality of each article we publish.