 Weina Xu1†
 Shuliu Sang
 Hailun Zhou
95% of researchers rate our articles as excellent or good
Learn more about the work of our research integrity team to safeguard the quality of each article we publish.
Find out more
ORIGINAL RESEARCH article
Front. Immunol. , 17 September 2024
Sec. Cancer Immunity and Immunotherapy
Volume 15 - 2024 | https://doi.org/10.3389/fimmu.2024.1452946
This article is part of the Research Topic Community Series in Novel Biomarkers in Tumor Immunity and Immunotherapy: Volume II View all 13 articles
Background: Ovarian cancer (OC) is a global malignancy characterized by metastatic invasiveness and recurrence. Long non-coding RNAs (lncRNAs) and Telomeres are closely connected with several cancers, but their potential as practical prognostic markers in OC is less well-defined.
Methods: Relevant mRNA and clinical data for OC were sourced from The Cancer Genome Atlas (TCGA) database. The telomere-related lncRNAs (TRLs) prognostic model was established by univariate/LASSO/multivariate regression analyses. The effectiveness of the TRLs model was evaluated and measured via the nomogram. Additionally, immune infiltration, tumor mutational load (TMB), and drug sensitivity were evaluated. We validated the expression levels of prognostic genes. Subsequently, PTPRD-AS1 knockdown was utilized to perform the CCK8 assay, colony formation assay, transwell assay, and wound healing assay of CAOV3 cells.
Results: A six-TRLs prognostic model (PTPRD-AS1, SPAG5-AS1, CHRM3-AS2, AC074286.1, FAM27E3, and AC018647.3) was established, which can effectively predict patient survival rates and was successfully validated using external datasets. According to the nomogram, the model could effectively predict prognosis. Furthermore, we detected the levels of regulatory T cells and M2 macrophages were comparatively higher in the high-risk TRLs group, but the levels of activated CD8 T cells and monocytes were the opposite. Finally, the low-risk group was more sensitive to anti-cancer drugs. The mRNA levels of PTPRD-AS1, SPAG5-AS1, FAM27E3, and AC018647.3 were significantly over-expressed in OC cell lines (SKOV3, A2780, CAOV3) in comparison to normal IOSE-80 cells. AC074286.1 were over-expressed in A2780 and CAOV3 cells and CHRM3-AS2 only in A2780 cells. PTPRD-AS1 knockdown decreased the proliferation, cloning, and migration of CAOV3 cells.
Conclusion: Our study identified potential biomarkers for the six-TRLs model related to the prognosis of OC.
Ovarian cancer (OC) is the fifth most prevalent cancer globally (1, 2). Epithelial OC, accounting for the majority of cases, includes serous, endometrioid, mucinous, and clear cell subtypes, each with varying degrees of differentiation (3). The International Federation of Gynecology and Obstetrics (FIGO) classifies OC into five stages, ranging from stage 0 to extensive stage IV metastasis (4). Currently, targeted therapies, such as poly (ADP-ribose) polymerase inhibitors, and other treatments like surgery, radiation, immunotherapy, nanomedicine technology, and combinatorial therapies, have made rapid progress in improving outcomes for OC patients (5, 6). However, most OC patients still develop resistance, recurrence, metastasis, and the potential development of multi-system complications (7, 8). Hence, it is urgent to pinpoint novel biomarkers that can serve as predictors for clinical outcomes in OC.
Telomeres are special complexes crucial for protecting the ends of eukaryotic chromosomes (9). Abnormal telomeres can result in cancer and age-related pathologies which are related to the integrity of the DNA damage response (10). Notably, short telomeres contribute to genomic instability, which promotes cancer progression. Nevertheless, long telomeres may enhance the risk of cancer (11). It reported that telomerase is highly expressed in ovaries (12). Additionally, a multicenter study shows that the length of telomeres serves as the biomarker in elderly patients with OC (13).
Long non-coding RNAs (lncRNAs) with a length surpassing 200 nucleotides contribute to the modulation of chromatin dynamics, cellular growth, gene expression, differentiation, and developmental processes (14). Compared to mRNAs, lncRNAs are often less abundant in cells, exhibit more specialized tissue-specific expression, and can have a shorter lifespan (15). To fulfill their diverse biological roles, lncRNAs engage in intricate gene regulatory networks through interactions with mRNAs (16). Research has revealed that analyzing lncRNA-mRNA co-expression networks is instrumental for elucidating the involvement of lncRNAs in platinum resistance and for uncovering those with prognostic significance and therapeutic potential in OC (17, 18). Moreover, lncRNAs can modulate immune responses and serve as crucial prognostic biomarkers and diagnostic markers in OC (19, 20). Previous research revealed that certain lncRNAs, including TERC, TERRA, and GUARDIN, have been implicated in the intricate mechanisms of DNA damage response integration, safeguarding of telomere termini, and regulation of telomere length (21, 22). Indeed, emerging evidence suggests that telomere-related lncRNAs (TRLs) are associated with the prognosis of kidney renal clear cell carcinoma prognosis (23). However, the molecular underpinnings of how lncRNAs contribute to telomere homeostasis remain largely uncharted territory. We found that prior research has concentrated on the length and significance of telomeres in cancer prognosis, leaving the correlation of TRLs with OC unexplored. Recognizing the importance of both telomeres and lncRNAs, combining the two to improve prognosis in OC patients may be a viable strategy.
In the present study, we formulated TRLs from The Cancer Genome Atlas (TCGA) dataset to predict OC outcomes. Additionally, we probed the connection between the TRLs model and the immune and delved into the potential impact of TRLs on therapeutic drug selection. This study introduces novel perspectives and targets for treating OC.
The transcriptome data, clinical information, and tumor mutational burden (TMB) information of 429 OC patients were from the TCGA (https://portal.gdc.cancer.gov/) database. Normal sample data (88 samples) were from the GTEx (http://commonfund.nih.gov/GTEx/) database. The annotation information was from the Ensembl database (https://www.ensembl.org) (24) to identify lncRNAs. The inclusion criteria for our study were strictly defined: (1) patients diagnosed with primary ovarian serous cystadenocarcinoma, (2) Samples with complete survival time and outcomes. After matching, a total of 370 OC samples were enrolled in the subsequent study and randomly divided into two groups (7:3 ratio), with 259 cases used for training and 111 cases for testing. The clinical baseline information of the patients is presented in Supplementary Table 1.
The 2093 telomere-related genes (TRGs) were downloaded from TelNet (http://www.cancertelsys.org/telnet/) database (25). The differentially expressed TRGs were pinpointed using the criteria of |log2 FC| ≥ 3 and FDR < 0.05 (23) with the “limma” package. We performed the Pearson correlation analysis to calculate the correlation coefficient between differentially expressed TRGs and lncRNAs expression using the “linkET” package. LncRNAs meeting P < 0.001 and |R|> 0.7 (18) screening criteria were designated as TRLs.
To identify potential prognostic TRLs in OC patients, the univariate Cox analysis was utilized to integrate the TRLs expression information with survival information using the “survival” package. The least absolute shrinkage and selection operator (LASSO) analysis could mitigate the impact of multicollinearity among the numerous genetic variables (26). This approach, when synergized with the Cox model, can refine the screening of potential biomarkers (27). In the training cohort, we conducted a LASSO analysis to filtrate the prognostic TRLs ulteriorly using the “glmnet” package. The LASSO-selected data applied the multivariate Cox analysis to identify which TRLs emerged as independent prognostic factors for OC patients (28–31). Subsequently, Kaplan-Meier (KM) analysis was utilized to contrast the high- and low-risk groups, divided by the median risk score. The KM method generated a survival curve with time depicted on the x-axis and the cumulative survival probability represented on the y-axis, offering a visual representation of the proportion of individuals surviving over the study period. If the log-rank test p-value is less than 0.05, there is a statistically significant difference between survival curves (32). Additionally, Receiver Operating Characteristic (ROC) analysis was applied to observe the predictive value of the TRLs prognostic model using the “timeROC” package. The ROC curve was plotted with the false positive rate on the x-axis and the true positive rate on the y-axis, featuring a 95% confidence interval indicated by dotted lines. The area under the ROC curve (AUC) quantified the model’s discriminatory ability, the AUC value closer to 1.0 signified superior model performance and generalization capabilities (33, 34). To assess the independence of risk scores derived from the signature, we performed the Cox regression analyses. Subsequently, we verified the prediction performance using testing and entire sets. Ultimately, the integrated nomogram was constructed, encompassing all independent prognostic parameters using the “rms” package, to provide a qualitative prediction of the overall survival (OS) for OC patients within the entire set.
To explore the functional mechanisms associated with the model, we determined the differentially expressed genes between low- and high-risk TRLs groups (|log2FC| > 1 and FDR < 0.05) using the “limma” package. Subsequently, we conducted GO and KEGG analyses on the above genes. P < 0.05 was considered significant.
To delve into the connection between risk score and immune infiltration, the ESTIMATE algorithm was employed to compute the abundance of stromal and immune components. Patients were stratified into two groups according to the median values of risk score levels. Then, the abundance of 28 immune-cell types in two groups was determined by the ssGSEA. Utilizing the CIBERSORT algorithm, we estimated the abundance of 22 distinct immune cell subtypes in patients. The distribution pattern of the two groups was visualized by PCA analysis. To investigate the correlation between immune cells and prognostic TRLs, the results were performed by the Pearson correlation analysis and visualized utilizing the “ggplot2” package.
The TMB data was computed in low- and high-TMB groups, categorized by the median TMB value of OC patients. Subsequently, the mutational landscape was depicted in a waterfall plot using the “maftool” package. Furthermore, comparative and survival analyses were executed to explore disparities in somatic mutations between the two groups.
The “oncoPredict” package was employed to forecast drugs IC50 values. The IC50, indicative of tolerance capacity, was computed, with higher IC50 values signifying increased resistance of cells to the drugs. Subsequently, the disparity in sensitivity scores between the two groups was analyzed.
OC cell lines (SKOV3, A2780, CAOV3) and IOSE-80 cells were sourced from the Cell Bank of the Chinese Academy of Sciences. SKOV3 cells were grown in McCoy’s 5A medium (Servicebio Technology Co., Ltd., China, G4541-500ML) with 10% fetal bovine serum. A2780 cells and IOSE-80 cells were grown in RPMI-1640 medium (Servicebio Technology Co., Ltd., China, G4535-500ML) with 10% fetal bovine serum. CAOV3 cells were grown in DMEM medium (Servicebio Technology Co., Ltd., China, G4515-500ML) with 10% fetal bovine serum. Then, the cells were cultivated in a 37°C incubator with 5% CO2.
Total RNA was extracted from the cells using an RNA extraction solution (Servicebio Technology Co., Ltd., China, G3013-100ML). For the conversion of RNA to cDNA, we utilized a cDNA Synthesis kit ((TransGen, China, AU341-02) to carry out the reverse transcription process. The quantification of lncRNA levels was determined using the 2-ΔΔCq method, with the results being normalized against the expression levels of the GAPDH. The TRLs sequences are shown in Table 1.
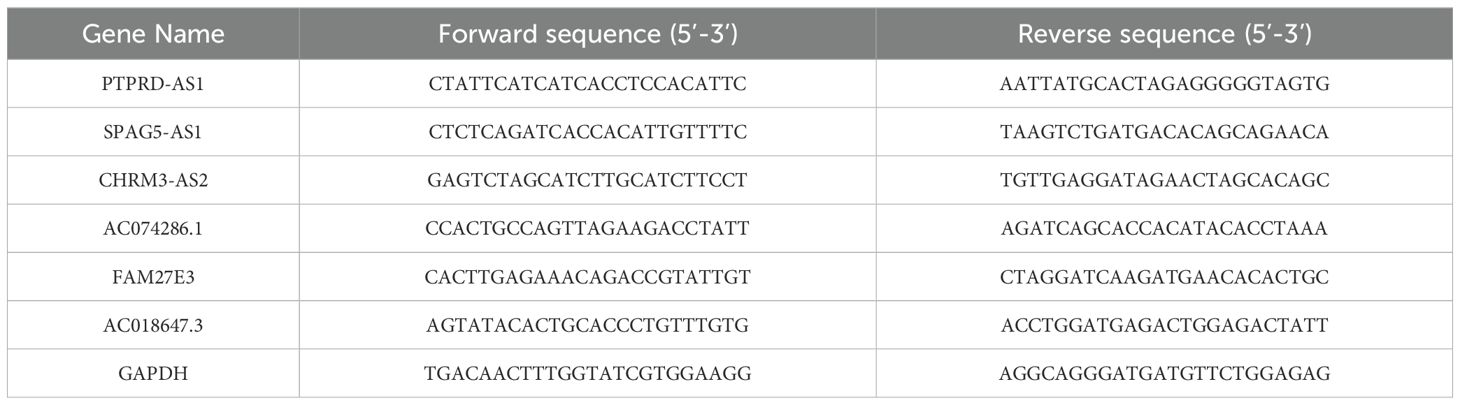
Table 1. The TRLs sequences.
CAOV3 cells, in the exponential growth phase, were seeded in a six-well plate at a density of 4 × 10⁴ cells per well to achieve 70–80% confluency. Subsequently, CAOV3 cells were transfected with small interfering RNA targeting PTPRD-AS1 (si‐PTPRD-AS1) and a non-targeting siRNA as a negative control (siNC) using the Lipofectamine 2000 reagent (Thermo Fisher Scientific, USA, 11668-027). The PTPRD-AS1 siRNAs, siNC, and Lipofectamine 2000 were prepared by dilution in Opti-MEM serum-free medium (Gibco, USA, 31985-070), then combined and allowed to incubate for 20 minutes to form the transfection complex. This mixture was subsequently introduced into CAOV3 cells for transfection. After a 6-hour incubation period, the medium was replaced with the fresh complete growth medium. The CAOV3 cells were then collected 48 h post-transfection for further analysis. To confirm the knockdown efficiency, qRT-PCR analysis was conducted post-transfection. The sequences of siRNAs are shown in Table 2.
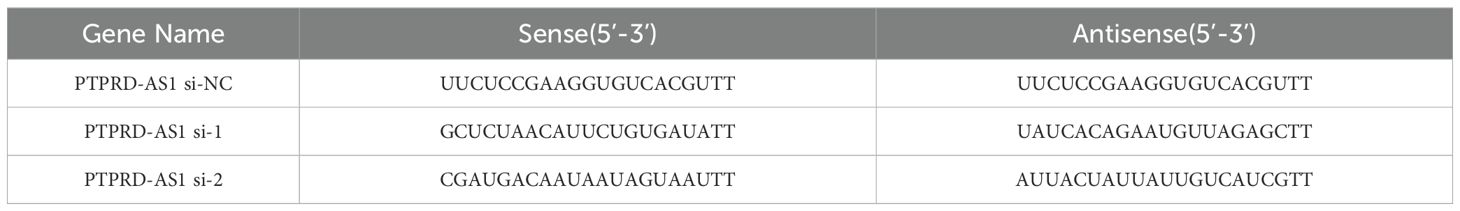
Table 2. The PTPRD-AS1 gene siRNA sequence.
The CCK8 assay and the colony formation assay were utilized to determine the effect of PTPRD-AS1 knockdown on the proliferation of CAOV3 cells. 4,000 CAOV3 cells transfected with si-NC or si-PTPRD-AS1 per well were seeded into 96-well plates and grown for 48 h. Subsequently, the optical density (OD) values were measured at 450 nm within 1-4 h after the addition of 10 μL/well of the CCK-8 reagent (Beyotime Inc., China, C0038). For colony formation, a total of 1,000 CAOV3 cells transfected with si-NC or si-PTPRD-AS1 per well were dispensed into 6-well plates and cultured for 2 weeks. Upon the emergence of visible colonies, the cells were processed for staining using crystal violet (Beyotime Inc., China, C0121).
Upper transwell chambers coated with matrigel (Corning, USA, 354234) were utilized to assess the invasive capacity of PTPRD-AS1 knockdown. 2×10⁴ CAOV3 cells transfected with si-NC or si-PTPRD-AS1 were plated in the upper chambers with DMEM medium devoid of FBS. The lower chambers were filled with DMEM supplemented with 10% FBS. Subsequently, the cells were fixed using a 4% paraformaldehyde solution for 30 minutes and stained with crystal violet for an additional 30 minutes to facilitate the quantification of invasive cells.
The assessment of cell migration was conducted using a wound healing assay. CAOV3 cells transfected with si-NC or si-PTPRD-AS1 were plated in 6-well plates to achieve 80% confluence. A standardized scratch wound was created across the well using a 10 μL pipette tip to generate a uniform gap and photographed after 24 h.
All statistical analyses were carried out through R software (version 4.3.1) and GraphPad Prism 8.0 software. Two Group differences were statistically evaluated using the Student’s t-test. For the analysis of multiple groups, One-way ANOVA was the procedure followed. P < 0.05 was considered significant.
We obtained the expression information of 2093 TRGs. 79 differentially expressed TRGs, including 31 down-regulated and 48 up-regulated genes (Figure 1A), and 1,6901 lncRNAs were determined. Finally, 77 TRGs were reserved, and 381 lncRNAs were determined as TRLs (|R| > 0.7 and P < 0.001).
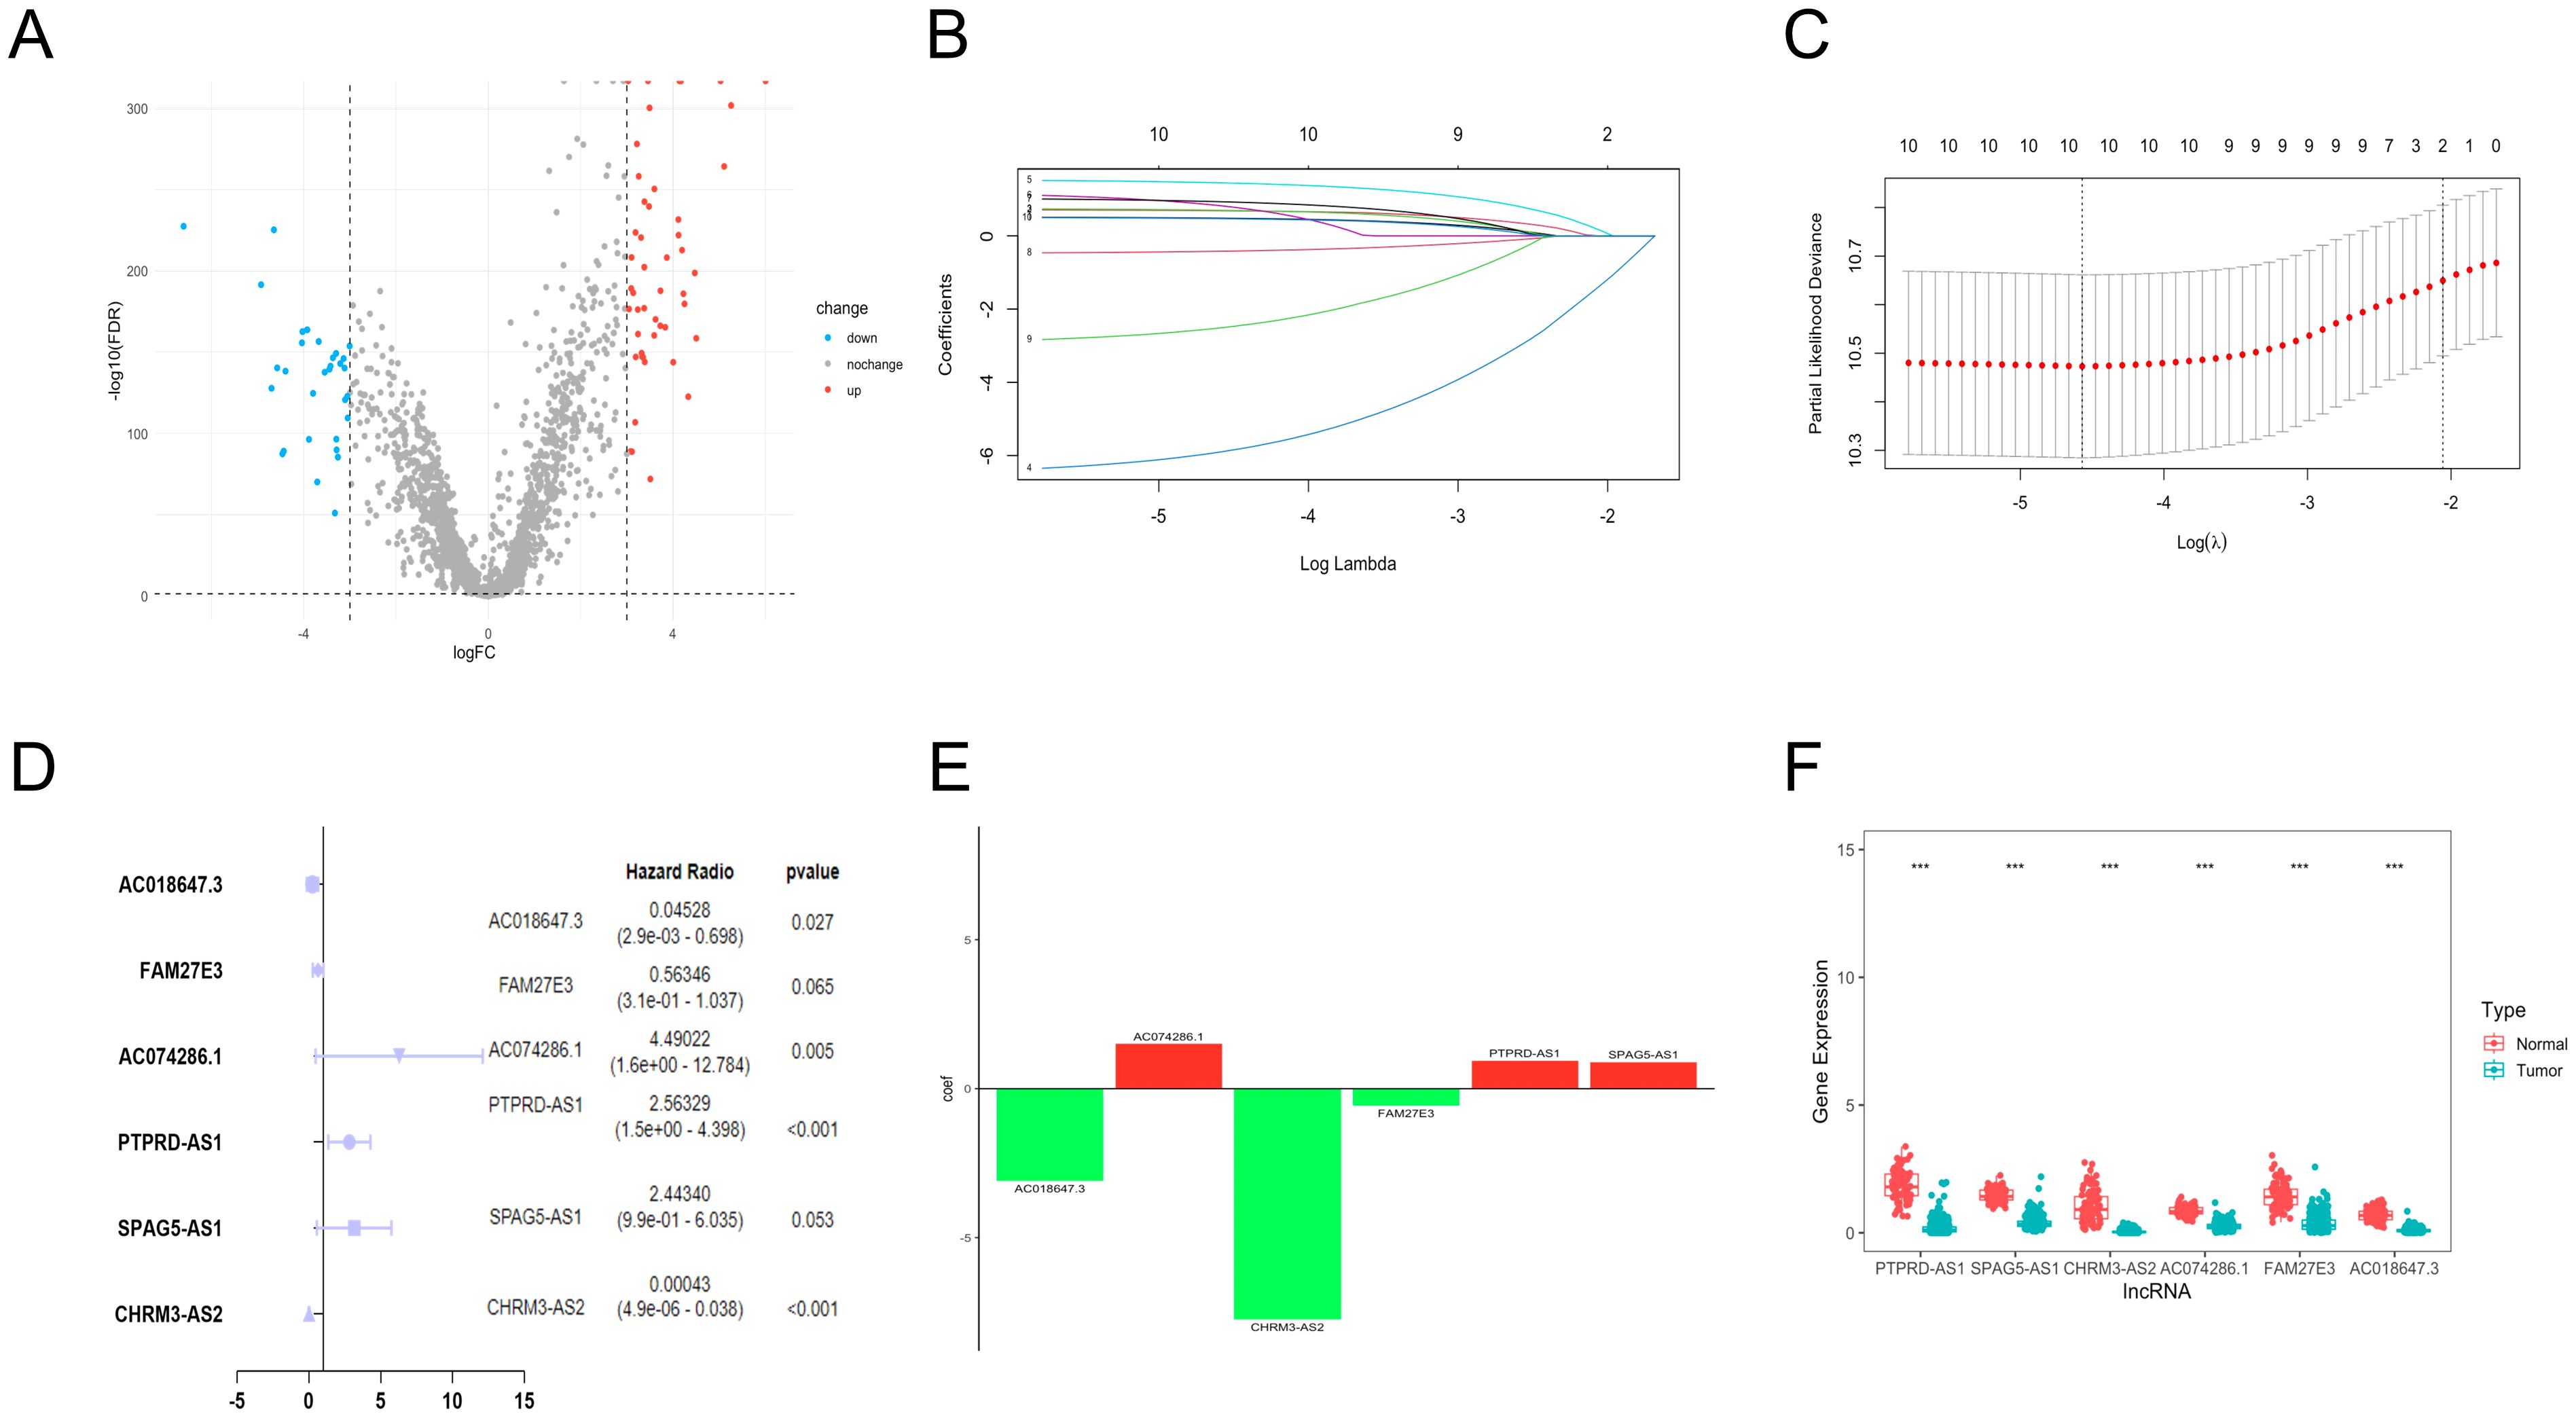
Figure 1. Establishment of TRLs prognostic model in OC. (A) The differentially expressed TRGs between normal and OC samples. (B) The distribution of lambda values in LASSO analysis. (C) The deviance diagram of LASSO analysis. (D) The six prognostic TRLs by multivariate analysis. (E) The coefficient distributions of six prognostic TRLs. (F) The expression of six prognostic TRLs between normal and OC tissues. *** P < 0.001.
A total of 10 TLRs of 381 TRLs were observably connected with OS via the univariate analysis (Supplementary Table 2). LASSO analysis was performed according to the 10 TRLs, and no genes were screened for incompatibility (Figures 1B, C). Subsequently, we performed the multivariate Cox regression analysis and identified six key TLRs (Figure 1D). The risk score for prognostic-related TRLs = (0.941293163 × PTPRD-AS1) + (0.893391681 × SPAG5-AS1) + (-7.750446273 × CHRM3-AS2) + (1.50190086 × AC074286.1) + (-0.57365439 × FAM27E3)+ (-3.094785104 × AC018647.3). Notably, CHRM3-AS2, FAM27E3, and AC018647.3 were protective factors with HR < 1 in OC patients. Nevertheless, PTPRD-AS1, SPAG5-AS1, and AC074286.1 were risk factors with HR > 1. The findings indicated that PTPRD-AS1, CHRM3-AS2, AC074286.1, and AC018647.3 were independent prognostic factors of OC patients (P< 0.05). The coefficient results of six TRLs are shown in Figure 1E. The expression levels of six TLRs in tumor cases in comparison to normal cases are shown in Figure 1F.
The low- and high-risk groups were categorized by the median score in the training, testing, and entire cohorts (Figures 2A–C). Analysis of survival status distributions indicated a higher mortality rate in the high-risk group (Figures 2D–F). The six TRLs in two groups were visually depicted through heat maps (Figures 2G–I). In the high-risk group, PTPRD-AS1, SPAG5-AS1, and AC074286.1 demonstrated comparatively elevated expression levels, while three protective lncRNAs (PTPRD-AS1, SPAG5-AS1, and AC074286.1) displayed the opposite trend. Additionally, the low-risk group experienced a higher OS rate (Figures 3A–C). The precision of the TRLs prognostic model was assessed by ROC analysis, revealing that the TRLs prognostic signature demonstrated potential in predicting OS (training cohort: 5-year AUC = 0.691, test cohort: 5-year AUC = 0.666, and entire cohort: 5-year AUC = 0.68) (Figures 3D–F). Furthermore, the risk score demonstrated superior prognostic prediction for OC patients compared to other clinical variables (Figures 3G–I). PCA analysis was employed to distinct distribution patterns between the two risk groups in the training, testing, and overall sets (Supplementary Figure 1). The two risk groups tended to diverge along two paths. These results underscored the robust predictive capability of this signature.
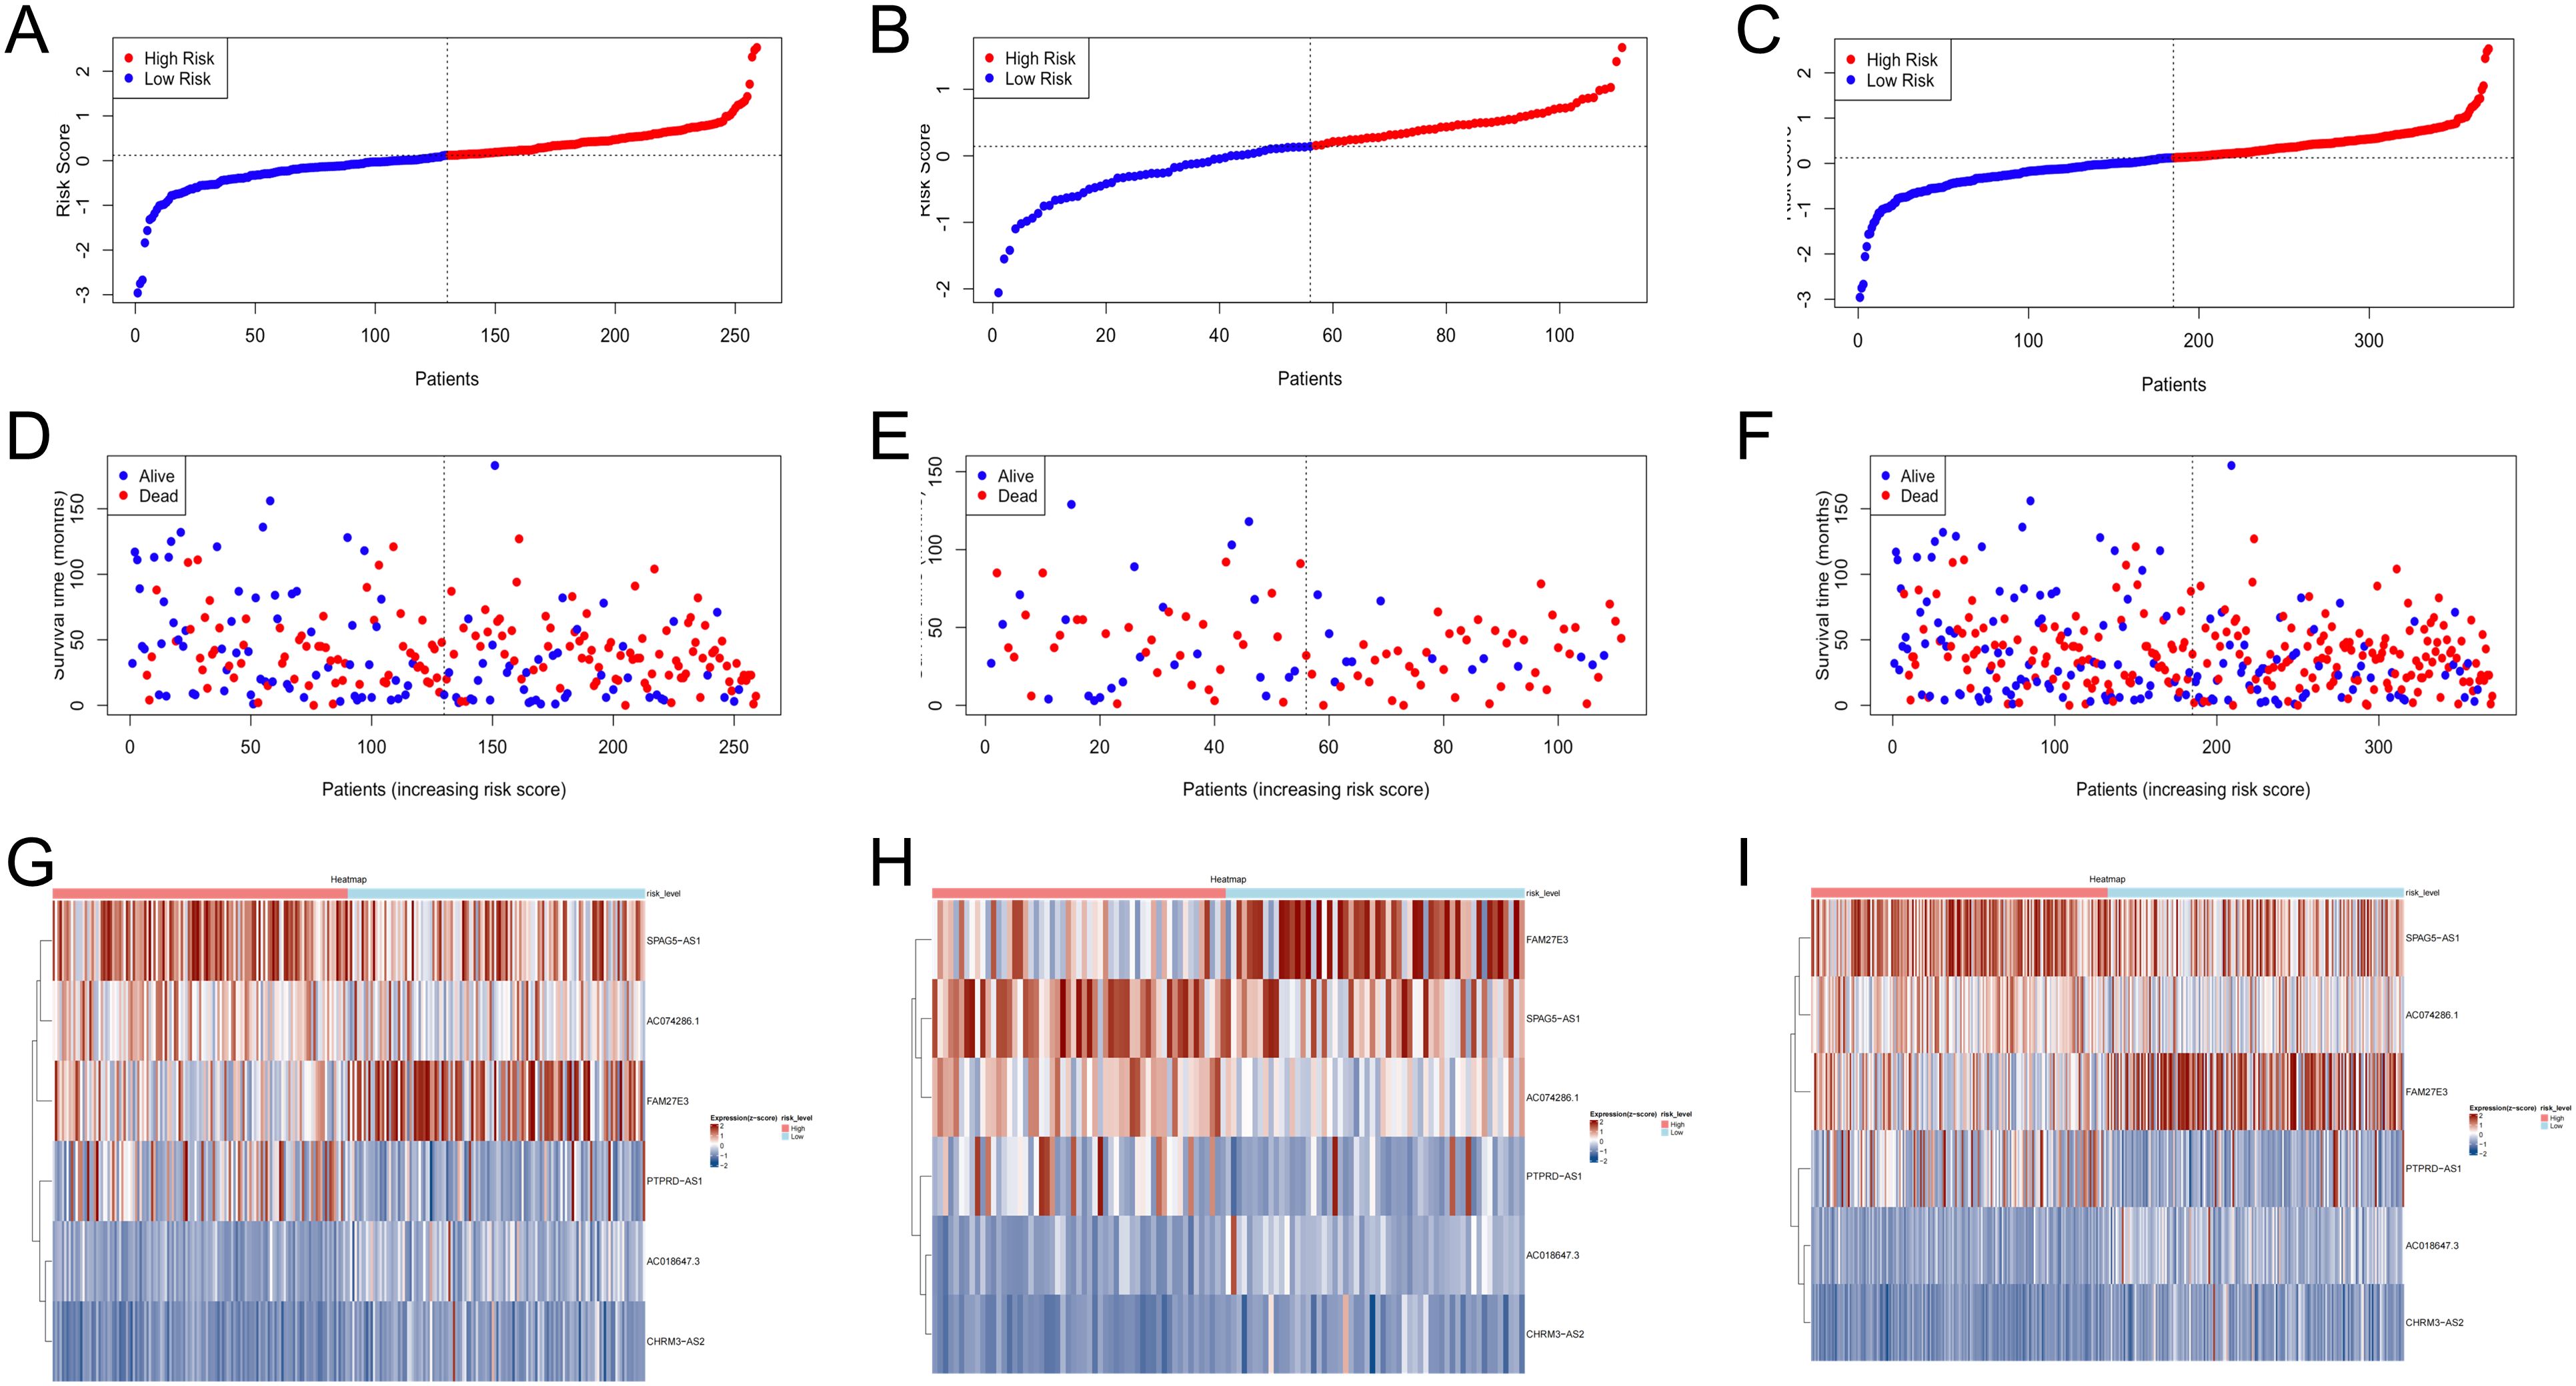
Figure 2. Verification of prognostic model in the training, testing, and overall sets. (A–C) The risk scores. (D–F) The survival status. (G–I) Heatmaps of 6 TRLs expression.
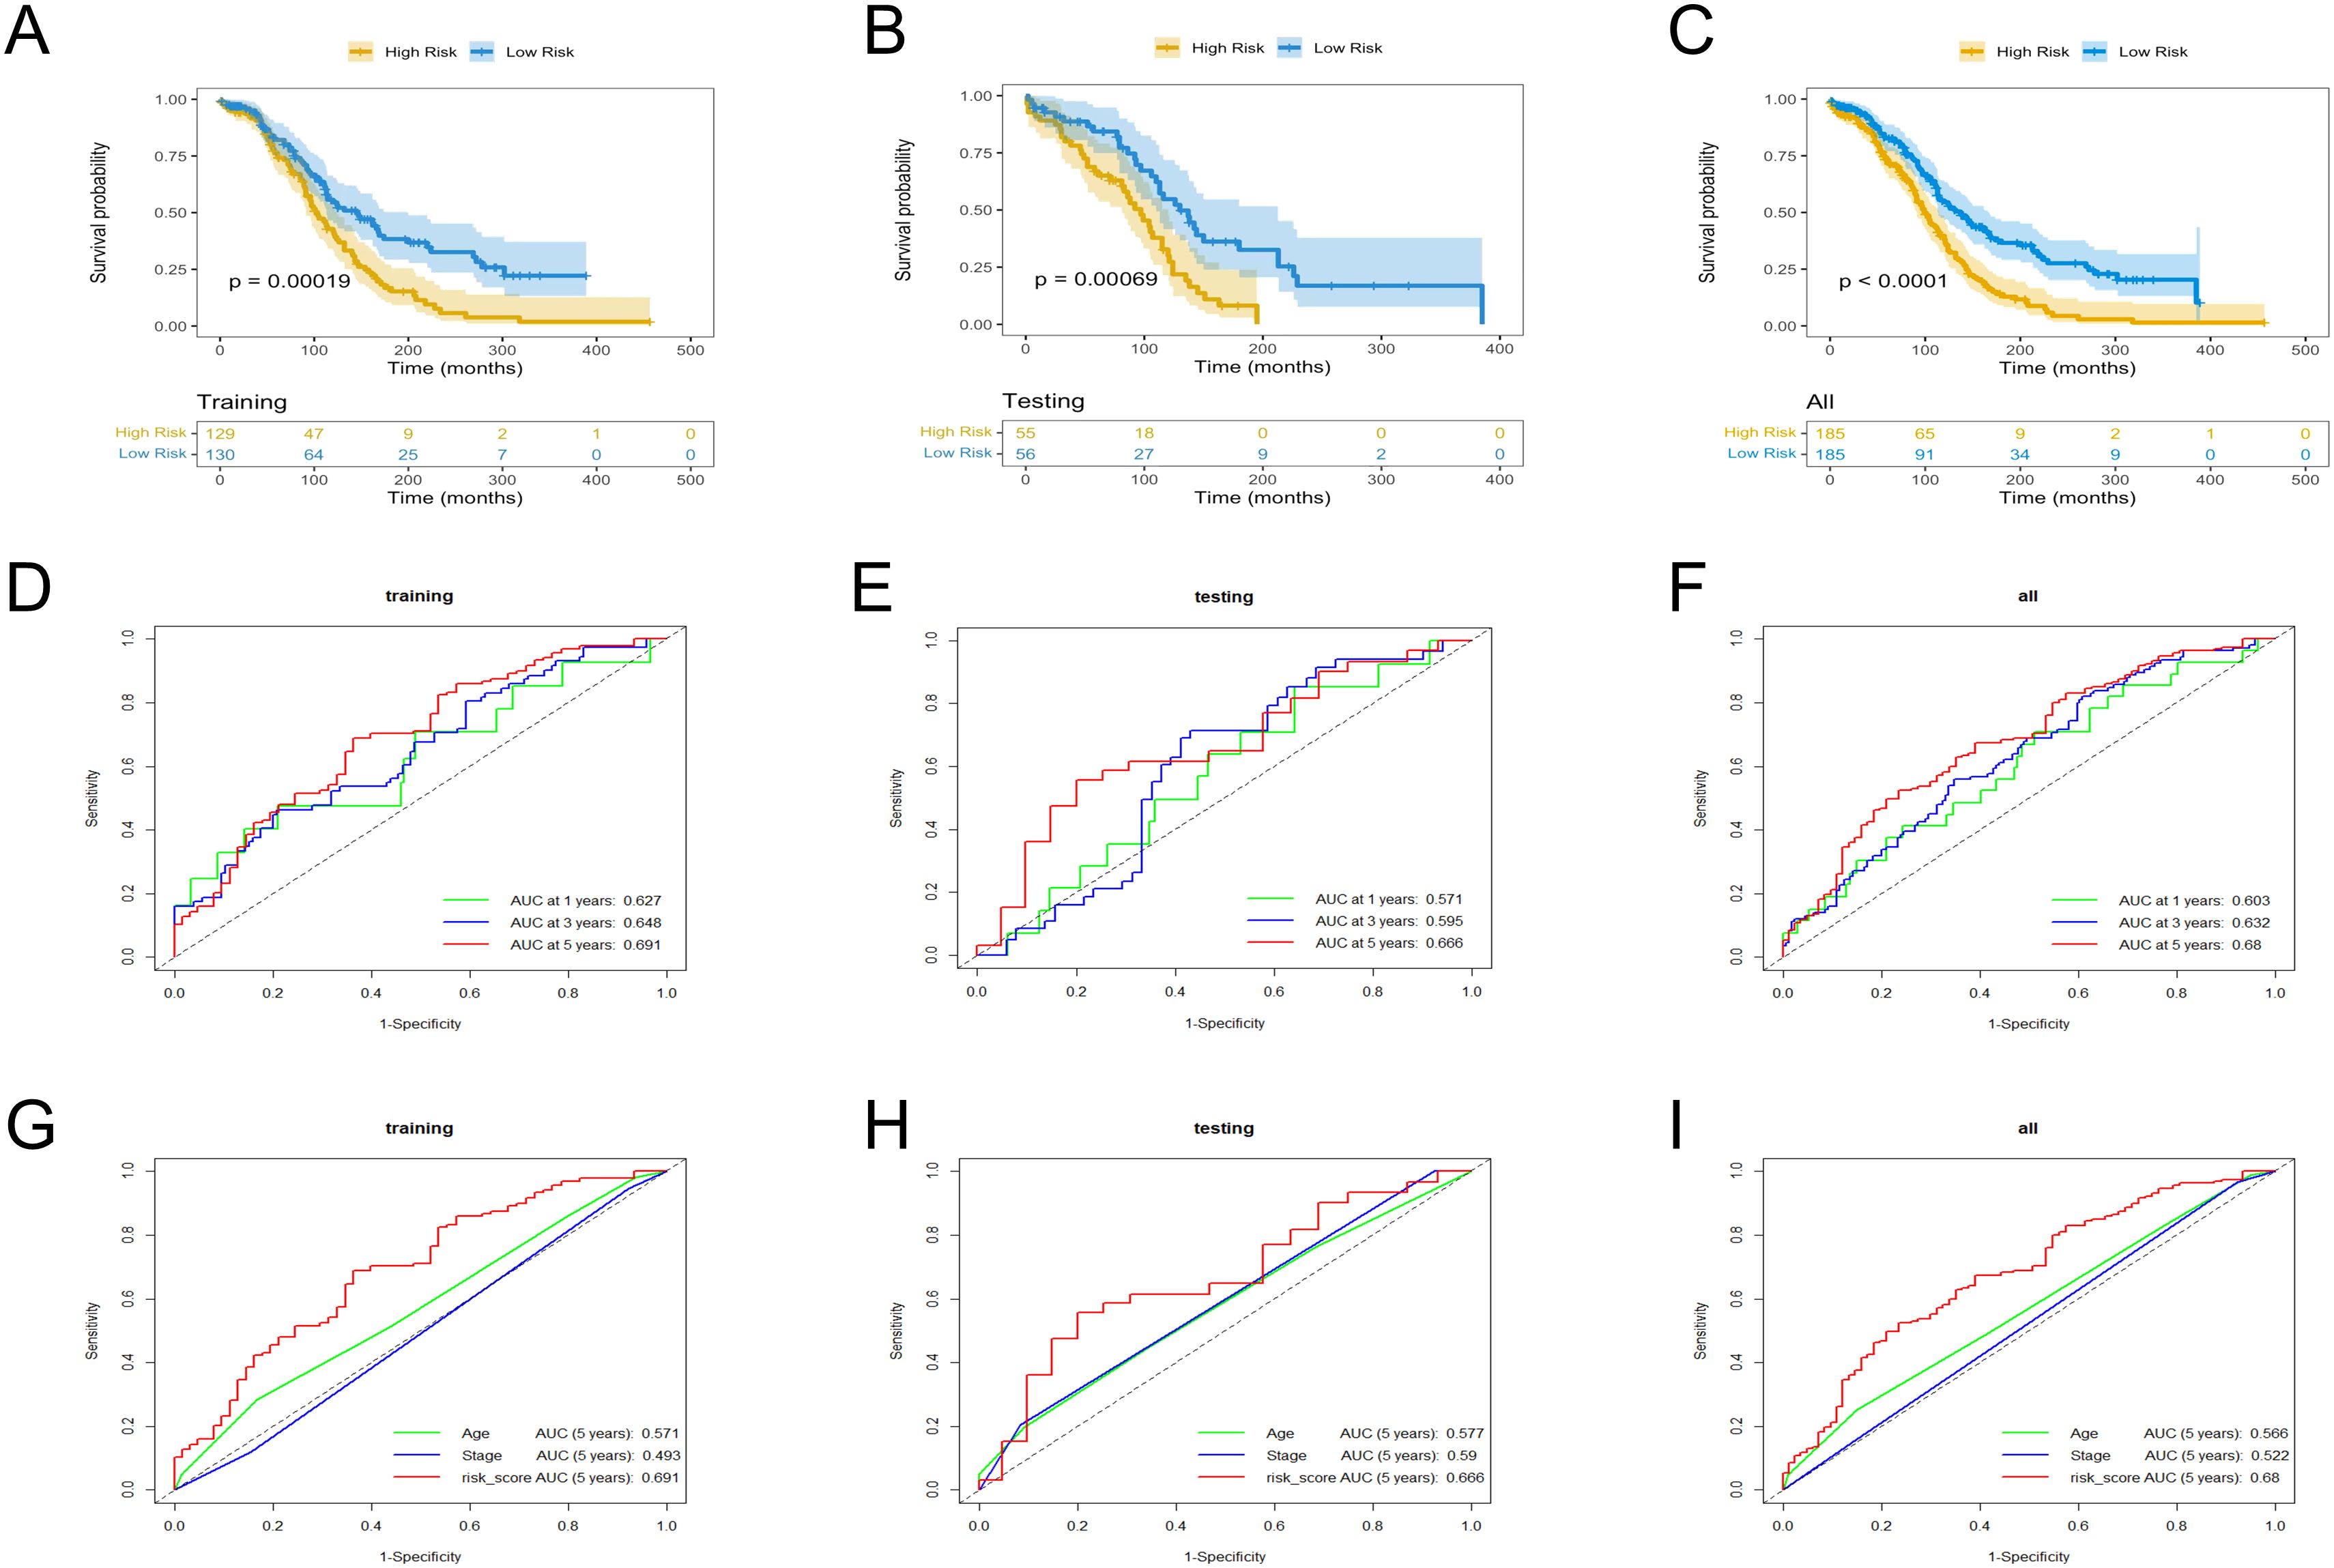
Figure 3. KM and ROC curves analysis in the training, testing, and overall sets. (A–C) OS rates. (D–F) ROC curves for the prognostic model. (G–I) ROC curves for the six TRLs risk scores and clinical factors.
In the training cohort, univariate analysis showed risk score was related to patient survival (Figure 4A). Furthermore, the multivariate analysis suggested that risk score was the independent prognostic factor for OC patients (Figure 4B). The analysis results for both the testing set (Figures 4C, D) and the overall set (Figures 4E, F) were consistent. Subsequently, a nomogram was conducted by combining the risk score with clinical features (Figure 4G). The calibration curves proved the dependability of the six TRLs prognostic model (Figure 4H).
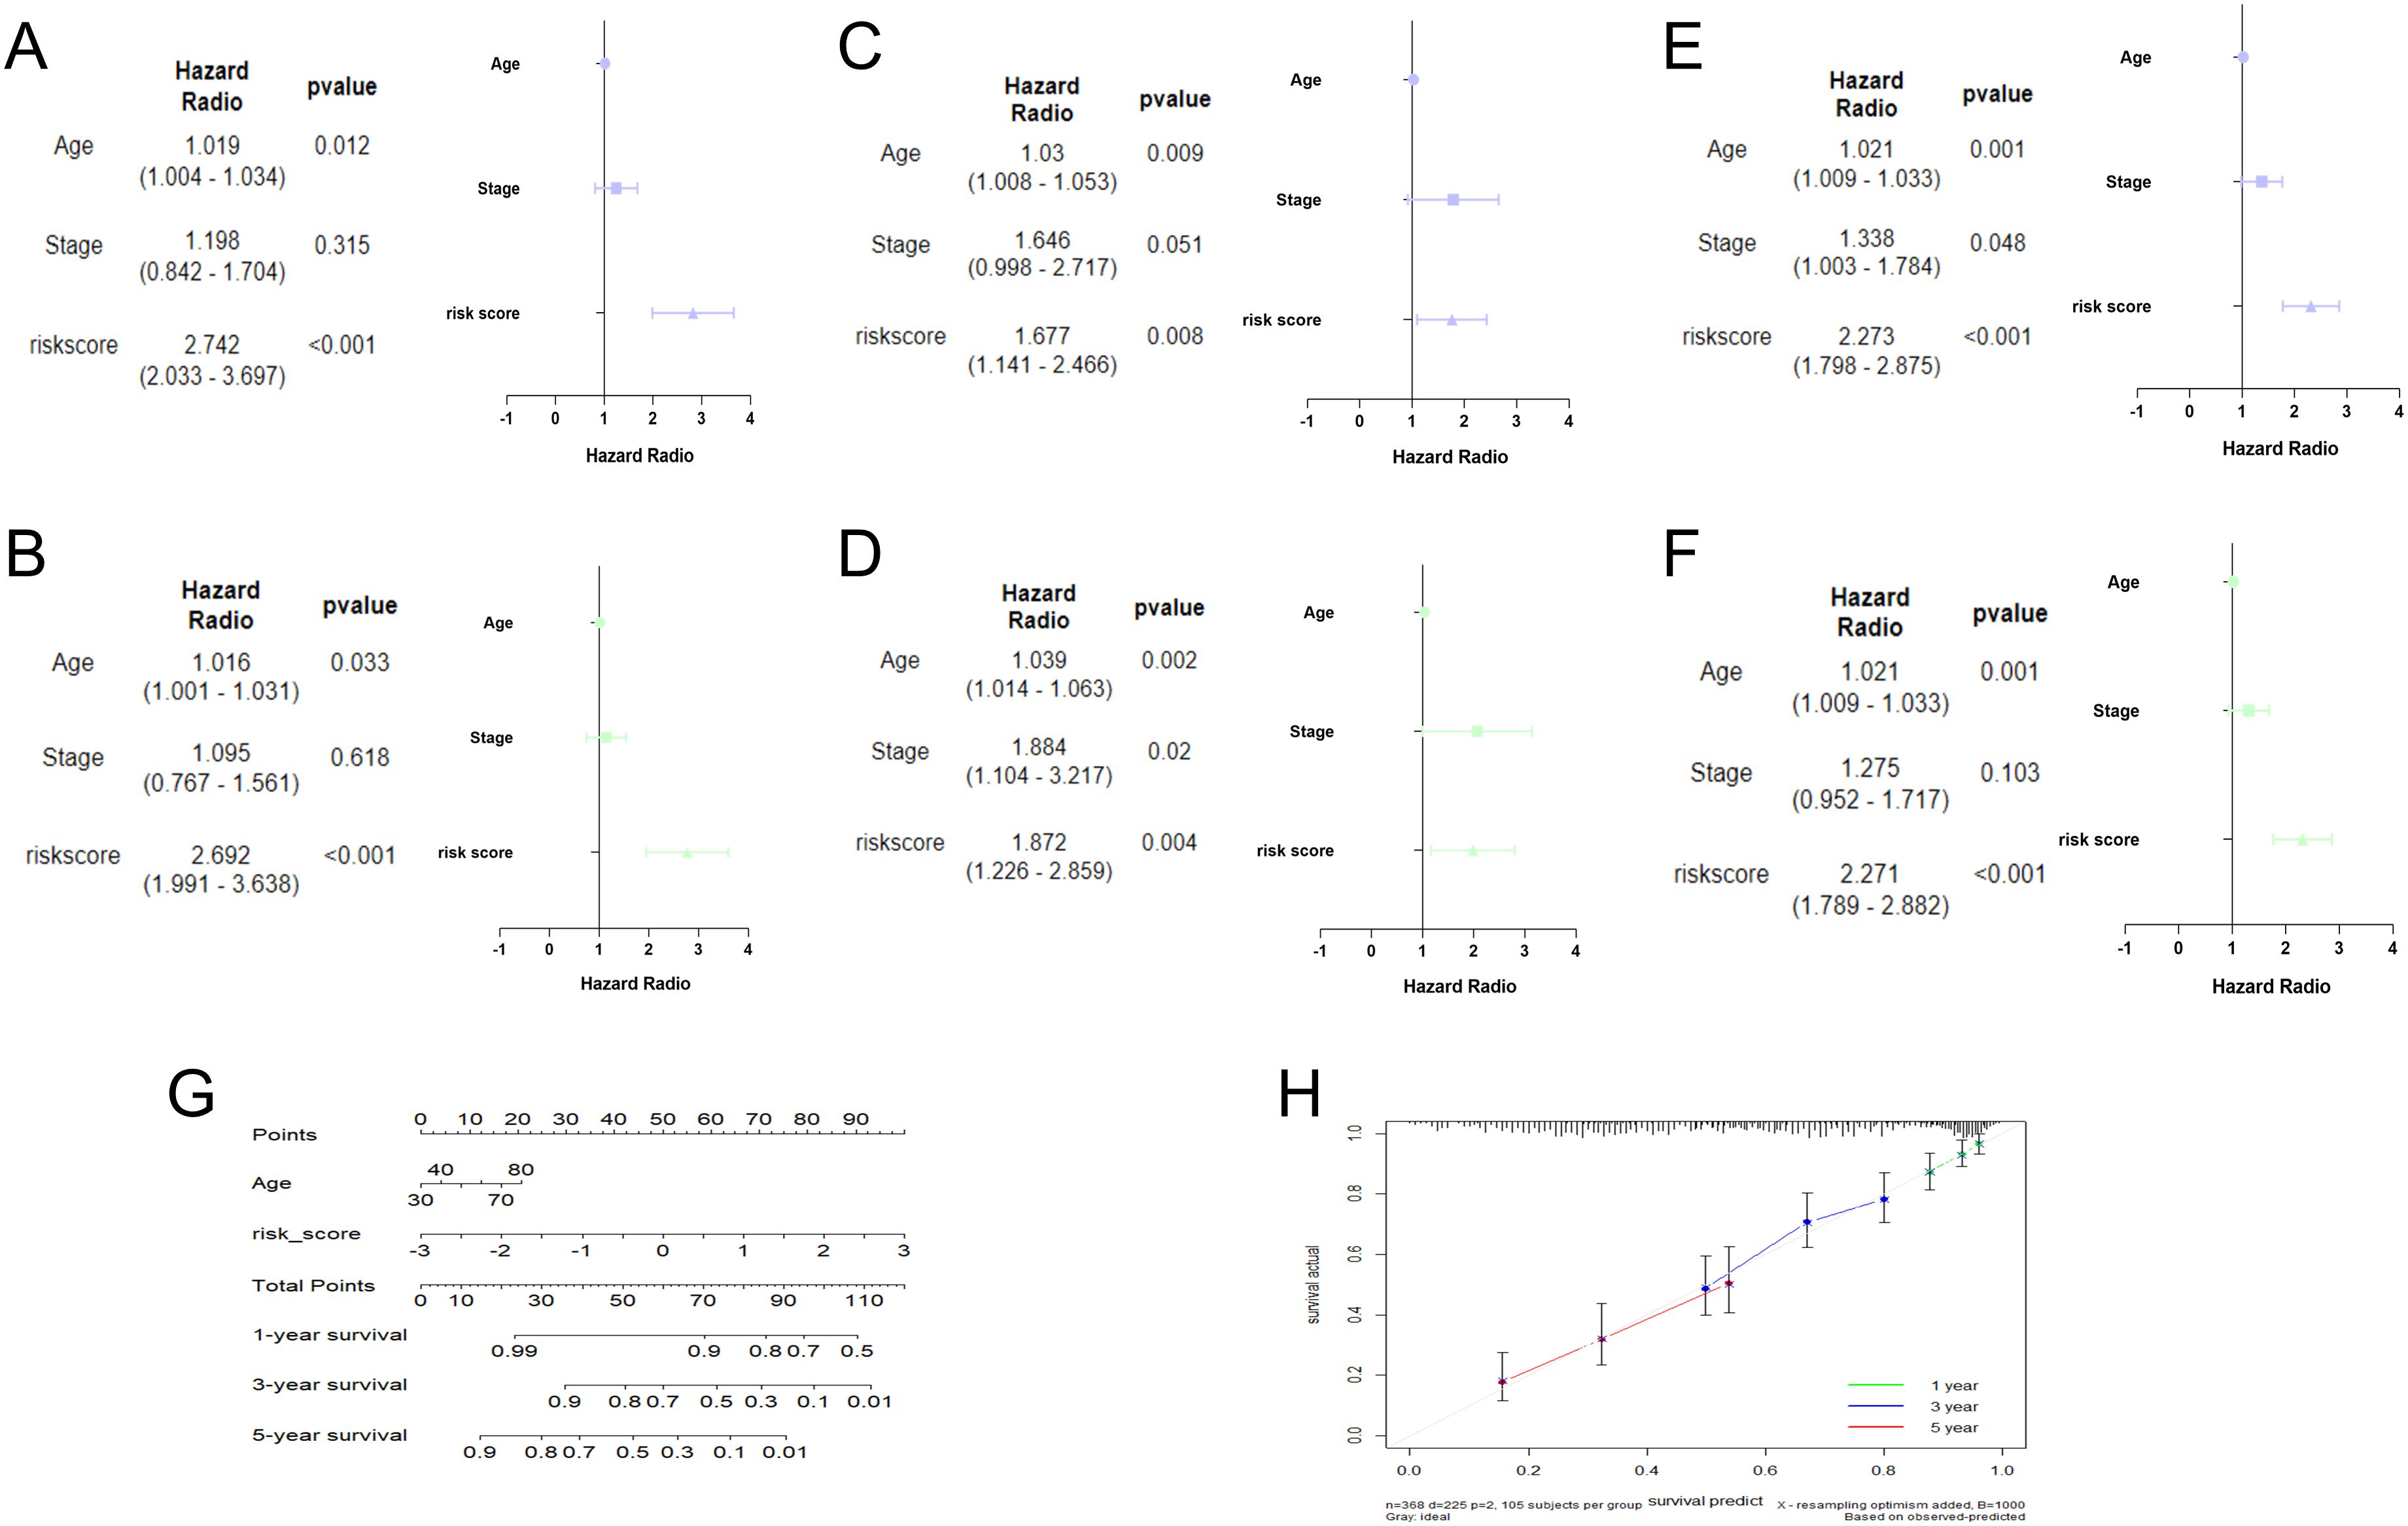
Figure 4. Establishment of nomogram. Univariate and multivariate analysis in the training (A, B), testing (C, D), and overall (E, F) sets. (G) Nomogram analysis in OC patients. (H) The calibration curves of the nomogram.
To study the potential biological function between the two groups, relevant enrichment analyses were carried out with 12 genes of differential expression between the two groups. GO terms showed that 12 genes were related to fibrillar collagen trimer and collagen fibrill organization (Figures 5A–C), while the KEGG pathway contained proteoglycans in cancer and PI3K-Akt signaling pathway, etc. (Figure 5D). Moreover, the cnetplots were used for the specific GO terms and KEGG categories (Figures 5E–H). These biological processes and pathways likely contribute to the high-risk group towards poorer clinical prognosis.
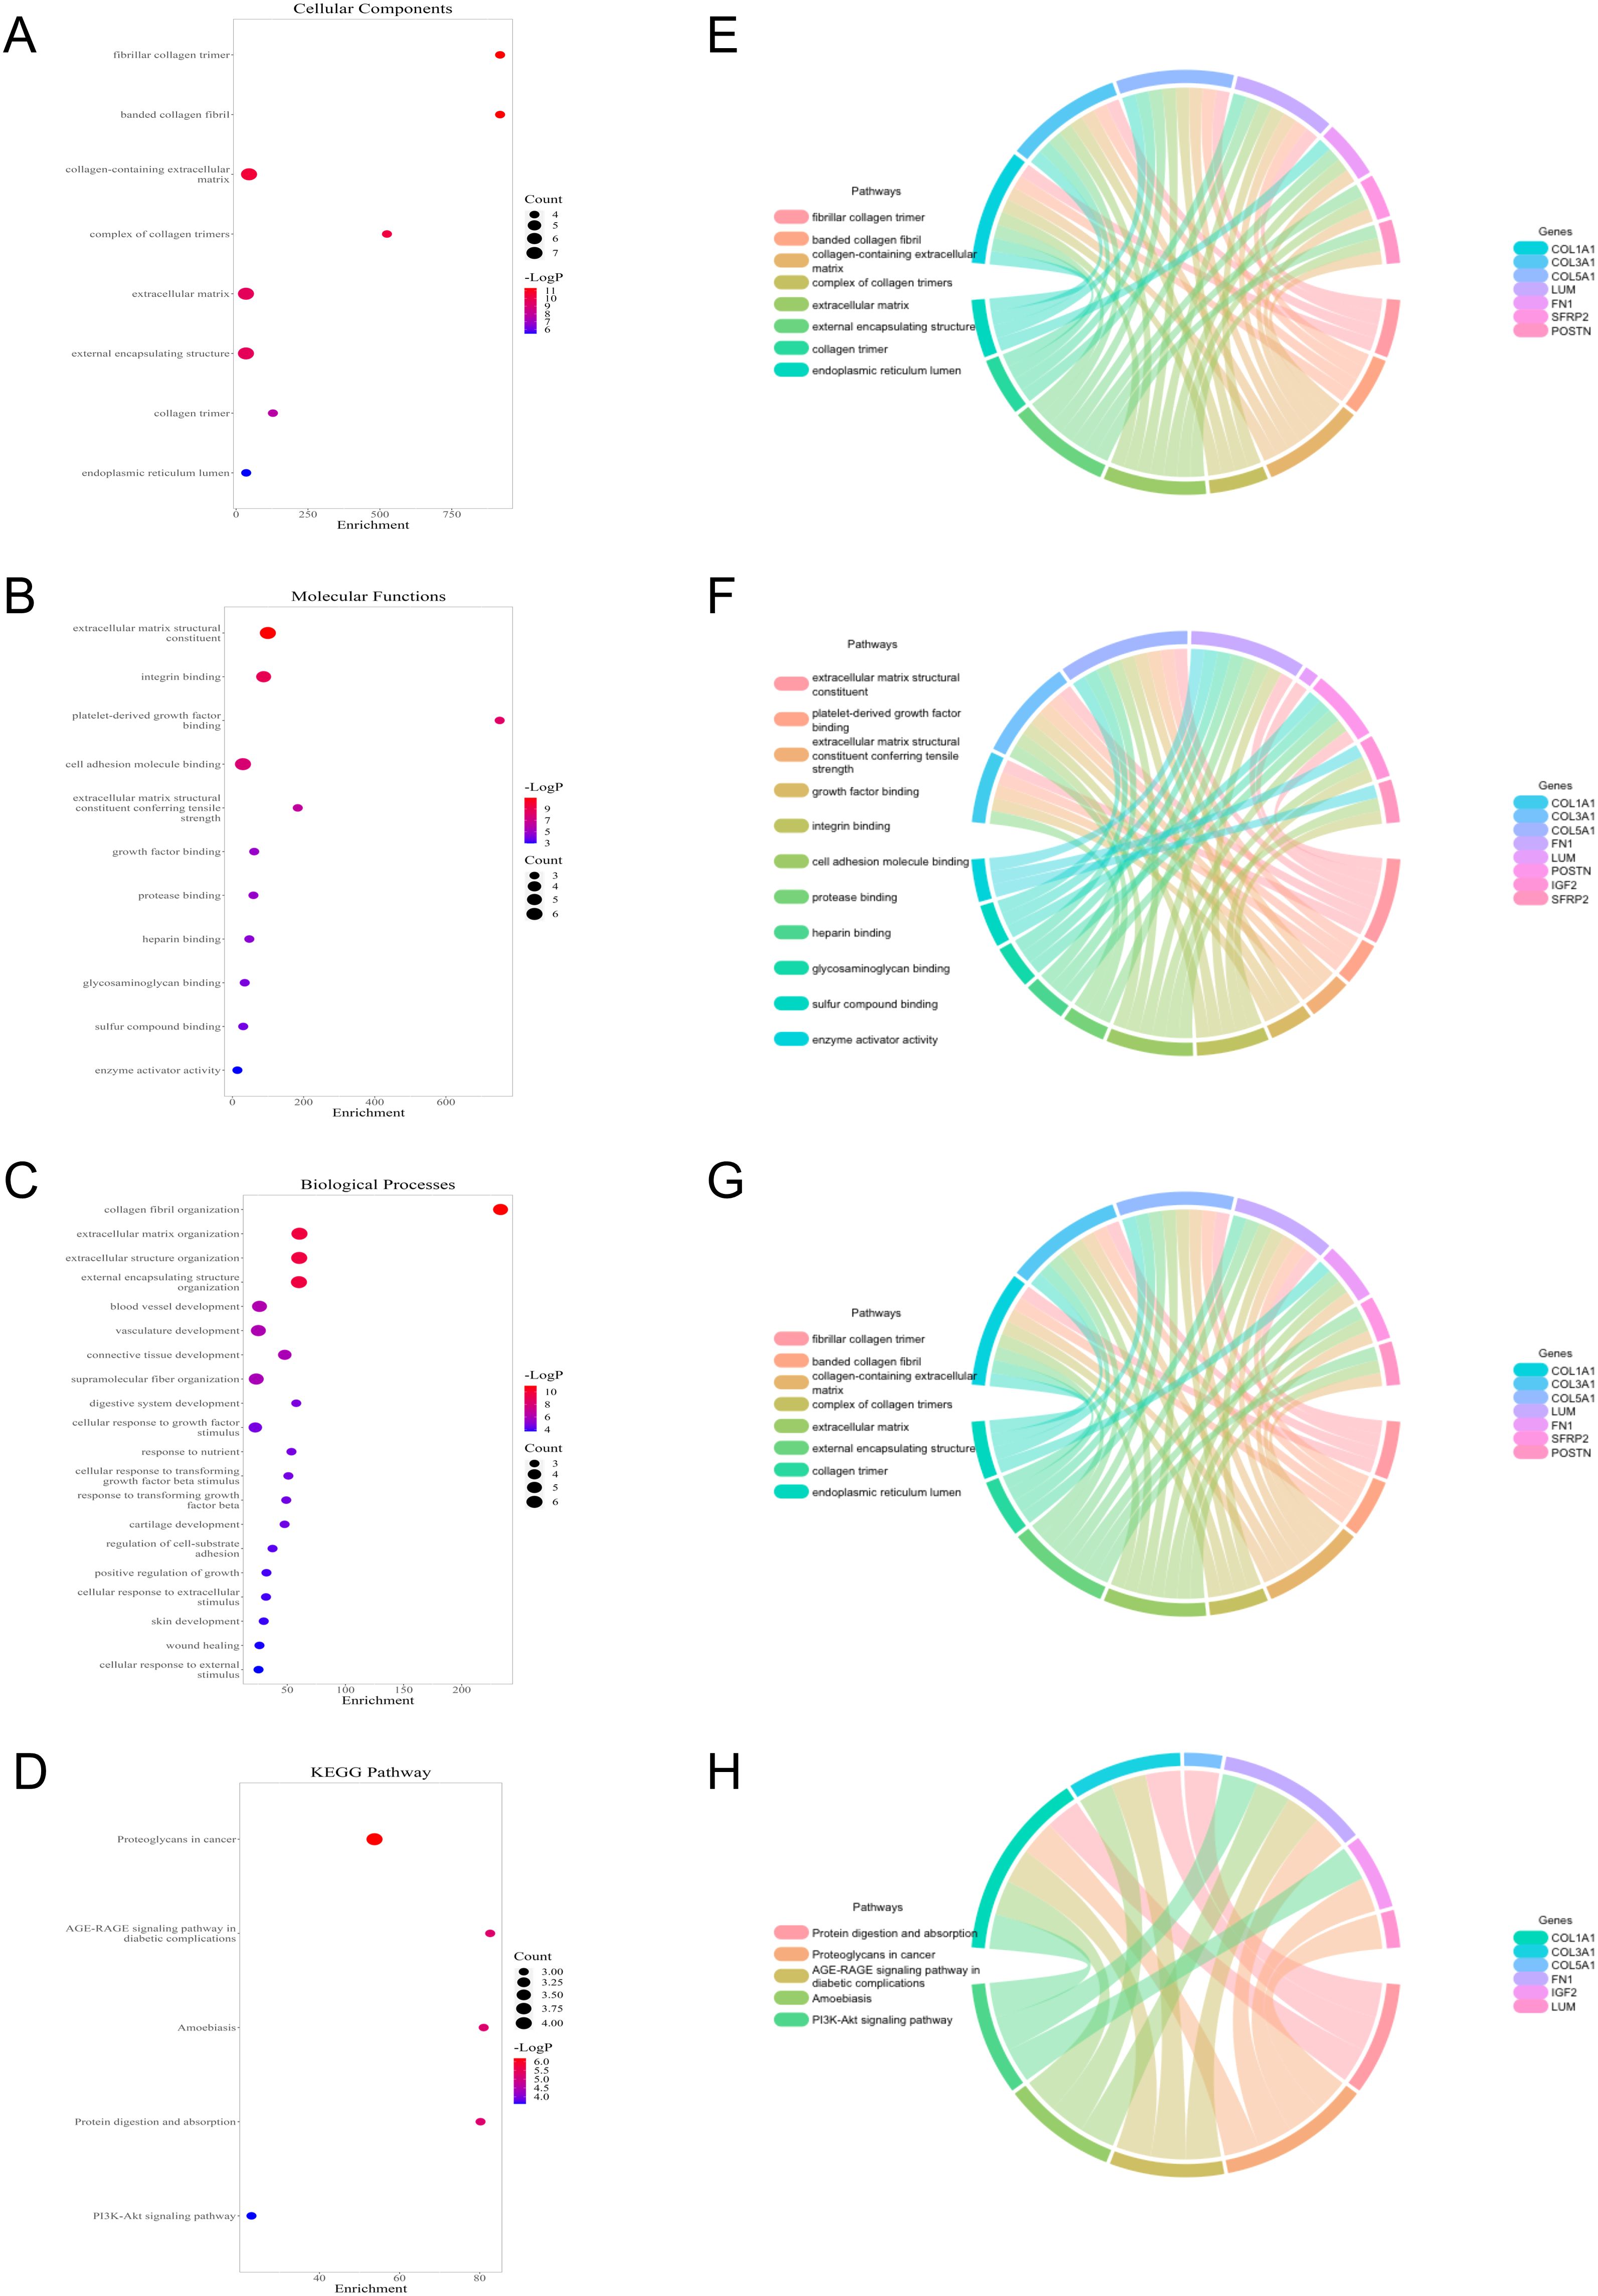
Figure 5. Functional analysis of 12 genes with differential expression between low- and high-risk groups. (A–C) GO terms analysis. (D) KEGG pathways analysis. (E–H) Specific genes related to the GO terms and pathways.
The levels of stromal score were significantly lower in the low-risk group (Figure 6A). ssGSEA analysis demonstrated that the abundance of regulatory T cells was comparatively higher in the high-risk group, and the abundance of activated CD8 T cells and monocytes was the opposite (Figure 6B). CIBERSORT analysis revealed that the high-risk group had significantly higher levels of M2 macrophages (Figure 6C). PCA plot demonstrated the marked classification of immune cells in two groups (Figure 6D). Moreover, the correlation analysis indicated that PTPRD-AS1, SPAG5-AS1, CHRM3-AS2, AC074286.1, FAM27E3 and AC018647.3 were strongly associated with 28 immune cells (Figures 6E–J). In summary, these findings reveal the obvious differences between the two groups in the immune cells and are closely related to PTPRD-AS1, SPAG5-AS1, CHRM3-AS2, AC074286.1, FAM27E3, and AC018647.3.
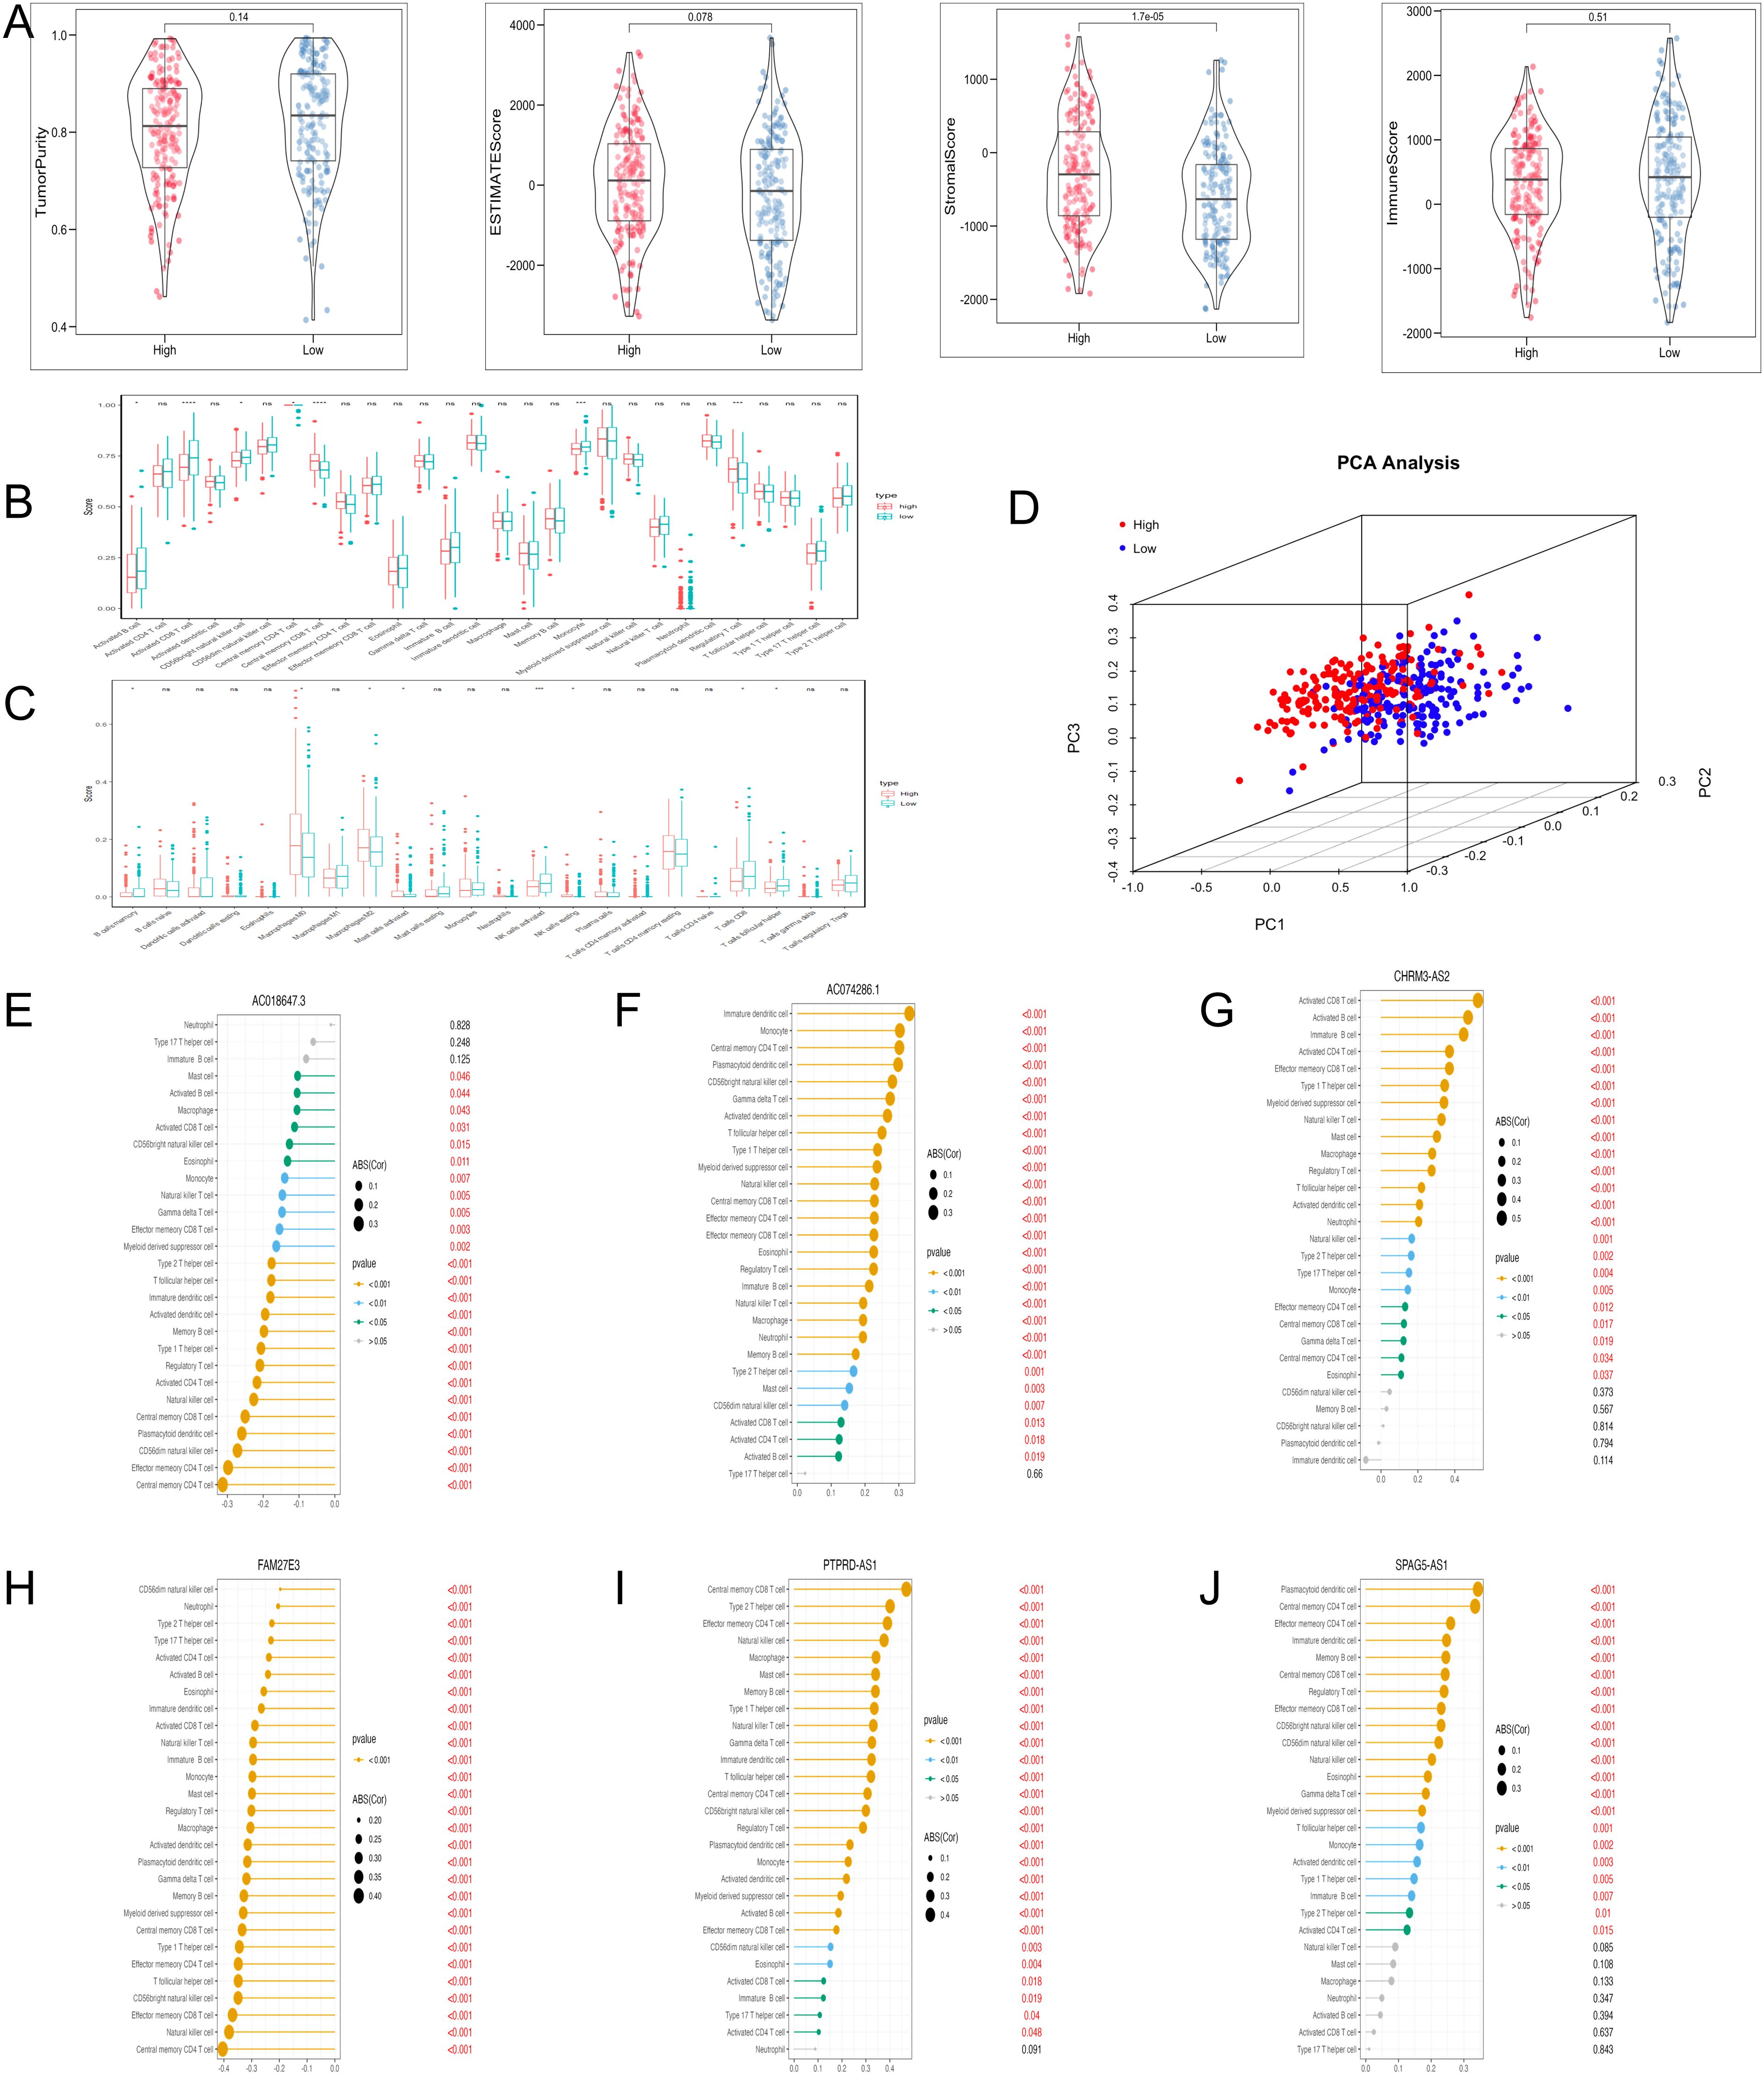
Figure 6. Immune cell infiltration analysis with TRLs risk group. (A) The ESTIMATE score, Immune score, and Stromal score diagrams. (B) The 28 type immune cells in two risk groups by ssGSEA. (C) The level of 22 immune cell infiltration in two risk groups by the CIBERSORT algorithm. (D) PCA analysis of immune cells between two groups. (E–J) Correlation analysis of six prognostic biomarkers (PTPRD-AS1, SPAG5-AS1, CHRM3-AS2, AC074286.1, FAM27E3, and AC018647.3) and immune cells. * P < 0.05, ** P < 0.01, **** P < 0.0001, ns, not significant.
In the analysis of TMB in OC patients, individual TMB values were determined. The probability of TMB in the high- and low-risk groups was 99.28% and 99.29%, respectively (Figures 7A, B). Nevertheless, the TMB values between the two groups were no significant difference (Figure 7C). Subsequent survival analyses were conducted across different TMB and risk groups. Notably, the high-TMB group exhibited the favorable OS, and the high-TMB combined with the low-risk group demonstrated the highest OS rate (Figures 7D, E).
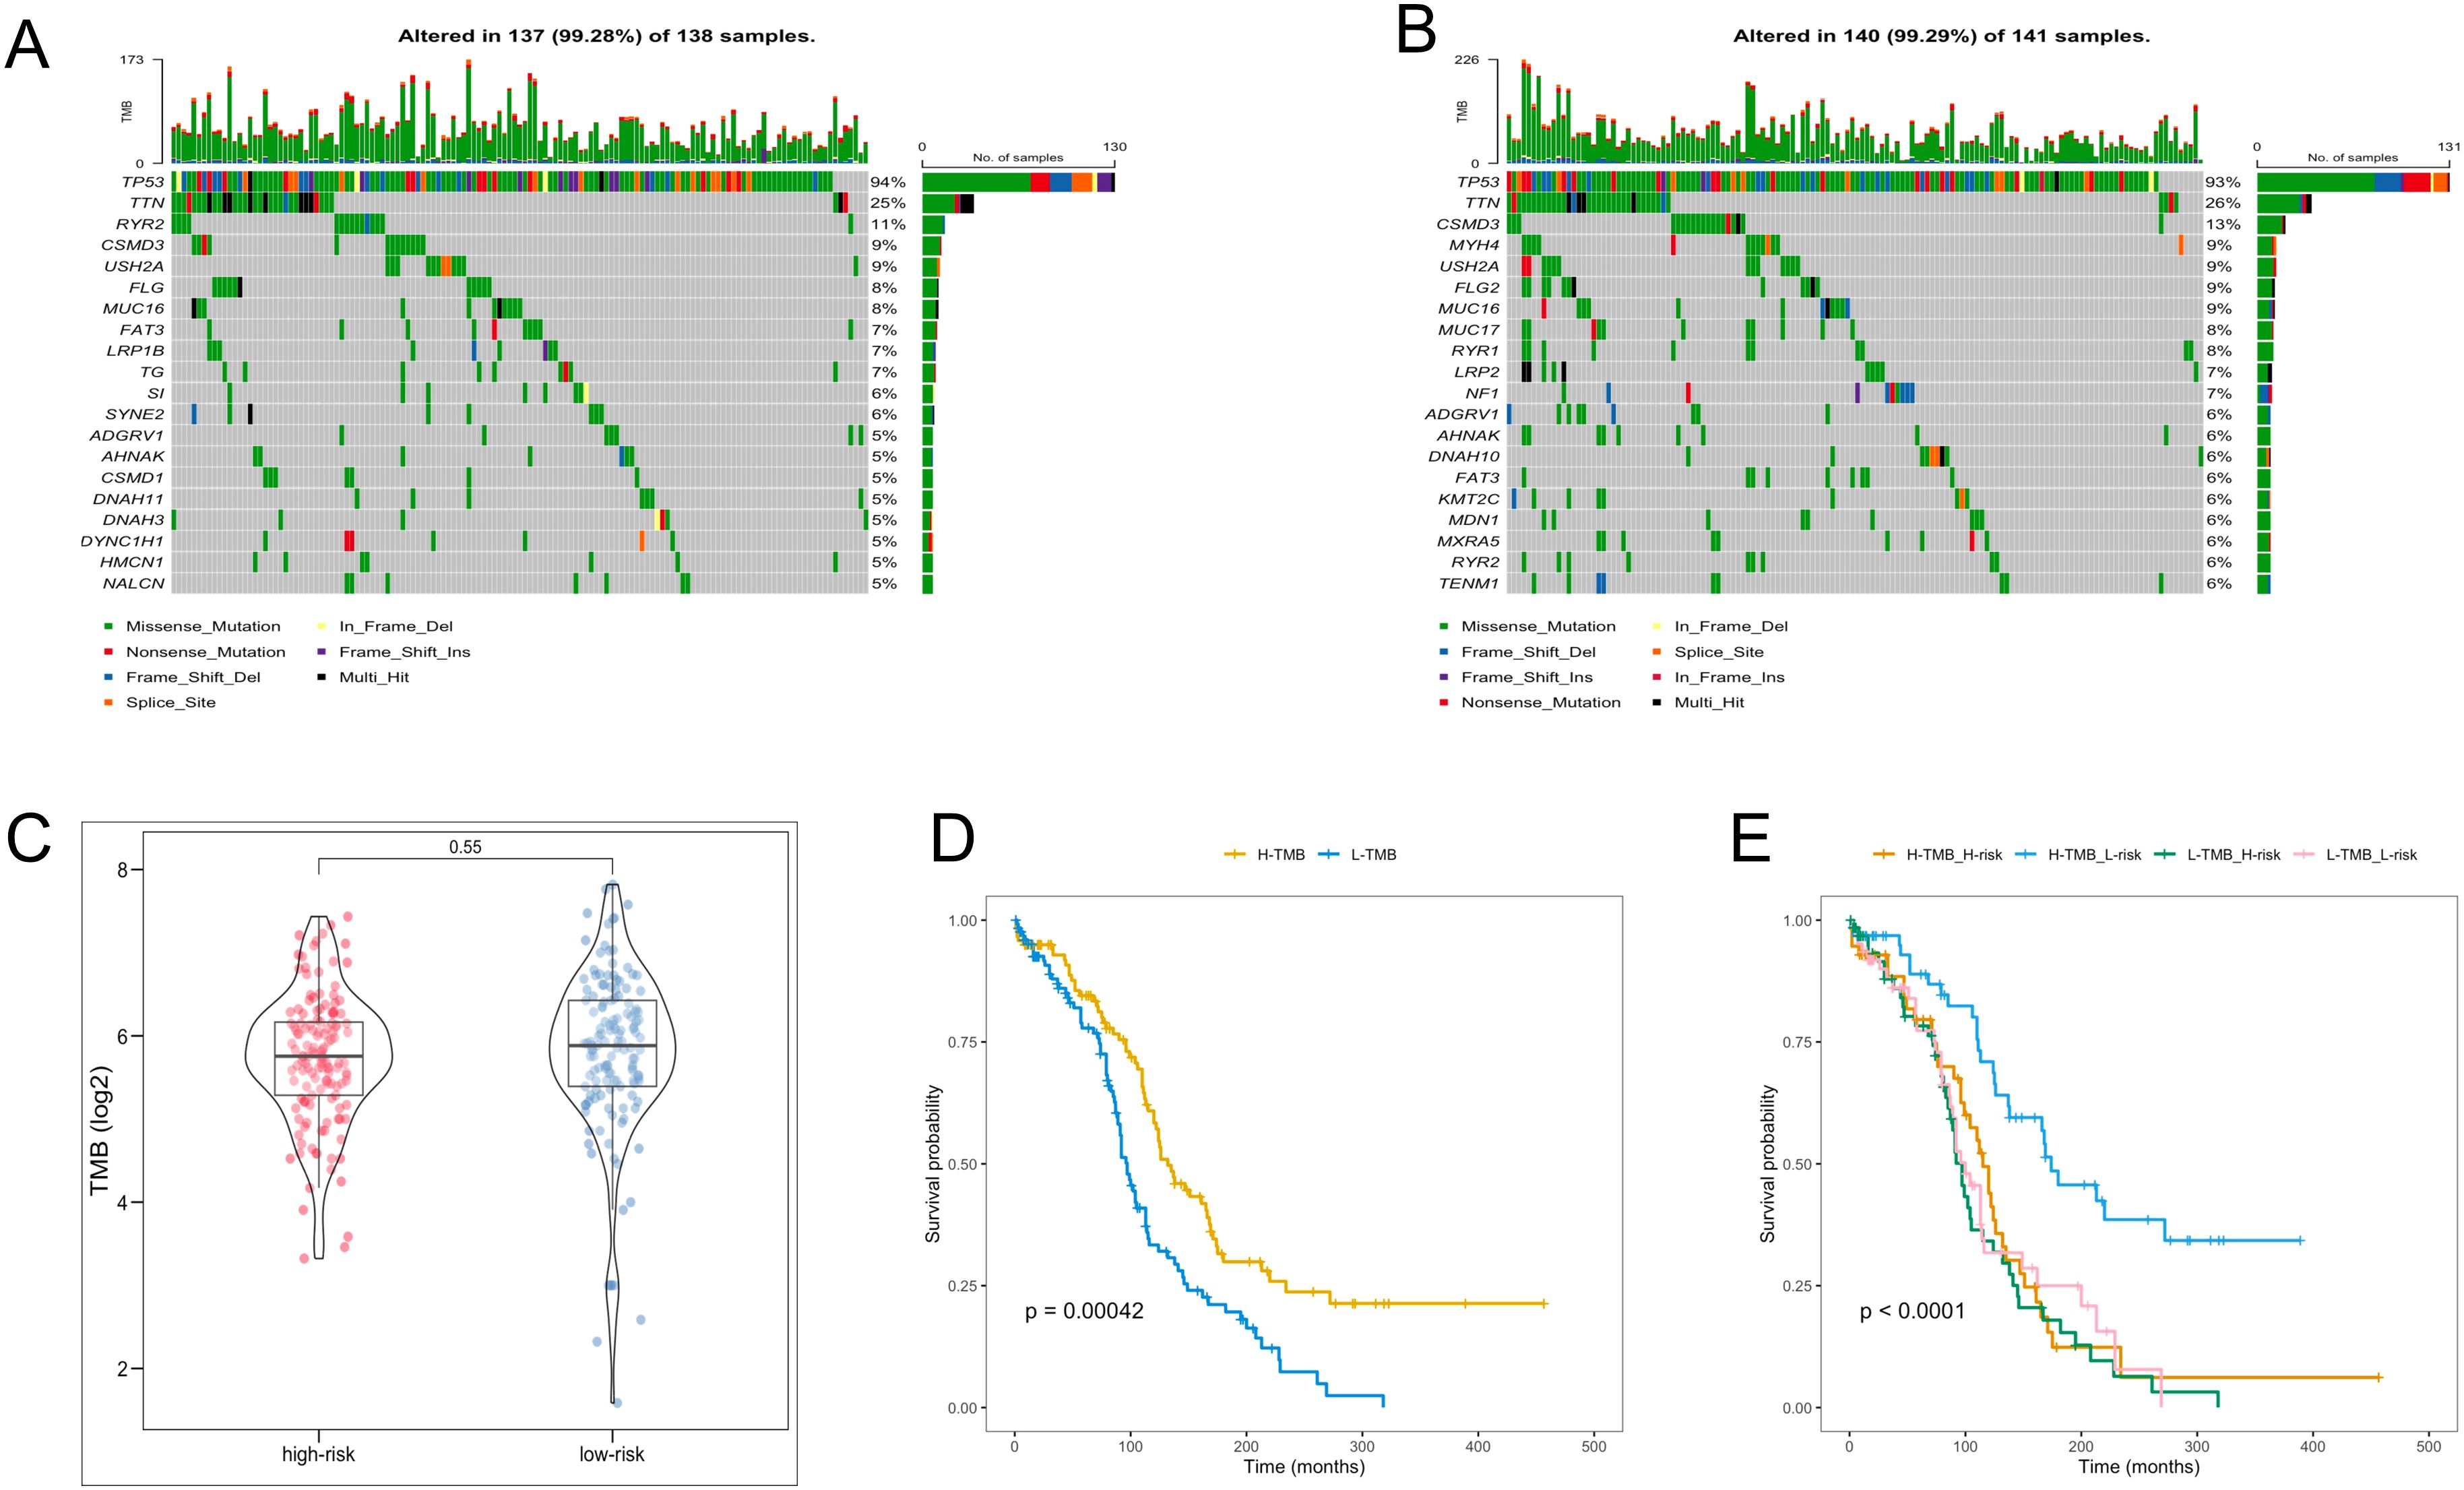
Figure 7. TMB analysis. (A, B) The waterfall plot of the frequency of TMB in two risk groups. (C) TMB levels between the two risk groups. (D) KM analysis of TCGA-OV patients in the low- and high-TMB groups. (E) KM analysis of TCGA-OV patients in the two risk groups combining the TMB groups.
To assess the efficacy of the TRLs prognostic model for predicting several drugs in OC, we calculated the IC50 value of the anti-cancer drugs in two groups of OC patients. The low-risk group had the low IC50 value of the anti-cancer drugs, which means that the above drugs were more sensitive to the low-risk group (Figure 8).
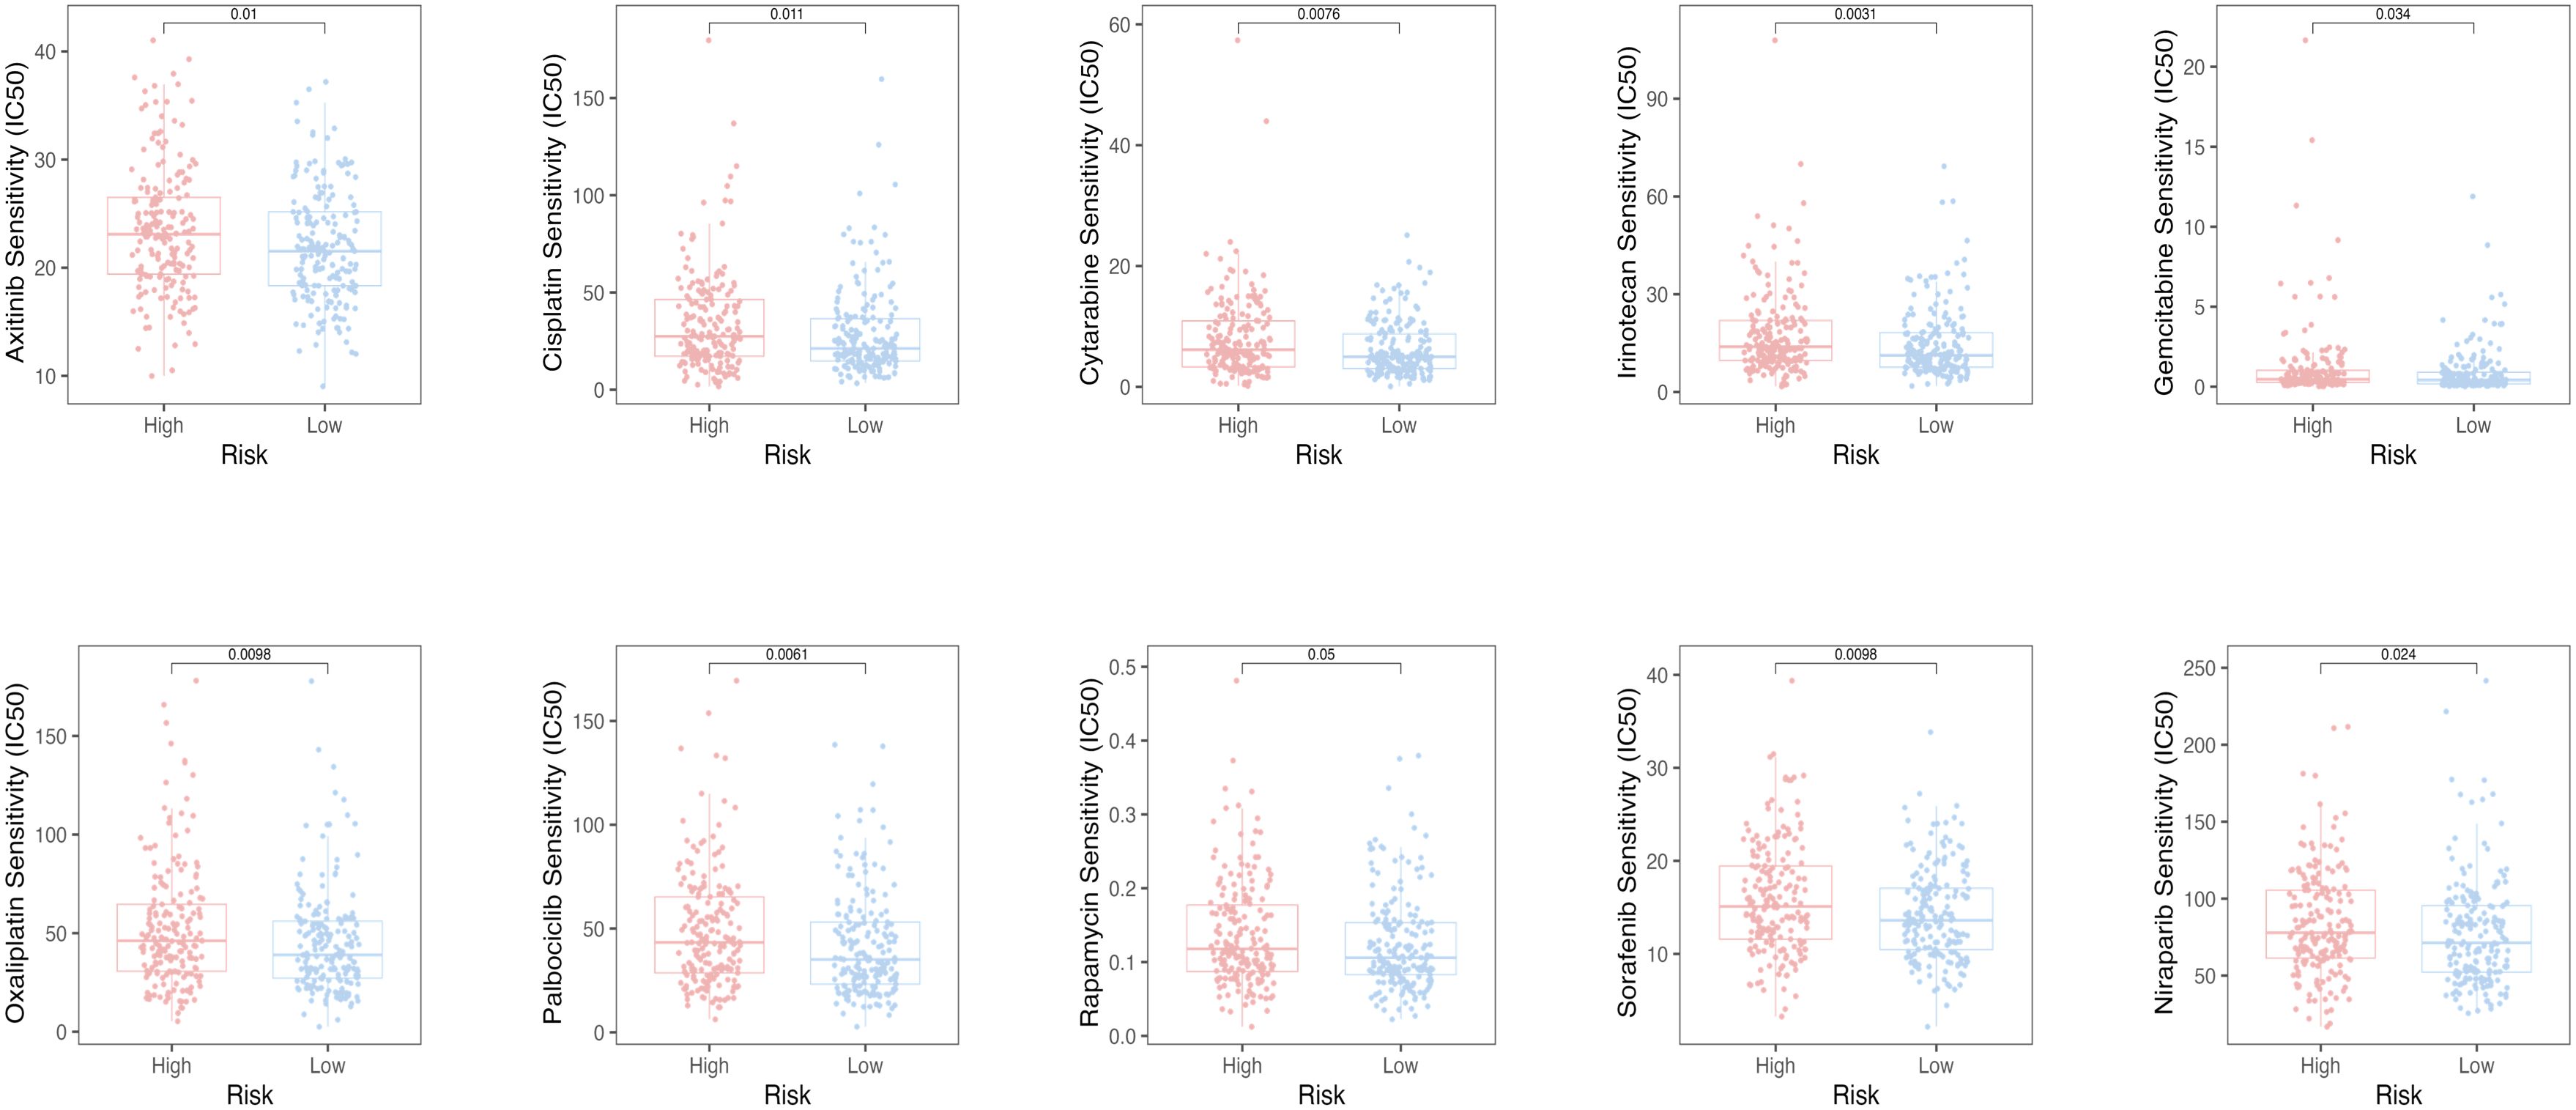
Figure 8. The oncoPredict algorithm predicted the IC50 values for ten anti-cancer drugs.
We performed qRT-PCR, and the result demonstrated that PTPRD-AS1, SPAG5-AS1, FAM27E3, and AC018647.3 were significantly over-expressed in OC cell lines (SKOV3, A2780, CAOV3) in comparison to normal IOSE-80 cells (P < 0.05). AC074286.1 were over-expressed in A2780 and CAOV3 cells and CHRM3-AS2 only in A2780 cells (P < 0.05) (Figure 9A). FAM27E3 had the highest expression in OC cell lines. We found that high expression of FAM27E3 was associated with a good prognosis (P = 0.036). Moreover, the levels of FAM27E3 were increased in stages III and grade III in OC. However, there was no significant difference among different stages and grades (Supplementary Figure 2). Among them, PTPRD-AS1, CHRM3-AS2, AC074286.1, and AC018647.3 were independent prognostic factors of OC patients. PTPRD-AS1 was strongly associated with the immune cells. In addition, high expression levels of PTPRD-AS1 have been proven to be associated with shorter survival of OC (35). But there is no further experimental evidence. Thus, we selected PTPRD-AS1 for more in-depth analysis. We utilized OS as the outcome measure to evaluate its effect on prognostic outcomes. Our results demonstrated a significant correlation between elevated PTPRD-AS1 expression and a poorer prognosis (P = 0.036, Supplementary Figure 3A), which was consistent with the previous research. Concurrently, we appraised the anti-cancer drugs sensitivity analysis. Patients exhibiting high levels of PTPRD-AS1 showed a more favorable response to the drugs Rapamycin and Dasatinib (Supplementary Figures 3B–F).
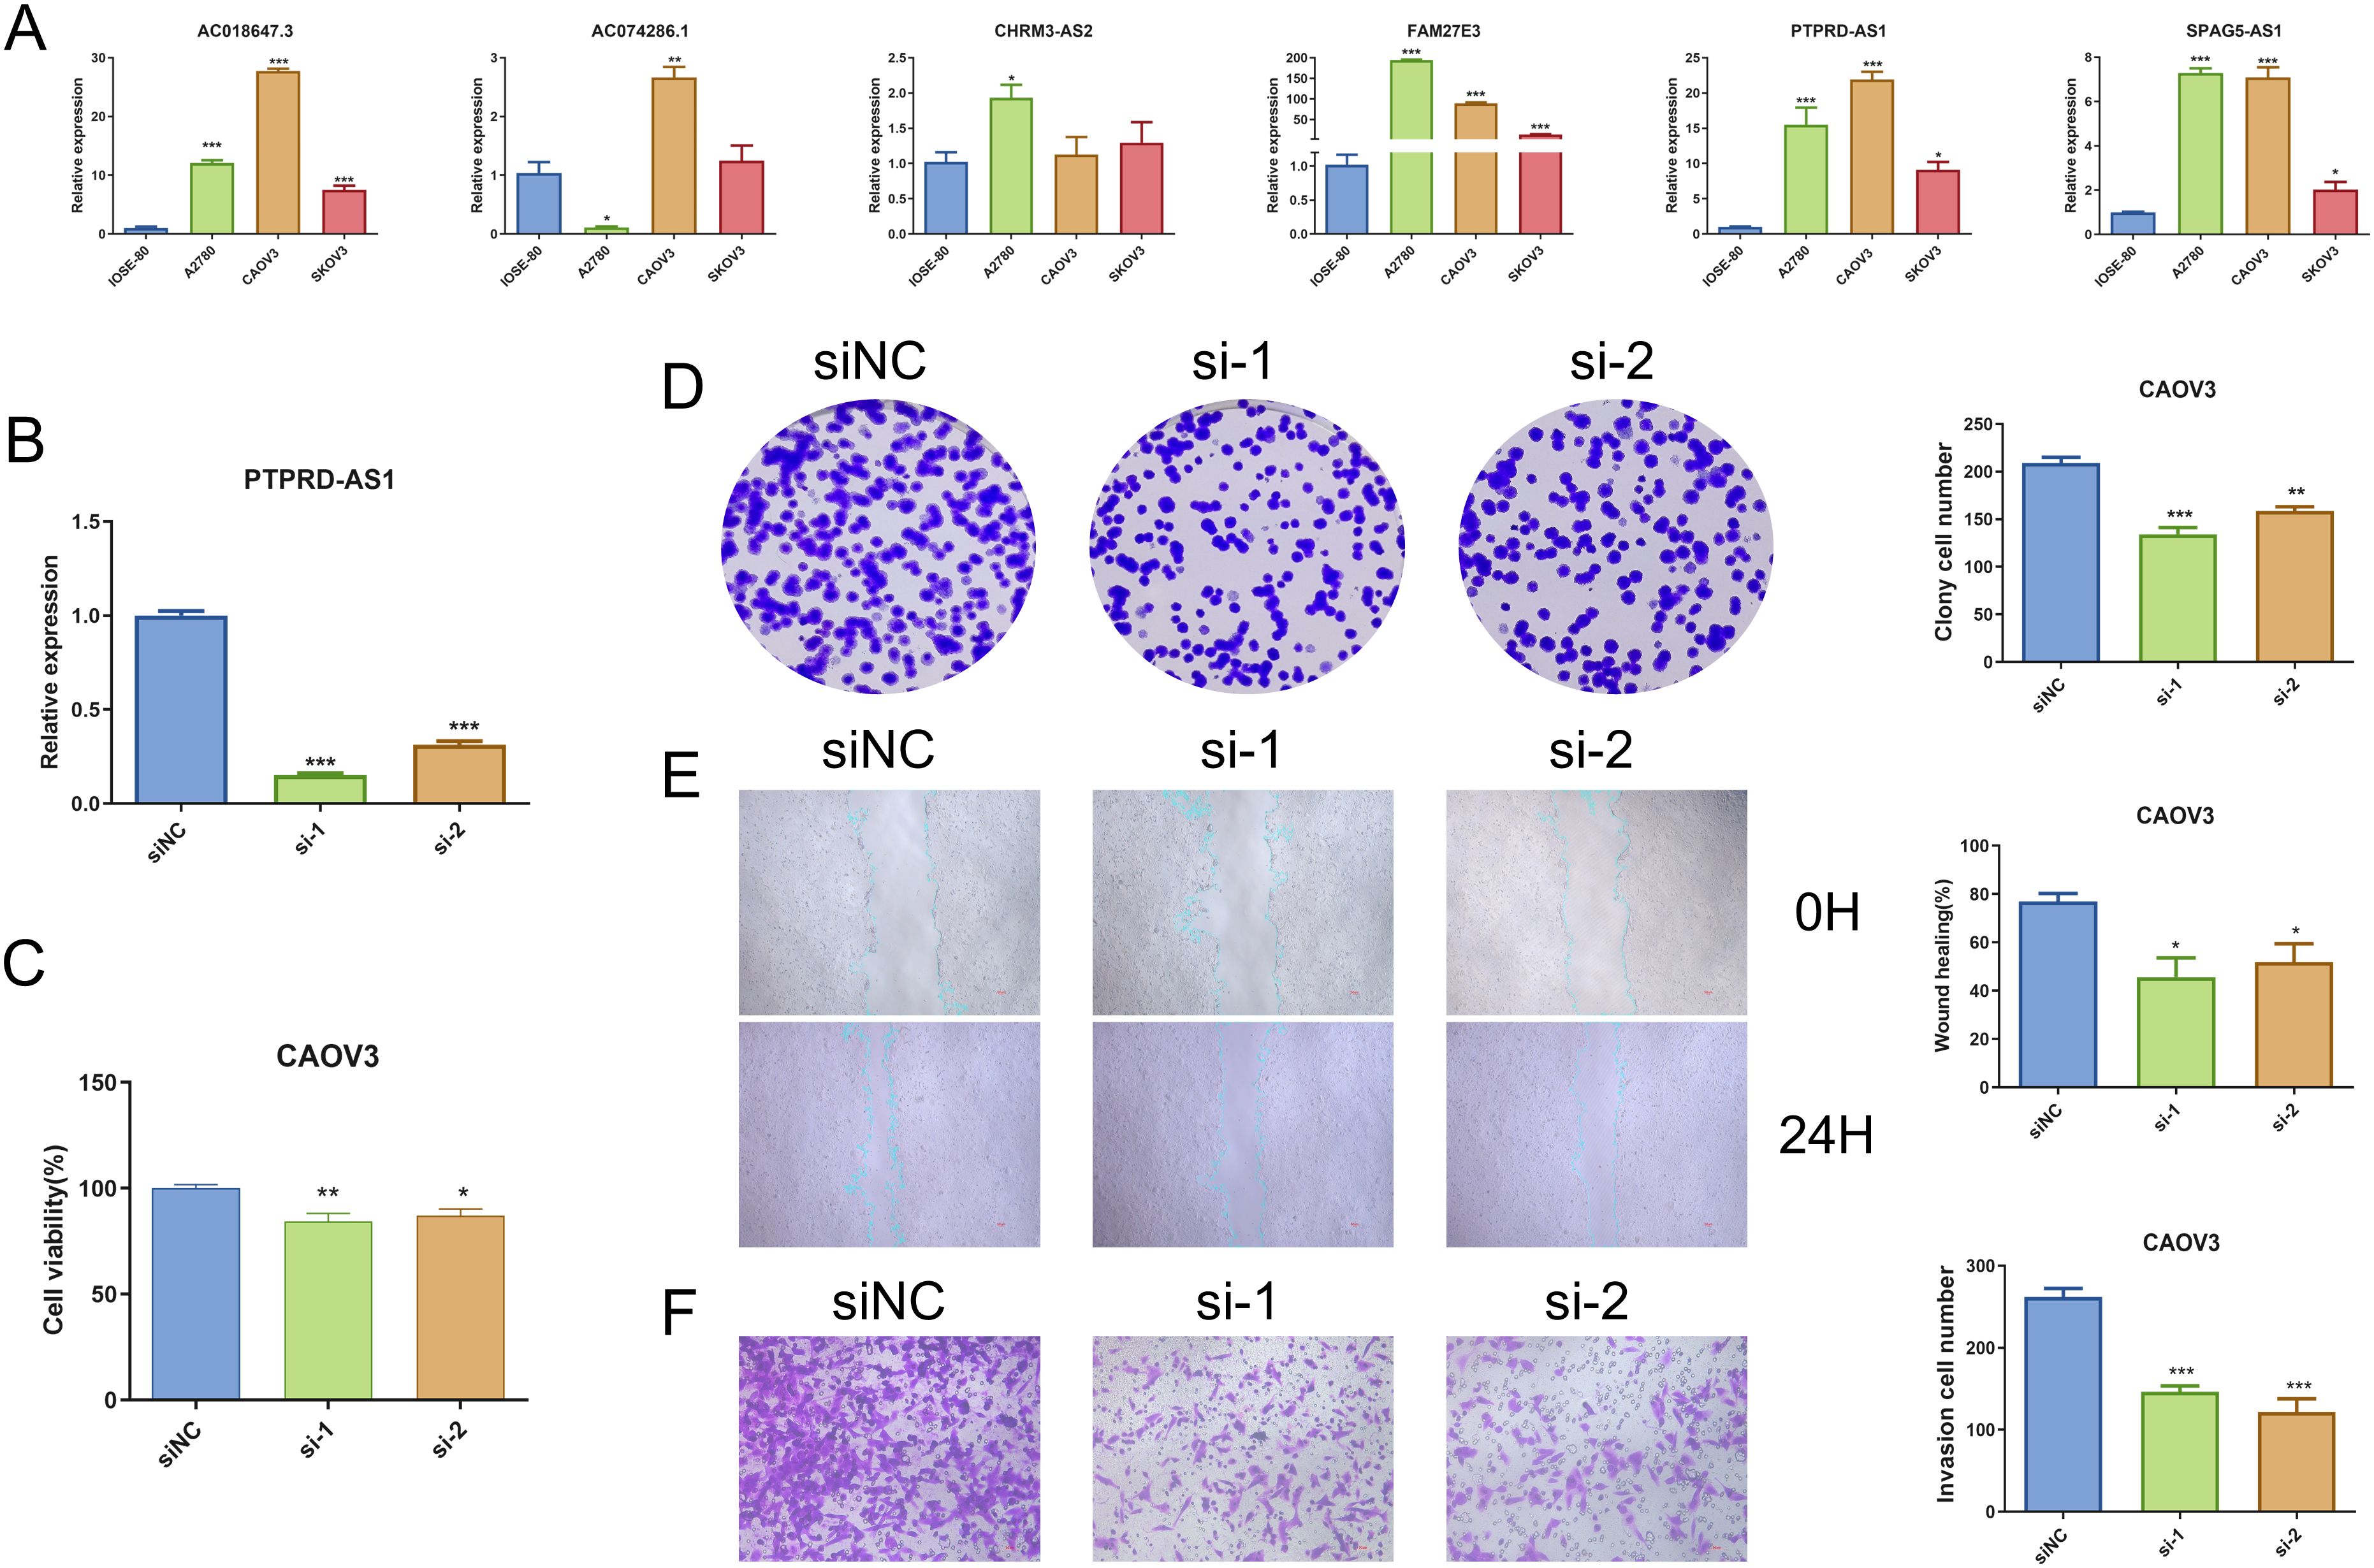
Figure 9. Analysis of PTPRD-AS1 mRNA Levels in OC. (A) Comparative expression levels of six prognostic genes in OC cell lines (SKOV3, A2780, CAOV3) and normal IOSE-80 cells by qRT-PCR. (B) Expression levels of PTPRD-AS1 in CAOV3 cells transduced with siRNA by qRT-PCR. (C–F) CCK8 assay, colony formation assay, wound healing assay, and transwell assay in transduced CAOV3 cells. The experiments were repeated at least three times. The One-way ANOVA was applied for statistical significance, * P < 0.05, ** P < 0.01, *** P < 0.001.
PTPRD-AS1 exhibited the highest mRNA expression levels in CAOV3 cells compared to other OC cell lines. Consequently, CAOV3 cells were chosen for further functional analysis. We achieved successful knockdown of PTPRD-AS1 in CAOV3 cells through transfection with Si-PTPRD-AS1 (Figure 9B). Importantly, the CCK8 assay and colony formation assay demonstrated a reduction in the proliferative capacity of CAOV3 cells after the knockdown of PTPRD-AS1, respectively (Figures 9C, D). Additionally, our findings indicated that the suppression of PTPRD-AS1 significantly impeded the metastatic and invasive properties of CAOV3 cells (Figures 9E, F). Notably, qPCR experiments revealed a significant downregulation of MMP2 and MMP9 upon PTPRD-AS1 knockdown (Supplementary Figure 4). Collectively, these results imply that the knockdown of PTPRD-AS1 exerts an inhibitory effect on the proliferation, migration, and invasion of CAOV3 cells.
OC remains a global malignancy characterized by metastatic invasiveness and recurrence (36). Notably, prognosis models based on lncRNAs have demonstrated accurate predictions for OC patient outcomes (37, 38). Although the clinical application of lncRNAs as predictive biomarkers is not yet fully understood, they offer distinct advantages over protein and mRNA biomarkers due to their tissue and stage-specific expression (39). This calls for more research to identify similar biomarkers for OC. Telomeres play a crucial role in preserving genomic integrity by safeguarding chromosome ends (40). Interestingly, anomalies in telomeric structures have been associated with various cancer types, underscoring their impact on oncogenesis and tumor progression. However, few studies explore the links between telomeres and lncRNAs in OC.
In this study, 79 TRGs were initially screened for differential expression between normal samples and OC samples. Through univariate Cox regression analysis, 10 TRLs were identified. Subsequently, based on LASSO and multivariate analysis, the prognostic model comprising 6 TRLs (PTPRD-AS1, SPAG5-AS1, CHRM3-AS2, AC074286.1, FAM27E3, and AC018647.3) was constructed. Among them, PTPRD-AS1 has been recognized as an effective biomarker for predicting the prognosis of breast cancer patients and OC patients (41). SPAG5-AS1 can promote apoptosis to improve and alleviate podocyte injury (42). CHRM3-AS2 was highly expressed in glioma cells, and silencing of CHRM3-AS2 expression could inhibit glioma growth (43). AC074286.1 had been proven as a protective lncRNA in glioma, and its high expression showed a favorable prognosis (44). The expression of FAM27E3 was up-regulated in thyroid cancer, and the high expressions of FAM27E3 suggested poor prognosis (45). However, the role of AC018647.3 remains unexplored in the literature, so future studies will necessitate investigations to unravel its functions and mechanisms.
To evaluate the prognostic utility of the model for OC patients, the OC patients were allocated into two risk groups. KM analysis revealed the low-risk group had the higher OS. ROC analysis demonstrated that the TRLs prognostic signature demonstrated potential in predicting OS. Subsequently, we confirmed the risk scores were the adverse prognostic factor. In addition, the nomogram enhanced the applicability of the prognostic model in clinical practice. The enrichment analysis was used to explore the mechanisms of prognostic TRLs. GO terms revealed these genes were observably related to fibrillar collagen trimer and collagen fibrill organization. The KEGG pathway contained proteoglycans in cancer and PI3K-Akt signaling pathway, etc. These biological processes and pathways likely contribute to the high-risk group towards poorer clinical OS.
We investigated the association between the characteristics of OC tumors and immune infiltration. The high-risk group had higher stromal score and estimate score, which might mean the activation of diverse biological behavior within the tumor microenvironment (46, 47). In addition, we find the levels of regulatory T cells (Tregs) were comparatively higher in the high-risk group, while the abundance of activated CD8 T cells and monocytes was the opposite by ssGESA. CIBERSORT analysis revealed that the high-risk group had significantly higher levels of M2 macrophages. Tregs are connected with dampening excessive immune activation and preserving immune homeostasis (48). Excessive activity of Tregs has the potential to promote the development of tumors (49). The strategic targeting of Tregs to restore a pro-inflammatory and immunogenic tumor microenvironment has gained increasing attention as an attractive approach for cancer treatment (50). CD8 T cells are the primary effector cells crucial for anti-tumor responses in immunotherapy. The phenomenon of CD8 T cell “exhaustion” frequently results in the loss of control and advancement of tumors (51). Monocytes, integral components of the mononuclear phagocyte system within the innate immune system, are crucial regulators of cancer initiation and progression. Distinct subsets of monocytes undertake diverse functions, contributing to both pro-tumoral and anti-tumoral immune responses (52). The expression of M2 macrophages is associated with a poor prognosis of OC (53). The study revealed that M2 macrophages stimulated the proliferation of OC cells, a process associated with the elevated expression of MMP9 (54). We observed discrepancies between the outcomes of ssGSEA and CIBERSORT analyses, which may point to contradictions. The varying levels of immune activity could potentially account for the poor prognosis observed in high-risk OC patients. It is noteworthy that the connection between the risk stratification of TRLs and immune response has not yet been verified. Elucidating the underlying mechanisms of this association is a valuable area for future investigation.
TMB is a critical measure of the tumor’s mutational load, which is translated into antigens that are presented to T cells. An elevated TMB can lead to the production of a greater number of neoantigens, increasing the chances of T cell recognition. This increased recognition may, in turn, enhance the efficacy of treatments involving immune checkpoint inhibitors by bolstering the immune system’s response against the tumor (55, 56). TMB levels are becoming widely acknowledged as a sensitive indicator predicting clinical responses to immunotherapy across diverse cancer types (57). Overall, TMB levels serve as a reflection of effective immune activation, with research indicating that higher TMB levels are associated with a greater likelihood of benefiting from immunotherapy (58). To investigate the essential roles of TMB in OC through somatic mutation analysis, we identified somatic mutations in 247 patients, with 137 (99.28%) in the high-risk group and 140 (99.29%) in the low-risk group. Consistent with findings from other studies, the TP53 gene had the highest mutation frequency (59). Moreover, The high-TMB group exhibited superior survival rates in OC, corroborating findings from the previous study (60). Interestingly, the high-TMB combined with the low-risk group demonstrated the highest OS rate, demonstrating that the low-risk group might derive more significant benefits from immunotherapy.
Additionally, we looked at patients’ responses to drug sensitivity, assessed through IC50 values. It is noteworthy that the above anti-tumor drugs were more sensitive to the low-risk group. In our subsequent analysis, we explored the correlation between PTPRD-AS1 expression and the sensitivity to the above anti-tumor drugs. Our findings indicated that patients with elevated PTPRD-AS1 levels exhibited a significantly better therapeutic response to Rapamycin and Dasatinib compared to those with lower levels. Rapamycin, a multifaceted immunosuppressant, has demonstrated therapeutic potential in the treatment of OC. Its antitumor activity is mediated through the inhibition of the mTOR signaling pathway, a critical cellular regulator of growth and proliferation (61, 62). Dasatinib, a potent tyrosine kinase inhibitor, has exhibited antitumor effects against OC (63). Collectively, these results indicate that patients with elevated levels of PTPRD-AS1 may respond more favorably to the therapeutic effects of Rapamycin and Dasatinib.
We verified six prognostic genes by qRT-PCR. The PTPRD-AS1, SPAG5-AS1, CHRM3-AS2, AC074286.1, FAM27E3 and AC018647.3 expression levels were significantly over-expressed in OC cell lines (SKOV3, A2780, CAOV3) in comparison to normal IOSE-80 cells. Notably, PTPRD-AS1 knockdown decreased cell proliferation, migration, and invasion in OC. In addition, we found a significant correlation between elevated PTPRD-AS1 expression and a poorer prognosis. And, PTPRD-AS1 was closely related to the immune cells. These results demonstrate that PTPRD-AS1 might serve as an efficient biomarker in OC.
Our study holds distinctive advantages. First, our prognostic model allows for a more nuanced understanding of the interactions between TRLs and patient outcomes. The risk of disease progression and prognosis for patients is evaluated by integrating clinical data with the expression levels of TRLs. Second, our model proposes a high-low risk stratification of patients and assesses their susceptibility to anti-cancer drugs as well as the efficacy of immunotherapy, which can facilitate more accurate treatment approaches and follow-up plans, providing the basis for personalized management and treatment strategies. Furthermore, our research has uncovered a novel biomarker for OC, PTPRD-AS1, which could be instrumental in identifying high-risk populations. It has the potential to enhance both the sensitivity and specificity of early diagnostic approaches, thereby improving the detection rate among at-risk individuals.
There are still some limitations to our study. First, aside from PTPRD-AS1, the remaining 5 TRLs need further experimental verification to confirm their roles. Second, our analysis was confined to the TCGA database, which means that our TRLs prognostic model needs to be validated using external datasets and ideally tested to test the predictive power of the model in a multicenter, large-scale clinical trial. In addition, achieving personalized precision studies depends on the integration of varied datasets, including clinical and multi-omics study data. Undoubtedly, our future research will be conducted in subsequent papers, including in vitro and in vivo experimental studies to better determine the capabilities of TRLs and mitigate the development of OC. We also need to collect blood and tissue samples from OC patients and integrate metabolomics and proteomics for comprehensive detection and analysis. This study is the first to verify the therapeutic potential of PTPRD-AS1 in OC. However, the precise mechanism by which PTPRD-AS1 influences prognosis, particularly its relationship with immune cell infiltration, remains to be elucidated. To explore this, We plan to examine the transcriptional effects of PTPRD-AS1 by conducting an RNA sequencing (RNA-seq) analysis. This will be complemented by the GO analysis to identify and characterize the functional roles of differentially expressed TRGs, providing insights into the mechanism of PTPRD-AS1. We will conduct flow cytometry assays to evaluate the impact of PTPRD-AS1 knockdown on the expression of OC cell surface markers. Additionally, we will co-culture these cells with peripheral blood mononuclear cells (PBMCs) or tumor-specific T cells to measure cytotoxic effects and the proliferation of immune cells. Immunohistochemical staining will be utilized to examine the spatial distribution and concentration of immune cells within tumor tissues, including CD8+ T cells, Monocytes, and Tregs. It is important to note that this study does not include drug-related validation. Consequently, future research will focus on pharmacokinetic studies to assess drug delivery, distribution, and accumulation of Rapamycin and Dasatinib in OC tissues.
The original contributions presented in the study are included in the article/Supplementary Material. Further inquiries can be directed to the corresponding authors.
WX: Investigation, Writing – original draft. SS: Validation, Writing – original draft. JW: Methodology, Writing – original draft. SG: Data curation, Writing – original draft. XZ: Methodology, Writing – original draft. HZ: Validation, Writing – original draft. YC: Funding acquisition, Writing – review & editing.
The author(s) declare financial support was received for the research, authorship, and/or publication of this article. The study was supported by the National Nature Science Foundation of China (No. 82004313), Natural Science Foundation of Minhang District, Shanghai (2023MHZ038), Medicine Foundation project of Longhua Hospital Affiliated to Shanghai University of Traditional Chinese Medicine (YM2021006) and Health Research Project of Shanghai Pudong New Area Health Commission (PKJ2021-Y101).
The authors declare that the research was conducted in the absence of any commercial or financial relationships that could be construed as a potential conflict of interest.
All claims expressed in this article are solely those of the authors and do not necessarily represent those of their affiliated organizations, or those of the publisher, the editors and the reviewers. Any product that may be evaluated in this article, or claim that may be made by its manufacturer, is not guaranteed or endorsed by the publisher.
The Supplementary Material for this article can be found online at: https://www.frontiersin.org/articles/10.3389/fimmu.2024.1452946/full#supplementary-material
1. Siegel RL, Miller KD, Wagle NS, Jemal A. Cancer statistics, 2023. CA Cancer J Clin. (2023) 73:17–48. doi: 10.3322/caac.21763
2. Vang R, Shih I, Kurman RJ. Ovarian low-grade and high-grade serous carcinoma: pathogenesis, clinicopathologic and molecular biologic features, and diagnostic problems. Adv Anat Pathol. (2009) 16:267–82. doi: 10.1097/PAP.0b013e3181b4fffa
3. Testa U, Petrucci E, Pasquini L, Castelli G, Pelosi E. Ovarian cancers: genetic abnormalities, tumor heterogeneity and progression, clonal evolution and cancer stem cells. Medicines (Basel). (2018) 5:16. doi: 10.3390/medicines5010016
4. Prat J. Figo’s staging classification for cancer of the ovary, fallopian tube, and peritoneum: abridged republication. J Gynecol Oncol. (2015) 26:87–9. doi: 10.3802/jgo.2015.26.2.87
5. Anastasiadou E, Messina E, Sanavia T, Labruna V, Ceccarelli S, Megiorni F, et al. Calcineurin gamma catalytic subunit ppp3cc inhibition by mir-200c-3p affects apoptosis in epithelial ovarian cancer. Genes (Basel). (2021) 12:1400. doi: 10.3390/genes12091400
6. Anastasiadou E, Messina E, Sanavia T, Mundo L, Farinella F, Lazzi S, et al. Mir-200c-3p contrasts pd-l1 induction by combinatorial therapies and slows proliferation of epithelial ovarian cancer through downregulation of β-catenin and c-myc. Cells. (2021) 10:519. doi: 10.3390/cells10030519
7. Hennessy BT, Coleman RL, Markman M. Ovarian cancer. Lancet. (2009) 374:1371–82. doi: 10.1016/S0140-6736(09)61338-6
8. Konstantinopoulos PA, Matulonis UA. Clinical and translational advances in ovarian cancer therapy. Nat Cancer. (2023) 4:1239–57. doi: 10.1038/s43018-023-00617-9
9. Blackburn EH. Switching and signaling at the telomere. Cell. (2001) 106:661–73. doi: 10.1016/s0092-8674(01)00492-5
10. Martínez P, Blasco MA. Telomeric and extra-telomeric roles for telomerase and the telomere-binding proteins. Nat Rev Cancer. (2011) 11:161–76. doi: 10.1038/nrc3025
11. Aviv A, Anderson JJ, Shay JW. Mutations, cancer and the telomere length paradox. Trends Cancer. (2017) 3:253–8. doi: 10.1016/j.trecan.2017.02.005
12. Toupance S, Fattet AJ, Thornton SN, Benetos A, Guéant JL, Koscinski I. Ovarian telomerase and female fertility. Biomedicines. (2021) 9:842. doi: 10.3390/biomedicines9070842
13. Falandry C, Horard B, Bruyas A, Legouffe E, Cretin J, Meunier J, et al. Telomere length is a prognostic biomarker in elderly advanced ovarian cancer patients: a multicenter gineco study. Aging (Albany NY). (2015) 7:1066–76. doi: 10.18632/aging.100840
14. Bhan A, Mandal SS. Lncrna hotair: a master regulator of chromatin dynamics and cancer. Biochim Biophys Acta. (2015) 1856:151–64. doi: 10.1016/j.bbcan.2015.07.001
15. Yunusov D, Anderson L, DaSilva LF, Wysocka J, Ezashi T, Roberts RM, et al. Hipstr and thousands of lncrnas are heterogeneously expressed in human embryos, primordial germ cells and stable cell lines. Sci Rep. (2016) 6:32753. doi: 10.1038/srep32753
16. Entezari M, Taheriazam A, Orouei S, Fallah S, Sanaei A, Hejazi ES, et al. Lncrna-mirna axis in tumor progression and therapy response: an emphasis on molecular interactions and therapeutic interventions. BioMed Pharmacother. (2022) 154:113609. doi: 10.1016/j.biopha.2022.113609
17. Xiao Q, Luo J, Liang C, Li G, Cai J, Ding P, et al. Identifying lncrna and mrna co-expression modules from matched expression data in ovarian cancer. IEEE/ACM Trans Comput Biol Bioinform. (2020) 17:623–34. doi: 10.1109/TCBB.2018.2864129
18. Fang L, Wang H, Li P. Systematic analysis reveals a lncrna-mrna co-expression network associated with platinum resistance in high-grade serous ovarian cancer. Invest New Drugs. (2018) 36:187–94. doi: 10.1007/s10637-017-0523-3
19. Fu LL, Li CJ, Xu Y, Li LY, Zhou X, Li DD, et al. Role of lncrnas as novel biomarkers and therapeutic targets in ovarian cancer. Crit Rev Eukaryot Gene Expr. (2017) 27:183–95. doi: 10.1615/CritRevEukaryotGeneExpr.v27.i2
20. Wang X, Wang Y, Sun F, Xu Y, Zhang Z, Yang C, et al. Novel lncrna zfhx4-as1 as a potential prognostic biomarker that affects the immune microenvironment in ovarian cancer. Front Oncol. (2022) 12:945518. doi: 10.3389/fonc.2022.945518
21. Rossi M, Gorospe M. Noncoding rnas controlling telomere homeostasis in senescence and aging. Trends Mol Med. (2020) 26:422–33. doi: 10.1016/j.molmed.2020.01.010
22. Oliva-Rico D, Herrera LA. Regulated expression of the lncrna terra and its impact on telomere biology. Mech Ageing Dev. (2017) 167:16–23. doi: 10.1016/j.mad.2017.09.001
23. Chen J, Zhang D, Ren X, Wang P. A comprehensive prognostic and immunological analysis of telomere-related lncrnas in kidney renal clear cell carcinoma. Aging (Albany NY). (2023) 15:11012–32. doi: 10.18632/aging.205056
24. Martin FJ, Amode MR, Aneja A, Austine-Orimoloye O, Azov AG, Barnes I, et al. Ensembl 2023. Nucleic Acids Res. (2023) 51:D933–41. doi: 10.1093/nar/gkac958
25. Braun DM, Chung I, Kepper N, Deeg KI, Rippe K. Telnet - a database for human and yeast genes involved in telomere maintenance. BMC Genet. (2018) 19:32. doi: 10.1186/s12863-018-0617-8
26. Zhang G, Feng Z, Zeng Q, Huang P. Exploring cancer dependency map genes and immune subtypes in colon cancer, in which tigd1 contributes to colon cancer progression. Aging (Albany NY). (2023) 15:6400–28. doi: 10.18632/aging.204859
27. Feng J, Yu Y, Yin W, Qian S. Development and verification of a 7-lncrna prognostic model based on tumor immunity for patients with ovarian cancer. J Ovarian Res. (2023) 16:31. doi: 10.1186/s13048-023-01099-0
28. Li XY, Zhao ZJ, Wang JB, Shao YH, Liu H, You JX, et al. M7g methylation-related genes as biomarkers for predicting overall survival outcomes for hepatocellular carcinoma. Front Bioeng Biotechnol. (2022) 10:849756. doi: 10.3389/fbioe.2022.849756
29. Zou J, Lin Z, Jiao W, Chen J, Lin L, Zhang F, et al. A multi-omics-based investigation of the prognostic and immunological impact of necroptosis-related mrna in patients with cervical squamous carcinoma and adenocarcinoma. Sci Rep. (2022) 12:16773. doi: 10.1038/s41598-022-20566-0
30. Lin Z, Zou J, Sui X, Yao S, Lin L, Wang J, et al. Necroptosis-related lncrna signature predicts prognosis and immune response for cervical squamous cell carcinoma and endocervical adenocarcinomas. Sci Rep. (2022) 12:16285. doi: 10.1038/s41598-022-20858-5
31. Zhao J, Zou J, Jiao W, Lin L, Wang J, Lin Z. Construction of n-7 methylguanine-related mrna prognostic model in uterine corpus endometrial carcinoma based on multi-omics data and immune-related analysis. Sci Rep. (2022) 12:18813. doi: 10.1038/s41598-022-22879-6
32. Marengo E, Robotti E. Biomarkers for pancreatic cancer: recent achievements in proteomics and genomics through classical and multivariate statistical methods. World J Gastroenterol. (2014) 20:13325–42. doi: 10.3748/wjg.v20.i37.13325
33. Ferri C, Hernández-Orallo J, Flach PA. A coherent interpretation of auc as a measure of aggregated classification performance. Proceedings of the 28th International Conference on Machine Learning (ICML-11) (2011), 657–64.
34. Xiao J, Wang R, Cai X, Ye Z. Coupling of co-expression network analysis and machine learning validation unearthed potential key genes involved in rheumatoid arthritis. Front Genet. (2021) 12:604714. doi: 10.3389/fgene.2021.604714
35. Zhou M, Sun Y, Sun Y, Xu W, Zhang Z, Zhao H, et al. Comprehensive analysis of lncrna expression profiles reveals a novel lncrna signature to discriminate nonequivalent outcomes in patients with ovarian cancer. Oncotarget. (2016) 7:32433–48. doi: 10.18632/oncotarget.8653
36. Schoutrop E, Moyano-Galceran L, Lheureux S, Mattsson J, Lehti K, Dahlstrand H, et al. Molecular, cellular and systemic aspects of epithelial ovarian cancer and its tumor microenvironment. Semin Cancer Biol. (2022) 86:207–23. doi: 10.1016/j.semcancer.2022.03.027
37. Chen Y, Bi F, An Y, Yang Q. Identification of pathological grade and prognosis-associated lncrna for ovarian cancer. J Cell Biochem. (2019) 120:14444–54. doi: 10.1002/jcb.28704
38. Zheng M, Hu Y, Gou R, Nie X, Li X, Liu J, et al. Identification three lncrna prognostic signature of ovarian cancer based on genome-wide copy number variation. BioMed Pharmacother. (2020) 124:109810. doi: 10.1016/j.biopha.2019.109810
39. Jin H, Du W, Huang W, Yan J, Tang Q, Chen Y, et al. Lncrna and breast cancer: progress from identifying mechanisms to challenges and opportunities of clinical treatment. Mol Ther Nucleic Acids. (2021) 25:613–37. doi: 10.1016/j.omtn.2021.08.005
40. Maciejowski J, de Lange T. Telomeres in cancer: tumour suppression and genome instability. Nat Rev Mol Cell Biol. (2017) 18:175–86. doi: 10.1038/nrm.2016.171
41. Wu Y, Zhang L, He S, Guan B, He A, Yang K, et al. Identification of immune-related lncrna for predicting prognosis and immunotherapeutic response in bladder cancer. Aging (Albany NY). (2020) 12:23306–25. doi: 10.18632/aging.104115
42. Gao X, Zhang S, Chen Y, Wen X, Chen M, Wang S, et al. Development of a novel six-long noncoding rna signature predicting survival of patients with bladder urothelial carcinoma. J Cell Biochem. (2019) 120:19796–809. doi: 10.1002/jcb.29285
43. Wang D, Chen Q, Liu J, Liao Y, Jiang Q. Silencing of lncrna chrm3-as2 expression exerts anti-tumour effects against glioma via targeting microrna-370-5p/klf4. Front Oncol. (2022) 12:856381. doi: 10.3389/fonc.2022.856381
44. Duan WW, Yang LT, Liu J, Dai ZY, Wang ZY, Zhang H, et al. A TGF-β signaling-related lncRNA signature for prediction of glioma prognosis, immune microenvironment, and immunotherapy response. CNS Neurosci Ther. (2024) 30:e14489. doi: 10.1111/cns.14489
45. Zhang D, Xiang KF, Xiang C, Wu Y, Wang L. Construction of novel 7 integrin-related gene signatures in thyroid cancer construction of model based on integrin genes. Med (Baltimore). (2023) 102:e36412. doi: 10.1097/MD.0000000000036412
46. Liu Y, Wang Y, Li C, Feng H, Liu Y, Ma L. An effective prognostic model in colon adenocarcinoma composed of cuproptosis-related epigenetic regulators. Front Pharmacol. (2023) 14:1254918. doi: 10.3389/fphar.2023.1254918
47. Anderson NM, Simon MC. The tumor microenvironment. Curr Biol. (2020) 30:R921–5. doi: 10.1016/j.cub.2020.06.081
48. Ferreira L, Muller YD, Bluestone JA, Tang Q. Next-generation regulatory t cell therapy. Nat Rev Drug Discovery. (2019) 18:749–69. doi: 10.1038/s41573-019-0041-4
49. Dees S, Ganesan R, Singh S, Grewal IS. Regulatory t cell targeting in cancer: emerging strategies in immunotherapy. Eur J Immunol. (2021) 51:280–91. doi: 10.1002/eji.202048992
50. Yan Y, Huang L, Liu Y, Yi M, Chu Q, Jiao D, et al. Metabolic profiles of regulatory t cells and their adaptations to the tumor microenvironment: implications for antitumor immunity. J Hematol Oncol. (2022) 15:104. doi: 10.1186/s13045-022-01322-3
51. Wang Q, Qin Y, Li B. Cd8(+) t cell exhaustion and cancer immunotherapy. Cancer Lett. (2023) 559:216043. doi: 10.1016/j.canlet.2022.216043
52. Olingy CE, Dinh HQ, Hedrick CC. Monocyte heterogeneity and functions in cancer. J Leukoc Biol. (2019) 106:309–22. doi: 10.1002/JLB.4RI0818-311R
53. Hensler M, Kasikova L, Fiser K, Rakova J, Skapa P, Laco J, et al. M2-like macrophages dictate clinically relevant immunosuppression in metastatic ovarian cancer. J Immunother Cancer. (2020) 8:e000979. doi: 10.1136/jitc-2020-000979
54. Carroll MJ, Kapur A, Felder M, Patankar MS, Kreeger PK. M2 macrophages induce ovarian cancer cell proliferation via a heparin binding epidermal growth factor/matrix metalloproteinase 9 intercellular feedback loop. Oncotarget. (2016) 7:86608–20. doi: 10.18632/oncotarget.13474
55. Jardim DL, Goodman A, de Melo GD, Kurzrock R. The challenges of tumor mutational burden as an immunotherapy biomarker. Cancer Cell. (2021) 39:154–73. doi: 10.1016/j.ccell.2020.10.001
56. Li ZH, Li JY, Wu ZT, Zhu YJ, Zhuo T, Nong JS, et al. Upregulation of poc1a in lung adenocarcinoma promotes tumour progression and predicts poor prognosis. J Cell Mol Med. (2024) 28:e18135. doi: 10.1111/jcmm.18135
57. Samstein RM, Lee CH, Shoushtari AN, Hellmann MD, Shen R, Janjigian YY, et al. Tumor mutational load predicts survival after immunotherapy across multiple cancer types. Nat Genet. (2019) 51:202–6. doi: 10.1038/s41588-018-0312-8
58. Nie S, Ni N, Chen N, Gong M, Feng E, Liu J, et al. Development of a necroptosis-related gene signature and the immune landscape in ovarian cancer. J Ovarian Res. (2023) 16:82. doi: 10.1186/s13048-023-01155-9
59. Zhao S, Zhang X, Gao F, Chi H, Zhang J, Xia Z, et al. Identification of copper metabolism-related subtypes and establishment of the prognostic model in ovarian cancer. Front Endocrinol (Lausanne). (2023) 14:1145797. doi: 10.3389/fendo.2023.1145797
60. Wang H, Liu J, Yang J, Wang Z, Zhang Z, Peng J, et al. A novel tumor mutational burden-based risk model predicts prognosis and correlates with immune infiltration in ovarian cancer. Front Immunol. (2022) 13:943389. doi: 10.3389/fimmu.2022.943389
61. Huynh H, Teo CC, Soo KC. Bevacizumab and rapamycin inhibit tumor growth in peritoneal model of human ovarian cancer. Mol Cancer Ther. (2007) 6:2959–66. doi: 10.1158/1535-7163.MCT-07-0237
62. Schlosshauer PW, Li W, Lin KT, Chan JL, Wang LH. Rapamycin by itself and additively in combination with carboplatin inhibits the growth of ovarian cancer cells. Gynecol Oncol. (2009) 114:516–22. doi: 10.1016/j.ygyno.2009.06.002
Keywords: ovarian cancer, prognosis, telomere, immune, lncRNA
Citation: Xu W, Sang S, Wang J, Guo S, Zhang X, Zhou H and Chen Y (2024) Identification of telomere-related lncRNAs and immunological analysis in ovarian cancer. Front. Immunol. 15:1452946. doi: 10.3389/fimmu.2024.1452946
Received: 21 June 2024; Accepted: 26 August 2024;
Published: 17 September 2024.
Edited by:
Eyad Elkord, Xi’an Jiaotong-Liverpool University, ChinaReviewed by:
Dipanjan Ghosh, National Institute of Pharmaceutical Education and Research, Kolkata, IndiaCopyright © 2024 Xu, Sang, Wang, Guo, Zhang, Zhou and Chen. This is an open-access article distributed under the terms of the Creative Commons Attribution License (CC BY). The use, distribution or reproduction in other forums is permitted, provided the original author(s) and the copyright owner(s) are credited and that the original publication in this journal is cited, in accordance with accepted academic practice. No use, distribution or reproduction is permitted which does not comply with these terms.
*Correspondence: Hailun Zhou, YXBtNzBhbGxlbkAxMjYuY29t; Yijia Chen, NzQyODg2NDg3QHFxLmNvbQ==
†These authors have contributed equally to this work and share first authorship
‡ORCID: Yijia Chen, orcid.org/0000-0002-5602-5667
Disclaimer: All claims expressed in this article are solely those of the authors and do not necessarily represent those of their affiliated organizations, or those of the publisher, the editors and the reviewers. Any product that may be evaluated in this article or claim that may be made by its manufacturer is not guaranteed or endorsed by the publisher.
Research integrity at Frontiers
Learn more about the work of our research integrity team to safeguard the quality of each article we publish.