- 1Department of Clinical Laboratory, Shanghai Pulmonary Hospital, School of Medicine, Tongji University, Shanghai, China
- 2Shanghai Institute of Immunity and Infection, Chinese Academy of Sciences, Shanghai, China
Staphylococcus aureus (S. aureus) is an opportunistic pathogen that could cause life-threatening bloodstream infections. The objective of this study was to identify potential diagnostic biomarkers of S. aureus bloodstream infection. Gene expression dataset GSE33341 was optimized as the discovery dataset, which contained samples from human and mice. GSE65088 dataset was utilized as a validation dataset. First, after overlapping the differentially expressed genes (DEGs) in S. aureus infection samples from GSE33341-human and GSE33341-mice samples, we detected 63 overlapping genes. Subsequently, the hub genes including DRAM1, PSTPIP2, and UPP1 were identified via three machine-learning algorithms: random forest, support vector machine-recursive feature elimination, and least absolute shrinkage and selection operator. Additionally, the receiver operating characteristic curve was leveraged to verify the efficacy of the hub genes. DRAM1 (AUC=1), PSTPIP2 (AUC=1), and UPP1 (AUC=1) were investigated and demonstrated significant expression differences (all P < 0.05) and diagnostic efficacy in the training and validation datasets. Furthermore, the relationship between the diagnostic markers and the abundance of immune cells was assessed using cell-type identification by estimating relative subsets of RNA transcripts (CIBERSORT). These three diagnostic indicators also correlated with multiple immune cells to varying degrees. The expression of DRAM1 was significantly positively correlated with B cell naive and mast cell activation, and negatively correlated with NK cells and CD4/CD8+ T cells. The expression of PSTPIP2 was significantly positively correlated with macrophage M0, macrophage M1, B cell naive, and dendritic cell activation, while the expression of PSTPIP2 was negatively correlated with NK cells and CD4/CD8+ T cells. Significant negative correlations between UPP1 expression and T cell CD4 memory rest and neutrophils were also observed. Finally, we established a mouse model of S. aureus bloodstream infection and collected the blood samples for RNA-Seq analysis and RT-qPCR experiments. The analysis results in RNA-Seq and RT-qPCR experiments further confirmed the significant expression differences (all P < 0.05) of these three genes. Overall, three candidate hub genes (DRAM1, PSTPIP2, and UPP1) were identified initially for S. aureus bloodstream infection diagnosis. Our study could provide potential diagnostic biomarkers for S. aureus bloodstream infection patients.
Introduction
The opportunistic pathogenic bacterium Staphylococcus aureus has successfully adapted to the human body’s environmental conditions (1). It causes a spectrum of infections in communities and hospitals, ranging from skin and soft tissue infections to life-threatening bloodstream infections (2). A critical feature of bloodstream infections by S. aureus is the coordinated and timely expression of virulence factors and other relevant genes by the pathogen. Due to its prevalence, S. aureus ranks among the leading pathogens causing bloodstream infections (3). The S. aureus bloodstream infections are characterized by high mortality rates (ranging from 20% to 50%), frequent recurrence (5-10%), and sustained injury in over one-third of survivors (3–5). Over the past three decades, the incidence rate of S. aureus bloodstream infection has been increasing in developed countries (3, 4), but remains a significant but often overlooked issue in developing countries (6). Therefore, there is an urgent need to identify biomarkers for the diagnosis of S. aureus bloodstream infection.
During infections, S. aureus could trigger inflammatory responses, including the secretion of cytokines and chemokines that recruit leukocytes to the area of infection. These recruited neutrophils, monocytes, macrophages, NK cells, Dendritic cells (DCs), and CD4/CD8+ T cells play crucial roles in both the direct killing of bacteria and the indirect control of infection, such as contributing to the cytokine milieu, clearing damaged cells, and presenting antigen to initiate adaptive immunity (7). Hence, discovering new immunological biomarkers was important not only for the diagnosis but also for the application of immunotherapy in S. aureus bloodstream infection.
High-throughput sequencing was a valuable method for investigating changes in disease gene expression and distinguishing possible disease-related genes for new diagnostic and therapeutic biomarkers (8). Gene expression levels serve as essential indicators for diagnosing various disorders, including S. aureus bloodstream infection (9). Machine learning method assists in assessing high-dimensional transcriptome data and identifying biologically significant genes (10).
In this study, we integrated multiple high-throughput sequencing datasets of S. aureus bloodstream infections and employed machine learning algorithms for the first time to identify three characteristic genes associated with these infections, distinguishing our work from previous studies (8, 11–13). In addition, using a mouse model of S. aureus bloodstream infection, we validated the diagnostic value of these three genes through RNA-Seq and RT-qPCR experiments. Additionally, we investigated the relationship between diagnostic markers and immune cell abundance to acquire a more in-depth understanding of the molecular immune mechanisms underlying S. aureus bloodstream infections. Our study may offer potential diagnostic biomarkers and select potential candidates receiving immunotherapy for patients with S. aureus bloodstream infection.
Methods
Public gene expression datasets
Accessing the Gene Expression Omnibus (GEO) database (https://www.ncbi.nlm.nih.gov/geo/), which is a public collection of high-throughput gene expression data, chips, and microarrays, was how the information was collected. We searched the GEO database with the keywords “Staphylococcus aureus” [MeSH Terms] AND “Bloodstream infection”[All Fields]. None of the included samples were associated with any other diseases. The sample size of both the pediatric sepsis group and the normal group was greater than 10. Finally, GSE33341 (14) was utilized as the discovery dataset, which contained samples from human and mice. Another dataset GSE65088 (15) was applied as a validation dataset.
Identification of the differentially expressed genes
The Wilcoxon test was utilized to identify differentially expressed genes (DEGs) between the S. aureus bloodstream infection group and the control group. A volcano plot was generated to visualize the differential expression of DEGs. A P value < 0.05 and |log2FC|> 1 were considered to be the cutoffs for DEGs.
Evaluation of functional enrichment
Gene Ontology (GO) and the Kyoto Encyclopedia of Genes and Genomes (KEGG) pathway enrichment analyses were conducted via the “clusterProfiler” (16) package in R to explore possible biological features of DEGs. Gene set enrichment analysis (GSEA) (17) was also used to investigate the enrichment pathways via the “clusterProfiler” package in R.
Screening and validation of diagnostic markers
Firstly, we intersected the up-regulated genes in the human S. aureus infection group and the mice S. aureus infection group in GSE33341 to obtain genes associated with S. aureus bloodstream infection. Subsequently, these genes were further screened using three machine-learning algorithms, random forests (RF), support vector machine-recursive feature elimination (SVM-RFE), and least absolute shrinkage and selection operator (LASSO) logistic regression, to identify robust biomarkers for S. aureus bloodstream infection. The “randomForest” R package in R was used to implement the random forest technique with 100 trees generated for each datapoint, and genes with top MeanDecreaseAccuracy were screened out (18). LASSO logistic regression investigation was conducted with the R package “glmnet”, and minimal lambda was considered optimal. In our study, the selection of optimization parameters was cross-verified by a factor of 10, and the partial likelihood deviation met the minimum criteria (19). The DEGs were also determined by applying a support vector machine recursive feature elimination (SVM-RFE) algorithm based on a nonlinear SVM using R package “kernlab”, “e1071”, and “caret” (20). It was evaluated based on the study of receiver operating characteristic (ROC) curves, and the area under the curve (AUC) was calculated to assess the predictive capability of these markers. The GSE65088 dataset was enrolled to validate the predictive power of these biomarkers.
Assessment of immune cell abundance
Immune cell abundance was assessed by computing the differential abundances of 22 immune cells using the CIBERSORT (21) algorithm. The correlation between gene expression and immune cells were assessed using Pearson’s correlation coefficients. Correlation plots were plotted using the “ggpubr” R package.
Construction of S. aureus bloodstream infection
Methicillin-sensitive Staphylococcus aureus (MSSA) Newman strain was grown for 16 h on TSB medium at 37°C. Overnight cultures were centrifuged at 2683g (RCF) for 5 min at room temperature and adjusted to a concentration of 2 × 10⁹ CFU/mL using phosphate-buffered saline (PBS). Next, injected into female Balb/c mice via the tail vein with 100 μL PBS containing 2 × 10⁸ CFU bacterial cells suspended. At 8 h.p.i., anesthetized the mice with 2,2,2-tribromoethanol (5 mg/25 g). Used surgical scissors to remove mouse whiskers, then clamped the eyeball with tweezers and quickly removed it, allowing blood to flow from the eye socket into the EP tube. The blood sample was immediately placed in liquid nitrogen and maintained at −80°C until RNA extraction.
RNA-Seq and data processing
After the blood samples were collected from mice infected with S. aureus, the RNA for RNA-Seq samples were immediately mixed with Trizol Reagent (Ambion®) and then sent to Shanghai Personal Biotechnology Cp. Ltd for the subsequent RNA transcriptome sequencing work. Following library preparation and pooling of different samples, the samples were subjected to Illumina sequencing. Commonly, the RNA-Seq use PE150 (paired-end 150nt) sequencing. Raw data (raw reads) of FASTQ format were first processed through in-house perl scripts. In this step, clean data (clean reads) were obtained by removing the following reads: (1) reads with adapter; (2) reads with more than 3 N; (3) reads with more than 20% nucleotides with Qphred<=5; At the same time, Q20, Q30 and GC content of the clean data were calculated. Then, map the clean reads to the silva database to remove the rRNA. All the downstream analyses were based on clean data without rRNA. Paired-end clean reads were aligned to the reference genome using Hisat2 (22). Featurecount (23) was used to count the reads numbers mapped to each gene.
RNA extraction and real-time polymerase chain reaction
The total RNA of blood was isolated by Trizol Reagent (24) and then was reverse transcribed into cDNA using the PrimeScript RT reagent kit with gDNA Eraser (Takara). Real-time quantitative PCR (RT-qPCR) was performed using TB GreenTM Premix Ex TaqTM II (Takara) on QuantStudioTM 5 Real-Time PCR System (Applied Biosystems). RNA expression levels of DRAM1, PSTPIP2, and UPP1 genes unified to GAPDH were calculated by the formula 2−ΔΔCt. All primers used in this study were listed in Supplementary Table 1. Each reaction was performed trice.
Statistical analysis
R version 4.2.2 was utilized for all statistical analyses and graphics except for RT-qPCR results which were analyzed by GraphPad Prism 8 (GraphPad Software Inc. San Diego, CA, USA). Statistical significance was determined by a two-tailed test with a P value of less than 0.05. **P < 0.01, ****P < 0.0001.
Results
Screening of DEGs in S. aureus bloodstream infection
The clinical characteristics of the two groups of samples are presented in Supplementary Table 2. Figure 1 displays the study design of this research. The human blood samples in GSE33341, consisting of 31 S. aureus infection samples and 43 control samples, were applied to obtain 482 DEGs. Following the identification of DEGs, heatmap (Figure 2A) and volcano plots (Figure 2B) were drawn to present these findings.
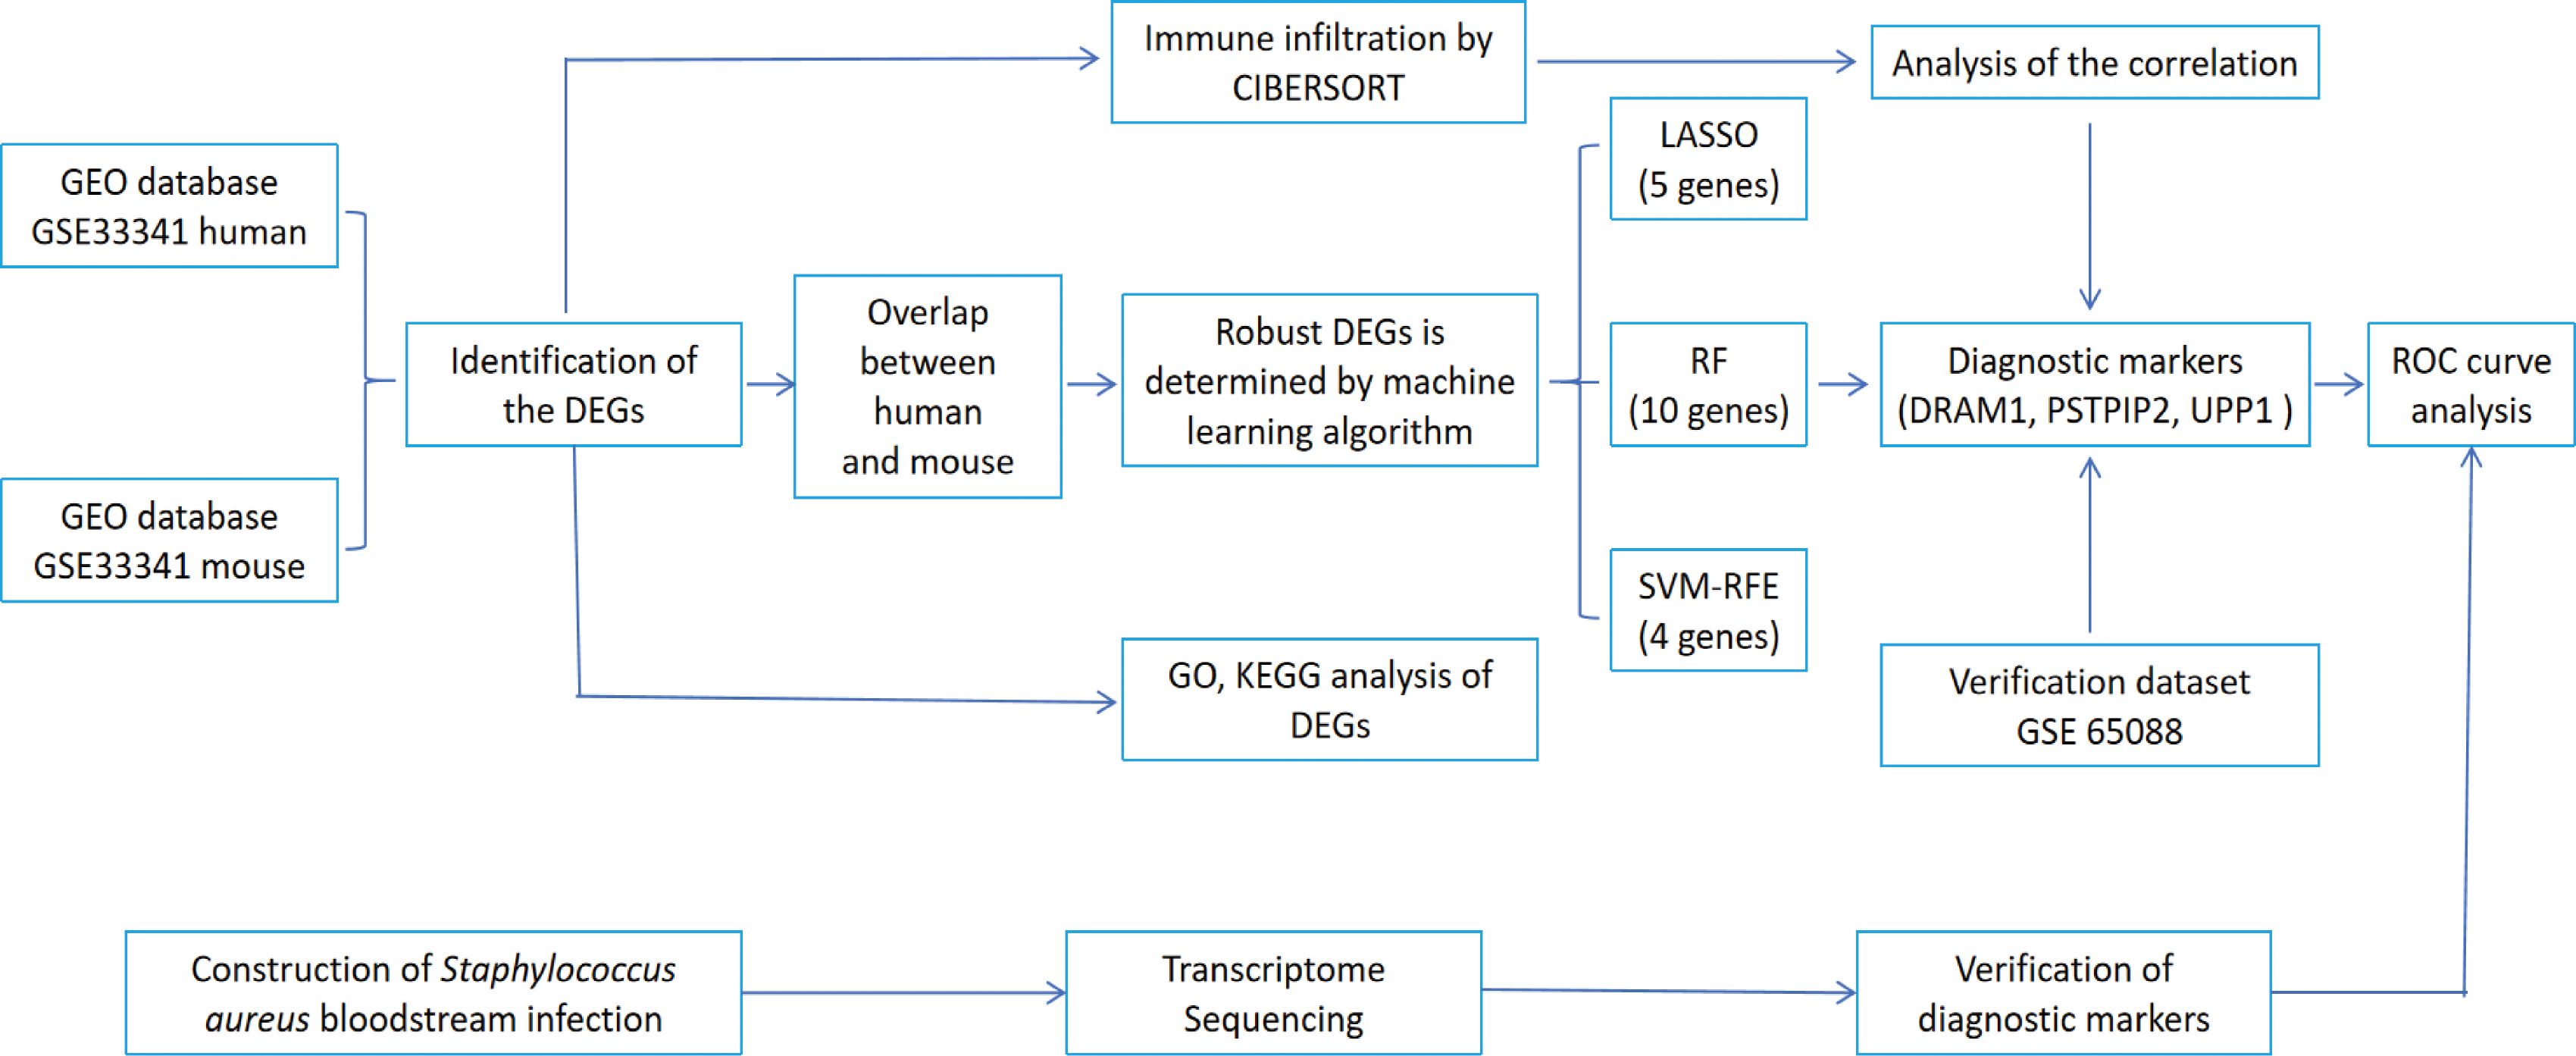
Figure 1. The flowchart depicting the investigation procedure. GEO, gene expression omnibus; GSEA, gene set enrichment analysis; CIBERSORT, cell-type identification by estimating relative subsets of RNA transcripts; DEGs, differentially expressed genes; GO, gene ontology; KEGG, Kyoto Encyclopedia of Genes and Genomes; LASSO, Least absolute shrinkage and selection operator; RF, random forest; SVM-RFE, support vector machine-recursive feature elimination; ROC, receiver operating characteristic curve.
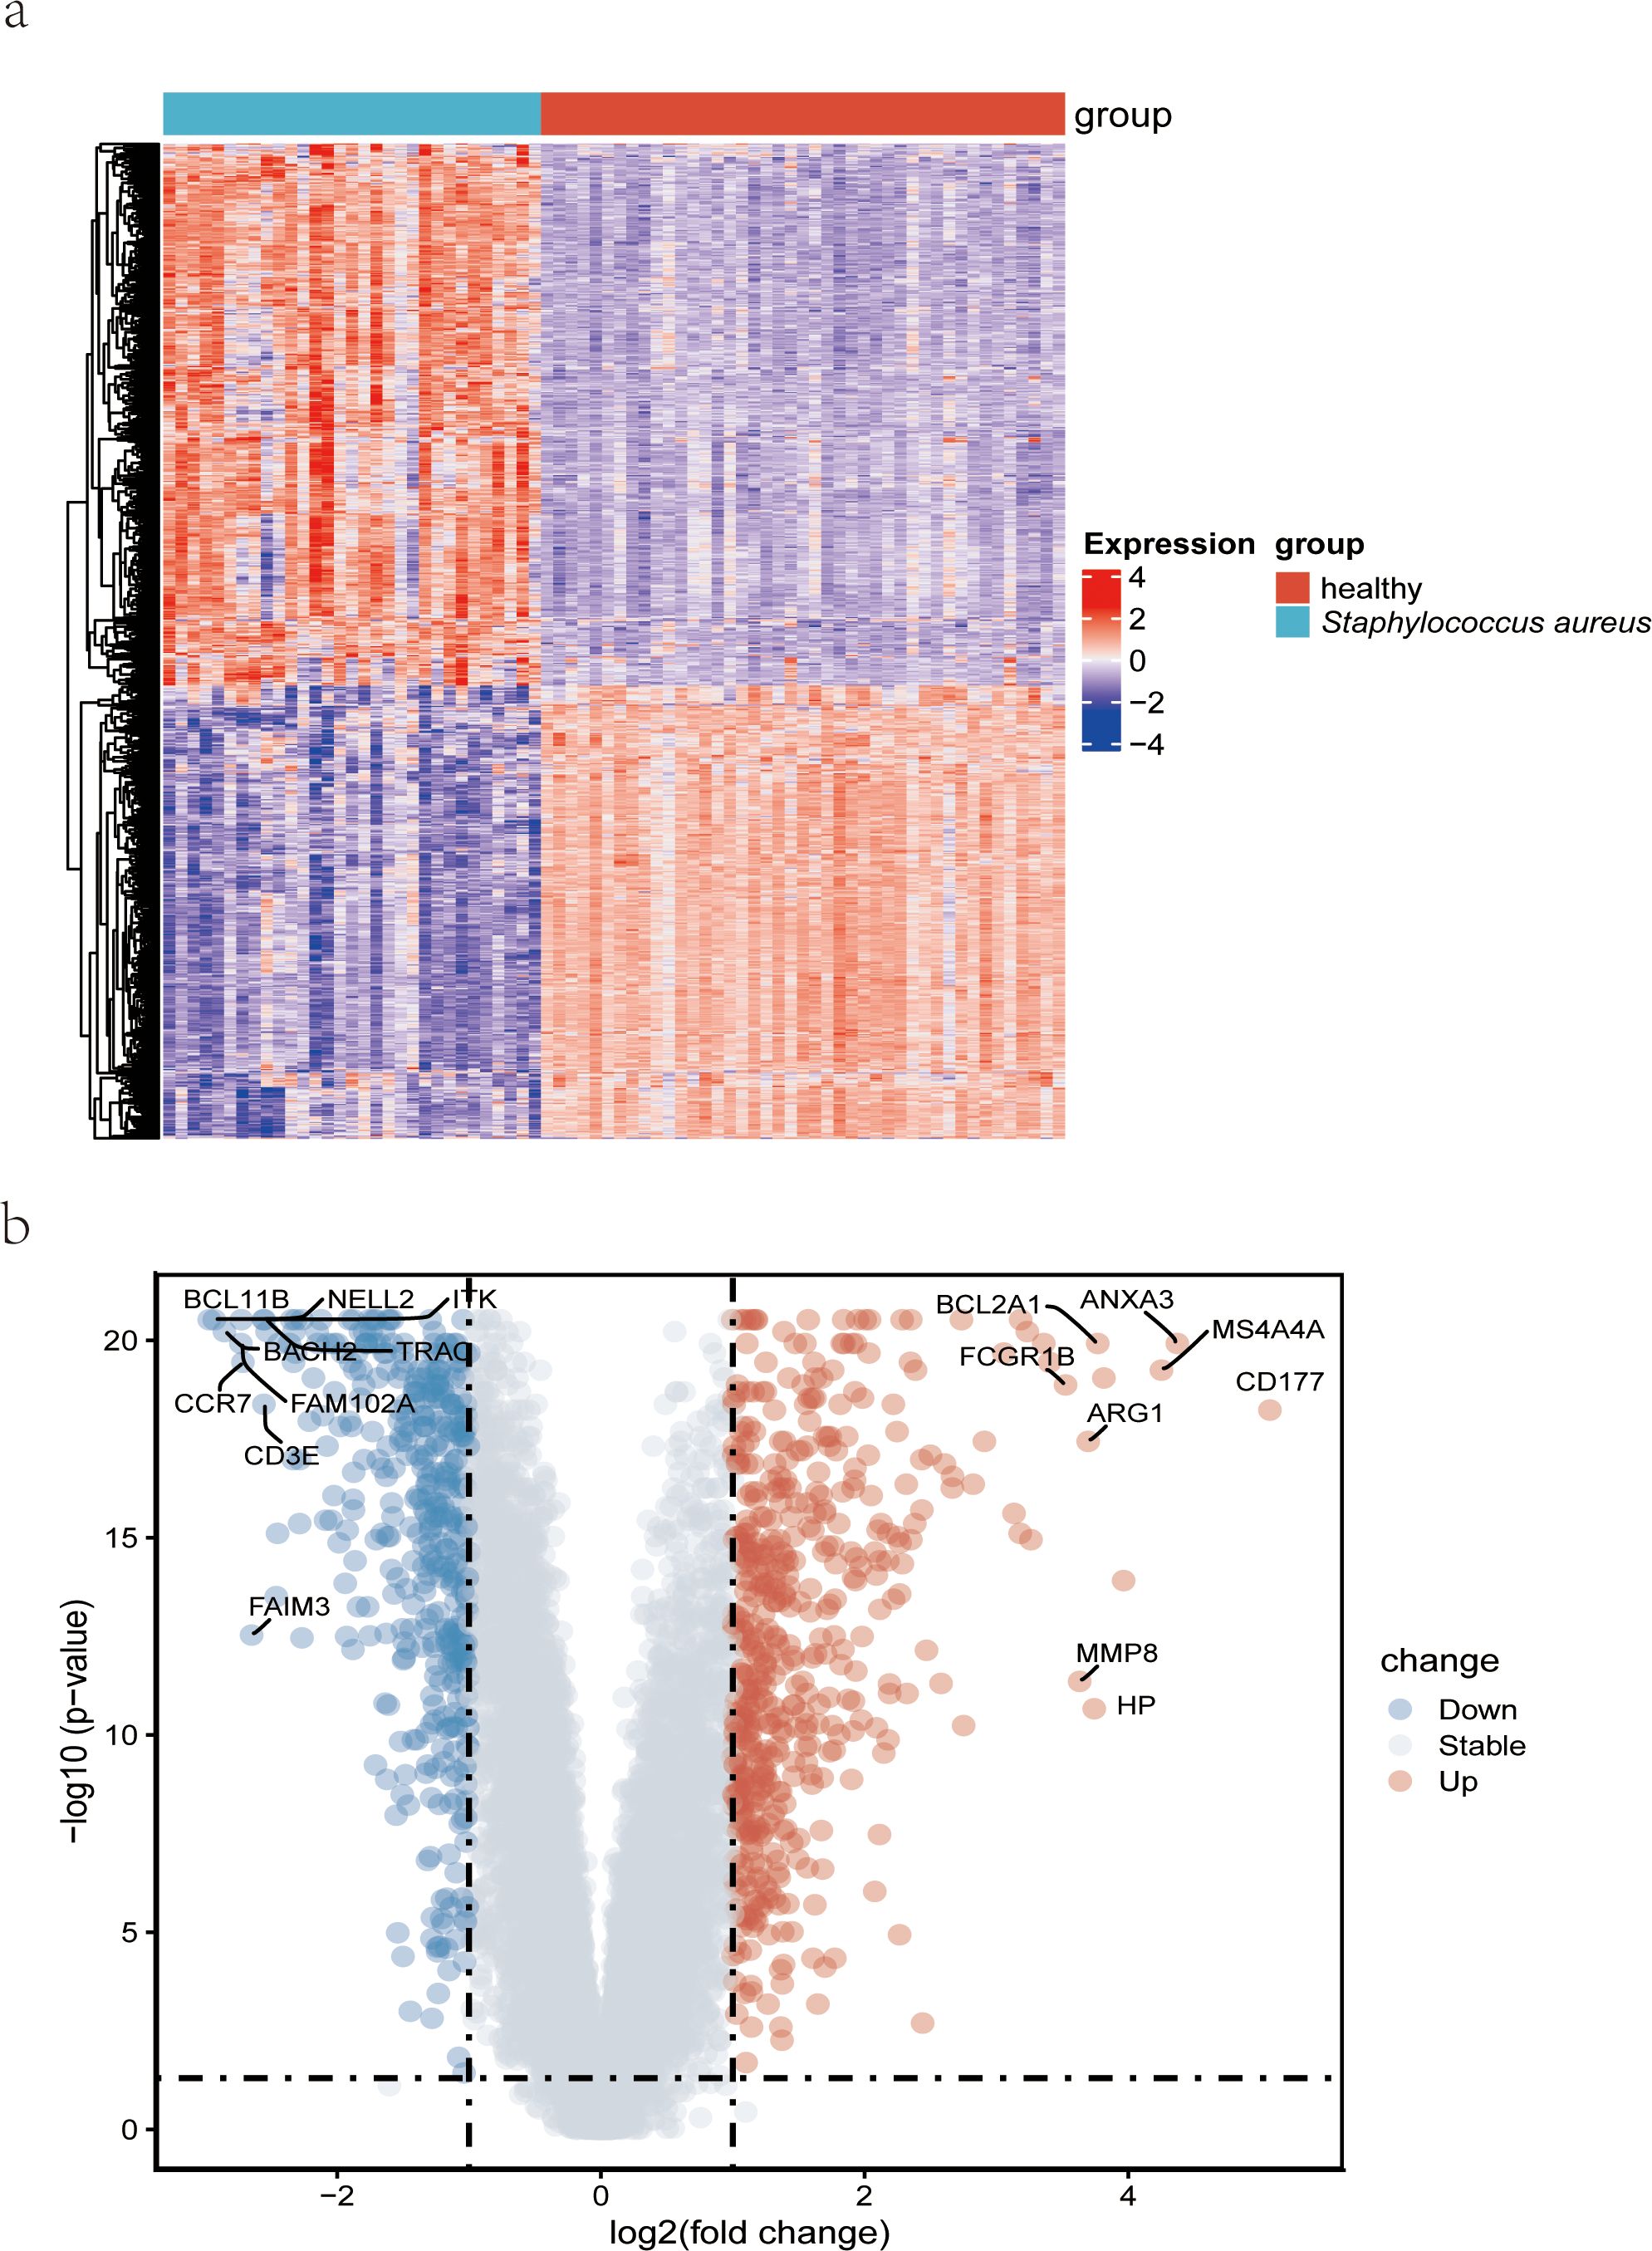
Figure 2. Detection of differentially expressed genes from datasets GSE33341 on S. aureus patients. (A) A heatmap comparing the genes that were differentially expressed in S. aureus bloodstream patients and control patients; (B) Volcano plot of the 482 DEGs. DEGs, differentially expressed genes; FC, fold-change.
Functional enrichment analysis of DEGs
Functional analysis was performed to gain a more thorough understanding of the biological functions of these DEGs. GO enrichment analysis showed that up-regulated DEGs were related to positive regulation of cytokine production and activation of the immune response (Figure 3A, left). Down-regulated DEGs were enriched in mononuclear cell differentiation, lymphocyte differentiation, and immune response-regulating signaling pathway (Figure 3A, right). Likewise, KEGG analysis for up-regulated DEGs was associated with Prion disease, Parkinson disease, and NOD-like receptor signaling pathway (Figure 3B, left). KEGG analysis for down-regulated DEGs was enriched in hematopoietic cell lineage, Th1 and Th2 cell differentiation, and Th17 cell differentiation (Figure 3B, right).
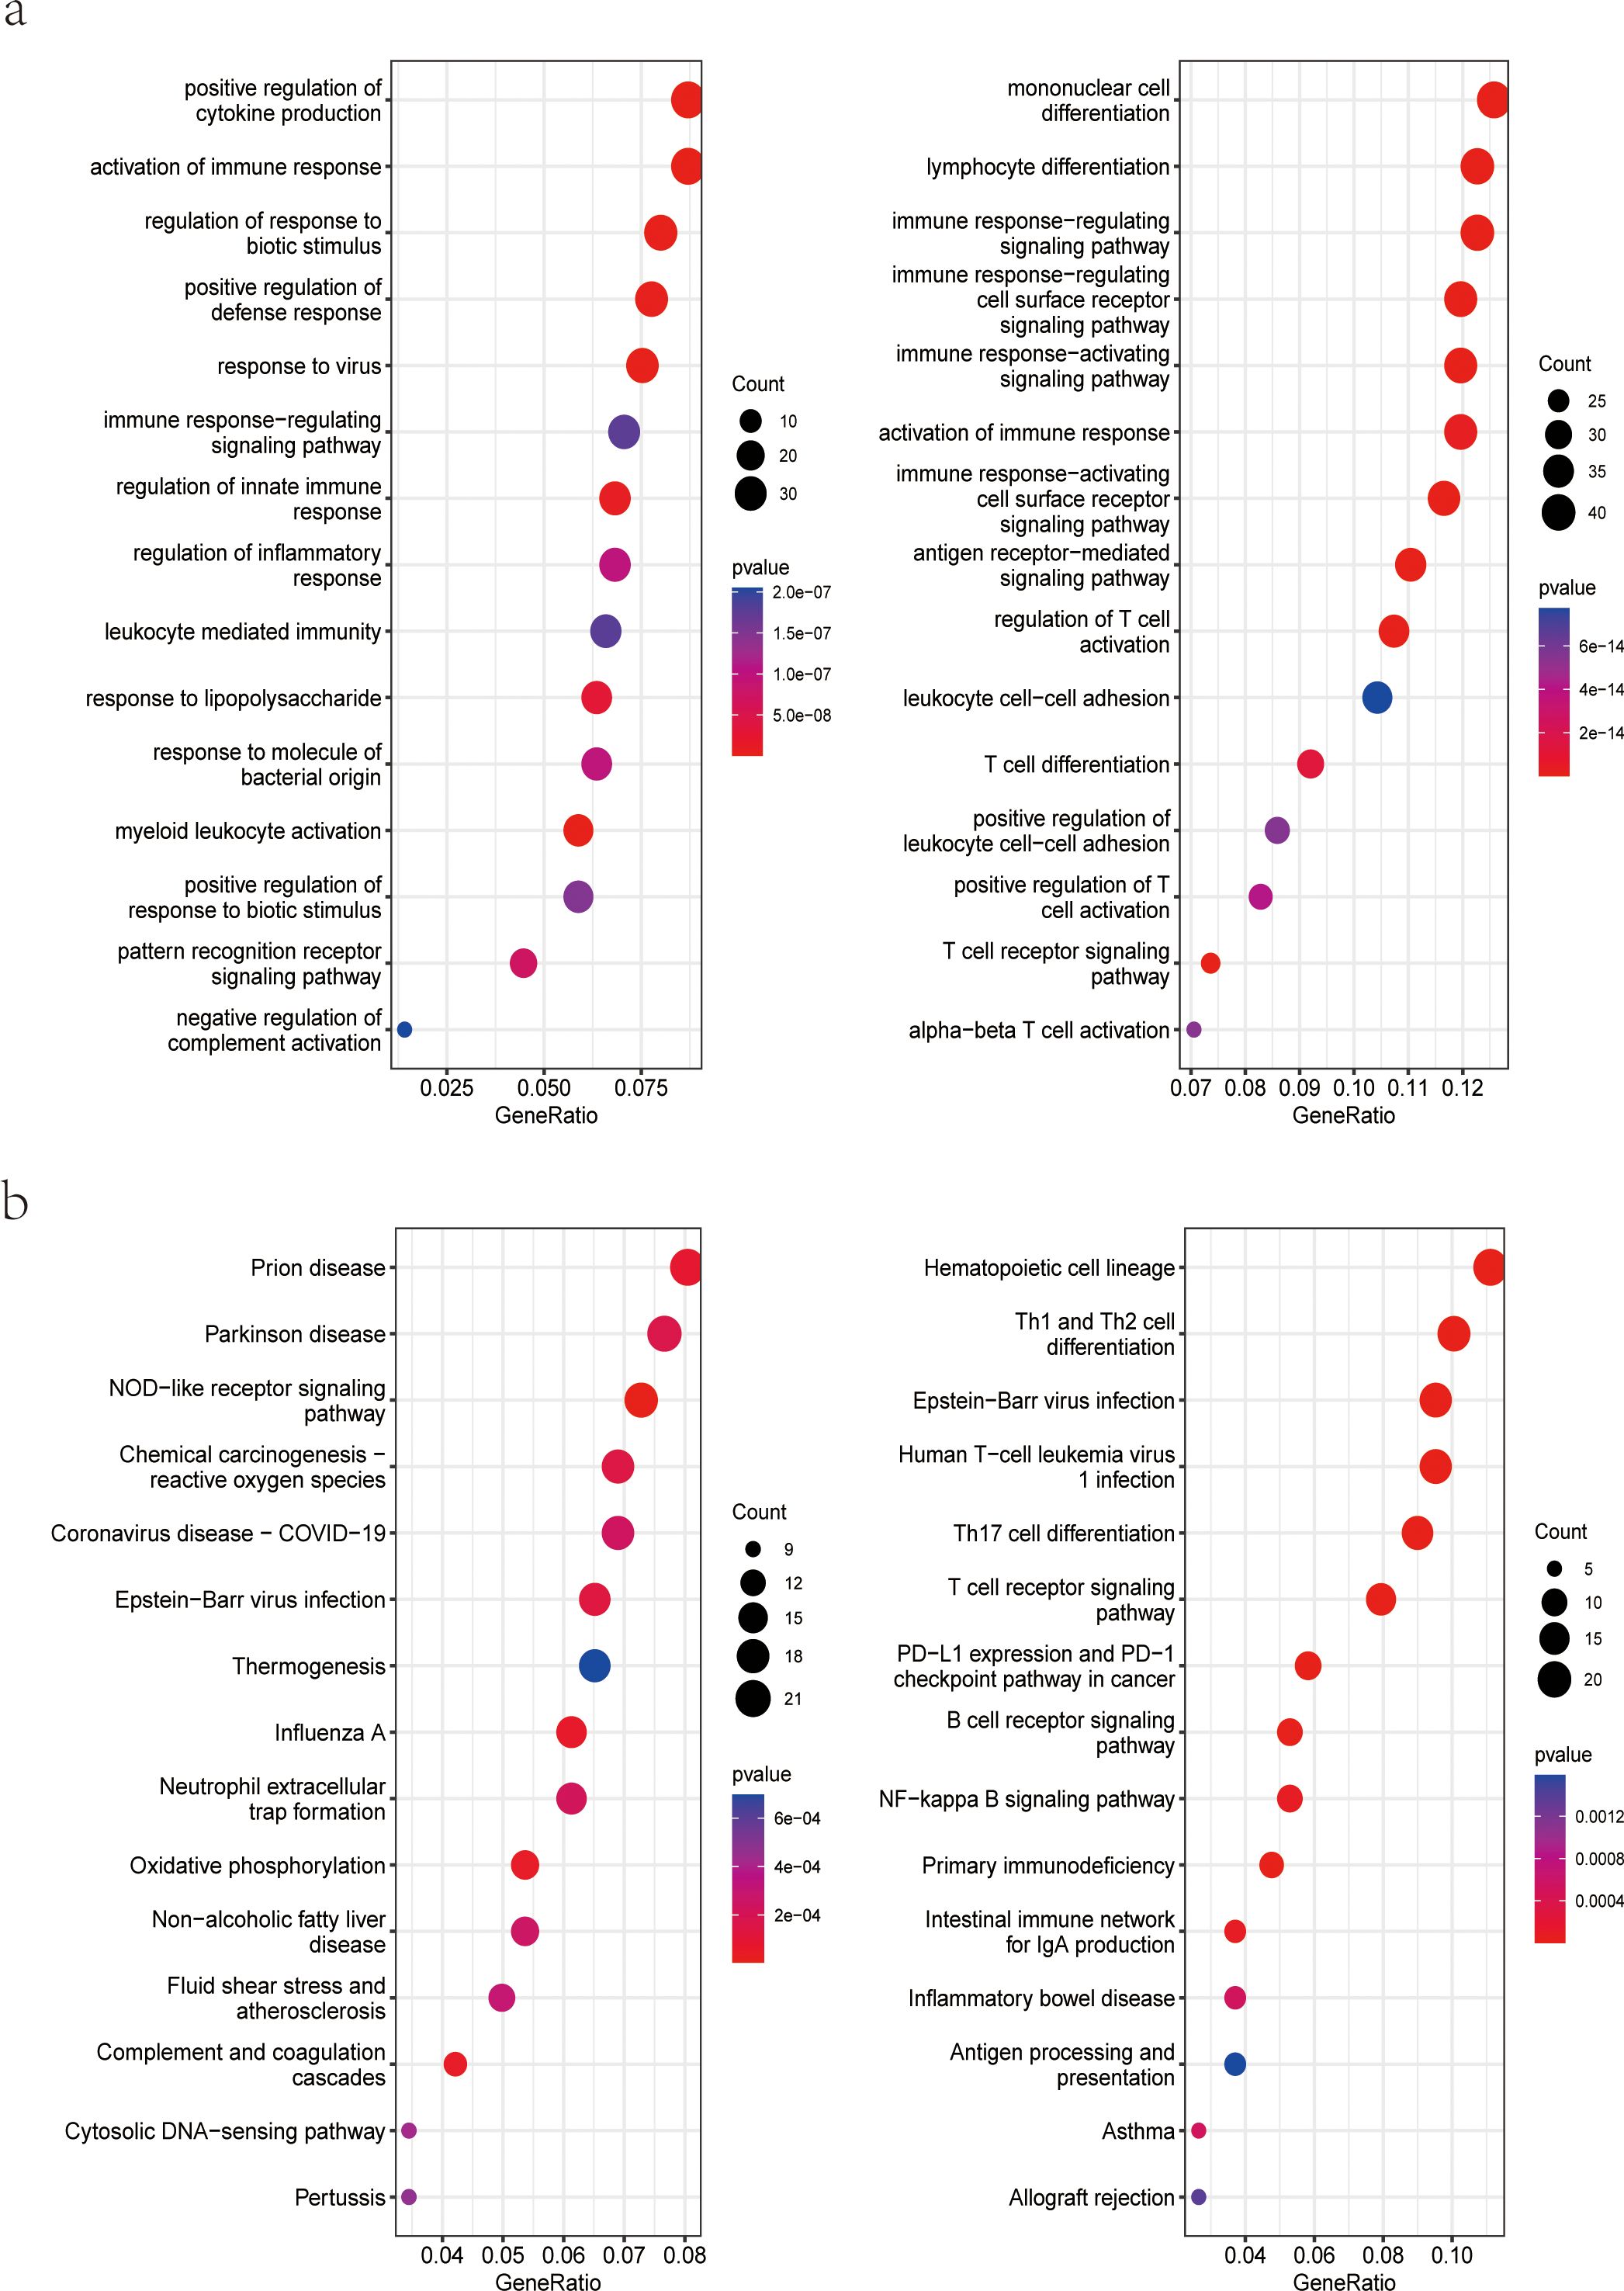
Figure 3. Functional enrichment analysis of DEGs. (A) GO enrichment analysis of upregulated (left) and downregulated (right) genes in the dataset GSE33341 human group; (B) KEGG pathway enrichment analysis of upregulated (left) and downregulated (right) genes in the dataset GSE33341 human group. GO, Gene Ontology; KEGG, Kyoto Encyclopedia of Genes and Genomes.
Screening and validation of diagnostic markers
The human blood samples in GSE33341, consisting of 31 S. aureus infection samples and 43 control samples, and the mice blood samples in GSE33341, including 10 S. aureus infection samples and 21 control samples, were exploited for analyzing the up-regulated genes separately. There were 482 up-regulated DEGs in the GSE33341-human samples and 305 up-regulated DEGs in the GSE33341-mice samples. A Venn plot was drawn to present the up-regulated genes intersected by GSE33341-human and GSE33341-mice samples (Figure 4A). Then we adopted three machine-learning algorithms to identify feature genes: Random Forest selected the top 10 genes (Figure 4B); SVM-RFE screened 4 genes (Figure 4C) and LASSO regression analysis was utilized to select 3 predicted genes from among the statistically significant univariate variables (Figure 4D). The three algorithms finally identified DRAM1, PSTPIP2, and UPP1 as the diagnostic markers (Figure 5A).
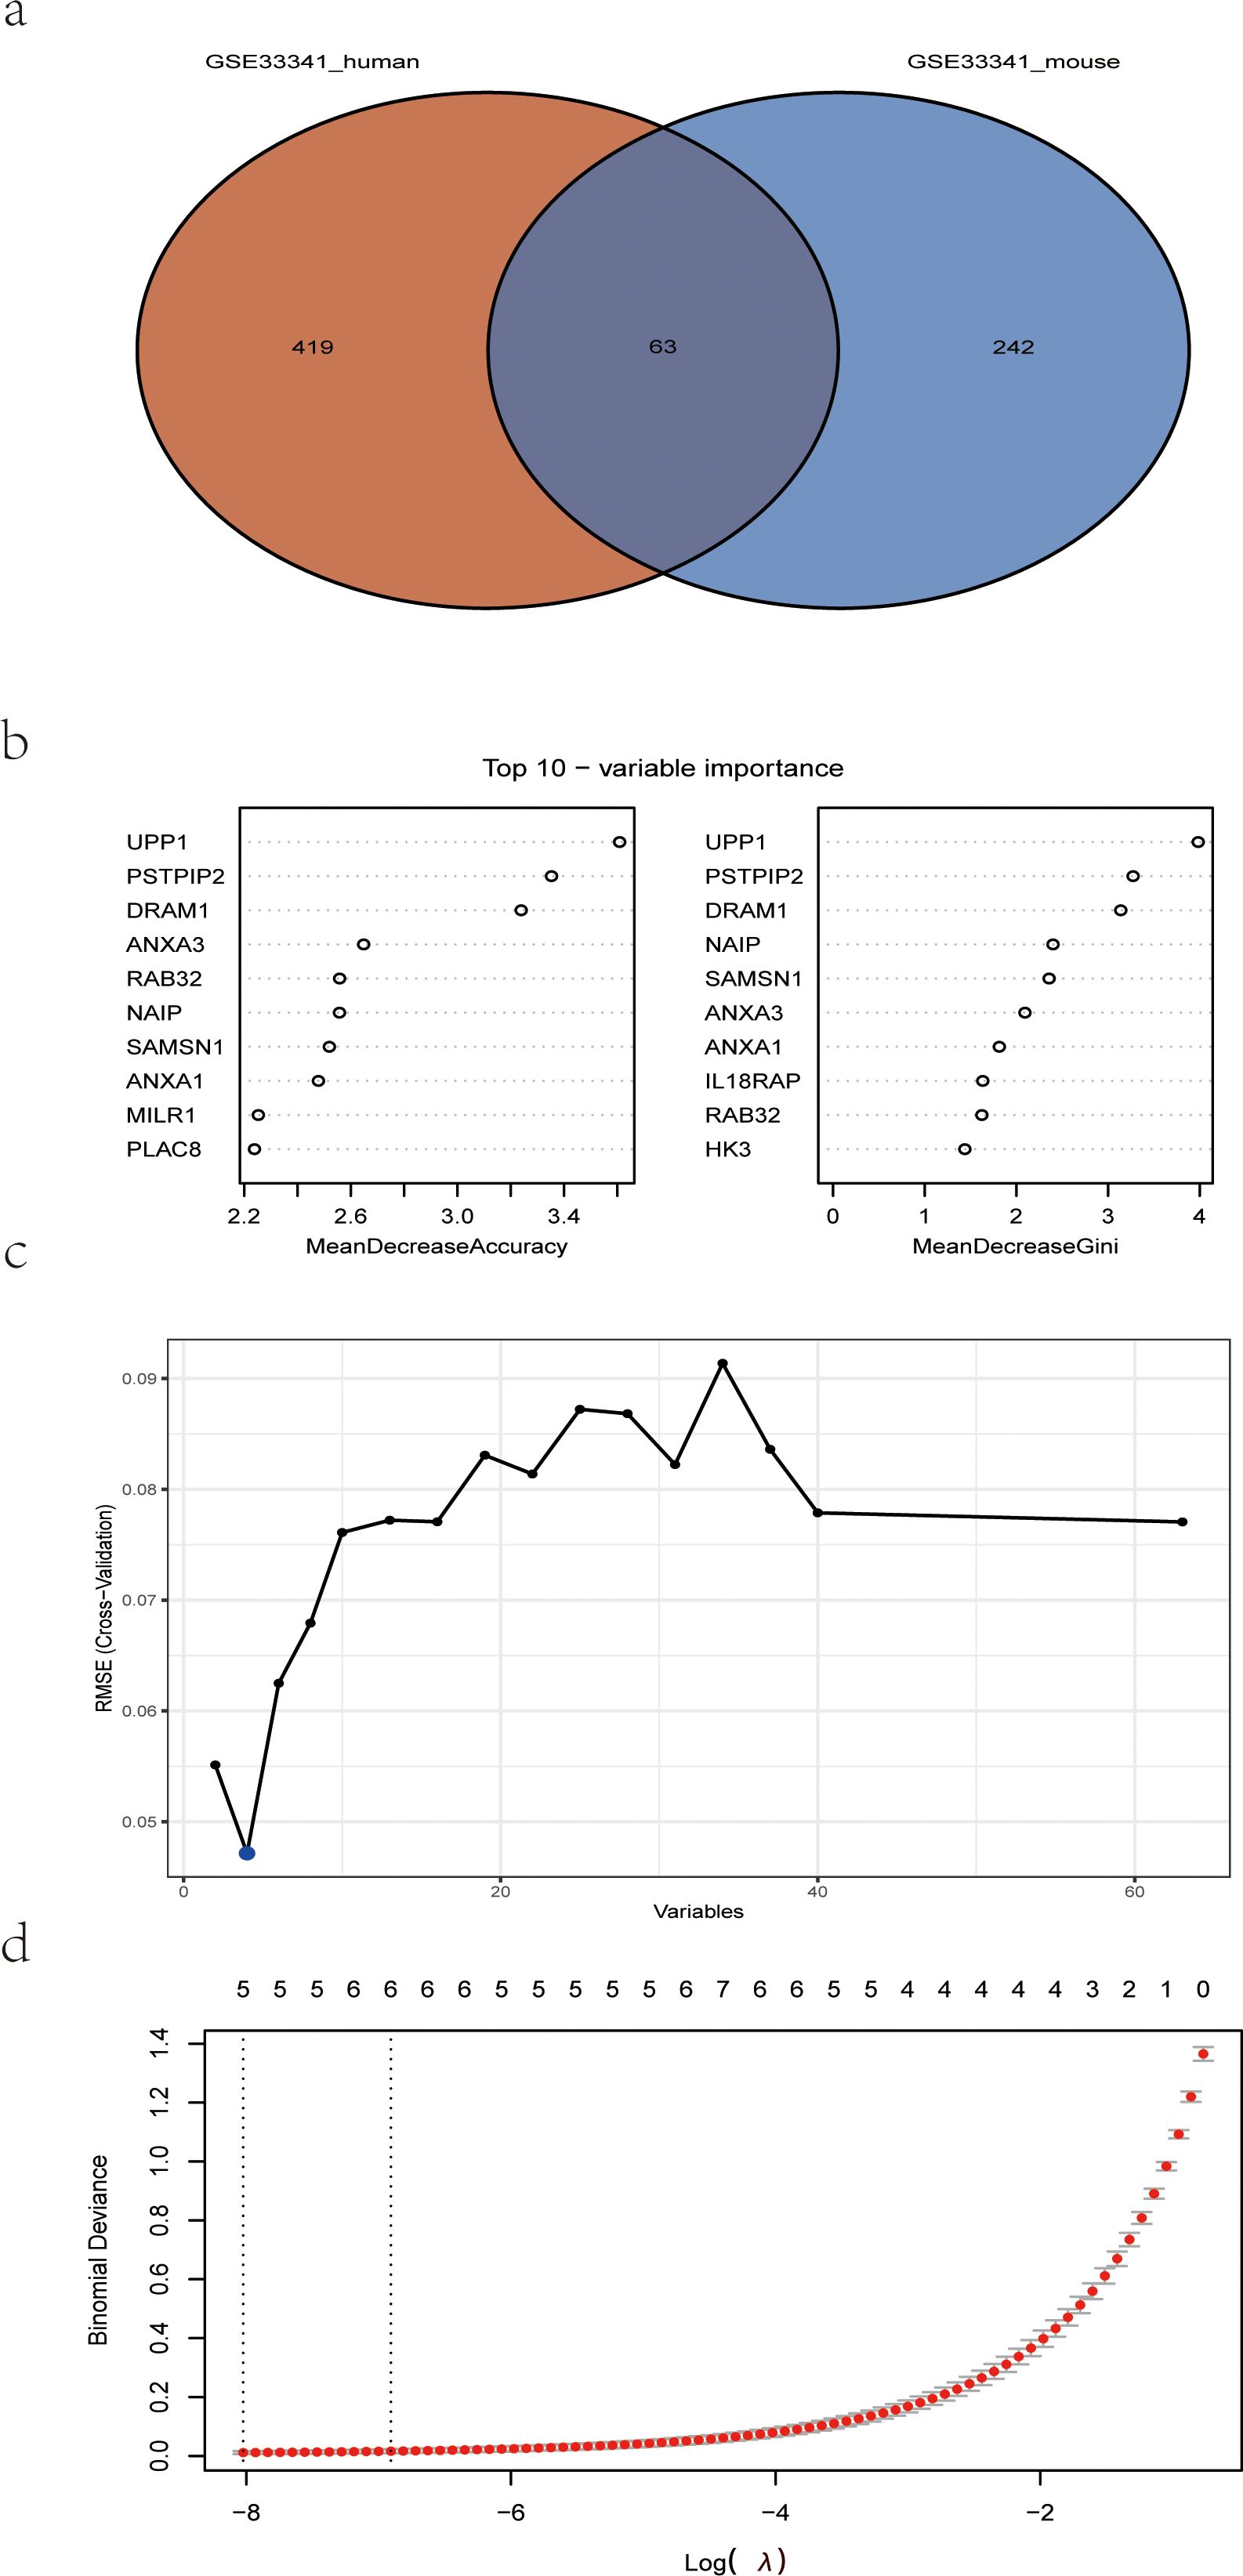
Figure 4. Detection of diagnostic markers using a thorough method. (A) Venn diagram of upregulated genes of human S. aureus infection versus mice group in GSE33341; (B) based on RF algorithm to screen biomarkers; (C) Based on SVM-RFE to screen biomarkers; (D) LASSO logistic regression algorithm to screen diagnostic markers. RF, random forest; SVM-RFE, support vector machine-recursive feature elimination; LASSO, least absolute shrinkage, and selection operator.
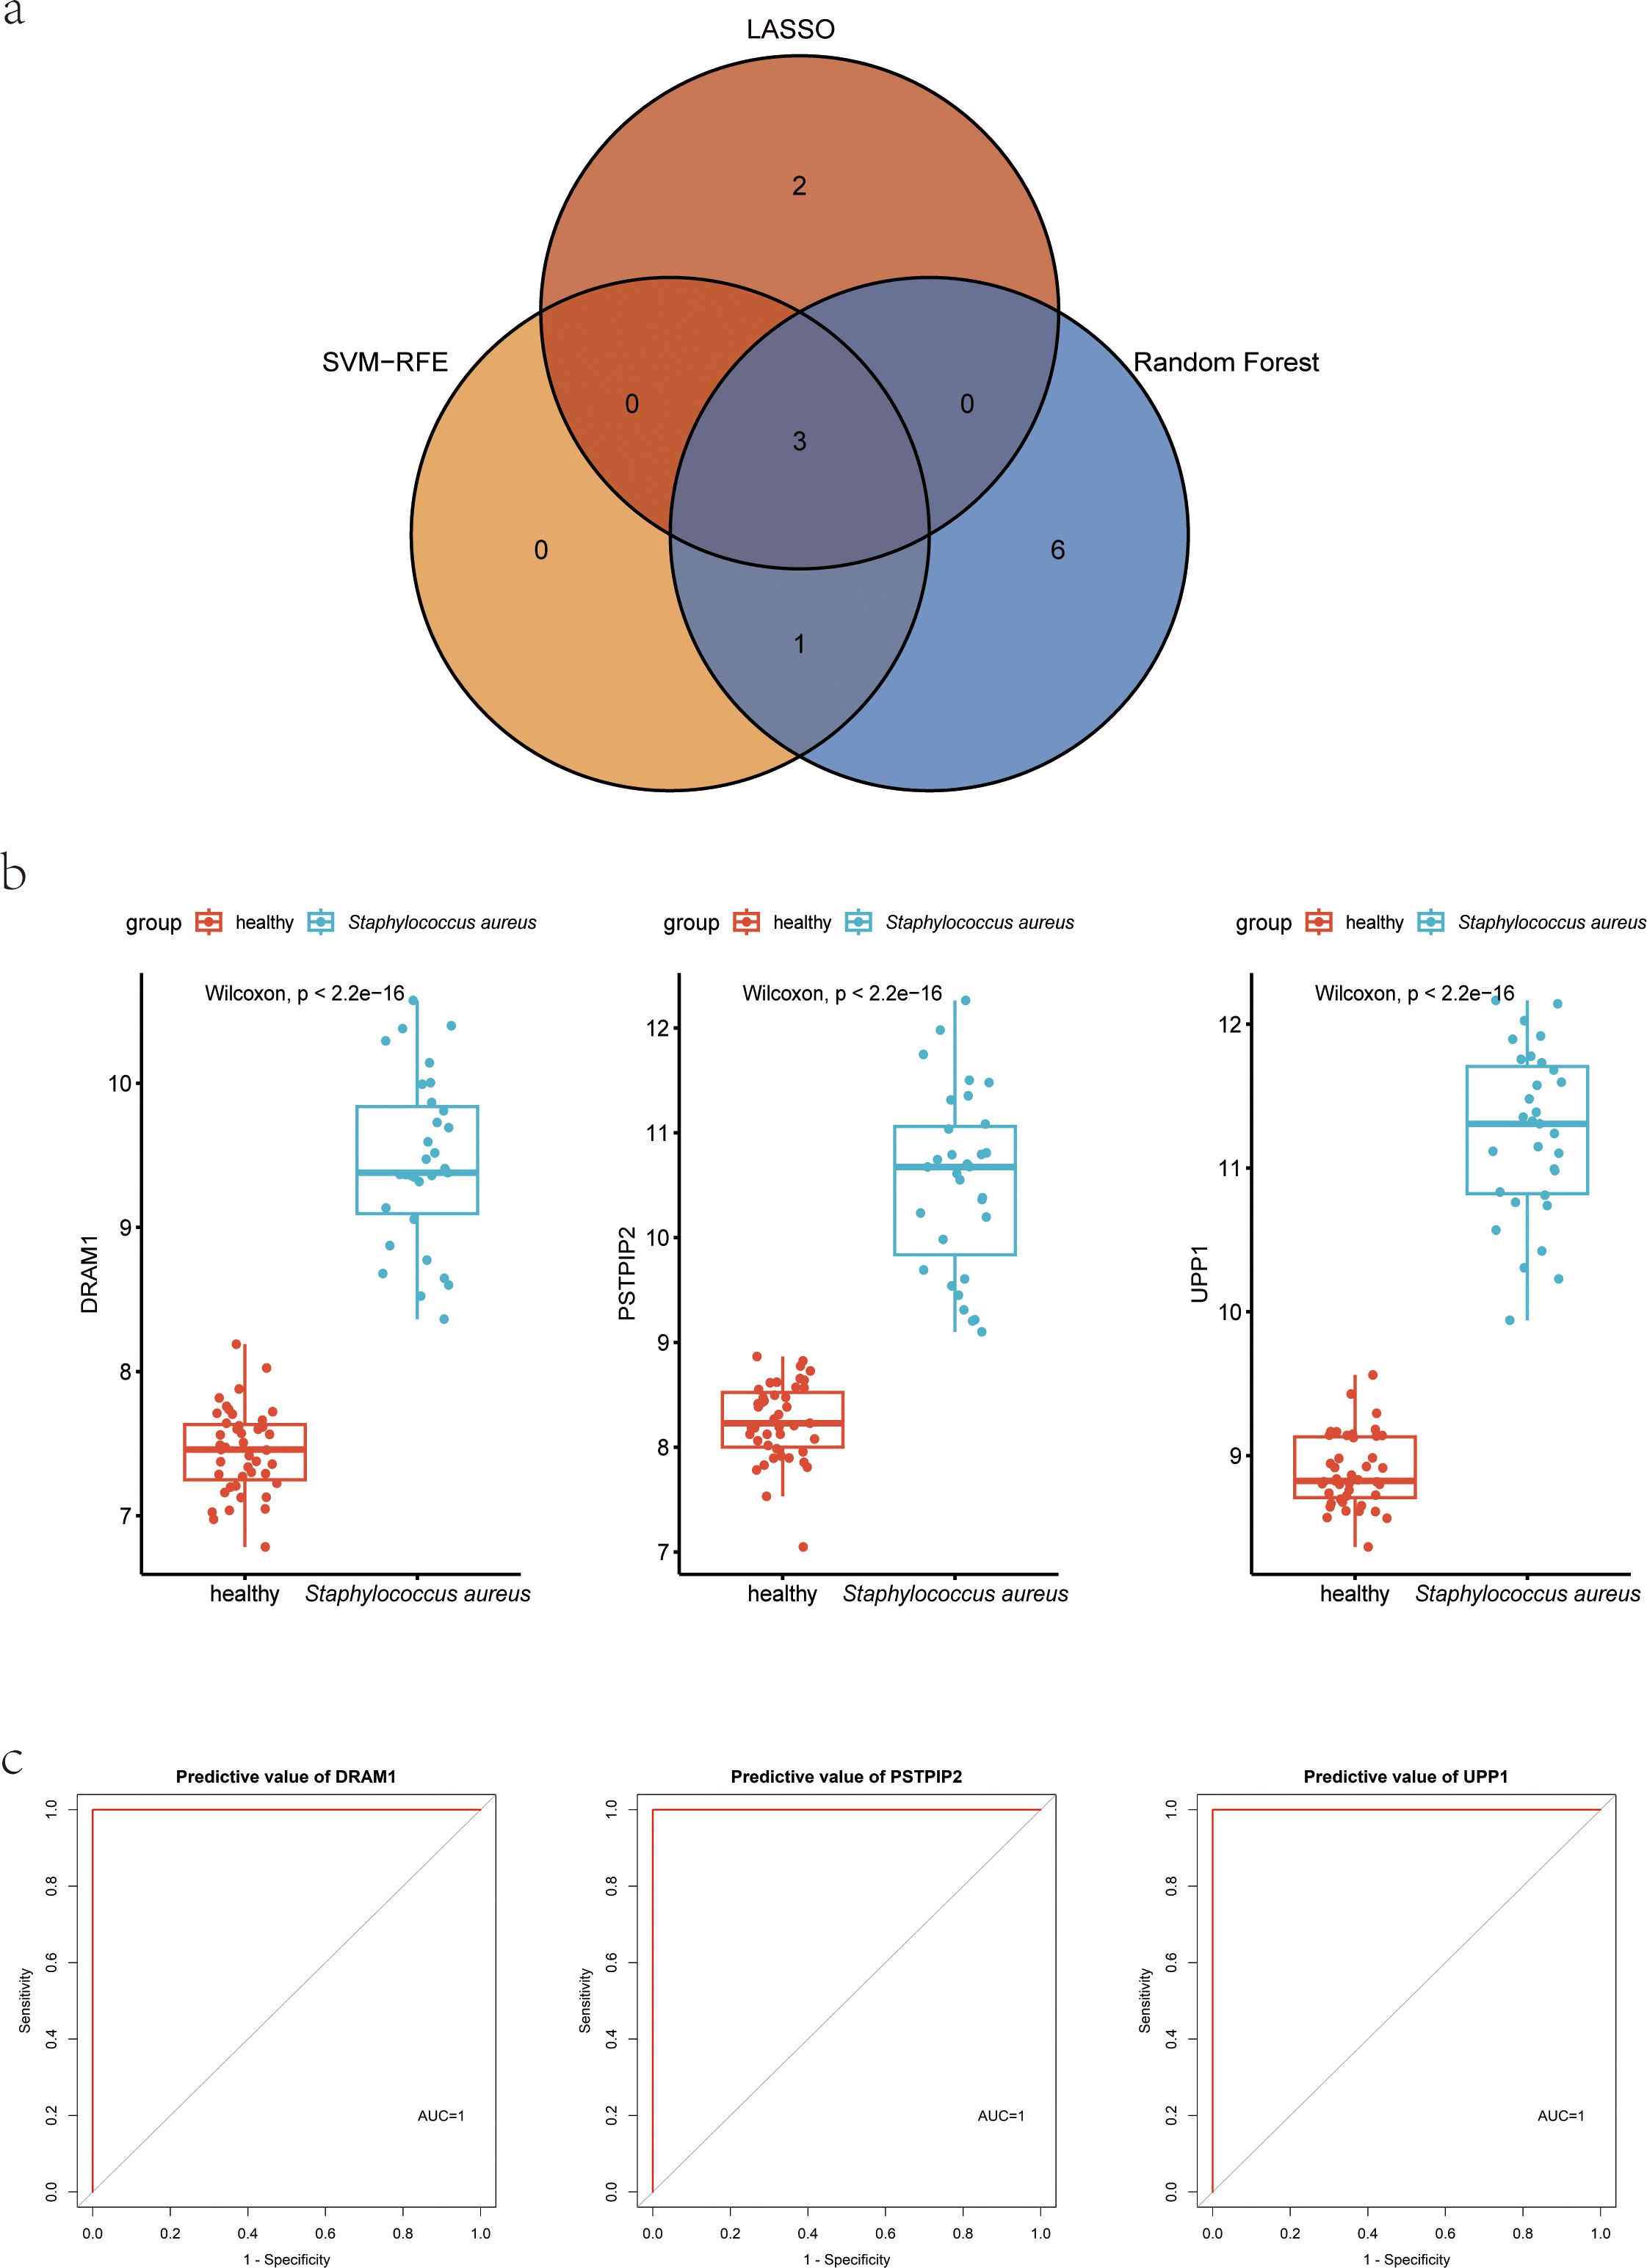
Figure 5. Hub genes for S. aureus blood infection diagnosis. (A) Venn diagram showed the intersection of diagnostic markers obtained by the three algorithms; (B) Boxplot showed the expression of hub genes between the S. aureus infection group and control group in discovery dataset GSE33341 human group; (C) The ROC curve of the diagnostic efficacy verification between the S. aureus infection group and control group in discovery dataset GSE33341 human group.
In the GSE33341, these three genes not only were highly expressed in the S. aureus infection group but also presented with good discriminative power between S. aureus and the control group (Figure 5B; Supplementary Figure 1). ROC curves for DRAM1, PSTPIP2, and UPP1 also highlighted them as potential diagnostic biomarkers (Figure 5C).
Meanwhile, we also acquired another independent cohort with S. aureus infection to validate the above findings. In GSE65088, the significantly high expression for DRAM1, PSTPIP2, and UPP1 in S. aureus group was also observed (Supplementary Figure 2A), along with high AUC values (Supplementary Figure 2B), which indicates that the biological markers had high predictive value accuracy.
Association of biomarkers with immune cells abundance
CIBERSORT algorithm was utilized to evaluate the immune cell abundance. Based on a correlation analysis, we assessed the relationship between immune cells and three diagnostic biomarkers. We found DRAM1 was significantly positively associated with B cell naive and Mast cell activated. However, the expression of DRAM1 was negatively associated with NK cells and CD4/CD8+ T cells (Figure 6A). Meanwhile, PSTPIP2 was notably positively correlated with Macrophages M0, Macrophages M1, B cell naive, and Dendritic cells activated, the expression of PSTPIP2 was negatively associated with NK cells and CD4/CD8+ T cells (Figure 6B). Furthermore, UPP1 was remarkably negatively related to T cells CD4 memory resting and Neutrophils (Figure 6C). The above results of analysis suggested there was a potential connection between these three biomarkers and a wide variety of immune cells. Immunological prophylaxis and therapy for S. aureus are attractive goals. Our findings provided reasonable application of these markers for screening potential patients with S. aureus bloodstream infection for immunotherapy.
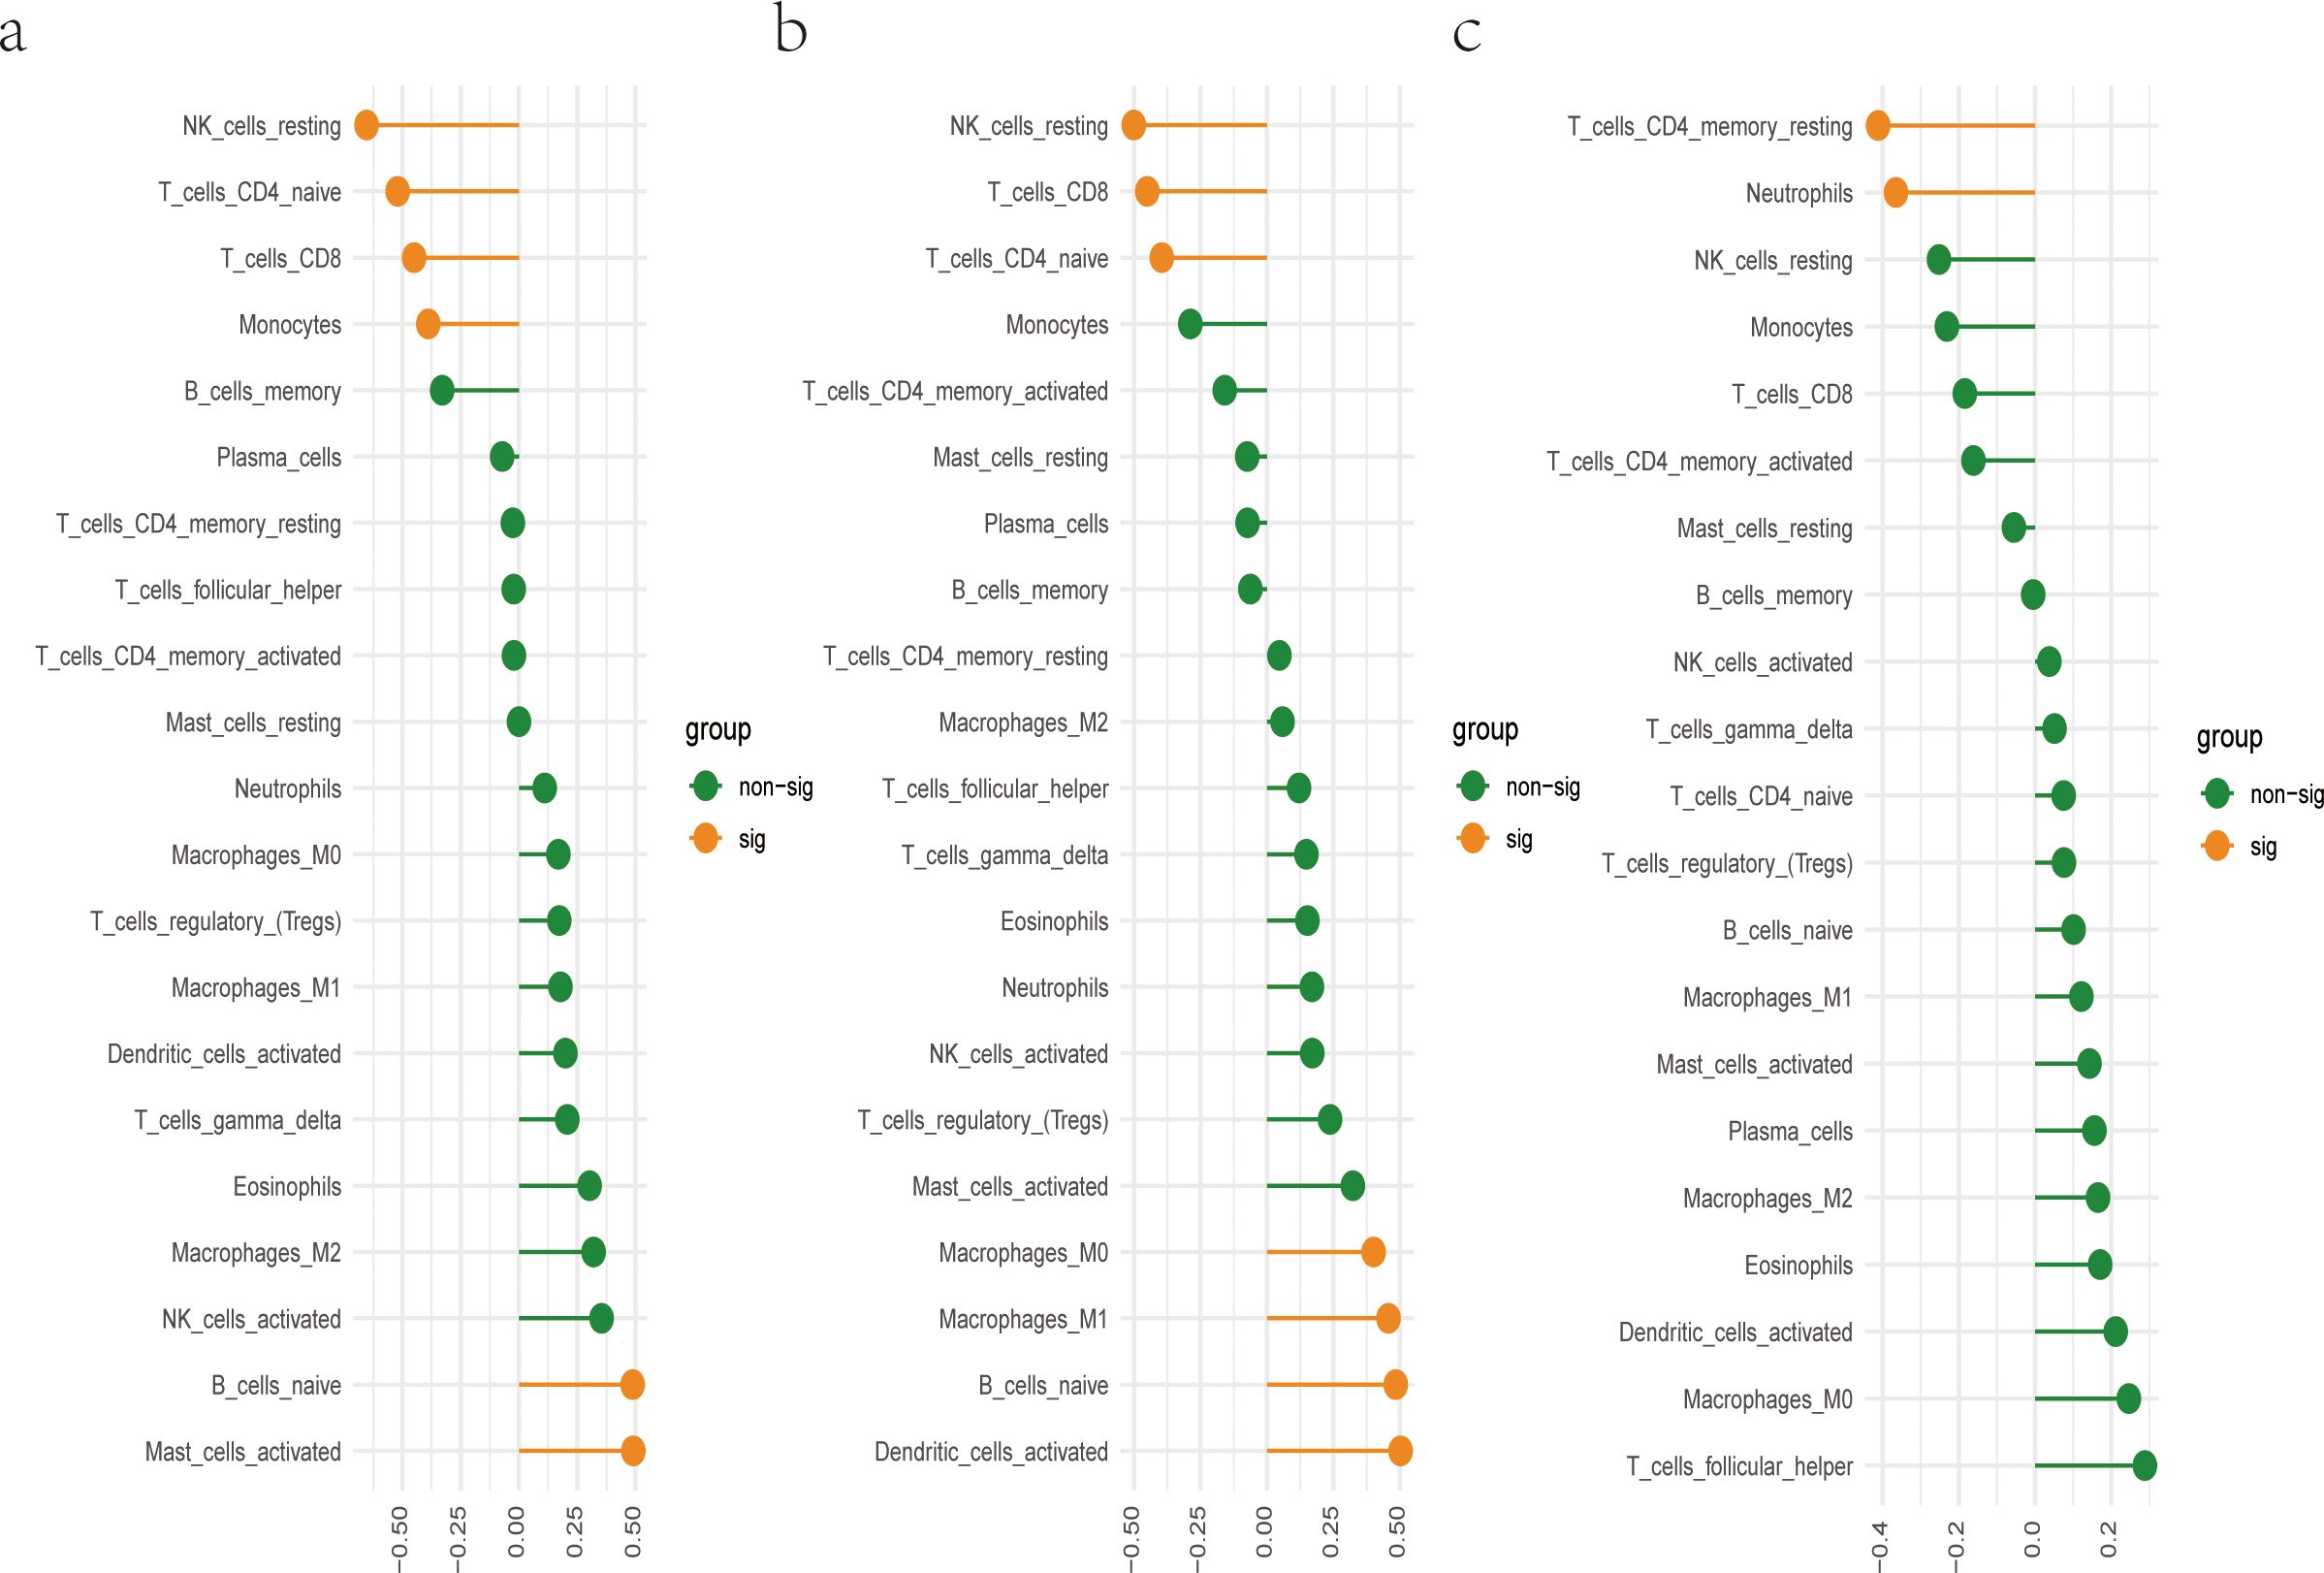
Figure 6. There is a correlation between hub genes and immune cells. (A) Correlation between DRAM1 and immune cells; (B) Correlation between PSTPIP2 and immune cells; (C) Correlation between UPP1 and immune cells.
Validation of diagnostic markers using RNA-Seq and RT-qPCR for S. aureus bloodstream infection mice models
To further confirm the diagnostic value of these three genes, we constructed a mice model of S. aureus bloodstream infection and collected the blood of mice for RNA-Seq analysis and RT-qPCR experiments. The reason we chose the S. aureus Newman strain was that it is a hypervirulent stain that has been widely applied in the various models of S. aureus. We isolated the total RNA of the blood and synthesized the cDNA. RNA-Seq analysis results confirmed the above results (Figure 7A), with ROC results showing the high diagnostic value for these three genes (Figure 7B). RT-qPCR results further validated that the RNA expression levels of DRAM1, PSTPIP2, and UPP1 genes were significantly increased in the S. aureus Newman tread group compared to the control group (Figure 7C). Meanwhile, these three genes were significantly higher in S. aureus group in the combined mouse dataset including GSE33341 mice and blood infection mouse model sequencing data (Figure 7D).
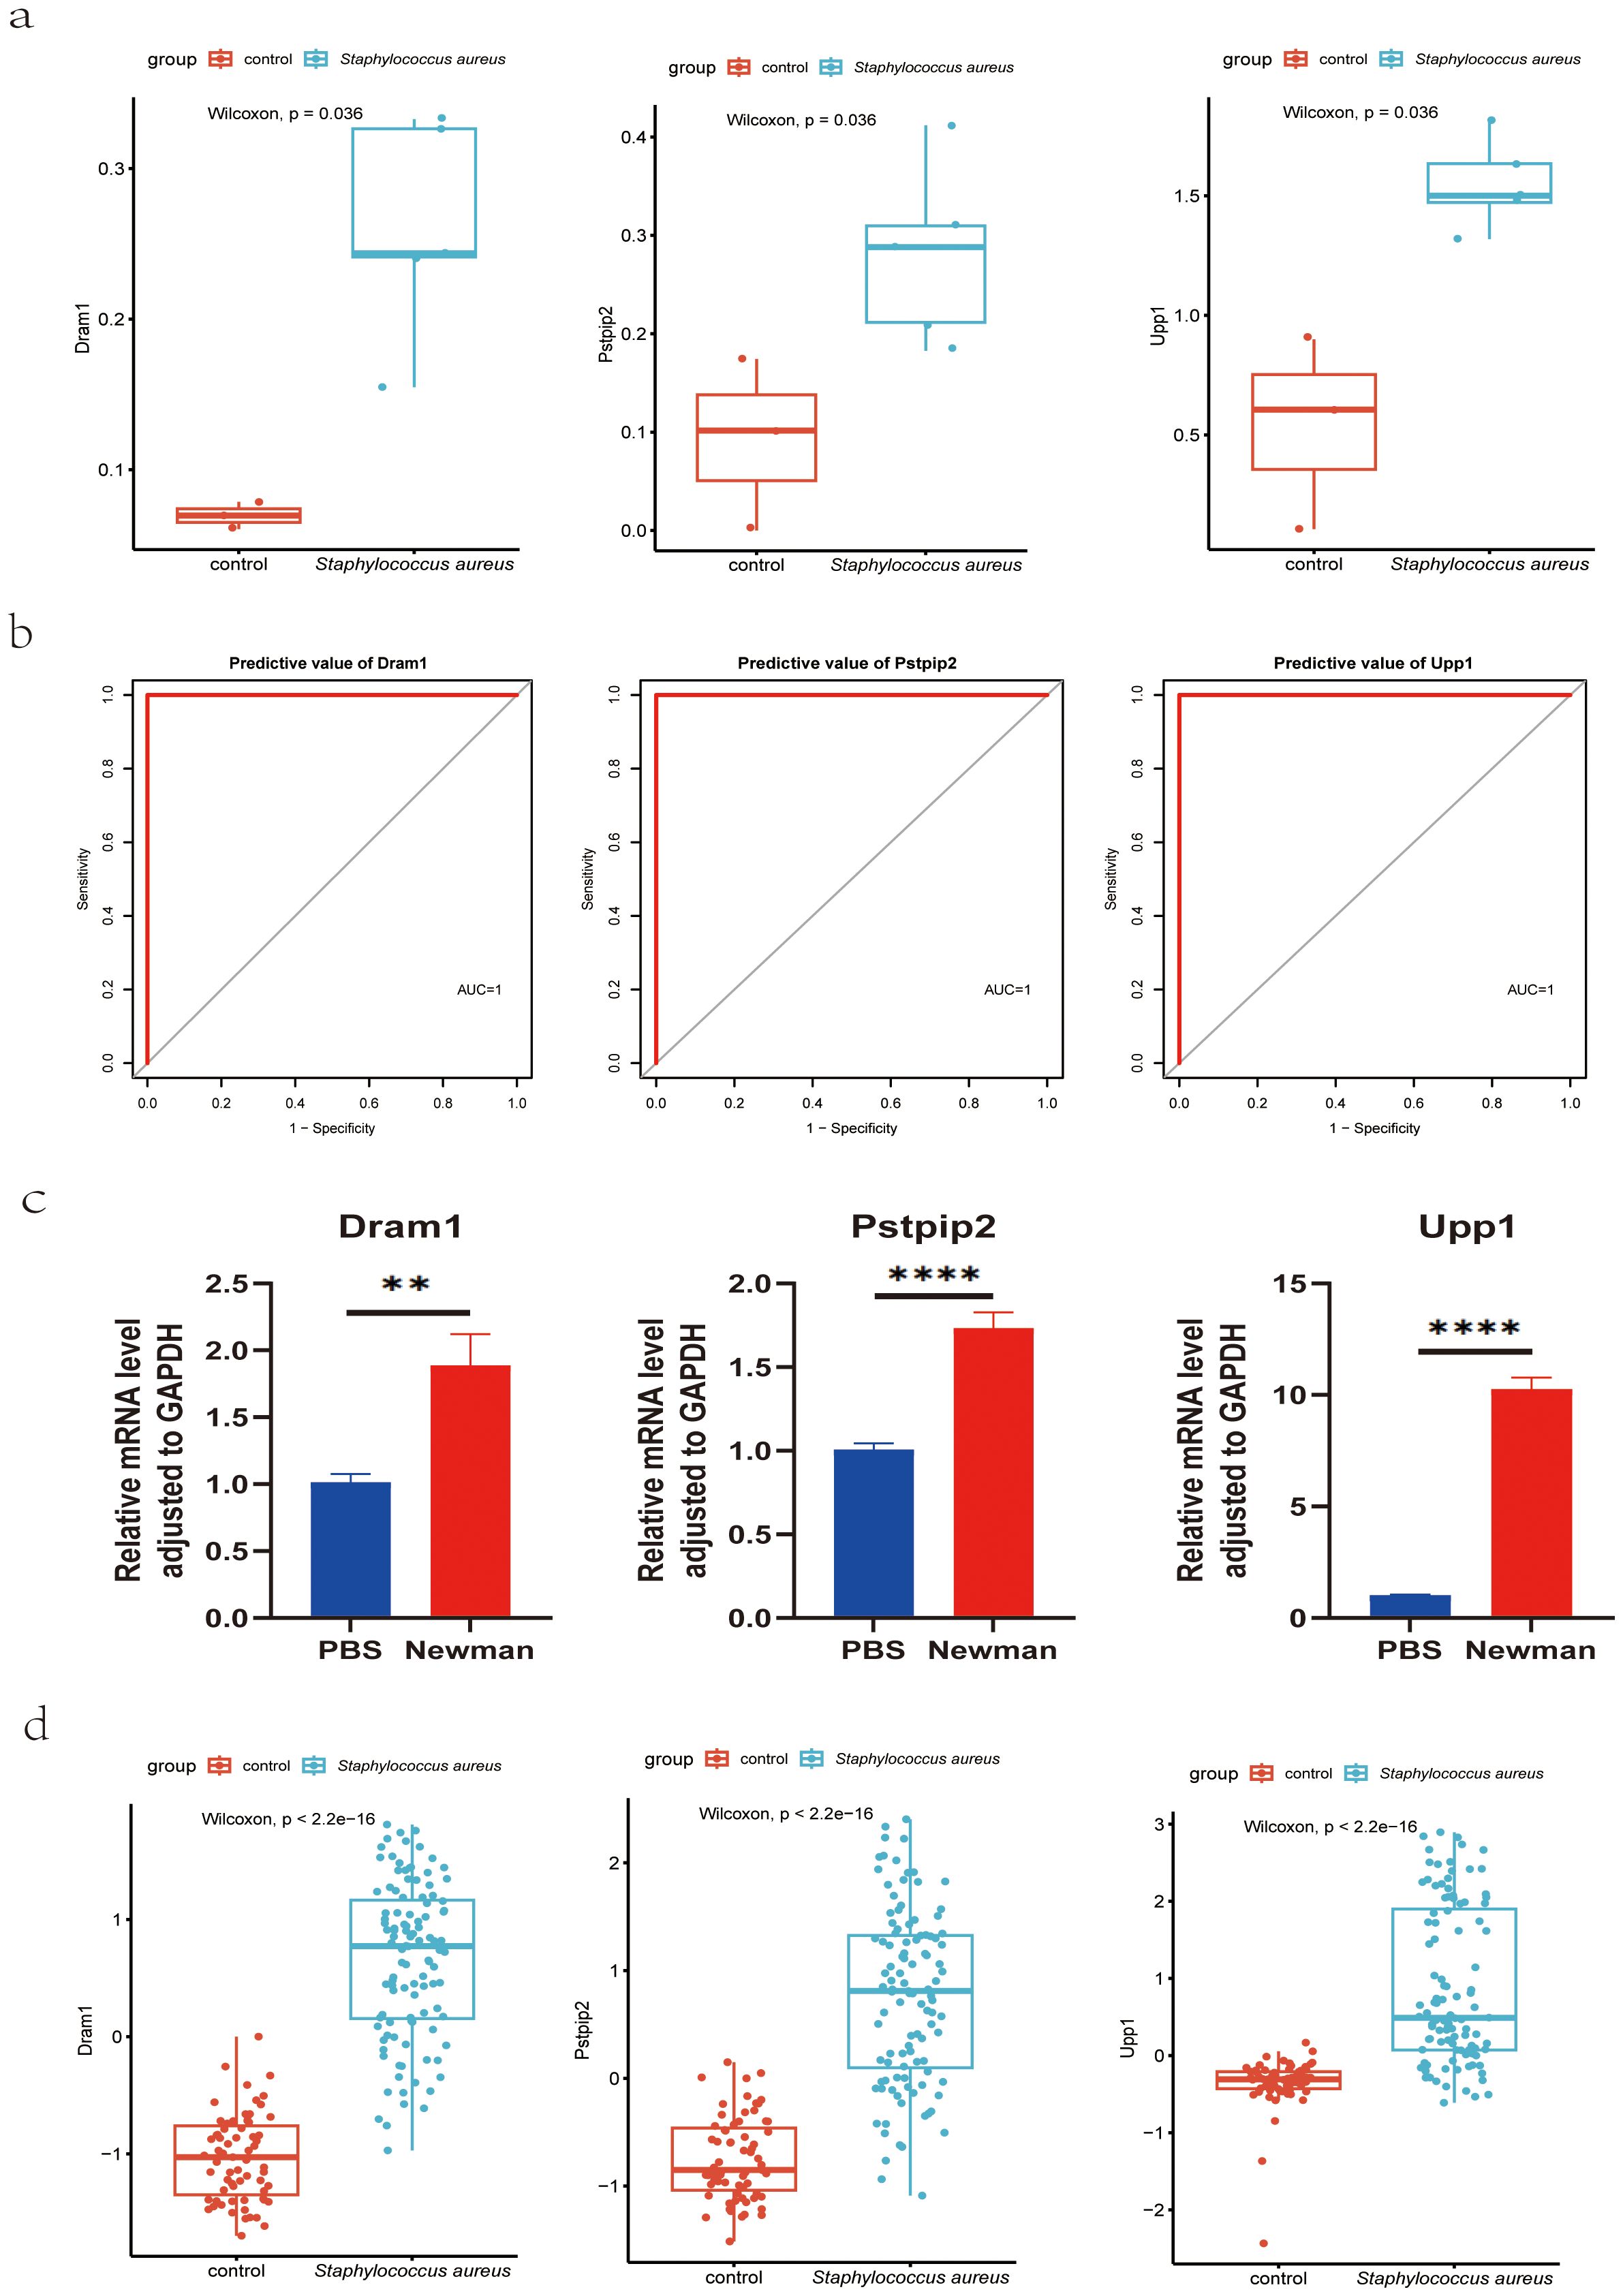
Figure 7. Validation of hub genes for S. aureus blood infection diagnosis. (A) Validation of diagnostic markers using RNA-Seq; (B) The ROC curve of the diagnostic efficacy verification in RNA-Seq analysis; (C) Validation of diagnostic markers using RT-qPCR; **P < 0.01 and ****P < 0.0001. d Validation of diagnostic markers via the combined mouse sequencing data including GSE33341 mice and blood infection mouse model sequencing data. AUC, area under the curve; ROC, receiver operating characteristic curve.
Discussion
The opportunistic pathogen S. aureus adapted to human hosts, could result in fatal bloodstream infection (25). It represented a heterogeneous clinical entity with a high risk of metastatic complications and a high in-hospital mortality rate of 20% to 30%. Optimized diagnostic and therapeutic approaches can improve patients’ outcomes (26). The Agr quorum-sensing system, one of the earliest regulators discovered to be involved in S. aureus bloodstream infections, is essential for the secretion of numerous toxins and other soluble virulence factors (27). Another virulence regulatory system closely related to S. aureus bloodstream infections is the two-component ArlRS system, and its downstream effector, the global regulator MgrA (27). Under the background of S. aureus bloodstream infections, this cascade reaction was shown to regulate plasma aggregation, adhesion, and interactions with endothelium (28, 29). Furthermore, the ArlRS-MgrA cascade regulates the expression of several immune evasion genes to evade host defense (30–32). These findings underscore S. aureus’s ability to cause bloodstream infection by expressing a series of virulence genes, emphasizing the urgency of finding biomarkers for bloodstream infection of S. aureus for early diagnosis and treatment.
In recent years, extensive studies have attempted to discover diagnostic biomarkers for S. aureus bloodstream infections. Erin et al. found that S. aureus induced a muted host response in human blood that blunts the recruitment of neutrophils to promote the survival of pathogens during invasive infection (33). Sun et al. constructed a predictive model for sepsis in children with S. aureus bloodstream infections, which could guide clinicians in optimizing the treatment plan according to these risk factors and drug sensitivity results for minimizing unnecessary invasive procedures (34). Rachel et al. found that manipulation of autophagy in phagocytes facilitated S. aureus bloodstream infection (35). Sinead et al. carried out a prospective study in 61 patients with S. aureus bloodstream infection and revealed that IL-6 might be an early inflammatory marker of complicated S. aureus bloodstream infection (36). However, these diagnostic biomarkers more or less suffer from some limitations. Identifying new diagnostic markers for S. aureus bloodstream infection was urgently needed.
In this study, we attempted to identify new diagnostic biomarkers for S. aureus bloodstream infection. First, we identified the up-regulated genes in the S. aureus infection group common to the GSE33341-human and GSE33341-mouse datasets. Subsequently, the hub genes including DRAM1, UPP1, and PSTPIP2 were certificated by the use of three machine-learning algorithms. Further, we verified the findings by another dataset GSE65088, and developed a mice model of S. aureus bloodstream infection to collect the blood of mice for RNA-Seq analysis and RT-qPCR experiments. The receiver operating characteristic curve was employed to verify the efficacy of the hub genes. To summarize, our results suggest that DRAM1, UPP1, and PSTPIP2 were potential S. aureus bloodstream infection diagnostic indicators.
Currently, many studies have focused on the three genes mentioned above in S. aureus or other bacterial infections. DNA damage-regulated autophagy modulator 1 (DRAM1) is a stress-inducible regulator of autophagy and cell death (37). Xie et al. confirmed that DRAM1 could independently promote the zebrafish host defense against Mycobacterium marinum (38), and its role in facilitating Lysosomal Delivery of Mycobacterium marinum in murine RAW264.7 macrophages (39), suggesting DRAM1 is a host resistance factor against intracellular mycobacterial infection. Similarly, Zhang et al. demonstrated that deficiency in DRAM1 exacerbated pyroptotic cell death of Mycobacteria-infected macrophages (40). Han et al. found that DRAM1 expression was up-regulated in the S. aureus-treated bovine mammary epithelial cells and triggered the production of autophagosome (41). This appeared to coincide with our results since we demonstrated that DRAM1 was highly expressed in the blood of mice infected with S. aureus. Sun et al. proved upregulation of DRAM1 was involved in regulating autophagy and glycolysis in C10_ULK1 cells in response to both Escherichia coli (E. coli) infection and E. coli sepsis (42). Uridine phosphorylase 1 (UPP1) encodes uridine phosphorylase, a key enzyme that participates in the regulation of intracellular uridine homeostasis and the metabolism of pyrimidine ribonucleosides (43). Fan et al. revealed that UPP1 emerged with remarkable diagnostic value in pediatric septic shock and was involved in immune cell infiltration (44). Similarly, Lai et al. analyzed GEO datasets and found that UPP1 was upregulated in the sepsis group, and confirmed this finding by establishing a sepsis-induced acute lung injury model (45). Our research further expanded the diagnostic value of UPP1 and indicated its likelihood as a diagnostic biomarker. Proline-serine-threonine phosphatase Interacting Protein 2 (PSTPIP2), also known as macrophage F-actin–associated and tyrosine-phosphorylated protein (MAYP), is a Fes CIP4 homology domain (FCH) and Bin/Amphiphysin/Rvs (BAR; F-BAR) protein, predominantly expressed in the myeloid lineage (46). Johnny et al. uncovered that PSTPIP2 was highly expressed in the confirmed bacterial infection patients, correlating with infection status (47). Chen et al. validated the high expression of PSTPIP2 in patients infected with E. coli by analyzing GEO datasets and ex-vivo human blood models (48).
Additionally, the relationship between these diagnostic markers and infiltrating immune cells was further studied. The changes in various immune cell infiltration may be relevant to the occurrence and progression of S. aureus bloodstream infection (33, 49). NK cells are pivotal in the first line of defense of the human immune system (50, 51). They mediated some immune responses during anti-tumor and various viral infections and were the “natural barrier” in the human immune system (52). Under the stimulation of LPS and so on, dormant macrophages (M0) could induce polarization into M1 type macrophages, secreting a large number of pro-inflammatory factors, including IL-1, IL-6, and TNF-α, to promote inflammation, bacterial killing, and phagocytosis (53). M2 macrophages were mainly activated by IL-4 inflammatory factors and inhibit M1 macrophages by secreting anti-inflammatory cytokines such as IL10 (54). Neutrophils are one of the important cells in the immune system, with various functions, including chemotactic, regulatory, phagocytic, degranulation, and bactericidal effects (55, 56). Dendritic cells could uptake, process, and present antigens, and were initiators of adaptive immune responses (57, 58). CD4+ T cells mainly recognized foreign antigens presented by antigen-presenting cells (APCs) and generated responses (59). CD8+ T cells cloud secrete cytokines including TNF-α, IFN-γ, and the production and release of cytotoxic particles to defend against intracellular viruses and bacteria (60). In our research, DRAM1 expression was significantly positively correlated with B cell naive and mast cell activation, and negatively correlated with NK cells and CD4+/CD8+ T cells. PSTPIP2 expression was significantly positively correlated with macrophage M0, macrophage M1, B cells naive, and dendritic cells, while negatively correlated with NK cells and CD4/CD8+ T cells. UPP1 expression showed significant negative correlations with T cell CD4 memory rest and neutrophils. Li et al. (61) associated PD-1/PD-L1 signaling with the immunosuppressive state in S. aureus osteomyelitis, suggesting potential novel therapies combining PD-1/PD-L1 blockade with antibiotics for the treatment of S. aureus osteomyelitis. Therefore, our proposed diagnostic biomarkers may also be used to select potential patients with S. aureus bloodstream infection for the utilization of immunotherapy.
However, this study also had some limitations. Despite having reported the diagnostic value of these three markers in S. aureus bloodstream infections, unfortunately, we have not yet collected blood samples from patients with S. aureus bloodstream infection, which is a limitation of our study. Additionally, the S. aureus bloodstream infection-related molecular mechanisms should be investigated further by constructing animal models and cellular experiments. Meanwhile, the differences in immune response between mice and humans might affect the translational relevance of our findings.
Here, our study initially identified that DRAM1, PSTPIP2, and UPP1 were potential diagnostic indicators for S. aureus bloodstream infection. Furthermore, these three diagnostic genes also correlate with multiple immune cells to varying degrees and may be used for the S. aureus selection of potential patients for the utilization of immunotherapy.
Data availability statement
The raw data has been uploaded to the NCBI database (accession number: PRJNA1171428).
Ethics statement
This study was approved by the Ethics Committee of Shanghai Pulmonary Hospital, School of Medicine, Tongji University, Shanghai, China. All animal experiments were carried out under the guidelines approved by the Ethics Committee of the Shanghai Pulmonary Hospital of Tongji University School, Tongji University, Shanghai (Project number: K22-183Y).
Author contributions
JS: Conceptualization, Data curation, Formal analysis, Investigation, Methodology, Project administration, Resources, Software, Supervision, Validation, Visualization, Writing – original draft, Writing – review & editing. LS: Data curation, Writing – original draft. YX: Data curation, Writing – original draft. CW: Data curation, Writing – original draft. BW: Data curation, Writing – original draft. PZ: Methodology, Writing – original draft. JZ: Investigation, Writing – original draft. WH: Project administration, Writing – original draft. RH: Formal analysis, Writing – original draft. FY: Funding acquisition, Writing – review & editing. HW: Validation, Writing – review & editing.
Funding
The author(s) declare financial support was received for the research, authorship, and/or publication of this article. This study was supported by a grant from the National Natural Science Foundation of China (NSFC) (Grant No. 82272394).
Acknowledgments
Thanks to Mr. Sun Liangdong for his irreplaceable help in my work, which greatly improved my understanding of academic writing and taught me a lot of specific research skills.
Conflict of interest
The authors declare that the research was conducted in the absence of any commercial or financial relationships that could be construed as a potential conflict of interest.
Publisher’s note
All claims expressed in this article are solely those of the authors and do not necessarily represent those of their affiliated organizations, or those of the publisher, the editors and the reviewers. Any product that may be evaluated in this article, or claim that may be made by its manufacturer, is not guaranteed or endorsed by the publisher.
Supplementary material
The Supplementary Material for this article can be found online at: https://www.frontiersin.org/articles/10.3389/fimmu.2024.1450782/full#supplementary-material
Supplementary Table 1 | Primer pairs used in RT-PCRs.
Supplementary Table 2 | Information on microarray datasets obtained from GEO.
References
1. Tong SY, Davis JS, Eichenberger E, Holland TL, Fowler VG Jr. Staphylococcus aureus infections: epidemiology, pathophysiology, clinical manifestations, and management. Clin Microbiol Rev. (2015) 28:603–61. doi: 10.1128/CMR.00134-14
2. Lowy FD. Staphylococcus aureus infections. N Engl J Med. (1998) 339:520–32. doi: 10.1056/NEJM199808203390806
3. Kern WV, Rieg S. Burden of bacterial bloodstream infection-a brief update on epidemiology and significance of multidrug-resistant pathogens. Clin Microbiol Infect. (2020) 26:151–7. doi: 10.1016/j.cmi.2019.10.031
4. Asgeirsson H, Thalme A, Weiland O. Staphylococcus aureus bacteraemia and endocarditis - epidemiology and outcome: a review. Infect Dis (Lond). (2018) 50:175–92. doi: 10.1080/23744235.2017.1392039
5. Jacobsson G, Gustafsson E, Andersson R. Outcome for invasive Staphylococcus aureus infections. Eur J Clin Microbiol Infect Dis. (2008) 27:839–48. doi: 10.1007/s10096-008-0515-5
6. Nickerson EK, West TE, Day NP, Peacock SJ. Staphylococcus aureus disease and drug resistance in resource-limited countries in south and east Asia. Lancet Infect Dis. (2009) 9:130–5. doi: 10.1016/S1473-3099(09)70022-2
7. Buvelot H, Posfay-Barbe KM, Linder P, Schrenzel J, Krause KH. Staphylococcus aureus, phagocyte NADPH oxidase and chronic granulomatous disease. FEMS Microbiol Rev. (2017) 41:139–57. doi: 10.1093/femsre/fuw042
8. Bacchelli C, Williams HJ. Opportunities and technical challenges in next-generation sequencing for diagnosis of rare pediatric diseases. Expert Rev Mol Diagn. (2016) 16:1073–82. doi: 10.1080/14737159.2016.1222906
9. Thaden JT, Ahn R, Ruffin F, Gjertson DW, Hoffmann A, Fowler VG Jr, et al. Transcriptional signatures differentiate pathogen- and treatment-specific host responses in patients with bacterial bloodstream infections. J Infect Dis. (2023) 229(5):1535–45. doi: 10.1093/ofid/ofad500.313
10. Greener JG, Kandathil SM, Moffat L, Jones DT. A guide to machine learning for biologists. Nat Rev Mol Cell Biol. (2022) 23:40–55. doi: 10.1038/s41580-021-00407-0
11. Yang X, Zeng J, Yu X, Wang Z, Wang D, Zhou Q, et al. PCT, IL-6, and IL-10 facilitate early diagnosis and pathogen classifications in bloodstream infection. Ann Clin Microbiol Antimicrob. (2023) 22:103. doi: 10.1186/s12941-023-00653-4
12. Yoon J, Kym D, Hur J, Park J, Kim M, Cho YS, et al. The clinical differentiation of blood culture-positive and -negative sepsis in burn patients: a retrospective cohort study. Burns Trauma. (2023) 11:tkad031. doi: 10.1093/burnst/tkad031
13. Li H, Wang Z, Li X. G-CSF as a potential early biomarker for diagnosis of bloodstream infection. J Clin Lab Anal. (2021) 35:e23592. doi: 10.1002/jcla.23592
14. Ahn SH, Tsalik EL, Cyr DD, Zhang Y, van Velkinburgh JC, Langley RJ, et al. Gene expression-based classifiers identify Staphylococcus aureus infection in mice and humans. PloS One. (2013) 8:e48979. doi: 10.1371/journal.pone.0048979
15. Dix A, Hünniger K, Weber M, Guthke R, Kurzai O, Linde J. Biomarker-based classification of bacterial and fungal whole-blood infections in a genome-wide expression study. Front Microbiol. (2015) 6:171. doi: 10.3389/fmicb.2015.00171
16. Wu T, Hu E, Xu S, Chen M, Guo P, Dai Z, et al. clusterProfiler 4.0: A universal enrichment tool for interpreting omics data. Innovation (Camb). (2021) 2:100141. doi: 10.1016/j.xinn.2021.100141
17. Subramanian A, Tamayo P, Mootha VK, Mukherjee S, Ebert BL, Gillette MA, et al. Gene set enrichment analysis: a knowledge-based approach for interpreting genome-wide expression profiles. Proc Natl Acad Sci U.S.A. (2005) 102:15545–50. doi: 10.1073/pnas.0506580102
18. Kursa MB. Robustness of Random Forest-based gene selection methods. BMC Bioinf. (2014) 15:8. doi: 10.1186/1471-2105-15-8
19. Frost HR, Amos CI. Gene set selection via LASSO penalized regression (SLPR). Nucleic Acids Res. (2017) 45:e114. doi: 10.1093/nar/gkx291
20. Mi X, Zou B, Zou F, Hu J. Permutation-based identification of important biomarkers for complex diseases via machine learning models. Nat Commun. (2021) 12:3008. doi: 10.1038/s41467-021-22756-2
21. Newman AM, Liu CL, Green MR, Gentles AJ, Feng W, Xu Y, et al. Robust enumeration of cell subsets from tissue expression profiles. Nat Methods. (2015) 12:453–7. doi: 10.1038/nmeth.3337
22. Kim D, Langmead B, Salzberg SL. HISAT: a fast spliced aligner with low memory requirements. Nat Methods. (2015) 12:357–60. doi: 10.1038/nmeth.3317
23. Liao Y, Smyth GK, Shi W. feature Counts: an efficient general purpose program for assigning sequence reads to genomic features. Bioinformatics. (2014) 30:923–30. doi: 10.1093/bioinformatics/btt656
24. Li S, Chen L, Li J, Liu J. Comparison of different protocols of RNA preparation from circulating blood for RNA sequencing. Biotechnol Lett. (2021) 43:1685–98. doi: 10.1007/s10529-021-03152-8
25. Edwards AM, Massey RC. How does Staphylococcus aureus escape the bloodstream? Trends Microbiol. (2011) 19:184–90. doi: 10.1016/j.tim.2010.12.005
26. Jung N, Rieg S. Essentials in the management of S. aureus bloodstream infection. Infection. (2018) 46:441–2. doi: 10.1007/s15010-018-1130-8
27. Jenul C, Horswill AR. Regulation of staphylococcus aureus virulence. Microbiol Spectr. (2019) 7(2):10.1128. doi: 10.1128/microbiolspec.GPP3-0031-2018
28. Seidl K, Leemann M, Zinkernagel AS. The ArlRS two-component system is a regulator of Staphylococcus aureus-induced endothelial cell damage. Eur J Clin Microbiol Infect Dis. (2018) 37:289–92. doi: 10.1007/s10096-017-3130-5
29. McAdow M, Kim HK, Dedent AC, Hendrickx AP, Schneewind O, Missiakas DM. Preventing Staphylococcus aureus sepsis through the inhibition of its agglutination in blood. PloS Pathog. (2011) 7:e1002307. doi: 10.1371/journal.ppat.1002307
30. Crosby HA, Tiwari N, Kwiecinski JM, Xu Z, Dykstra A, Jenul C, et al. The Staphylococcus aureus ArlRS two-component system regulates virulence factor expression through MgrA. Mol Microbiol. (2020) 113:103–22. doi: 10.1111/mmi.14404
31. Párraga Solórzano PK, Yao J, Rock CO, Kehl-Fie TE. Disruption of glycolysis by nutritional immunity activates a two-component system that coordinates a metabolic and antihost response by staphylococcus aureus. mBio. (2019) 10(4):e01321–19. doi: 10.1128/mBio.01321-19
32. Radin JN, Kelliher JL, Párraga Solórzano PK, Kehl-Fie TE. The two-component system arlRS and alterations in metabolism enable staphylococcus aureus to resist calprotectin-induced manganese starvation. PloS Pathog. (2016) 12:e1006040. doi: 10.1371/journal.ppat.1006040
33. Zwack EE, Chen Z, Devlin JC, Li Z, Zheng X, Weinstock A, et al. Staphylococcus aureus induces a muted host response in human blood that blunts the recruitment of neutrophils. Proc Natl Acad Sci U.S.A. (2022) 119:e2123017119. doi: 10.1073/pnas.2123017119
34. Sun C, Tan D, Yu J, Liu J, Shen D, Li S, et al. Predictive models for sepsis in children with Staphylococcus aureus bloodstream infections: a retrospective cohort study. BMC Pediatr. (2023) 23:496. doi: 10.1186/s12887-023-04317-2
35. O’Keeffe KM, Wilk MM, Leech JM, Murphy AG, Laabei M, Monk IR, et al. Manipulation of autophagy in phagocytes facilitates staphylococcus aureus bloodstream infection. Infect Immun. (2015) 83:3445–57. doi: 10.1128/IAI.00358-15
36. McNicholas S, Talento AF, O'Gorman J, Hannan MM, Lynch M, Greene CM, et al. Cytokine responses to Staphylococcus aureus bloodstream infection differ between patient cohorts that have different clinical courses of infection. BMC Infect Dis. (2014) 14:580. doi: 10.1186/s12879-014-0580-6
37. Chen G, Lin Y, Chen L, Zeng F, Zhang L, Huang Y, et al. Role of DRAM1 in mitophagy contributes to preeclampsia regulation in mice. Mol Med Rep. (2020) 22:1847–58. doi: 10.3892/mmr
38. Xie J, Meijer AH. Xenophagy receptors Optn and p62 and autophagy modulator Dram1 independently promote the zebrafish host defense against Mycobacterium marinum. Front Cell Infect Microbiol. (2023) 13:1331818. doi: 10.3389/fcimb.2023.1331818
39. Banducci-Karp A, Xie J, Engels SAG, Sarantaris C, van Hage P, Varela M, et al. DRAM1 promotes lysosomal delivery of mycobacterium marinum in macrophages. Cells. (2023) 12(6):828. doi: 10.3390/cells12060828
40. Zhang R, Varela M, Forn-Cuní G, Torraca V, van der Vaart M, Meijer AH. Deficiency in the autophagy modulator Dram1 exacerbates pyroptotic cell death of Mycobacteria-infected macrophages. Cell Death Dis. (2020) 11:277. doi: 10.1038/s41419-020-2477-1
41. Wang X, Su F, Yu X, Geng N, Li L, Wang R, et al. RNA-seq whole transcriptome analysis of bovine mammary epithelial cells in response to intracellular staphylococcus aureus. Front Vet Sci. (2020) 7:642. doi: 10.3389/fvets.2020.00642
42. Sun P, Cui M, Jing J, Kong F, Wang S, Tang L, et al. Deciphering the molecular and cellular atlas of immune cells in septic patients with different bacterial infections. J Transl Med. (2023) 21:777. doi: 10.1186/s12967-023-04631-4
43. Im YS, Shin HK, Kim HR, Jeong SH, Kim SR, Kim YM, et al. Enhanced cytotoxicity of 5-FU by bFGF through up-regulation of uridine phosphorylase 1. Mol Cells. (2009) 28:119–24. doi: 10.1007/s10059-009-0116-x
44. Fan J, Shi S, Qiu Y, Liu M, Shu Q. Analysis of signature genes and association with immune cells infiltration in pediatric septic shock. Front Immunol. (2022) 13:1056750. doi: 10.3389/fimmu.2022.1056750
45. Lai K, Song C, Gao M, Deng Y, Lu Z, Li N, et al. Uridine alleviates sepsis-induced acute lung injury by inhibiting ferroptosis of macrophage. Int J Mol Sci. (2023) 24(6):5093. doi: 10.3390/ijms24065093
46. Xu JJ, Li HD, Du XS, Li JJ, Meng XM, Huang C, et al. Role of the F-BAR family member PSTPIP2 in autoinflammatory diseases. Front Immunol. (2021) 12:585412. doi: 10.3389/fimmu.2021.585412
47. Atallah J, Ghebremichael M, Timmer KD, Warren HM, Mallinger E, Wallace E, et al. Novel host response-based diagnostics to differentiate the etiology of fever in patients presenting to the emergency department. Diagnostics (Basel). (2023) 13(5):953. doi: 10.3390/diagnostics13050953
48. Chen H, Li Y, Li T, Sun H, Tan C, Gao M, et al. Identification of Potential Transcriptional Biomarkers Differently Expressed in Both S. aureus- and E. coli-Induced Sepsis via Integrated Analysis. BioMed Res Int. (2019) 2019:2487921. doi: 10.1155/2019/2487921
49. Mulder WJM, Ochando J, Joosten LAB, Fayad ZA, Netea MG. Therapeutic targeting of trained immunity. Nat Rev Drug Discovery. (2019) 18:553–66. doi: 10.1038/s41573-019-0025-4
50. Mujal AM, Delconte RB, Sun JC. Natural killer cells: from innate to adaptive features. Annu Rev Immunol. (2021) 39:417–47. doi: 10.1146/annurev-immunol-101819-074948
51. Spits H, Bernink JH, Lanier L. NK cells and type 1 innate lymphoid cells: partners in host defense. Nat Immunol. (2016) 17:758–64. doi: 10.1038/ni.3482
52. O’Sullivan TE, Sun JC, Lanier LL. Natural killer cell memory. Immunity. (2015) 43:634–45. doi: 10.1016/j.immuni.2015.09.013
53. Sica A, Colombo MP, Trama A, Horn L, Garassino MC, Torri V. Immunometabolic status of COVID-19 cancer patients. Physiol Rev. (2020) 100:1839–50. doi: 10.1152/physrev.00018.2020
54. Sica A, Mantovani A. Macrophage plasticity and polarization: in vivo veritas. J Clin Invest. (2012) 122:787–95. doi: 10.1172/JCI59643
55. Kolaczkowska E, Kubes P. Neutrophil recruitment and function in health and inflammation. Nat Rev Immunol. (2013) 13:159–75. doi: 10.1038/nri3399
56. Liew PX, Kubes P. The neutrophil’s role during health and disease. Physiol Rev. (2019) 99:1223–48. doi: 10.1152/physrev.00012.2018
57. Anderson DA 3rd, Dutertre CA, Ginhoux F, Murphy KM. Genetic models of human and mouse dendritic cell development and function. Nat Rev Immunol. (2021) 21:101–15. doi: 10.1038/s41577-020-00413-x
58. Eisenbarth SC. Dendritic cell subsets in T cell programming: location dictates function. Nat Rev Immunol. (2019) 19:89–103. doi: 10.1038/s41577-018-0088-1
59. Sallusto F. Heterogeneity of human CD4(+) T cells against microbes. Annu Rev Immunol. (2016) 34:317–34. doi: 10.1146/annurev-immunol-032414-112056
60. Reina-Campos M, Scharping NE, Goldrath AW. CD8(+) T cell metabolism in infection and cancer. Nat Rev Immunol. (2021) 21:718–38. doi: 10.1038/s41577-021-00537-8
Keywords: Staphylococcus aureus, bloodstream infection, machine-learning, biomarkers, immune cell abundance
Citation: Shi J, Shen L, Xiao Y, Wan C, Wang B, Zhou P, Zhang J, Han W, Hu R, Yu F and Wang H (2024) Identification and validation of diagnostic biomarkers and immune cell abundance characteristics in Staphylococcus aureus bloodstream infection by integrative bioinformatics analysis. Front. Immunol. 15:1450782. doi: 10.3389/fimmu.2024.1450782
Received: 18 June 2024; Accepted: 01 August 2024;
Published: 25 November 2024.
Edited by:
Hui-Xin Liu, China Medical University, ChinaReviewed by:
Hongfei Li, Zhejiang Ocean University, ChinaTomasz Prajsnar, Jagiellonian University, Poland
Copyright © 2024 Shi, Shen, Xiao, Wan, Wang, Zhou, Zhang, Han, Hu, Yu and Wang. This is an open-access article distributed under the terms of the Creative Commons Attribution License (CC BY). The use, distribution or reproduction in other forums is permitted, provided the original author(s) and the copyright owner(s) are credited and that the original publication in this journal is cited, in accordance with accepted academic practice. No use, distribution or reproduction is permitted which does not comply with these terms.
*Correspondence: Fangyou Yu, d3pqeHlmeUAxNjMuY29t; Hongxiu Wang, cG9sZXJ0ZXJ3YW5nQDE2My5jb20=
 Junhong Shi
 Li Shen1
 Bingjie Wang
 Fangyou Yu
 Hongxiu Wang