
95% of researchers rate our articles as excellent or good
Learn more about the work of our research integrity team to safeguard the quality of each article we publish.
Find out more
ORIGINAL RESEARCH article
Front. Immunol. , 04 November 2024
Sec. Cancer Immunity and Immunotherapy
Volume 15 - 2024 | https://doi.org/10.3389/fimmu.2024.1446273
 Longguo Zhang1,2†
 Huixin Li1,2†
 Fangyan Sun1,2
 Qiuping Wu1,2
 Leigang Jin1,2
 Aimin Xu1,2
 Jiarui Chen3*
 Ranyao Yang1,2,4*
Background: Due to the unique heterogeneity of neuroblastoma, its treatment and prognosis are closely related to the biological behavior of the tumor. However, the effect of the tumor immune microenvironment on neuroblastoma needs to be investigated, and there is a lack of biomarkers to reflect the condition of the tumor immune microenvironment.
Methods: The GEO Database was used to download transcriptome data (both training dataset and test dataset) on neuroblastoma. Immunity scores were calculated for each sample using ssGSEA, and hierarchical clustering was used to categorize the samples into high and low immunity groups. Subsequently, the differences in clinicopathological characteristics and treatment between the different groups were examined. Three machine learning algorithms (LASSO, SVM-RFE, and Random Forest) were used to screen biomarkers and synthesize their function in neuroblastoma.
Results: In the training set, there were 362 samples in the immunity_L group and 136 samples in the immunity_H group, with differences in age, MYCN status, etc. Additionally, the tumor microenvironment can also affect the therapeutic response of neuroblastoma. Six characteristic genes (BATF, CXCR3, GIMAP5, GPR18, ISG20, and IGHM) were identified by machine learning, and these genes are associated with multiple immune-related pathways and immune cells in neuroblastoma.
Conclusions: BATF, CXCR3, GIMAP5, GPR18, ISG20, and IGHM may serve as biomarkers that reflect the conditions of the immune microenvironment of neuroblastoma and hold promise in guiding neuroblastoma treatment.
Neuroblastoma (NBL) is a malignant pediatric tumor originating from neural crest cells, representing the most common extracranial solid tumor in children and accounting for a significant proportion of pediatric cancer cases (1). NBL typically occurs in the adrenal glands but can also develop in nerve tissue along the spine, chest, abdomen, or pelvis. NBL, with its striking predilection for young children, exemplifies the challenges posed by rare malignancies (2). The incidence rate varies across different populations and geographical regions, with NBL being more prevalent in Caucasians than in individuals of African or Asian descent (3). Certain genetic factors, such as mutations in the ALK gene (4), MYCN amplification (5), and familial predisposition (6), are associated with an increased risk of developing NBL. Other factors, including maternal age, birth weight, and prenatal exposures, may also influence NBL development (3). Conversely, NBL is rare in older age groups and adults (7). Due to the significant heterogeneity of NBL (8), MDT (Multi-disciplinary Team) to HIM (Holistic Integrative Medicine) is required to provide patients with precise treatment plans based on the clinicopathological characteristics of the tumor and maximize the clinical benefits for patients. The principal treatments for NBL include systemic chemotherapy and surgery (8, 9). Depending on the disease stage, additional treatment options such as radiotherapy, stem cell transplantation and immune-targeted therapy may be utilized to provide comprehensive care for patients (8, 9). Staging systems for NBL, including the International NBL Risk Group (INRG) (10) classification system and the International Neuroblastoma Staging System (INSS) (11), were developed to standardize the classification of NBL. However, there is still a significant variation in patient outcomes within the same stage group under the current staging system (12). Therefore, further research is needed to investigate the pathophysiological features and classification of NBL within the framework of the existing staging system, to establish a foundation for more precise clinical management and prevent both over-treatment and under-treatment.
The tumor microenvironment (TME) is a dynamic, constantly changing, and highly complex environment composed of tumor cells and a variety of non-tumor cells, including immune cells, fibroblasts, etc., which play a critical role in tumor proliferation, invasion, and metastasis (13, 14). The tumor immune microenvironment (TIME), which constitutes a significant component of the TME, encompasses not only immune cells (e.g., T cells, macrophages, dendritic cells.), but also non-immune cells (e.g., fibroblasts, endothelial cells.), extracellular matrix components, and a range of molecules involved in the immune response (15). The TIME shapes tumor biological features through both anti-tumorigenic and pro-tumorigenic effects. On the one hand, the immune cells in TIME are activated to recognize and eliminate tumor cells (16). Moreover, immune cells have the capacity to generate cytokines and chemokines, which serve to attract other immune cells to the tumor site and stimulate an immune response against the tumor (16, 17). On the other hand, tumor cells can also manipulate the TIME and eventually undermine effective tumor surveillance (18). Tumors achieve immune evasion through multiple pathways (18–20), including dysfunctional antigen presentation mechanism, recruitment of regulatory immune cells, and induction of T cell exhaustion, etc. In non-small cell lung cancer (21) and colorectal cancer (22), tumor typing based on TIME can enhance the prediction of patient prognosis and provide guidance for clinical therapy. In NBL, the immune checkpoint-based signature constructed using OX40, B7-H3, ICOS, and TIM-3 can differentiate between high- and low-risk NBL patients and has the potential to predict prognosis (23). However, there is a lack of sufficient clinical evidence to reveal the relationship between the TIME of NBL and its clinicopathologic features. Furthermore, accurately diagnosing the level of immune infiltration in NBL remains challenging.
In this study, we calculated the immune enrichment score of each sample using ssGSEA (single-sample Gene Set Enrichment Analysis), and used hierarchical clustering to categorize the samples into high and low immunity groups. Subsequently, we systematically evaluated the relationship between the clinicopathologic features of the tumor and the status of immune infiltration. To better distinguish the immune subset profile of NBL, we employed three machine-learning algorithms to identify potential diagnostic biomarkers and analyze the function of these characterized genes in NBL (Figure 1).
All transcriptome sequencing data for NBL were obtained from the Gene Expression Omnibus (GEO) database (https://www.ncbi.nlm.nih.gov/geo/). The GSE49710 dataset [GPL16876 platform, Agilent-020382 Human Custom Microarray 44k (Feature Number version)] containing 498 tumor samples was downloaded for the training set. Two independent cohorts GSE16476 (GPL570 platform, [HG-U133_Plus_2] Affymetrix Human Genome U133 Plus 2.0 Array, n=88) and GSE19274 (GPL6102, Illumina human-6 v2.0 expression beadchip, n=100) were used as test datasets. The GSE85047 dataset (GPL5175 platform, [HuEx-1_0-st] Affymetrix Human Exon 1.0 ST Array [transcript (gene) version], n=283) was used for survival analysis of characterized genes. The probe names in the original gene expression matrix were converted to gene symbols using Perl (v5.32.1.1), and duplicate gene symbols were averaged. The expression information of probes without gene symbols was deleted.
As a rank-based algorithm, ssGSEA (single-sample Gene Set Enrichment Analysis) can be conducted to investigate the absolute enrichment levels of each sample in a particular set of genes by calculating its enrichment score (24). In this study, ssGSEA was employed to investigate the enrichment levels of 29 clusters of immune cell markers, or gene sets associated with immune function and/or pathways to reflect the immune infiltration conditions of tumors, in each NBL tissue using “GSVA” (25) and “GSEABase” R packages. Hierarchical clustering analysis was applied to classify NBL tissues into high or low immunity groups based on ssGSEA enrichment results among immune signature genes, using “sparcl” (26) R package.
As a dimensionality reduction technique, t-SNE (t-distribution Stochastic Neighbor Embedding) is commonly used to visualize high-dimensional data into low-dimensional data. It excels at capturing complex patterns and relationships within the dataset (27). The t-SNE algorithm was employed, with the assistance of the “Rtsne” R package, to analyze the distribution of NBL samples across different immunity conditions.
Since non-tumor cells and tumor cells display distinct gene expression patterns, the ESTIMATE (Estimation of STromal and Immune cells in MAlignant Tumor tissues using Expression data) algorithm can calculate the relative abundance of non-tumor cells (e.g., immune cells and stromal cells) in tumor tissues by analyzing the expression of characteristic genes among those cells within the sample (28). To assess the outcomes of the ssGSEA-based hierarchical clustering, ESTIMATE was employed to analyze four tumor microenvironment scores including tumor purity, ESTIMATE score, immune score, and stromal score. This analysis was performed for each patient to compare the high and low immunity groups, using “estimate” (29) R package.
The CIBERSORT (Cell-type Identification By Estimating Relative Subsets Of RNA Transcripts) algorithm quantifies the relative proportions of immune cell clusters in tumor samples by deconvolution of bulk RNA-Seq results using a support vector regression (SVR) machine learning approach (30). It assesses the fraction of 22 tumor-infiltrating immune cell (TIIC) subpopulations, including T cells, B cells, natural killer cells, macrophages, etc., in the tumor microenvironment. This assessment was based on the matrix file named “LM22,” which comprises 547 genes and covers 22 mature human hematopoietic populations (31). The abundance of different immune cells between the high and low immunity groups of NBL was investigated using CIBERSORT algorithm.
The influence of the immune infiltration level of NBL on clinical drug therapy was analyzed. Firstly, the effect of immunity on NBL immunotherapy was investigated, and we examined six immune-checkpoint-associated genes (CD274, CTLA4, HAVCR2, LAG3, PDCD1, PDCD1LG2) in the high and low immunity groups. Utilizing data from the Genomics of Drug Sensitivity in Cancer 2 database (GDSC2) at https://www.cancerrxgene.org/, the “oncoPredict” (32) R package was used to predict the sensitivity of each patient to different drugs, further use of the Wilcoxon rank-sum test to analyze the differences between high-sensitivity drugs in various immunity conditions.
Using the “limma” (33) R package to analyze differentially expressed genes (DEGs) between the low and high immunity groups of NBL samples in the log2-processed training dataset. In this process, genes with log2|fold change (FC)| ≥ 1 and adjusted p-value < 0.05 were identified as DEGs affected by immune infiltration levels and were used as candidate genes for further analysis. Meanwhile, for the NBL immune-related characteristic genes identified by machine learning, the samples were categorized into high- and low-expression groups based on the median expression of these genes. The selection method of DEGs between high and low expression groups was the same as described previously.
Weighted Gene Co-Expression Network Analysis (WGCNA) was used to cluster highly synergistic gene modules in NBL, correlate these modules with immunity classifications, and subsequently identify immune-associated core modules and genes. This analysis was performed using the “WGCNA” R package (34). Initially, the log2-processed gene expression matrix was screened to remove genes with low expression levels. To determine the appropriate soft threshold power value for the median calculation of the correlation coefficient to obtain the scale-free network distribution, the “pickSoftThreshold” function is employed to calculate the soft thresholding power (β) value. Subsequently, the “sft$powerEstimate” function is used to select the optimal β value from a range of 1 to 20, with the requirement that the scale-free topology fit R^2 index exceeds 0.85. Adjacency matrix and TOM matrix were then constructed sequentially on the basis of the gene expression matrix according to the β value. The dynamic tree cut algorithm was used to construct modules and analyze the correlation between modules and immunity.
Prior to analysis, the symbol IDs of all genes were converted to Homo sapiens EnterzID using the “org.Hs.eg.db” R package. We explored the functions of all DEGs associated with immunity of NBL using Gene Ontology (GO) analysis and Kyoto Encyclopedia of Genomes (KEGG) analysis with the assistance of the “clusterProfiler” (35) R package, and the screening criteria for the terms were p < 0.05. GO gene set enrichment analysis (GSEA) was applied to conduct enrichment analysis of DEGs among high- and low-expression groups of each immune infiltration-related Genes using “clusterProfiler” R package.
Three Machine Learning algorithms were utilized to identify characteristic genes affecting immunity levels in NBL. LASSO (Least Absolute Shrinkage and Selection Operator) possesses inherent regularization properties, allowing it to perform feature selection by shrinking specific regression coefficients to zero. This unique property makes LASSO well-suited for identifying relevant variables and selecting a subset of significant features in a given dataset (36). Genes were ranked by Random Forest, and the top 30 genes were selected for further analysis. SVM-RFE (Support Vector Machine Recursive Feature Elimination) operates as a feature selection algorithm reliant on Support Vector Machines (SVMs). SVM separates different classes of data points in a high-dimensional feature space by finding the optimal hyperplane (37). LASSO, SVM, and Random Forest were implemented using the “glmnet” (38), “e1071” (39), and “randomForest” (40) R packages, respectively. The intersection of LASSO, SVM, and Random Forest results was used to identify hub genes affecting immunity in NBL. Determine the area under the curve (AUC) using the receiver operating characteristic (ROC) curve to evaluate the characterized genes and assess their discrimination value in the immune infiltration levels, using the “pROC” (41) R package.
In order to investigate the effect of the immunity-related characteristic gene expression on the prognosis of NBL patients, we analyzed the OS (Overall Survival) and PFS (Profression Free Survival) data in the GSE85047 dataset. Samples were categorized into two high and low expression groups based on the median gene expression, and the Kaplan-Meier curve was used to investigate the survival differences between the two groups, with the assistance of the ‘survival’ and ‘survminer’ R packages.
Continuous data were presented using mean ± standard deviation (M ± SD), and categorical and count data were expressed as frequencies (rates). When analyzing differences in clinical features between high and low expression groups of characterized genes using IBM SPSS Statistics 27, the Mann-Whitney U test was used for continuous variables and the chi-square test for categorical variables. A two-sided p-value of less than 0.05 was considered to indicate a statistically significant difference. The remaining analysis was performed using R software (version 4.2.2). The Wilcoxon rank-sum test was used to analyze the difference in continuity variables between the Immunity_L and Immunity_H groups. P < 0.05 was considered statistically significant.
Scoring the immune infiltration conditions of 498 NBL samples from the training dataset (GSE49710) based on transcriptome sequencing data using the ssGSEA algorithm. An unsupervised hierarchical clustering algorithm identified two clusters with different immune infiltration patterns based on the ssGSEA scores. In total, 362 samples belonged to the low immunity group (Immunity_L), while 136 samples were categorized as the high immunity group (Immunity_H), as illustrated in Figure 2A. t-SNE analysis further demonstrated distinct gene expression patterns between the high and low immune infiltration groups (Figure 2B). To validate the immunoclustering based on ssGSEA scores, the ESTIMATE algorithm was employed. The results indicated that the high immunity group exhibited significantly higher ESTIMATE scores (L: -448.0756 ± 1095.2302; H: 1452.7437 ± 936.7952), ImmuneScores (L: -146.0297 ± 627.0643; H: 1237.8876 ± 554.5626), and StromalScores (L: -302.0459 ± 559.7807; H: 214.8562 ± 502.2821). Additionally, this group showed lower Tumor Purity (L: 0.8470 ± 0.0784; H: 0.6772 ± 0.1013) (Figures 2C, D). Concurrently, multiple HLA genes upregulated in the immunity group, as shown in Figure 2E. Furthermore, CIBERSORT results indicated that NBL samples with high immunity exhibited increased levels of B cells naive, Plasma cells, T cells CD8, T cells CD4 naive, T cells CD4 memory activated, T cells follicular helper, T cells regulatory (Tregs), T cells gamma delta, Macrophages M1 infiltration, and lower levels of T cells CD4 memory resting, Macrophages M0, Macrophages M2, and Mast cells activated infiltration (Figures 2F, G). The clinicopathologic characteristics among the different groups were shown in Supplementary Table S1.
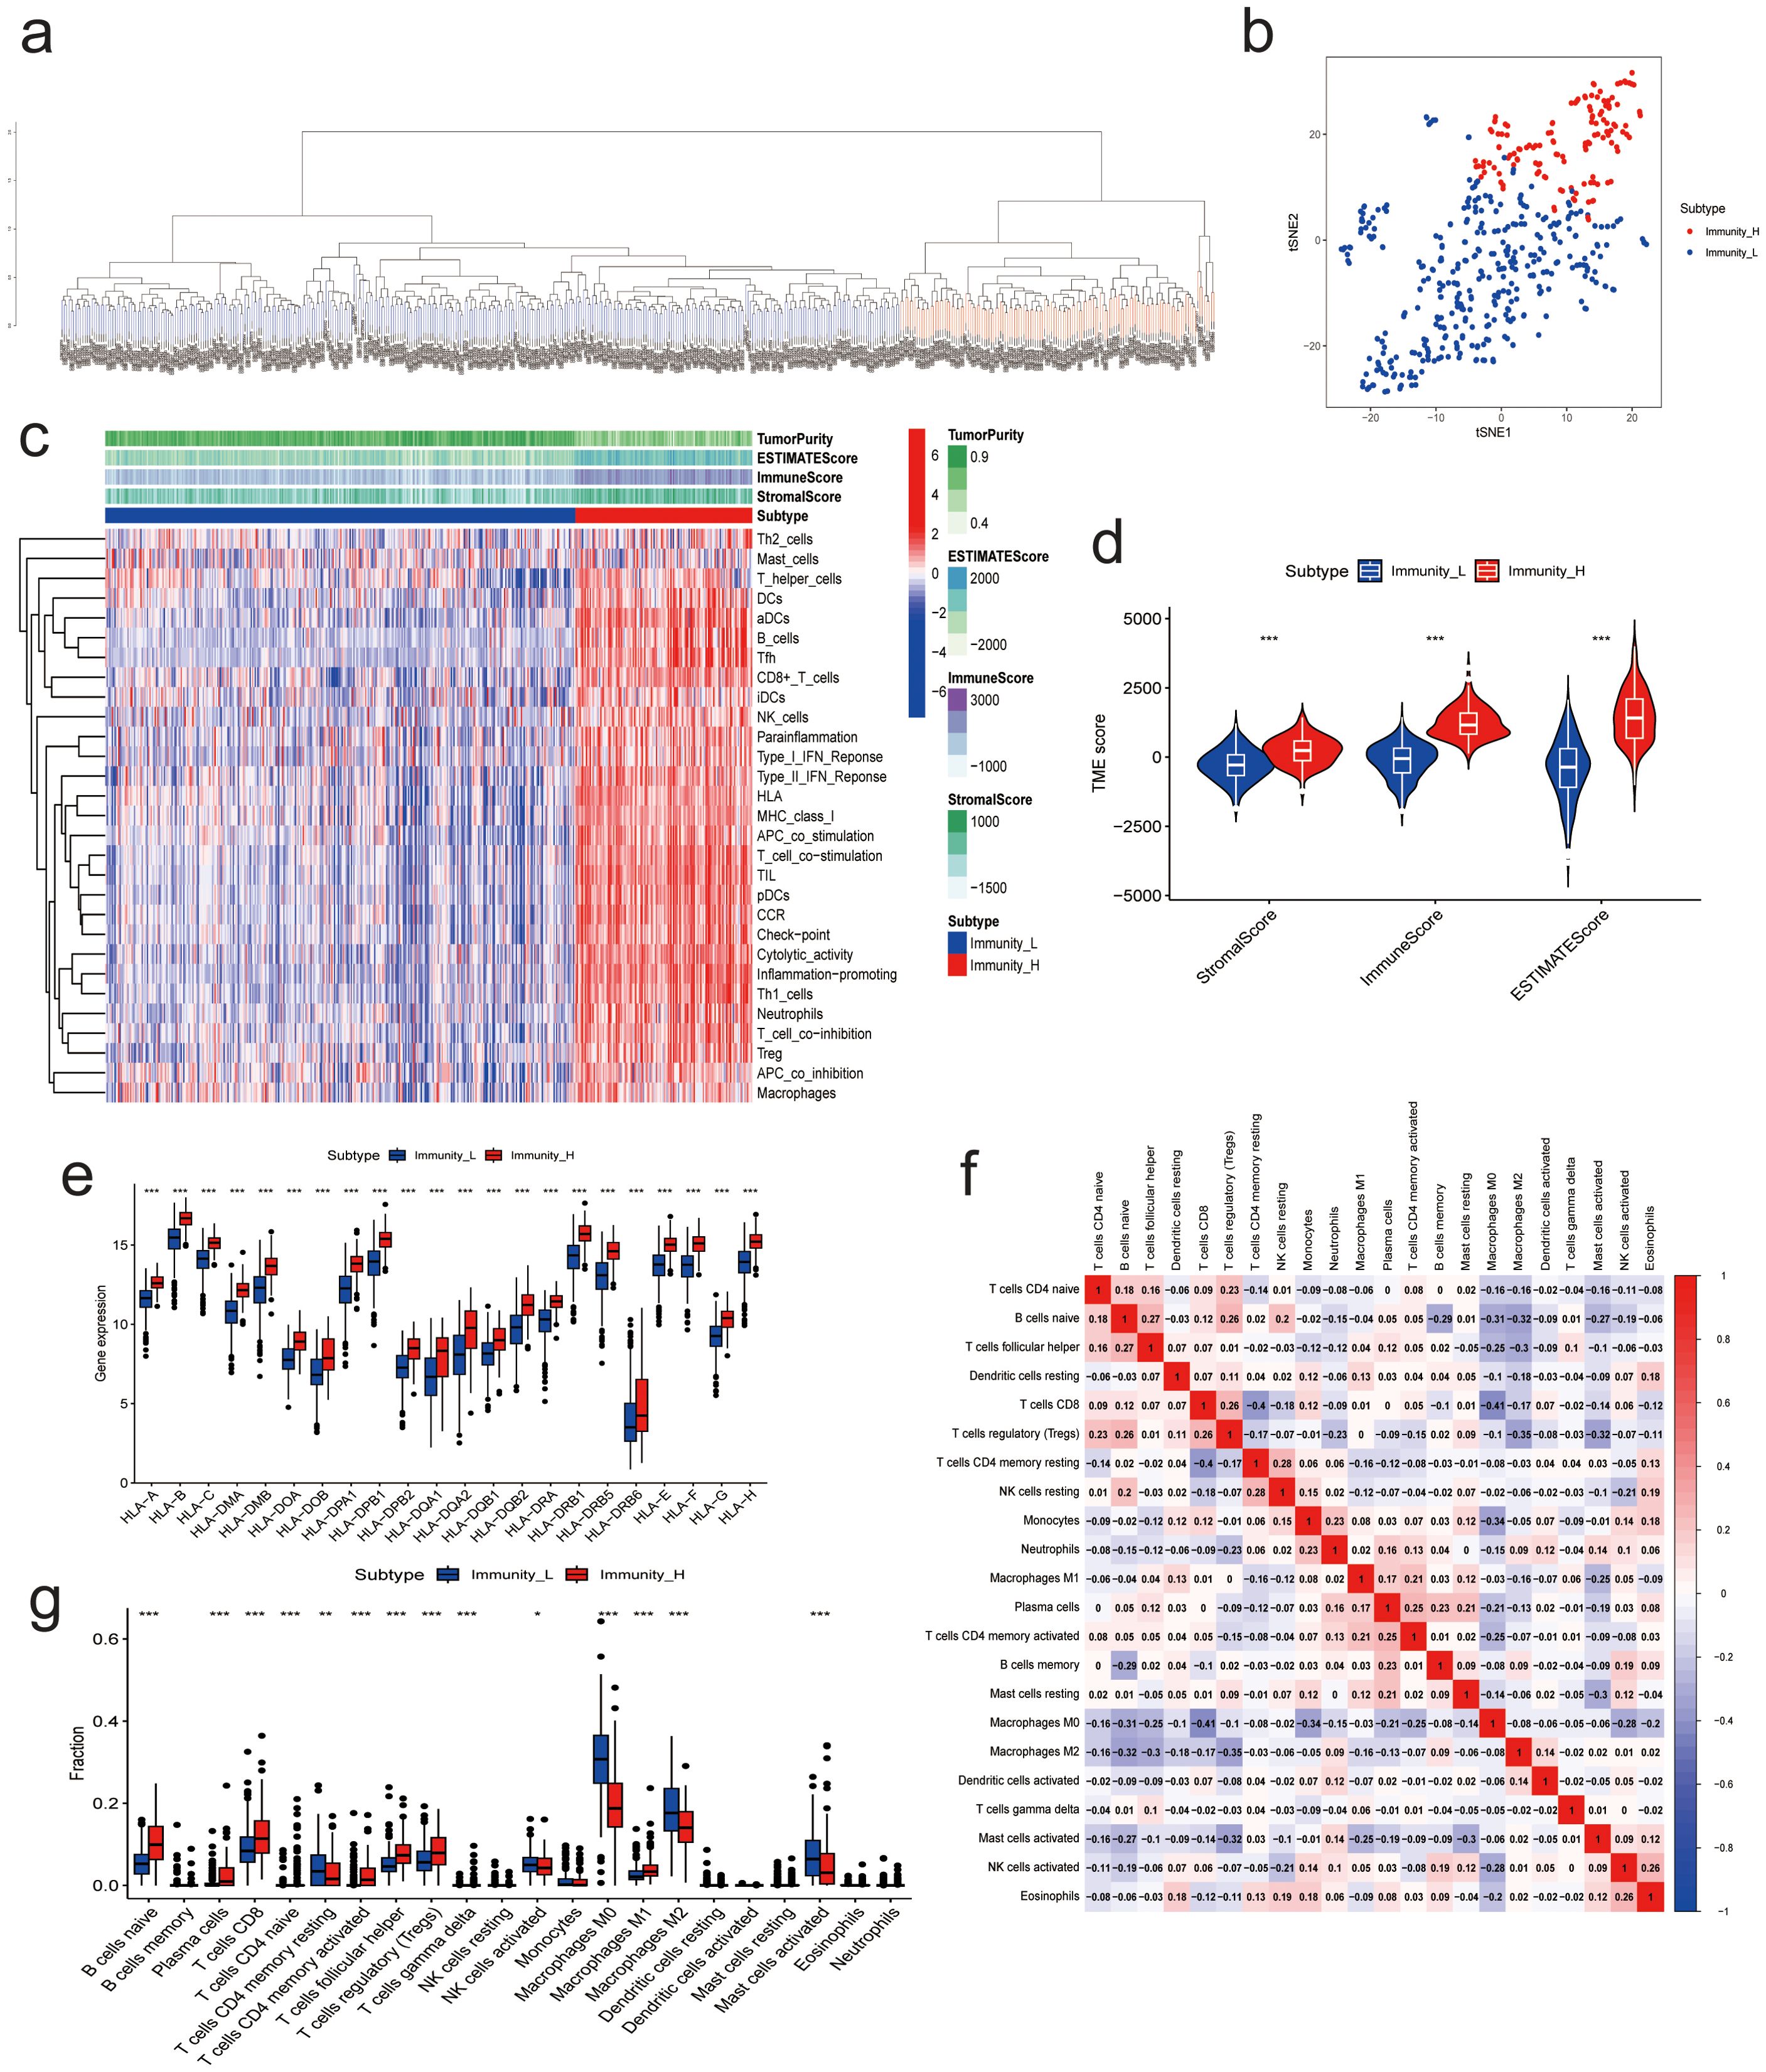
Figure 2. Results of NB Immunoclustering. (A) Hierarchical clustering analysis results based on ssGSEA enrichment score. (B) t-SNE analysis of the high- and low-immunity groups. (C) Heatmap of ESTIMATES analysis results. (D) Violin plot of ESTIMATES analysis results. (E) Expression of immune-related genes between high and low immunity groups. (F) Correlation analysis between 22 immune cells from CIBERSORT analysis. (G) Immune cell infiltration between high and low immunity groups. (* P<0.05, ** P<0.01, *** P<0.001).
To further investigate the clinical value of different immunity levels in NBL, we analyzed the differences between high and low immunity groups in immunotherapy and chemotherapy. The results showed that the high immunity group had higher expression of 6 immune checkpoint-related genes, as shown in Figure 3A. Meanwhile, the drug sensitivity results showed that the high immunity group was more sensitive to drugs AZD8055, Bortezomib, Camptothecin, CDK9_5038, CDK9_5576, Dactinomycin, Dactolisib, Dinaciclib, Epirubicin, Gemcitabine, Luminespib, Podophyllotoxin bromide, Rapamycin, Sabutoclax, Staurosporine, Vinblastine; while the low immunity group was more sensitive to drugs Daporinad, Sepantronium bromide (Figures 3B–S).
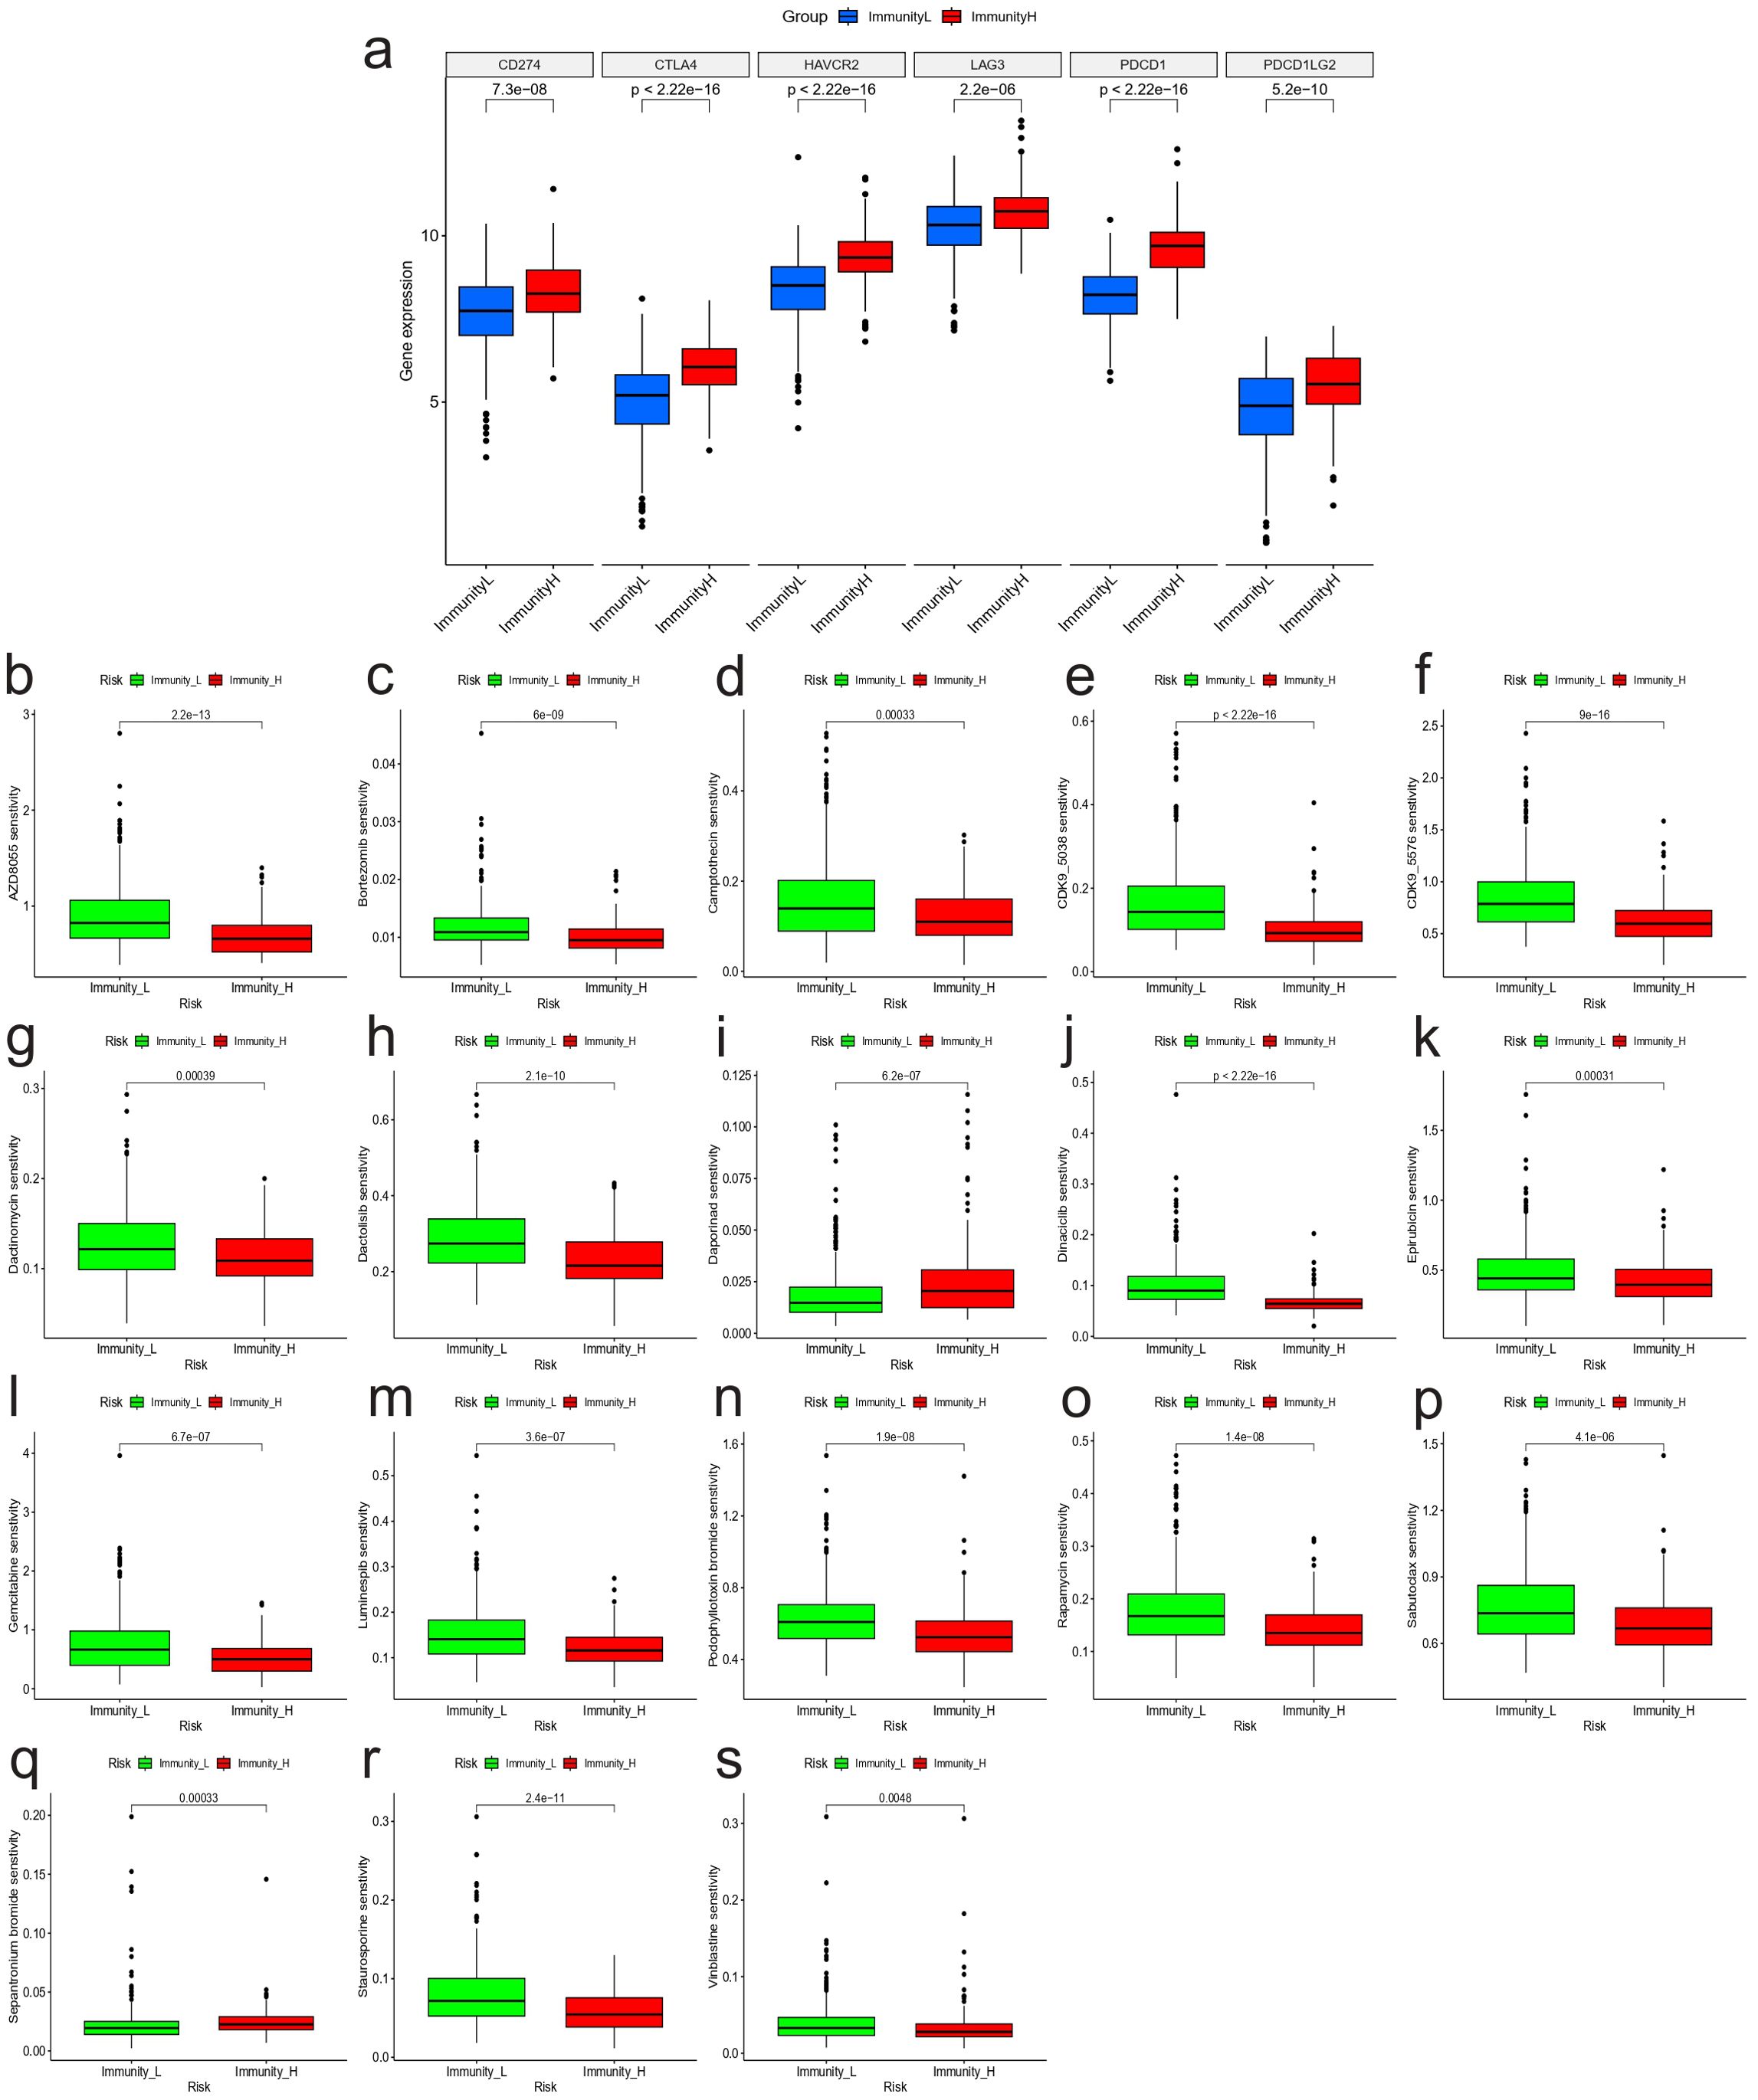
Figure 3. Immunoclustering and clinical treatment results. (A) Expression of genes associated with immune checkpoints between high and low immunity groups. Results of drug sensitivity analysis: (B) AZD8055; (C) Bortezomib; (D) Camptothecin; (E) CDK9_5038; (F) CDK9_5576; (G) Dactinomycin; (H) Dactolisib; (I) Daporinad; (J) Dinaciclib; (K) Epirubicin; (L) Gemcitabine; (M) Luminespib; (N) Podophyllotoxin bromide; (O) Rapamycin; (P) Sabutoclax; (Q) Sepantronium bromide; (R) Staurosporine; (S) Vinblastine.
In the training dataset, 586 genes were up-regulated, while 11 genes were down-regulated in the high-immunity NBL group when compared to the low-immunity group based on “limma” method(Figures 4A, B). After excluding abnormal samples and genes with low expression, we conducted WGCNA analysis on the remaining samples to identify clusters of genes associated with NBL immunity. The scale-free network was constructed with an R^2 value greater than 0.85, using a soft threshold power of 5 (Figures 4C, D). Fifteen genetic modules were identified by dynamic cutting tree, among which the MEgreen module displayed the highest positive association with immunity to NBL (L: R = -0.74, p < 0.001; H: R = 0.74, p < 0.001) (Figures 4E–H). After intersecting the sets of differentially expressed genes and MEgreen module genes, a total of 399 differentially expressed genes associated with NBL immunity were identified as candidates for further analysis (Figure 4I).
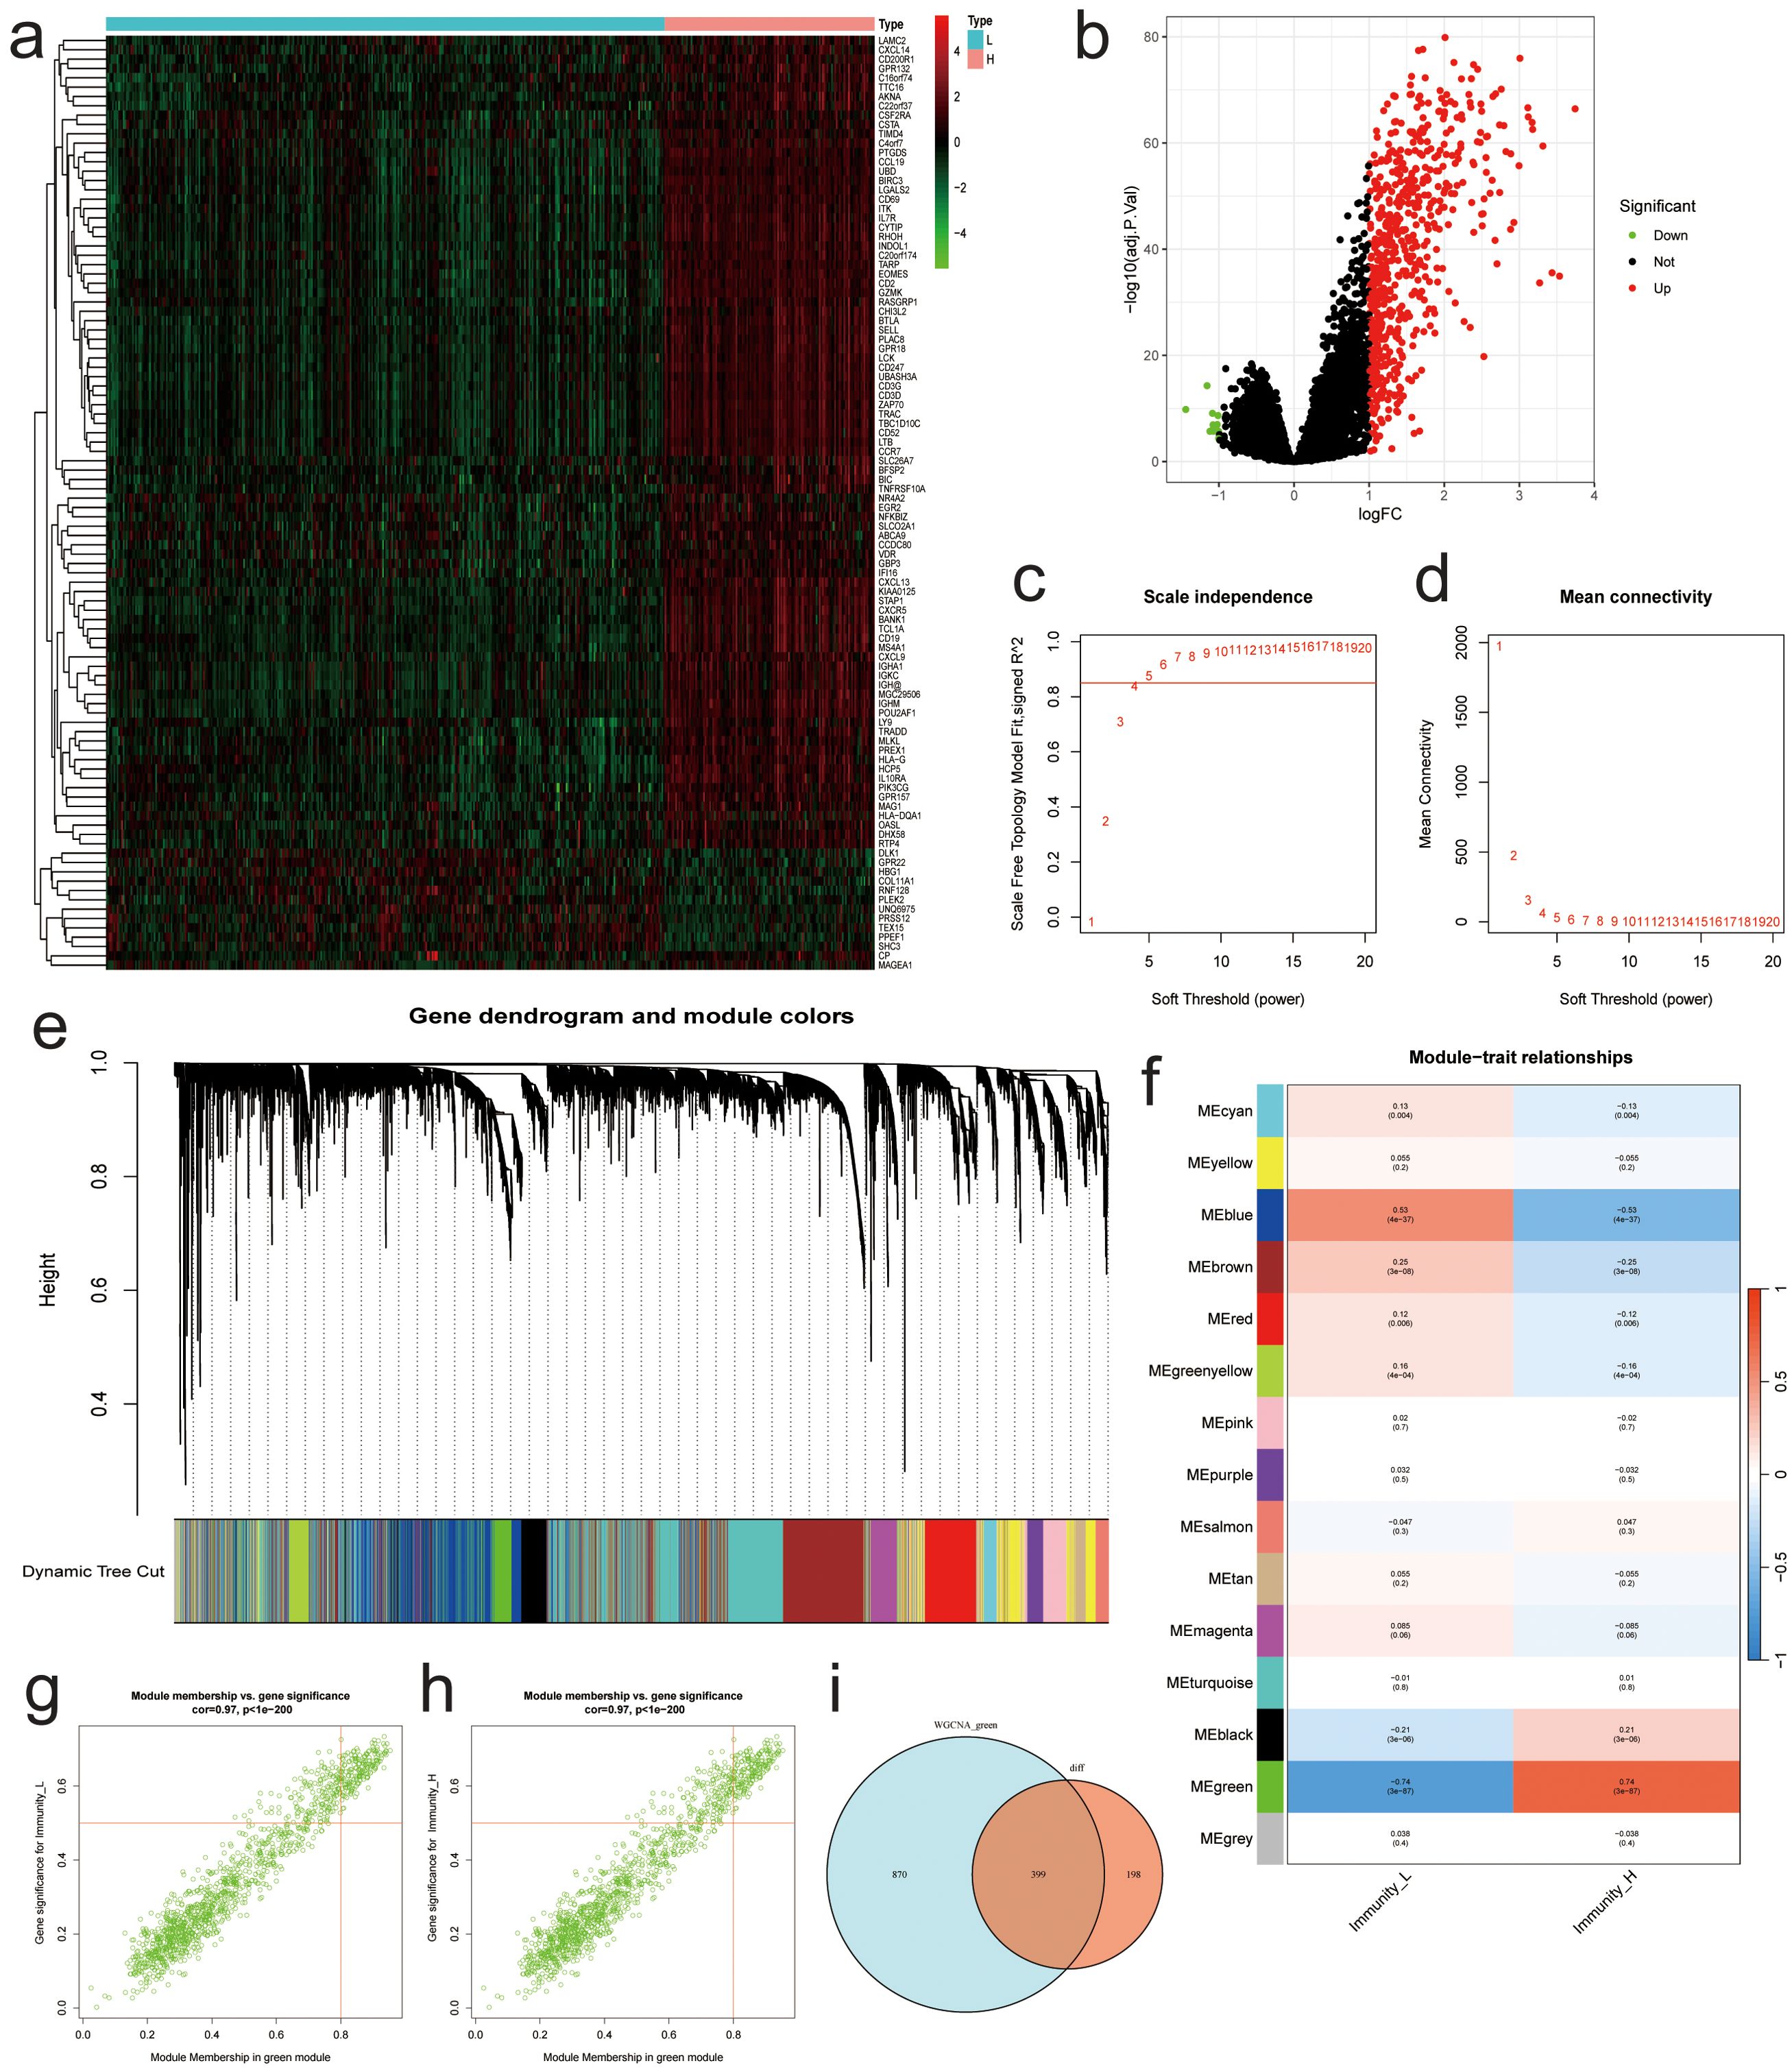
Figure 4. Results of Differential Expression Analysis and WGCNA Analysis. (A) Heatmap of the most significantly differentially expressed genes. (B) Volcano plot of differentially expressed genes. (C) Relationship between β and R^2. (D) Plots of β and mean connectedness. (E) Clustering tree diagram for all genes. (F) Heatmap of the relationship between the characteristic gene modules and immunity. Scatter plots of GS score and MM for each gene in the MEgreen module among (G) low and (H) high immunity groups. (I) Venn diagram showing differentially expressed genes associated with immunity between different groups.
To further investigate the mechanisms that contribute to the different immune conditions in NBL, enrichment analyses of differentially expressed genes that are positively correlated with immunity in NBL were conducted. The GO results based on gene count (Figure 5A) and gene ratio (Figure 5B) revealed that the candidate genes were involved in multiple immune-related biological process pathways (e.g., mononuclear cell differentiation, activation of immune response, immune response−regulating cell surface receptor signaling pathway.) and were present in multiple immune-related cellular components (e.g., alpha-beta T cell receptor complex, T cell receptor complex, immunoglobulin complex.), and the molecular functions involved include, for example, immune receptor activity, cytokine receptor activity, antigen binding. KEGG results based on gene count (Figure 5C) and gene ratio (Figure 5D) also showed that candidate genes were enriched in several immune-related pathways, including Natural killer cell mediated cytotoxicity, Primary immunodeficiency, and Cytokine−cytokine receptor interaction.
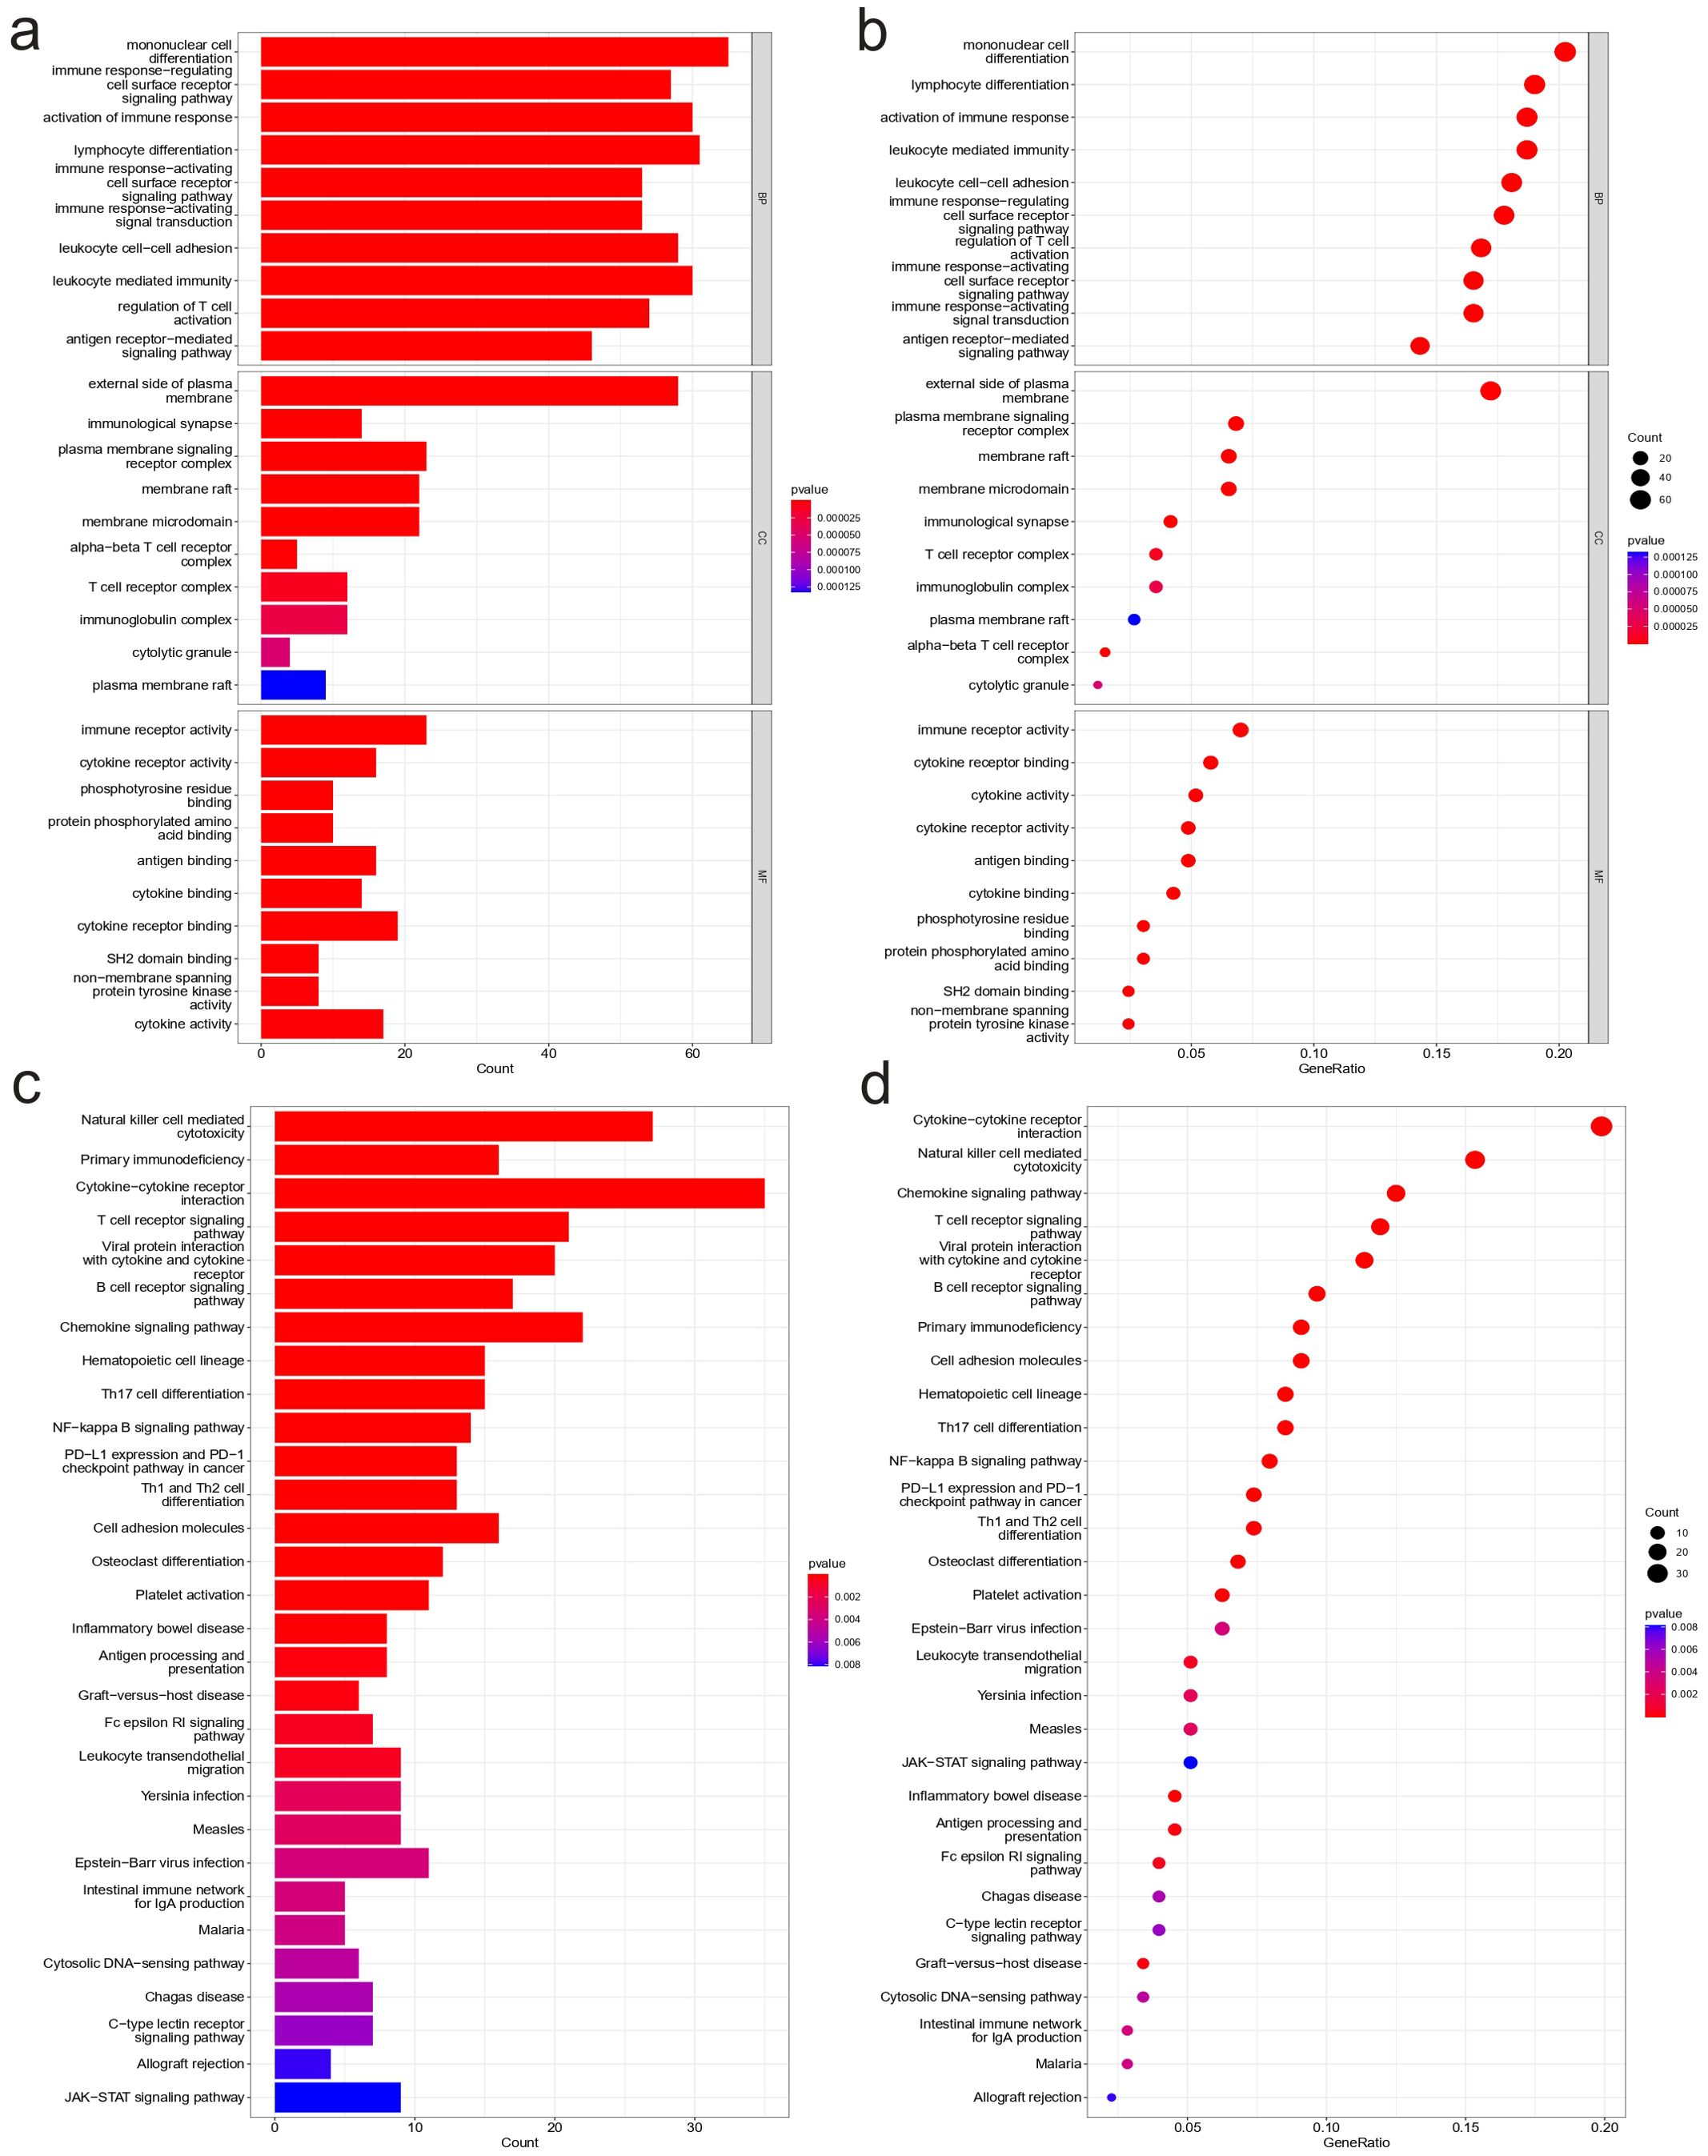
Figure 5. Functional enrichment analysis results. Results of GO analysis: (A) Bar plot based on gene count, (B) Bubble plot based on gene ratio. Results of KEGG analysis: (C) Bar plot based on gene count, (D) Bubble plot based on gene ratio.
Machine learning algorithms were employed to identify characteristic genes associated with NBL immunity among the candidate genes screened through differential expression analysis and WGCNA analysis. A total of 20 genes were identified by the LASSO algorithm, which are IGHM, GPR18, CXCR3, etc (Figures 6A, B). The top 30 genes ranked by Random Forest were TBC1D10C, GPR18, CD247, etc (Figures 6C, D). In the the SVM-RFE algorithm, the error reached its lowest value when the feature count was 40, comprising GPR18, ARHGAP9, C20orf174, etc (Figure 6E). The Venn diagram results (Figure 6F) showed that a total of six overlapping genes (BATF, CXCR3, GIMAP5, GPR18, ISG20, IGHM) were identified by the three machine learning algorithms and all six genes were up-regulated in the high immunity group (Figure 6G).
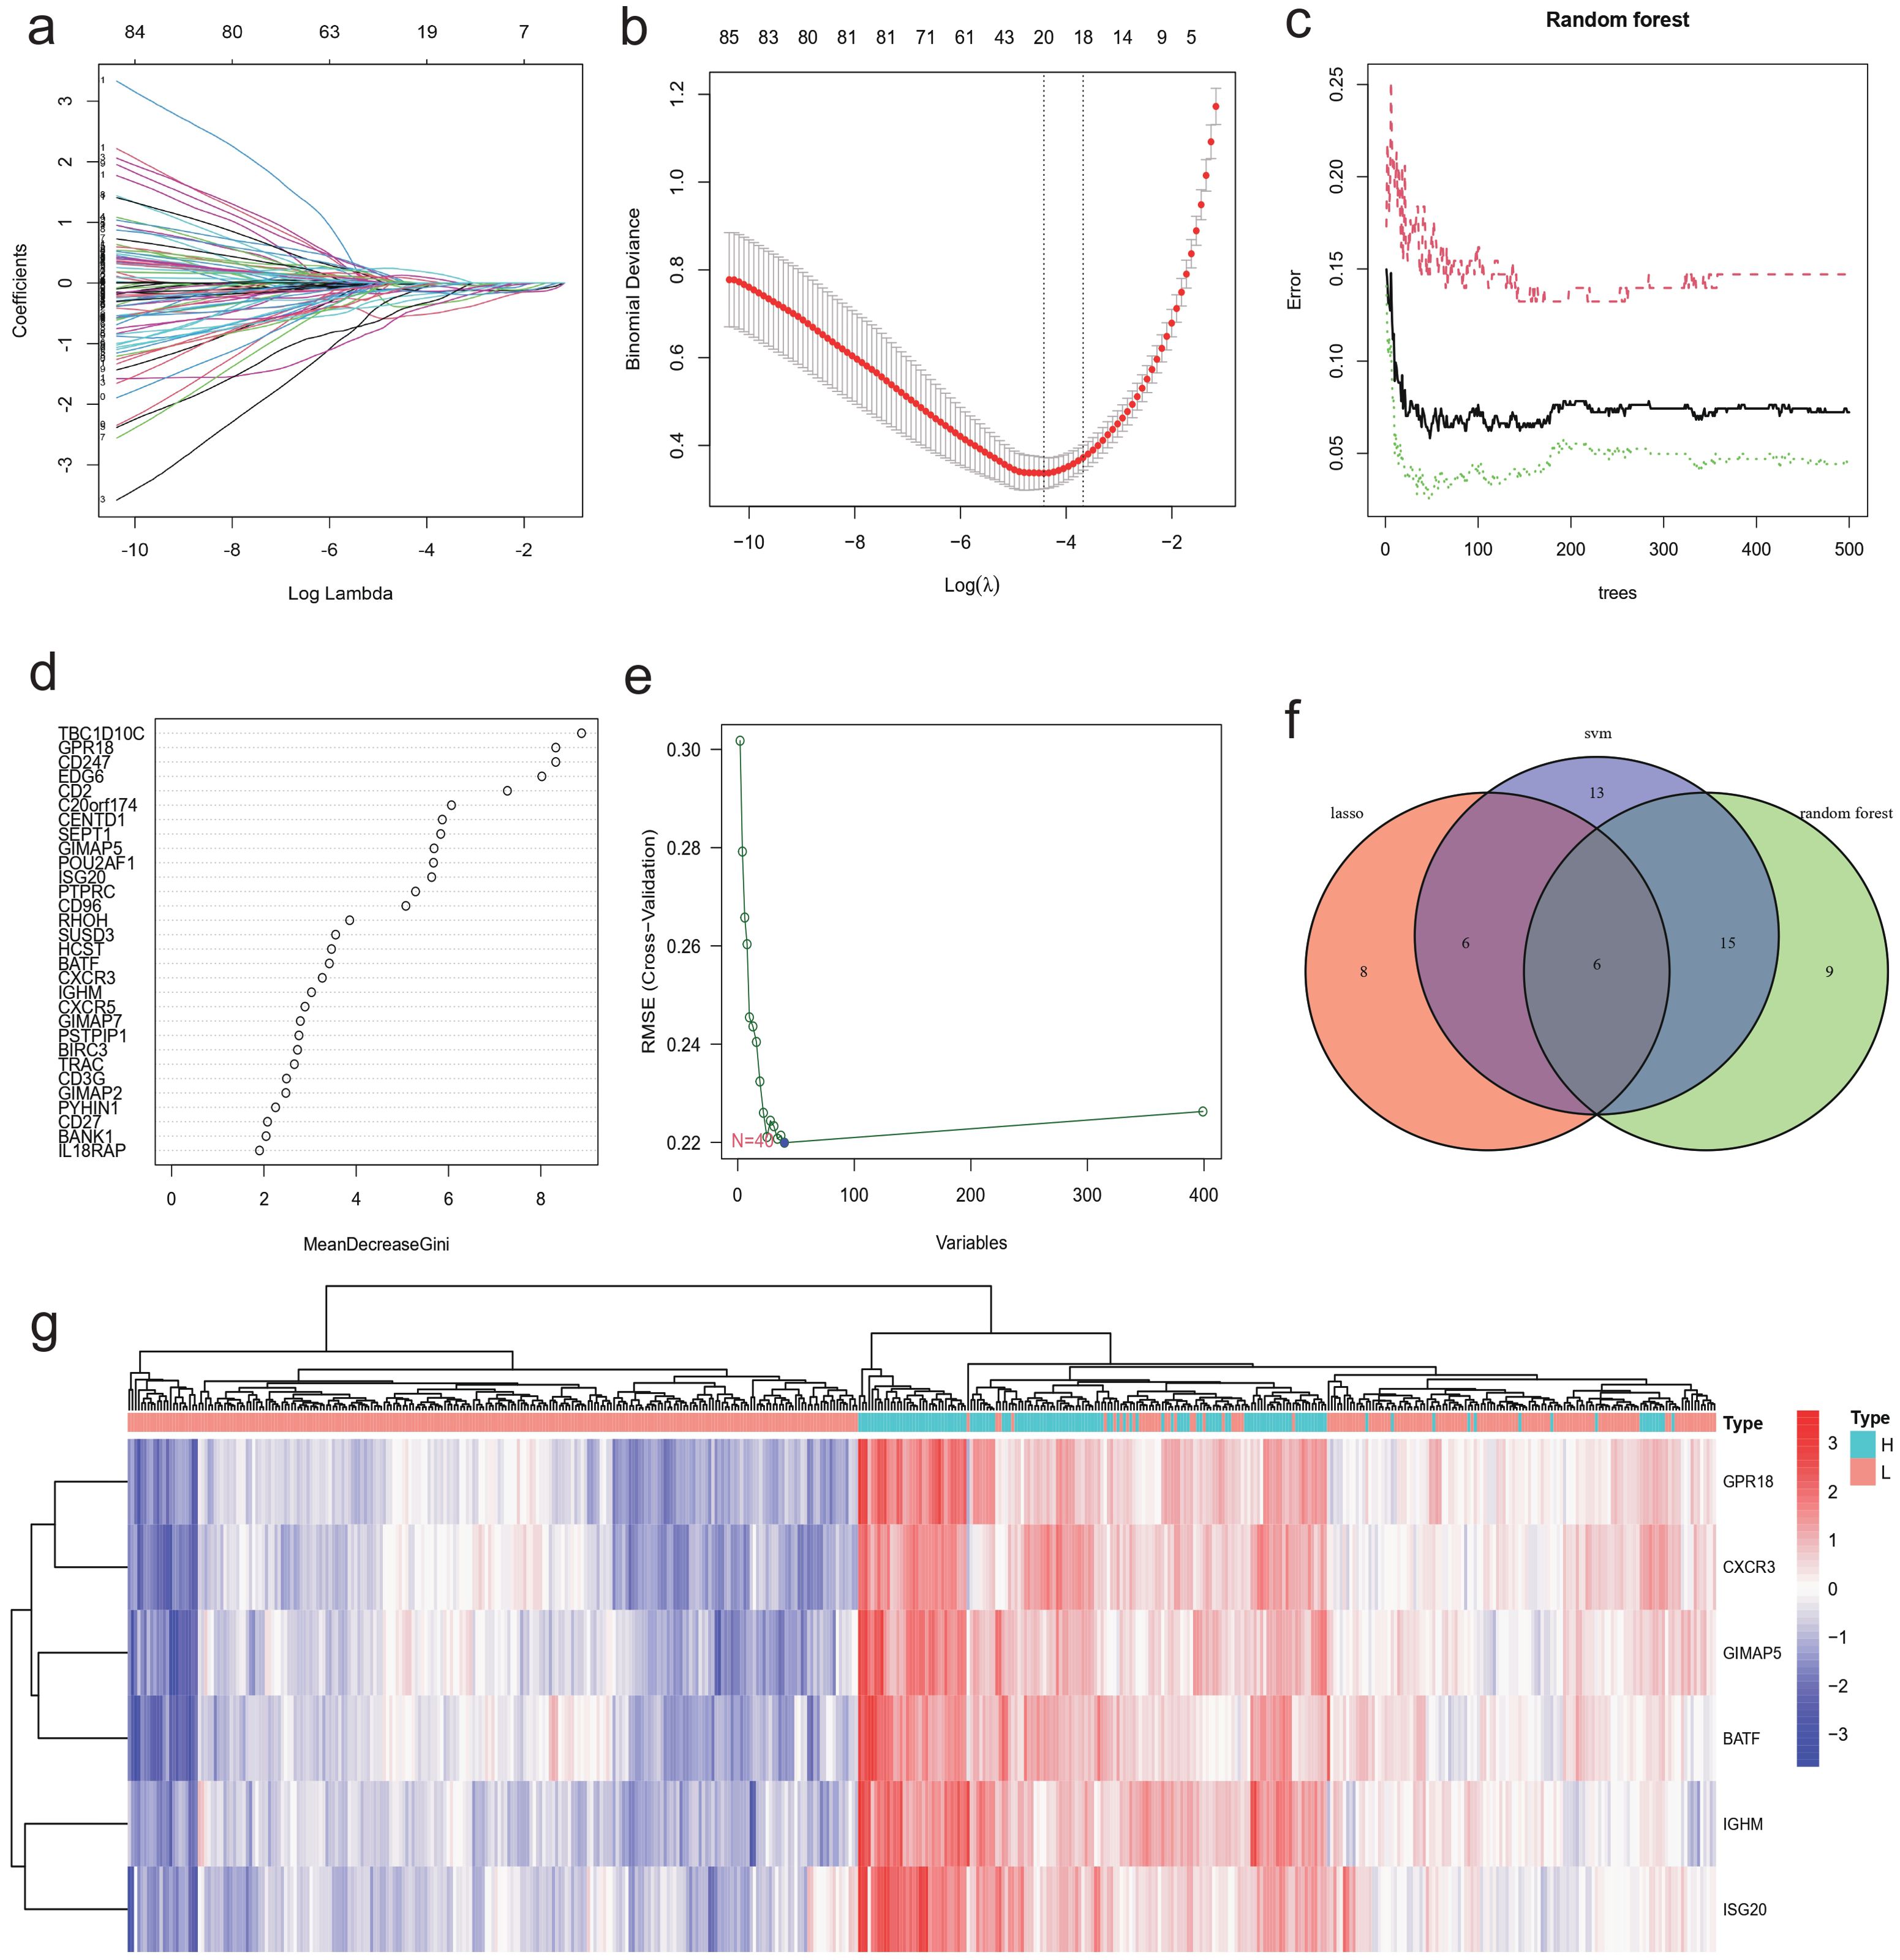
Figure 6. Identification of characteristic gene using machine learning. The Lasso algorithm identified 20 characteristic genes that distinguish the immune levels of NBL: (A) regression coefficients plot, (B) cross-validation plot. Top 30 characteristic genes ranked by random forest algorithm: (C) Out-Of-Bag (OOB) errors against number of trees plot, (D) Feature importance plot. (E) 40 genes were identified by SVM-RFE algorithm. (F) Venn diagram showing the 6 characteristic genes co-identified by LASSO, Random Forest, and SVM-RFE. (G) Heatmap of characteristic genes expression.
First, we analyzed the diagnostic ability of six characteristic genes for immunoclustering of NBL in the training dataset by plotting ROC curves. The analysis results suggested that all six characteristic genes could serve as diagnostic markers for NBL immunoclustering (BATF: AUC: 0.928, 95%CI: 0.905−0.950; CXCR3: AUC: 0.937, 95%CI: 0.913−0.958; GIMAP5: AUC: 0.930, 95%CI: 0.906−0.950; GPR18: AUC: 0.955, 95%CI: 0.935−0.971; ISG20: AUC: 0.937, 95%CI: 0.916−0.956; IGHM: AUC: 0.941, 95%CI: 0.921−0.959, Figures 7A–F). When analyzing the GSE16476 test dataset, all the characteristic genes exhibited the same trend as in the train dataset (BATF: AUC: 0.919, 95%CI: 0.857−0.971; CXCR3: AUC: 0.850, 95%CI: 0.757−0.922; GIMAP5: AUC: 0.944, 95%CI: 0.898−0.980; GPR18: AUC: 0.935, 95%CI: 0.872−0.981; ISG20: AUC: 0.970, 95%CI: 0.932−0.997; IGHM: AUC: 0.950, 95%CI: 0.887−0.994, Figures 7G–L). In addition, when analyzing the GSE19274 test dataset, we found that all genes had satisfactory diagnostic capabilities (BATF: AUC: 0.896, 95%CI: 0.825−0.954; CXCR3: AUC: 0.889, 95%CI: 0.799−0.958; GIMAP5: AUC: 0.940, 95%CI: 0.890−0.980; GPR18: AUC: 0.907, 95%CI: 0.841−0.963; ISG20: AUC: 0.932, 95%CI: 0.884−0.972; Figures 7M–Q) except for IGHM (AUC: 0.522, 95%CI: 0.403−0.638; Figure 7R).
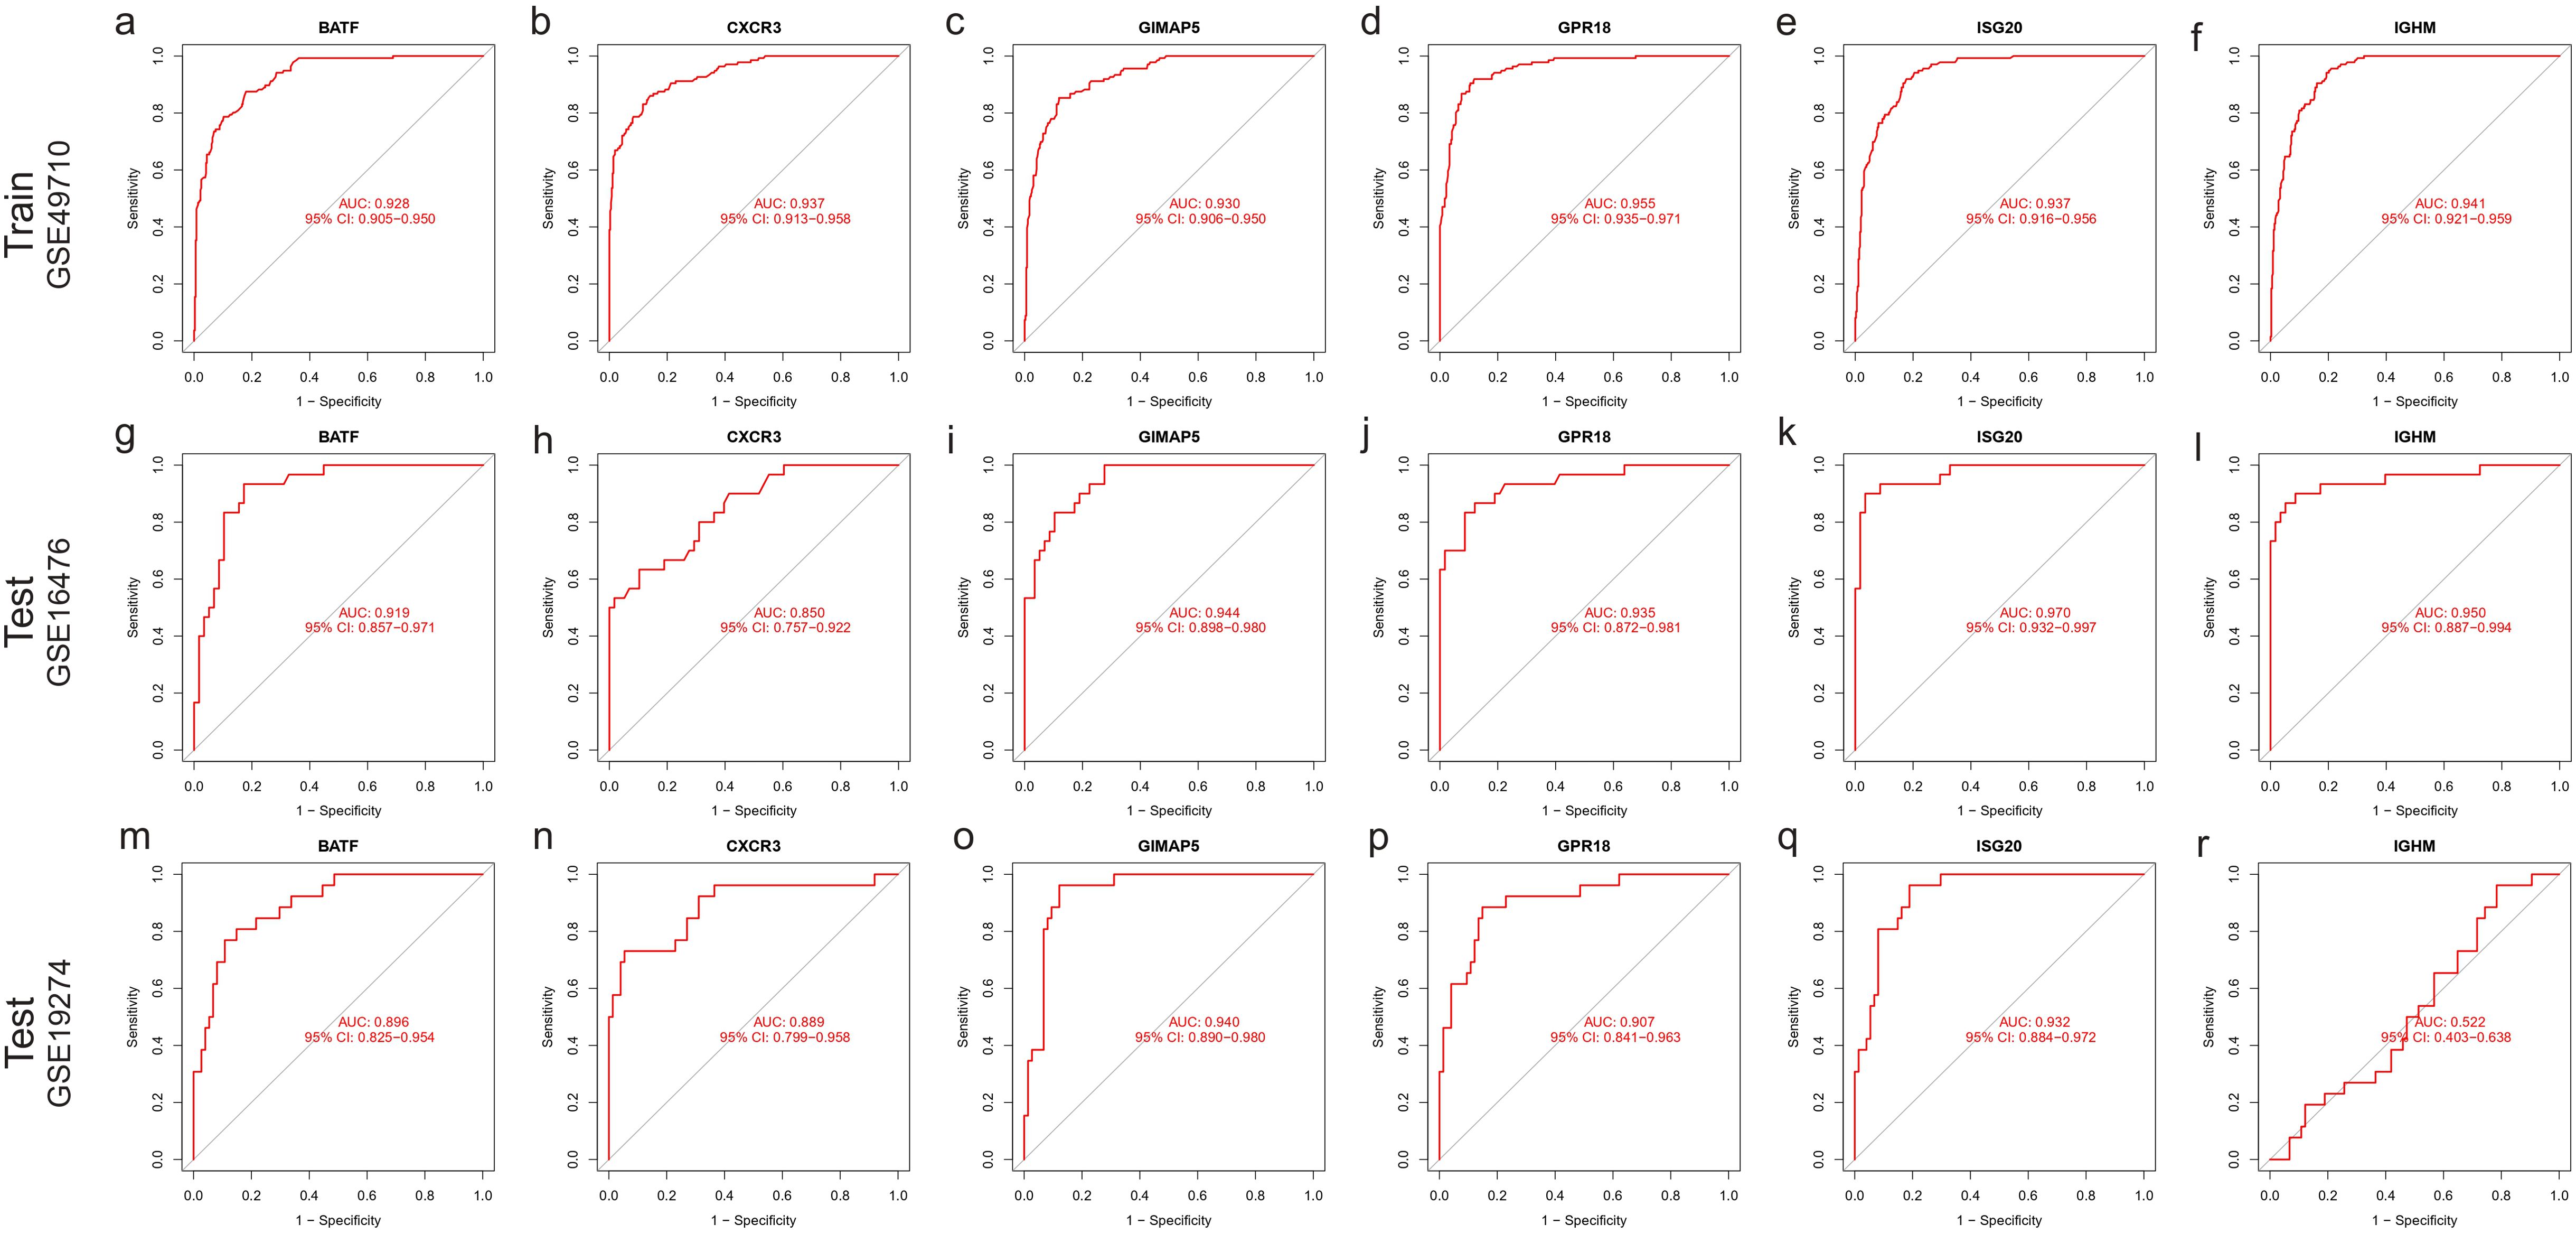
Figure 7. ROC curve of characteristic gene. Train dataset GSE49710: (A) BATF, (B) CXCR3, (C) GIMAP5, (D) GPR18, (E) ISG20, (F) IGHM. Test dataset GSE16476: (G) BATF, (H) CXCR3, (I) GIMAP5, (J) GPR18, (K) ISG20, (L) IGHM; Test dataset GSE16476: (M) BATF, (N) CXCR3, (O) GIMAP5, (P) GPR18, (Q) ISG20, (R) IGHM.
We further analyzed the relationship between six characteristic genes and immune cells in NBL. The analysis revealed that BATF was positively correlated with T cells CD4 memory activated, etc., and negatively correlated with Macrophages M2, etc., (Figure 8A). CXCR3 had a significant positive association with CD4 memory-activated T cells, etc., and a negative association with Mast cells activated, etc., (Figure 8B). GIMAP5 was significantly positively correlated with T cells CD4 memory activated, etc., and negatively correlated with Mast cells activated, etc., (Figure 8C). GPR18 was found to be positively correlated with T cells CD4 memory activated, etc., and negatively correlated with Macrophages M2, etc., (Figure 8D). IGHM was positively correlated with Plasma cells, etc., and negatively correlated with Mast cells activated, etc., (Figure 8E). ISG20 was positively associated with T cells CD4 memory activated, etc., and negatively associated with Macrophages M2, etc., (Figure 8F).
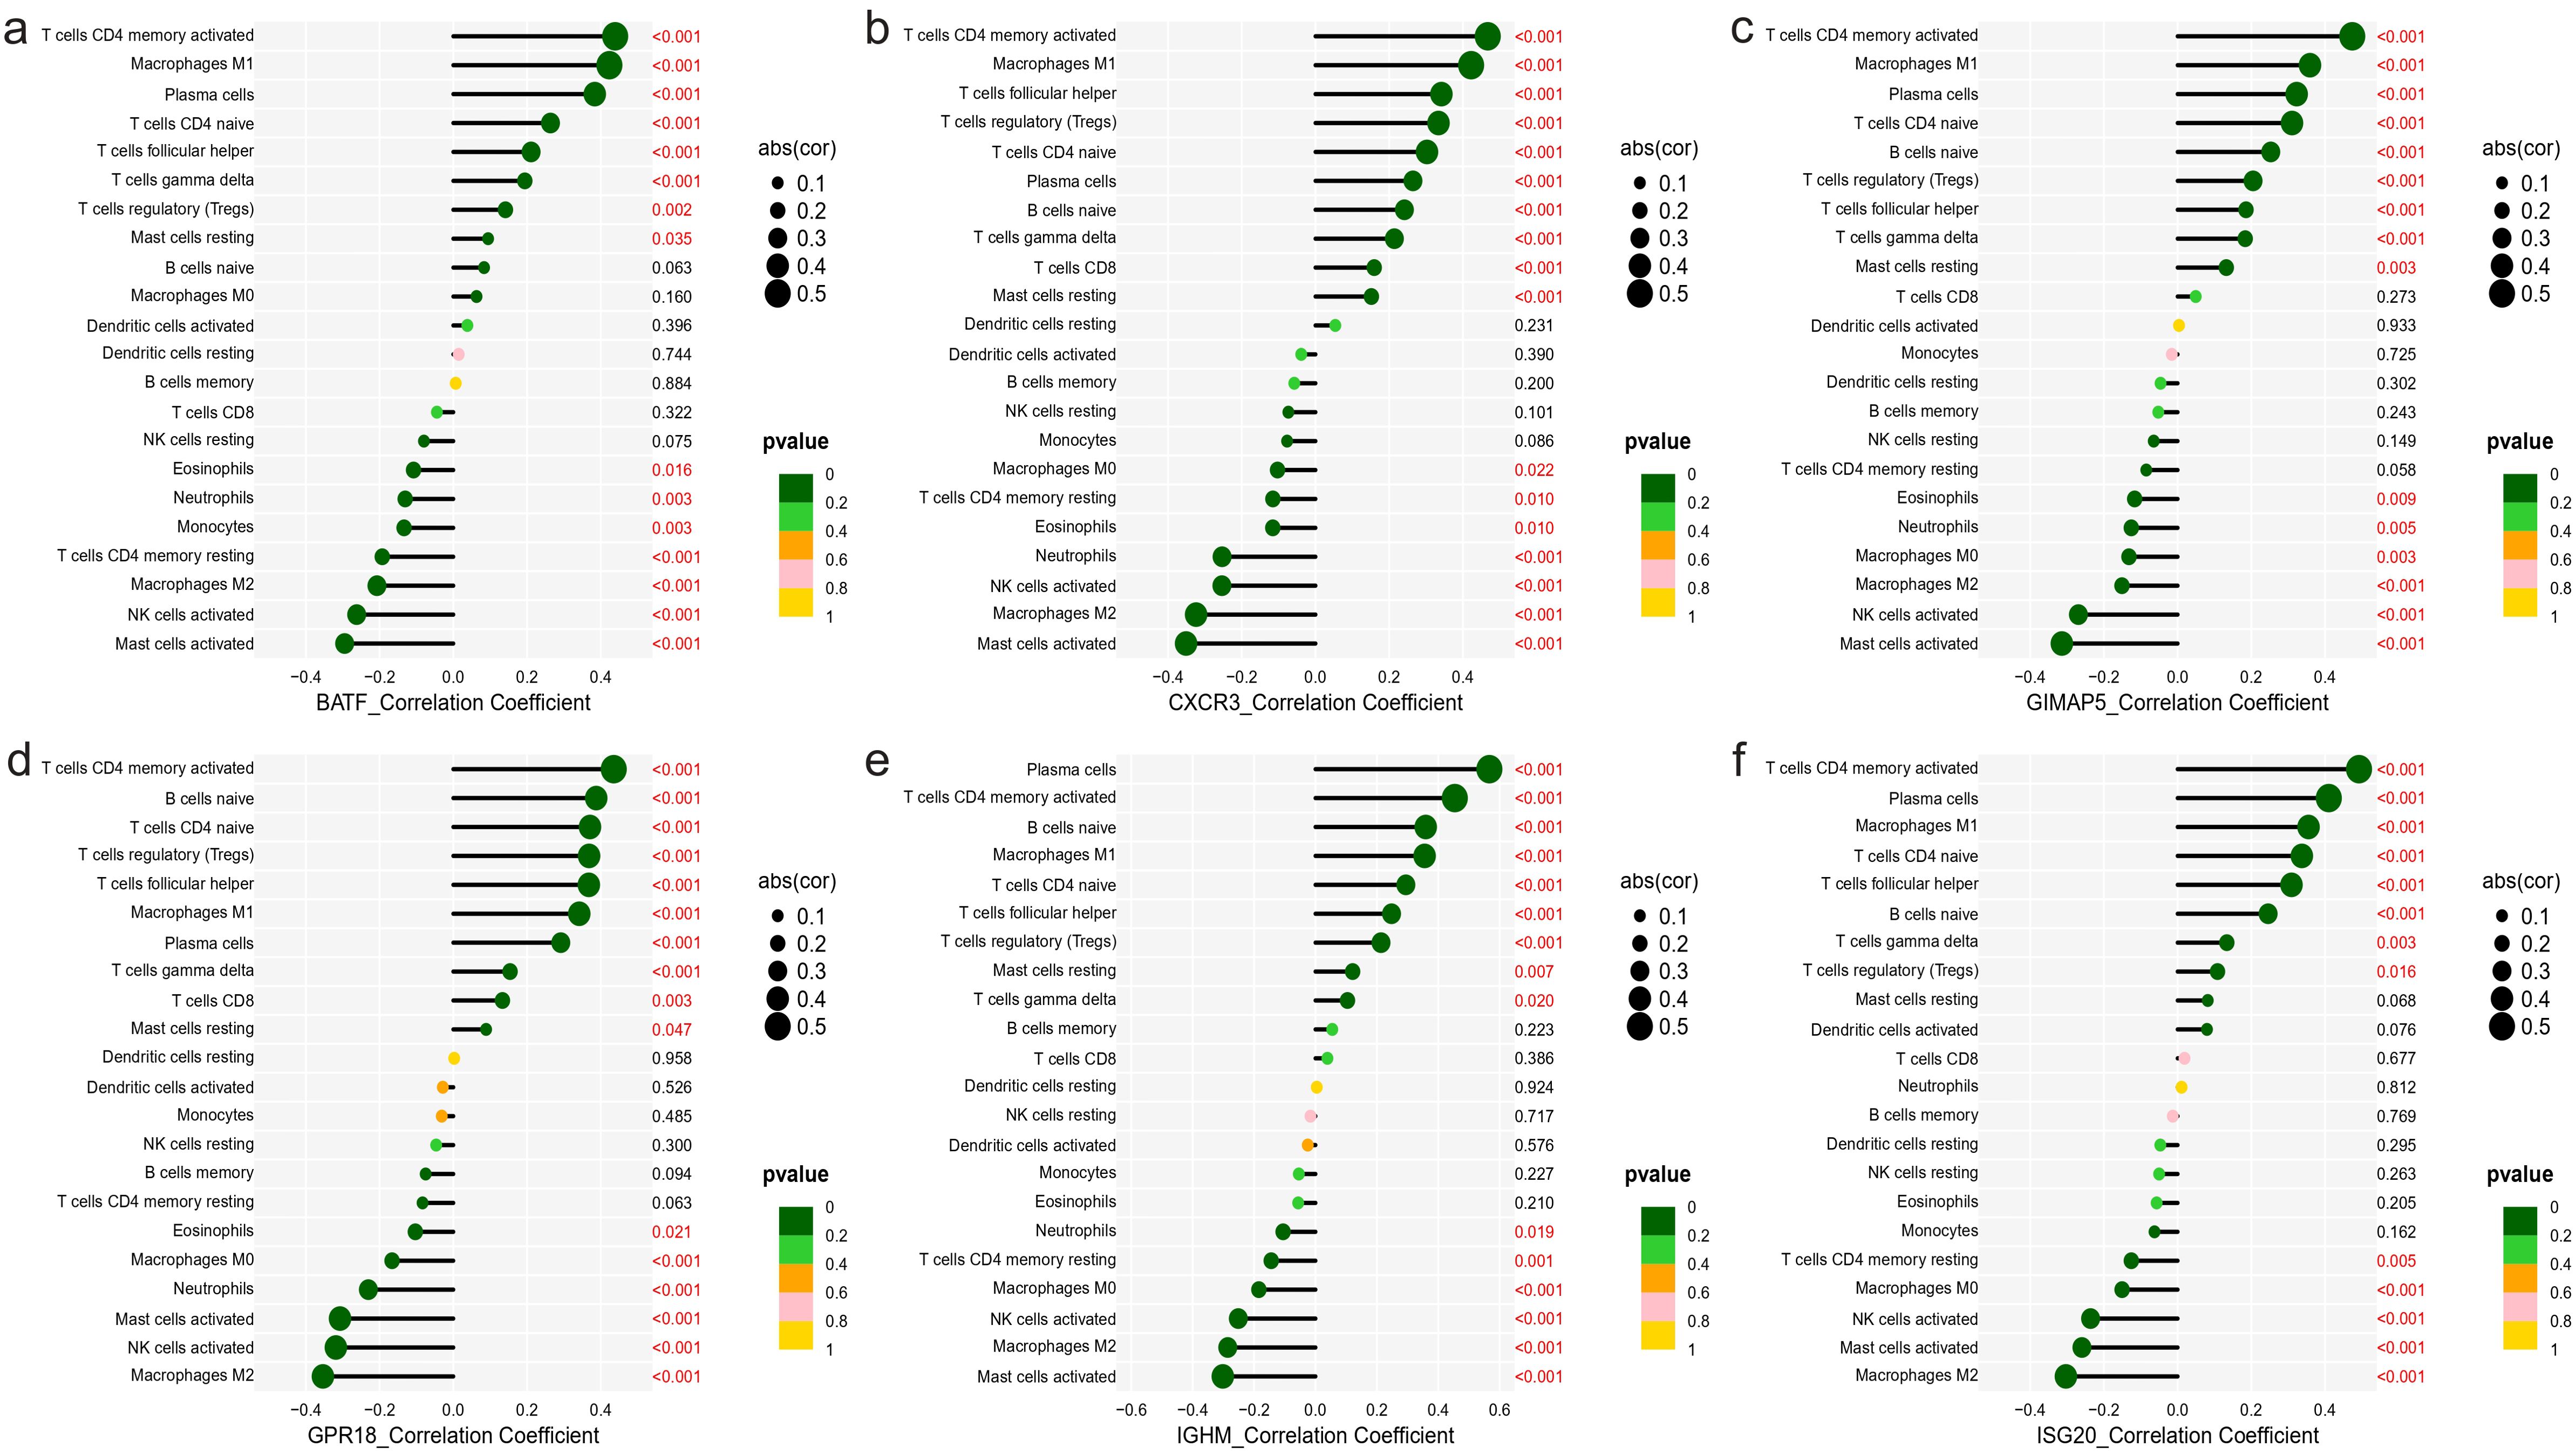
Figure 8. Correlation between characteristic genes and immune cells. (A) BATF, (B) CXCR3, (C) GIMAP5, (D) GPR18, (E) IGHM, (F) ISG20.
In order to better understand the function of the characterized genes in NBL, we divided the training group into high and low expression groups with the median gene expression value as the threshold, and then performed GSEA_GO analysis on the differentially expressed genes among these two groups. We found that these genes participated in various immune-associated pathways (IGHM: ie. antigen receptor−mediated signaling pathway; GPR18: ie. antigen receptor−mediated signaling pathway; CXCR3: ie.immune response−activating cell surface receptor signaling pathway; ISG20: ie. antigen receptor−mediated signaling pathway; GIMAP5: ie. antigen processing and presentation; BATF: ie. antigen receptor−mediated signaling pathway Figure 9).
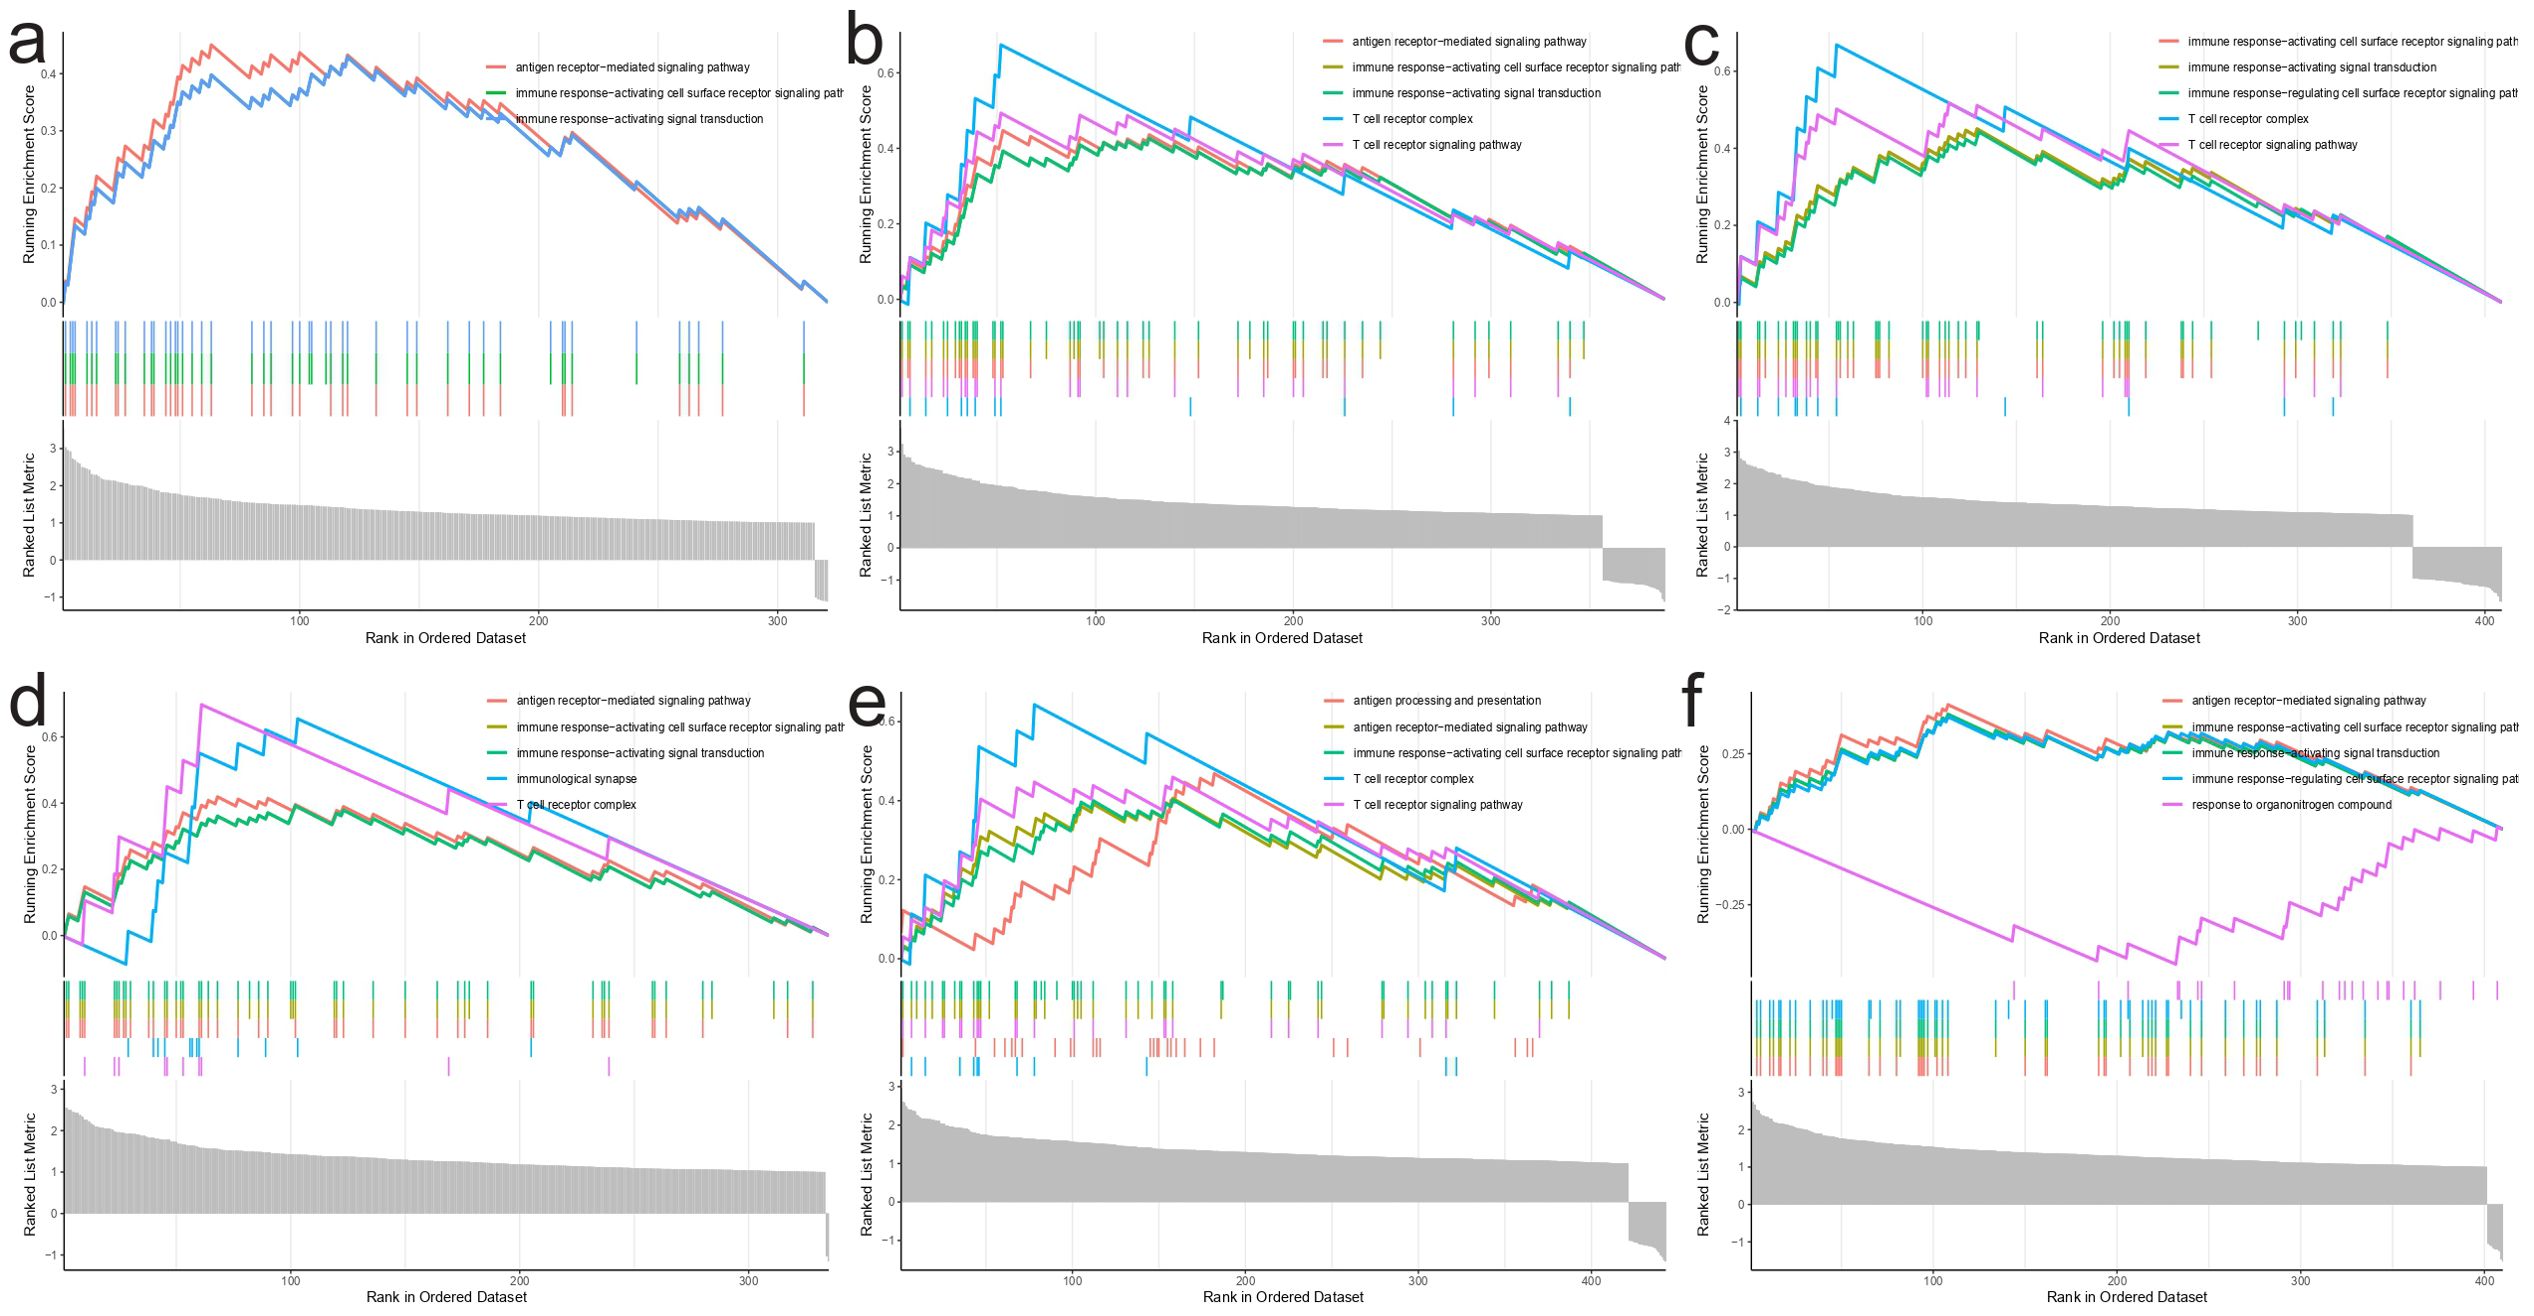
Figure 9. GSEA_GO analysis results. (A) IGHM, (B) GPR18, (C) CXCR3, (D) ISG20, (E) GIMAP5, (F) BATF.
We first analyzed the effect of five characteristic genes on the prognosis of NBL patients (There was no expression information for the IGHM gene in GSE85047 dataset). The Kaplan-Meier curve demonstrated that increased expression of the ISG20 gene was negatively associated with the prognosis of NBL patients (OS: P=0.036, PFS: P=0.022). There is no association between the expression of five other characterized genes and the survival of NBL patients (Supplementary Figure S1). In addition, we analyzed the correlation between immune-related characteristic genes and clinicopathological features of NBL based on training dataset (GSE49710). The results indicated that IGHM was highly expressed in female patients (Supplementary Figure S2A), while CXCR3 and GPR18 were highly expressed in patients younger than 1.5 years (Supplementary Figure S2B). We subsequently investigated the relationship between the state of MYCN, an independent prognosticator of NBL, and the expression of characteristic genes. The results showed that all the characteristic genes were downregulated in NBL patients with MYCN amplification (Supplementary Figure S2C). BATF, CXCR3, GIMAP5, GPR18, IGHM have lower expression in high-risk neuroblastoma patients (Supplementary Figure S2D). Except for IGHM and ISG20, the other characteristic genes were associated with NBL INSS stage, and class label (Supplementary Figures S2E, F). We also found that CXCR3 and GPR18 were downregulated in NBL patients with progression (Supplementary Figure S2G).
The relationship between NBL and immunity is a complex and intricate one, due to the unique challenges posed by the cold tumor microenvironment of NBL (42). Although considered cold tumors, certain subgroups of NBL exhibit high immune infiltration, possibly due to variations in genetic or epigenetic factors, immune cell composition, and tumor microenvironment (43). These differences underscore the importance of identifying diagnostic biomarkers for effective patient stratification and personalized treatment strategies. Immunotherapy, which leverages the immune system to recognize and destroy cancer cells, has emerged as a promising treatment option for various cancers (44). However, its efficacy in NBL remains suboptimal, necessitating further investigation into the underlying mechanisms and potential therapeutic targets (45).
In this study, we analyzed data from the GEO database and performed immunophenotyping using the ssGSEA method to gain insights into the immune landscape of NBL. We employed machine learning algorithms to screen six genes, BATF, CXCR3, GIMAP5, GPR8, IGHM, and ISG20, that have been extensively investigated in other cancers, including lymphoma, melanoma, leukemia, breast cancer, multiple myeloma, hepatocellular carcinoma, and lung cancer. Despite their diagnostic value and clinical significance in other cancers, the roles of these biomarkers in NBL remain largely unexplored.
Our study delved into the functions and associations of these biomarkers with specific immune cell populations in NBL. We found that these biomarkers were mainly positively correlated with tumor-resistant immune cells (e.g., T cells, macrophages M1, etc.) and negatively correlated with tumor-promoting immune cells (e.g., macrophages M2, etc.) (46). This suggests that these biomarkers may play a crucial role in shaping the immune landscape in NBL, ultimately influencing the balance between antitumor immunity and immune evasion. For instance, BATF has been studied extensively in lymphoma and melanoma and is known to regulate T helper (Th) cell differentiation and immune responses (47, 48). In NBL, BATF might regulate Th cell differentiation, thereby shaping the immune landscape and influencing the immune response against tumor cells. CXCR3, which has been investigated in various cancers, including colorectal cancer, melanoma, and renal cell carcinoma, directs the migration of immune cells to the tumor site and has been associated with prognosis (49, 50). CXCR3 might contribute to recruiting cytotoxic T cells and natural killer cells to the tumor microenvironment, thus enhancing the immune response against NBL cells and affecting tumor growth and metastasis (51). GIMAP5 has been linked to the survival and homeostasis of lymphocytes and may influence the clinical outcome in leukemia (52). GIMAP5 might regulate T cell development and function within the tumor microenvironment, possibly affecting the survival and function of immune cells and the overall immune response against NBL cells (53). GPR8, which has been linked to the regulation of cell growth and proliferation in breast cancer, might regulate signaling pathways crucial for cancer cell survival and metastasis, as well as influence the immune microenvironment by modulating immune cell recruitment and activation in NBL (54, 55). IGHM, associated with B-cell receptor signaling, might modulate the immune response by promoting B cell activation and antibody production in NBL, which could influence tumor progression and response to therapy (56, 57). Lastly, ISG20, which has been studied in hepatocellular carcinoma and lung cancer, may play a role in modulating the type I interferon response and activating immune cells crucial for antitumor immunity in NBL (58, 59).
Current treatment options for NBL, such as chemotherapy, radiation therapy, and immunotherapy, often result in suboptimal prognosis (60). Precision medicine and effective patient stratification are essential for improving therapeutic outcomes. Our study found that treatment effectiveness in NBL patients was highly correlated with the level of immune infiltration, emphasizing the importance of understanding the immune landscape in NBL for better patient management. Moreover, we conducted drug sensitization analyses that could potentially inform personalized treatment strategies for patients. In addition to conventional chemotherapy, immunotherapy has shown promise in other solid tumors. For example, pembrolizumab, a PD-1 inhibitor, has significantly prolonged survival in non-small cell lung cancer (60). This success has been attributed to the targeting of immune checkpoint molecules, such as PD-1, which play a crucial role in regulating immune responses and maintaining self-tolerance (61). Pembrolizumab has become a mature second-line drug in clinical guidelines for non-small cell lung cancer, and numerous meta-analyses and systematic reviews have shown clear evidence of its ability to prolong survival compared to other treatments (62). However, the development of immunotherapy in NBL is less advanced compared to other solid tumors, such as gastric cancer and lung cancer. The identification of novel immunotherapeutic targets and strategies is crucial for improving treatment outcomes in NBL. Our study contributes to the growing body of evidence supporting the potential of immunotherapy in NBL by exploring the immune landscape and identifying potential diagnostic biomarkers. These findings provide a foundation for future research and the development of more effective and targeted treatments for this devastating pediatric cancer.
In conclusion, this study underscores the importance of understanding the relationship between NBL and immunity, and the potential role of immunotherapy as a treatment option. By analyzing the immune landscape of NBL, we identified six genes - BATF, CXCR3, GIMAP5, GPR8, IGHM, and ISG20-with diagnostic and clinical significance in other cancers, but whose roles in NBL remain largely unexplored. Our research delved into the functions and associations of these biomarkers with specific immune cell populations in NBL, uncovering positive correlations with immune-positive cells and negative correlations with immune-negative cells. Furthermore, our findings suggest that the level of immune infiltration is crucial for treatment effectiveness in NBL patients, and drug sensitization analyses may aid in developing personalized treatment strategies.
The original contributions presented in the study are included in the article/Supplementary Material. Further inquiries can be directed to the corresponding authors.
Ethical review and approval was not required for the study on human participants in accordance with the local legislation and institutional requirements. Written informed consent from the patients/participants OR patients/participants legal guardian/next of kin was not required to participate in this study in accordance with the national legislation and the institutional requirements.
LZ: Writing – original draft. HL: Writing – original draft. FS: Writing – review & editing. QW: Writing – original draft. LJ: Writing – review & editing. AX: Writing – review & editing. JC: Writing – review & editing. RY: Writing – review & editing.
The author(s) declare financial support was received for the research, authorship, and/or publication of this article. This work was supported by Hong Kong Research Grants Council/Area of Excellence (AoE/M/707-18), Shenzhen-Hong Kong-Macau Science and Technology Program Category C (SGDX20210823103537031), General Research Fund (17125022) and National Natural Science Foundation of China (81800754).
The authors declare that the research was conducted in the absence of any commercial or financial relationships that could be construed as a potential conflict of interest.
All claims expressed in this article are solely those of the authors and do not necessarily represent those of their affiliated organizations, or those of the publisher, the editors and the reviewers. Any product that may be evaluated in this article, or claim that may be made by its manufacturer, is not guaranteed or endorsed by the publisher.
The Supplementary Material for this article can be found online at: https://www.frontiersin.org/articles/10.3389/fimmu.2024.1446273/full#supplementary-material
Supplementary Figure 1 | Effects of characteristic gene expression on survival in NBL patients using Kaplan-Meier curve analysis. OS: (A) BATF, (B) CXCR3, (C) GIMAP5, (D) GPR18, (E) ISG20. PFS: (F) BATF, (G) CXCR3, (H) GIMAP5, (I) GPR18, (J) ISG2.
Supplementary Figure 2 | Relationship between the expression of characteristic genes and clinicopathologic features of NBL. (A) Sex, (B) Age, (C) MYCN status, (D) High risk, (E) INSS stage, (F) Class label, (G) Progression. (Note: High risk: Clinically considered as high-risk neuroblastoma. INSS stage: disease stage according to INSS. Class label: Maximally divergent disease courses - Favorable: patient survived without chemotharapy for at least 1000 days post diagnosis; Unfavorable: patient died despite intensive chemotherapy. Progression: Occurrence of a tumor progression event).
NBL, Neuroblastoma; MDT, Multi-disciplinary Team; HIM, Holistic Integrative Medicine; INRG, International NBL Risk Group; INSS, International Neuroblastoma Staging System; TME, Tumor Microenvironment; TIME, Tumor Immune Microenvironment; ssGSEA, single-sample Gene Set Enrichment Analysis; t-SNE, t-distribution Stochastic Neighbor Embedding; ESTIMATE, Estimation of STromal and Immune cells in MAlignant Tumor tissues using Expression data; CIBERSORT, Cell-type Identification By Estimating Relative Subsets Of RNA Transcripts; SVR, Support Vector Regression; TIIC, Tumor-Infiltrating Immune Cell; GDSC2, Genomics of Drug Sensitivity in Cancer 2; DEGs, Differentially Expressed Genes FDR, False Discovery Rate; FC, Fold Change; WGCNA, Weighted Gene Co-Expression Network Analysis; GO, Gene Ontology; KEGG, Kyoto Encyclopedia of Genomes; GSEA, Gene Set Enrichment Analysis; LASSO, Least Absolute Shrinkage and Selection Operator; SVM-RFE, Support Vector Machine Recursive Feature Elimination; SVMs, Support Vector Machines; AUC, Area Under the Curve; ROC, receiver operating characteristic; OS, Overall Survival; PFS, Profression Free Survival; M ± SD, Mean ± Standard Deviation.
1. Maris JM. Recent advances in neuroblastoma. N Engl J Med. (2010) 362:2202–11. doi: 10.1056/NEJMra0804577
2. Matthay KK, Maris JM, Schleiermacher G, Nakagawara A, Mackall CL, Diller L, et al. Neuroblastoma. Nat Rev Dis Primers. (2016) 2:16078. doi: 10.1038/nrdp.2016.78
3. Heck JE, Ritz B, Hung RJ, Hashibe M, Boffetta P. The epidemiology of neuroblastoma: a review. Paediatr Perinat Epidemiol. (2009) 23:125–43. doi: 10.1111/j.1365-3016.2008.00983.x
4. Mossé YP, Laudenslager M, Longo L, Cole KA, Wood A, Attiyeh EF, et al. Identification of ALK as a major familial neuroblastoma predisposition gene. Nature. (2008) 455:930–5. doi: 10.1038/nature07261
5. Seeger RC, Brodeur GM, Sather H, Dalton A, Siegel SE, Wong KY, et al. Association of multiple copies of the N-myc oncogene with rapid progression of neuroblastomas. N Engl J Med. (1985) 313:1111–6. doi: 10.1056/NEJM198510313131802
6. Trochet D, Bourdeaut F, Janoueix-Lerosey I, Deville A, de Pontual L, Schleiermacher G, et al. Germline mutations of the paired-like homeobox 2B (PHOX2B) gene in neuroblastoma. Am J Hum Genet. (2004) 74:761–4. doi: 10.1086/383253
7. Franks LM, Bollen A, Seeger RC, Stram DO, Matthay KK. Neuroblastoma in adults and adolescents: an indolent course with poor survival. Cancer. (1997) 79:2028–35. doi: 10.1002/(SICI)1097-0142(19970515)79:10<2028::AID-CNCR26>3.0.CO;2-V
8. Bagatell R, DuBois SG, Naranjo A, Belle J, Goldsmith KC, Park JR, et al. Children’s Oncology Group’s 2023 blueprint for research: Neuroblastoma. Pediatr Blood Cancer. (2023) 70:e30572. doi: 10.1002/pbc.30572
9. Bansal D, Totadri S, Chinnaswamy G, Agarwala S, Vora T, Arora B, et al. Management of neuroblastoma: ICMR consensus document. Indian J Pediatr. (2017) 84:446–55. doi: 10.1007/s12098-017-2298-0
10. Monclair T, Brodeur GM, Ambros PF, Brisse HJ, Cecchetto G, Holmes K, et al. The International NB Risk Group (INRG) staging system: an INRG Task Force report. J Clin Oncol. (2009) 27:298–303. doi: 10.1200/JCO.2008.16.6876
11. Brodeur GM, Pritchard J, Berthold F, Carlsen NL, Castel V, Castelberry RP, et al. Revisions of the international criteria for NB diagnosis, staging, and response to treatment. J Clin Oncol. (1993) 11:1466–77. doi: 10.1200/JCO.1993.11.8.1466
12. Bagatell R, Beck-Popovic M, London WB, Zhang Y, Pearson AD, Matthay KK, et al. Significance of MYCN amplification in international Neuroblastoma staging system stage 1 and 2 Neuroblastoma: a report from the International Neuroblastoma Risk Group database. J Clin Oncol. (2009) 27:365–70. doi: 10.1200/JCO.2008.17.9184
13. Quail DF, Joyce JA. Microenvironmental regulation of tumor progression and metastasis. Nat Med. (2013) 19:1423–37. doi: 10.1038/nm.3394
14. Baghban R, Roshangar L, Jahanban-Esfahlan R, Seidi K, Ebrahimi-Kalan A, Jaymand M, et al. Tumor microenvironment complexity and therapeutic implications at a glance. Cell Commun Signal. (2020) 18:59. doi: 10.1186/s12964-020-0530-4
15. Chew V, Toh HC, Abastado JP. Immune microenvironment in tumor progression: characteristics and challenges for therapy. J Oncol. (2012) 2012:608406. doi: 10.1155/2012/608406
16. Chen DS, Mellman I. Oncology meets immunology: the cancer-immunity cycle. Immunity. (2013) 39:1–10. doi: 10.1016/j.immuni.2013.07.012
17. Franciszkiewicz K, Boissonnas A, Boutet M, Combadière C, Mami-Chouaib F. Role of chemokines and chemokine receptors in shaping the effector phase of the antitumor immune response. Cancer Res. (2012) 72:6325–32. doi: 10.1158/0008-5472.CAN-12-2027
18. Lv B, Wang Y, Ma D, Cheng W, Liu J, Yong T, et al. Immunotherapy: reshape the tumor immune microenvironment. Front Immunol. (2022) 13:844142. doi: 10.3389/fimmu.2022.844142
19. Bandola-Simon J, Roche PA. Dysfunction of antigen processing and presentation by dendritic cells in cancer. Mol Immunol. (2019) :113:31–37. doi: 10.1016/j.molimm.2018.03.025
20. Boussiotis VA. Molecular and biochemical aspects of the PD-1 checkpoint pathway. N Engl J Med. (2016) 375:1767–78. doi: 10.1056/NEJMra1514296
21. Sun D, Liu J, Zhou H, Shi M, Sun J, Zhao S, et al. Classification of tumor immune microenvironment according to programmed death-ligand 1 expression and immune infiltration predicts response to immunotherapy plus chemotherapy in advanced patients with NSCLC. J Thorac Oncol. (2023) 18:869–81. doi: 10.1016/j.jtho.2023.03.012
22. Hamada T, Soong TR, Masugi Y, Kosumi K, Nowak JA, da Silva A, et al. TIME (Tumor Immunity in the MicroEnvironment) classification based on tumor CD274 (PD-L1) expression status and tumor-infiltrating lymphocytes in colorectal carcinomas. Oncoimmunology. (2018) 7:e1442999. doi: 10.1080/2162402X.2018.1442999
23. Zeng L, Xu H, Li SH, Xu SY, Chen K, Qin LJ, et al. Cross-cohort analysis identified an immune checkpoint-based signature to predict the clinical outcomes of neuroblastoma. J Immunother Cancer. (2023) 11:e005980. doi: 10.1136/jitc-2022-005980
24. Yi M, Nissley DV, McCormick F, Stephens RM. ssGSEA score-based Ras dependency indexes derived from gene expression data reveal potential Ras addiction mechanisms with possible clinical implications. Sci Rep. (2020) 10:10258. doi: 10.1038/s41598-020-66986-8
25. Hänzelmann S, Castelo R, Guinney J. GSVA: gene set variation analysis for microarray and RNA-seq data. BMC Bioinf. (2013) 14:7. doi: 10.1186/1471-2105-14-7
26. Witten DM, Tibshirani R. A framework for feature selection in clustering. J Am Stat Assoc. (2010) 105:713–26. doi: 10.1198/jasa.2010.tm09415
27. Abdelmoula WM, Balluff B, Englert S, Dijkstra J, Reinders MJ, Walch A, et al. Data-driven identification of prognostic tumor subpopulations using spatially mapped t-SNE of mass spectrometry imaging data. Proc Natl Acad Sci U S A. (2016) 113:12244–9. doi: 10.1073/pnas.1510227113
28. Yoshihara K, Shahmoradgoli M, Martínez E, Vegesna R, Kim H, Torres-Garcia W, et al. Inferring tumour purity and stromal and immune cell admixture from expression data. Nat Commun. (2013) 4:2612. doi: 10.1038/ncomms3612
29. Scire J, Huisman JS, Grosu A, Angst DC, Lison A, Li J, et al. estimateR: an R package to estimate and monitor the effective reproductive number. BMC Bioinf. (2023) 24:310. doi: 10.1186/s12859-023-05428-4
30. Chen B, Khodadoust MS, Liu CL, Newman AM, Alizadeh AA. Profiling tumor infiltrating immune cells with CIBERSORT. Methods Mol Biol. (2018) 1711:243–59. doi: 10.1007/978-1-4939-7493-1_12
31. Newman AM, Liu CL, Green MR, Gentles AJ, Feng W, Xu Y, et al. Robust enumeration of cell subsets from tissue expression profiles. Nat Methods. (2015) 12:453–7. doi: 10.1038/nmeth.3337
32. Maeser D, Gruener RF, Huang RS. oncoPredict: an R package for predicting in vivo or cancer patient drug response and biomarkers from cell line screening data. Brief Bioinform. (2021) 22:bbab260. doi: 10.1093/bib/bbab260
33. Ritchie ME, Phipson B, Wu D, Hu Y, Law CW, Shi W, et al. limma powers differential expression analyses for RNA-sequencing and microarray studies. Nucleic Acids Res. (2015) 43:e47. doi: 10.1093/nar/gkv007
34. Langfelder P, Horvath S. WGCNA: an R package for weighted correlation network analysis. BMC Bioinf. (2008) 9:559. doi: 10.1186/1471-2105-9-559
35. Yu G, Wang LG, Han Y, He QY. clusterProfiler: an R package for comparing biological themes among gene clusters. OMICS. (2012) 16:284–7. doi: 10.1089/omi.2011.0118
36. Tibshirani R. Regression shrinkage and selection via the lasso. J R Stat Soc: Ser B (Methodological). (1996) 58:267–88. doi: 10.1111/j.2517-6161.1996.tb02080.x
37. Burges CJ. A tutorial on support vector machines for pattern recognition. Data Min Knowledge Discovery. (1988) 2:121–67. doi: 10.1023/A:1009715923555
38. Friedman J, Hastie T, Tibshirani R. Regularization paths for generalized linear models via coordinate descent. J Stat Software. (2010) 33:1–22. doi: 10.18637/jss.v033.i01
39. Meyer D, Dimitriadou E, Hornik K, et al. E1071: Miscellaneous functions of department of statistics TU Wien, Version 1.7-6 (2021). Available online at: https://cran.r-project.org/web/packages/e1071/ (Accessed October 25, 2024).
40. Liaw A, Wiener M. Classification and regression by randomforest. R News. (2002) 2:18–22. Available online at: https://journal.r-project.org/articles/RN-2002-022/RN-2002-022.pdf (Accessed October 25, 2024).
41. Robin X, Turck N, Hainard A, Tiberti N, Lisacek F, Sanchez JC, et al. pROC: an open-source package for R and S+ to analyze and compare ROC curves. BMC Bioinf. (2011) 12:77. doi: 10.1186/1471-2105-12-77
42. Cheung NK, Dyer MA. Neuroblastoma: developmental biology, cancer genomics and immunotherapy. Nat Rev Cancer. (2013) 13:397–411. doi: 10.1038/nrc3526
43. Asgharzadeh S, Salo JA, Ji L, Oberthuer A, Fischer M, Berthold F, et al. Clinical significance of tumor-associated inflammatory cells in metastatic neuroblastoma. J Clin Oncol. (2012) 30:3525–32. doi: 10.1200/JCO.2011.40.9169
44. Capitini CM, Otto M, DeSantes KB, Sondel PM. Immunotherapy in pediatric Malignancies: current status and future perspectives. Future Oncol. (2014) 10:1659–78. doi: 10.2217/fon.14.62
45. Siebert N, Zumpe M, Schwencke CH, Biskupski S, Troschke-Meurer S, Leopold J, et al. Combined blockade of TIGIT and PD-L1 enhances anti-neuroblastoma efficacy of GD2-directed immunotherapy with dinutuximab beta. Cancers. (2023) 15:3317. doi: 10.3390/cancers15133317
46. Liu J, Geng X, Hou J, Wu G. New insights into M1/M2 macrophages: key modulators in cancer progression. Cancer Cell Int. (2021) 21:389. doi: 10.1186/s12935-021-02089-2
47. De Giovanni C, Nanni P, Landuzzi L, Ianzano ML, Nicoletti G, Croci S, et al. Immune targeting of autocrine IGF2 hampers rhabdomyosarcoma growth and metastasis. BMC Cancer. (2019) 19:126. doi: 10.1186/s12885-019-5339-4
48. Ciofani M, Madar A, Galan C, Sellars M, Mace K, Pauli F, et al. A validated regulatory network for Th17 cell specification. Cell. (2012) 151:289–303. doi: 10.1016/j.cell.2012.09.016
49. Liu M, Guo S, Hibbert JM, Jain V, Singh N, Wilson NO, et al. CXCL10/IP-10 in infectious diseases pathogenesis and potential therapeutic implications. Cytokine Growth Factor Rev. (2011) 22:121–30. doi: 10.1016/j.cytogfr.2011.06.001
50. Groom JR, Luster AD. CXCR3 in T cell function. Exp Cell Res. (2011) 317:620–31. doi: 10.1016/j.yexcr.2010.12.017
51. Müller L, Tunger A, Plesca I, Wehner R, Temme A, Westphal D, et al. Bidirectional crosstalk between cancer stem cells and immune cell subsets. Front Immunol. (2020) 11:140. doi: 10.3389/fimmu.2020.00140
52. Limoges MA, Cloutier M, Nandi M, Ilangumaran S, Ramanathan S. The GIMAP family proteins: an incomplete puzzle. Front Immunol. (2021) 12:679739. doi: 10.3389/fimmu.2021.679739
53. Hellquist A, Zucchelli M, Kivinen K, Saarialho-Kere U, Koskenmies S, Widen E, et al. The human GIMAP5 gene has a common polyadenylation polymorphism increasing risk to systemic lupus erythematosus. J Med Genet. (2007) 44:314–21. doi: 10.1136/jmg.2006.046185
54. O'Hayre M, Vázquez-Prado J, Kufareva I, Stawiski EW, Handel TM, Seshagiri S, et al. The emerging mutational landscape of G proteins and G-protein-coupled receptors in cancer. Nat Rev Cancer. (2013) 13:412–24. doi: 10.1038/nrc3521
55. Arang N, Gutkind JS. G Protein-Coupled receptors and heterotrimeric G proteins as cancer drivers. FEBS Lett. (2020) 594:4201–32. doi: 10.1002/1873-3468.14017
56. Seda V, Mraz M. B-cell receptor signalling and its crosstalk with other pathways in normal and malignant cells. Eur J Haematol. (2015) 94:193–205. doi: 10.1111/ejh.12427
57. Sarvaria A, Madrigal JA, Saudemont A. B cell regulation in cancer and anti-tumor immunity. Cell Mol Immunol. (2017) 14:662–74. doi: 10.1038/cmi.2017.35
58. Espert L, Degols G, Lin YL, Vincent T, Benkirane M, Mechti N. Interferon-induced exonuclease ISG20 exhibits an antiviral activity against human immunodeficiency virus type 1. J Gen Virol. (2005) 86:2221–9. doi: 10.1099/vir.0.81074-0
59. McNab F, Mayer-Barber K, Sher A, Wack A, O'Garra A. Type I interferons in infectious disease. Nat Rev Immunol. (2015) 15:87–103. doi: 10.1038/nri3787
60. Pardoll DM. The blockade of immune checkpoints in cancer immunotherapy. Nat Rev Cancer. (2012) 12:252–64. doi: 10.1038/nrc3239
61. Wang DY, Salem JE, Cohen JV, Chandra S, Menzer C, Ye F, et al. Fatal toxic effects associated with immune checkpoint inhibitors: A systematic review and meta-analysis. JAMA Oncol. (2018) 4:1721–8. doi: 10.1001/jamaoncol.2018.3923
Keywords: biomarker, tumor microenvironment, immunoclustering, machine learning, neuroblastoma
Citation: Zhang L, Li H, Sun F, Wu Q, Jin L, Xu A, Chen J and Yang R (2024) Identification of novel markers for neuroblastoma immunoclustering using machine learning. Front. Immunol. 15:1446273. doi: 10.3389/fimmu.2024.1446273
Received: 09 June 2024; Accepted: 15 October 2024;
Published: 04 November 2024.
Edited by:
Robin Parihar, Baylor College of Medicine, United StatesReviewed by:
Zbigniew Starosolski, Texas Children’s Hospital, United StatesCopyright © 2024 Zhang, Li, Sun, Wu, Jin, Xu, Chen and Yang. This is an open-access article distributed under the terms of the Creative Commons Attribution License (CC BY). The use, distribution or reproduction in other forums is permitted, provided the original author(s) and the copyright owner(s) are credited and that the original publication in this journal is cited, in accordance with accepted academic practice. No use, distribution or reproduction is permitted which does not comply with these terms.
*Correspondence: Jiarui Chen, Y2hlbmpyMjI4QG1haWwuc3lzdS5lZHUuY24=; Ranyao Yang, eWFuZ3J5QGhrdS5oaw==
†These authors have contributed equally to this work and share first authorship
Disclaimer: All claims expressed in this article are solely those of the authors and do not necessarily represent those of their affiliated organizations, or those of the publisher, the editors and the reviewers. Any product that may be evaluated in this article or claim that may be made by its manufacturer is not guaranteed or endorsed by the publisher.
Research integrity at Frontiers

Learn more about the work of our research integrity team to safeguard the quality of each article we publish.