 Huijun Zhou1†
 Xuehao Cui
- 1Department of Endocrinology, The Affiliated Yancheng First Hospital of Nanjing University Medical School, The First People's Hospital of Yancheng, Yancheng, Jiangsu, China
- 2Department of Radiotherapy Oncology, The Affiliated Yancheng First Hospital of Nanjing University Medical School, The First People’s Hospital of Yancheng, Yancheng, Jiangsu, China
- 3John Van Geest Centre for Brain Repair and MRC Mitochondrial Biology Unit, Department of Clinical Neurosciences, University of Cambridge, Cambridge, United Kingdom
- 4Cambridge Eye Unit, Addenbrooke’s Hospital, Cambridge University Hospitals, Cambridge, United Kingdom
Background: Diabetic retinopathy (DR) is a major microvascular complication of diabetes and a leading cause of blindness worldwide. The pathogenesis of DR involves complex interactions between metabolic disturbances, immune cells, and proteolytic enzymes such as cathepsins (CATs). Despite various studies, the precise roles of different CATs, metabolites, and vitamins in DR remain unclear.
Method: In this study, we employed Mendelian Randomization (MR) to assess causal relationships using genetic instruments selected based on genome-wide association studies (GWAS). We employed two-sample and mediation MR to explore the causal effects between nine CATs, immune cells, metabolites, vitamins, and DR. Additionally, the study also incorporated data from the NHANES survey to explore the associated relationship between vitamins and DR. We utilized cross-sectional data from the NHANES to analyze the association between vitamin intake and diabetic retinopathy (DR), adjusting for potential confounders to strengthen the validity of our findings.
Results: The MR analysis identified CAT H as a significant risk factor for both NPDR and PDR, with no evidence of reverse causality. Additionally, 62 immune cell traits were found to have causal relationships with NPDR and 49 with PDR. Enrichment analysis revealed that metabolic pathways such as sphingolipid metabolism are crucial in DR progression. Vitamins B6 and E were significantly associated with a reduced risk of PDR. Cross-sectional data indicated that vitamins B1, B2, B6, B12, and E progressively decreased with DR severity.
Conclusion: This study is the first to identify CAT H as a key risk factor for DR, while vitamins B6 and E showed significant protective effects, particularly against PDR. These findings suggest that CAT H, along with vitamins B6 and E, could serve as therapeutic targets for DR. Further validation through larger, multi-center studies is recommended to enhance the accuracy and applicability of these findings.
Introduction
Diabetic retinopathy (DR) is the most common microvascular complication of diabetes and the leading cause of preventable blindness in the adult working population, affecting over 100 million people globally in 2020 (1–3). The Global Burden of Disease study identifies DR as the fifth leading cause of blindness and significant visual impairment in individuals aged 50 and older. Projections indicate that the global number of people affected by DR will increase to 129.84 million by 2030 and 160.5 million by 2045 (4). DR, characterized by neurovascular degeneration due to chronic hyperglycemia, affects 34.6% of diabetic patients globally (5, 6). It can be classified into non-proliferative DR (NPDR), and proliferative DR (PDR), with PDR posing a severe risk of complete vision loss (7). The incidence rates for PDR, diabetic macular edema, and vision-threatening DR are 7.0%, 6.8%, and 10.2% respectively, highlighting the urgent need for new preventive and therapeutic approaches (5). Despite advancements in DR management, optimal diagnostic indicators and therapeutic approaches are lacking (8). Current treatments, including laser photocoagulation, anti-VEGF drugs, and ocular steroids, have limitations: lasers can cause permanent retinal damage, anti-VEGF therapy risks endophthalmitis, and ocular steroids often increase intraocular pressure (9–11).
Cathepsins (CATs), a group of lysosomal proteolytic enzymes, are crucial for cellular homeostasis and are involved in numerous physiological and pathophysiological processes, including protein and lipid metabolism, autophagy, and lysosome-mediated cell death (12–15). Their critical roles in these processes make them significant in various diseases, including diabetes (16, 17). Recent studies have revealed the roles of several CATs, including CAT B (18), C (19), D (20), L (21), and S (22), in either promoting or suppressing diabetes and complications like diabetic cardiomyopathy, diabetic nephropathy, and diabetic kidney disease. However, only a limited number of studies and clinical trials have explored the association between cathepsins and DR. A previous study found that the downregulation of CAT B, D, and L is associated with high glucose-induced anti-autophagic and pro-apoptotic effects in retinal vascular endothelial cells, suggesting a novel pathogenic mechanism and potential therapeutic targets for PDR (23). Another study found that CAT G released by neutrophils, along with neutrophil elastase (NE) and proteinase 3, contributes to the development of DR by enhancing the inflammatory response (24). A study found that CAT H is implicated in several diseases, including high myopia, atherosclerosis, type 1 diabetes, neuroinflammation, and brain atrophy (25). Furthermore, recent studies have found that CATs interact complexly with immune cells. CATs C and H are expressed in cytotoxic T lymphocytes and natural killer cells, aiding in the activation of granzymes; CAT B and L help maintain adaptive immune response homeostasis by regulating T and B lymphocyte cell death (26). Some CATs have complex interactions with serum metabolites, influencing the development of various diseases, including diabetes (20). Additionally, some studies found that vitamins can regulate the expression and function of CATs, demonstrating therapeutic effects in certain diabetes-related diseases through this pathway (27, 28).
Previous studies indicate significant differences in CATs roles across diabetic complications, the causal relationships between different CATs and DR, as well as their interactions with immune cells and metabolites in DR, remain underexplored. Therefore, further investigation is needed to clarify the causal relationships between different types of CATs and the risk of DR, which could potentially reveal new therapeutic targets. With advancements in genomics, increasing evidence highlights the role of heritability in disease etiology. Mendelian randomization (MR), which uses genome-wide association studies (GWAS) to employ genetic variants as instrumental variables, can infer causal effects of exposure on outcomes; MR analyses have been used to investigate the causal effects of different cathepsins on the risk of lung cancer and its histological subtypes using both univariable and multivariable methods. In our study, we used multi-omics MR and mediation MR to explore the causal relationships between immune cells, blood metabolites, and CATs with NPDR and PDR, as well as the potential therapeutic roles of certain vitamins in PDR. Subsequently, by utilizing data from the National Health and Nutrition Examination Survey (NHANES), we investigated the association between these vitamins and NPDR and PDR, further validating their therapeutic roles.
Methods and materials
Study design of MR analysis
Our MR study consists of three main steps (Figure 1). First, we performed a two-sample MR analysis to evaluate causal relationships between 9 CATs and DR, as well as between 731 immune cells/traits and 1400 metabolites/traits with DR. Second, we explored whether immune cells and metabolites mediate the causal relationship between CATs and DR, using enrichment analysis to investigate immune-metabolic mechanisms. Third, we examined the causal relationships between vitamins B6 and E and PDR, identifying their potential therapeutic roles and the mediating effect of CATs. To ensure the validity of our MR analysis, we met three key assumptions: (1) Genetic variants must be significantly associated with the exposure; (2) The selected instrumental variables (IVs) should not be correlated with confounders affecting both exposure and outcome; and (3) There should be no horizontal pleiotropy, meaning IVs should influence the outcome only through the exposure (29). The study employed two-step MR analyses to evaluate and quantify the mediating effects of selected mediators on the causal pathway between exposures and outcomes. In the first step, MR analysis determined the causal impact (β1) of exposures on each mediator. In the second step, MR analysis assessed the causal influence (β2) of each mediator on the outcome risk. The mediation proportion was calculated by dividing the product of the mediation effects (β1×β2) by the total effect between exposures and outcomes (30).
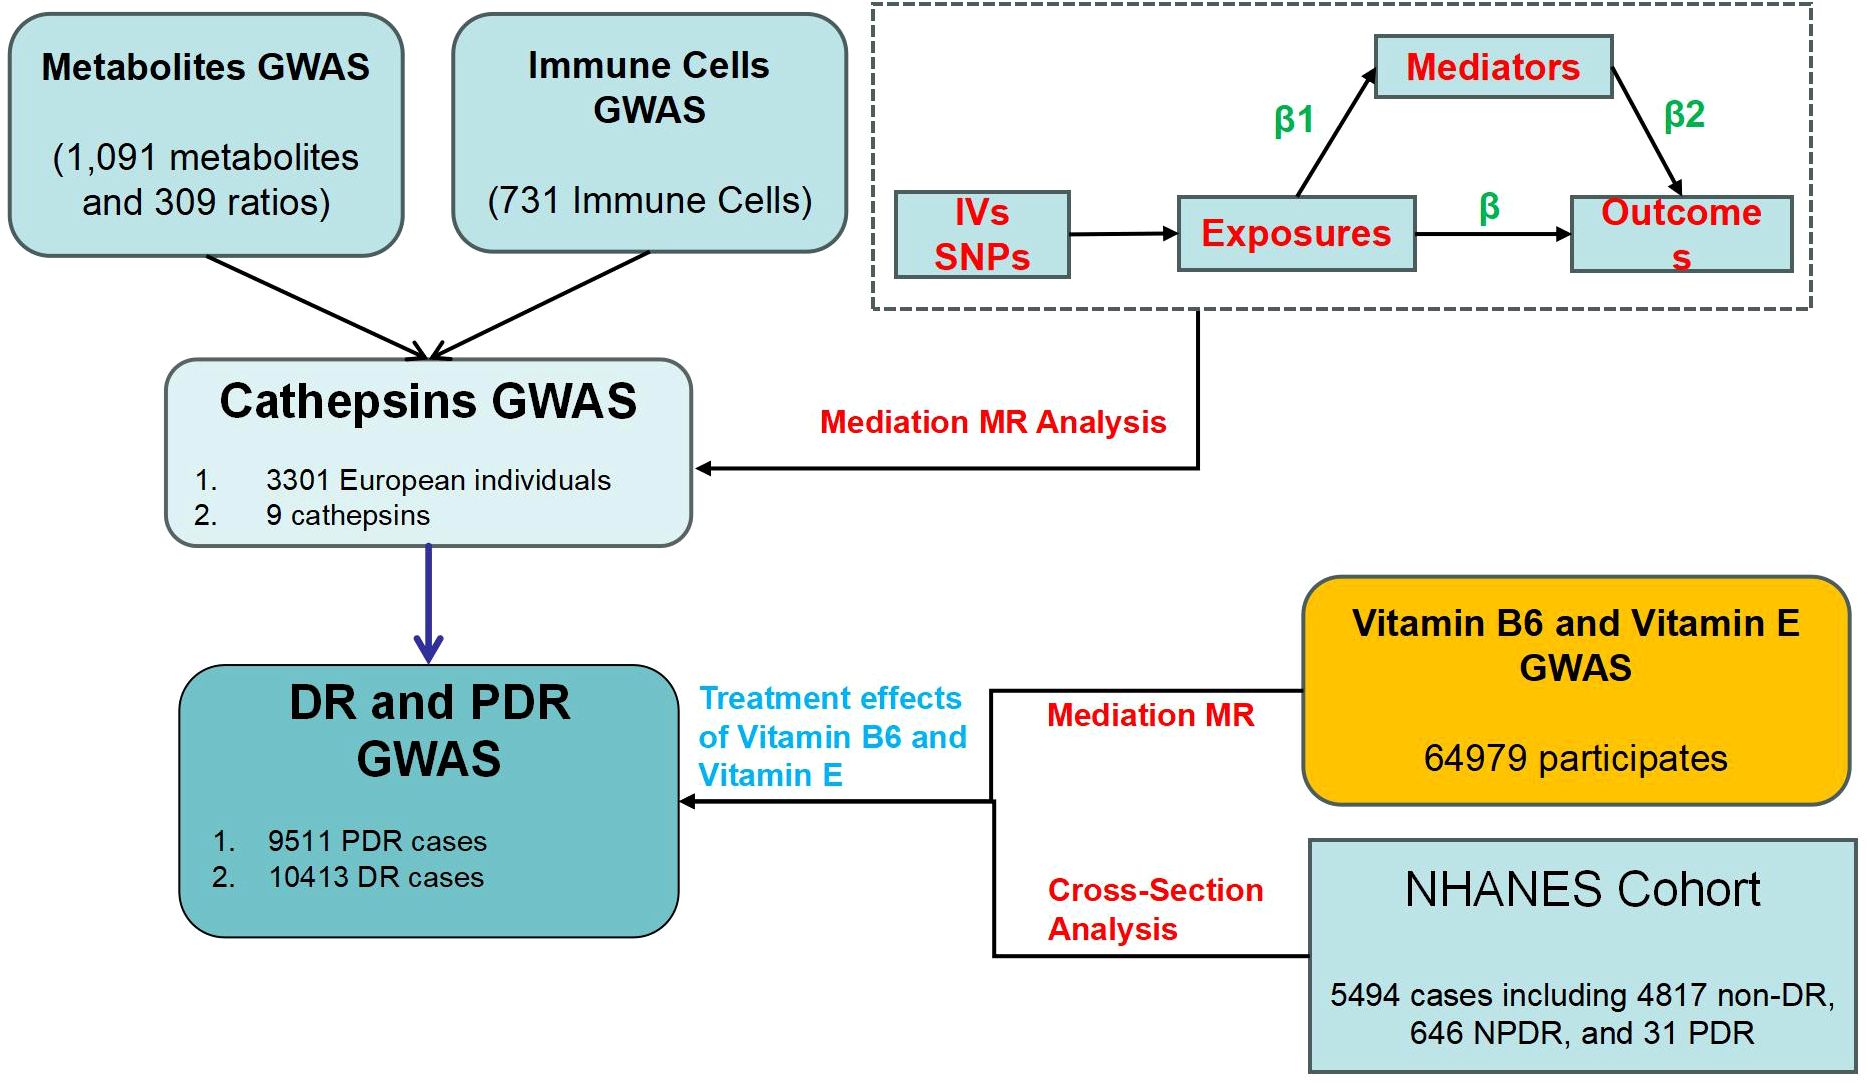
Figure 1. The study design and review.
Data sources of Mendelian randomization analysis
GWAS data for NPDR (GWAS ID: finngen_R9_H7_RETINOPATHYDIAB_BKG, 4,011 cases and 344,569 controls), PDR (GWAS ID: finngen_R9_DM_RETINA_PROLIF, 9511 cases and 362581 controls), were obtained from FinnGen (freeze 9) (31). This included 10,413 DR cases and 308,633 controls, 9,511 PDR cases and 362,581 controls. We identified cases of NPDR and PDR using International Classification of Diseases codes, specifically ICD-9 (3620) and ICD-10 (H360) for DR, and ICD-10 (H3603) for PDR.
The GWAS data on immune traits came from a study exploring the genetic basis of immune cell characteristics (32). 731 immune cell phenotypes were classified into four groups: absolute cell counts (AC), median fluorescence intensity (MFI), morphological parameters (MP), and relative cell counts (RC).
The GWAS dataset on metabolites was obtained from a study investigating the genetic determinants of metabolite profiles (33). Researchers examined 1,091 metabolites and 309 ratios, identifying genetic associations for 690 metabolites and 143 ratios across various loci.
Genetic instruments for assessing the levels of various CATs were sourced from the INTERVAL study, which included 3,301 European individuals (34). All participants provided informed consent, and the INTERVAL study was approved by the National Research Ethics Service (11/EE/0538). Summary data are available at https://gwas.mrcieu.ac.uk.
The GWAS data on vitamin B6 and vitamin E was derived from a substantial cohort of European ancestry within the UK Biobank (UKB). This dataset, compiled in 2018, included 64,979 participants and featured a comprehensive analysis of 9,851,867 single nucleotide polymorphisms (SNPs). This large-scale genetic evaluation provides a robust foundation for exploring the genetic determinants associated with vitamin B6 and E levels.
Selection of genetic variants and MR analysis
No sample overlap was detected because the source populations of all the GWAS data included were diverse. We ensured that the selected SNPs were significantly associated with the exposures, with all SNPs linked to immune cells, and metabolites meeting the genome-wide significance threshold (P < 5 × 10⁻⁸). Additionally, we selected a separate set of SNPs below the locus-wide significance level (P < 5 × 10⁻⁶) as instrumental variables for CATs, this value was established in line with the limitation of the sample size. We performed linkage disequilibrium (LD) analysis with strict criteria (R² < 0.001, clumping distance = 10,000 kb) to adhere to MR assumptions. We performed this step using the gwasvcf package in R (35). Instrument strength was measured by the F-statistic, variance explained by r2, and proxy SNPs with r2 > 0.8 were used when exposure SNPs were absent from the outcome dataset (36). We used the LD matrix from the 1000 Genomes Project (European Utah residents) and included only results with at least three independent SNPs and an average F-statistic over 10 to ensure robust MR analyses (37). Genetic variants were harmonized by aligning the effect sizes (betas) to the same effect allele with the TwoSampleMR package (38). We utilized various analytical methods to validate our findings, the inverse variance-weighted (IVW) method was applied to estimate the overall impact of exposures on outcomes (39). Depending on the presence of heterogeneity, either a fixed or random effects model was used for the IVW analysis. When significant heterogeneity (P < 0.05) was detected, a random-effects IVW model was chosen (40). Effect sizes were reported using beta coefficients, odds ratios (OR), and 95% confidence intervals (CI).
Sensitivity analysis
Sensitivity analyses were performed to ensure the robustness of the MR findings regarding the causal relationship between exposures and DR. Cochrane’s Q method was used to assess heterogeneity among the IVs, with P-values less than 0.05 indicating potential heterogeneity. Pleiotropic effects were initially evaluated using the intercept from MR-Egger regression, with P-values below 0.05 suggesting potential pleiotropy in the IVs. Additionally, the leave-one-out approach was implemented to assess the influence of individual SNPs, thus reinforcing the reliability of the MR analysis in establishing causality between exposures and DR.
Enrichment analysis
We conducted an enrichment analysis on metabolites with significant effects (P < 0.05) on DR, aligning them with a curated reference of metabolic pathways. Enrichment ratios were calculated by dividing the number of metabolites within each pathway by the total number of metabolites listed in that pathway from the reference set. To determine the statistical significance of enrichment for each pathway, we used the hypergeometric test, which accounts for the sizes of both the reference set and the specific metabolite group.
Data sources of cross−sectional study
The NHANES is an ongoing series of cross-sectional surveys targeting non-institutionalized civilians in the United States. Utilizing a multistage probability sampling technique, NHANES selects a sample that accurately represents the national population. It evaluates participants’ health and nutritional status through a combination of household interviews, physical examinations, and laboratory tests. This survey is managed by the National Center for Health Statistics (NCHS), part of the Centers for Disease Control and Prevention (CDC). Detailed information on the sampling method and data collection procedures is available in prior publications. All statistical analyses accounted for the NHANES complex survey design, incorporating sample weights, stratification, and clustering to ensure estimates are representative of the U.S. population. This methodology enhances the generalizability of the findings and reinforces the validity of the research in a population health context. The study received ethical approval from the NCHS Ethics Review Board, and all participants provided written informed consent (41).
The data for the cross-sectional study originated from the results of 2 cycles in the NHANES (2005–2008, www.cdc.gov/nchs/nhanes) and included demographic data, dietary data, laboratory test results, examinations, and questionnaire results. A total of 20,497 participants were included in the study. Among them, 14,793 were excluded due to a lack of DR-related records, and 210 were excluded due to missing dietary intake data for vitamin B6 and vitamin E. Consequently, a total of 5,494 individuals were included in this cross-sectional study. The assessment of retinal photographs, available on the NHANES website, was meticulously conducted by at least two experienced experts using a rigorous procedure for the diagnosis and classification of DR. In the NHANES surveys, participants were required to provide written informed consent before enrollment.
Covariates in analysis
The regression models were adjusted for covariates previously linked to vitamin intake and DR, including age, gender, race, education level, and BMI. Other relevant indicators such as blood glucose (GLU) and HbA1C were also included.
Statistical analyses
In our study, we analyzed clinical data using EmpowerStats software and logistic regression models. We statistically described the baseline characteristics of the study population by DR subgroups. Continuous variables were presented as means with standard deviations (SD) and analyzed using weighted linear regression models. To evaluate the association between vitamin intake and DR, we determined beta values and 95% confidence intervals through multivariate linear regression analysis. The multivariate analysis included three models: model 1 with no adjustments, model 2 adjusted for gender, age, and race, and model 3 adjusted for all covariates. Smoothed curve fits were adjusted for variables simultaneously. Statistical significance was defined as P < 0.05. To reduce data volatility, we employed a weighting approach.
Result
Causal effect of CATs with DR in MR
We first analyzed the causal relationship between 9 CATs (CAT B, E, F, G, H, L2, O, S, and Z) and DR (NPDR and PDR) using MR analysis. Of the 9 CATs, under the criterion of P<0.05, the IVW method found that CAT H was significantly associated with both NPDR and PDR. We conducted a false discovery rate (FDR) correction for our results to get the FDR-P. With an FDR < 0.05, we still found that CAT H has a significant causal relationship with NPDR (OR = 1.06, 95% CI 1.02 – 1.10, P = 0.0032) and PDR (OR = 1.09, 95% CI 1.02 – 1.17, P = 0.0079) (Figures 2, 3). The causal results of CAT H with NPDR were found by MR analysis using other MR methods, including weighted median (OR = 1.08, 95% CI 1.03 – 1.13, P = 0.0005) and MR Egger (OR = 1.09, 95% CI 1.03 – 1.15, P = 0.019). Similarly, the results for CATs with PDR were doubly validated in both the weighted median (OR = 1.11, 95% CI = 1.04 – 1.20, P = 0.0041) and MR Egger (OR = 1.11, 95% CI = 1.01 – 1.21, P = 0.036) methods (Figure 2). We did not find heterogeneity and horizontal pleiotropy in these results (Supplementary Table S1). To explore the possibility of reverse causality, we conducted reverse MR analyses. These results indicated a lack of reverse causality between cathepsin H and the risk of NPDR and PDR (Supplementary Table S2).
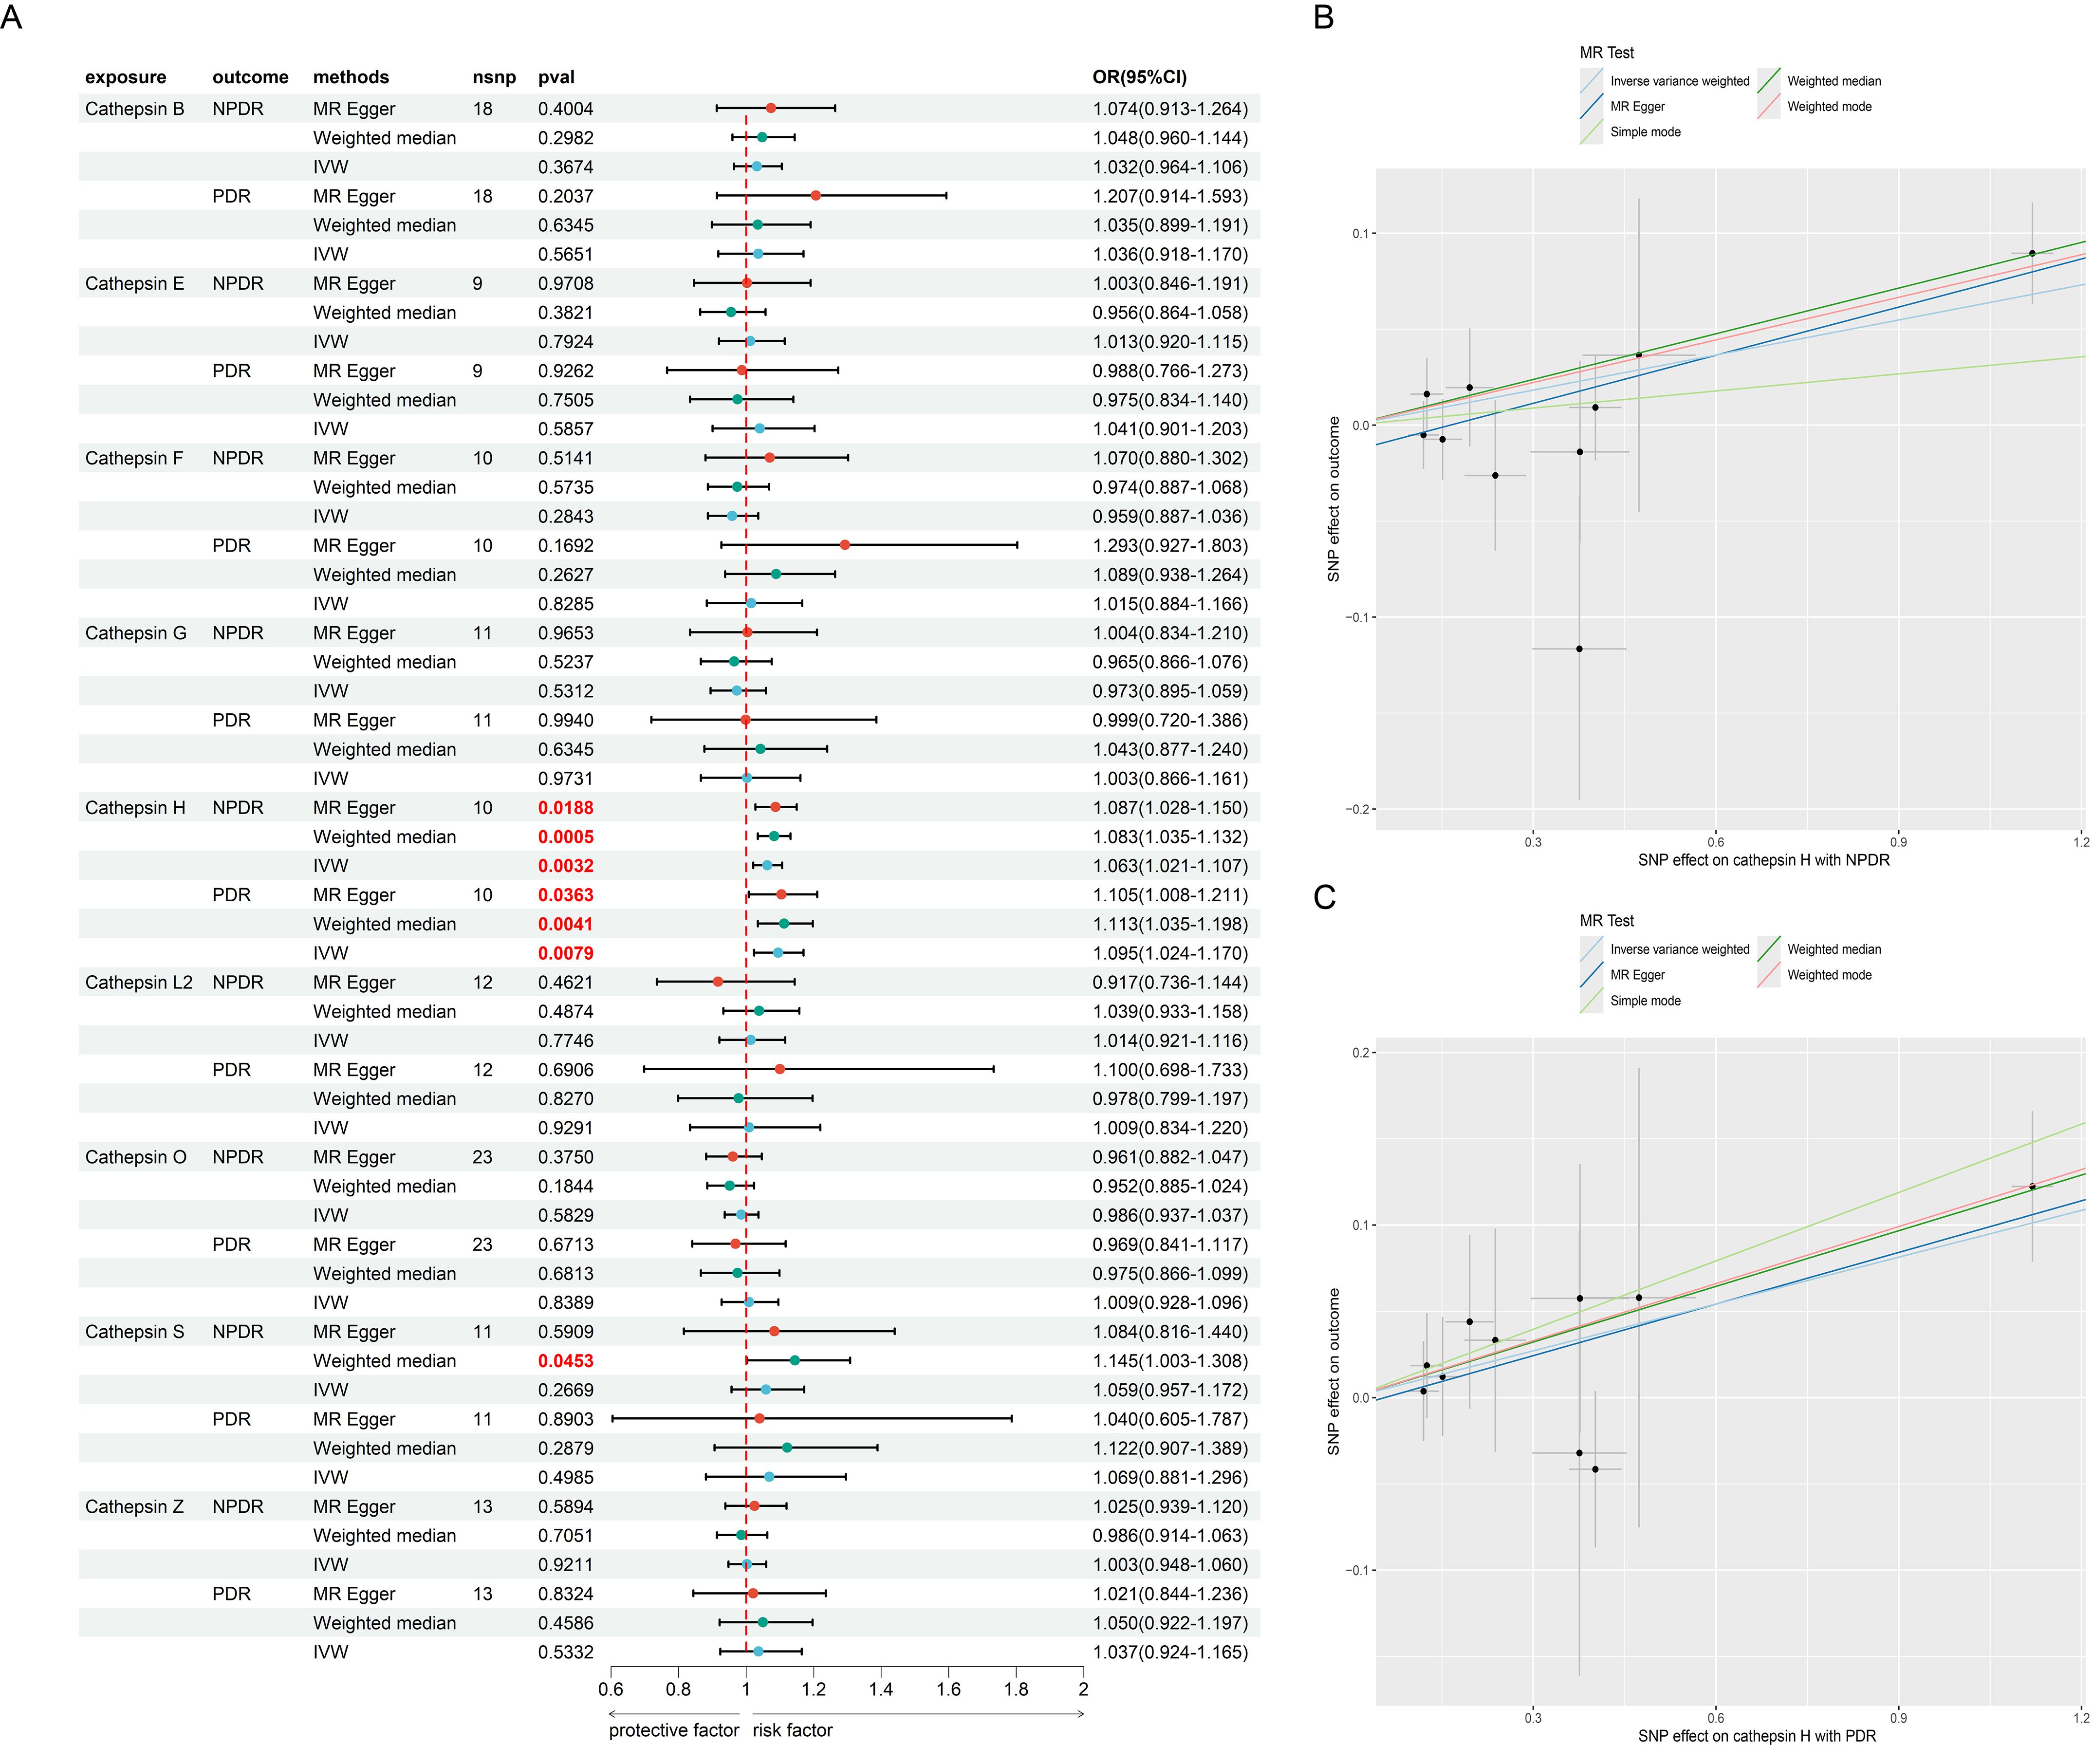
Figure 2. The MR result of cathepsins and DR. (A) the forest plot of MR result between cathepsins and DR. (B) the scatter plot of MR result between CAT H and NPDR. (C) the scatter plot of MR result between CAT H and PDR.
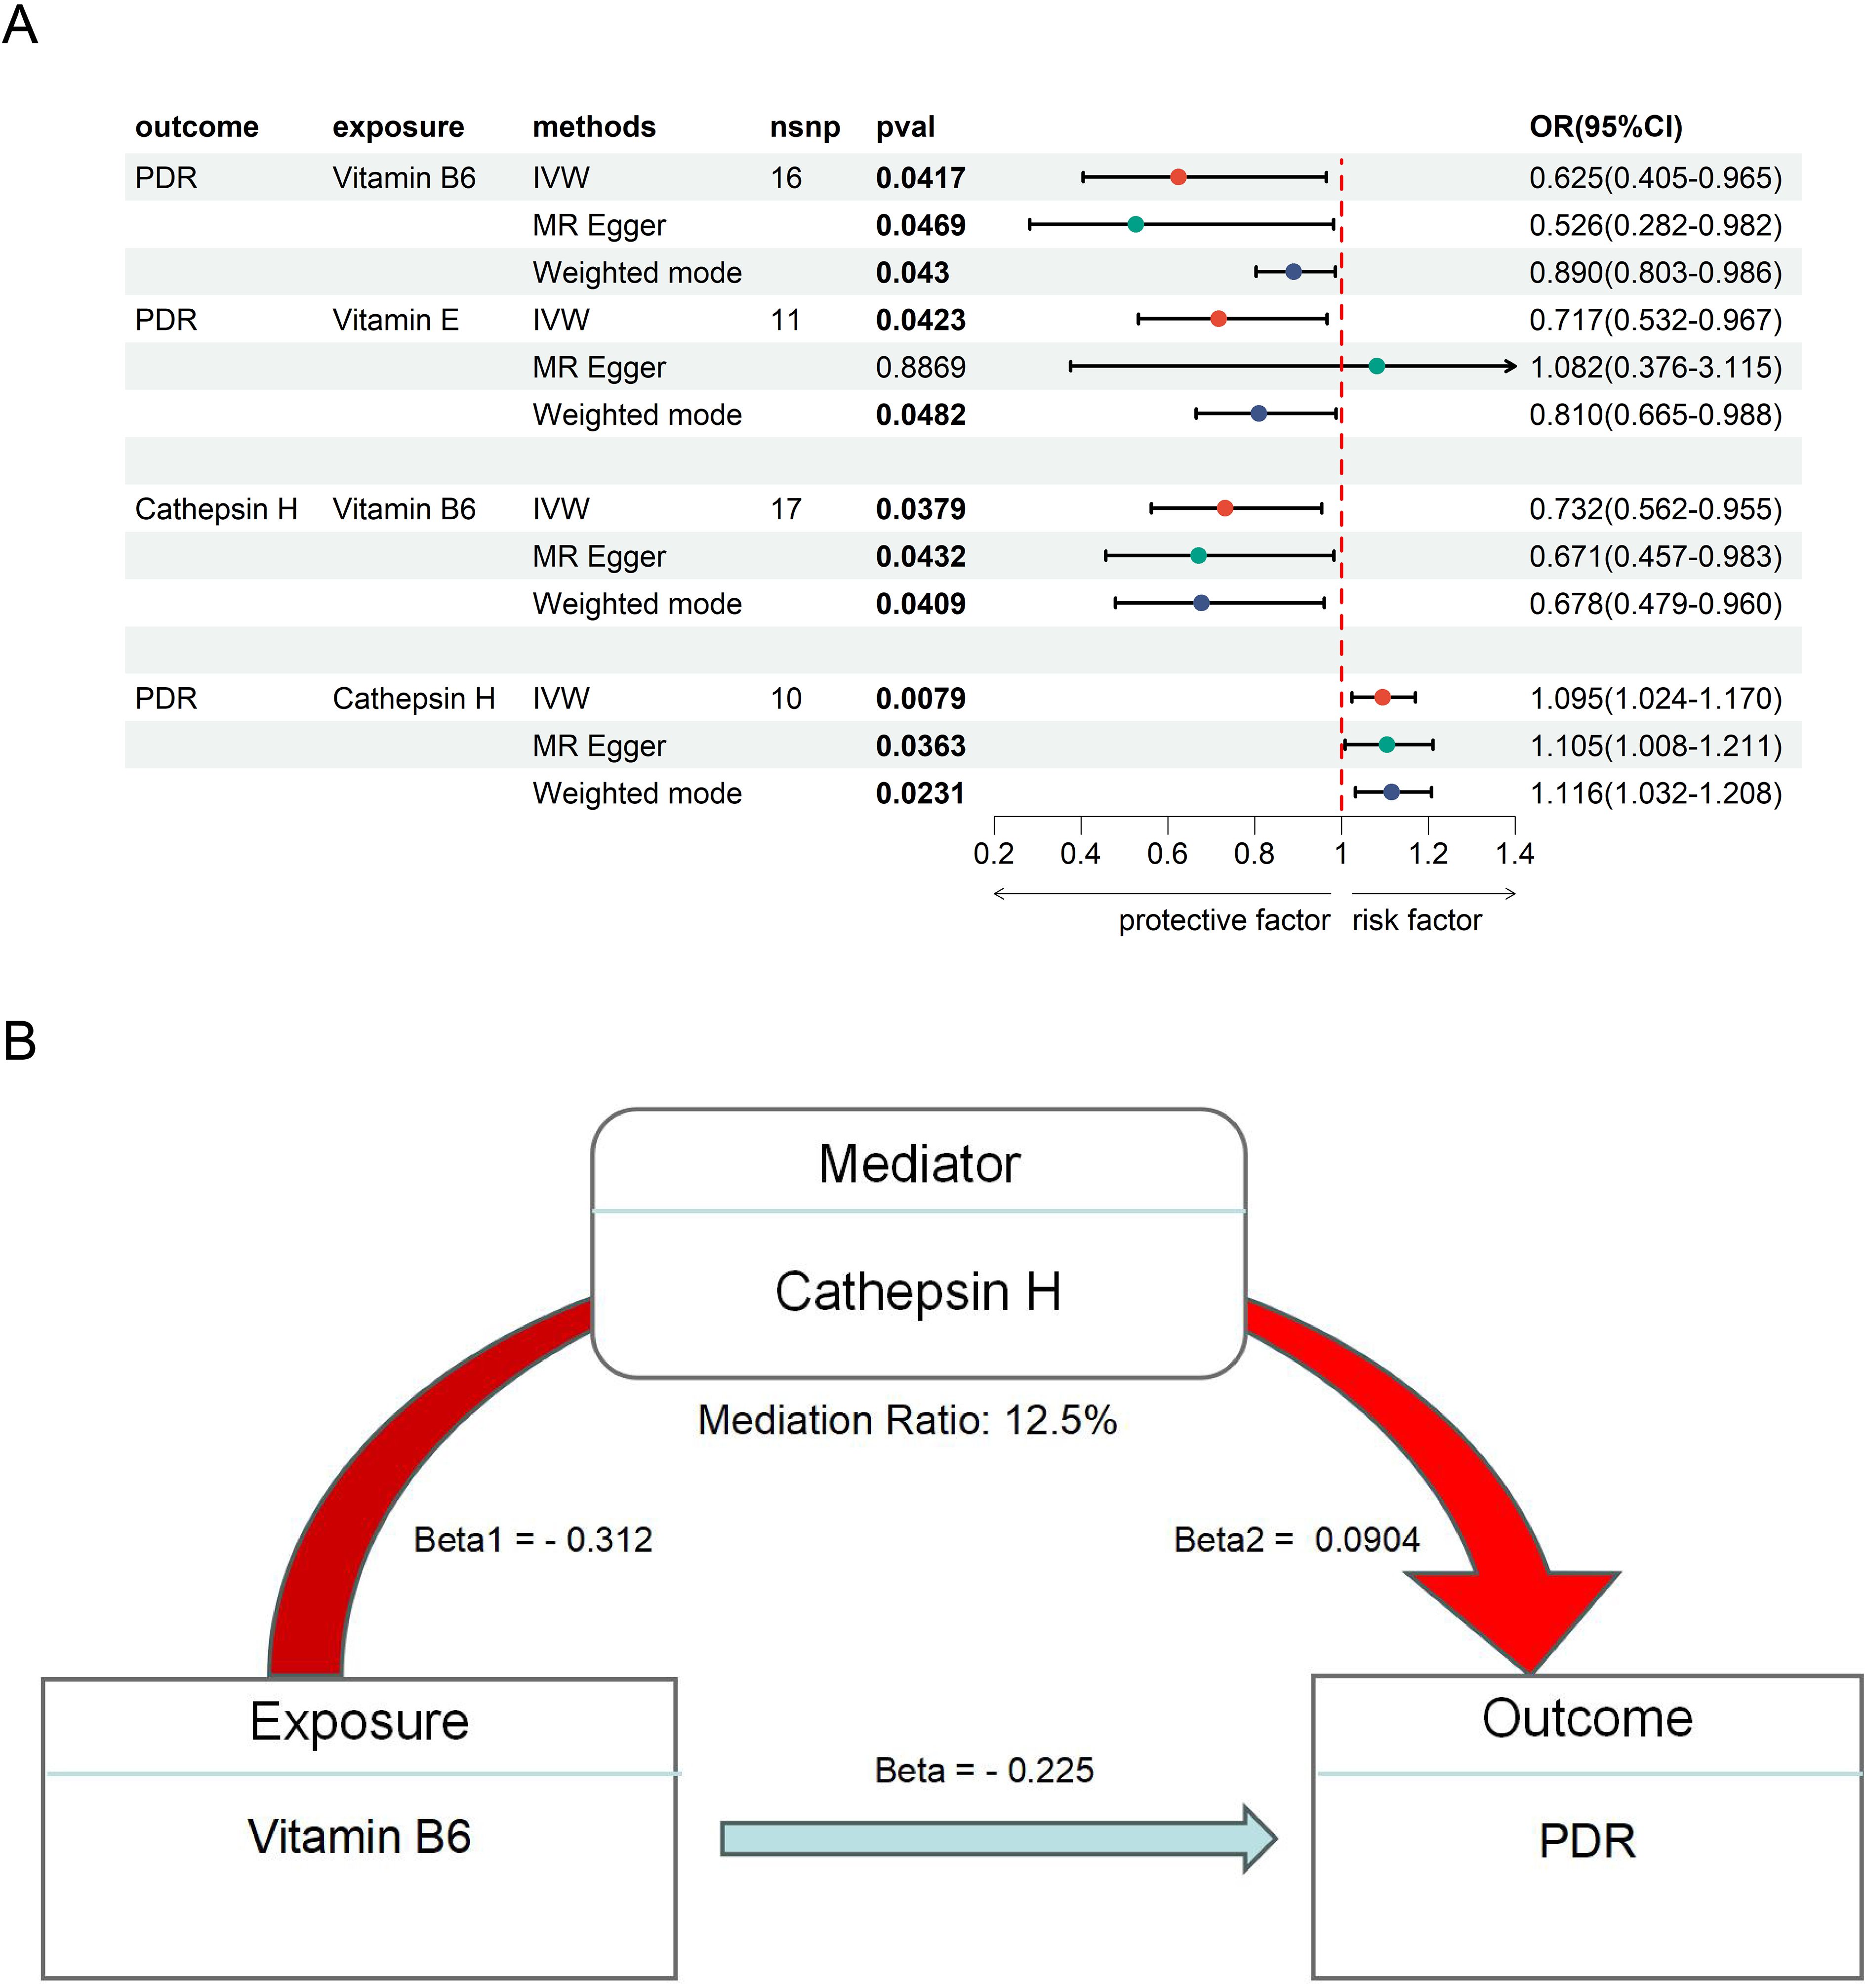
Figure 3. The MR result of vitamins and PDR. (A) the MR result of Vitamin B6, E and PDR. (B) the mediation effect of Vitamin B6, CAT H and PDR.
Causal effect of immune cells with DR in MR
We then assess the causal effect between immune cells and NPDR and PDR (Figure 4; Supplementary Tables S9, S10). We found 62 immune cells/traits have a causal relationship to NPDR (P < 0.05) (Supplementary Figure S1) and 49 immune cells/traits have a causal relationship to PDR (P < 0.05) (Supplementary Figure S2). We applied the Benjamini-Hochberg (BH) method to adjust our results, obtaining enhanced FDR-adjusted P-values (FDR-P). We found that 6 immune cells/traits had FDR-P values less than 0.05 in NPDR and 8 immune cells/traits in PDR. The 6 immune cells with the most significant causal relationship to NPDR were as follows: HLA DR on plasmacytoid DC (beta = 0.568, FDR-P = 5.34E-06), HLA DR on DC (beta = 0.622, FDR-P = 6.27E-05), HLA DR on CD33br HLA DR+ CD14- (beta = 0.162, FDR-P = 6.44E-05), HLA DR on CD33- HLA DR+ (beta = 0.584, FDR-P = 0.00061), HLA DR on myeloid DC (beta = 0.654, FDR-P = 0.0095) and TD CD4+ %T cell (beta = - 0.882, FDR-P = 0.011) (Figure 4). The 8 immune cells with the most significant causal relationship to PDR were as follows: HLA DR on plasmacytoid DC (beta = 0.688, FDR-P = 4.62E-06), HLA DR on DC (beta = 0.750, FDR-P = 0.00011), HLA DR on CD33- HLA DR+ (beta = 0.703, FDR-P = 0.00018), HLA DR on myeloid DC (beta = 0.801, FDR-P = 0.0032), TD CD4+ %T cell (beta = - 1.146, FDR-P = 0.0036), HLA DR on CD33br HLA DR+ CD14- (beta = 0.190, FDR-P = 0.014), CD45 on CD33br HLA DR+ CD14- (beta = -0.194, FDR-P = 0.022) and CD28 on CD39+ CD8br (beta = - 0.213, FDR-P = 0.049) (Figure 4). We did not find heterogeneity and horizontal pleiotropy in these results (Supplementary Tables S3, S4).
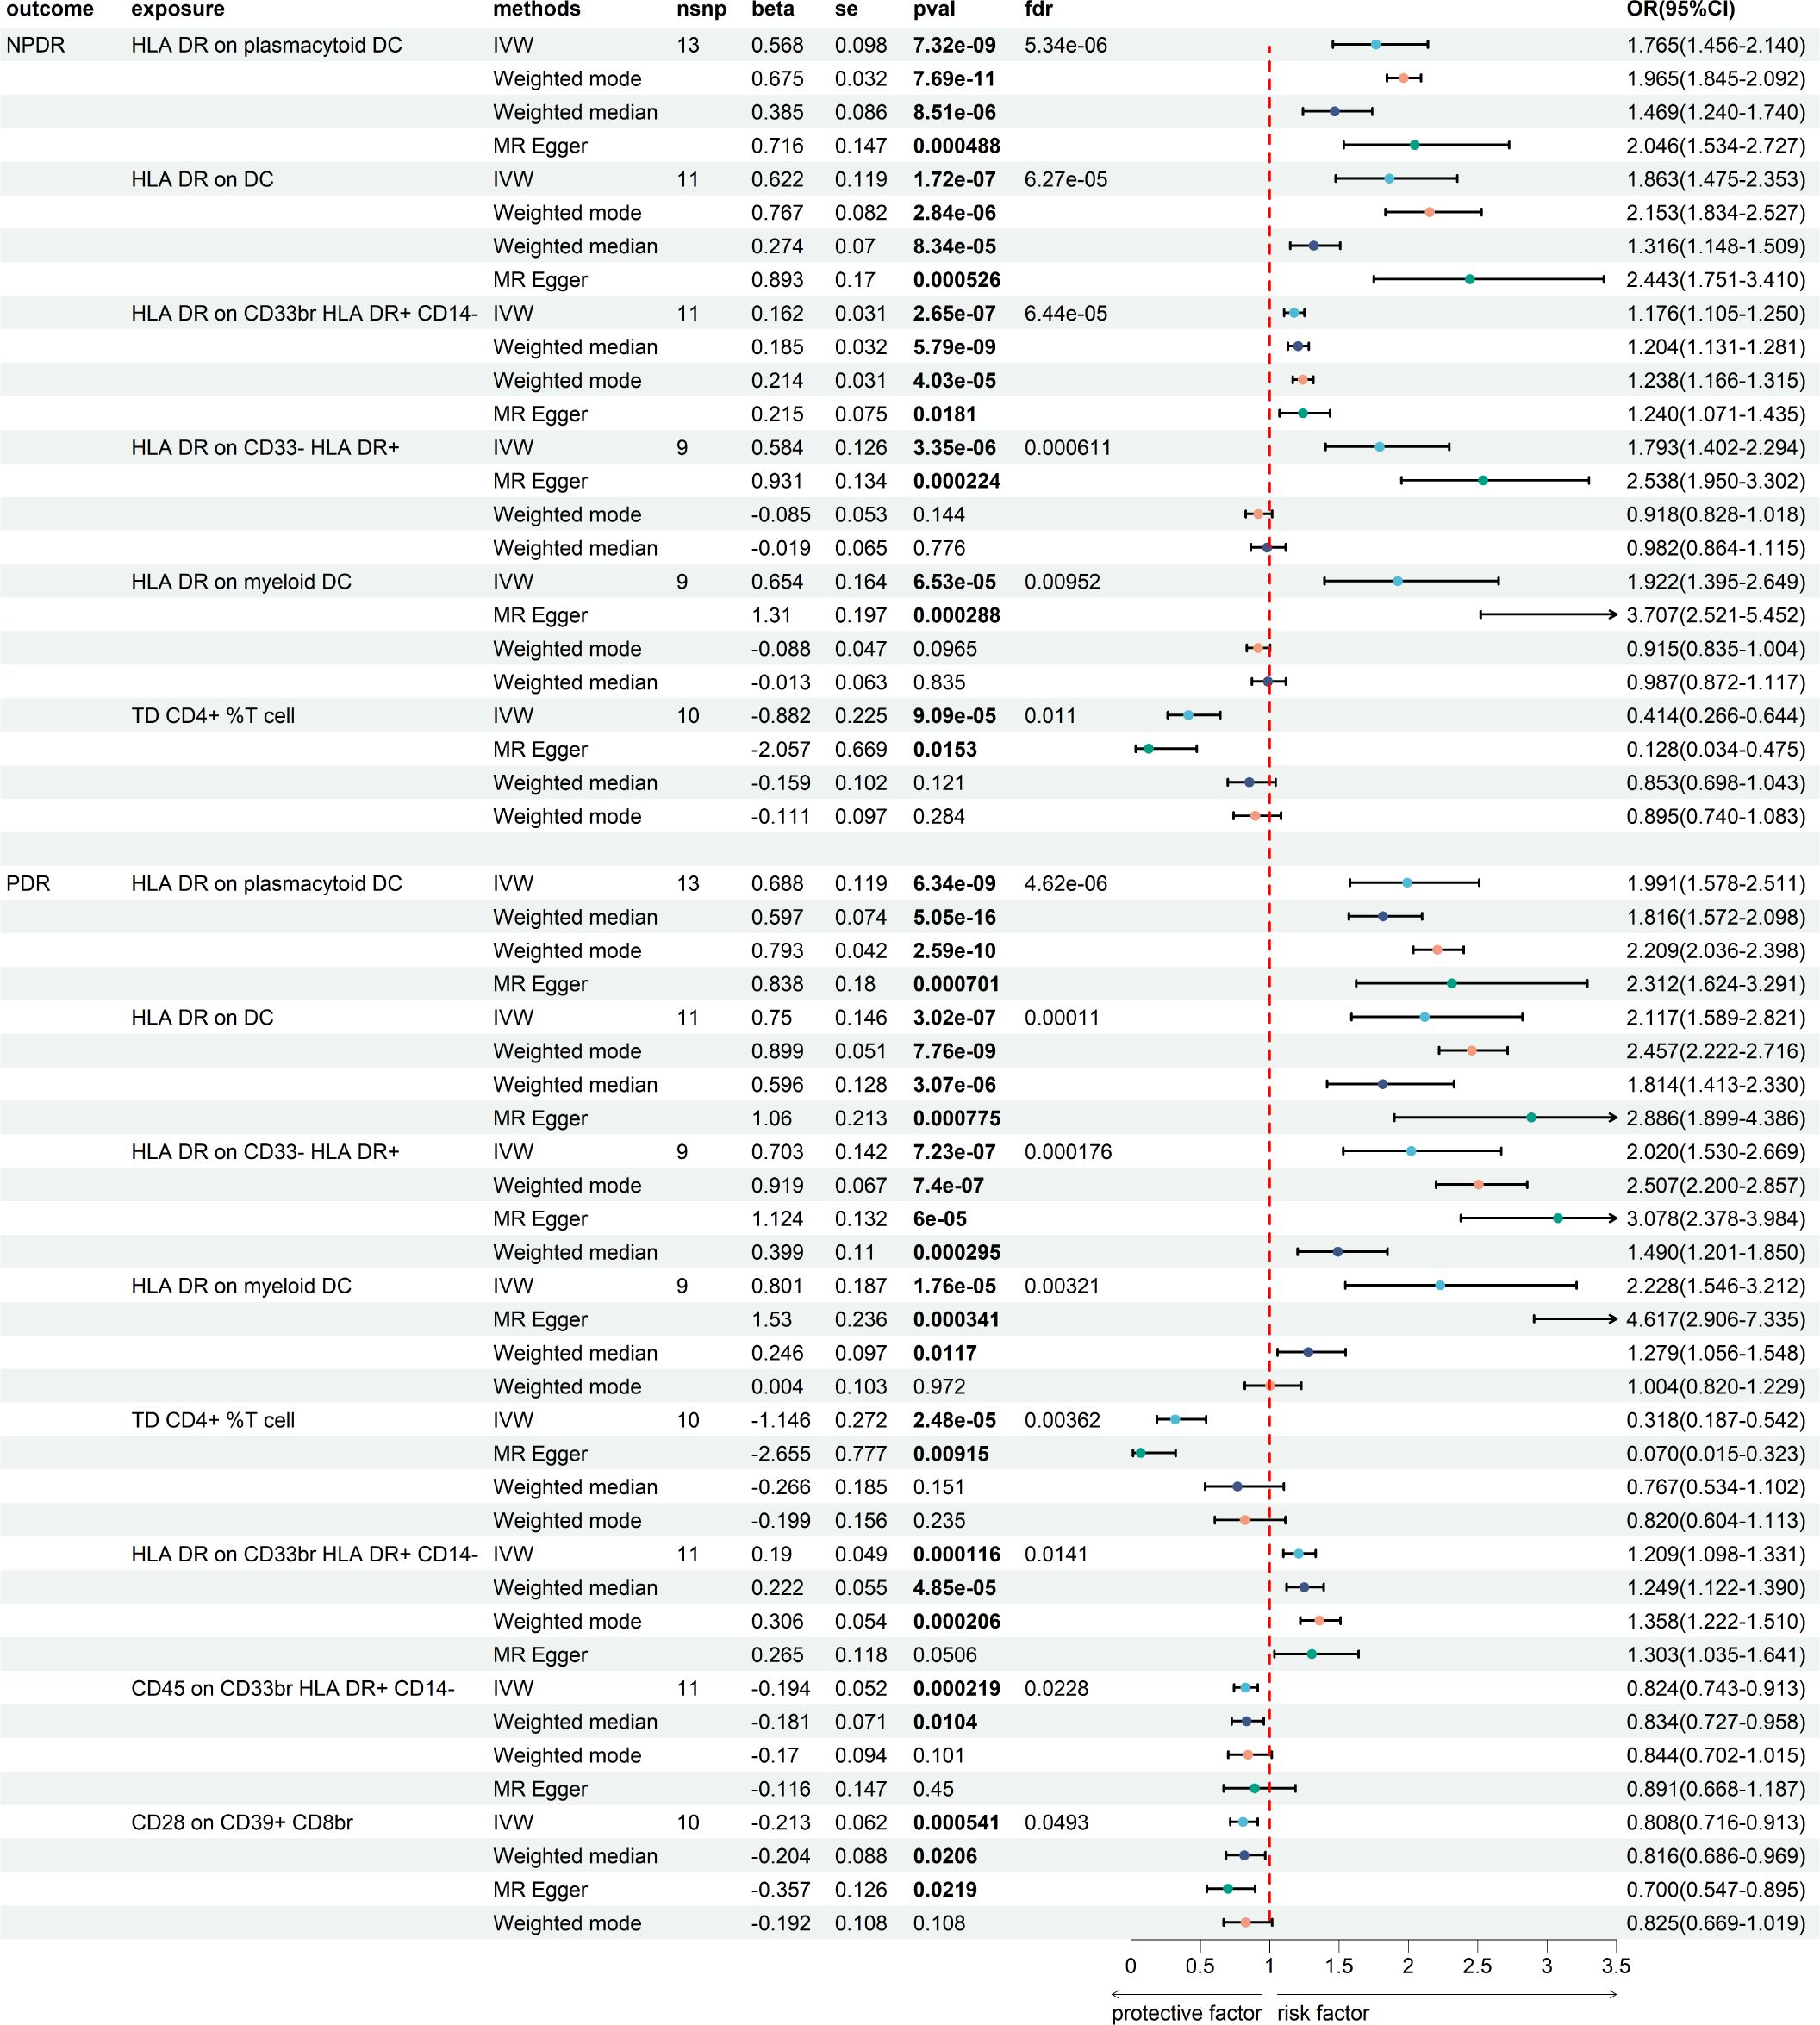
Figure 4. The MR result of immune cells and DR.
The causal effect between metabolites and the risk of DR and enrichment analysis
We further investigated the causal link between metabolites and NPDR and PDR (Supplementary Tables S11, S12), as shown in Figure 5. This analysis identified 58 metabolites with a significant causal relationship with NPDR (P < 0.05, Figure 5A) and 53 metabolites with PDR (P < 0.05, Figure 5B). Among these, 30 metabolites were positively associated with an increased risk of NPDR, while 28 metabolites demonstrated a negative causal relationship, suggesting a protective effect against NPDR. In PDR, 26 metabolites were positively associated with an increased risk, while 27 metabolites demonstrated a negative causal relationship. We did not find heterogeneity and horizontal pleiotropy in these results (Supplementary Tables S5, S6).
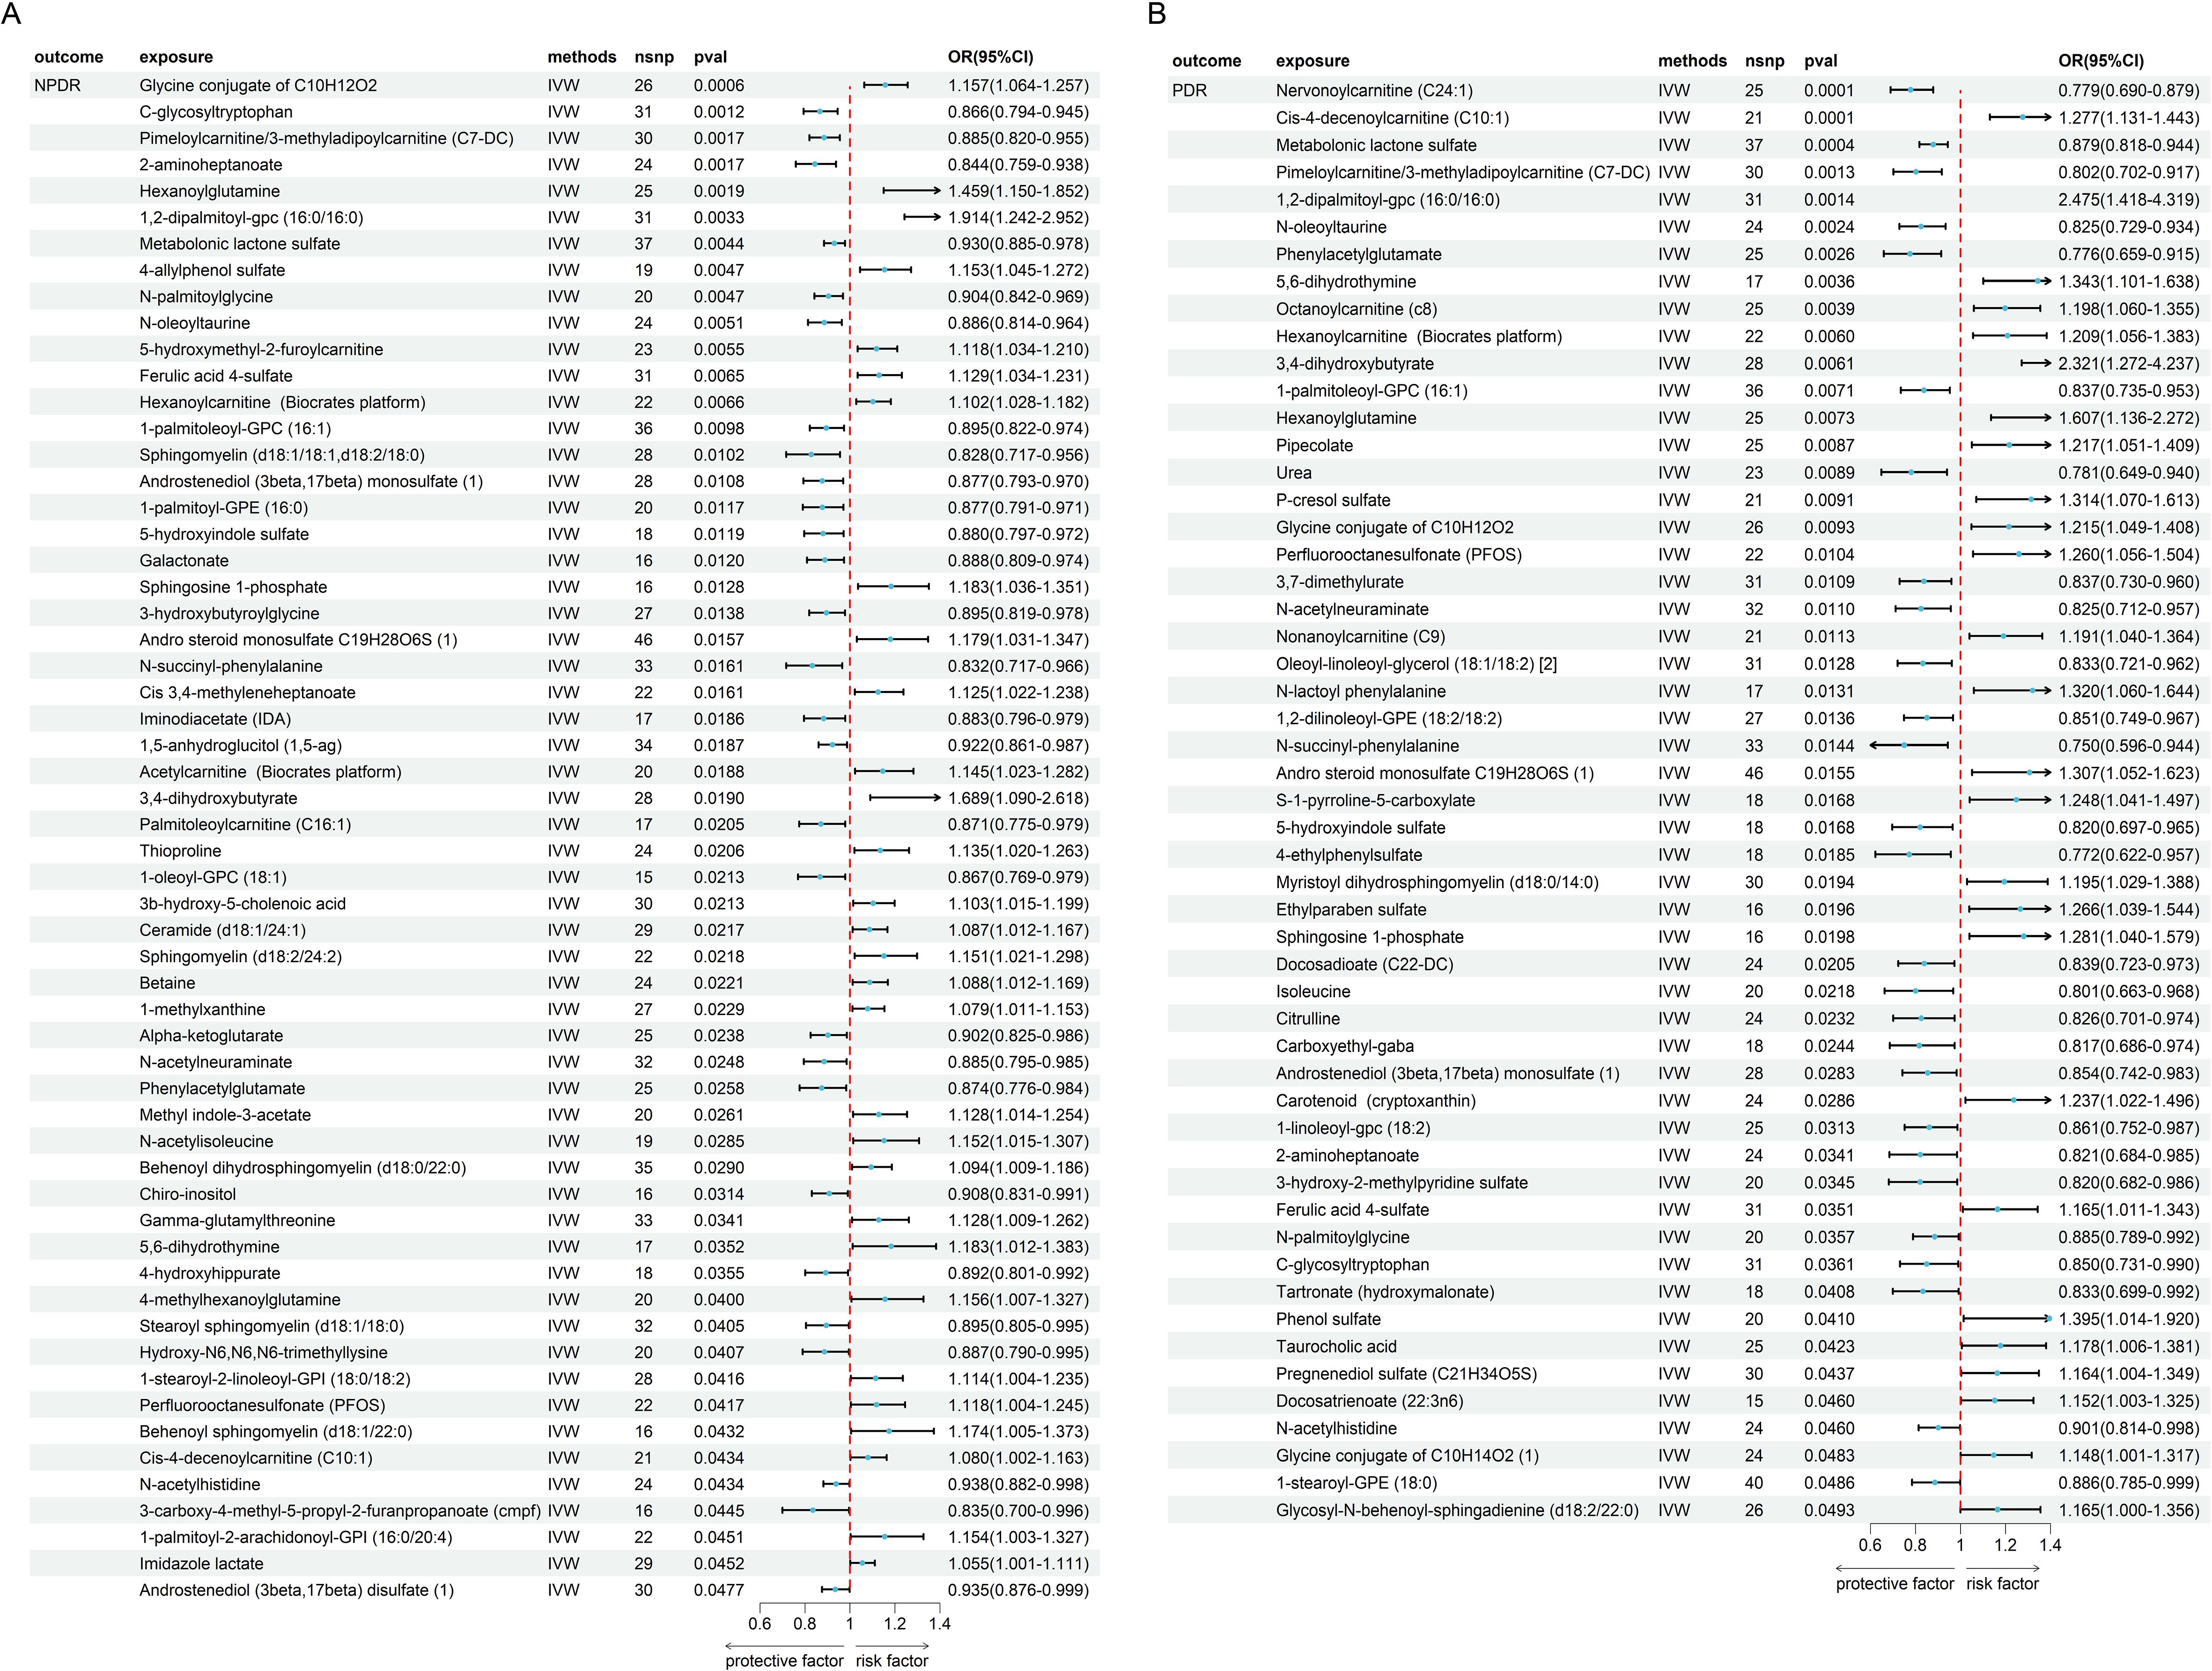
Figure 5. The MR result of metabolites and DR. (A) the result of metabolites and NPDR. (B) the result of metabolites and PDR.
Subsequently, we conducted an enrichment analysis on these metabolites to identify potential metabolic pathways (Figure 6). In NPDR, the analysis revealed that Sphingolipid metabolism had the most significant impact, followed by pathways related to caffeine metabolism, arginine biosynthesis, and butanoate metabolism (Figure 6A). In PDR, the analysis revealed that arginine biosynthesis had the most significant impact, followed by pathways related to valine, leucine, and isoleucine biosynthesis, then caffeine metabolism (Figure 6B). We found that some pathways, such as caffeine metabolism, have a significant role in both NPDR and PDR. However, some pathways show considerable differences between the two groups. Since PDR develops from NPDR, we can infer that metabolic pathways significantly associated with PDR may be crucial in the progression of NPDR to PDR. Therefore, these pathways could potentially serve as important therapeutic targets for preventing and delaying the development of PDR.
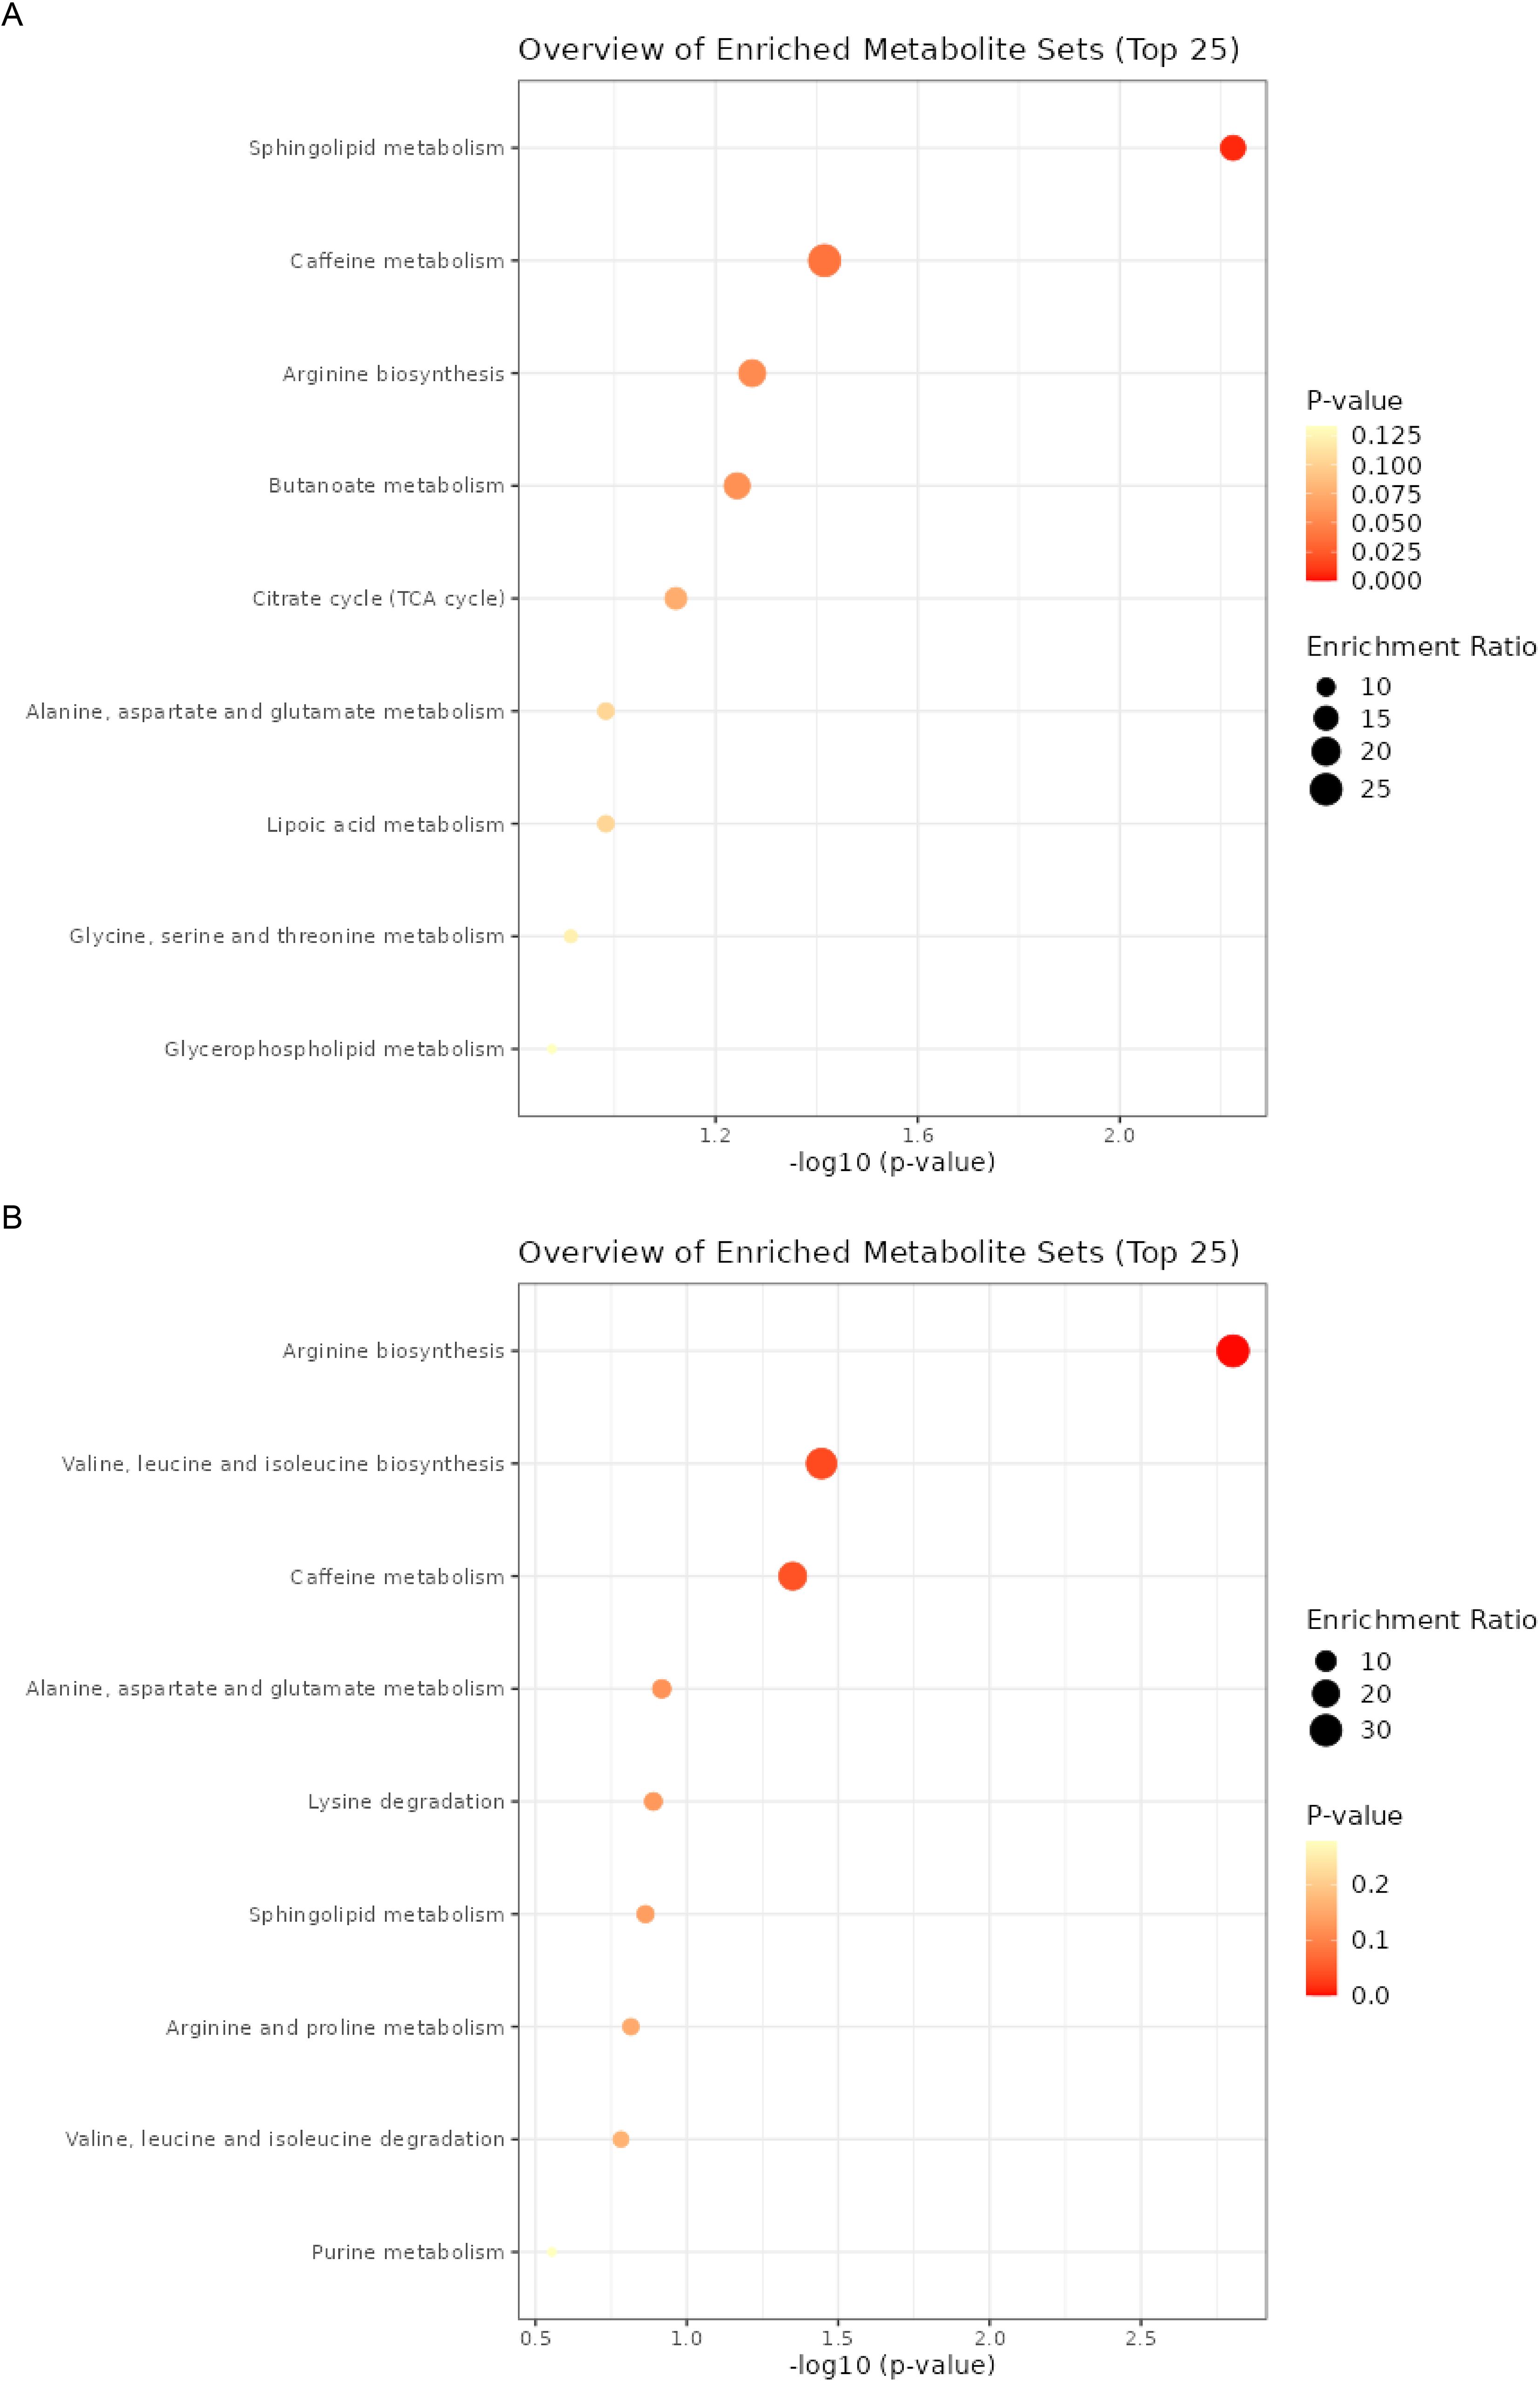
Figure 6. The enrichment analysis of metabolites. (A) the enrichment analysis of metabolites and NPDR. (B) the enrichment analysis of metabolites and PDR.
Immune cells mediate the causal effect of CAT H with DR
We used mediation MR analyses to explore the role of immune cells in the relationship between CAT H and DR (Table 1). Our findings indicated that HLA DR on CD33br HLA DR+ CD14- and HLA DR on CD14- CD16+ monocyte influences both NDPR and PDR via CAT H. Additionally, CD3 on NKT increased the risk of NPDR mediated by CAT H with a mediation proportion is 11.07%. The mediation effects of HLA DR on CD33br HLA DR+ CD14- and HLA DR on CD14- CD16+ monocytes in NPDR were 2.4% and 1.31%, respectively, and both were 3.04% in PDR.
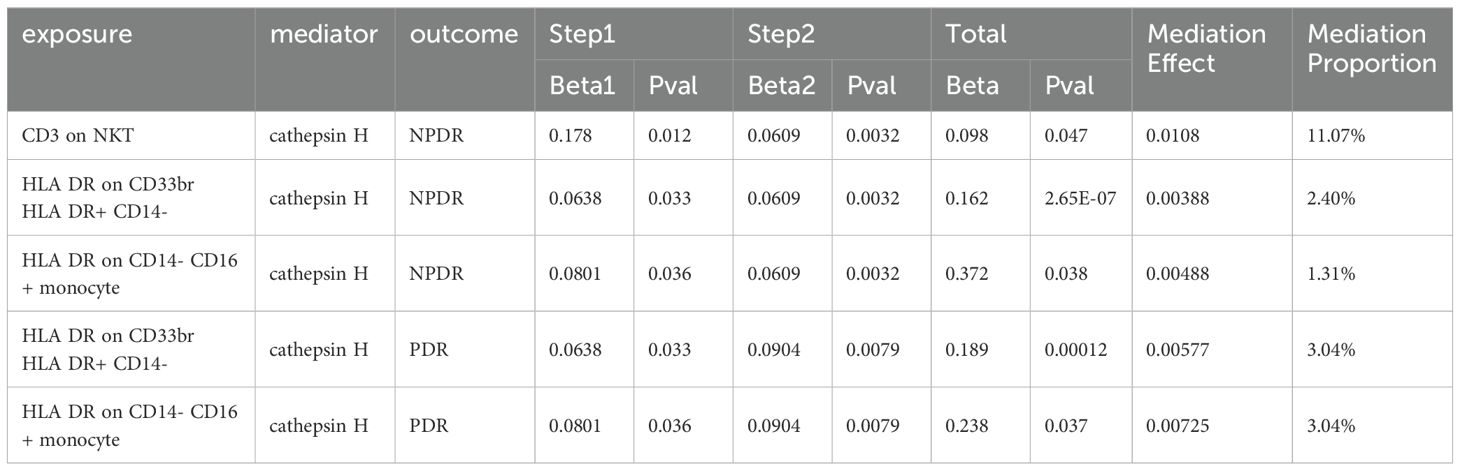
Table 1. The mediation effect of Cathepsin H between Immune Cells and DR.
The potential therapeutic role of vitamins in DR
To further explore the therapeutics of DR, we conducted an MR analysis using Vitamins as the exposures and DR as the outcome. This analysis revealed a significant causal link between Vitamin B6 (OR = 0.625, 95% CI 0.405 - 0.965, P = 0.042), Vitamin E (OR = 0.717, 95% CI 0.532 - 0.967, P = 0.042), and PDR (Figure 3A), suggesting a potential protective or therapeutic effect of Vitamin B6, E against PDR. We did not find heterogeneity and horizontal pleiotropy in these results (Supplementary Table S7).
Next, we examined the mediating role of CAT H in this relationship by using Vitamin B6, and E as the exposures. Our analysis showed a significant negative causal relationship between Vitamin B6 and CAT H (OR = 0.732, 95% CI 0.562 - 0.955, P = 0.038), while CAT H was associated with an increased risk of PDR (OR = 1.10, 95% CI 1.02 - 1.17, P = 0.0079) (Figure 3A). These findings suggest that Vitamin B6 may protect against ON by influencing CAT H, with a mediating effect of 12.5% (Figure 3B).
Baseline characteristics of population-based study from NHANES
In this investigation, there were a total of 677 DR patients and 4817 controls, with 547 participants classified as mild NPDR, 99 moderate/severe NPDR, and 31 confirmed as PDR (Table 2; Supplementary Table S8). The average age, gender distribution, race, and education levels of different groups are shown in Table 2. Building on prior MR studies, we assessed the relationship between vitamin B6, vitamin intake, and DR within this demographic. The average concentrations of vitamin B6 were measured at 74.6 mmol/L, 68.2 mmol/L, 55.3 mmol/L, and 49.0 mmol/L in non-DR, mild NPDR, moderate/severe NPDR, and PDR, respectively. Regarding vitamin intakes, significant differences were observed between the DR groups and the control group for vitamin B1, B2, B6, B12, and E, while differences in vitamin A, C, and K did not reach statistical significance. Specifically, the levels of vitamin B family and vitamin E were significantly lower in the DR group compared to the control group, with the lowest levels observed in the PDR group. The results from the NHANES study indicate that the severity of DR is significantly associated with the intake of B vitamins and vitamin E, the lower the intake, the more severe the DR. These findings are consistent with the previous MR analysis, suggesting that B vitamins and vitamin E could be important targets for the prevention or treatment of DR.
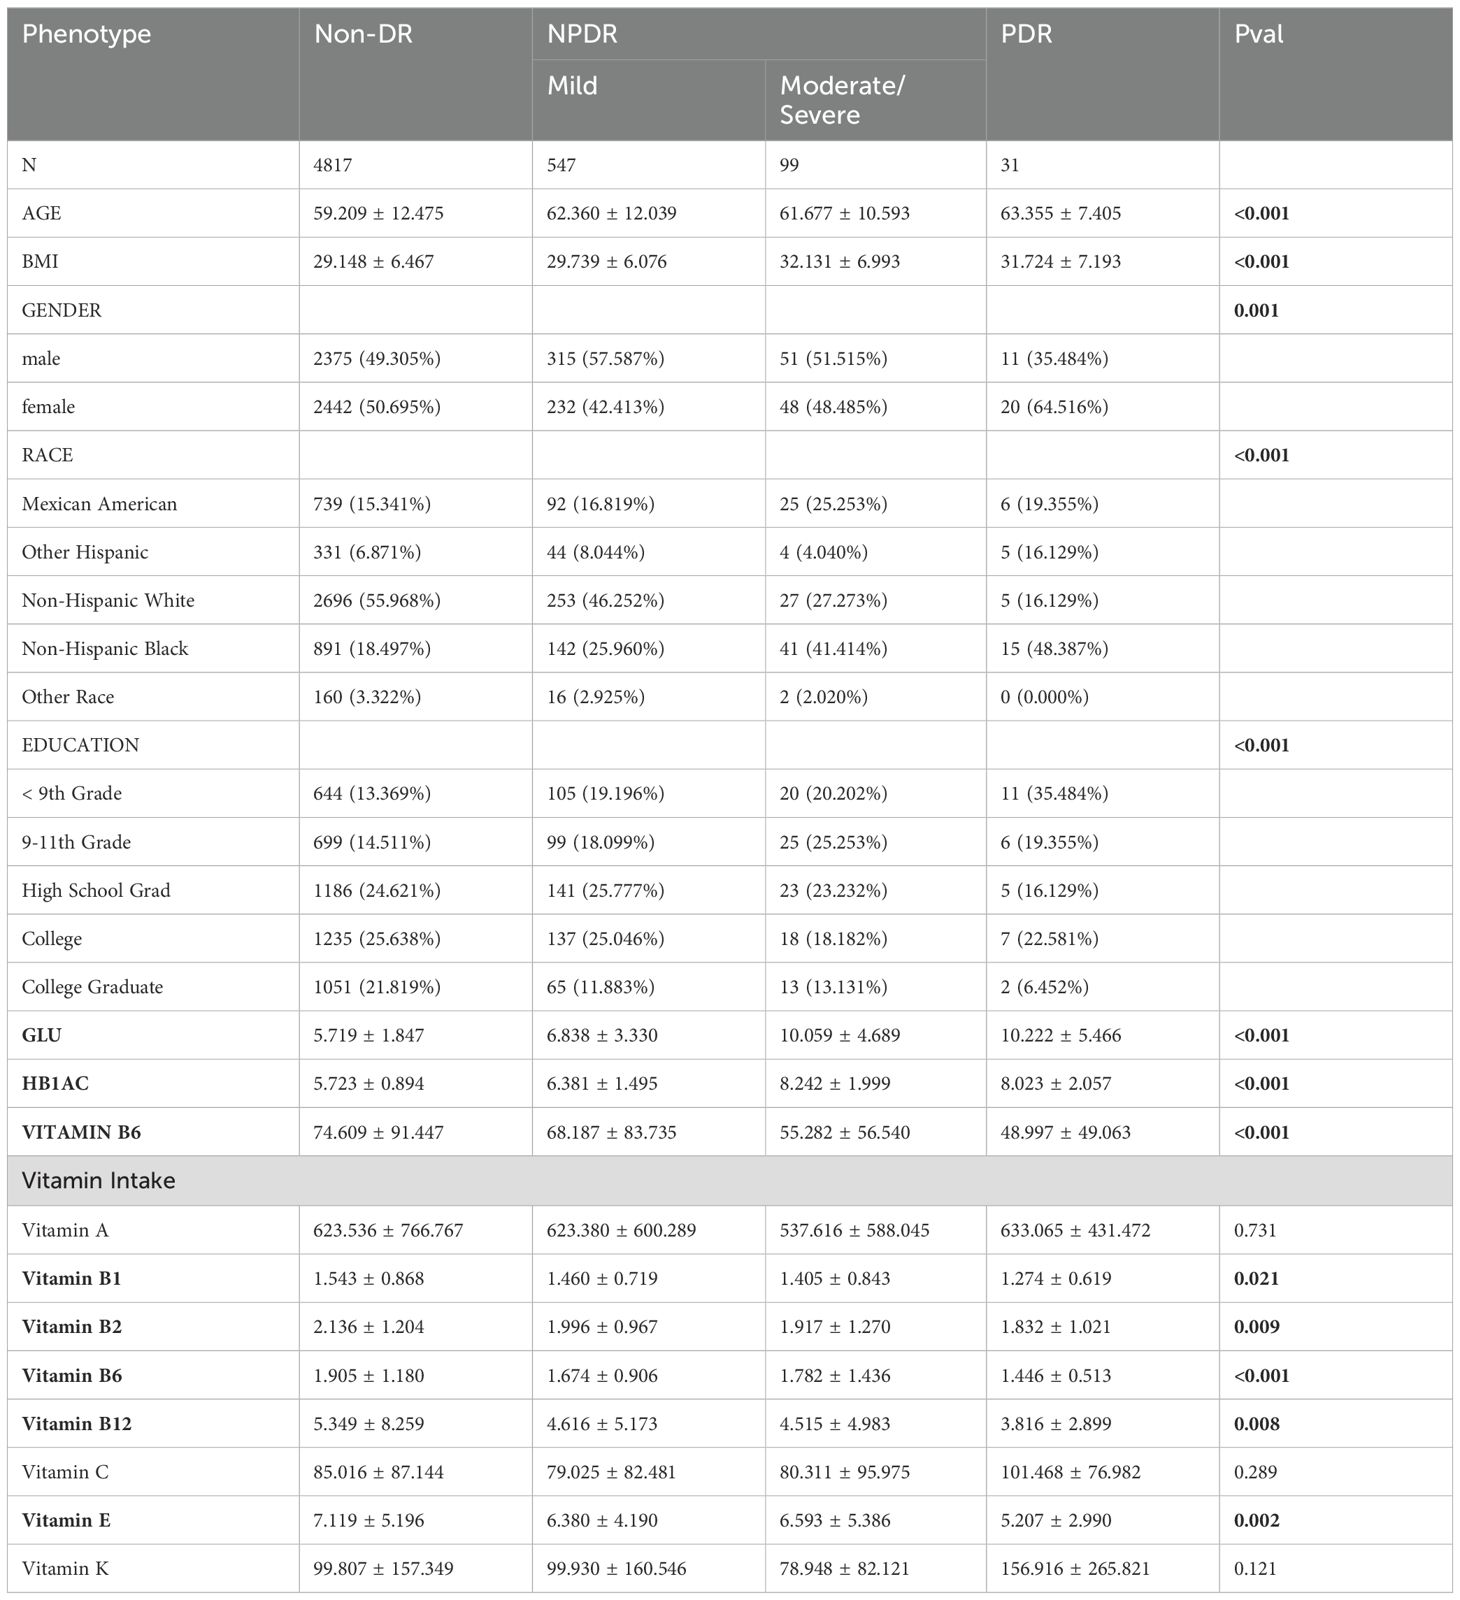
Table 2. Weighted characteristics of the study population based on DR.
Association between Vitamin B6, Vitamin E, and DR
In both previous MR and cross-sectional studies, vitamins B6 and E were identified as having a protective effect against DR. Table 3 displays the outcomes from the multivariate regression analysis. In the unadjusted model, vitamin B6 [-0.023 (-0.033 ~ -0.013), P < 0.00001] and vitamin E [-0.004 (-0.007 ~ -0.002), P < 0.00032] were strongly associated with DR. Following adjustments for age, gender, race in model 2 and all covariates in model 3, the relationship between vitamin B6, E and DR were still significant (Table 3). These findings are consistent with the results from previous MR and Cross-Sectional studies, further confirming that vitamins B6 and E may play an important role in treating DR.
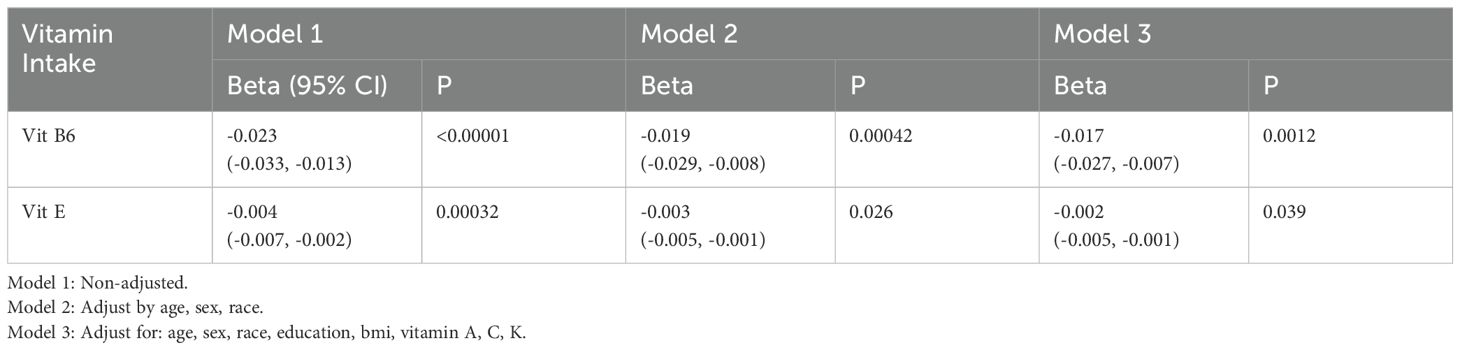
Table 3. The association between Vitamin Intake and DR.
We performed a smooth curve fit to describe the nonlinear relationship between vitamins and DR. Using a two-segment linear regression model, we found a nonlinear relationship between vitamin B6, E, and DR, suggesting that with increased intake of vitamin B6 (Figure 7A) and vitamin E (Figure 7B), there is a noticeable decrease in the risk and severity of DR.
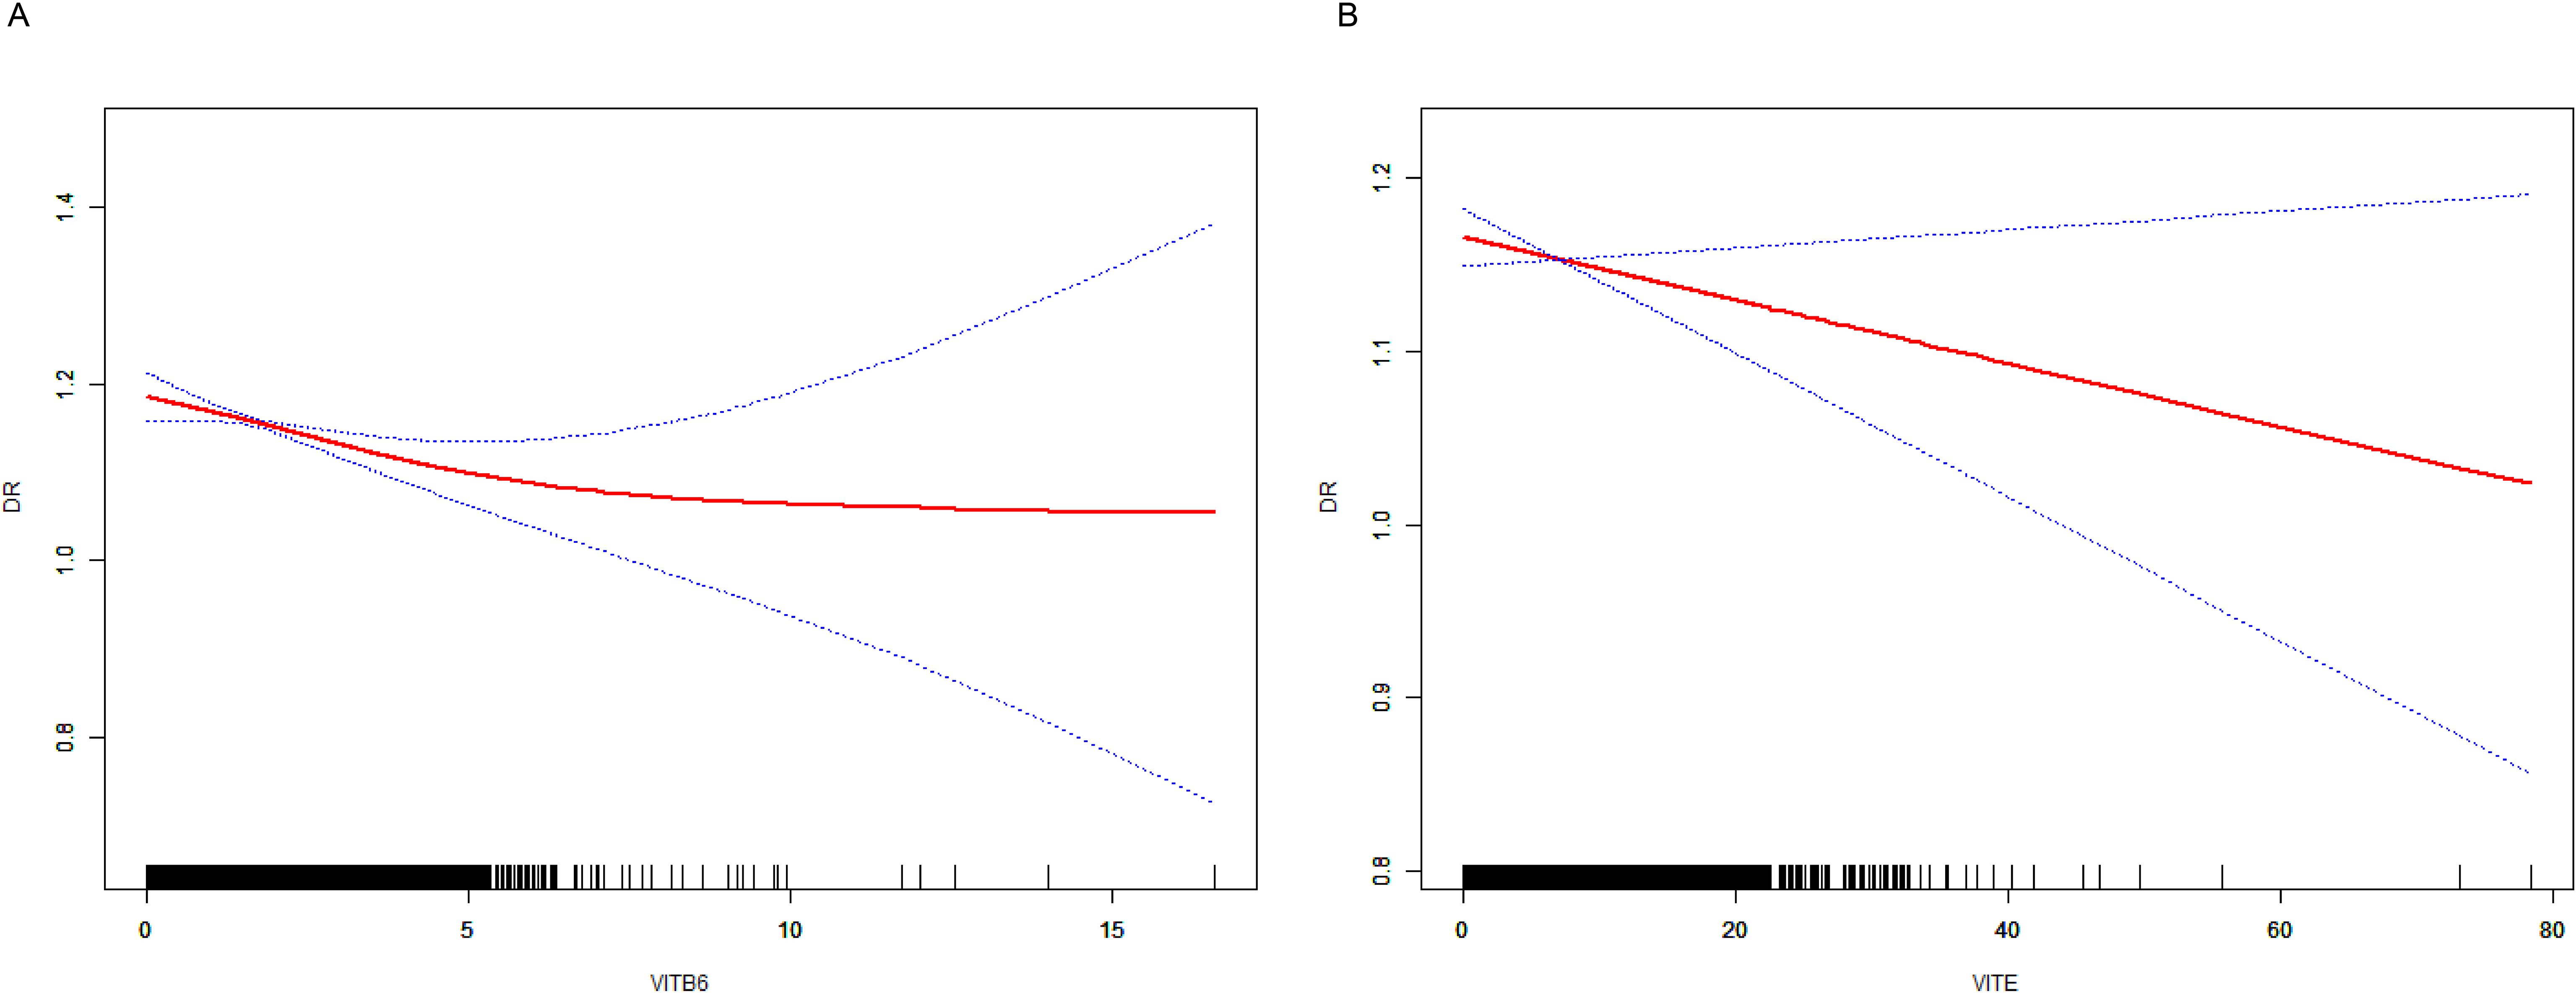
Figure 7. The result of the smooth curve of vitamins and DR. (A) the smooth curve of vitamin B6 and DR. (B) the smooth curve of vitamin E and DR.
Discussion
In this study, we utilized MR analysis and cross-sectional data to explore the association between Cats, immune cells, metabolites, vitamins, and DR. Our findings indicate the pathogenic effects of CAT H on DR and the protective effects of vitamin B6, and E. Additionally, we highlighted the causal effects of immune cells, metabolites in DR, and the interactions between immune cells and CAT H. This study is pioneering in combining MR analysis with a cross-sectional study based on the NHANES database, systematically analyzing the causal relationships and correlations between various exposures and DR. By corroborating findings from both approaches, we have enhanced the reliability of our results, suggesting that CAT H could become crucial indicators of the risk of DR, and vitamin B6 and E could become potential therapeutics for DR.
The development and progression of diabetes and diabetic complications involve a highly complex process in which proteolytic events play a crucial role (42–45). Among these, CATs have garnered significant interest for their role in proteolytic events. In this study, we conducted a large-scale genetic-based MR analysis to investigate the causal relationship between nine different CATs and the risk and the progression of DR. Through two-sample and mediation MR analyses, we identified CAT H as a significant risk factor for DR. Additionally, we found that immune cells can influence DR mediated by CAT H. Some studies indicate that patients with the type 1 diabetes mellitus (T1DM) risk variant often exhibit higher CAT H transcription levels, an earlier onset of the disease, and a rapid decline in β-cell function (46, 47). CAT H, a lysosomal cysteine protease, plays a prominent role in physiological and pathological processes due to its unique endopeptidase activity (25). We have identified a significant positive causal relationship between CAT H and both NPDR and PDR, suggesting that CAT H may play a significant role in the onset and progression of DR. Previous research found that CAT B, L, and H are expressed constitutively in most immune cells, playing roles in both innate and adaptive immune responses (48). Cathepsin H is a lysosomal cysteine protease involved in protein degradation and processing. In the context of diabetic retinopathy, cathepsins have been implicated in the remodeling of the extracellular matrix (ECM) and in the regulation of inflammation (49). Dysregulation of cathepsin H can contribute to excessive ECM degradation, leading to retinal damage and the progression of DR. Additionally, cathepsin H may influence the activation of various signaling pathways that are involved in inflammatory responses, further exacerbating retinal damage. Previous studies have shown that increased cathepsin activity is associated with higher levels of inflammation and tissue degradation in diabetic complications (50), suggesting that cathepsin H could play a role in the pathogenesis of DR. In our study, we found that certain immune cells can increase the risk of DR by upregulating CAT H expression. This suggests that the interaction between immune cells and CAT H plays an important role in the pathogenesis of DR. Future research should conduct more experiments to investigate this further.
Recent studies have revealed that the pathological processes of DR are associated with long-term metabolic disturbances (51, 52). With advancements in metabolomics, metabolites and metabolic pathways linked to DR are continually being discovered (53). In our study, we utilized serum metabolomics GWAS to analyze NPDR and PDR, identifying metabolites causally linked to DR and subsequently performing enrichment analysis to determine the metabolic pathways most strongly associated with NPDR and PDR. Previous study found that sphingolipid metabolism may play an important role in DR pathogenesis (54), and another study suggested that caffeine metabolism will reduce the risk of DR in T2DM (55), the results of these studies are consistent with our findings. Previous research has identified the arginine metabolic pathway as a potential new treatment strategy for DR (56). Our study confirms that this pathway is significantly associated with DR, particularly in PDR, suggesting its crucial role in the progression of DR, especially in its later stages. Targeting this pathway may help reduce the incidence of PDR. In addition, we also found that the biosynthesis of valine, leucine, and isoleucine is highly significant in PDR, consistent with previous research findings (57). Based on our results, future research should focus on these pathways as potential drug targets, providing new strategies for the treatment and prevention of PDR.
Previous studies have found that vitamins may play an important role in DR (58, 59). A study found no significant differences in serum levels of vitamins B1 and B2 between diabetic patients and healthy controls, while levels of vitamins B6, B9, and B12 were significantly lower in diabetics. Additionally, only vitamin B12 levels were significantly lower in diabetic patients with retinopathy compared to those without, with no significant differences in B1, B2, B6, and B9 levels (60). Vitamin E, comprising tocopherol and tocotrienol, is recognized as one of the most potent antioxidants, known to suppress angiogenesis and reduce oxidative stress (61, 62). A Study also found that vitamin D levels in patients with DR are significantly lower than in control groups, indicating that vitamin D deficiency is a major risk factor for DR (63). Several studies have demonstrated that the mean serum level of vitamin E is significantly lower in patients with DR compared to those without DR (64, 65), but a study showed no significant difference in the serum vitamin E levels between patients with no DR and any DR severities (66). Despite previous studies exploring the relationship between vitamins and DR, the results remain controversial and lack large-scale confirmation. Through combined MR and NHANES analysis, we demonstrated a significant causal relationship between vitamins B6 and E and PDR, suggesting their important protective role in PDR. In our cross-sectional study, we found that blood levels of vitamin B6 progressively decreased across the non-DR, mild and moderate/severe NPDR, and PDR groups. Similarly, the intake levels of vitamins B1, B2, B6, B12, and E also decreased progressively. Along with MR analysis, these findings strongly suggest that these vitamins are directly related to the severity of DR and could serve as therapeutic targets for the disease. Further experiments are needed to validate the mechanisms through which vitamins affect DR. Additionally, our mediation MR analysis revealed that vitamin B6 could reduce the risk of PDR by acting on CAT H. Previous study found that vitamin B6 can inhibit the activity of CAT B, but its relationship with CAT H requires further experimental validation (67). Vitamin B6 helps reduce homocysteine levels and possesses anti-inflammatory properties, which may protect against vascular damage and microvascular complications in diabetic retinopathy (68). Vitamin E acts as an antioxidant, stabilizing cell membranes and reducing oxidative stress, which may protect retinal blood vessels and lower the risk of diabetic retinopathy (69). However, further experimental studies are needed to explore the biological mechanisms of Vitamin B6 and E in DR.
This study is the first to indicate that CAT H may have a causal effect on the risk and progression of DR. MR analysis effectively acts as a natural randomized controlled trial (RCT), and the GWAS data used were extracted from the latest versions, covering the largest European population to date. Therefore, the MR analysis method used in this study remains the most effective approach for determining the causal relationship between CATs and DR. Our study is the first to use mediation MR to investigate the relationship between immune cells and CATs, and further identify the mediating role of CAT H between immune cells and DR. Subsequently, we combined MR analysis and cross-sectional studies to identify the significant protective roles of vitamins B6 and E in DR, particularly in PDR. These findings suggest that the B vitamin family and vitamin E could serve as effective therapeutic targets for DR, especially in the treatment and prevention of PDR. Our findings provide constructive advice for the management of patients with DR, suggesting that the use of vitamin B6 and E in DR patients should be effective in preventing and treating PDR.
Study limitations
The current study has several limitations: (1). As this study exclusively used GWAS data from the European population, it may not accurately represent other ethnicities or races worldwide. (2) In the cross-sectional study, despite our efforts to include a broad range of participants from NHANES, the number of participants was still limited, especially for the PDR group only has 31 patients, potentially leading to bias in the results. (3) Some covariates may not have been considered in the multiple regression analysis. (4) Despite efforts to identify and eliminate outlier variants, the potential for horizontal pleiotropy to affect the findings cannot be entirely ruled out. (5) A significant limitation of our study is the reliance on GWAS data predominantly derived from European populations and the use of NHANES data, which includes limited sample sizes for certain DR categories, particularly PDR. This reliance on a specific ethnic group limits the generalizability of our findings to other populations. The small sample size for PDR in the NHANES data may also introduce bias and affect the robustness of our results. Therefore, our findings should be interpreted with caution, and future research should aim to validate these associations in larger, more diverse populations. This approach will help ensure that the results are applicable across different ethnicities and enhance the overall reliability of the study. Therefore, further validation of this study’s findings is necessary through multi-center epidemiological research and genetic engineering experiments, employing larger sample sizes and diverse populations.
Conclusion
Using MR analysis, this study was the first to explore the causal impact of CATs, immune cells, metabolites, and vitamins on DR from a genetic perspective, with findings validated by a cross-sectional study based on NHANES data. The results confirmed a causal association between CAT H and a significantly increased risk of DR, identified the metabolomic pathways that play an important role in the progression of DR and also explored the protective effects and therapeutic potential of vitamin B6 and E in PDR. However, the accuracy and validity of these findings require further verification through additional basic and clinical studies on DR.
Data availability statement
The original contributions presented in the study are included in the article/Supplementary Material. Further inquiries can be directed to the corresponding author.
Author contributions
HZ: Methodology, Validation, Investigation, Software, Writing – review & editing. JW: Conceptualization, Data curation, Formal analysis, Investigation, Methodology, Project administration, Writing original draft, Writing – review & editing. XC: Funding acquisition, Resources, Software, Supervision, Validation, Visualization, Writing – original draft, Writing – review & editing.
Funding
The author(s) declare financial support was received for the research, authorship, and/or publication of this article. This study was funded by the Cambridge Trust, the Addenbrooke’s Charitable Trust, Cambridge University Hospitals, and the NIHR Cambridge Biomedical Research Centre (NIHR203312).
Acknowledgments
We sincerely thank the FinnGen consortium, the UK Biobank and Open Gwas Project for publicly providing all the data for this MR analysis. We also sincerely thank the NHANES database.
Conflict of interest
The authors declare that the research was conducted in the absence of any commercial or financial relationships that could be construed as a potential conflict of interest.
Publisher’s note
All claims expressed in this article are solely those of the authors and do not necessarily represent those of their affiliated organizations, or those of the publisher, the editors and the reviewers. Any product that may be evaluated in this article, or claim that may be made by its manufacturer, is not guaranteed or endorsed by the publisher.
Supplementary material
The Supplementary Material for this article can be found online at: https://www.frontiersin.org/articles/10.3389/fimmu.2024.1443236/full#supplementary-material
Supplementary Figure 1 | the MR result of immune cells and NPDR.
Supplementary Figure 2 | the MR result of immune cells and PDR.
References
1. Leasher JL, Bourne RR, Flaxman SR, Jonas JB, Keeffe J, Naidoo K, et al. Global estimates on the number of people blind or visually impaired by diabetic retinopathy: a meta-analysis from 1990 to 2010. Diabetes Care. (2016) 39:1643–9. doi: 10.2337/dc15-2171
2. Shah AR, Gardner TW. Diabetic retinopathy: research to clinical practice. Clin Diabetes Endocrinol. (2017) 3:1–7. doi: 10.1186/s40842-017-0047-y
3. Teo ZL, Tham Y-C, Yu M, Chee ML, Rim TH, Cheung N, et al. Global prevalence of diabetic retinopathy and projection of burden through 2045: systematic review and meta-analysis. Ophthalmology. (2021) 128:1580–91. doi: 10.1016/j.ophtha.2021.04.027
4. Ong KL, Stafford LK, Mclaughlin SA, Boyko EJ, Vollset SE, Smith AE, et al. Global, regional, and national burden of diabetes from 1990 to 2021, with projections of prevalence to 2050: a systematic analysis for the Global Burden of Disease Study 2021. Lancet. (2023) 402:203–34. doi: 10.1016/S0140-6736(23)01301-6
5. Yau JW, Rogers SL, Kawasaki R, Lamoureux EL, Kowalski JW, Bek T, et al. Global prevalence and major risk factors of diabetic retinopathy. Diabetes Care. (2012) 35:556–64. doi: 10.2337/dc11-1909
6. Flaxel CJ, Adelman RA, Bailey ST, Fawzi A, Lim JI, Vemulakonda GA, et al. Diabetic retinopathy preferred practice pattern®. Ophthalmology. (2020) 127:P66–P145. doi: 10.1016/j.ophtha.2020.06.047
7. Dai L, Sheng B, Chen T, Wu Q, Liu R, Cai C, et al. A deep learning system for predicting time to progression of diabetic retinopathy. Nat Med. (2024), 1–11. doi: 10.1038/s41591-023-02702-z
8. Dănilă A-I, Ghenciu LA, Stoicescu ER, Bolintineanu SL, Iacob R, Săndesc M-A, et al. Aldose reductase as a key target in the prevention and treatment of diabetic retinopathy: A comprehensive review. Biomedicines. (2024) 12:747. doi: 10.3390/biomedicines12040747
9. Wong TY, Sun J, Kawasaki R, Ruamviboonsuk P, Gupta N, Lansingh VC, et al. Guidelines on diabetic eye care: the international council of ophthalmology recommendations for screening, follow-up, referral, and treatment based on resource settings. Ophthalmology. (2018) 125:1608–22. doi: 10.1016/j.ophtha.2018.04.007
10. Wang J-H, Roberts GE, Liu G-S. Updates on gene therapy for diabetic retinopathy. Curr Diabetes Rep. (2020) 20:1–12. doi: 10.1007/s11892-020-01308-w
11. Gauldin D, Ahmad KT, Ferguson S, Uwaydat SH. Exposure of contralateral eyes to laser radiation during retinal photocoagulation. Curr Eye Res. (2021) 46:1424–7. doi: 10.1080/02713683.2021.1884729
12. Reiser J, Adair B, Reinheckel T. Specialized roles for cysteine cathepsins in health and disease. J Clin Invest. (2010) 120:3421–31. doi: 10.1172/JCI42918
13. Fonović M, Turk B. Cysteine cathepsins and extracellular matrix degradation. Biochim Biophys Acta (BBA)-general Subj. (2014) 1840:2560–70. doi: 10.1016/j.bbagen.2014.03.017
14. Wang HL, Narisawa M, Wu P, Meng X, Cheng XW. The many roles of cathepsins in restenosis. Heliyon. (2024) 10. doi: 10.1016/j.heliyon.2024.e24720
15. Xie X, Lan Q, Zhao J, Zhang S, Liu L, Zhang Y, et al. Structure-based design of pan-coronavirus inhibitors targeting host cathepsin L and calpain-1. Signal Transduct Target Ther. (2024) 9:54. doi: 10.1038/s41392-024-01758-8
16. Frørup C, Jensen MH, Haupt-Jorgensen M, Buschard K, Størling J, Pociot F, et al. Elevated cathepsin S serum levels in new-onset type 1 diabetes and autoantibody-positive siblings. Diabetes. (2024), db230911. doi: 10.2337/db23-0911
17. Zhao D, Huang Z-K, Liang Y, Li Z-J, Zhang X-W, Li K-H, et al. Monocytes release pro-cathepsin D to drive blood-to-brain transcytosis in diabetes. Circ Res. (2024). doi: 10.1161/CIRCRESAHA.123.323622
18. Liu C, Yao Q, Hu T, Cai Z, Xie Q, Zhao J, et al. Cathepsin B deteriorates diabetic cardiomyopathy induced by streptozotocin via promoting NLRP3-mediated pyroptosis. Mol Therapy-Nucleic Acids. (2022) 30:198–207. doi: 10.1016/j.omtn.2022.09.019
19. Audzeyenka I, Rachubik P, Rogacka D, Typiak M, Kulesza T, Angielski S, et al. Cathepsin C is a novel mediator of podocyte and renal injury induced by hyperglycemia. Biochim Biophys Acta (BBA)-Molecular Cell Res. (2020) 1867:118723. doi: 10.1016/j.bbamcr.2020.118723
20. Ding L, Houben T, Oligschlaeger Y, Bitorina AV, Verwer BJ, Tushuizen ME, et al. Plasma cathepsin D activity rather than levels correlates with metabolic parameters of type 2 diabetes in male individuals. Front Endocrinol. (2020) 11:575070. doi: 10.3389/fendo.2020.575070
21. Brings S, Fleming T, Herzig S, Nawroth PP, Kopf S. Urinary cathepsin L is predictive of changes in albuminuria and correlates with glucosepane in patients with type 2 diabetes in a closed-cohort study. J Diabetes its Complications. (2020) 34:107648. doi: 10.1016/j.jdiacomp.2020.107648
22. Jing Y, Shi J, Lu B, Zhang W, Yang Y, Wen J, et al. Association of circulating cathepsin S and cardiovascular disease among patients with type 2 diabetes: A cross-sectional community-based study. Front Endocrinol. (2021) 12:615913. doi: 10.3389/fendo.2021.615913
23. Niu R, Wang J, Geng C, Li Y, Dong L, Liu L, et al. Tandem mass tag-based proteomic analysis reveals cathepsin-mediated anti-autophagic and pro-apoptotic effects under proliferative diabetic retinopathy. Aging (Albany NY). (2021) 13:973. doi: 10.18632/aging.202217
24. Lessieur EM, Liu H, Saadane A, Du Y, Tang J, Kiser J, et al. Neutrophil-derived proteases contribute to the pathogenesis of early diabetic retinopathy. Invest Ophthalmol Visual Sci. (2021) 62:7–7. doi: 10.1167/iovs.62.13.7
25. Wang Y, Zhao J, Gu Y, Wang H, Jiang M, Zhao S, et al. Cathepsin H: Molecular characteristics and clues to function and mechanism. Biochem Pharmacol. (2023) 212:115585. doi: 10.1016/j.bcp.2023.115585
26. Perišić Nanut M, Pečar Fonović U, Jakoš T, Kos J. The role of cysteine peptidases in hematopoietic stem cell differentiation and modulation of immune system function. Front Immunol. (2021) 12:680279. doi: 10.3389/fimmu.2021.680279
27. Golpasandi H, Rahimi M, Ahmadi S. Combined effects of vitamin D3 supplementation and aerobic training on cardiac cathepsin D and insulin resistance in diabetic rats induced by high-fat diet and streptozotocin. Iranian J Endocrinol Metab. (2023) 24:362–72.
28. Golpasandi H, Rahimi MR, Ahmadi S, Łubkowska B, Cięszczyk P. Effects of vitamin D3 supplementation and aerobic training on autophagy signaling proteins in a rat model type 2 diabetes induced by high-fat diet and streptozotocin. Nutrients. (2023) 15:4024. doi: 10.3390/nu15184024
29. Wu F, Huang Y, Hu J, Shao Z. Mendelian randomization study of inflammatory bowel disease and bone mineral density. BMC Med. (2020) 18:1–19. doi: 10.1186/s12916-020-01778-5
30. Sanderson E. Multivariable Mendelian randomization and mediation. Cold Spring Harbor Perspect Med. (2021) 11:a038984. doi: 10.1101/cshperspect.a038984
31. Kurki MI, Karjalainen J, Palta P, Sipilä TP, Kristiansson K, Donner KM, et al. FinnGen provides genetic insights from a well-phenotyped isolated population. Nature. (2023) 613:508–18.
32. Orrù V, Steri M, Sidore C, Marongiu M, Serra V, Olla S, et al. Complex genetic signatures in immune cells underlie autoimmunity and inform therapy. Nat Genet. (2020) 52:1036–45. doi: 10.1038/s41588-020-0684-4
33. Chen Y, Lu T, Pettersson-Kymmer U, Stewart ID, Butler-Laporte G, Nakanishi T, et al. Genomic atlas of the plasma metabolome prioritizes metabolites implicated in human diseases. Nat Genet. (2023) 55:44–53. doi: 10.1038/s41588-022-01270-1
34. Sun BB, Maranville JC, Peters JE, Stacey D, Staley JR, Blackshaw J, et al. Genomic atlas of the human plasma proteome. Nature. (2018) 558:73–9. doi: 10.1038/s41586-018-0175-2
35. Bowden J, Davey Smith G, Haycock PC, Burgess S. Consistent estimation in Mendelian randomization with some invalid instruments using a weighted median estimator. Genet Epidemiol. (2016) 40:304–14. doi: 10.1002/gepi.21965
36. Pierce BL, Ahsan H, Vanderweele TJ. Power and instrument strength requirements for Mendelian randomization studies using multiple genetic variants. Int J Epidemiol. (2011) 40:740–52. doi: 10.1093/ije/dyq151
37. Burgess S, Thompson SG, Collaboration CCG. Avoiding bias from weak instruments in Mendelian randomization studies. Int J Epidemiol. (2011) 40:755–64. doi: 10.1093/ije/dyr036
38. Hemani G, Zheng J, Elsworth B, Wade KH, Haberland V, Baird D, et al. The MR-Base platform supports systematic causal inference across the human phenome. elife. (2018) 7:e34408. doi: 10.7554/eLife.34408
39. Burgess S, Bowden J. Integrating summarized data from multiple genetic variants in Mendelian randomization: bias and coverage properties of inverse-variance weighted methods. arXiv preprint arXiv:1512.04486. (2015).
40. Ye T, Shao J, Kang H. Debiased inverse-variance weighted estimator in two-sample summary-data Mendelian randomization. Ann Stat. (2021) 49:2079–100. doi: 10.1214/20-AOS2027
41. Control, C.F.D., and Prevention. The National Health and Nutritional Examination Survey (NHANES) Analytic and Reporting Guidelines. Atlanta, GA: CDC (2006).
42. Brownlee M, Vlassara H, Cerami A. Nonenzymatic glycosylation and the pathogenesis of diabetic complications. Ann Internal Med. (1984) 101:527–37. doi: 10.7326/0003-4819-101-4-527
43. Mclennan S, Zilkens R, Yue D, Turtle J. Reduction of leucocyte proteolytic enzyme activity in diabetic patients with microalbuminuria and proteinuria: its possible role in diabetic nephropathy. Diabetic Med. (1996) 13:145–9.
44. Lobmann R, Ambrosch A, Schultz G, Waldmann K, Schiweck S, Lehnert H. Expression of matrix-metalloproteinases and their inhibitors in the wounds of diabetic and non-diabetic patients. Diabetologia. (2002) 45:1011–6. doi: 10.1007/s00125-002-0868-8
45. Giebel SJ, Menicucci G, Mcguire PG, Das A. Matrix metalloproteinases in early diabetic retinopathy and their role in alteration of the blood–retinal barrier. Lab Invest. (2005) 85:597–607. doi: 10.1038/labinvest.3700251
46. Inshaw JR, Cutler AJ, Crouch DJ, Wicker LS, Todd JA. Genetic variants predisposing most strongly to type 1 diabetes diagnosed under age 7 years lie near candidate genes that function in the immune system and in pancreatic β-cells. Diabetes Care. (2020) 43:169–77. doi: 10.2337/dc19-0803
47. Koskinen MK, Mikk M-L, Laine A-P, Lempainen J, Löyttyniemi E, Vähäsalo P, et al. Longitudinal pattern of first-phase insulin response is associated with genetic variants outside the class II HLA region in children with multiple autoantibodies. Diabetes. (2020) 69:12–9. doi: 10.2337/db19-0329
48. Perišić Nanut M, Sabotič J, Jewett A, Kos J. Cysteine cathepsins as regulators of the cytotoxicity of NK and T cells. Front Immunol. (2014) 5:616. doi: 10.3389/fimmu.2014.00616
49. Yadati T, Houben T, Bitorina A, Shiri-Sverdlov R. The ins and outs of cathepsins: physiological function and role in disease management. Cells. (2020) 9:1679. doi: 10.3390/cells9071679
50. Liu J, Ma L, Yang J, Ren A, Sun Z, Yan G, et al. Increased serum cathepsin S in patients with atherosclerosis and diabetes. Atherosclerosis. (2006) 186:411–9. doi: 10.1016/j.atherosclerosis.2005.08.001
51. Fang J, Wang H, Niu T, Shi X, Xing X, Qu Y, et al. Integration of vitreous lipidomics and metabolomics for comprehensive understanding of the pathogenesis of proliferative diabetic retinopathy. J Proteome Res. (2023) 22:2293–306. doi: 10.1021/acs.jproteome.3c00007
52. Qian X, Klatt S, Bennewitz K, Wohlfart DP, Lou B, Meng Y, et al. Impaired detoxification of trans, trans-2, 4-decadienal, an oxidation product from omega-6 fatty acids, alters insulin signaling, gluconeogenesis and promotes microvascular disease. Advanced Sci. (2024) 11:2302325. doi: 10.1002/advs.202302325
53. Wang Z, Tang J, Jin E, Ren C, Li S, Zhang L, et al. Metabolomic comparison followed by cross-validation of enzyme-linked immunosorbent assay to reveal potential biomarkers of diabetic retinopathy in Chinese with type 2 diabetes. Front Endocrinol. (2022) 13:986303. doi: 10.3389/fendo.2022.986303
54. Delioğlu ENE, Uğurlu N, Erdal E, Malekghasemi S, Çağıl N. Evaluation of sphingolipid metabolism on diabetic retinopathy. Indian J Ophthalmol. (2021) 69:3376–80. doi: 10.4103/ijo.IJO_3724_20
55. Alcubierre N, Granado-Casas M, Bogdanov P, Hernández C, Ramos H, Castelblanco E, et al. Caffeine and the risk of diabetic retinopathy in type 2 diabetes mellitus: findings from clinical and experimental studies. Nutrients. (2023) 15:1169. doi: 10.3390/nu15051169
56. Sun Y, Kong L, Zhang A-H, Han Y, Sun H, Yan G-L, et al. A hypothesis from metabolomics analysis of diabetic retinopathy: arginine-creatine metabolic pathway may be a new treatment strategy for diabetic retinopathy. Front Endocrinol. (2022) 13:858012. doi: 10.3389/fendo.2022.858012
57. Wang H, Li S, Wang C, Wang Y, Fang J, Liu K. Plasma and vitreous metabolomics profiling of proliferative diabetic retinopathy. Invest Ophthalmol Visual Sci. (2022) 63:17–7. doi: 10.1167/iovs.63.2.17
58. Dow C, Mancini F, Rajaobelina K, Boutron-Ruault M-C, Balkau B, Bonnet F, et al. Diet and risk of diabetic retinopathy: a systematic review. Eur J Epidemiol. (2018) 33:141–56. doi: 10.1007/s10654-017-0338-8
59. Ruamviboonsuk V, Grzybowski A. The roles of vitamins in diabetic retinopathy: A narrative review. J Clin Med. (2022) 11:6490. doi: 10.3390/jcm11216490
60. Satyanarayana A, Balakrishna N, Pitla S, Reddy PY, Mudili S, Lopamudra P, et al. Status of B-vitamins and homocysteine in diabetic retinopathy: association with vitamin-B12 deficiency and hyperhomocysteinemia. PloS One. (2011) 6:e26747. doi: 10.1371/journal.pone.0026747
61. Nakagawa K, Shibata A, Yamashita S, Tsuzuki T, Kariya J, Oikawa S, et al. In vivo angiogenesis is suppressed by unsaturated vitamin E, tocotrienol. J Nutr. (2007) 137:1938–43. doi: 10.1093/jn/137.8.1938
62. Peh HY, Tan WD, Liao W, Wong WF. Vitamin E therapy beyond cancer: Tocopherol versus tocotrienol. Pharmacol Ther. (2016) 162:152–69. doi: 10.1016/j.pharmthera.2015.12.003
63. Zhang J, Upala S, Sanguankeo A. Relationship between vitamin D deficiency and diabetic retinopathy: a meta-analysis. Can J Ophthalmol. (2017) 52:S39–44. doi: 10.1016/j.jcjo.2017.09.026
64. Said N, Hadhoud K, Nada W, El Tarhouny S. Superoxide dismutase, glutathione peroxidase and vitamin E in patients with diabetic retinopathy. Life Sci J. (2013) 10:1851–6.
65. Kumari S, Pradhan T, Panda TK. Trace minerals and oxidative stress in diabetic retinopathy. Bangladesh J Med Sci. (2014) 13:175–9. doi: 10.3329/bjms.v13i2.14963
66. Lam CS, Benzie IF, Choi SW, Chan LY, Yeung VT, Woo GC. Relationships among diabetic retinopathy, antioxidants, and glycemic control. Optom Vis Sci. (2011) 88:251–6. doi: 10.1097/OPX.0b013e318208494a
67. Inubushi T, Okada M, Matsui A, Hanba J, Murata E, Katunuma N. Effect of dietary vitamin B6 contents on antibody production. BioFactors. (2000) 11:93–6. doi: 10.1002/biof.5520110127
68. Singh M, Mohan A, Chaubey A, Saxena S. Nutrient Supplementation in Diabetic Macular Edema. In: Diabetic Macular Edema. Springer (2023). p. 199–208.
Keywords: diabetic retinopathy, cathepsin, immune cell, metabolite, vitamin, Mendelian randomization, cross-sectional study, NHANES
Citation: Zhou H, Wang J and Cui X (2024) Causal effect of immune cells, metabolites, cathepsins, and vitamin therapy in diabetic retinopathy: a Mendelian randomization and cross-sectional study. Front. Immunol. 15:1443236. doi: 10.3389/fimmu.2024.1443236
Received: 03 June 2024; Accepted: 10 September 2024;
Published: 01 October 2024.
Edited by:
Philippe Lesnik, Institut National de la Santé et de la Recherche Médicale (INSERM), FranceReviewed by:
Jiang-Hui Wang, Centre for Eye Research Australia, AustraliaShaowei Jiang, Jiahui International Hospital, China
Daniel Petrovič, University of Ljubljana, Slovenia
Copyright © 2024 Zhou, Wang and Cui. This is an open-access article distributed under the terms of the Creative Commons Attribution License (CC BY). The use, distribution or reproduction in other forums is permitted, provided the original author(s) and the copyright owner(s) are credited and that the original publication in this journal is cited, in accordance with accepted academic practice. No use, distribution or reproduction is permitted which does not comply with these terms.
*Correspondence: Xuehao Cui, eGMzNTBAY2FtLmFjLnVr
†These authors share first authorship