 Yifan Huang1
 Songkai Yue1Jinhan Qiao2Yonghui Dong1
 Yunke Liu1
 Meng Zhang1Cheng Zhang3Chuanliang Chen4
 Yuqin Tang4*Jia Zheng1*
- 1Department of Orthopedics, People’s Hospital of Zhengzhou University, Henan Provincial People’s Hospital, Zhengzhou, Henan, China
- 2Department of Magnetic Resonance Imaging, The First Affiliated Hospital of Zhengzhou University, Zhengzhou, Henan, China
- 3Department of Immunology, College of Basic Medical Science, Dalian Medical University, Dalian, Liaoning, China
- 4Clinical Bioinformatics Experimental Center, People’s Hospital of Zhengzhou University, Henan Provincial People’s Hospital, Zhengzhou, Henan, China
Background: Interactions between the immune and metabolic systems may play a crucial role in the pathogenesis of metabolic syndrome-associated rheumatoid arthritis (MetS-RA). The purpose of this study was to discover candidate biomarkers for the diagnosis of RA patients who also had MetS.
Methods: Three RA datasets and one MetS dataset were obtained from the Gene Expression Omnibus (GEO) database. Differential expression analysis, weighted gene co-expression network analysis (WGCNA), and machine learning algorithms including Least Absolute Shrinkage and Selection Operator (LASSO) regression and Random Forest (RF) were employed to identify hub genes in MetS-RA. Enrichment analysis was used to explore underlying common pathways between MetS and RA. Receiver operating characteristic curves were applied to assess the diagnostic performance of nomogram constructed based on hub genes. Protein−protein interaction, Connectivity Map (CMap) analyses, and molecular docking were utilized to predict the potential small molecule compounds for MetS-RA treatment. qRT-PCR was used to verify the expression of hub genes in fibroblast-like synoviocytes (FLS) of MetS-RA. The effects of small molecule compounds on the function of RA-FLS were evaluated by wound-healing assays and angiogenesis experiments. The CIBERSORT algorithm was used to explore immune cell infiltration in MetS and RA.
Results: MetS-RA key genes were mainly enriched in immune cell-related signaling pathways and immune-related processes. Two hub genes (TYK2 and TRAF2) were selected as candidate biomarkers for developing nomogram with ideal diagnostic performance through machine learning and proved to have a high diagnostic value (area under the curve, TYK2, 0.92; TRAF2, 0.90). qRT-PCR results showed that the expression of TYK2 and TRAF2 in MetS-RA-FLS was significantly higher than that in non-MetS-RA-FLS (nMetS-RA-FLS). The combination of CMap analysis and molecular docking predicted camptothecin (CPT) as a potential drug for MetS-RA treatment. In vitro validation, CPT was observed to suppress the cell migration capacity and angiogenesis capacity of MetS-RA-FLS. Immune cell infiltration results revealed immune dysregulation in MetS and RA.
Conclusion: Two hub genes were identified in MetS-RA, a nomogram for the diagnosis of RA and MetS was established based on them, and a potential therapeutic small molecule compound for MetS-RA was predicted, which offered a novel research perspective for future serum−based diagnosis and therapeutic intervention of MetS-RA.
Introduction
Rheumatoid arthritis (RA) is a chronic, systemic, autoimmune inflammatory disease that primarily affects the joints and soft tissue around the joints (1). RA patients have a high risk of developing cardiovascular diseases (CVD) and premature death due to systemic inflammation, which can shorten their expected lifespan by 5-10 years (2). Metabolic syndrome (MetS) is a common phenotype associated with increased CVD risk, including elevated fasting blood glucose, elevated triglycerides, low high-density lipoprotein, increased waist circumference, and hypertension (3). There are increasing evidences that RA is related to various components of MetS, such as weight changes, quantitative and qualitative dyslipidemia, characteristic adipokine profile, and insulin resistance, which increase CVD mortality (4). Previous research has established that MetS was prevalent in RA patients and that the risk of developing moderate to severe RA was higher in MetS patients than in those without MetS. Importantly, MetS-associated RA (MetS-RA) patients have higher disease activity than non-MetS-RA (nMetS-RA) patients (5), which was associated with the number of MetS components (6), suggesting that MetS may have an inflammatory environment that promotes the development of more severe RA.
Most recently, the interface between the metabolic system and the immune system has aroused great interest (7). Changes in immune-metabolic crosstalk contribute to the development of autoimmune diseases (8). Adipokines such as leptin, adiponectin, and lipoic acid-2 play multiple metabolic roles, which contributes to the onset of MetS and participates in the inflammatory process and immune regulation of RA (9). Consequently, exploring the molecular associations between RA and MetS is of great clinical value and research significance.
Currently, integrated bioinformatics analysis has been widely applied to identify new diagnostic genes and pathogenic genes related to various diseases (10, 11). Nevertheless, the genes for the common diagnosis of RA and MetS and the genes associated with each other are scarcely understood. Accordingly, the primary purpose of this study is to screen out the hub genes between RA and MetS, construct a diagnostic model, and provide new insights into the prevention and treatment of MetS-RA.
In this study, we used a variety of bioinformatics tools to search for MetS-RA hub genes by collecting RA datasets and MetS datasets from the Gene Expression Omnibus (GEO). Two MetS-RA hub genes (TYK2 and TRAF2) were filtered by machine learning algorithms, and a diagnostic model for RA prediction was constructed. In addition, camptothecin (CPT), a potential small molecule compound for MetS-RA treatment, was discovered via connectivity map (CMap) analysis and molecular docking. We validated the expression of hub genes in fibroblast-like synoviocytes (FLS) from the synovium of MetS-RA patients and verified the effects of CPT on the cell migration and angiogenesis of MetS-RA-FLS in vitro. Finally, we explored the immune cell infiltration characteristics of RA and MetS.
Materials and methods
Microarray data collecting and processing
Three raw expression profile datasets of RA and healthy control groups, including GSE7307, GSE77298, and GSE206848, were obtained from the GEO database (https://www.ncbi.nlm.nih.gov/geo/) (12). The raw expression profile dataset GSE98895 of peripheral blood mononuclear cells (PBMCs) in MetS patients was obtained from the GEO database. Detailed description of the datasets is shown in Table 1. The combat function of “inSilicoMerging” package in R software (version 4.3.3) was used to merge three RA datasets and eliminate batch effect (13, 14).
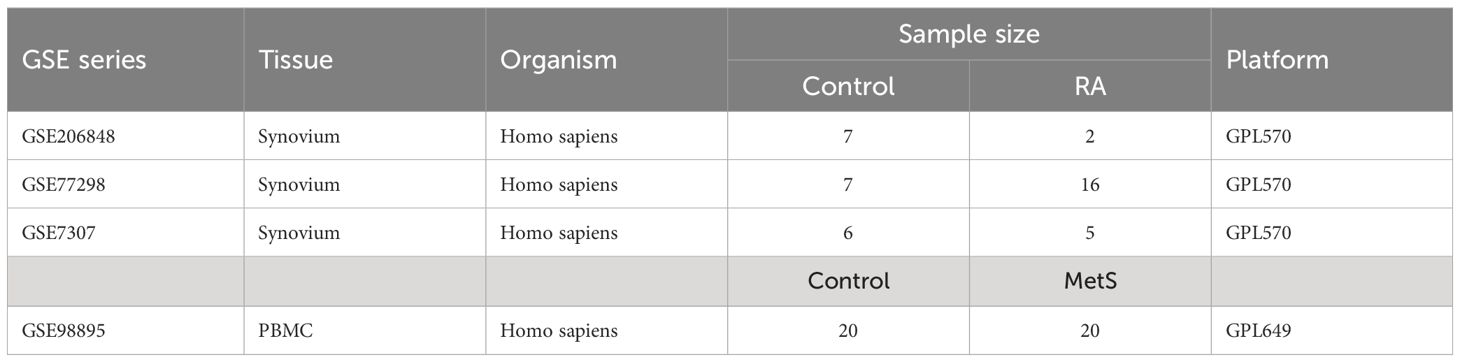
Table 1 Basic information of GEO datasets used in the study.
Differentially expressed genes analysis
Sangerbox Tools (http://www.sangerbox.com/tool) as a user-friendly interface supports differential analysis and provides interactive customizable analysis tools, including various kinds of correlation analyses, enrichment analyses, weighted correlation network analysis (WGCNA) as well as some other common tools and functions (15). Sangerbox Tools was utilized to missing values completion, data standardization, and gene symbol conversion of the integrated RA dataset and MetS dataset. The DEGs of RA and MetS datasets were obtained through the “Limma” package in R software (16), and the P value < 0.05 was statistically significant. The expression patterns of DEGs were then visualized in the form of volcanic plots and heatmaps.
Functional enrichment analysis
RA and MetS gene expression profile data were imported into Gene Set Enrichment Analysis (GSEA) software (version 4.3.1), and selected the Kyoto Encyclopedia of Genes and Genomes (KEGG) subset to evaluate the relevant pathways and molecular mechanisms. The DEGs were imported into Sangerbox Tools, KEGG and Gene Ontology Biological Process (GO-BP) enrichment analysis was completed based on the latest subset gene annotation. Absolute value of Normalized Enrichment Score (NES) > 1.5, Nominal P value (NP) < 0.05 and false discovery rate (FDR) < 0.05 were considered statistically significant. The results of enrichment analysis were visualized by Sangerbox Tools.
Weighted gene co-expression network analysis
The MetS gene expression profile data was imported into Sangerbox Tools, and the Median Absolute Deviation (MAD) of each gene was calculated, and the top 50% of the genes with the smallest MAD were excluded. The “goodSamplesGenes” function of the “WGCNA” package in R software was applied to remove outlier genes and samples (17). Further, a scale-free co-expression network was constructed based on the one-step network construction function of the “WGCNA” package. The appropriate “soft” threshold power (β = 3) was used for co-expression of similarity to calculate adjacency. Then, dynamic tree cuts and hierarchical clustering were performed, and a topological overlap matrix (TOM) was created to group genes into modules by random colors, and a gene dendrogram was constructed using a TOM-based measure of phase dissimilarity and a minimum gene cluster size (n = 30), the sensitivity was set to 3, and modules with distances less than 0.25 were merged. After obtaining the module, the different module eigengenes (ME) were obtained according to the first principal component of the module expression, and the modular-trait relationship was evaluated in line with the association between ME and MetS diagnosis. The module with the most significant positive correlation between the module-trait relationship was screened to obtain the genes contained in the module. And the correlation between module membership (MM) and Gene Significance (GS) scores in the module was evaluated to illustrate the module significance (MS). Sangerbox Tools was used to visualize the WGCNA analysis.
Machine learning
Candidate genes of MetS-RA were obtained by overlapping RA DEGs, MetS DEGs, and the most significant module genes of MetS. The expression profile data of these candidate genes in RA dataset were screened for potential hub genes through the least absolute shrinkage and selection operator (LASSO) algorithm of Sangerbox Tools based on R software “glmnet” package. The R software “survival” package was used to integrate RA diagnosis and gene expression profile data, and the prognostic significance of each gene was further evaluated by COX method, and P value < 0.05 was statistically significant. The risk score was computed by the mRNA expression of diagnostic biomarkers weighted by their corresponding coefficients via Sangerbox Tools. RiskScore = -0.1374*CAPN3 + 0.0413*CKAP4 - 0.1862*CNBP + 0.0114*H2AFY2 + 0.0143*KCNK12 - 0.0441*KIR2DS1 + 0.0249*PIK3CD + 0.1887*TRAF2 + 0.6682*TYK2 - 0.0810*UQCRB. Candidate genes were further screened and the forest map was drawn. The R software “random forest” package was also used to screen out potential hub genes, with the Increase in Mean Squared Error (%IncMSE) P value < 0.01. The overlapping genes screened by Lasso-cox regression analysis and Random Forest (RF) algorithm were defined as hub genes.
The construction of nomogram, the assessment of diagnostic marker prediction model, and the evaluation of diagnostic models in the external cohort
The nomogram of hub genes was constructed using the “rms” package of R software. The area under receiver operating characteristic (ROC) curve was plotted to evaluate the performance of hub genes and the nomogram in the diagnosis of RA. The calibration curves, decision curve analysis (DCA) and clinical impact curve (CIC) were used to evaluate the validity of nomogram in predicting MetS-RA. The validity of the above nomogram was verified by using external GEO datasets. Nomogram models based on hub genes from RA (GSE97779) and MetS (GSE142401) datasets were constructed respectively, meanwhile ROC, calibration curves, DCA, and CIC were used to evaluate the validity of the nomogram.
Protein-protein interaction network analysis and cluster analysis
The overlapping genes of RA DEGs and MetS DEGs were analyzed by the STRING database (https://www.stringdb.org) (18), with a medium confidence score of > 0.4. The PPI network was imported into the Cytoscape software (version 3.10.2) for visualization. Further, the Cytoscape molecular complex detection (MCODE) function was used to screen the gene cluster with the highest score for the next small molecule compound prediction.
Connectivity map analysis
The up-regulated genes in the highest scoring gene clusters from the MetS-RA PPI network were analyzed by the CMap database (https://clue.io) to search for potential small molecule compounds. The top 10 small molecule compounds with the highest negative enrichment scores were obtained.
Molecular docking
The protein crystal structure (pdb format) of hub genes was obtained from the RCSB Protein Data Bank (http://www.pdb.org/). The structure of the small molecule compounds (sdf format) was obtained from the Pubchem (https://pubchem.ncbi.nlm.nih.gov/), and was converted to a pdb format through OpenBabel software (version 2.4.1). The proteins and compounds in pdb format were imported into Autodock tools software (version 1.5.7) for deleting water and adding hydrogenation. All flexible keys of compounds were rotatable by default and saved in pdbqt format as docking ligands. Then the molecular docking process was completed (19). According to the binding energy of proteins and compounds (< -6 kcal/mol), the tightly bound small molecular compounds were screened out. The molecular docking results were visualized using PyMOL (version 3.0).
Immune cell infiltration analysis
RA and MetS gene expression profile data were analyzed by Sangerbox Tools immunoinfiltration analysis function. The R software “CIBERSORT” package was used to calculate the proportion of 22 types of immune cells in each sample by Wilcoxon test (20), P value < 0.05 was considered statistically significant, and stacked histogram visualization was performed. Spearman’s correlation coefficient was employed to analyze the proportion of infiltrating immune cells, P < 0.05 was considered statistically significant, and heatmap was used for visualization.
Demographic and metabolic characteristics of RA patients
RA patients who underwent total knee arthroplasty in our hospital were collected (n = 29). According to the 2005 NCEP-ATP-III diagnostic criteria for Asian patients with MetS, RA patients with MetS were included in MetS-RA group (n = 15), and patients without MetS were included in nMetS-RA group (n = 14). All participants in the study obtained the consent of themselves or their families. The study was approved by the ethics committee of Henan Provincial People’s Hospital (IRB ID:2023-108). Demographics are shown in Supplementary Table 1. Serum metabolic indicators of RA patients were recorded.
Human synovial sample collection and RA-FLS isolation
Synovium samples of RA patients were collected. The synovium was cut into 1 mm3 pieces, digested with 2.5 mg/ml type I collagenase at 37°C for 2 h, filtered with 75 μm filter to remove the tissue fragments. The isolated cells were cultured in DMEM medium containing 10% fetal bovine serum and 1% penicillin-streptomycin. RA-FLSs were passaged when reaching approximately 90% confluence. Macrophages were removed by passage to purify FLS. RA-FLSs of more than three passages were used for experiments.
The validation of the expression of hub genes
Total cellular RNA of RA-FLS was extracted using RNA extraction reagent (Accurate) according to the manufacturer’s instructions. cDNA synthesis (Accurate) and quantitative real-time PCR (qRT-PCR, Accurate) were performed according to the manufacturer’s instructions. Data of hub genes were expressed as 2-△△ct, mRNA expression was calculated relative to the β-actin level. Primer sequences are listed as follows: TYK2-F, 5’-GAGATGCAAGCCTGATGCTAT-3’, TYK2-R, 5’-GGTTCCCGAGGATTCATGCC-3’, TRAF2-F, 5’-TCCCTGGAGTTGCTACAGC-3’, TRAF2-R, 5’-AGGCGGAGCACAGGTACTT-3’.
The effect of small molecule compounds on cell function
The effects of small molecule compounds on the function of RA-FLS were evaluated by wound-healing assays and angiogenesis experiments.
Cell counting kit-8 for cell viability
CCK-8 was used to determine the viability of RA-FLS incubated with camptothecin (CPT, TargetMol) in a concentration gradient (0, 2.5, 5, 10, 20 µmol/L) and a time gradient (6, 12, 24, 48, 72 h). Cell viability (%) = [OD value (CPT) - OD value (blank)]/[OD value (control) - OD value (blank)]×100%. According to CCK-8 results, optimal concentration of CPT was determined to be 5 µmol/L.
Wound-healing assays
2×10⁵ RA-FLSs/well were seeded in 6-well plates, and were grown overnight until they reached 95% confluence, after which wound gaps were generated using a 200µl sterile pipette tip, and cellular debris was removed with phosphate buffered saline (PBS). The wound closure was monitored and photographed by inverted microscope (Olympus) at 0 h, 24 h, and 48 h. The migration area was quantified using imageJ (version 1.8.0) (21), average scratch width = (initial scratch area - scratch area at detection time)/image length, and cell migration ratio = (initial scratch area - scratch area at detection time)/initial scratch area.
Angiogenesis experiments
Growth factor reduced matrigel (no phenol red, 8.9 mg/ml, Becton), 48-well plate and pipette tips were precooled at 4°C, 120 µl matrigel was uniformly added to 48-well plate and solidified at 37°C for 30 min. Human umbilical vein endothelial cells (HUVECs) were re-suspended with pre-collected serum-free culture supernatants (nMetS-RA-FLS, MetS-RA-FLS, and MetS-RA-FLS treated with 5 µmol/L CPT for 24 h), and 200 µl cell culture supernatant containing 8×10⁴ HUVEC was added to each well. HUVECs were cultured in a 5% CO2 cell incubator at 37°C for 4 h. The tube formation of HUVECs was observed with an inverted microscope and photographed. The number of meshes and segments length were quantized by imageJ (22).
Statistical analysis
All data between the two groups were analyzed statistically and plotted using GraphPad Prism software (version 8.0) or Sangerbox Tools. The normality of the data distribution was evaluated using the Kolmogorov–Smirnov test. Levene test was used to assess the homogeneity of variance. Independent samples t-tests were applied to analyze normally distributed values. Data with non-Gaussian distribution were analyzed by using the non-parametric Mann–Whitney U test. Correlation analysis was performed using Spearman’s method. Two-tailed values of P < 0.05 were considered statistically significant.
Results
Data processing, identification of DEGs and GSEA enrichment analysis
The flow chart of bioinformatics analysis is shown in Figure 1. After batch correction, a total of 23 RA synovial samples and 20 healthy control synovium samples were obtained from the integrated RA dataset. All three datasets are from the same sequencing platform and contain the same number of genes (Supplementary Figure 1A). After batch effect removal, the data distribution among the three datasets tended to be consistent (Supplementary Figures 1B–E), and they cluster and intertwine with each other (Supplementary Figures 1F, G), indicating that the batch effect was better removed. There were 4013 DEGs in the integrated RA dataset, including 1316 up-regulated genes and 2697 down-regulated genes (Figure 2A). The volcano plot and heatmap were used to display the expression patterns of DEGs in the merged RA dataset (Figures 2B, C). GSEA analysis revealed up-regulated T cell receptor signaling pathways, B cell receptor signaling pathways, and Intestinal Immune Network For Iga Production (Figure 2D). To comprehensively demonstrate the metabolic characteristics of RA datasets, KEGG enrichment analysis involving metabolic pathway was conducted via GSEA. The results showed that these RA datasets have similar metabolic characteristics, including abnormalities in metabolic pathways such as Type I Diabetes Mellitus, Sulfur Metabolism, and Tyrosine Metabolism (Supplementary Tables 2–4). A total of 3507 DEGs were identified in MetS dataset, including 1819 up-regulated genes and 1688 down-regulated genes (Figure 3A). The volcano plot and heatmap were used to describe the expression patterns of DEGs in the MetS dataset (Figures 3B, D). GSEA analysis showed up-regulated T cell receptor signaling pathways and B cell receptor signaling pathways (Figure 3C). KEGG enrichment analysis involving metabolic pathway demonstrated the metabolic characteristics of MetS and dysregulated metabolic genes (Supplementary Table 5).
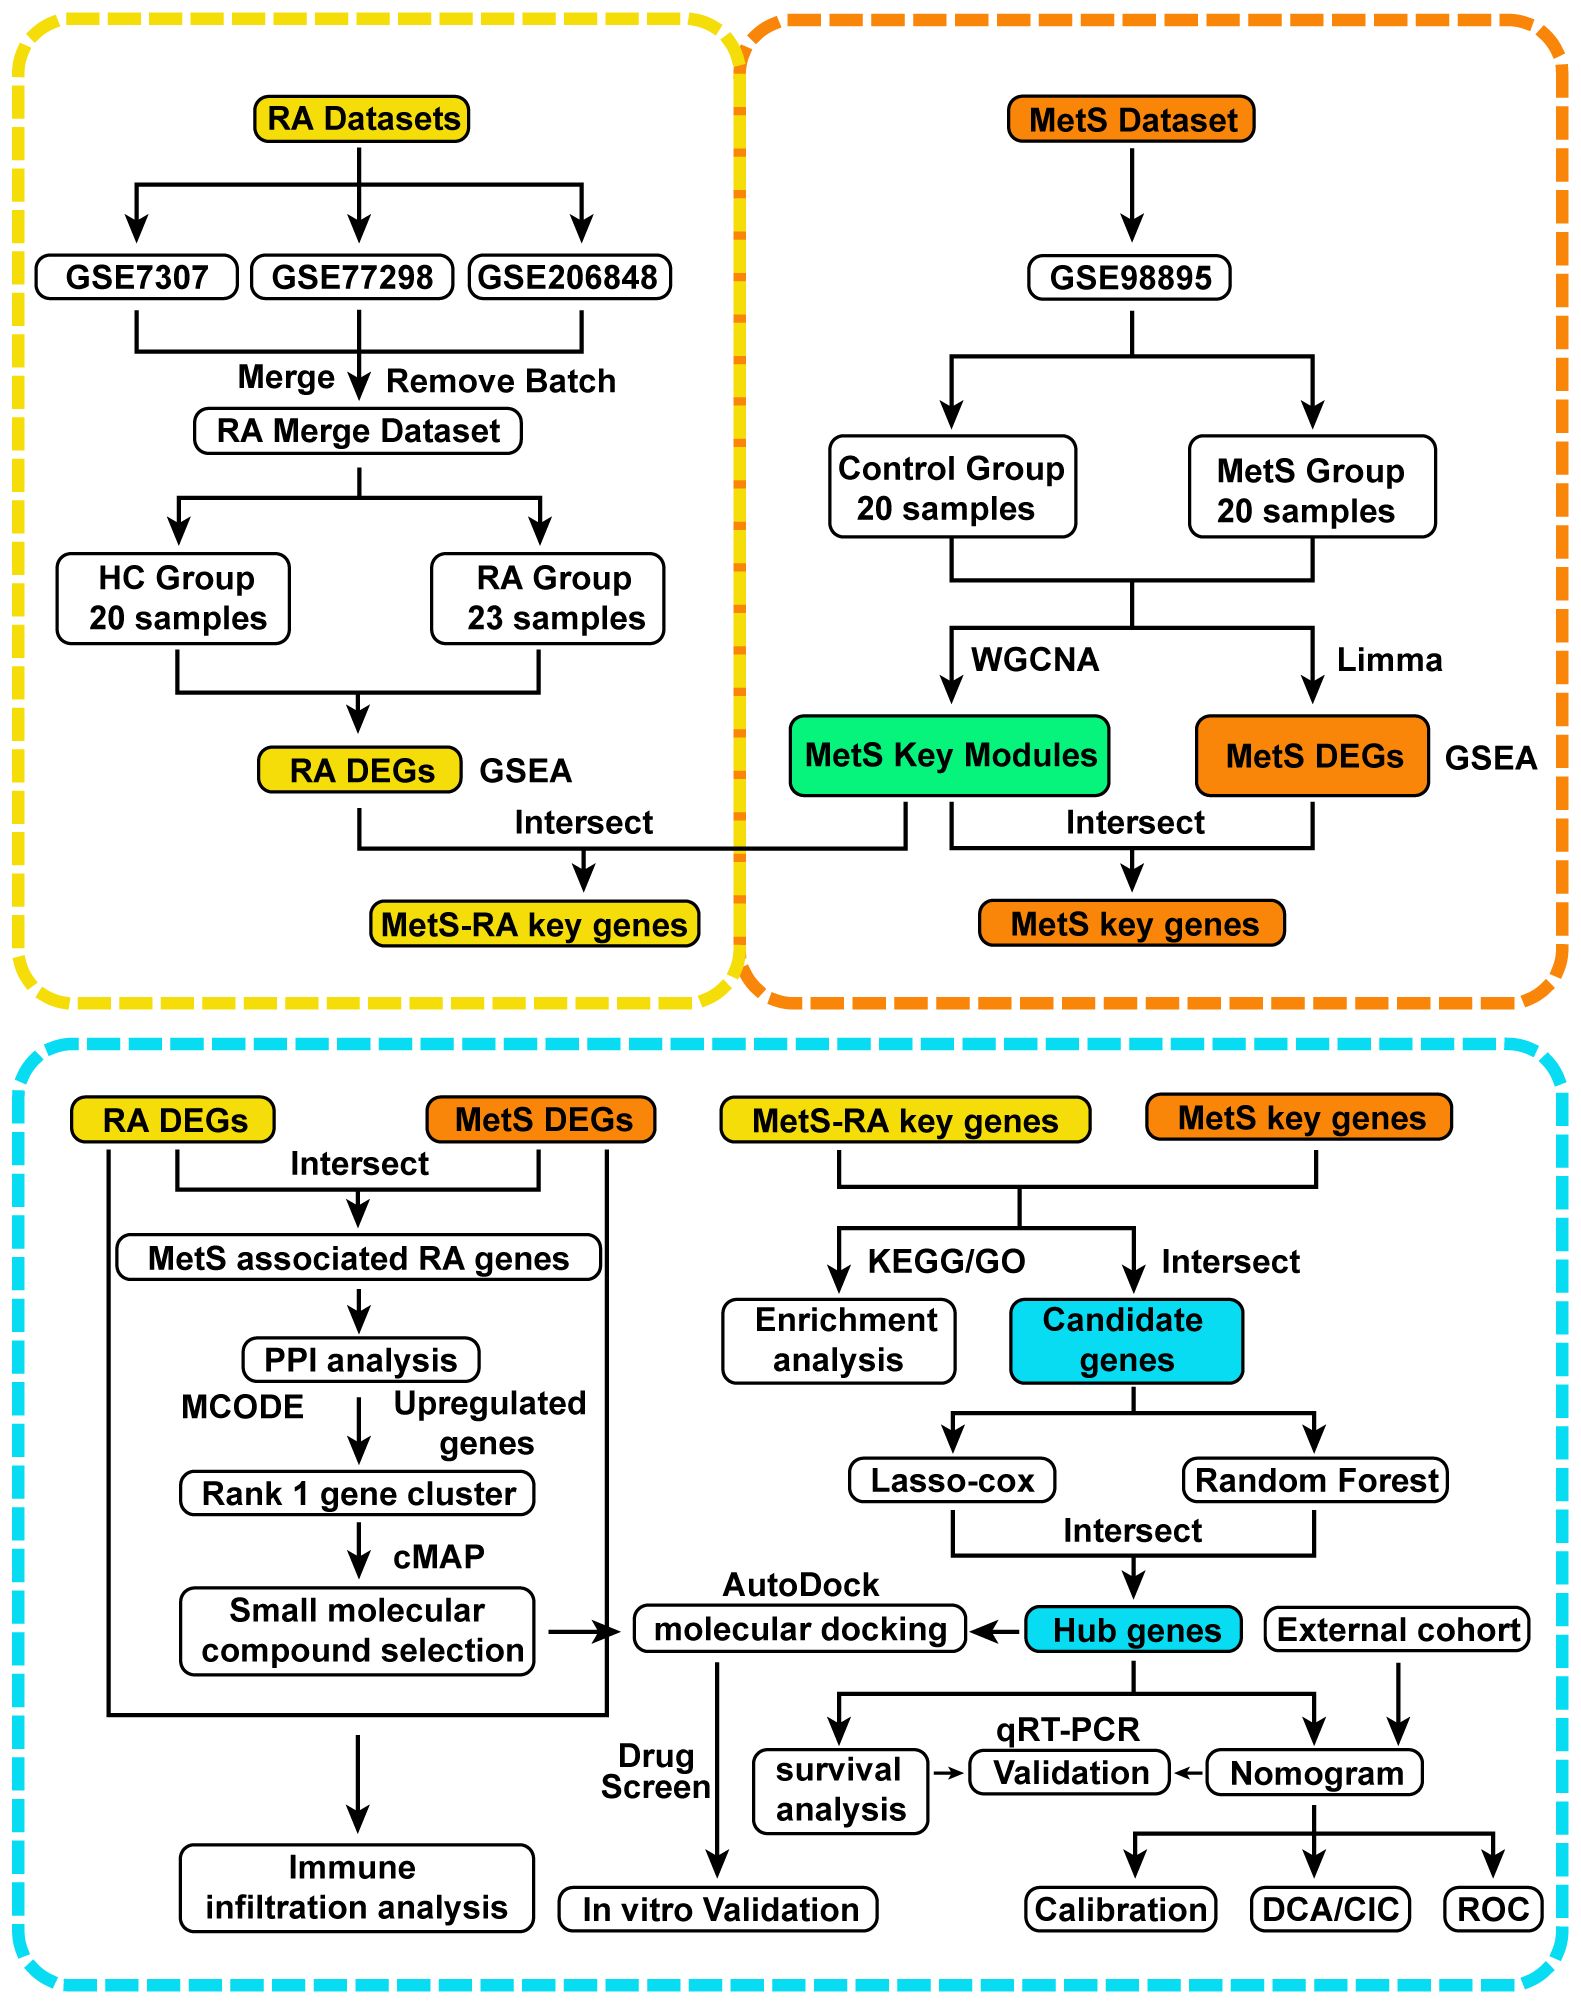
Figure 1 Flow chart of this study design. RA, Rheumatoid arthritis; MetS, Metabolic syndrome; MetS-RA, MetS-associated RA; DEGs, differentially expressed genes; WGCNA, weighted correlation network analysis; Gene Set Enrichment Analysis, GSEA; Limma, linear models for microarray data; PPI, protein-protein interaction; MCODE, molecular complex detection; KEGG, Kyoto Encyclopedia of Genes and Genomes; GO, Gene Ontology; least absolute shrinkage and selection operator, LASSO; qRT-PCR, quantitative real-time PCR; DCA, decision curve analysis; CIC clinical impact curve; ROC, receiver operating characteristic.
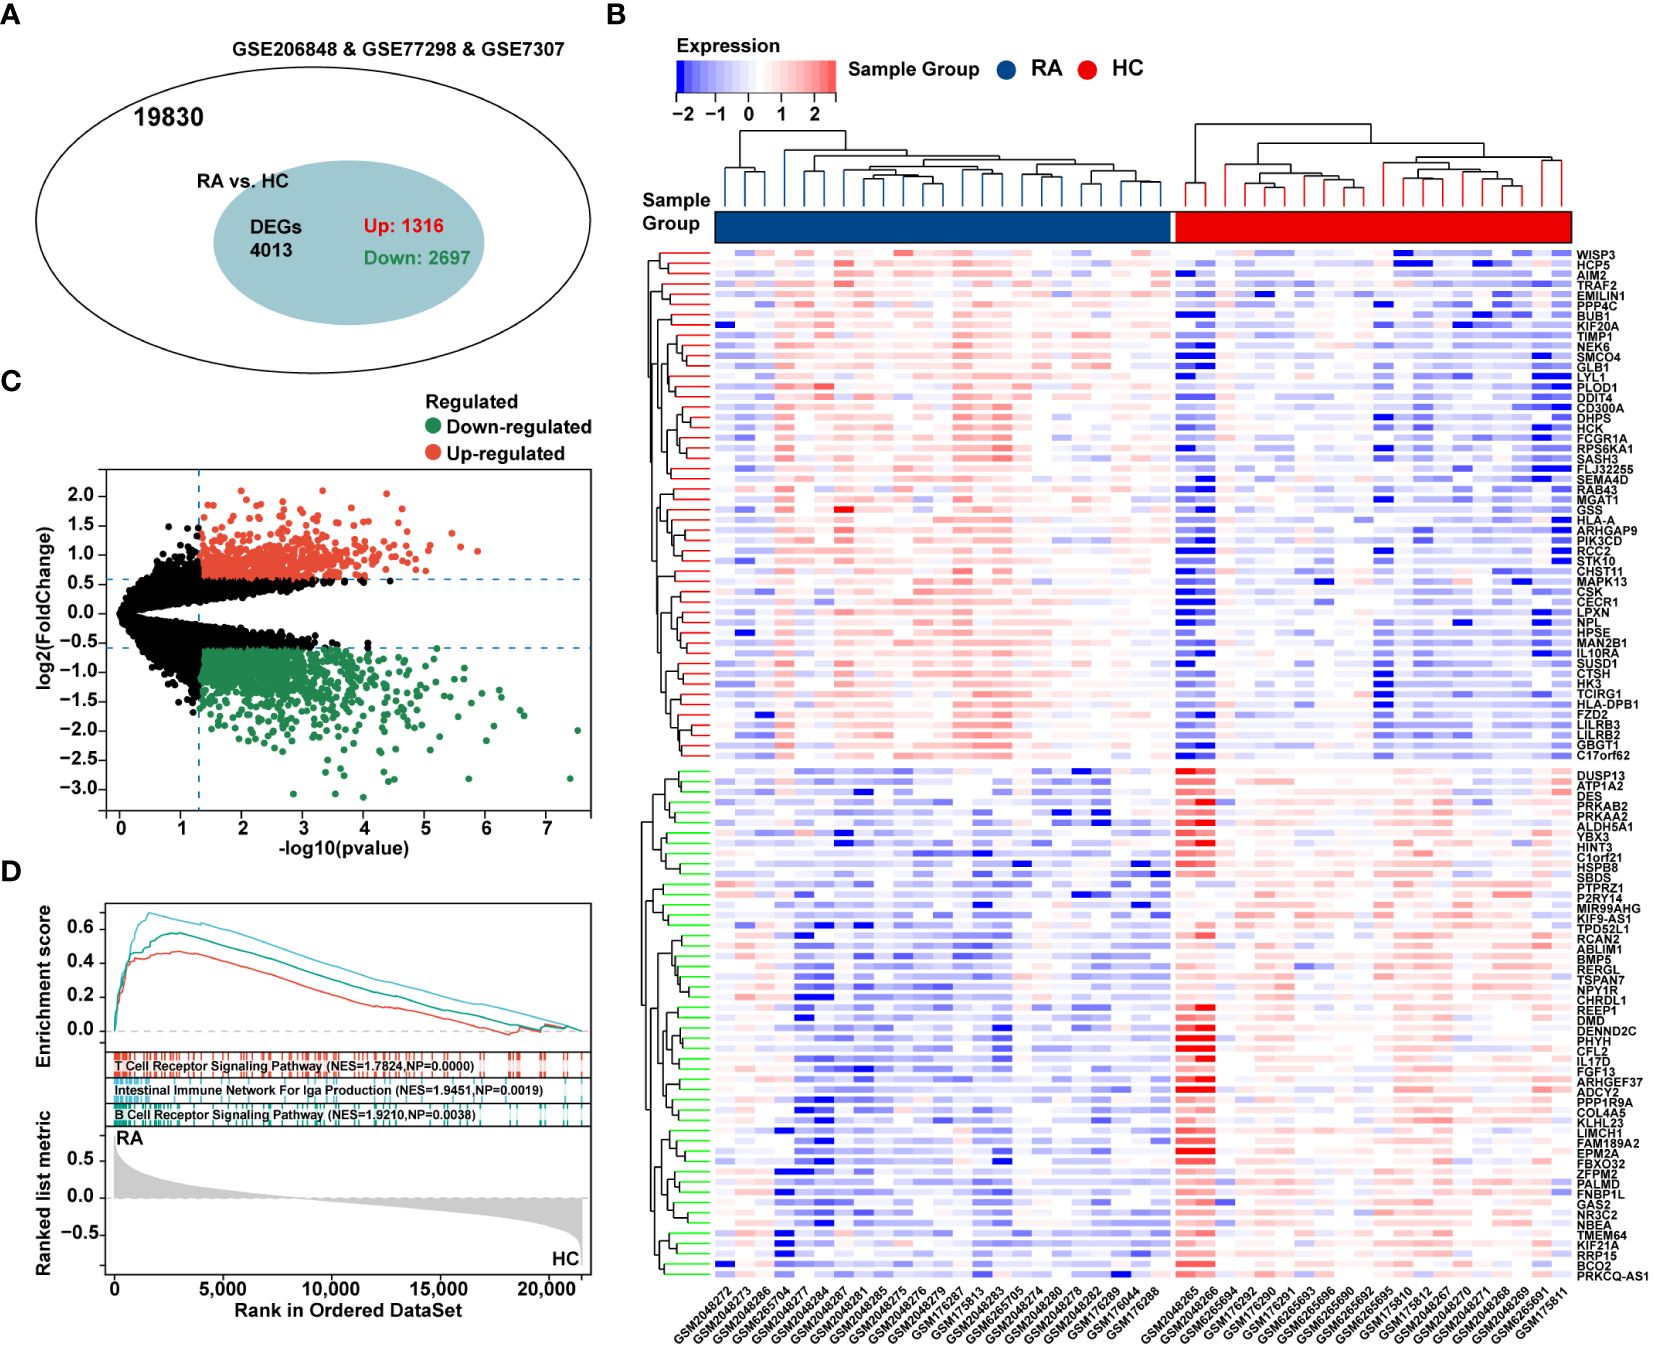
Figure 2 Differential expression analysis and GSEA of the integrated RA dataset. (A) The venn chart represented the total number of genes and the number of DEGs in the integrated RA dataset, with red representing up-regulated genes and green representing down-regulated genes. (B) The heatmap represented expression patterns of partial significantly up-regulated or down-regulated DEGs in the integrated RA dataset, with each row representing a DEG and each column representing a sample of RA cases or controls. (C) The volcano plots represented the expression pattern of RA DGEs with red representing up-regulated genes, green representing down-regulated genes, and black representing genes with no significant differences. (D) GSEA with KEGG gene sets indicated up-regulated T cell receptor signaling pathways, B cell receptor signaling pathways, and NK cell mediated cytotoxicity signaling pathways in RA synovium compared with healthy control (NES absolute value > 1.5, NP value < 0.05, FDR < 0.05). NES, normalized enrichment score; NP, Nominal P value; FDR, false discovery rate.
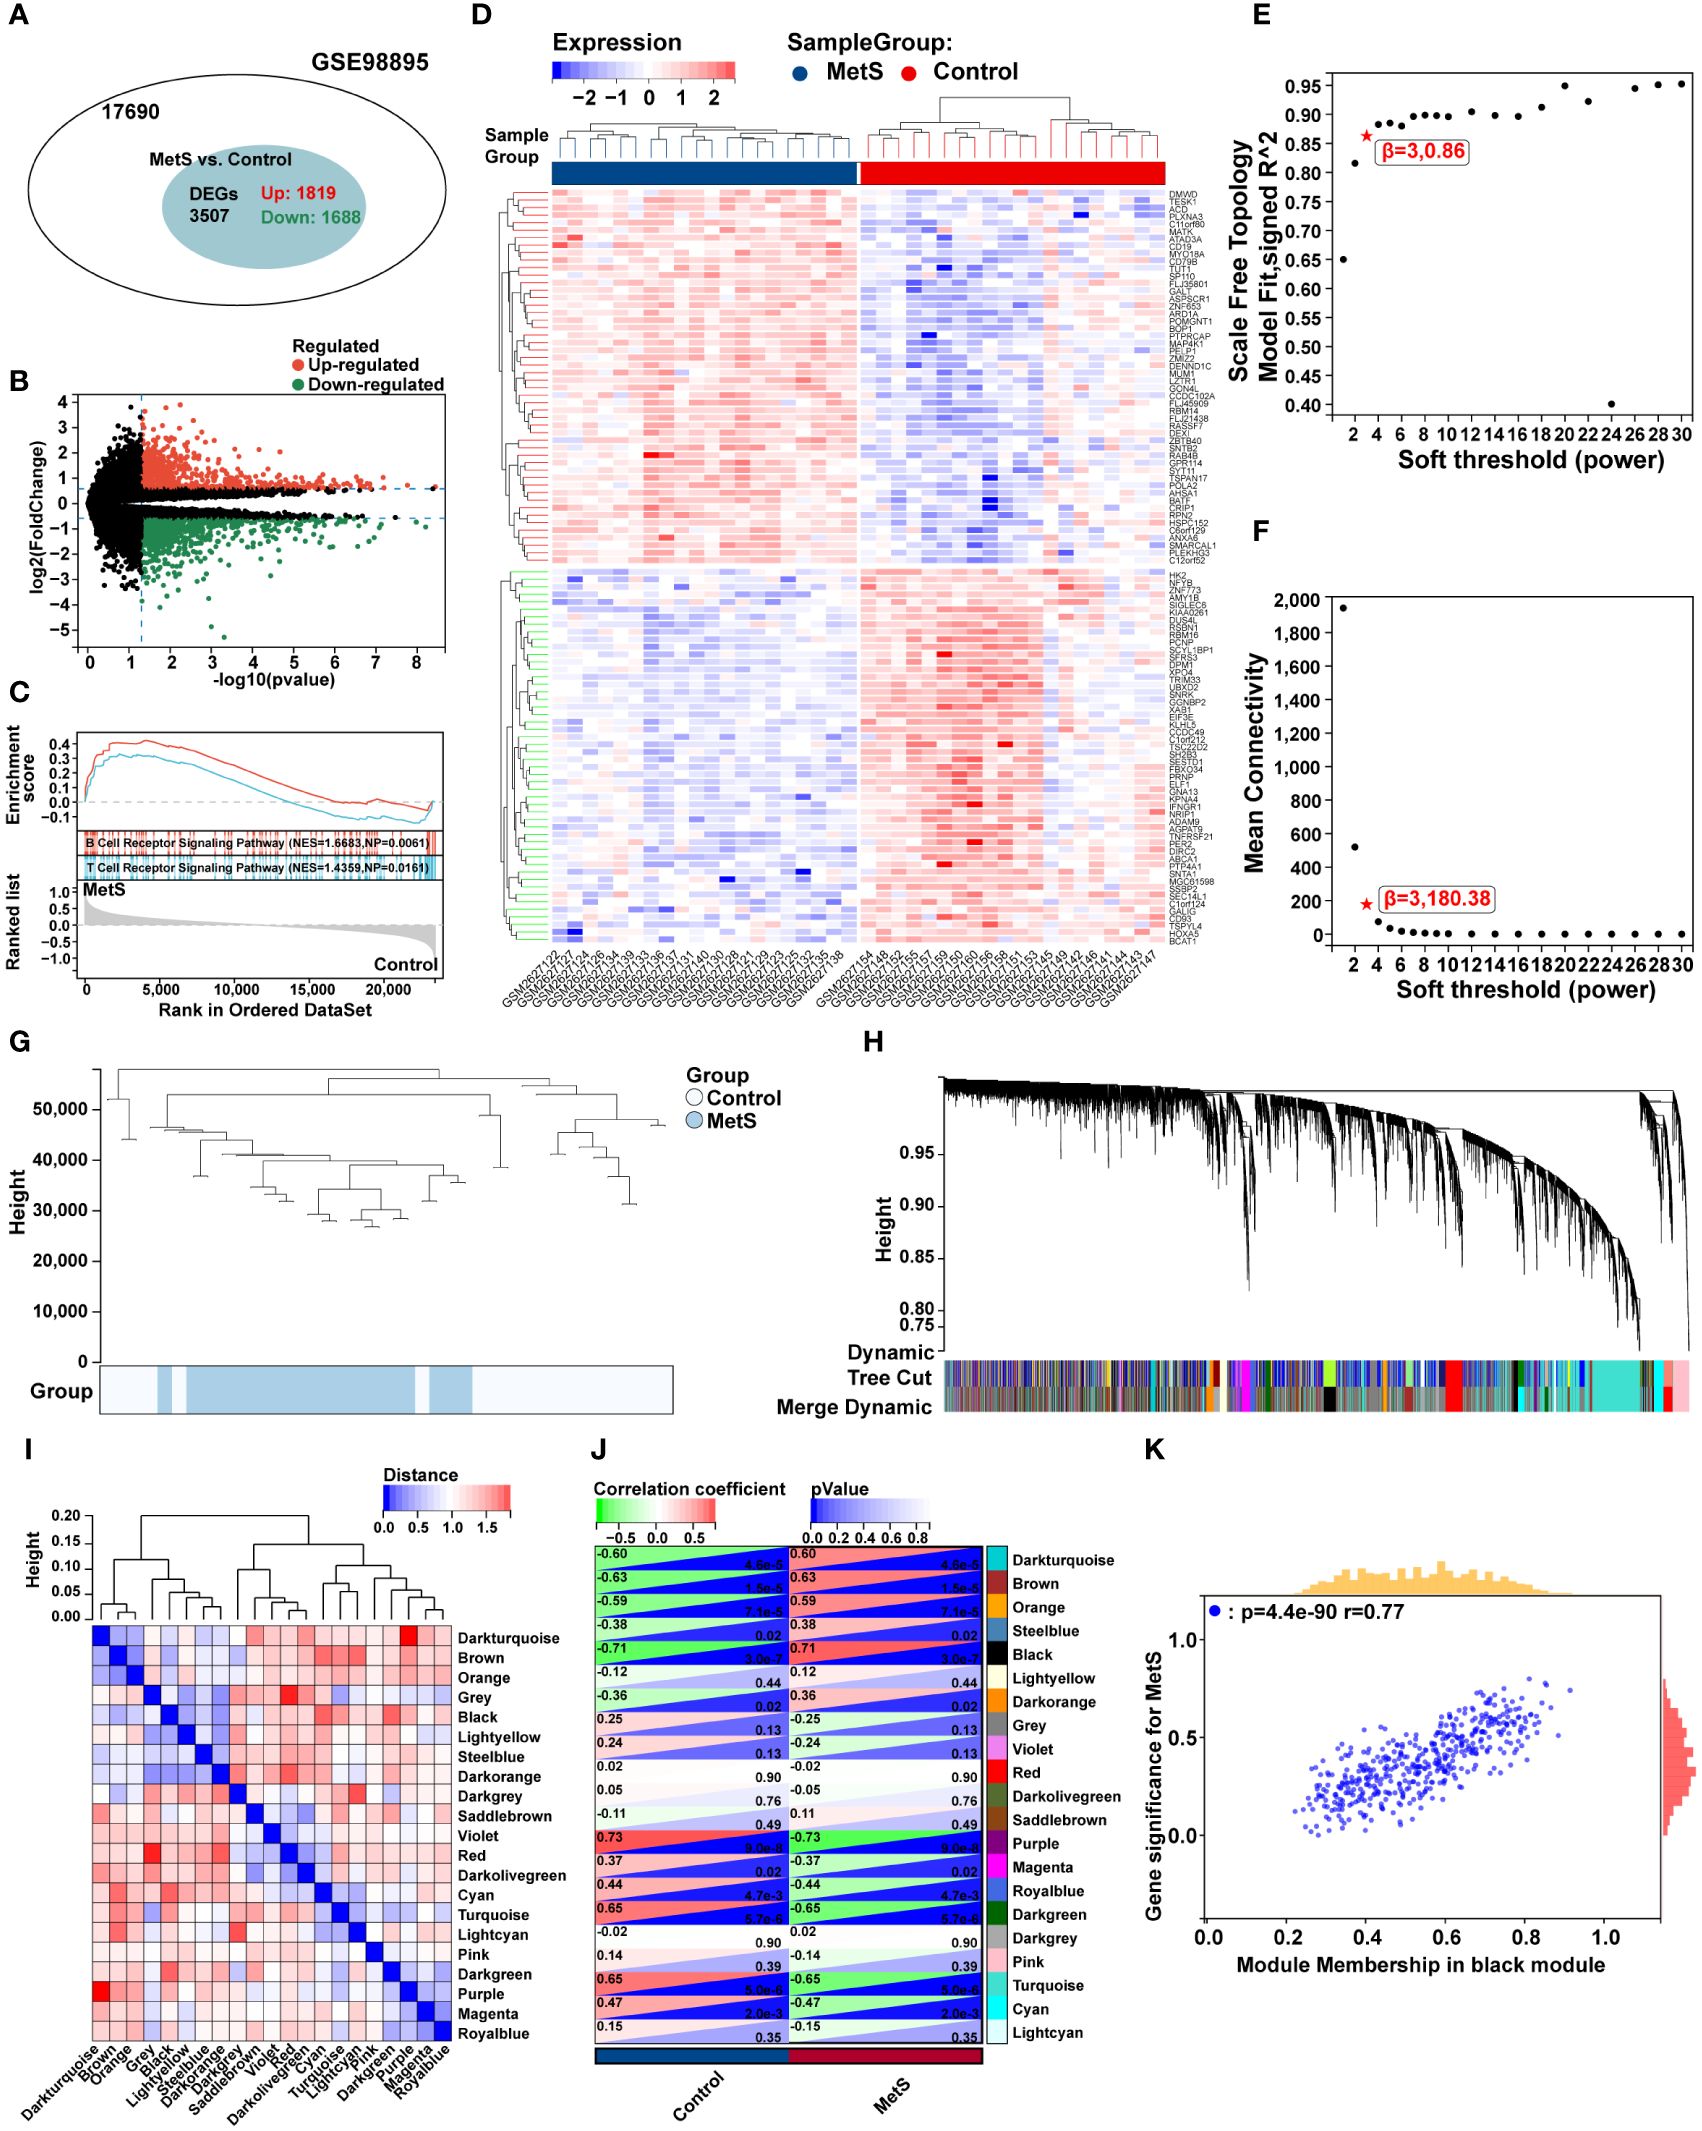
Figure 3 Differential expression analysis, GSEA analysis, and identification of key modules of WGCNA in the MetS dataset. (A) The venn chart represented the total number of genes and the number of DEGs in the MetS dataset, with red representing up-regulated genes and green representing down-regulated genes. (B) The volcano plots represented the expression pattern of MetS DGEs with red representing up-regulated genes, green representing down-regulated genes, and black representing genes with no significant differences. (C) GSEA with KEGG gene sets indicated up-regulated T cell receptor signaling pathways and B cell receptor signaling pathways in MetS PBMCs compared with healthy control (NES absolute value > 1.5, NP value < 0.05, FDR < 0.05). (D) The heatmap represented expression patterns of partial significantly up-regulated or down-regulated DEGs in the MetS dataset, with each row representing a DEG and each column representing a sample of MetS cases or controls. (E) A scale-free topological model was used to determine the optimal β value, combined with scale independence and (F) mean connectivity analysis, β = 3 was selected as the soft threshold. (G) The cluster dendrogram of the MetS and control samples. (H) Gene co-expression modules represented by different colors under the gene tree. (I) Heatmap of eigengene adjacency. (J) The heatmap represented the relationship between module eigengenes and MetS. The correlation (left) and P value (right) were presented. The black module correlated with RA exhibited the highest correlation coefficient, which was identified as the key module of MetS. (K) Correlation plot between module membership and gene significance of genes included in the black module. PBMCs, peripheral blood mononuclear cells.
Construction of WGCNA and identification of key module genes in MetS dataset
To further explore key genes in MetS, WGCNA was conducted to identify the most relevant gene modules in MetS dataset. Based on scale independence and mean connectivity, the soft threshold of soft power was set as 3 (Figures 3E, F). The clustering tree diagram of MetS and control group were shown in Figure 3G. In order to further assess these modules, we calculated the dissimilarity of module eigengenes, chose a cut line for module dendrogram and merged the module with a distance less than 0.25, and a total of 21 co-expression modules were obtained (Figure 3H). Spearman’s correlation coefficient was performed to map the module-trait relationship and evaluate the correlation between each module and MetS diagnosis (Figure 3I). The black module exhibited the highest positive correlation with MetS (454 genes, r = 0.71, P = 3e-7), and was selected as the most relevant module for MetS (Figure 3J). The correlation analysis results of genes in the black module showed a strong association between module membership and gene significance, r = 0.77, P = 4.4e-90 (Figure 3K).
MetS key genes screening and enrichment analysis
A total of 196 overlapping genes between MetS black module genes and MetS DEGs were identified (Figure 4A). KEGG enrichment analysis showed that these overlapping genes were mainly enriched in “Kaposi sarcoma-associated herpesvirus infection”, “osteoclast differentiation”, “NF-kappa B signaling pathway”, and immune cell-related signaling pathways such as “NK cell mediated cytotoxicity”, “Th1 and Th2 cell differentiation”, “Th17 cell differentiation”, and “T cell receptor signaling pathway” (Figure 4B). In terms of GO-BP analysis, overlapping genes were mainly enriched in “Cellular macromolecule localization”, “Intracellular transport”, “Intracellular protein transport”, “Regulation of mitochondrion organization” and other processes (Figure 4C).
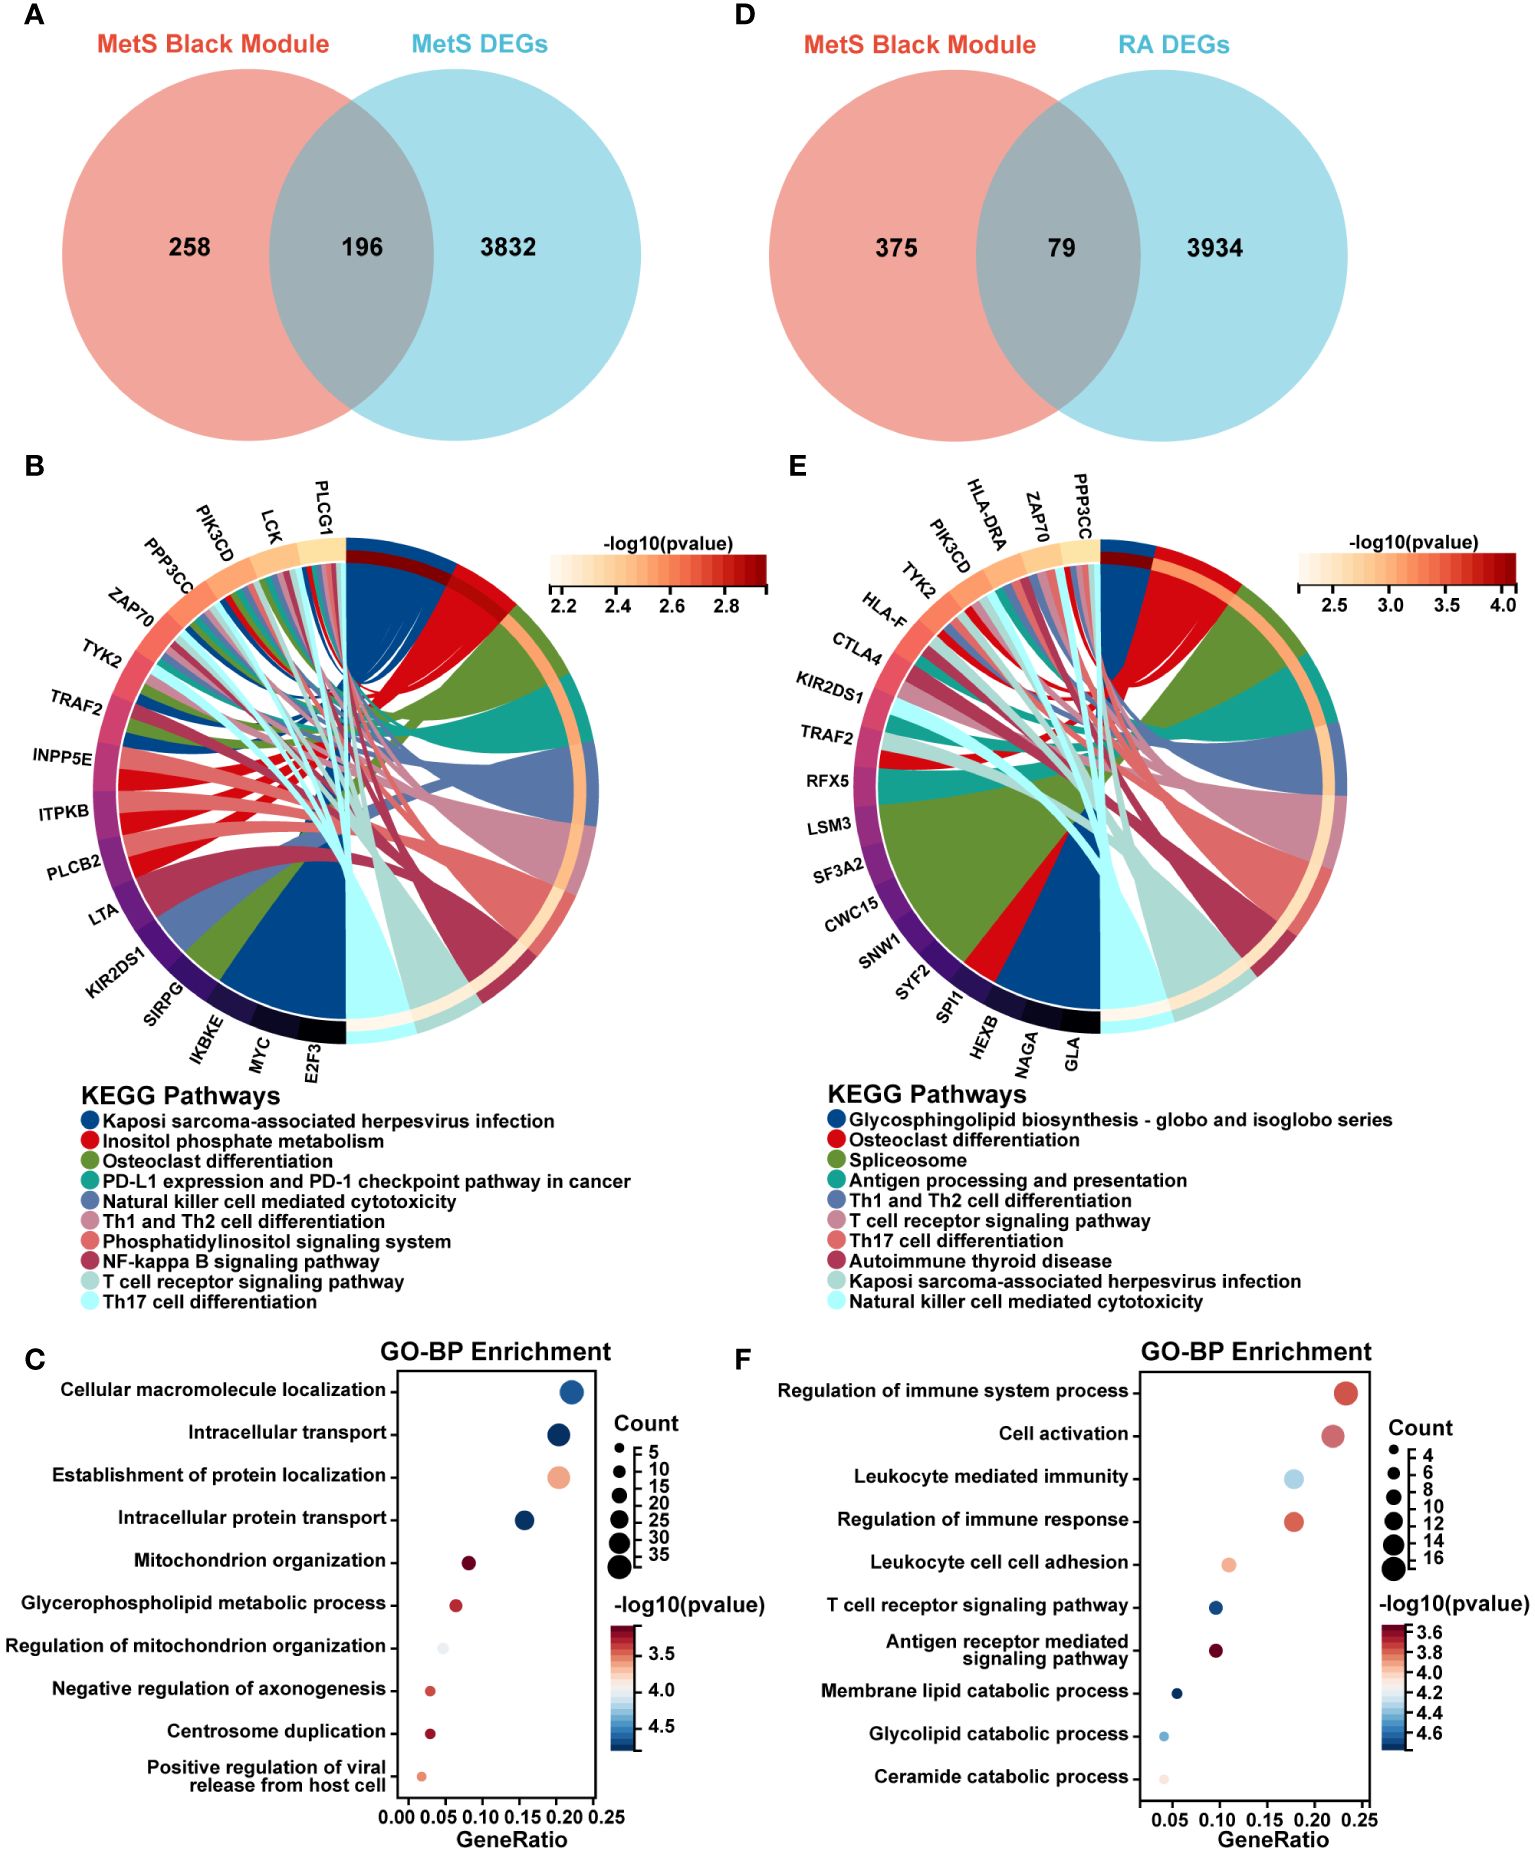
Figure 4 Screening and enrichment analysis of MetS key genes and MetS-RA key genes. (A) The venn diagram represented the overlap between MetS black module genes and MetS DEGs, totally 196 overlapping genes, which were defined as MetS key genes. Red represents MetS black module genes and blue represents MetS DEGs. (B) The circos plot represented KEGG analysis results for MetS key genes. (C) The bubble plot represented GO-BP analysis results for MetS key genes. (D) The venn diagram represented the overlap between MetS black module genes and RA DEGs, totally 79 overlapping genes, which were defined as MetS-RA key genes. Red represents MetS black module genes and blue represents RA DEGs. (E) The circos plot represented KEGG analysis results for MetS-RA key genes. (F) The bubble plot represented GO-BP analysis results for MetS-RA key genes. GO-BP, Gene Ontology Biological Process.
MetS-RA key genes screening and enrichment analysis
There were a total of 79 overlapping genes between MetS black module genes and RA DEGs (Figure 4D). KEGG enrichment analysis showed that these overlapping genes were concentrated in “Osteoclast differentiation”, “Spliceosome”, and immune cell-related signaling pathways such as “Th1 and Th2 cell differentiation”, “Th17 cell differentiation”, “NK cell mediated cytotoxicity”, and “T cell receptor signaling” (Figure 4E). In terms of GO-BP analysis, overlapping genes were mainly enriched in immune-related processes such as “Regulation of immune response”, “Cell activation”, “Leukocyte mediated immunity”, “Regulation of immune system process”, and “T cell receptor signaling pathway”. In addition, enrichment pathways were involved in metabolism-related pathway including “Membrane lipid catabolic process”, “Glycolipid catabolic process”, and “Ceramide catabolic process” (Figure 4F).
Screening of hub genes for MetS-RA diagnosis via machine learning
The common DEGs between MetS and RA may play critical roles in MetS-RA, so the next step will be to further search for hub genes in MetS-RA. A total of 43 overlapping genes between MetS key genes and MetS-RA key genes will be further screened as candidate genes (Figure 5A). LASSO regression algorithm was applied to identify 10 potential candidate genes from 43 common genes (Figures 5B, C). The prognostic significance of each gene was further evaluated by COX regression analysis, and TYK2, TRAF2 and CAPN3 were screened out. The hazard ratio (HR) of TYK2 was 6.00 (95%CI 2.00 - 17.97), the HR of TRAF2 was 2.23 (95%CI 1.12 - 4.45), and the HR of CAPN3 was 0.64 (95%CI 0.48 - 0.84) (Figure 5D). Meanwhile, RF machine learning algorithm was applied to sort 43 overlapping genes according to the %IncMSE of each gene, and genes with %IncMSE P value < 0.01 were extracted. A total of 6 genes were obtained (Figure 5E). Three overlapping genes (TYK2, TRAF2, and CAPN3) were identified in candidate genes obtained by LASSO-COX and RF (Figure 5F). The expression of TYK2 and TRAF2 was positively correlated with the risk score of RA diagnosis, while CAPN3 was negatively correlated with the risk score of RA diagnosis (Figure 5G). For better diagnosis and prediction, a nomogram was constructed based on TYK2 and TRAF2 by logistic regression analysis (Figure 6A). The area under the curve (AUC) value of the hub gene was evaluated using ROC to determine its sensitivity and specificity for the diagnostic efficacy of MetS-RA. AUC values of TYK2 and TRAF2 were both > 0.9, suggesting that these two hub genes had strong diagnostic value for MetS-RA (Figure 6B). The calibration curve showed that the prediction probability of the constructed nomogram diagnostic model was almost identical to that of the ideal model (Figure 6C). In addition, the DCA and the CIC showed that decision making based on the nomogram model may be beneficial for the diagnosis of MetS-RA (Figures 6D, E). To further confirm the accuracy of the above nomogram model, two external GEO datasets were used for validation. We developed a MetS diagnostic nomogram model based on GSE142401 to predict the possibility of MetS from control and MetS groups (Figure 6F). The AUC values of TYK2 and TRAF2 were 0.83 and 0.79, respectively (Figure 6G). The calibration curves, DCA, and CIC for assessing nomogram MetS showed that decision-making based on the nomogram MetS may favor the prediction of MetS (Figures 6H–J). Furthermore, another diagnostic nomogram model was also constructed to distinguish RA patients based on GSE97779 (Figure 6K). Similarly, ROC, calibration curves, DCA, and CIC indicated ideal predictive value of nomogram RA for the RA patients (Figures 6L–O).
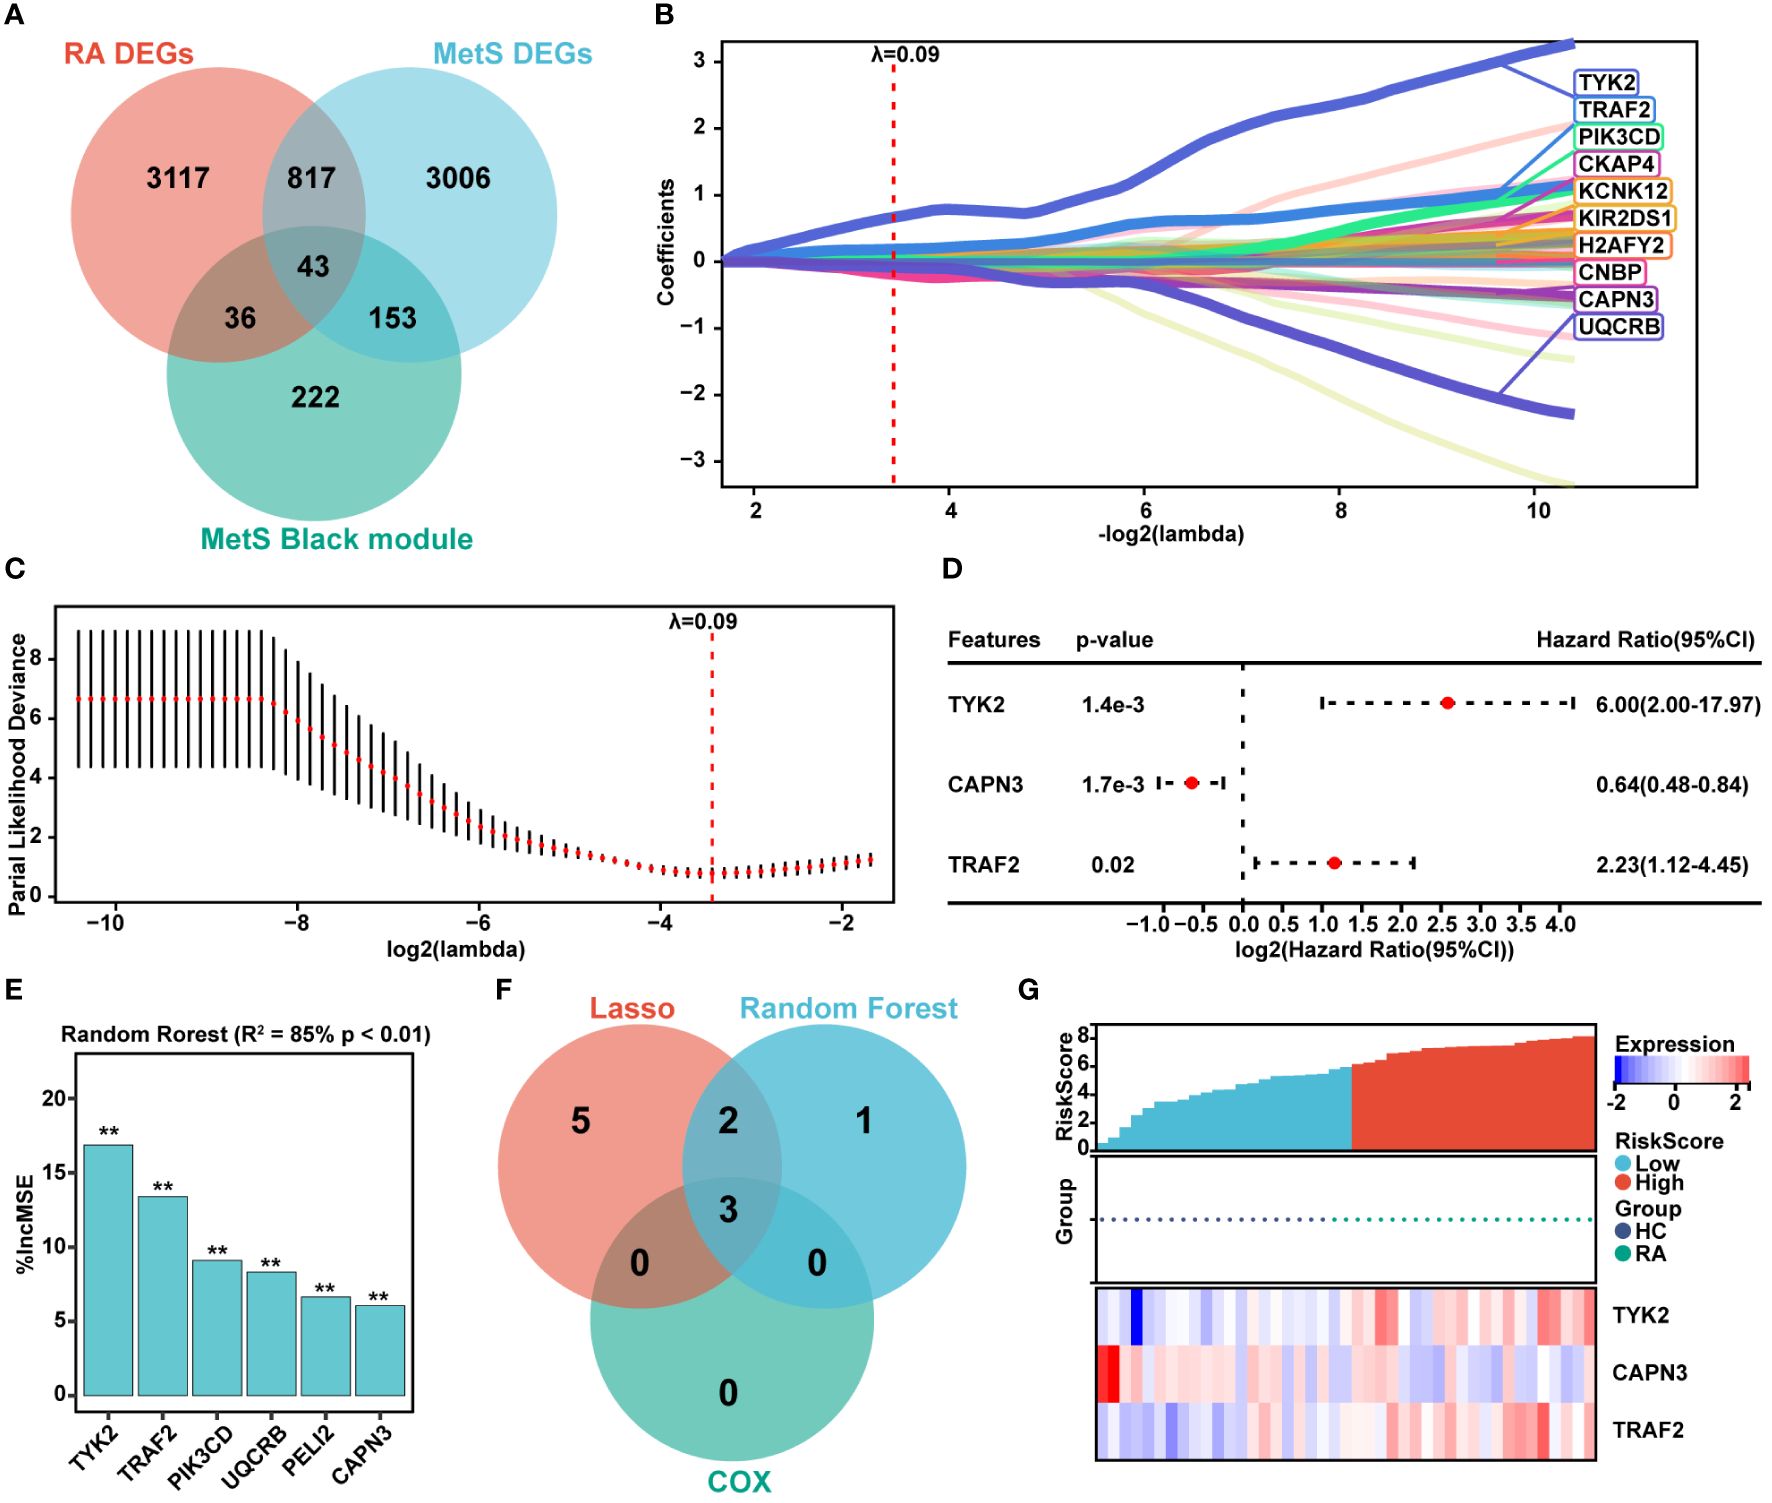
Figure 5 Hub genes screening via LASSO-COX and Random Forest. (A) The venn diagram represented the overlap among RA DEGs, MetS DEGs, and MetS black module genes, with a total of 43 overlapping genes defined as MetS-RA pathogenic candidate genes. Red represents RA DEGs, blue represents MetS DEGs, and green represents MetS black module genes. (B, C) The expression profile data of 43 genes were analyzed through the LASSO algorithm of Sangerbox Tools based on R software “glmnet” package. The R software “survival” package was used to integrate RA diagnosis and gene expression profile data, and the prognostic significance of each gene was further evaluated by COX method. The risk score was computed by the mRNA expression of diagnostic biomarkers weighted by their corresponding coefficients via Sangerbox Tools. The diagnostic biomarkers (n = 10) were identified by the LASSO logistic regression algorithm, λ = 0.09. (D) The forest plot represented candidate genes screened by LASSO model were evaluated for RA diagnostic significance by COX method. (E) The R software “random forest” package was also used to screen out potential hub genes. The diagnostic biomarkers (n = 6) were identified by the RF algorithm with %IncMSE P value < 0.01 were extracted. ** P < 0.01. (F) The venn diagram displayed three common genes between LASSO-COX and RF algorithms, which were identified as the hub genes in MetS-RA. (G) Visualization of the relationship between RA diagnostic risk and hub genes expression.
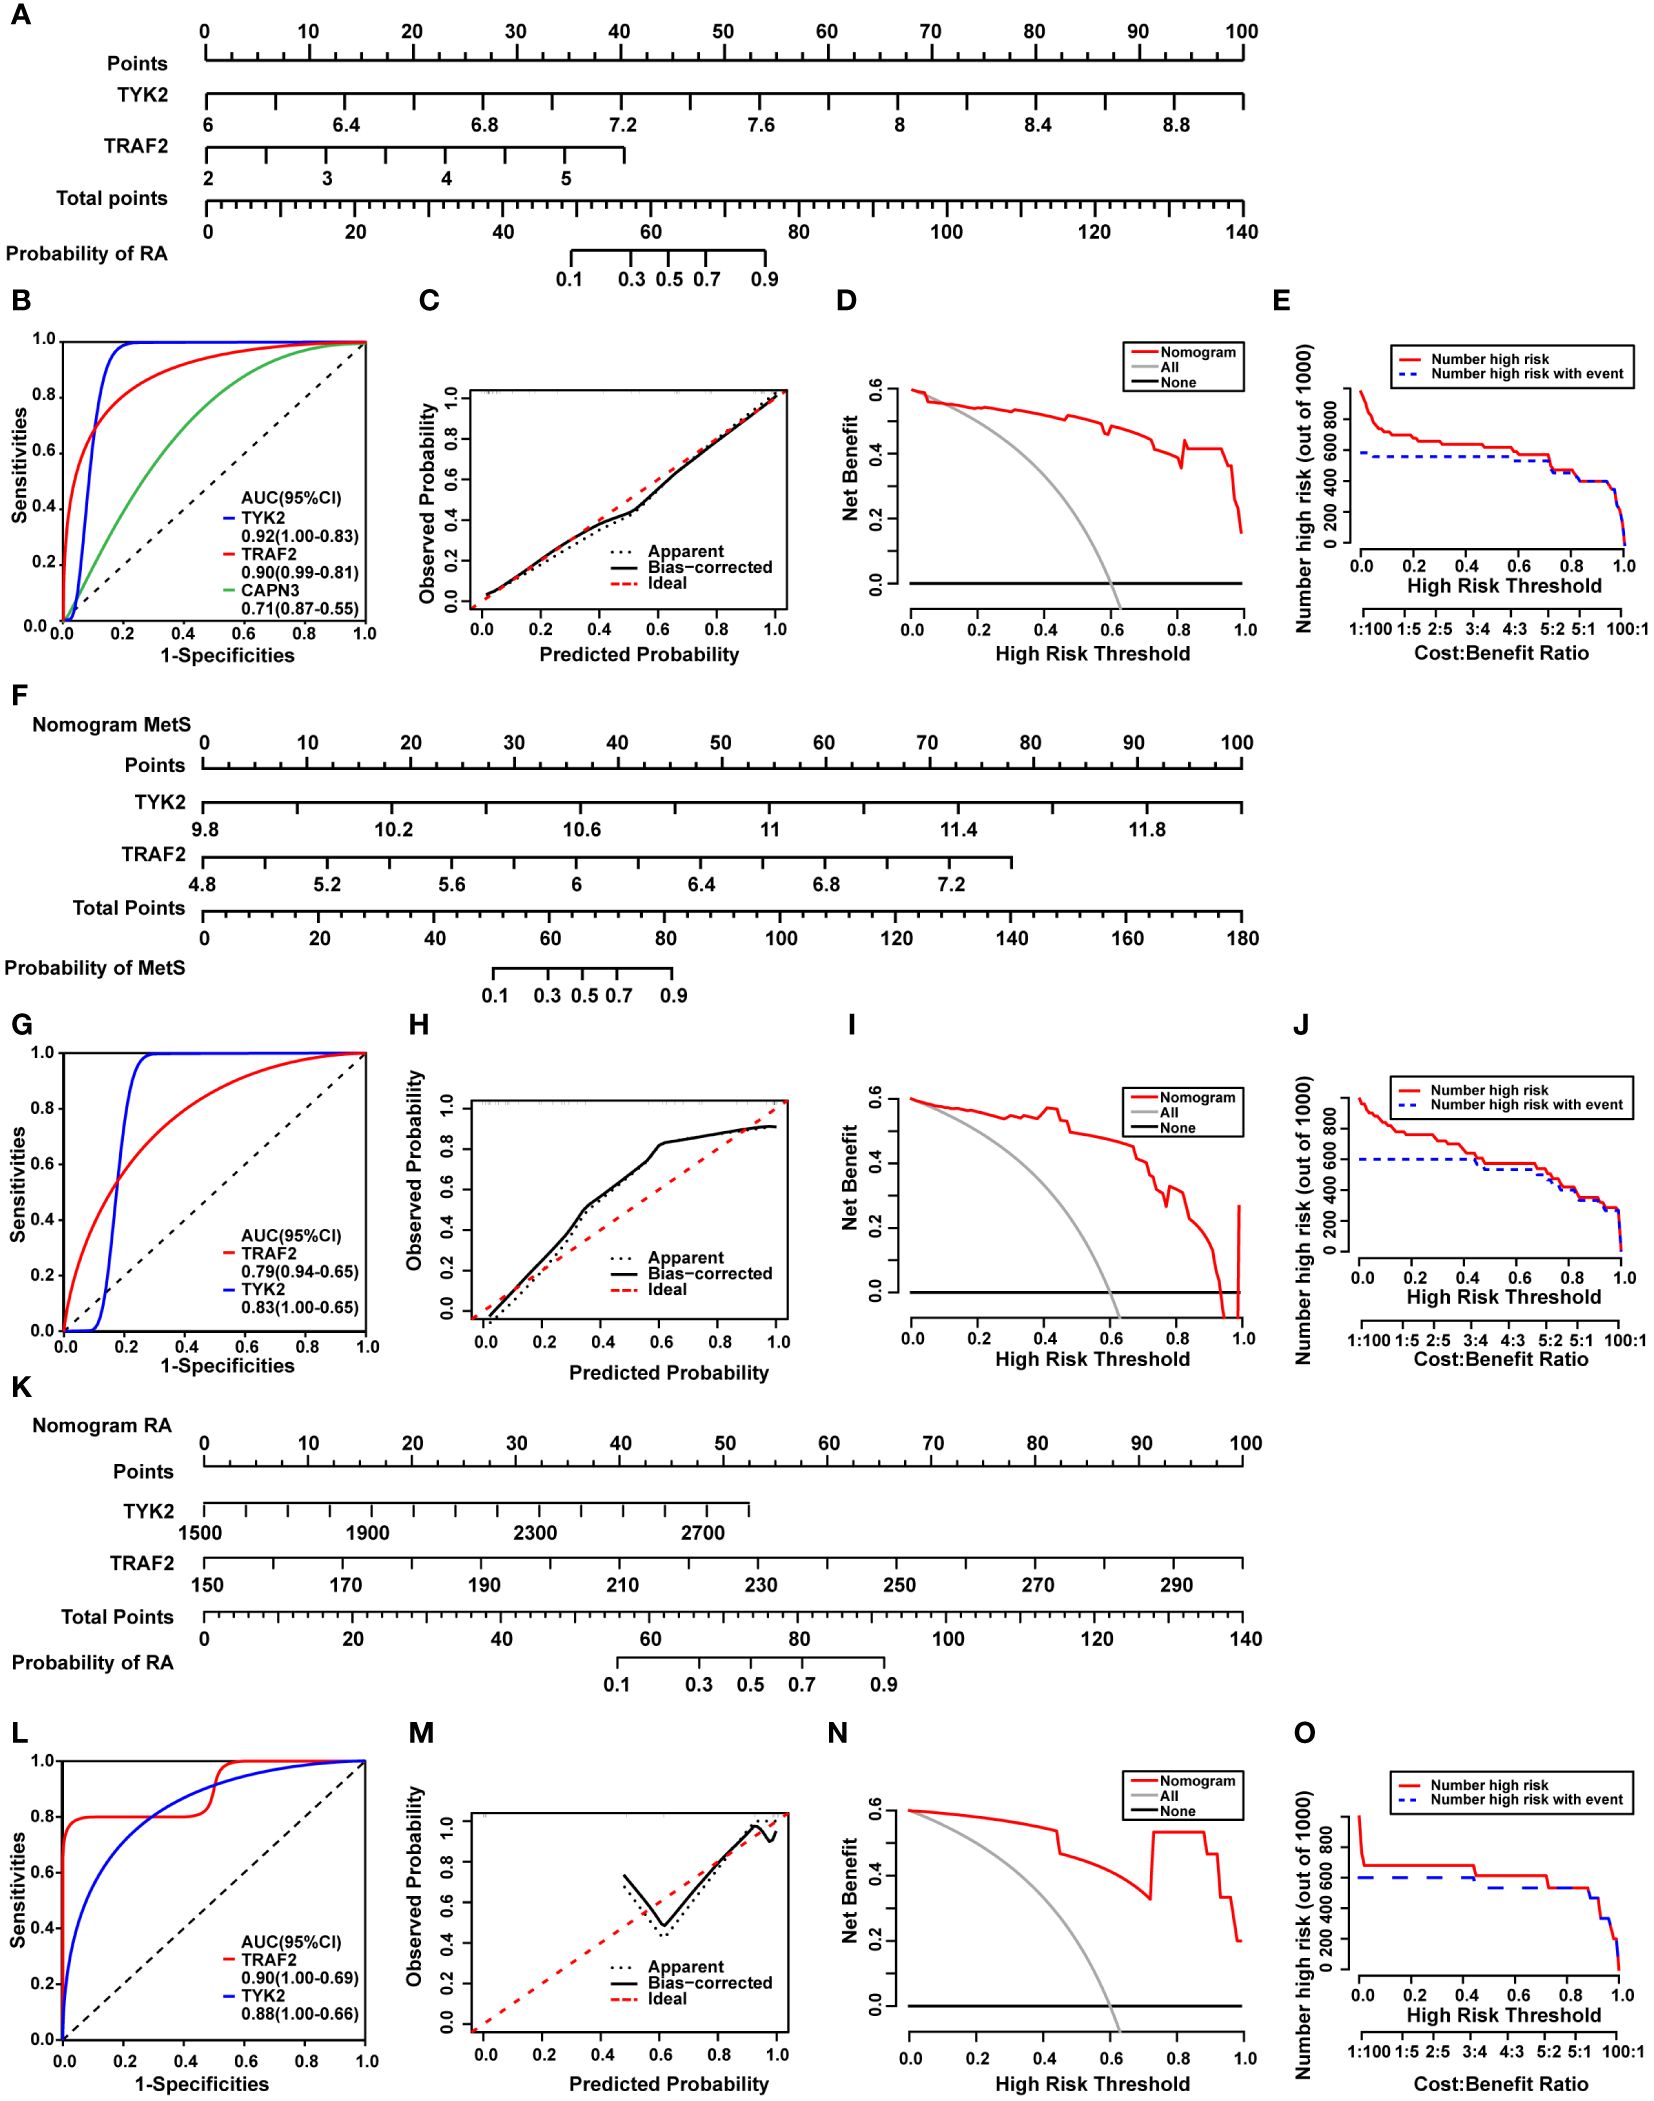
Figure 6 Construction of a diagnostic nomogram model and evaluation of diagnostic models in external cohorts. (A) The nomogram was constructed based on the hub genes TYK2 and TRAF2. (B) The ROC curve for the diagnostic performance of TYK2, TRAF2, and CAPN3. (C) The calibration curve of nomogram model prediction in MetS-RA. The dotted line marked as “Apparent” represents the uncalibrated prediction curve. The solid line marked as “Bias−corrected” represents the calibrated prediction curve. The dash line marked as “Ideal”, represents the perfect prediction of the ideal model. (D) DCA for the nomogram model. The black line marked as “None” stands for the net benefit of the assumption that no patients have RA. The grey line marked as “All” represents the net benefit of the assumption that all patients have RA. The red line marked as “Nomogram” represents the net benefit of the assumption that MetS-RA was identified according to the diagnostic value of RA predicted by the nomogram model. (E) CIC for the nomogram model. The red curve indicates the number of people who are classified as high risk by the model at each threshold probability. The blue curve represents the number of true positives at each threshold probability. (F) The nomogram was developed based on TYK2 and TRAF2 from MetS dataset (GSE142401) to predict the risk of MetS. (G) The ROC curves for the predictive performance of TYK2, TRAF2. (H) The calibration curve of nomogram prediction in MetS patients. (I) DCA for the nomogram model. (J) CIC for the nomogram model. (K) The nomogram was developed based on TYK2 and TRAF2 from RA dataset (GSE97779) to predict the risk of RA. (L) The ROC curves for the predictive performance of TYK2, TRAF2. (M) The calibration curve of nomogram prediction in RA patients. (N) DCA for the nomogram model. (O) CIC for the nomogram model.
Identification of candidate small molecule compounds and molecular docking
In order to uncover potential pathogenic genes and underlying signaling pathways in MetS-RA, interactions of MetS associated RA genes were obtained through the STRING database with a medium confidence score > 0.4. The top-ranked module was identified and visualized via the MCODE function of Cytoscape software (Figure 7A, Supplementary Figures 2A). The module with the highest score contained 25 genes (Figure 7B). KEGG analysis showed that these genes were mainly enriched in “NK cell mediated cytotoxicity”, “Hematopoietic cell lineage”, “Cell adhesion molecules”, and immune-related signaling pathways (Figure 7C). In terms of GO-BP, overlapping genes were mainly enriched in immune regulatory processes such as “Regulation of immune system process”, “Regulation of immune response” and “Positive regulation of immune system process”, and cell activation processes such as “T cell activation”, “Lymphocyte activation”, and “Positive regulation of cell activation” (Figure 7D). To predict potential small molecule compounds that might play a therapeutic role in MetS-RA patients, 25 genes (all up-regulated genes) were analyzed via the CMap database. The top 10 compounds with the highest negative scores were considered to be potential therapeutic drugs for the treatment of MetS-RA, including desoxypeganine, IRL-2500, latrepirdine, etodolac, verapamil, CPT, phyllalbine, flumazenil, tropanserin, and valproic-acid (Figure 7E). The sankey diagram showed the targeted pathways of these 10 compounds (Figure 7F), and the chemical structure was visualized (Figure 7G). Further, the molecular docking of these potential therapeutic compounds with TYK2 and TRAF2 was carried out, and the results showed that IRL-2500 and CPT were the top two compounds most closely bound to TYK2 or TRAF2. The binding energy of TYK2 with IRL-2500 was -10.3 kcal/mol, and the binding energy of TYK2 with CPT was -9.43 kcal/mol. TRAF2 has a binding energy of -8.24 kcal/mol with IRL-2500 and -7.7 kcal/mol with CPT (Supplementary Figures 2B, C). It was well proved from a previous research that low-dose CPT could improve the disease condition of RA (23), so the next step was to validate the effect of CPT on the function of MetS-RA-FLS in vitro. The molecular docking of TYK2 or TRAF2 with CPT was visualized (Figures 7H, I).
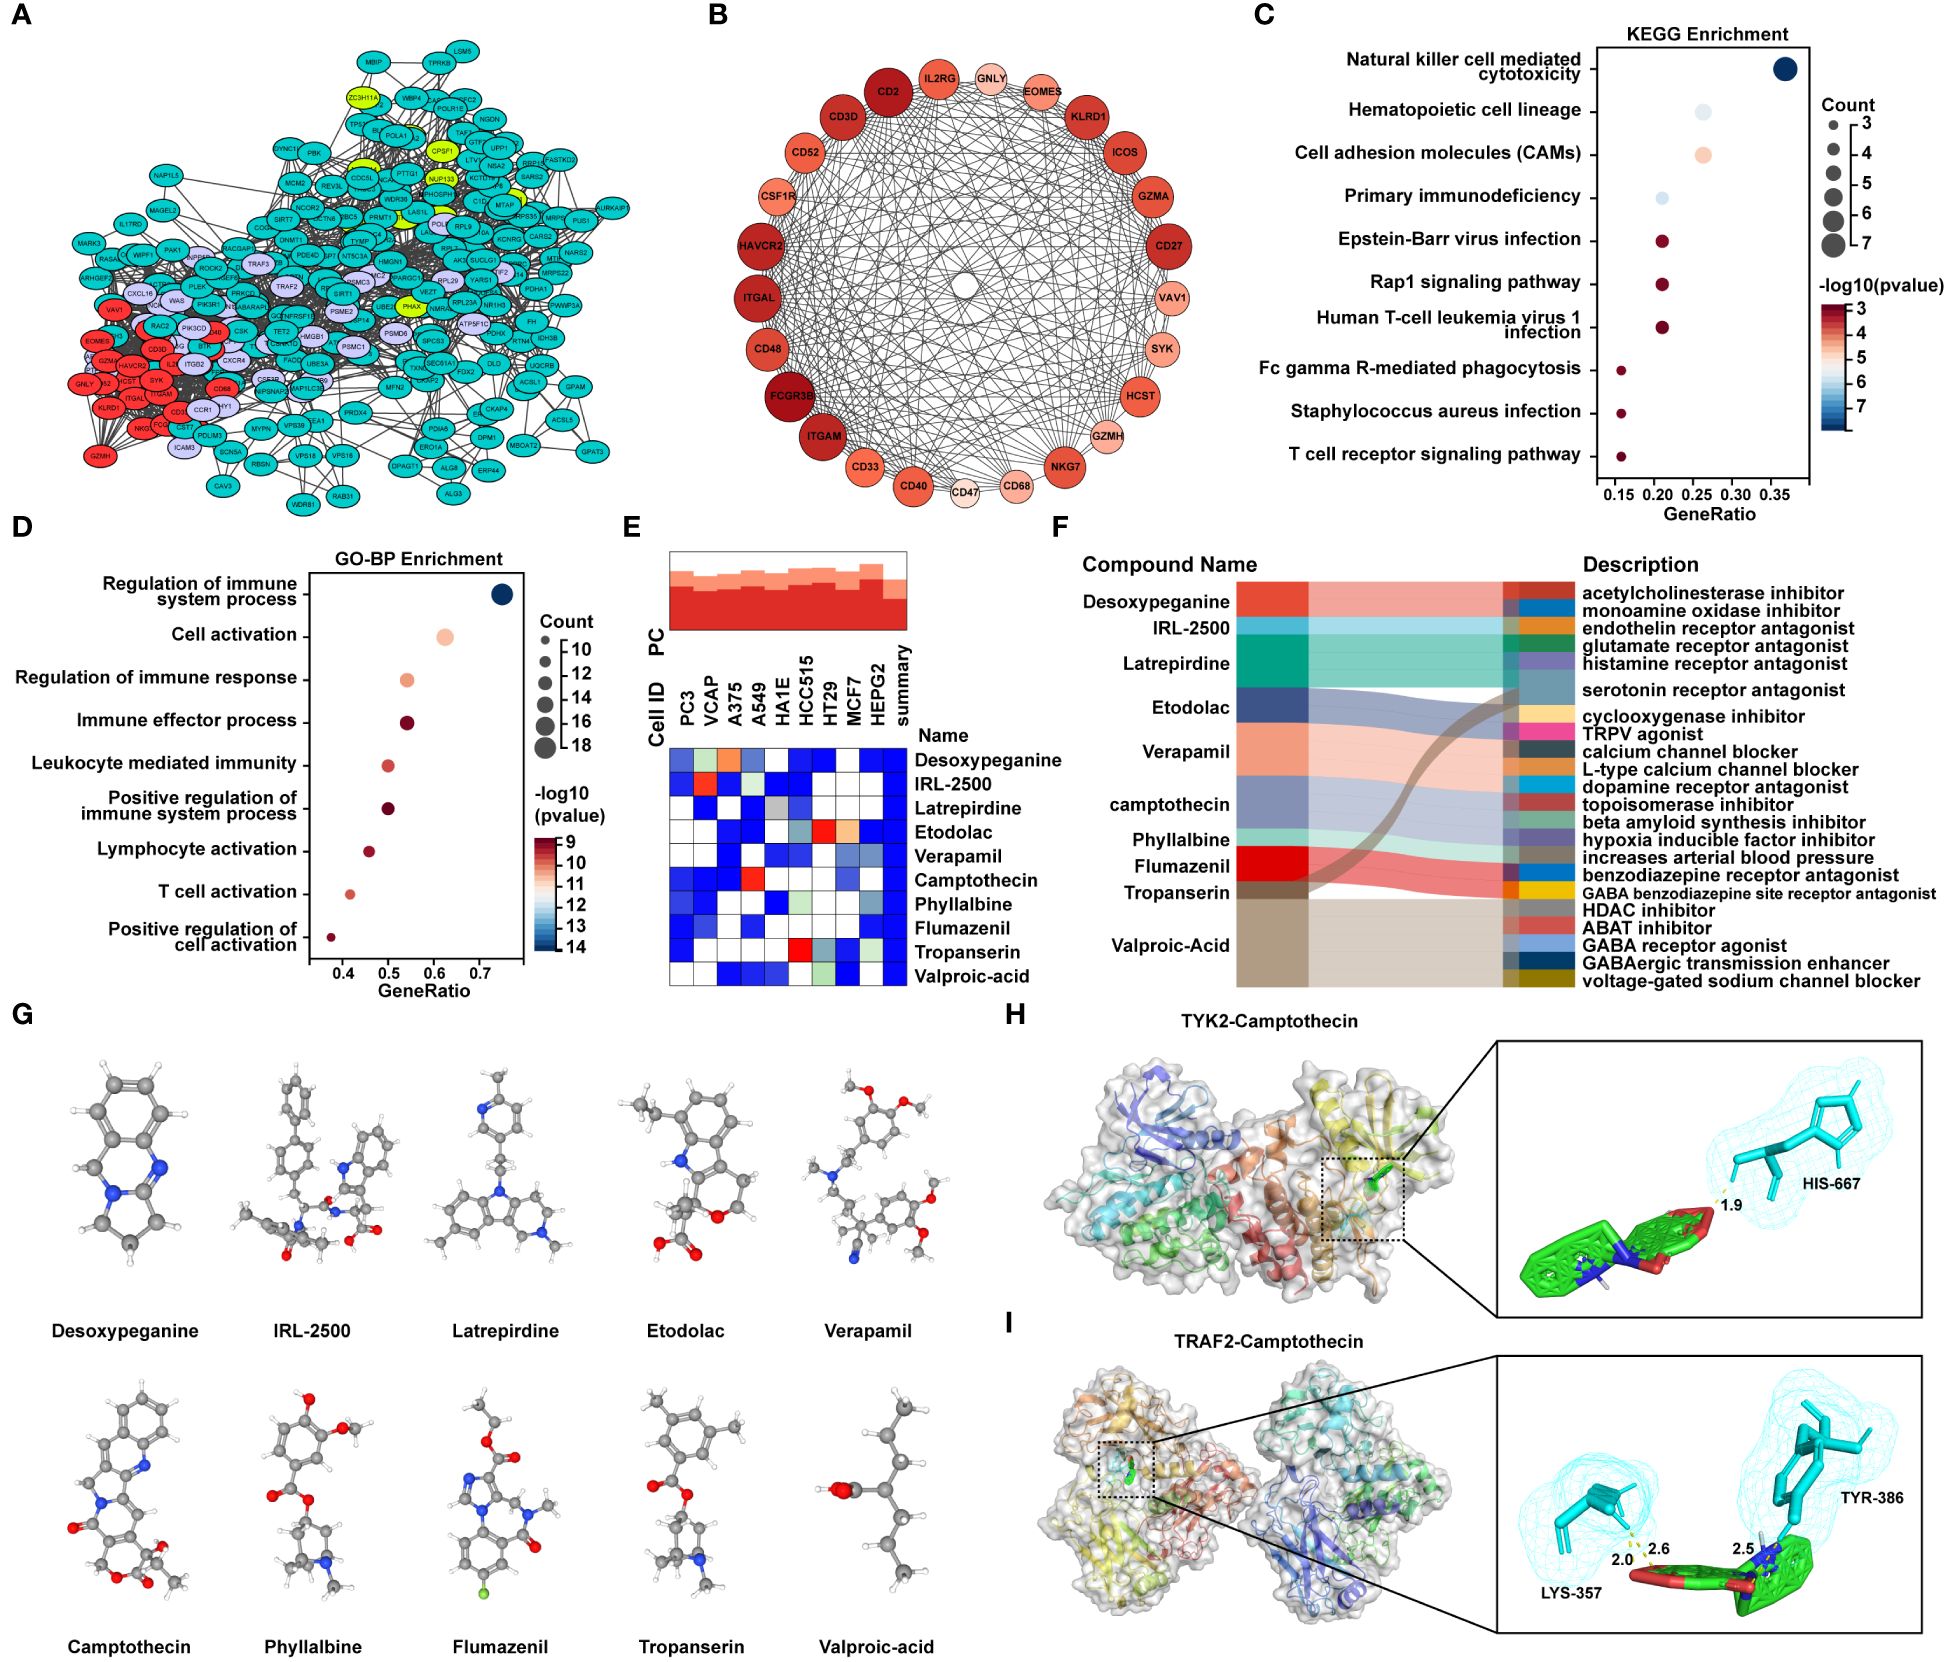
Figure 7 Identification of candidate small molecule compounds and molecular docking. (A) PPI analysis of overlapping genes between RA DGEs and MetS DEGs was performed by STRING database, and cluster analysis was performed via MCODE function of Cytoscape software. (B) The PPI network of module genes with the highest score contained 25 genes based on MCODE analysis. (C) The bubble plot displayed the KEGG enrichment analysis and (D) GO-BP enrichment analysis of genes included in module with the highest score. (E) The heatmap presented the top10 compounds with the most significantly negative enrichment scores in cell lines based on CMap analysis. (F) The sankey diagram showed a description of the top ten compounds. (G) 3D chemical structure visualization of 10 compounds. (H) The molecular docking of TYK2 and camptothecin (CPT), and (I) the molecular docking of TRAF2 and CPT. The yellow dash line represents the hydrogen bond between CPT and the amino acid residue of TYK2 or TRAF2.
Validation of the expression of hub genes and the effect of camptothecin on cell migration and angiogenesis of MetS-RA-FLS
To verify the accuracy of the two hub genes obtained by above integrated bioinformatics analysis, FLSs from patients with osteoarthritis (OA), MetS-RA, and nMetS-RA were isolated. CCK-8 assay showed that the cytotoxicity of CPT to RA-FLS was obvious with the concentration of CPT at 10 or 20μmol/L. According to CCK-8 results, optimal concentration of CPT was determined to be 5 µmol/L (Figure 8A). qRT-PCR results indicated that TYK2 and TRAF2 levels were elevated in RA-FLS compared to OA-FLS, TYK2 and TRAF2 were higher expressed in MetS-RA-FLS compared to nMetS-RA-FLS (Figure 8B). Then CPT was identified as a potential treatment for MetS-RA. RA-FLS has the ability to promote angiogenesis and strong cell migration, so wound-healing assays and angiogenesis experiments were conducted in vitro to verify the effect of CPT on MetS-RA-FLS functions. The results revealed that CPT significantly attenuated the angiogenesis ability of MetS-RA-FLS (Figure 8C). Wound-healing assays showed that MetS-RA-FLS had stronger cell migration ability than MetS-RA-FLS, and CPT treatment significantly reduced the cell migration ability of MetS-RA-FLS (Figure 8D).
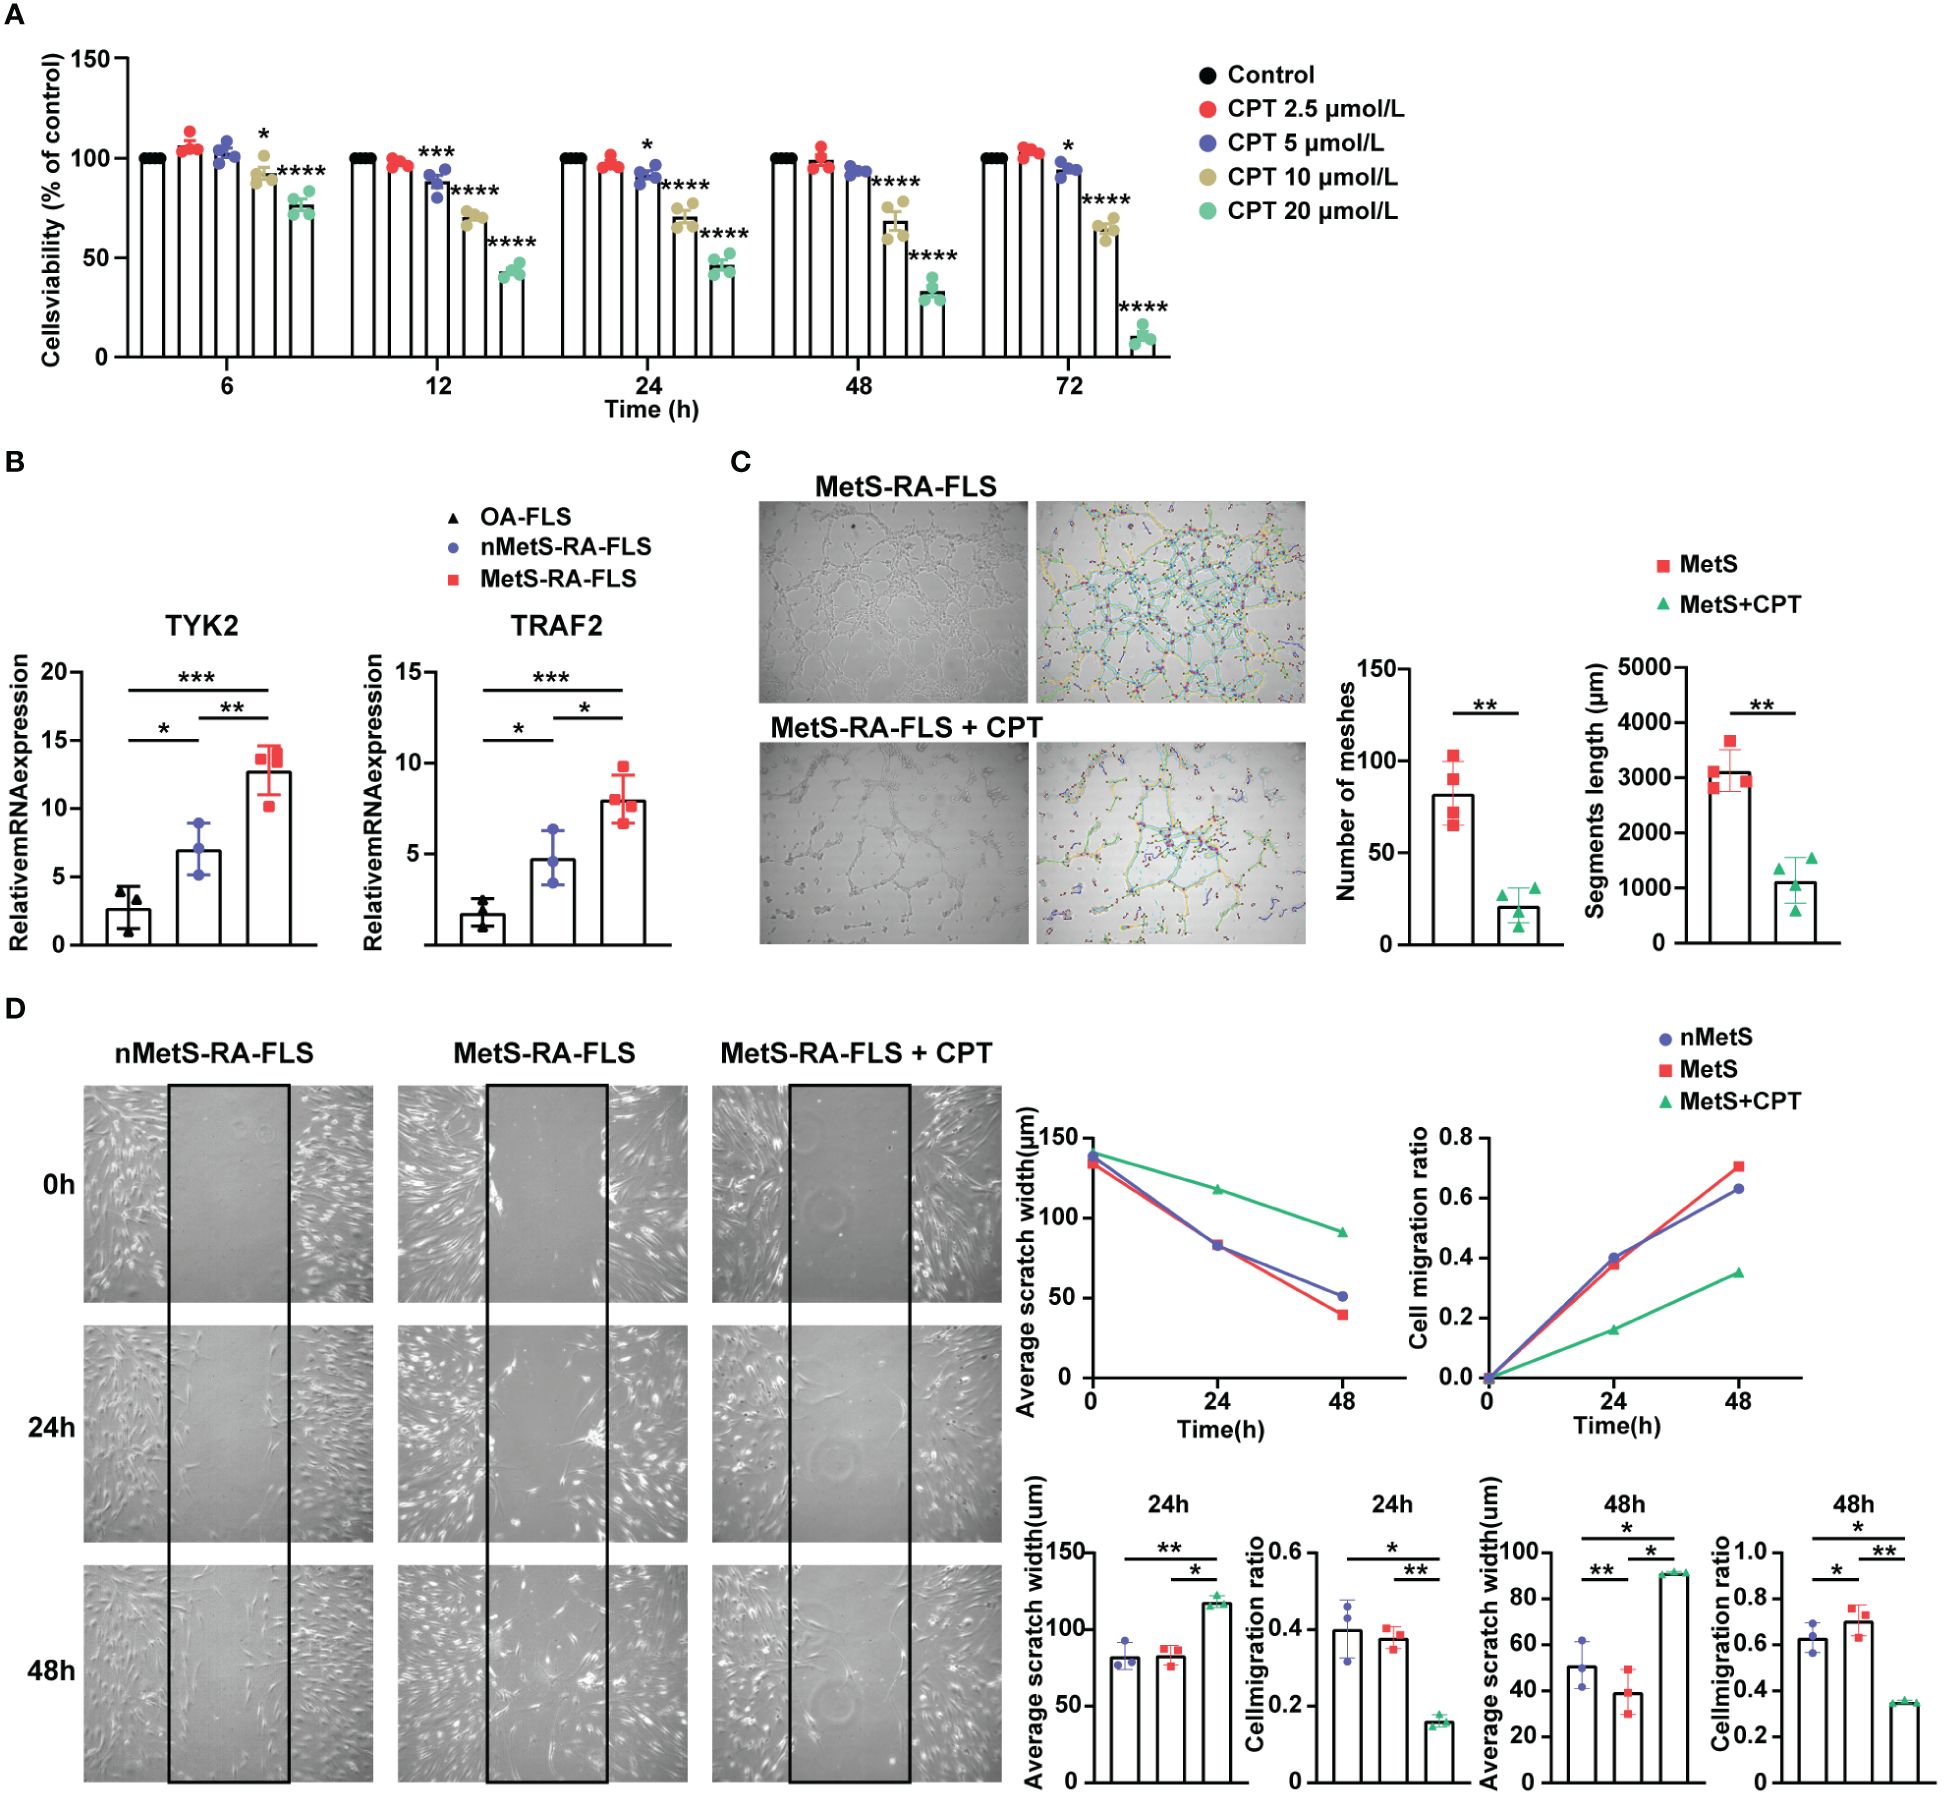
Figure 8 Validation of the expression of hub genes and the effect of CPT on cell migration and angiogenesis of MetS-RA-FLS. (A) Cell Counting Kit-8 (CCK-8) was used to determine the viability of RA-FLS incubated with CPT in a concentration gradient (0, 2.5, 5, 10, and 20μmol/L) and a time gradient (6, 12, 24, 48, and 72h). (B) qRT-PCR was used to determine the relative mRNA level of TYK2 and TRAF2 in OA-FLS (n = 3), nMetS-RA-FLS (n = 3), and MetS-RA-FLS (n = 4). Data are mean ± SD, * P < 0.05, ** P < 0.01, *** P < 0.001, **** P < 0.0001. (C) Angiogenesis experiments exhibited HUVEC tube formation after 4h treatment with cell culture supernatants of MetS-RA-FLS and MetS-RA-FLS incubated with 5 µmol/L CPT (n = 4, per group). Number of meshes and segments length were calculated via ImageJ. (D) Wound-healing assays displayed cell migration of nMetS-RA-FLS, MetS-RA-FLS, and MetS-RA-FLS treated with 5 µmol/L CPT at 0, 24, and 48 h (n = 3, per group). Measurement of scratch width and cell migration ratio via ImageJ.
Immune cell infiltration and correlation analysis in MetS and RA
The enrichment analysis of MetS key genes and MetS-RA key genes showed that MetS and MetS-RA were closely related to immune cell-related signaling pathways. Therefore, the CIBERSORT algorithm was employed to obtain immune cell characteristics to explore the immune regulation and the correlation between infiltrating immune cells in MetS and RA. Immunoinfiltration analysis displayed the proportion of 22 types of immune cells in each sample (Figures 9A, C). There were significant differences in 9 immune cell subsets between RA and control synovium samples. Compared with the control group, the proportion of T cells CD4 memory activated, T cells follicular helper, T cells gamma delta, NK cells activated, and Macrophages M1 increased, while the proportion of B cells naive, Monocytes, Dendritic cells resting, and Mast cells resting decreased (Figure 9B). The correlation analysis showed that Macrophages M1 was significantly positively correlated with T cells gamma delta (r = 0.70, P < 0.0001), T cells CD4 memory activation was negatively correlated with T cells regulation (r = -0.60, P < 0.0001) (Figure 9E). There were significant differences between the PBMC samples from MetS and control groups in 3 immune cell subsets, and the proportion of T cells CD4 memory activated and NK cells resting was increased in MetS PBMC, while the proportion of Macrophages M0 decreased (Figure 9D). The correlation analysis showed that Macrophages M0 was significantly positively correlated with Mast cells resting (r = 0.62, P < 0.0001), T cells CD8 was negatively correlated with T cells CD4 memory resting (r = -0.60, P < 0.0001) (Figure 9F).
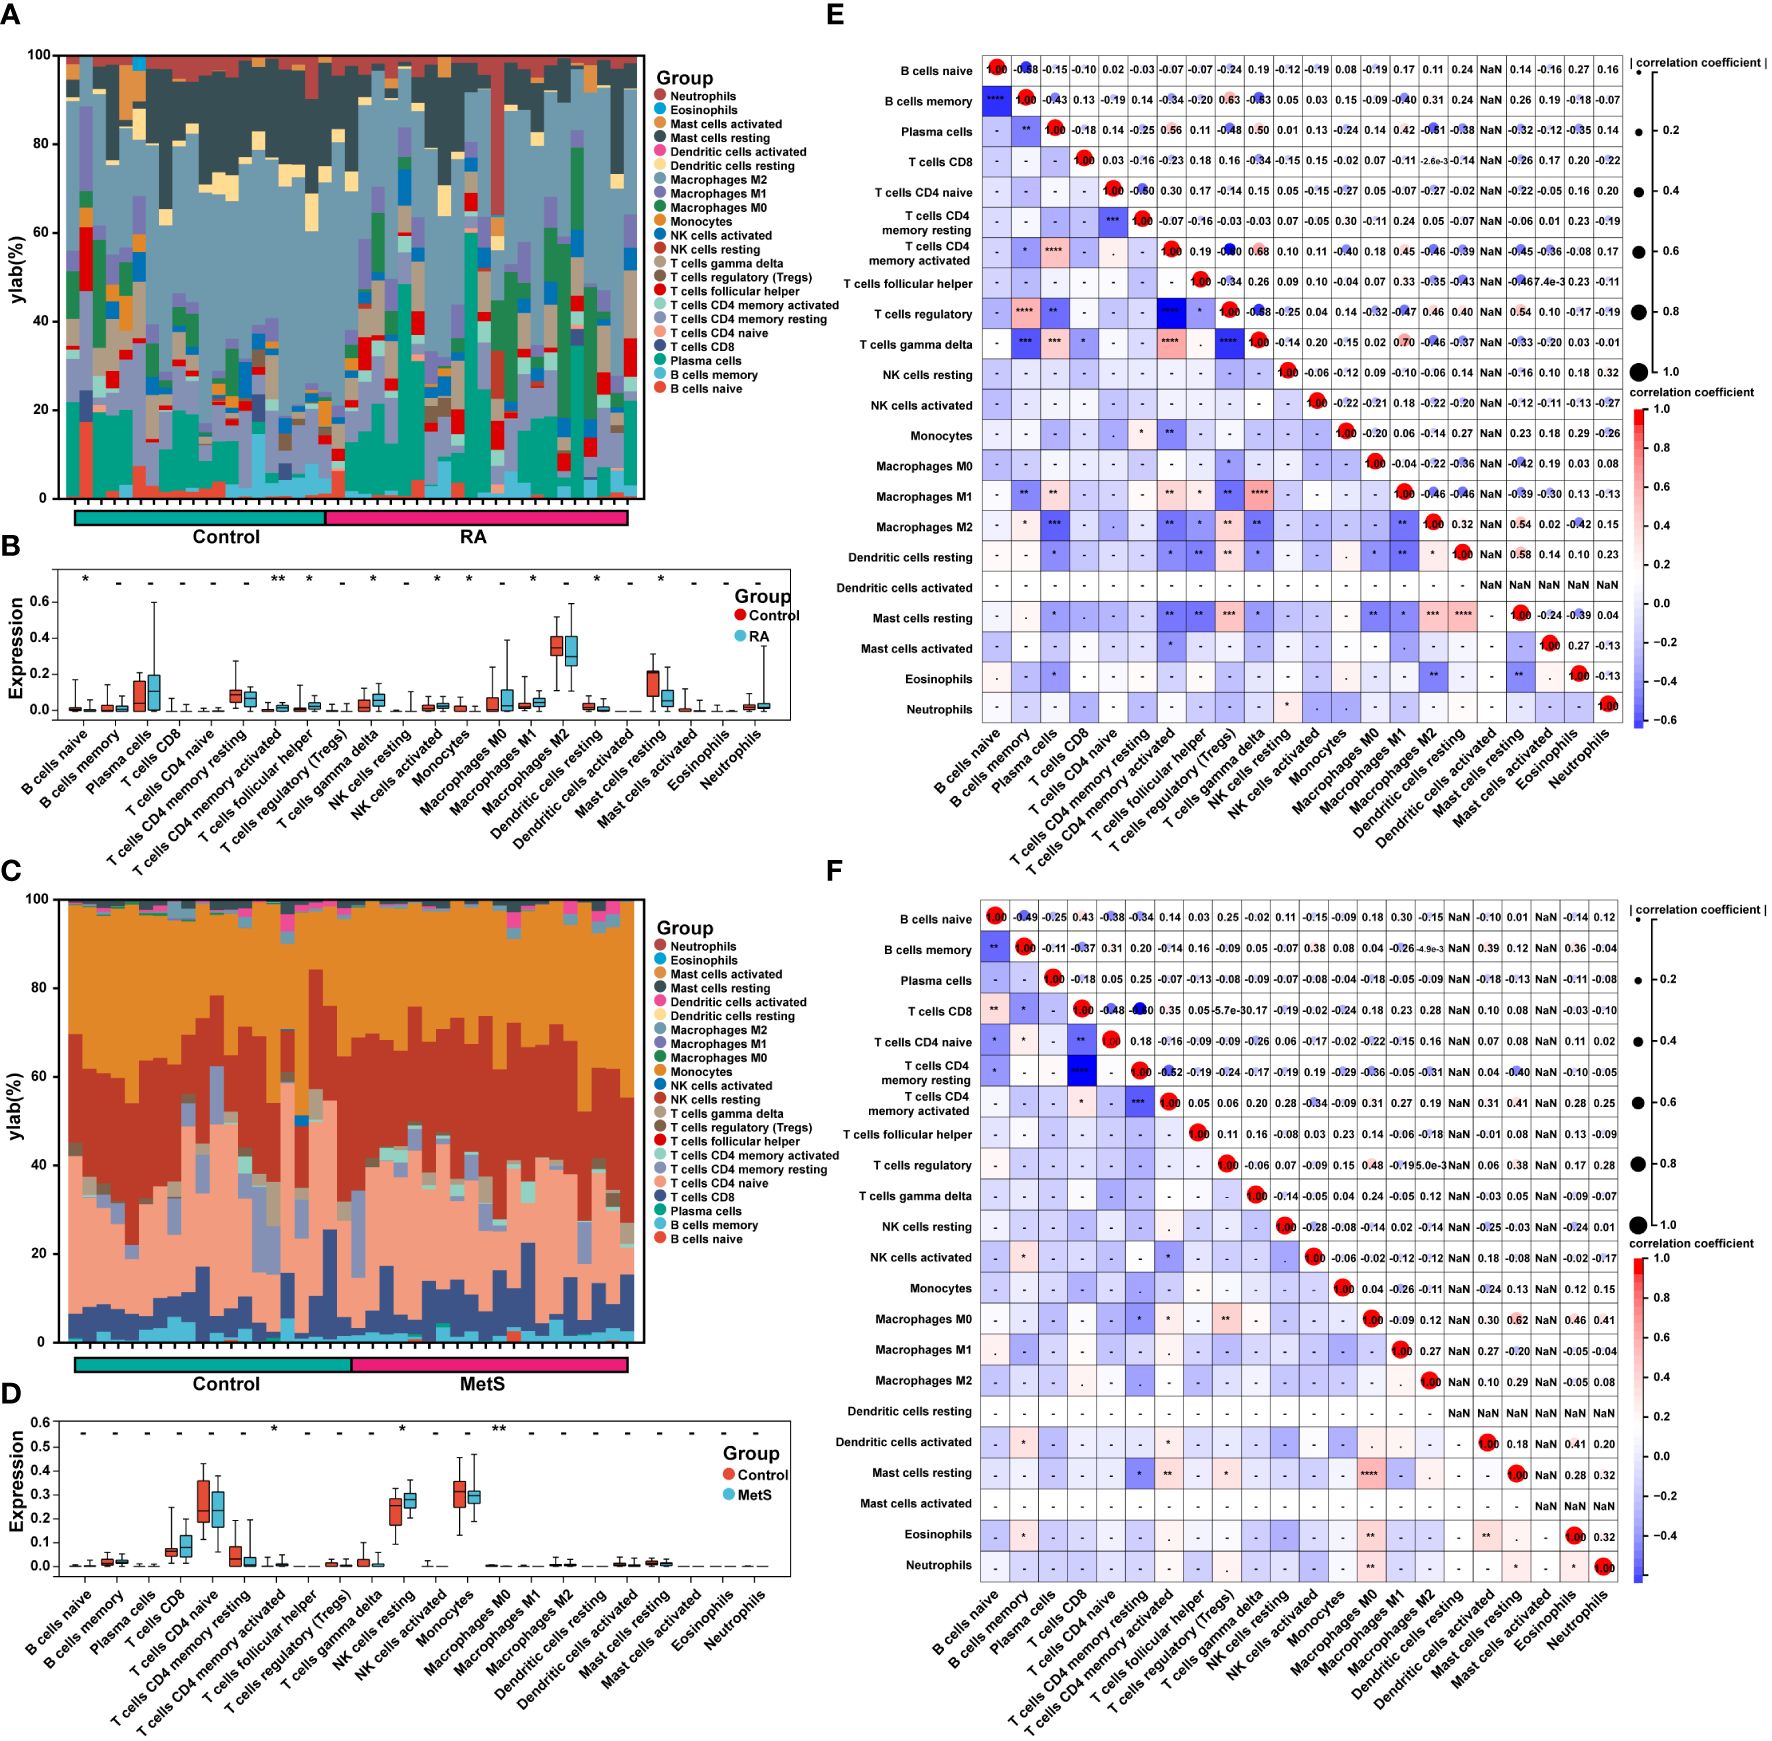
Figure 9 Immune cell infiltration and correlation analysis in MetS and RA. (A) The stacked histogram displayed the proportion of 22 kinds of immune cells between RA and control groups. (B) The boxplot showed the comparison of 22 kinds of immune cells between RA and control groups. Data are mean ± SD, * P < 0.05, ** P < 0.01. (C) The stacked histogram represented the proportion of 22 kinds of immune cells between MetS and control groups. (D) The boxplot exhibited the comparison of 22 kinds of immune cells between MetS and control groups. Data are mean ± SD, * P < 0.05, ** P < 0.01. (E) The heatmap displayed the correlation of 22 immune cell type compositions. Both horizontal and vertical axes demonstrate immune cell subtypes of RA or (F) MetS. * P < 0.05, ** P < 0.01, *** P < 0.001, **** P < 0.0001.
Discussion
In recent years, with the widespread application of sequencing, integrated bioinformatic analysis and machine learning methods are increasingly being applied to explore key genes of disease, potential diagnostic and prognostic biomarkers, potential signaling pathways, and therapeutic targets, thereby providing data support for the full disclosure of diseases (24, 25). The association between RA and MetS has received extensive attention, and a large number of studies have revealed a close relationship between various components of MetS and clinical features of RA (8, 26). In terms of molecular mechanisms, adipokines associated with MetS and metabolic reprogramming of cells caused by MetS affect the disease course of RA (4). However, studies on RA and MetS based on bioinformatics are much less explored. In this study, a variety of bioinformatics analysis methods and machine learning methods were employed to excavate pathogenic genes in MetS-RA, clarify the association between RA and MetS, predict small molecule compounds with potential therapeutic effects, and reveal the immune cell infiltration characteristics of MetS and RA, providing new ideas for future treatment of MetS-RA patients.
Firstly, the enrichment analysis in this study demonstrated that the pathogenesis of MetS-RA may focus on immune system regulation and immune cell activation. GSEA analysis revealed that both RA and MetS had up-regulated T cell receptor pathways and B cell receptor signaling pathways. Moreover, the key genes of MetS and MetS-RA that overlapped with key modules of WGCNA were enriched in Th1/2/17 cell differentiation, NK mediated cytotoxicity, and osteoclast differentiation signaling pathways, which were also included in the enrichment pathway of MetS and RA overlapping DEGs. Li et al. have enlightened the contribution of NK cells to the chronic inflammatory state found in obesity (27). NK cells are innate lymphoid cells that reside in visceral adipose tissue and mediate cellular cytotoxicity. In addition, a study has demonstrated that in non-obese people, macrophages were the main immune cells in adipose tissue, playing a key role in regulating anti-inflammatory mediators, while in obese people, the shift in macrophage phenotype leads to the recruitment of NK cells (28). In turn, NK cells produce cytokines and chemokines that further promote the inflammatory microenvironment associated with obesity. Th cells are key regulators of pro-inflammatory and anti-inflammatory immune processes. Th1 cells are pro-inflammatory cells that express the transcription factor T-bet, interferon γ (IFNγ), interleukin 2 (IL-2), and tumor necrosis factor α (TNF-α). Th17 cells are also highly pro-inflammatory cells. While in obesity-related conditions, Th2 cells seem to exert an anti-inflammatory effect. At present, it is well confirmed that Th1 cells are involved in adipose tissue inflammation associated with obesity-related pathology, the content of Th17 cells in adipose tissue and peripheral blood was increased in patients with obesity and type 2 diabetes. In addition, Th1 and Th17 also aggravate insulin resistance (29). Yokota et al. have reported that osteoclasts induced by TNF and IL-6 participate in the pathological process of RA joint destruction (30). Moreover, pro-inflammatory systemic condition and altered immune response in MetS also affect both catabolic and anabolic processes of bone healing, including increased osteoclastogenesis and impaired osteoblast activity, which could be explained by the dysfunction of insulin receptors that led to activation of signals related to osteoblast differentiation (31). Furthermore, dysregulated metabolic genes existed in MetS, primarily involving glycan biosynthesis, inositol phosphate metabolism, and tryptophan metabolism. These abnormal metabolic pathway were also present in RA, indicating that MetS and RA may share common metabolic pathways, which may be a potential pathogenic mechanism for MetS-RA. In summary, abnormal immune cell differentiation and osteoclast differentiation in MetS may aggravate the pathological process of RA, and the immune environment of RA may also aggravate the inflammatory microenvironment and metabolic reprogramming of histocytes in adipose tissue of individuals with MetS.
Next, two hub genes of MetS-RA, TYK2, and TRAF2, were screened by machine learning methods. After the evaluation of ROC, DCA, and CIC, a nomogram model was constructed based on TYK2 and TRAF2 to show the ideal efficacy of RA diagnosis. In addition, qRT-PCR results showed higher levels of TYK2 and TRAF2 in MetS-RA-FLS, providing a potential novel serum biomarker for the diagnosis of MetS-RA. The tyrosine kinase encoded by the TYK2 gene, a member of the Janus kinase (JAK) protein family, binds to cytoplasmic domains of type I and type II cytokine receptors and transmits cytokine signals by phosphorylating the receptor subunits. Currently, five different JAK inhibitors have been marketed as molecular-targeted compounds for RA as one of the therapeutic strategies for RA, and four of them inhibit TYK2 (32). A Mendelian randomization study suggested that TYK2 gene expression was closely associated with RA, and TYK2 inhibition was associated with a reduced risk of multiple autoimmune diseases (33). A recent review suggested that MetS should be a new indication for JAK inhibitors, highlighting the potential role of JAK inhibitors in reducing relevant inflammatory processes, improving insulin sensitivity, and resolving crosstalk with insulin pathways (34). The protein encoded by TRAF2 is a member of the TNF receptor-associated factor protein family. TRAF proteins are associated with members of the TNF receptor superfamily and mediate relevant signal transduction. Surveys such as that conducted by Potter et al. have shown that TRAF2 activated the NF-κB and JNK signaling pathways, which were involved in cell proliferation, cell differentiation, apoptosis, and bone remodeling. Importantly, it can further activate a variety of inflammatory and immune-related processes induced by cytokines such as TNF-α and IL-1, which play an important role in the pathology of RA (35). Likewise, Wu et al. found that in synovium tissues and cells of RA patients, TRAF2 methylation promoted sustained sensitization of NF-κB signal transduction by inhibiting its proteolysis and enhancing its activity, thereby promoting and sustaining inflammation in the joint (36). Interestingly, fisetin, a natural flavonoid drug that can alleviate MetS, eliminates high-fat diet-induced cardiac tissue inflammation induced by MetS via inhibiting TNFR1/TRAF2 signaling (37), suggesting that TRAF2 may be a key target in the systemic inflammatory response caused by MetS. Previous studies have screened many diagnostic biomarkers for RA and MetS through integrated bioinformatics analysis. Zhang et al. found that SLAMF8 can be used as diagnostic biomarkers for RA (38), while Yu et al. confirmed that LSP1 and GNLY have high predictability for RA (39). In the study by Li et al., FZD7, IRAK3, KDELR3, PHC2, RHOB, RNF170, SOX13, and ZKSCAN4 were screened as hub genes between OA and MetS (25). These hub genes provide new evidence for future disease diagnosis of RA and MetS, and our results also enrich the spectrum of diagnostic biomarkers for RA and MetS.
Nowadays, three categories of disease-modifying anti-rheumatic drugs (DMARDs) constitute the therapeutic armamentarium of RA, including conventional synthetic DMARDs which are small-molecular-weight synthetic drugs with unclear anti-inflammatory mechanisms, biological DMARDs which are mostly monoclonal antibodies that specifically target an individual molecule, and targeted synthetic DMARDs which target specific enzymes within cells (1). However, the phenomenon of pathological metabolic changes caused by RA treatment drugs is of great concern. Previous studies have reported that rheumatoid cachexia can persist in RA patients receiving biotherapy, even after arthritis symptoms improve, and treatment with anti-TNF preparations and other biologic therapies may result in elevated lipid subcomponents. In addition, some medications can also improve insulin sensitivity and have different effects on adipokines (4). Thus, it is necessary to search for drugs that can both improve RA symptoms and metabolic abnormalities. Small molecule compounds exhibit several advantages, including high tissue penetration, a tunable half-life, and oral bioavailability, making them more effective (40). Our study identified a potential small molecule compound CPT targeting MetS-RA based on MetS-RA related pathogenic genes through CMap analysis, providing a new research perspective for the treatment of MetS-RA. CPT is a natural compound originally derived from the Asian camptotheca acuminata, synthesized by Wall and Wani in 1966. CPT is a topoisomerase I inhibitor originally used as an anti-cancer drug, blocks DNA synthesis and cell division leading to programmed cell death by inhibiting topoisomerase I-DNA complex (41). An in vitro study conducted by Jackson et al. proved that CPT could inhibit synovial cell proliferation, angiogenesis, and collagenase expression, with potential anti-arthritic effects, supporting the explorative use of topoisomerase I (especially CPT) and II inhibitors as potential agents against RA (23). And Koo et al. also performed a study in vivo demonstrated that subcutaneous injection of low-dose CPT could reduce joint inflammation in collagen-induced arthritis mice (42). In line with previous studies, we also confirmed that CPT significantly inhibited the cell migration and angiogenesis of MetS-RA-FLS in vitro.
There is a large number of published studies on the analysis of immune cell infiltration in RA synovium have shown that there was accumulation of various types of immune cells in RA synovium, including T cells, B cells, macrophages, NK cells, mast cells, and dendritic cells (39, 43, 44). CD4(+) T cells account for a large proportion of the immune cells invading the RA synovium and participate in the pathological process of RA. T follicular helper (Tfh) cell is a subtype of CD4(+) T cells, whose main functions are assisting B cells and regulating the production of antibodies. Tfh cell surface and secreted molecules, including CXCR5, ICOS, and PD1, are involved in the development of RA. Regulatory T (Treg) cells control an excess of T-cell-mediated immune responses, and Treg cell dysfunction can lead to the development of autoimmunity (45). CD8(+) T cells have anti-inflammatory properties that may help reduce ongoing autoimmune reactions in RA joints (46). NK cell-derived cytokines and their cytotoxic functions through induction of apoptosis take part in the regulation of the immune responses and could contribute to the pathogenesis of RA (47). Macrophages in the synovial membrane of RA are mainly differentiated into M1 type, which has a pro-inflammatory effect, and participate in the pathological process of RA by secreting cytokines to recruit mononuclear or neutrophilic granulocytes, activate T cells, and promote FLS proliferation and activation to promote inflammation (48). B cells in RA synovium induce the production of cytokines such as IL-1α, IL-23, IL-12, IL-6, and TNF-α, causing bone damage, inflammation, and immune disorders (49). Mast cells are tissue-resident cells of the innate immunity, they are present in synovium and their activation has been linked to the potentiation of inflammation in the course of RA (50). In addition, dendritic cells also have been shown to play an important role in the development of RA (51). In this study, immunoinfiltration analysis of RA synovium showed that CD4(+) T cells, T follicular helper cells, T gamma delta cells, NK cells, and M1 type macrophages increased, which was consistent with previous studies. In addition, our results showed that CD4(+) T cells and NK cells were higher in MetS PBMC than in controls, suggesting abnormal immune cell regulation in the peripheral blood of MetS patients. Therefore, a comprehensive understanding of immune cell infiltration associated with RA synovium is essential to explore novel diagnostic or prognostic biomarkers for RA and to further search for therapeutic targets.
Although bioinformatics is widely applied to screen disease diagnostic markers, however, due to individual differences in samples, diagnostic biomarkers may produce false positive or false negative results, leading to insufficient sensitivity and specificity of the biomarkers. Therefore, future research should set more standards to reduce the heterogeneity between samples and ensure the reliability of diagnostic biomarkers.
Data availability statement
The datasets presented in this study can be found in online repositories. The names of the repository/repositories and accession number(s) can be found in the article/Supplementary Material.
Ethics statement
The studies involving humans were approved by Ethics Committee of Henan Provincial People’s Hospital. The studies were conducted in accordance with the local legislation and institutional requirements. The participants provided their written informed consent to participate in this study.
Author contributions
YH: Conceptualization, Data curation, Methodology, Software, Validation, Visualization, Writing – original draft, Writing – review & editing. SY: Data curation, Software, Validation, Writing – original draft. JQ: Data curation, Methodology, Visualization, Writing – review & editing. YD: Data curation, Writing – original draft. YL: Data curation, Writing – original draft. MZ: Software, Writing – original draft. CZ: Software, Writing – original draft. CC: Supervision, Writing – review & editing. YT: Conceptualization, Methodology, Software, Writing – review & editing. JZ: Conceptualization, Supervision, Writing – review & editing.
Funding
The author(s) declare financial support was received for the research, authorship, and/or publication of this article. This work was supported by grants from the Natural Science Funding of Henan province (242300421495).
Conflict of interest
The authors declare that the research was conducted in the absence of any commercial or financial relationships that could be construed as a potential conflict of interest.
Publisher’s note
All claims expressed in this article are solely those of the authors and do not necessarily represent those of their affiliated organizations, or those of the publisher, the editors and the reviewers. Any product that may be evaluated in this article, or claim that may be made by its manufacturer, is not guaranteed or endorsed by the publisher.
Supplementary material
The Supplementary Material for this article can be found online at: https://www.frontiersin.org/articles/10.3389/fimmu.2024.1431452/full#supplementary-material
References
1. Di Matteo A, Bathon JM, Emery P. Rheumatoid arthritis. Lancet. (2023) 402:2019–33. doi: 10.1016/S0140-6736(23)01525-8
2. Cai W, Tang X, Pang M. Prevalence of metabolic syndrome in patients with rheumatoid arthritis: an updated systematic review and meta-analysis. Front Med. (2022) 9:855141. doi: 10.3389/fmed.2022.855141
3. Eckel RH, Grundy SM, Zimmet PZ. The metabolic syndrome. Lancet. (2005) 365:1415–28. doi: 10.1016/S0140-6736(05)66378-7
4. Kerekes G, Nurmohamed MT, González-Gay MA, Seres I, Paragh G, Kardos Z, et al. Rheumatoid arthritis and metabolic syndrome. Nat Rev Rheumatol. (2014) 10:691–6. doi: 10.1038/nrrheum.2014.121
5. Grzechnik K, Targońska-Stępniak B. Metabolic syndrome and rheumatoid arthritis activity: an analysis of clinical, laboratory, and ultrasound parameters. Nutrients. (2023) 15:4756. doi: 10.3390/nu15224756
6. Karvounaris SA, Sidiropoulos PI, Papadakis JA, Spanakis EK, Bertsias GK, Kritikos HD, et al. Metabolic syndrome is common among middle-to-older aged Mediterranean patients with rheumatoid arthritis and correlates with disease activity: a retrospective, cross-sectional, controlled, study. Ann rheumatic Dis. (2007) 66:2. doi: 10.1136/ard.2006.053488
7. Zmora N, Bashiardes S, Levy M, Elinav E. The role of the immune system in metabolic health and disease. Cell Metab. (2017) 25:506–21. doi: 10.1016/j.cmet.2017.02.006
8. Medina G, Vera-Lastra O, Peralta-Amaro AL, Jiménez-Arellano MP, Saavedra MA, Cruz-Domínguez MP, et al. Metabolic syndrome, autoimmunity and rheumatic diseases. Pharmacol Res. (2018) 133:277–88. doi: 10.1016/j.phrs.2018.01.009
9. Francisco V, Ruiz-Fernández C, Pino J, Mera A, González-Gay MA, Gómez R, et al. Adipokines: Linking metabolic syndrome, the immune system, and arthritic diseases. Biochem Pharmacol. (2019) 165:196–206. doi: 10.1016/j.bcp.2019.03.030
10. Rhodes DR, Chinnaiyan AM. Integrative analysis of the cancer transcriptome. Nat Genet. (2005) 37 Suppl:S31–37. doi: 10.1038/ng1570
11. Sajda P. Machine learning for detection and diagnosis of disease. Annu Rev BioMed Eng. (2006) 8:537–65. doi: 10.1146/annurev.bioeng.8.061505.095802
12. Barrett T, Wilhite SE, Ledoux P, Evangelista C, Kim IF, Tomashevsky M, et al. NCBI GEO: archive for functional genomics data sets–update. Nucleic Acids Res. (2013) 41:D991–995. doi: 10.1093/nar/gks1193
13. Johnson WE, Li C, Rabinovic A. Adjusting batch effects in microarray expression data using empirical Bayes methods. Biostatistics. (2007) 8:118–27. doi: 10.1093/biostatistics/kxj037
14. Taminau J, Meganck S, Lazar C, Steenhoff D, Coletta A, Molter C, et al. Unlocking the potential of publicly available microarray data using inSilicoDb and inSilicoMerging R/Bioconductor packages. BMC Bioinf. (2012) 13:335. doi: 10.1186/1471-2105-13-335
15. Shen W, Song Z, Zhong X, Huang M, Shen D, Gao P, et al. Sangerbox: A comprehensive, interaction-friendly clinical bioinformatics analysis platform - Shen - 2022 - iMeta - Wiley Online Library. Imeta. (2022) 1:3. doi: 10.1002/imt2.36
16. Ritchie ME, Phipson B, Wu D, Hu Y, Law CW, Shi W, et al. limma powers differential expression analyses for RNA-sequencing and microarray studies. Nucleic Acids Res. (2015) 43:e47. doi: 10.1093/nar/gkv007
17. Langfelder P, Horvath S. WGCNA: an R package for weighted correlation network analysis. BMC Bioinf. (2008) 9:559. doi: 10.1186/1471-2105-9-559
18. Szklarczyk D, Kirsch R, Koutrouli M, Nastou K, Mehryary F, Hachilif R, et al. The STRING database in 2023: protein-protein association networks and functional enrichment analyses for any sequenced genome of interest. Nucleic Acids Res. (2023) 51:D638–46. doi: 10.1093/nar/gkac1000
19. Ferreira LG, dos Santos RN, Oliva G, Andricopulo AD. Molecular docking and structure-based drug design strategies. Molecules. (2015) 20:13384–421. doi: 10.3390/molecules200713384
20. Newman AM, Liu CL, Green MR, Gentles AJ, Feng W, Xu Y, et al. Robust enumeration of cell subsets from tissue expression profiles. Nat Methods. (2015) 12:453–7. doi: 10.1038/nmeth.3337
21. Suarez-Arnedo A, Torres Figueroa F, Clavijo C, Arbeláez P, Cruz JC, Muñoz-Camargo C. An image J plugin for the high throughput image analysis of in vitro scratch wound healing assays. PloS One. (2020) 15:e0232565. doi: 10.1371/journal.pone.0232565
22. Arnaoutova I, Kleinman HK. In vitro angiogenesis: endothelial cell tube formation on gelled basement membrane extract. Nat Protoc. (2010) 5:628–35. doi: 10.1038/nprot.2010.6
23. Jackson JK, Higo T, Hunter WL, Burt HM. Topoisomerase inhibitors as anti-arthritic agents. Inflammation Res. (2008) 57:126–34. doi: 10.1007/s00011-007-7163-6
24. Zhu E, Shu X, Xu Z, Peng Y, Xiang Y, Liu Y, et al. Screening of immune-related secretory proteins linking chronic kidney disease with calcific aortic valve disease based on comprehensive bioinformatics analysis and machine learning. J Transl Med. (2023) 21:359. doi: 10.1186/s12967-023-04171-x
25. Li J, Wang G, Xv X, Li Z, Shen Y, Zhang C, et al. Identification of immune-associated genes in diagnosing osteoarthritis with metabolic syndrome by integrated bioinformatics analysis and machine learning. Front Immunol. (2023) 14:1134412. doi: 10.3389/fimmu.2023.1134412
26. Luo P, Xu W, Ye D, Chen W, Ying J, Liu B, et al. Metabolic syndrome is associated with an increased risk of rheumatoid arthritis: A prospective cohort study including 369,065 participants. J Rheumatol. (2024) 51:360–7. doi: 10.3899/jrheum.2023-0349
27. Li Y, Wang F, Imani S, Tao L, Deng Y, Cai Y. Natural killer cells: friend or foe in metabolic diseases? Front Immunol. (2021) 12:614429. doi: 10.3389/fimmu.2021.614429
28. Lumeng CN, Bodzin JL, Saltiel AR. Obesity induces a phenotypic switch in adipose tissue macrophage polarization. J Clin Invest. (2007) 117:175–84. doi: 10.1172/JCI29881
29. Van Herck MA, Weyler J, Kwanten WJ, Dirinck EL, De Winter BY, Francque SM, et al. The differential roles of T cells in non-alcoholic fatty liver disease and obesity. Front Immunol. (2019) 10:82. doi: 10.3389/fimmu.2019.00082
30. Yokota K, Sato K, Miyazaki T, Aizaki Y, Tanaka S, Sekikawa M, et al. Characterization and function of tumor necrosis factor and interleukin-6-induced osteoclasts in rheumatoid arthritis. Arthritis Rheumatol. (2021) 73:1145–54. doi: 10.1002/art.41666
31. de Oliveira PGFP, Bonfante EA, Bergamo ETP, de Souza SLS, Riella L, Torroni A, et al. Obesity/metabolic syndrome and diabetes mellitus on peri-implantitis. Trends Endocrinol Metab. (2020) 31:596–610. doi: 10.1016/j.tem.2020.05.005
32. Kubo S, Nakayamada S, Tanaka Y. JAK inhibitors for rheumatoid arthritis. Expert Opin Investigational Drugs. (2023) 32:333–44. doi: 10.1080/13543784.2023.2199919
33. Yuan S, Wang L, Zhang H, Xu F, Zhou X, Yu L, et al. Mendelian randomization and clinical trial evidence supports TYK2 inhibition as a therapeutic target for autoimmune diseases. EBioMedicine. (2023) 89:104488. doi: 10.1016/j.ebiom.2023.104488
34. Collotta D, FranChina MP, Carlucci V, Collino M. Recent advances in JAK inhibitors for the treatment of metabolic syndrome. Front Pharmacol. (2023) 14:1245535. doi: 10.3389/fphar.2023.1245535
35. Potter C, Eyre S, Cope A, Worthington J, Barton A. Investigation of association between the TRAF family genes and RA susceptibility. Ann Rheum Dis. (2007) 66:1322–6. doi: 10.1136/ard.2006.065706
36. Wu W, Wang J, Xiao C, Su Z, Su H, Zhong W, et al. SMYD2-mediated TRAF2 methylation promotes the NF-κB signaling pathways in inflammatory diseases. Clin Transl Med. (2021) 11:e591. doi: 10.1002/ctm2.591
37. Hu L-F, Feng J, Dai X, Sun Y, Xiong M, Lai L, et al. Oral flavonoid fisetin treatment protects against prolonged high-fat-diet-induced cardiac dysfunction by regulation of multicombined signaling. J Nutr Biochem. (2020) 77:108253. doi: 10.1016/j.jnutbio.2019.108253
38. Zhang C, Huang H, Zhang J, Huang Y, Qin Y, Li X. SLAMF8 as a potential biomarker for rheumatoid arthritis identified by comparing peripheral blood mononuclear cells, fibroblast-like synoviocytes, and synovial tissue using bioinformatics analysis. Rheumatol Autoimmun. (2024) 4:99–108. doi: 10.1002/rai2.12117
39. Yu R, Zhang J, Zhuo Y, Hong X, Ye J, Tang S, et al. Identification of diagnostic signatures and immune cell infiltration characteristics in rheumatoid arthritis by integrating bioinformatic analysis and machine-learning strategies. Front Immunol. (2021) 12:724934. doi: 10.3389/fimmu.2021.724934
40. Zhang B, Dömling A. Small molecule modulators of IL-17A/IL-17RA: a patent review (2013-2021). Expert Opin Ther Pat. (2022) 32:1161–73. doi: 10.1080/13543776.2022.2143264
41. Stewart L, Redinbo MR, Qiu X, Hol WG, Champoux JJ. A model for the mechanism of human topoisomerase I. Science. (1998) 279:1534–41. doi: 10.1126/science.279.5356.1534
42. Koo OMY, Rubinstein I, Onyüksel H. Actively targeted low-dose camptothecin as a safe, long-acting, disease-modifying nanomedicine for rheumatoid arthritis. Pharm Res. (2011) 28:776–87. doi: 10.1007/s11095-010-0330-4
43. Ao Y, Wang Z, Hu J, Yao M, Zhang W. Identification of essential genes and immune cell infiltration in rheumatoid arthritis by bioinformatics analysis. Sci Rep. (2023) 13:2032. doi: 10.1038/s41598-023-29153-3
44. Zhou S, Lu H, Xiong M. Identifying immune cell infiltration and effective diagnostic biomarkers in rheumatoid arthritis by bioinformatics analysis. Front Immunol. (2021) 12:726747. doi: 10.3389/fimmu.2021.726747
45. Kondo Y, Yokosawa M, Kaneko S, Furuyama K, Segawa S, Tsuboi H, et al. Review: transcriptional regulation of CD4+ T cell differentiation in experimentally induced arthritis and rheumatoid arthritis. Arthritis Rheumatol. (2018) 70:653–61. doi: 10.1002/art.40398
46. Carvalheiro H, da Silva JAP, Souto-Carneiro MM. Potential roles for CD8(+) T cells in rheumatoid arthritis. Autoimmun Rev. (2013) 12:401–9. doi: 10.1016/j.autrev.2012.07.011
47. Kucuksezer UC, Aktas Cetin E, Esen F, Tahrali I, Akdeniz N, Gelmez MY, et al. The role of natural killer cells in autoimmune diseases. Front Immunol. (2021) 12:622306. doi: 10.3389/fimmu.2021.622306
48. Boutet M-A, Courties G, Nerviani A, Le Goff B, Apparailly F, Pitzalis C, et al. Novel insights into macrophage diversity in rheumatoid arthritis synovium. Autoimmun Rev. (2021) 20:102758. doi: 10.1016/j.autrev.2021.102758
49. Wu F, Gao J, Kang J, Wang X, Niu Q, Liu J, et al. B cells in rheumatoid arthritis: Pathogenic mechanisms and treatment prospects. Front Immunol. (2021) 12:750753. doi: 10.3389/fimmu.2021.750753
50. Rivellese F, Nerviani A, Rossi FW, Marone G, Matucci-Cerinic M, de Paulis A, et al. Mast cells in rheumatoid arthritis: friends or foes? Autoimmun Rev. (2017) 16:557–63. doi: 10.1016/j.autrev.2017.04.001
Keywords: rheumatoid arthritis, metabolic syndrome, machine learning, molecular docking, immune infiltration
Citation: Huang Y, Yue S, Qiao J, Dong Y, Liu Y, Zhang M, Zhang C, Chen C, Tang Y and Zheng J (2024) Identification of diagnostic genes and drug prediction in metabolic syndrome-associated rheumatoid arthritis by integrated bioinformatics analysis, machine learning, and molecular docking. Front. Immunol. 15:1431452. doi: 10.3389/fimmu.2024.1431452
Received: 12 May 2024; Accepted: 15 July 2024;
Published: 29 July 2024.
Edited by:
Michele Maria Luchetti Gentiloni, Clinical and Molecular Sciences Department, ItalyReviewed by:
Narjes Saheb Sharif-Askari, University of Sharjah, United Arab EmiratesJianan Zhao, Shanghai University of Traditional Chinese Medicine, China
Jinfang Gao, Shanxi Medical University, China
Copyright © 2024 Huang, Yue, Qiao, Dong, Liu, Zhang, Zhang, Chen, Tang and Zheng. This is an open-access article distributed under the terms of the Creative Commons Attribution License (CC BY). The use, distribution or reproduction in other forums is permitted, provided the original author(s) and the copyright owner(s) are credited and that the original publication in this journal is cited, in accordance with accepted academic practice. No use, distribution or reproduction is permitted which does not comply with these terms.
*Correspondence: Jia Zheng, emhlbmdqaWE5MDE4MEBzaW5hLmNvbQ==; Yuqin Tang, dGFuZ3l1cWluMTUwQDEyNi5jb20=