
94% of researchers rate our articles as excellent or good
Learn more about the work of our research integrity team to safeguard the quality of each article we publish.
Find out more
ORIGINAL RESEARCH article
Front. Immunol. , 17 July 2024
Sec. Cancer Immunity and Immunotherapy
Volume 15 - 2024 | https://doi.org/10.3389/fimmu.2024.1424933
This article is part of the Research Topic Mechanisms and Therapeutic Opportunities of T Cell Impairment in Cancer Immunity and Immunotherapy View all 9 articles
 Xue-Ping Li1,2
 Jiang-Tao Song1,2
 Yu-Ting Dai3
 Wei-Na Zhang4Bai-Tian Zhao2,5
 Jia-Ying Mao2,5
 Yan Gao2,5*
 Lu Jiang3*
 Yang Liang1,2*
Introduction: Immunotherapies targeting T cells in solid cancers are revolutionizing clinical treatment. Novel immunotherapies have had extremely limited benefit for acute myeloid leukemia (AML). Here, we characterized the immune microenvironment of t(8;21) AML patients to determine how immune cell infiltration status influenced prognosis.
Methods: Through multi-omics studies of primary and longitudinal t(8;21) AML samples, we characterized the heterogeneous immune cell infiltration in the tumor microenvironment and their immune checkpoint gene expression. Further external cohorts were also included in this research.
Results: CD8+ T cells were enriched and HAVCR2 and TIGIT were upregulated in the CD34+CD117dim%-High group; these features are known to be associated with immune exhaustion. Data integration analysis of single-cell dynamics revealed that a subset of T cells (cluster_2) (highly expressing GZMB, NKG7, PRF1 and GNLY) evolved and expanded markedly in the drug-resistant stage after relapse. External cohort analysis confirmed that the cluster_2 T-cell signature could be utilized to stratify patients by overall survival outcome.
Discussion: In conclusion, we discovered a distinct T-cell signature by scRNA-seq that was correlated with disease progression and drug resistance. Our research provides a novel system for classifying patients based on their immune microenvironment.
Immunotherapies have had good effects against solid cancers by targeting immune evasion to restore T-cell immunity and are revolutionizing cancer treatment (1, 2). However, the development of immunotherapy for acute myeloid leukemia (AML), which is characterized by the blockade of myeloid differentiation in hematopoietic stem and progenitor cells, has been rather challenging (3).
AML cells can escape or inhibit immune system mechanisms by, for example, downregulating major histocompatibility complex (MHC) molecules or upregulating inhibitory ligands (4, 5). Treatment for AML depends largely on T-cell-mediated effects (4, 5). Exhausted T cells play a role in AML relapse, even for patients receiving allogeneic hematopoietic cell transplantation (6).
Deciphering the immunosuppressive microenvironment of AML has become a research hotspot (4) (7). Recently, the development and application of single-cell technology have allowed the characterization of tumor-infiltrating T cells across cancers (8–10). Notably, exhausted T cells within different cancer types are diverse and heterogeneous.
AML with t(8;21)(q22;q22.1), a special subtype of core binding factor carrying the RUNX1-RUNX1T1 fusion genes, accouts for nearly 8% of all AMLs (11). Though normally considered as a favorable subtype, nearly 30% of patients with t(8;21)AML relapse clinically (12, 13).
Our group has been dedicated to evaluating the heterogeneity of t(8;21) AML. We have constructed a multi-omics dataset for studying t(8;21) AML; this dataset includes single-cell RNA-seq as well as whole-exome sequencing data (14–16). In our previous multi-omics studies (14, 15), patients with relapsed or refractory disease were shown to have a greater proportion of CD34+CD117dim cells (Blast population 1, BP1) than other patients.
Here, we aimed to apply a multi-omics approach to characterize the heterogeneity of immune microenvironment of t(8;21) AML patients and determine how immune cell infiltration status influences prognosis.
The study design is illustrated in Supplementary Figure S1. Briefly, we obtained data from newly diagnosed t(8;21) AML patients, including single-cell RNA-seq and bulk RNA-seq data (National Omics Data encyclopedia (NODE), OEP000629), from our previous reports (14). Patients received standard “3 + 7” induction regimens, including idarubicin and cytarabine, followed by high-dose cytarabine-based consolidation or hematopoietic stem cell transplantation (HSCT). In total, 28 of 62 t(8;21) AML patients relapsed. Of these 28 relapse patients, we observed 20 patients with drug-resistant disease stages (DRD).
We also used gene expression data of AML patients generated from Affymetrix arrays and RNA-seq. Data from the GSE37642 dataset, which included data obtained via the GPL96 (n=417) and GPL570 (n=136) platforms, and the GSE106291 (GPL18460) (n=250) dataset were downloaded online (17–20). We also downloaded the Beat AML (n = 200) (21) and TCGA LAML (n=140) (22) datasets. Patients were treated according to protocols described in the corresponding literature. In summary, data from 1205 patients were analyzed in this study (Table 1).
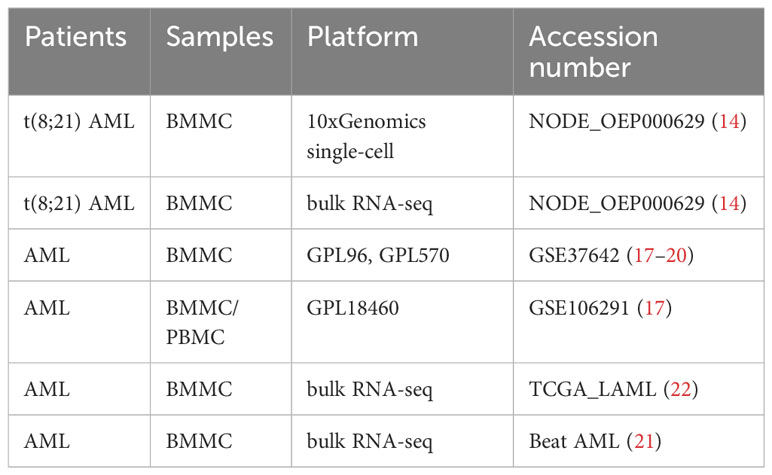
Table 1 The gene sets analyzed in this study.
Bone marrow mononuclear cells (BMMCs) from t(8;21) AML patients were collected and subjected to the 10X Chromium platform for indexed sequencing of libraries following paired-end (2 × 150 bp) sequencing on a NovaSeq platform (Illumina) to conduct the single-cell RNA-seq analysis. The detailed process was described in our previous research (14, 15). To generate gene expression matrices, we utilized the cellranger tool (version 3.1.2, default settings) from 10X Genomics to align single-cell RNA sequencing (scRNA-seq) data with the human GRCh38 reference genome (2020-A version). Both the cellranger software and the GRCh38 reference were downloaded from the 10X Genomics website (https://www.10xgenomics.com). Subsequently, the gene expression matrices were imported into the Seurat package in R for further analysis (23). For quality control, cells expressing fewer than 800 genes or containing more than 10% mitochondrial RNA were excluded. The resulting filtered count matrices from different time points were then merged using the Seurat package. The expression data underwent normalization through a global-scaling normalization method, as implemented by default in the Seurat package. Following normalization, 2000 variable genes were identified to analyze expression variability across samples. Batch effects were removed using ComBat (24, 25). The uniform manifold approximation and projection (UMAP) technique was used for visualization (26). Cell cycle phase scores were calculated using the built-in function CellCycleScoring in Seurat with default parameters (27). Cells were annotated utilizing the machine-learning-based software SingleR (28), alongside the identification of high expression levels of canonical markers, such as CD34 for progenitor cells, CD3 for T-cells, CD79A for B cells, and CA1 for erythroid cells. For T-cell cluster analysis, unsupervised clustering was conducted on the T-cells derived from t(8;21) AML samples. This was performed using the “FindClusters” function in Seurat with the resolution parameter set to 0.8. Following this, five distinct T-cell clusters were identified. Marker genes for each cluster were determined through the “FindAllMarkers” function, adhering to criteria that included a log2(fold change) greater than 0.58 (fold change > 1.5), min.pct > 0.1, and adjusted P < 0.05.
The raw bulk RNA-seq data from t(8;21) AML patients at diagnosis were obtained previously. Briefly, after aligning raw reads to human reference genome hg19, we generated indexed BAM files with SAMtools and acquired count matrix with DESeq2 (29, 30). To calculate the gene expression, we used the fragments per kilobase million after nomalization. In addtion, limma package (31) was applied to identify differentially expressed genes. A heatmap of the 79 immune checkpoint genes was generated via the Hiplot platform (https://hiplot.com.cn/).
CellPhoneDB (http://www.cellphonedb.org/) (32) was applied to analyze cell-cell communication between different cell types with default parameters. Mean expression of each receptor-ligand pair was calculated and enrolled for further analysis.
Overexpressed genes in cluster_2 T cells were defined as those with an average log2(fold change) greater than 1.0 and a p value less than 0.05 in the scRNA-seq data. A total of 178 genes were ultimately screened out from among the highly expressed genes in the scRNA-seq data of cluster_2 T cells (Supplementary Table S1). GSE37642 (German AMLCG 1999) dataset was applied as the training dataset. We first conducted univariate cox regression analyis to determine the significantly prognostic genes in cluster_2 T cells. Then, least absolute shrinkage and selection operator (LASSO) regression analysis was utilized to calculate the parameters of lambda.min and lambda.1se, which providing the optimal gene number interval to construct the model. Afterwards, we performed the multi-variate Cox regression to determine the final risk model, of which 14 genes with high coefficients were selected, 14 T-cell-related genes (named the 14TGS).
QuanTIseq (33), CIBERSORT (34) and EPIC (35) were used to estimate the proportions of infiltrated immune cell types in the bone marrow microenvironment of t(8;21) AML patients. Groups were compared with the two-sided Wilcoxon rank-sum test.
Kyoto Encyclopedia of Genes and Genomes (KEGG) (36) and Gene Ontology (GO) (37) enrichment analyses were applied to the 178 genes that characterized the cluster_2 T cells.The adjusted Benjamini-Hochberg P value was calculaeted to compare groups.
Kaplan–Meier plots were generated, and P values were determined via the log-rank test. Receiver operating characteristic (ROC) curves were analyzed with the timeROC package to calculate the areas under the ROC curves (AUCs) (38). R software (version 4.0.2) was used to perform the analysis.
To determine the landscape of infiltrating immune cells, we first conducted immune infiltration analysis with bulk RNA-seq data from patients newly diagnosed with t(8;21) AML (n = 62) in our cohort. The proportion of CD34+CD117dim cells in the total CD34+ population of the BM was determined previously by multiparameter flow cytometry at diagnosis (14). Patients then received standard induction chemotherapy as described (14). Here, we dichotomized the whole cohort into two subgroups around the median proportion of CD34+CD117dim cells (45.5%).
To estimate the proportions of various immune cell subsets, we used multiple methods, including quanTIseq (33), CIBERSORT (34) and EPIC (35). The immune infiltration results from quanTIseq showed that the CD34+CD117dim%-High subgroup had more CD8+ T cells and monocytes than the CD34+CD117dim%-Low subgroup (Supplementary Figure S2A). The EPIC and CIBERSORT algorithms also indicated a higher infiltration of CD8+T cells in the CD34+CD117dim%-High subgroup, though the P values were only 0.055 and 0.054, respectively (Supplementary Figures S2B, C). For the other infiltrating immune cells, we did not observe intergroup differences by these three methods. Thus, we further focused on the role of infiltrating CD8+ T cells, which might indicate a dysfunctional status of the T cells in the CD34+CD117dim%-High subgroup.
Immune checkpoint genes regulate the immune response by stimulating or inhibiting pathways (39) [for a summary of immune checkpoint genes, see (40)]. We hypothesized that CD8+ T cells in the CD34+CD117dim%-High subgroup were dysfunctional. We then analyzed the 79 immune checkpoint genes that function as active, inhibitory or two-sided immune chekcpoint genes (40), most of which were receptors or ligands in immune-related pathways.
The CD34+CD117dim%-High risk subgroup had a differential expression profile than the CD34+CD117dim%-Low risk subgroup had (Figure 1). Notably, the CD34+CD117dim%-High subgroup expressed high levels of immune checkpoint inhibitors, including HAVCR2 (encoding the TIM-3 protein) and TIGIT (encoding the immunoglobin protein), which were known to be associated with immune exhaustion (Figure 1; Supplementary Figure S3). In addition, CD27, CD70, CD226, CD276 and TNFSF9 were also more highly expressed in the CD34+CD117dim%-High subgroup. On the other hand, CEACM1 and TNFRSF9 were more highly expressed in the CD34+CD117dim%-Low subgroup (Supplementary Figure S3). The highly immunosuppressive phenotype of the microenvironment might play an important role in promoting inferior outcomes in the CD34+CD117dim%-High subgroup.
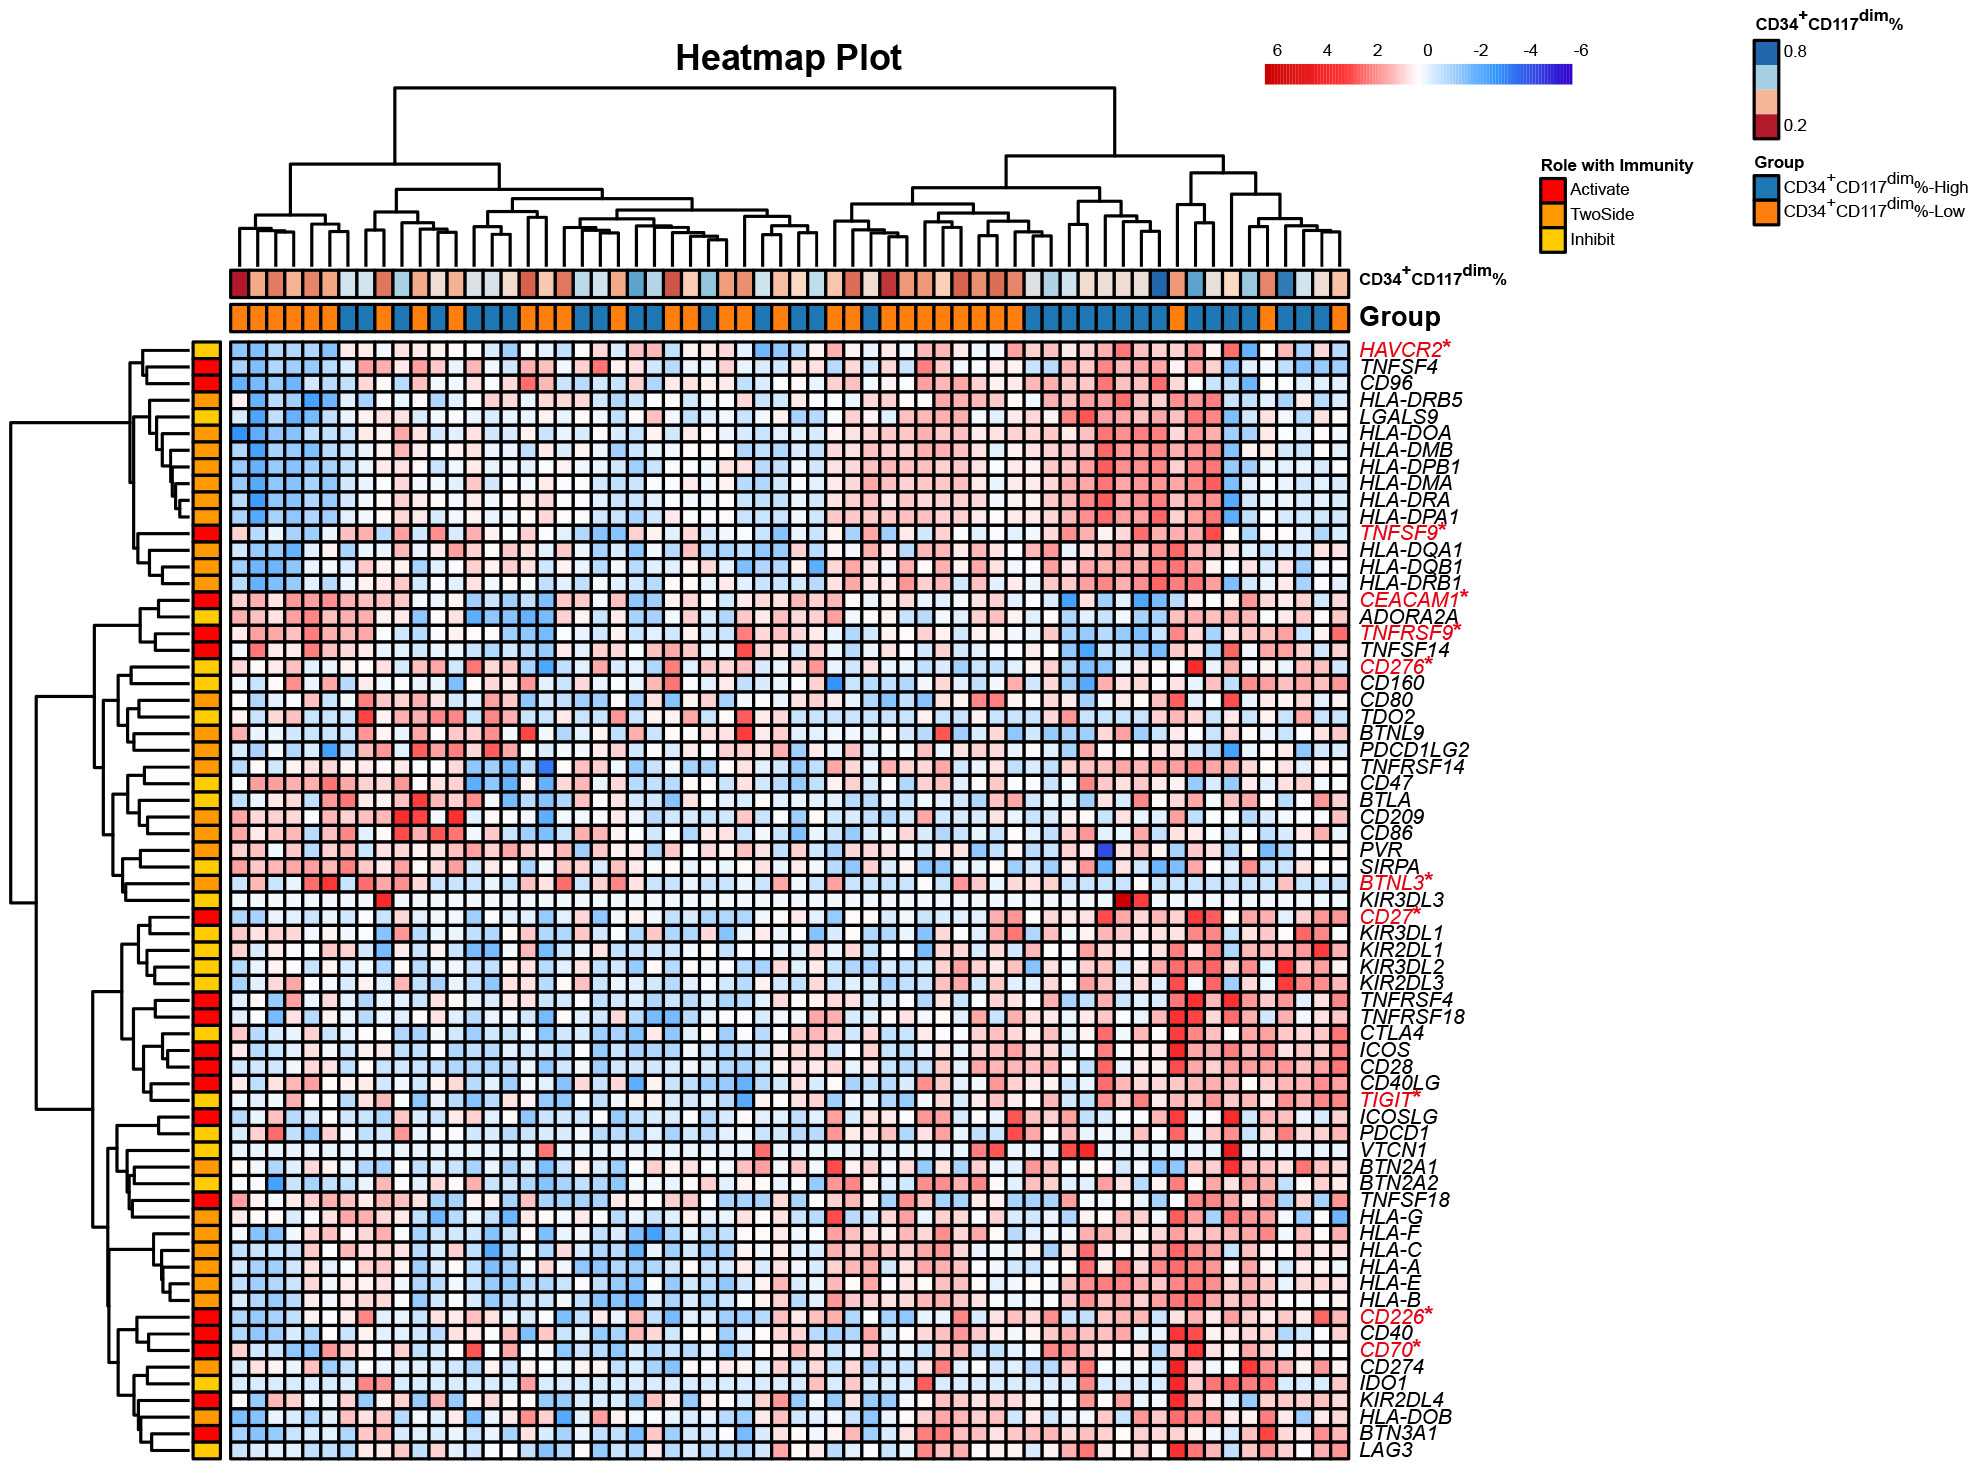
Figure 1 Heatmap of the expression of 79 immune checkpoint genes from bulk RNA-seq of t(8;21) AML patients at diagnosis. Each column represents a sample, and each row represents an immune checkpoint gene. The 79 genes were characterized as having active, inhibitory and two-sided effects on the immune responses. The upper row shows the corresponding percentage of CD34+CD117dim cells in each sample detected via flow cytometry. The lower row shows the corresponding subgroup separated by the median CD34+CD117dim population, namely CD34+CD117dim%-High subgroup and CD34+CD117dim%-Low subgroup. *Denotes the differentially expressed genes between the two subgroups, namely CD34+CD117dim%-High subgroup and CD34+CD117dim%-Low subgroup. Statistical analyses were conducted with a two-sided Wilcoxon rank-sum test. *p < 0.05.
To elucidate the complexity of the classifications and functions of T cells, we reanalyzed our previously generated scRNA-seq datasets of t(8;21) AML patients at different stages of disease progression, including the diagnosis, relapse and post-relapse drug-resistant stages (14). The t(8;21) AML patient received standard “3 + 7” induction chemotherapy to achieve complete remission (CR) followed by 3 courses of cytarabine consolidation. Relapse was observed, and then the patient was treated with IA combined with dasatinib which failed to achieve a CR (drug-resistant disease stage, DRD).
Integrated analysis of T cells at 3 time points revealed 5 subtypes of T cells (Supplementary Figures S4A, B). Cells were annotated utilizing the machine-learning-based software SingleR (28), verifying the identity of T cells (Supplementary Figure S4C). Compared to the rest BMMCs, T cells had a higher expression of T-cell markers, including CD3D, CD3E and CD7, each subtype had a unique gene signature (Supplementary Figures S4D, E).
To identify the subsets of T cells, we compared the expression of each gene between the clusters and the average of the other cells. We also conducted a functional enrichment analysis of the highly expressed genes in each cluster with Gene Ontology. Specifically, LYZ, CLEC11A, MGST1 and IFITM3 were highly expressed in cluster_0 (Figure 2). GO enrichment analysis showed that cluster 0 was enriched in the regulation of cell adhesion and T cell activation (Figure 3A). The genes overexpressed in cluster_1 were LTB, IL7R and CXCR4, which are markers of naïve T cells. Cluster_1 T cells were enriched in the T cell differentiation and lymphocyte differentiation (Figure 3A).
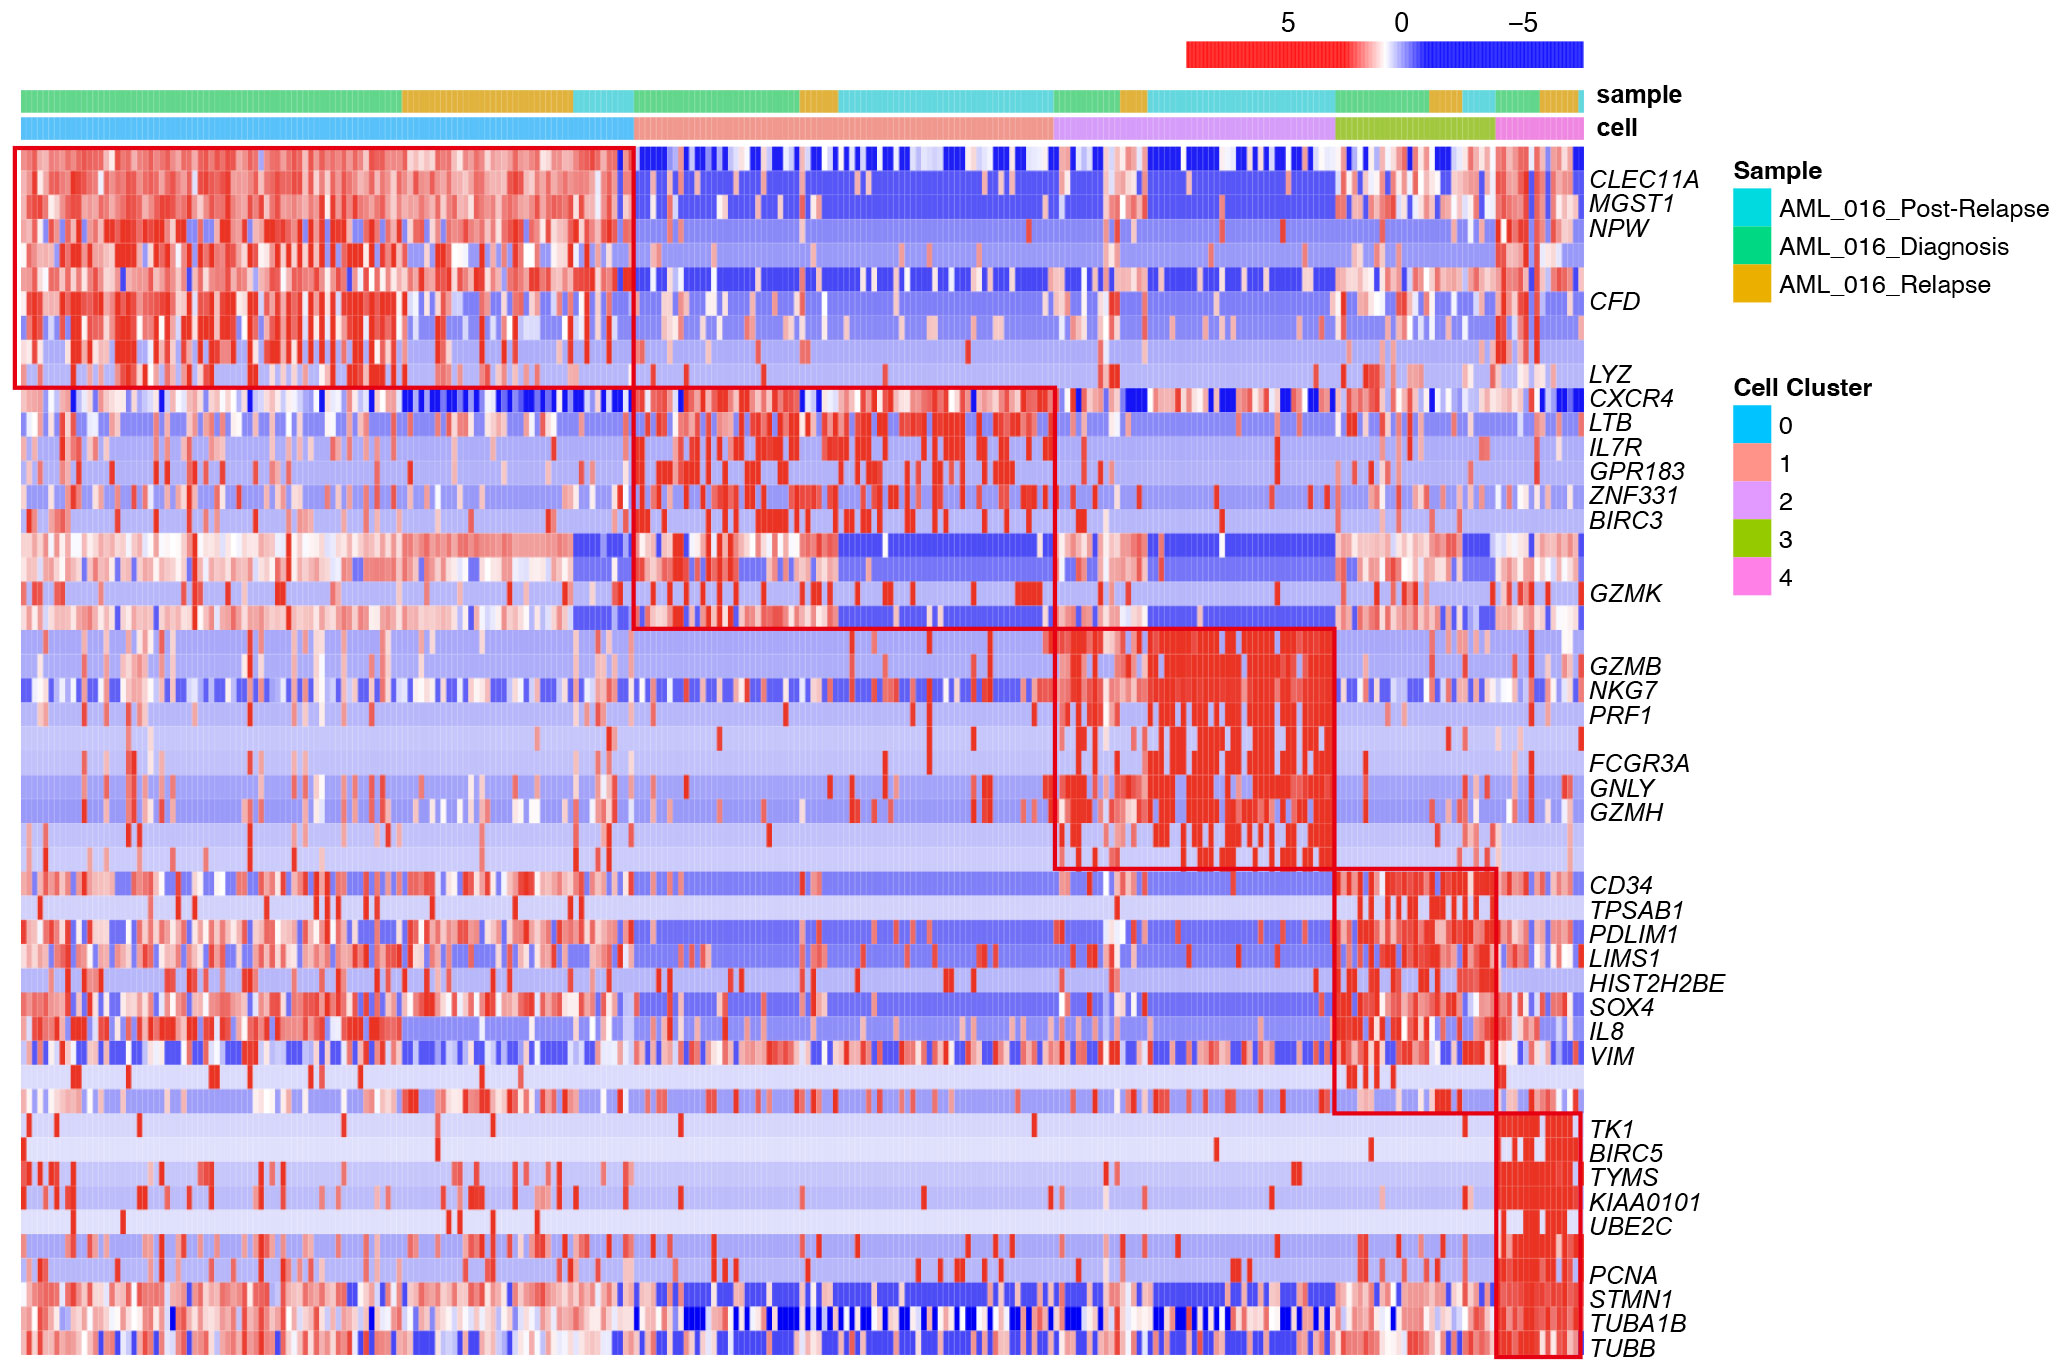
Figure 2 Heatmap of selected top differentially expressed marker genes for each of the 5 T-cell clusters across different stages, including diagnosis, relapse and post-relapse, according to the single-cell RNA-seq data. The upper row shows the corresponding sample from different stages. The lower row shows the cell clusters. Each row represents the relative expression level of genes, and each column represents a cell from the scRNA-seq data.
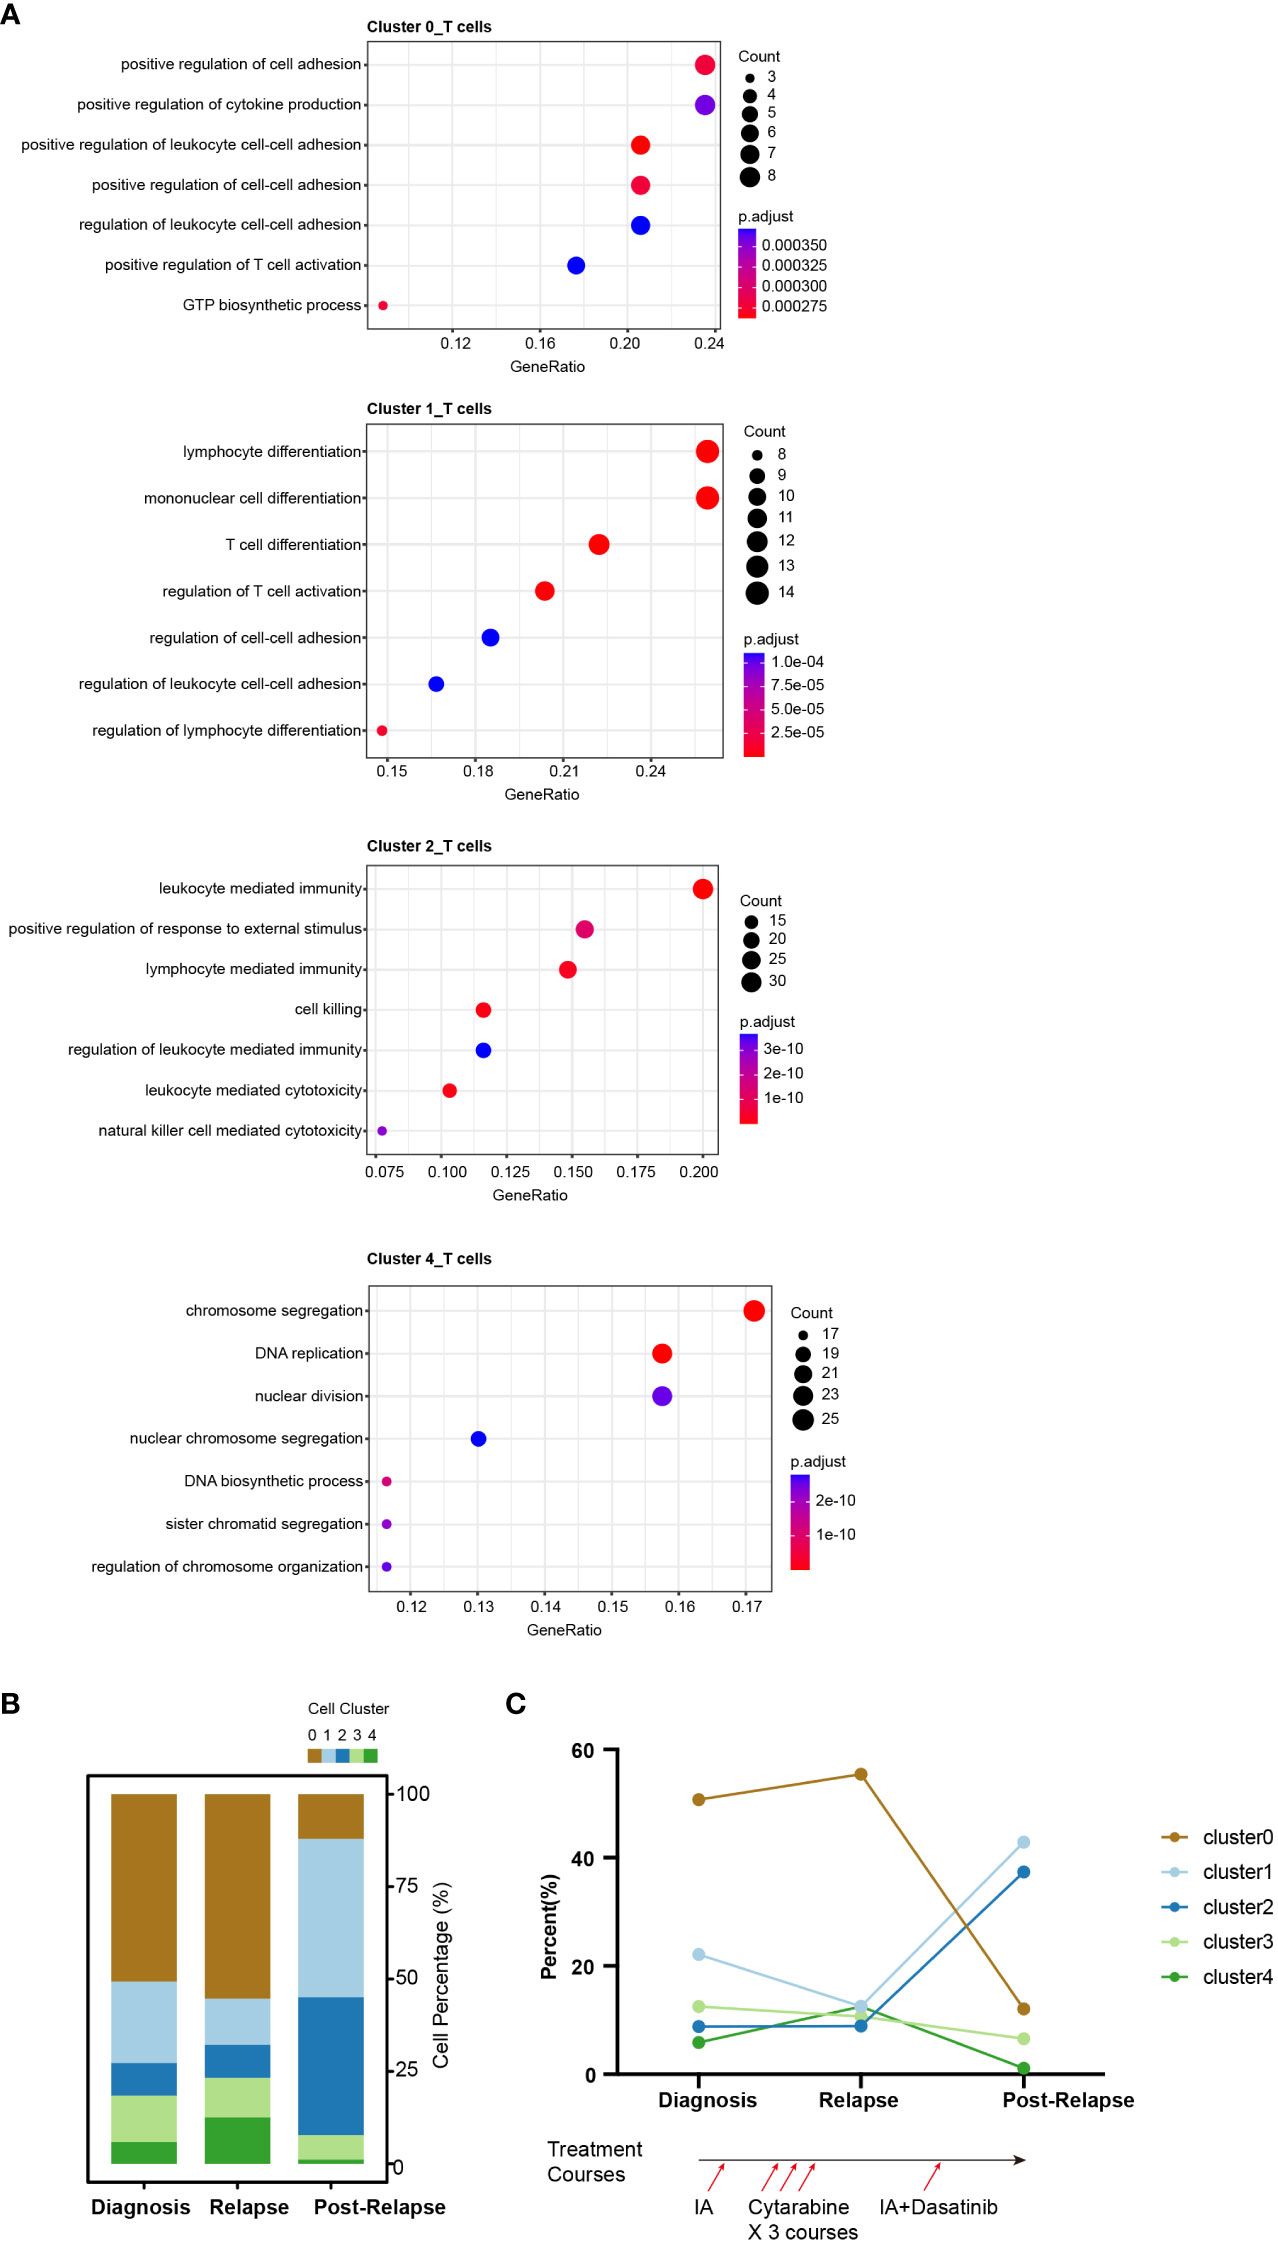
Figure 3 Single-cell RNA-seq atlas of T cells across disease states in the AML-016. (A) Gene Ontology enrichment analysis of the highly expressed genes in T cell clusters across disease stages. Biological process (BP) terms are shown, and the P value was adjusted by Benjamini-Hochberg correction. (B) Bar plot showing the relative proportions of the T-cell clusters across the disease samples. Each color represents a different T cell cluster. (C) Line chart showing the dynamic changes in the proportions of T-cell clusters across the disease samples. The lower panel shows the treatment course of AML-016. Briefly, patient received standard “3 + 7” induction chemotherapy to achieve complete remission (CR) followed by 3 courses of cytarabine consolidation. Relapse was observed, and then the patient was treated with IA combined with dasatinib which failed to achieve a CR.
Cluster_2 highly expressed GZMB, NKG7, PRF1 and GNLY, which are cytokines and effector molecules (Figure 2). Leukocyte-mediated immunity and cell killing were enriched in cluster_2 T cells. Cluster_3 highly expressed CD34, IL8 and SOX4, which are required for T-cell development (Figure 2). Cluster_4 highly expressed KIAA0101, TYMS, TK1 and PCNA, which are involved in the cell cycle, as further demonstrated by its higher G2M and S scores (Supplementary Figure S4F). DNA replication was enriched in cluster_4 T cells (Figure 3A).
We observed dynamic changes in the proportions of T-cell subtypes as the disease progressed and after treatment with multiple chemotherapies (Figures 3B, C). Specifically, cluster_2 T cells made up a low percentage of cells at disease onset and relapse, while in samples from patients who presented resistance to cytarabine treatment, cluster_2 T cells exhibited marked expansion, which may suggest that this T subtype reflected treatment failure and that the number of T cells contributed to drug resistance (Figure 3C).
AML cells interact with the immune microenvironment, including dysfunctional T cells and the accumulation of macrophages, further influencing patient prognosis and clinical outcome (4). We thus hypothesized that in AML patients, dysfunctional T cells existed and impaired survival. To test the potential prognostic value of the cluster_2 T-cells signature in the AML cohort, we constructed a T-cell signature. According to the criteria described in the Methods section, a total of 178 genes were included (Supplementary Table S1).
To identify T-cell-related genes related to the prognosis of AML patients, we used the GSE37642_GPL96 (German AMLCG 1999) dataset as the training dataset. By means of univariate Cox regression, 34 of 178 genes were prognostic factors associated with overall survival (Supplementary Table S2). We further utilized LASSO regression to calculate the weighting coefficient at the optimal parameter λ (Figures 4A, B).
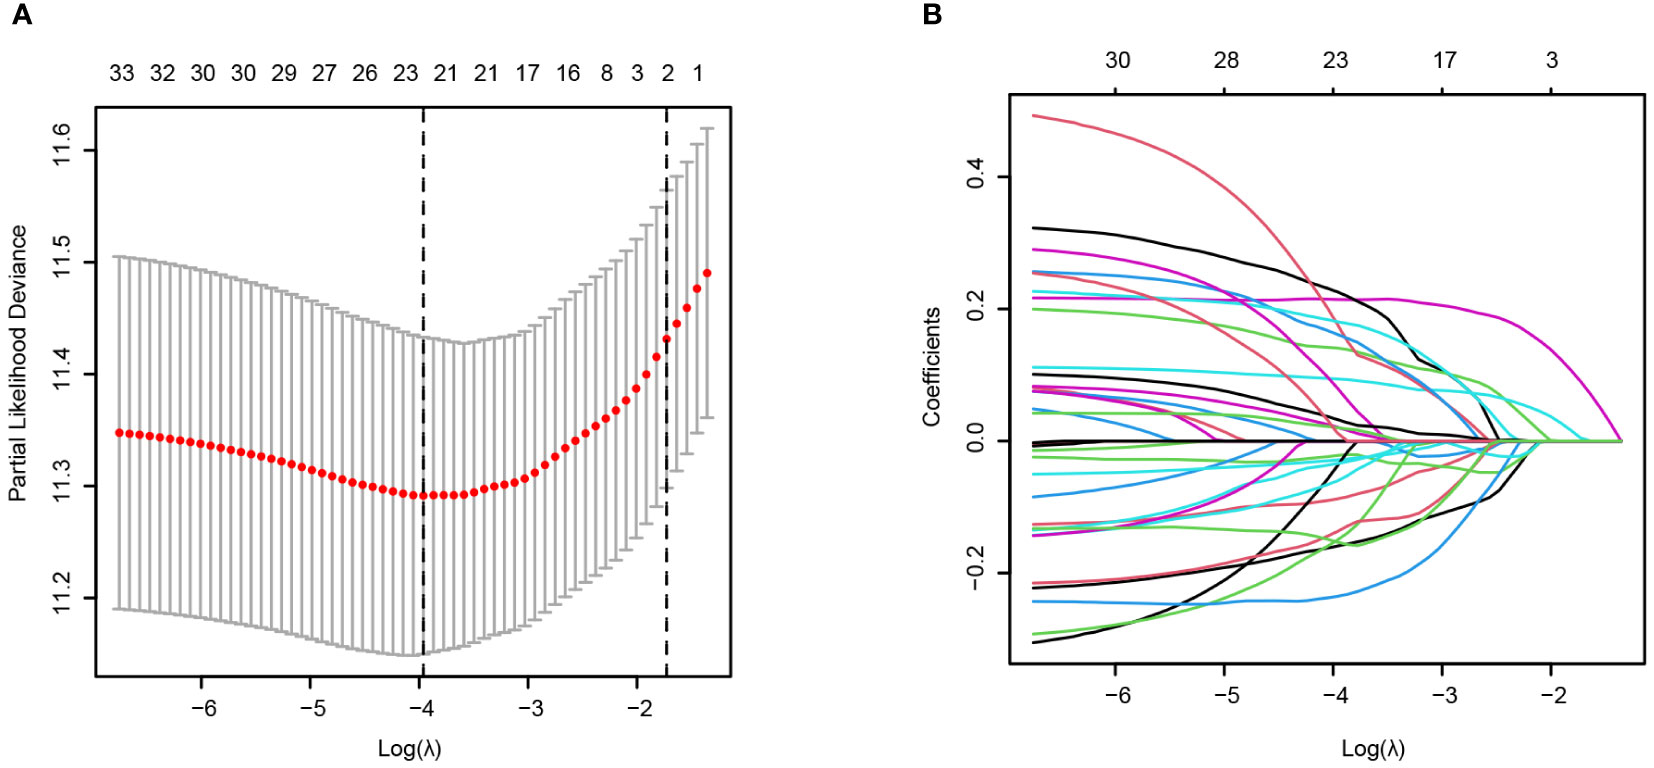
Figure 4 Construction of the T-cell signature from cluster_2 T cells via scRNA-seq based on LASSO regression in the training cohort (AMLCG 1999, GSE37642_GPL96). (A) The cross-validation results for determining the optimum value of log(λ). The dased line showed the value of lamda.min (Left) and lambda.1se (Right). (B) LASSO coefficients of the T-cell cluster model in the training cohort. Different curve denoted different genes.
Using multivariate Cox regression analysis, a final risk model based on these 14 T-cell-related genes [AES, DDIT4, GPR56 (ADGRG1), HOPX, IFITM1, IFITM2, LAIR2, LSP1, MGEA5 (OGA), OPTN, PRKCH, SH3BGRL3, SUN2 and YWHAQ] was constructed, which we named 14TGS (Supplementary Figures S5, S6).
We chose the median 14TGS score as the cutoff value to divide the whole group into a high-14TGS subgroup and a low-14TGS subgroup. In the training cohort, the high-14TGS subgroup had inferior outcomes, with a median OS time of 0.658 years vs. 3.181 years in the low-14TGS subgroup (Figure 5A). The area under the curve (AUC) values of the ROC curves for the prediction of 1-year, 3-year and 5-year OS were 0.726, 0.814 and 0.808, respectively (Figure 5A).
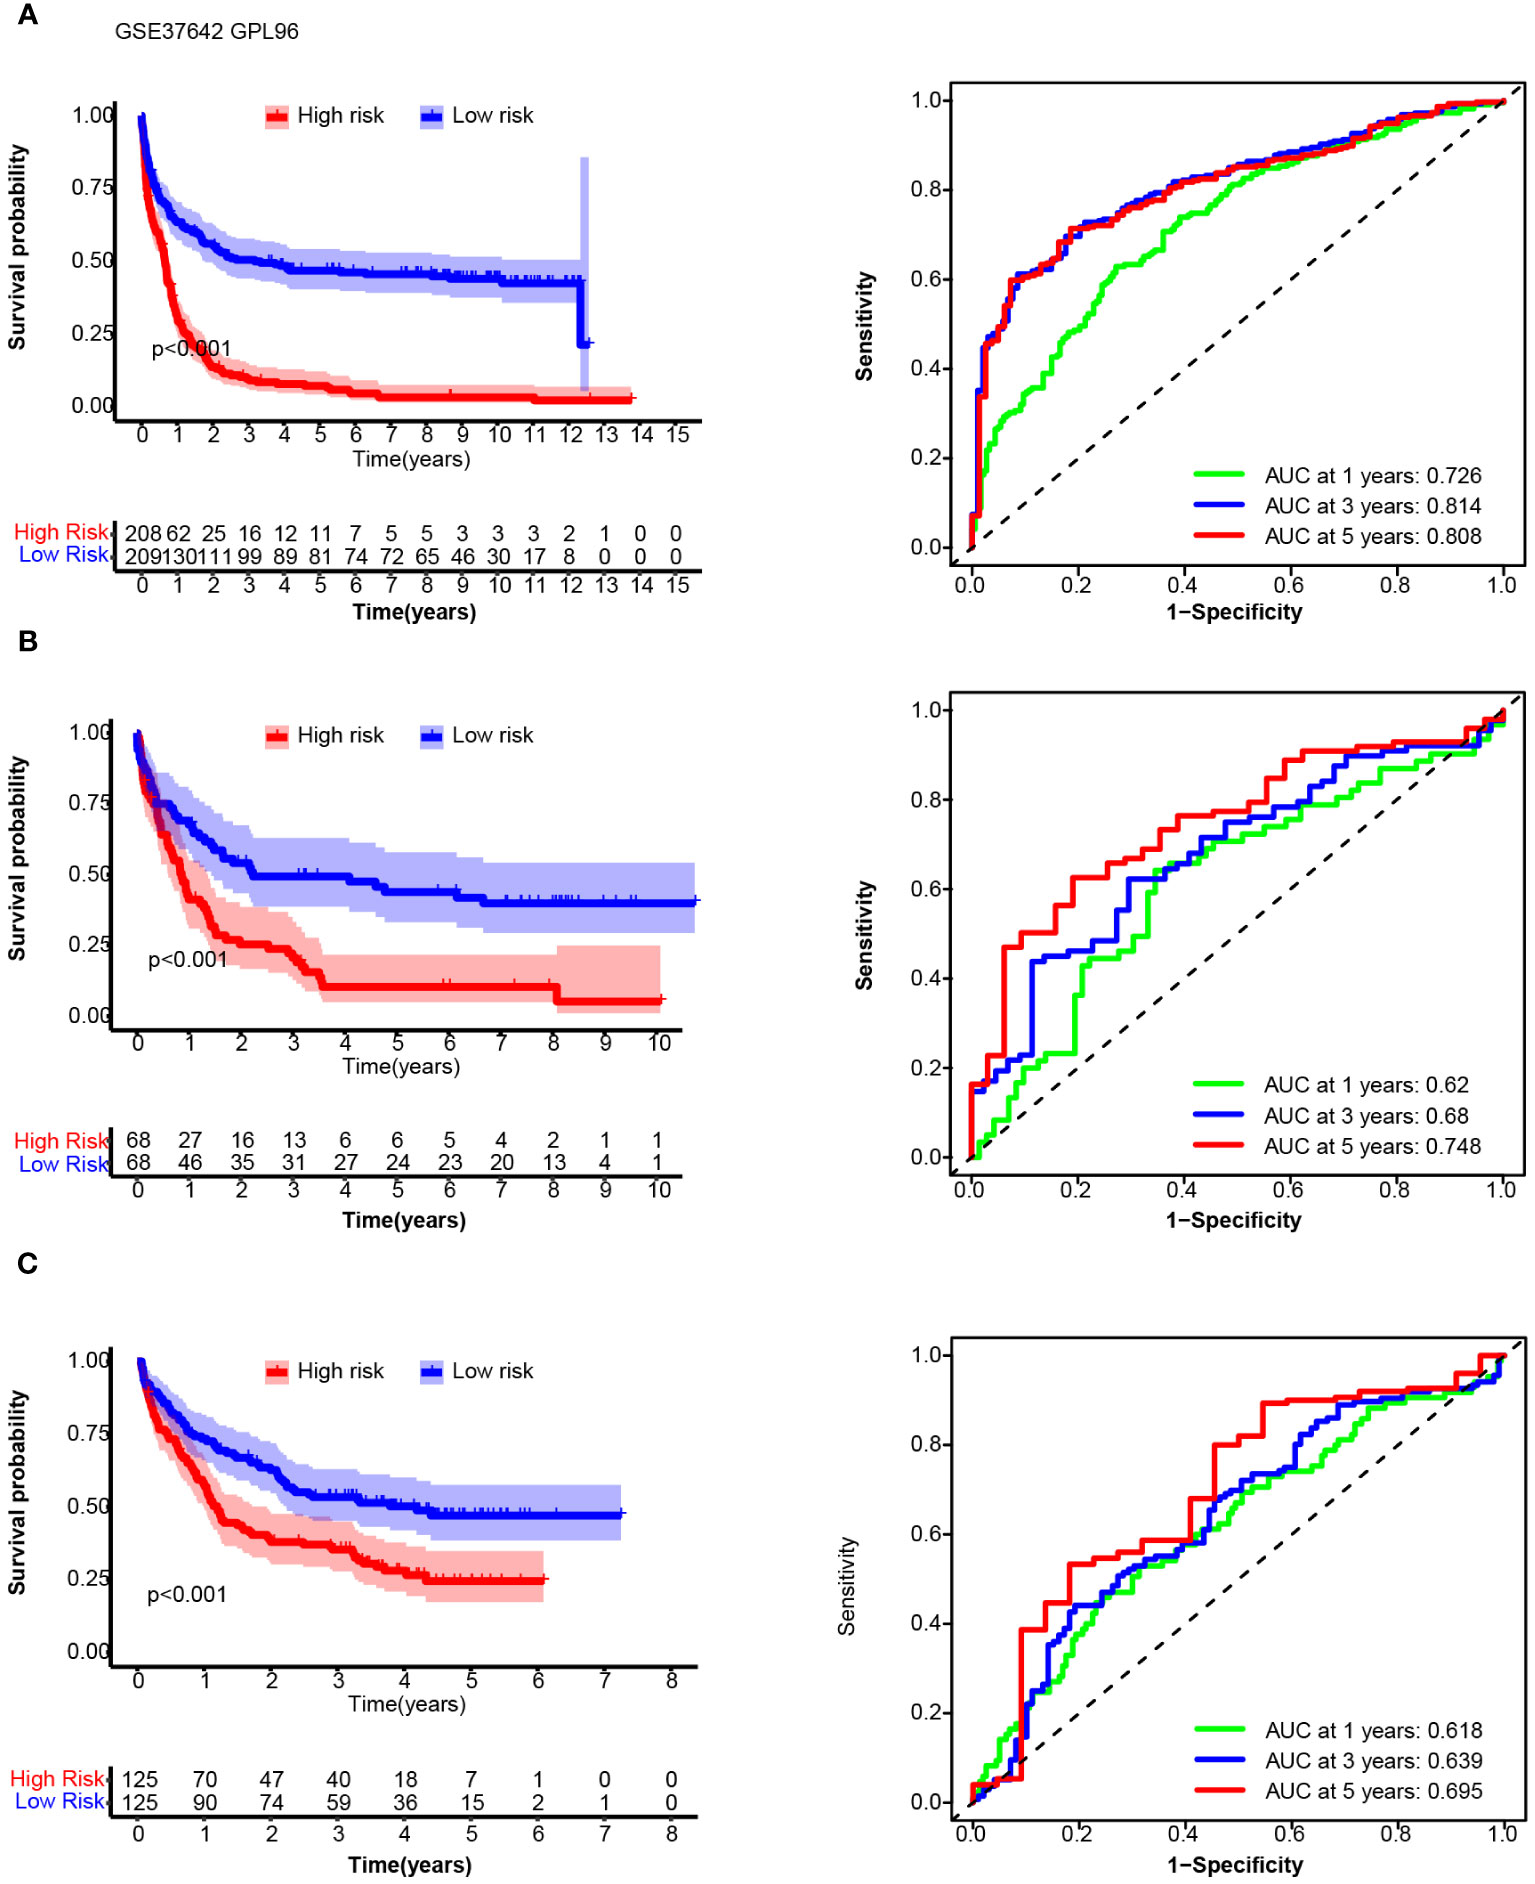
Figure 5 Overall survival (OS) and receiver operating characteristic (ROC) curve analysis of the 14TGS model in the training cohort (AMLCG 1999, GSE37642_GPL96, (A), validation cohort-1 (GSE37642-GPL570, (B) and validation cohort-2 (GSE106291, (C). (Left panel) Kaplan-Meier curves and log-rank tests were used to estimate and compare the survival differences between the high- and low- risk subgroup. (Right panel) Specificity and sensitivity of the 14TGS model was calculated using the timeROC package and aera under (AUC) at 1-year, 3-year, 5-year were shown.
Next, we tested the prognostic efficiency of 14TGS in external cohorts, including expression profiling by array (17–20), data generated with bulk RNA-seq, the TCGA dataset and the Beat AML dataset (21, 22).
In validation cohort_1 (GSE37642_GPL570), the median OS times in the high and low subgroups were 0.866 years and 2.236 years, respectively (log rank test, p < 0.001) (Figure 5B). The AUCs for predicting 1-year, 3-year and 5-year OS were 0.62, 0.68 and 0.748, respectively (Figure 5B). In validation cohort_2 (GSE106291), the median OS times in the high and low subgroups were 1.20 years and 4.19 years (log rank test, p < 0.001), respectively. The AUCs for the prediction of 1-year, 3-year and 5-year OS were 0.618, 0.639 and 0.695, respectively (Figure 5C).
14TGS had good performance in terms of gene expression according to the array platform, and we further tested the prognostic value of the data generated via the bulk RNA-seq platform. In validation cohort_3 (TCGA), the median OS times in the high and low subgroups were 0.838 years and 2.589 years (log rank test, p < 0.001), respectively. The AUCs for the prediction of 1-year, 2-year and 3-year OS were 0.653, 0.718 and 0.683, respectively (Figure 6A). In validation cohort-4 (Beat AML), the median OS times in the high and low subgroups were 1.06 years and 2.38 years (log rank test, p = 0.001), respectively. The AUCs for the prediction of 1-year, 2-year and 3-year OS were 0.678, 0.687 and 0.74, respectively (Figure 6B). In addition, we compared the 14TGS score among the different risk subgroup stratified by European LeukemiaNet (ELN) recommendations (41). As shown in Supplementary Figure S7, the adverse subgroup had the highest 14TGS score than favorable and intermediate subgroup, both for the TCGA AML and Beat AML datasets.
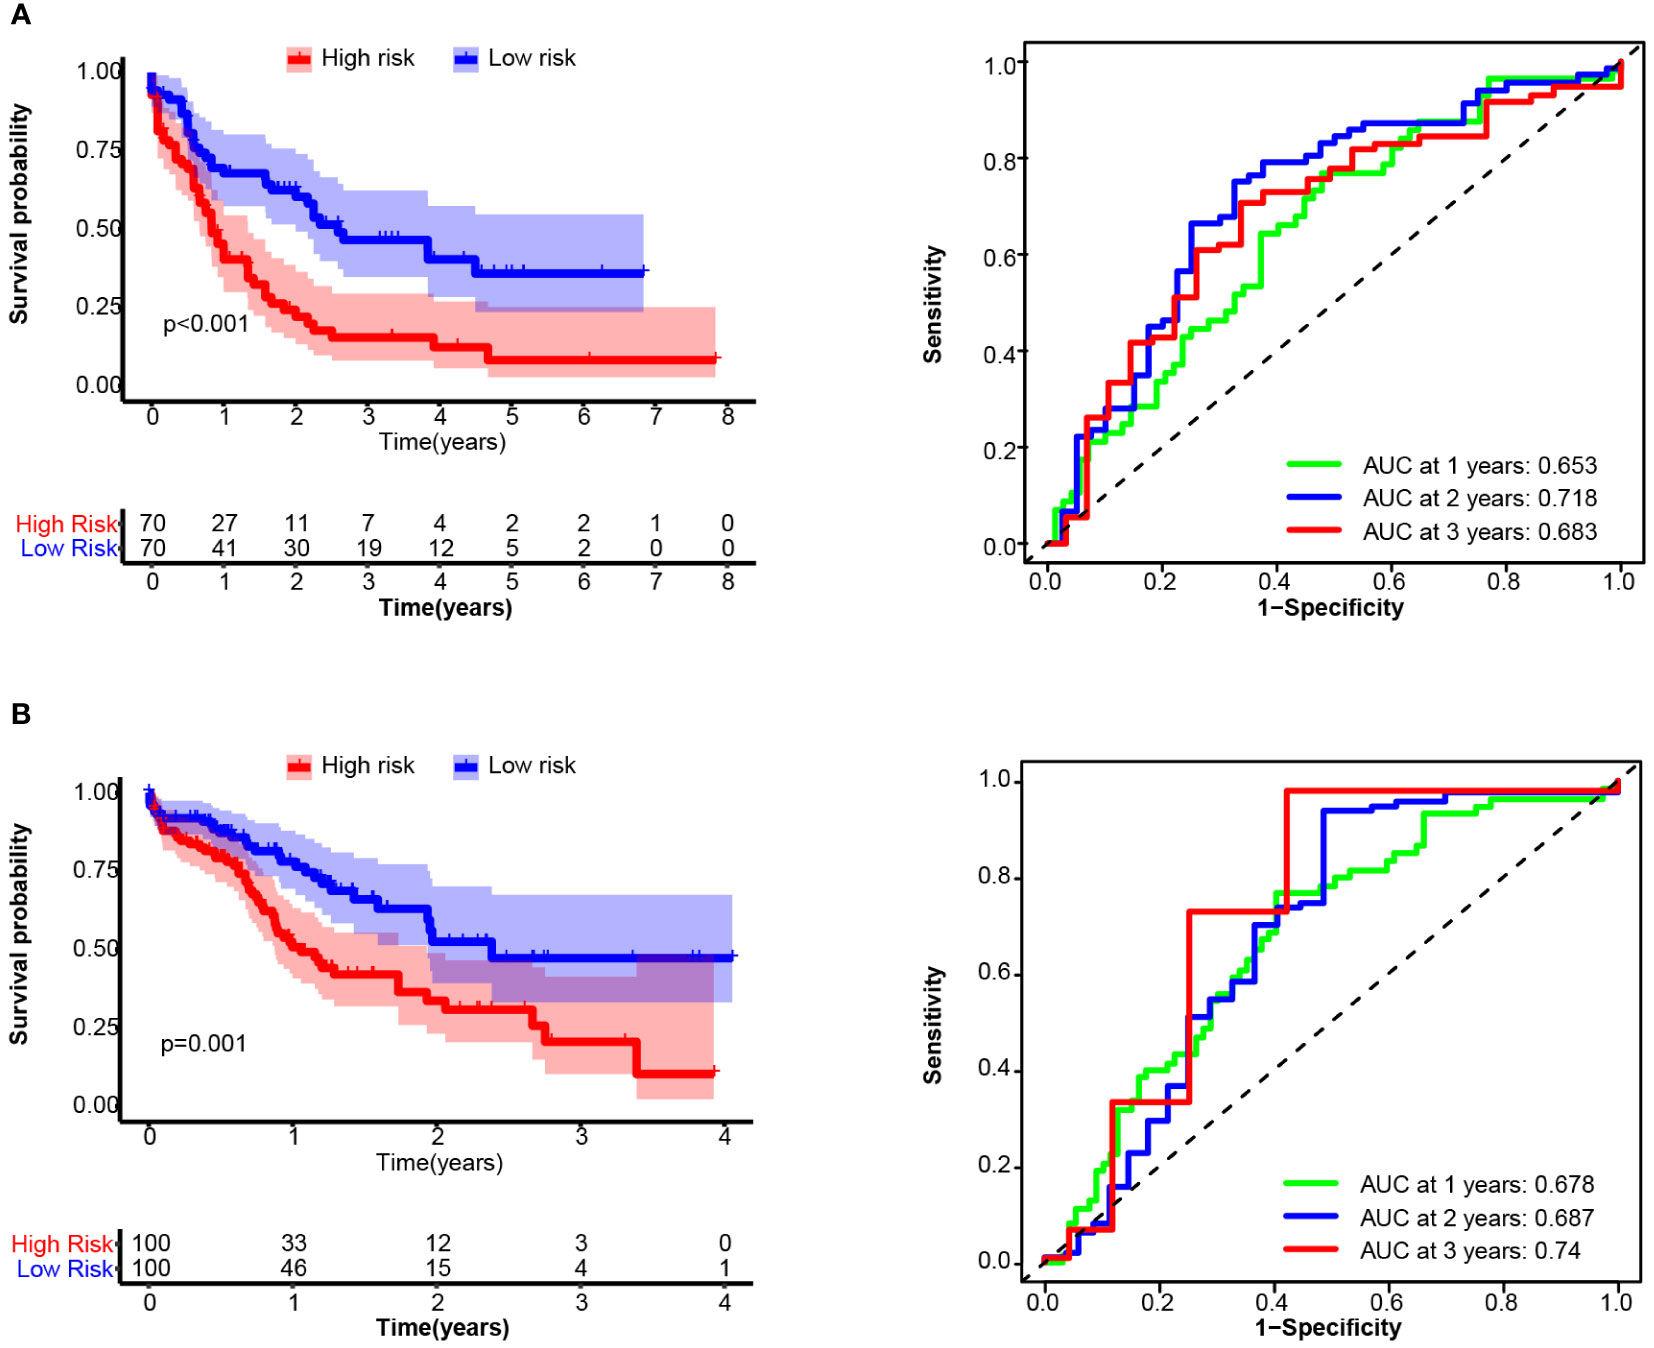
Figure 6 Overall survival (OS) and receiver operating characteristic (ROC) curve analysis of the 14TGS model in TCGA_LAML (A) and validation cohort-4 (Beat AML, B) (Left panel) Kaplan-Meier curves and log-rank tests were used to estimate and compare the survival differences between the high- and low- risk subgroup. (Right panel) Specificity and sensitivity of the 14TGS model was calculated using the timeROC package and aera under (AUC) at 1-year, 2-year, 3-year were shown.
Consistent with the results in the training cohort, patients with high 14TGS scores presented poorer clinical outcomes than those with low 14TGS scores. All the AUC values supported the prognostic value of the 14TGS model.
Our previous multiomics studies identified a unique cell subset, namely CD34+CD117dim cells (Blast population 1, BP1) that promoted disease progression in t(8;21) AML. In this work, we characterized the special immune microenvironment of high risk t(8;21) AML patients (CD34+CD117dim%-High subgroup) and evaluated longitudinal dynamic changes in the expression profiles of immune cells. Our research further characterized the complex microenvironment of AML, including malignant blast populations and complex T-cell subsets leading to clinical relapse and an unresponsive state to chemotherapy. In addition, we constructed the 14TGS model to stratify AML patients by their predicted survival outcomes.
The mechanism by which dysfunctional T cells impact the chemotherapy response is rather complex (42). First, AML induces a largely immunosuppressive bone marrow microenvironment, as indicated by reduced levels of cytotoxic T cells and NK cells, and this immunosuppressive state facilitates the immune escape of leukemic stem cells (LSCs), leading to chemotherapy resistance (4). Other reports have shown that the increase in senescent-like T cells in AML is associated with a weaker reponse to induction chemotherapy (43).
T-cell exhaustion, characterized by the expression of inhibitor proteins, including PD-1 and TIM3, is a phenotypically and mechanistically distinct state of T cells (44). The presence of exhausted T cells is usually related to poor outcomes in patients with a variety of cancers (45). Several studies have described the heterogeneity and functions of T cells in AML. Van Galen et al. reported a reduction in the proportion of CTLs in AML patients compared to that in healthy controls (46), and Schnorfeil et al. reported an increase in PD-1 expression on T cells in the bone marrow at relapse posttransplantation (47). Additionally, the efficacy of immunotherapies, such as immune checkpoint inhibitors, is largely dependent on the levels of “precursor exhausted” CD8+ T cells, which have been suggested to exist according to studies of multiple tumor models (48–50).
In this study, we identifed 5 clusters of T cells. There was a high proportion of cluster_0 T cells (which highly expressed LYZ, CLEC11A, MGST1 and IFITM3) at diagnosis and relapse, but this proportion declined sharply in the drug-resistant disease stages. Research has shown that LYZ (lysozyme) and IFITM3 are important for antioxidant and anti-inflammatory effects (51, 52). This was in accordance with the phenomenon that the reduction of this cluster was drug resistant. Cluster_4 T cells (highly expressing KIAA0101, TYMS, TK1 and PCNA), reflecting the state of cell proliferation rate, were reduced to an extremely low level. This finding was also consistent with the findings in another research analyzing the immune environment of melanoma (53), showing that the number of cycle-stage T cells decreased compared to that in the pre-treatment stage.
Cluster_1 T cells (which highly express LTB, IL7R and CXCR4) showed a unique dynamic pattern; compared with those at diagnosis, these cells decreased in number during relapse but increased in number during drug-resistant disease stages. Considering that these genes are involved in chemokine responses (54), this indicated a higly unstable inflammatory state.
Cluster_2 T cells, which highly expressed GZMB, NKG7, PRF1 and GNLY, expanded rapidly and greatly following disease progression. Given that the expansion of cluster_2 T cells had no clinical response to reinduction therapy at the post-relapse stage. Cluster_2 T cells should not be characterized as cytotoxic T cells. Further in vitro experiments, which directly analyze the interaction between cluster_2 T cells and blasts, are still needed to clarify their role in disease progression.
The gene signature we constructed included 14 genes, namely, AES (TLE5), DDIT4, GPR56 (ADGRG1), HOPX, IFITM1, IFITM2, LAIR2, LSP1, MGEA5 (OGA), OPTN, PRKCH, SH3BGRL3, SUN2 and YWHAQ. Most of these genes, including those encode IFITM proteins and leukocyte-associated immunoglobulin-like receptors, function in immune-related processes. The prognostic efficiency of 14TGS was further validated in other AML cohorts, and 14TGS demonstrated robust predictive value. Interestingly, one recent study published in Blood reported a distinct single-cell T-cell signature associated with stem cell transplantation outcome in AML patients; one of the included genes was GPR56, a biomarker of alloreactive CD8+ T cells (55). This further suggested that cluster_2 T cells are a novel subset that has different phenotypes and mechanisms of action.
In conclusion, through a multi-omics study of longitudinal t(8;21) AML, we revealed the heterogeneity of immune cells in the microenvironment and described the gene signatures and dynamic evolution of T-cell subsets. Further exploration of the gene signature of cluster_2 T cells revealed that this signature was a valuable prognostic indicator of survival in AML cohorts; the genes in this signature may represent clinical targets that could be investigated in more depth. Our research provides a novel system for classifying patients based on their immune microenvironment.
The original contributions presented in the study are included in the article/Supplementary Material. Further inquiries can be directed to the corresponding authors.
Ethical approval was not required for the study involving humans in accordance with the local legislation and institutional requirements. Written informed consent to participate in this study was not required from the participants or the participants’ legal guardians/next of kin in accordance with the national legislation and the institutional requirements.
X-PL: Conceptualization, Data curation, Funding acquisition, Investigation, Writing – original draft, Writing – review & editing. J-TS: Data curation, Methodology, Writing – original draft. Y-TD: Data curation, Methodology, Resources, Software, Writing – original draft. W-NZ: Methodology, Resources, Writing – review & editing. B-TZ: Methodology, Resources, Writing – review & editing. J-YM: Methodology, Writing – review & editing. YG: Investigation, Writing – original draft, Writing – review & editing. LJ: Writing – original draft, Writing – review & editing. YL: Writing – original draft, Writing – review & editing.
The author(s) declare financial support was received for the research, authorship, and/or publication of this article. This research was supported by Guangdong Basic and Applied Basic Research Foundation (2022A1515012227), and National Natural Science Foundation of China (82300184).
The authors declare that the research was conducted in the absence of any commercial or financial relationships that could be construed as a potential conflict of interest.
All claims expressed in this article are solely those of the authors and do not necessarily represent those of their affiliated organizations, or those of the publisher, the editors and the reviewers. Any product that may be evaluated in this article, or claim that may be made by its manufacturer, is not guaranteed or endorsed by the publisher.
The Supplementary Material for this article can be found online at: https://www.frontiersin.org/articles/10.3389/fimmu.2024.1424933/full#supplementary-material
Supplementary Table 1 | Overexpressed genes in the cluster_2 T cells based on the single-cell RNA-seq data of AML-016. Genes were defined as those with an average log2(fold change) greater than 1.0 and a p value less than 0.05 in the scRNA-seq data. A total of 178 genes were ultimately screened out.
Supplementary Table 2 | Univariate Cox analysis of the cluster_2 T genes to assess genes significantly correlated with overall survival in the training cohort (AMLCG 1999, GSE37642_GPL96). HR, hazard ratio.
Supplementary Table 3 | LASSO Cox multivariate regression analysis to construct the risk model in the training cohort (AMLCG 1999, GSE37642_GPL96). 14 genes with high coefficients were selected and constitude the 14 T-cell-related genes (named the 14TGS). HR, hazard ratio. Coef, Coefficient.
Supplementary Figure 1 | Overview of the study design.
Supplementary Figure 2 | Infiltrating immune cells in the BM microenvironment of t(8;21) AML patients. Bar plot showing the comparison of inferred infiltrated immune cells between the two subgroups, namely CD34+CD117dim%-High subgroup and CD34+CD117dim%-Low subgroup, through quanTIseq (A), EPIC (B) and CIBERSORT (C). Statistical analysis was compared with a two-sided Wilcoxon rank-sum test.
Supplementary Figure 3 | Differences in the expression of immune checkpoint genes between the two subgroups, namely CD34+CD117dim%-High subgroup and CD34+CD117dim%-Low subgroup. Statistical analysis was compared with a two-sided Wilcoxon rank-sum test.
Supplementary Figure 4 | Single-cell RNA-seq atlas of T cells across disease states in the AML-016 cohort. (A, B). Uniform manifold approximation and projection (UMAP) plot of T cells analyzed via scRNA-seq and integrated across all samples after removal batch effects. (A) T-cell clusters annotated with different colors. (B) Sample information annotated with different colors. (C) UMAP plot showing annotation results according to the the machine-learning-based software SingleR. (D) Violin plot showing the expression of T-cell markers, including CD3D, CD3E, CD7, between T cells and the rest of BMMCs in AML-016. (E) UMAP plot showing the expression of T-cell markers, including CD3D, CD3E, CD7 and RORA. (F) Violin plot showing the scores of cell cycle-related genes, namely G2M and S scores. (G) CellPhoneDB analysis showed the potential communication of cluster_2 T cells with AML blasts.
Supplementary Figure 5 | Forest plot showing the multivariate analyses in the training cohort (AMLCG 1999, GSE37642_GPL96). HR, hazard ratio. CI, confidence interval.
Supplementary Figure 6 | Kaplan-Meier curves showed the survival difference stratified by T-cell-related genes in the training cohort (AMLCG 1999, GSE37642_GPL96). Log-rank tests were used to compare the survival differences.
Supplementary Figure 7 | Comparsion of 14TGS score among different risk subgroup according to the ELN risk stratification. Wilcoxon test was performed to calculate the statistical differences. *p < 0.05; **p < 0.01; ***p < 0.001.
1. Sharpe AH, Pauken KE. The diverse functions of the PD1 inhibitory pathway. Nat Rev Immunol. (2018) 18:153–67. doi: 10.1038/nri.2017.108
2. Sanmamed MF, Chen L. A paradigm shift in cancer immunotherapy: from enhancement to normalization. Cell. (2018) 175:313–26. doi: 10.1016/j.cell.2018.09.035
3. Lane SW, Gilliland DG. Leukemia stem cells. Semin Cancer Biol. (2010) 20:71–6. doi: 10.1016/j.semcancer.2009.12.001
4. Khaldoyanidi S, Nagorsen D, Stein A, Ossenkoppele G, Subklewe M. Immune biology of acute myeloid leukemia: implications for immunotherapy. J Clin Oncol. (2021) 39:419–32. doi: 10.1200/JCO.20.00475
5. Teague RM, Kline J. Immune evasion in acute myeloid leukemia: current concepts and future directions. J Immunother Cancer. (2013) 1:1. doi: 10.1186/2051-1426-1-13
6. Noviello M, Manfredi F, Ruggiero E, Perini T, Oliveira G, Cortesi F, et al. Bone marrow central memory and memory stem T-cell exhaustion in AML patients relapsing after HSCT. Nat Commun. (2019) 10:1065. doi: 10.1038/s41467-019-08871-1
7. Sauerer T, Velazquez GF, Schmid C. Relapse of acute myeloid leukemia after allogeneic stem cell transplantation: immune escape mechanisms and current implications for therapy. Mol Cancer. (2023) 22:180. doi: 10.1186/s12943-023-01889-6
8. Zheng L, Qin S, Si W, Wang A, Xing B, Gao R, et al. Pan-cancer single-cell landscape of tumor-infiltrating T cells. Science. (2021) 374:abe6474. doi: 10.1126/science.abe6474
9. Abbas HA, Hao D, Tomczak K, Barrodia P, Im JS, Reville PK, et al. Single cell T cell landscape and T cell receptor repertoire profiling of AML in context of PD-1 blockade therapy. Nat Commun. (2021) 12:6071. doi: 10.1038/s41467-021-26282-z
10. Zhai Y, Singh P, Dolnik A, Brazda P, Atlasy N, Del Gaudio N, et al. Longitudinal single-cell transcriptomics reveals distinct patterns of recurrence in acute myeloid leukemia. Mol Cancer. (2022) 21:166. doi: 10.1186/s12943-022-01635-4
11. Al-Harbi S, Aljurf M, Mohty M, Almohareb F, Ahmed SOA. An update on the molecular pathogenesis and potential therapeutic targeting of AML with t(8;21)(q22;q22.1);RUNX1-RUNX1T1. Blood Adv. (2020) 4:229–38. doi: 10.1182/bloodadvances.2019000168
12. Jourdan E, Boissel N, Chevret S, Delabesse E, Renneville A, Cornillet P, et al. Prospective evaluation of gene mutations and minimal residual disease in patients with core binding factor acute myeloid leukemia. Blood. (2013) 121:2213–23. doi: 10.1182/blood-2012-10-462879
13. Neldeborg S, Soerensen JF, Moller CT, Bill M, Gao Z, Bak RO, et al. Dual intron-targeted CRISPR-Cas9-mediated disruption of the AML RUNX1-RUNX1T1 fusion gene effectively inhibits proliferation and decreases tumor volume. Vitro vivo. Leukemia. (2023) 37:1792–801. doi: 10.1038/s41375-023-01950-9
14. Jiang L, Li XP, Dai YT, Chen B, Weng XQ, Xiong SM, et al. Multidimensional study of the heterogeneity of leukemia cells in t(8;21) acute myelogenous leukemia identifies the subtype with poor outcome. Proc Natl Acad Sci USA. (2020) 117:20117–26. doi: 10.1073/pnas.2003900117
15. Li X, Dai Y, Chen B, Huang J, Chen S, Jiang L. Clinical significance of CD34(+)CD117(dim)/CD34(+)CD117(bri) myeloblast-associated gene expression in t(8;21) acute myeloid leukemia. Front Med. (2021) 15:608–20. doi: 10.1007/s11684-021-0836-7
16. Li XP, Zhang WN, Mao JY, Zhao BT, Jiang L, Gao Y. Integration of CD34(+)CD117(dim) population signature improves the prognosis prediction of acute myeloid leukemia. J Transl Med. (2022) 20:359. doi: 10.1186/s12967-022-03556-8
17. Herold T, Jurinovic V, Batcha AMN, Bamopoulos SA, Rothenberg-Thurley M, Ksienzyk B, et al. A 29-gene and cytogenetic score for the prediction of resistance to induction treatment in acute myeloid leukemia. Haematologica. (2018) 103:456–65. doi: 10.3324/haematol.2017.178442
18. Herold T, Metzeler KH, Vosberg S, Hartmann L, Rollig C, Stolzel F, et al. Isolated trisomy 13 defines a homogeneous AML subgroup with high frequency of mutations in spliceosome genes and poor prognosis. Blood. (2014) 124:1304–11. doi: 10.1182/blood-2013-12-540716
19. Li Z, Herold T, He C, Valk PJ, Chen P, Jurinovic V, et al. Identification of a 24-gene prognostic signature that improves the European LeukemiaNet risk classification of acute myeloid leukemia: an international collaborative study. J Clin Oncol. (2013) 31:1172–81. doi: 10.1200/JCO.2012.44.3184
20. Kuett A, Rieger C, Perathoner D, Herold T, Wagner M, Sironi S, et al. IL-8 as mediator in the microenvironment-leukaemia network in acute myeloid leukaemia. Sci Rep. (2015) 5:18411. doi: 10.1038/srep18411
21. Tyner JW, Tognon CE, Bottomly D, Wilmot B, Kurtz SE, Savage SL, et al. Functional genomic landscape of acute myeloid leukaemia. Nature. (2018) 562:526–31. doi: 10.1038/s41586-018-0623-z
22. Cancer Genome Atlas Research N, Ley TJ, Miller C, Ding L, Raphael BJ, Mungall AJ, et al. Genomic and epigenomic landscapes of adult de novo acute myeloid leukemia. N Engl J Med. (2013) 368:2059–74. doi: 10.1056/NEJMoa1301689
23. Butler A, Hoffman P, Smibert P, Papalexi E, Satija R. Integrating single-cell transcriptomic data across different conditions, technologies, and species. Nat Biotechnol. (2018) 36:411–20. doi: 10.1038/nbt.4096
24. Leek JT, Johnson WE, Parker HS, Jaffe AE, Storey JD. The sva package for removing batch effects and other unwanted variation in high-throughput experiments. Bioinformatics. (2012) 28:882–3. doi: 10.1093/bioinformatics/bts034
25. Buttner M, Miao Z, Wolf FA, Teichmann SA, Theis FJ. A test metric for assessing single-cell RNA-seq batch correction. Nat Methods. (2019) 16:43–9. doi: 10.1038/s41592-018-0254-1
26. Becht E, McInnes L, Healy J, Dutertre CA, Kwok IWH, Ng LG, et al. Dimensionality reduction for visualizing single-cell data using UMAP. Nat Biotechnol. (2018). doi: 10.1038/nbt.4314
27. Tirosh I, Izar B, Prakadan SM, Wadsworth MH 2nd, Treacy D, Trombetta JJ, et al. Dissecting the multicellular ecosystem of metastatic melanoma by single-cell RNA-seq. Science. (2016) 352:189–96. doi: 10.1126/science.aad0501
28. Aran D, Looney AP, Liu L, Wu E, Fong V, Hsu A, et al. Reference-based analysis of lung single-cell sequencing reveals a transitional profibrotic macrophage. Nat Immunol. (2019) 20:163–72. doi: 10.1038/s41590-018-0276-y
29. Li H, Handsaker B, Wysoker A, Fennell T, Ruan J, Homer N, et al. The sequence alignment/map format and SAMtools. Bioinformatics. (2009) 25:2078–9. doi: 10.1093/bioinformatics/btp352
30. Love MI, Huber W, Anders S. Moderated estimation of fold change and dispersion for RNA-seq data with DESeq2. Genome Biol. (2014) 15:550. doi: 10.1186/s13059-014-0550-8
31. Ritchie ME, Phipson B, Wu D, Hu Y, Law CW, Shi W, et al. limma powers differential expression analyses for RNA-sequencing and microarray studies. Nucleic Acids Res. (2015) 43:e47. doi: 10.1093/nar/gkv007
32. Efremova M, Vento-Tormo M, Teichmann SA, Vento-Tormo R. CellPhoneDB: inferring cell-cell communication from combined expression of multi-subunit ligand-receptor complexes. Nat Protoc. (2020) 15:1484–506. doi: 10.1038/s41596-020-0292-x
33. Finotello F, Mayer C, Plattner C, Laschober G, Rieder D, Hackl H, et al. Molecular and pharmacological modulators of the tumor immune contexture revealed by deconvolution of RNA-seq data. Genome Med. (2019) 11:34. doi: 10.1186/s13073-019-0638-6
34. Newman AM, Liu CL, Green MR, Gentles AJ, Feng W, Xu Y, et al. Robust enumeration of cell subsets from tissue expression profiles. Nat Methods. (2015) 12:453–7. doi: 10.1038/nmeth.3337
35. Racle J, de Jonge K, Baumgaertner P, Speiser DE, Gfeller D. Simultaneous enumeration of cancer and immune cell types from bulk tumor gene expression data. Elife. (2017) 6. doi: 10.7554/eLife.26476
36. Kanehisa M, Goto S. KEGG: kyoto encyclopedia of genes and genomes. Nucleic Acids Res. (2000) 28:27–30. doi: 10.1093/nar/28.1.27
37. Wilkerson MD, Hayes DN. ConsensusClusterPlus: a class discovery tool with confidence assessments and item tracking. Bioinformatics. (2010) 26:1572–3. doi: 10.1093/bioinformatics/btq170
38. Kamarudin AN, Cox T, Kolamunnage-Dona R. Time-dependent ROC curve analysis in medical research: current methods and applications. BMC Med Res Methodol. (2017) 17:53. doi: 10.1186/s12874-017-0332-6
39. Pardoll DM. The blockade of immune checkpoints in cancer immunotherapy. Nat Rev Cancer. (2012) 12:252–64. doi: 10.1038/nrc3239
40. Hu FF, Liu CJ, Liu LL, Zhang Q, Guo AY. Expression profile of immune checkpoint genes and their roles in predicting immunotherapy response. Brief Bioinform. (2021) 22. doi: 10.1093/bib/bbaa176
41. Dohner H, Estey E, Grimwade D, Amadori S, Appelbaum FR, Buchner T, et al. Diagnosis and management of AML in adults: 2017 ELN recommendations from an international expert panel. Blood. (2017) 129:424–47. doi: 10.1182/blood-2016-08-733196
42. Rutella S, Vadakekolathu J, Mazziotta F, Reeder S, Yau TO, Mukhopadhyay R, et al. Immune dysfunction signatures predict outcomes and define checkpoint blockade-unresponsive microenvironments in acute myeloid leukemia. J Clin Invest. (2022) 132. doi: 10.1172/JCI159579
43. Knaus HA, Berglund S, Hackl H, Blackford AL, Zeidner JF, Montiel-Esparza R, et al. Signatures of CD8+ T cell dysfunction in AML patients and their reversibility with response to chemotherapy. JCI Insight. (2018) 3. doi: 10.1172/jci.insight.120974
44. Wherry EJ, Kurachi M. Molecular and cellular insights into T cell exhaustion. Nat Rev Immunol. (2015) 15:486–99. doi: 10.1038/nri3862
45. Chow A, Perica K, Klebanoff CA, Wolchok JD. Clinical implications of T cell exhaustion for cancer immunotherapy. Nat Rev Clin Oncol. (2022) 19:775–90. doi: 10.1038/s41571-022-00689-z
46. van Galen P, Hovestadt V, Wadsworth Ii MH, Hughes TK, Griffin GK, Battaglia S, et al. Single-cell RNA-seq reveals AML hierarchies relevant to disease progression and immunity. Cell. (2019) 176:1265–1281 e1224. doi: 10.1016/j.cell.2019.01.031
47. Schnorfeil FM, Lichtenegger FS, Emmerig K, Schlueter M, Neitz JS, Draenert R, et al. T cells are functionally not impaired in AML: increased PD-1 expression is only seen at time of relapse and correlates with a shift towards the memory T cell compartment. J Hematol Oncol. (2015) 8:93. doi: 10.1186/s13045-015-0189-2
48. Siddiqui I, Schaeuble K, Chennupati V, Fuertes Marraco SA, Calderon-Copete S, Pais Ferreira D, et al. Intratumoral tcf1(+)PD-1(+)CD8(+) T cells with stem-like properties promote tumor control in response to vaccination and checkpoint blockade immunotherapy. Immunity. (2019) 50:195–211 e110. doi: 10.1016/j.immuni.2018.12.021
49. Kurtulus S, Madi A, Escobar G, Klapholz M, Nyman J, Christian E, et al. Checkpoint blockade immunotherapy induces dynamic changes in PD-1(-)CD8(+) tumor-infiltrating T cells. Immunity. (2019) 50:181–194 e186. doi: 10.1016/j.immuni.2018.11.014
50. Miller BC, Sen DR, Al Abosy R, Bi K, Virkud YV, LaFleur MW, et al. Subsets of exhausted CD8(+) T cells differentially mediate tumor control and respond to checkpoint blockade. Nat Immunol. (2019) 20:326–36. doi: 10.1038/s41590-019-0312-6
51. Dong Z, Chen F, Peng S, Liu X, Liu X, Guo L, et al. Identification of the key immune-related genes and immune cell infiltration changes in renal interstitial fibrosis. Front Endocrinol (Lausanne). (2023) 14:1207444. doi: 10.3389/fendo.2023.1207444
52. Wakim LM, Gupta N, Mintern JD, Villadangos JA. Enhanced survival of lung tissue-resident memory CD8(+) T cells during infection with influenza virus due to selective expression of IFITM3. Nat Immunol. (2013) 14:238–45. doi: 10.1038/ni.2525
53. Zhang C, Shen H, Yang T, Li T, Liu X, Wang J, et al. A single-cell analysis reveals tumor heterogeneity and immune environment of acral melanoma. Nat Commun. (2022) 13:7250. doi: 10.1038/s41467-022-34877-3
54. Miyabe Y, Miyabe C, Luster AD. LTB(4) and BLT1 in inflammatory arthritis. Semin Immunol. (2017) 33:52–7. doi: 10.1016/j.smim.2017.09.009
Keywords: single-cell technology, heterogeneity, T cells, AML, prognosis
Citation: Li X-P, Song J-T, Dai Y-T, Zhang W-N, Zhao B-T, Mao J-Y, Gao Y, Jiang L and Liang Y (2024) Integrative single-cell analysis of longitudinal t(8;21) AML reveals heterogeneous immune cell infiltration and prognostic signatures. Front. Immunol. 15:1424933. doi: 10.3389/fimmu.2024.1424933
Received: 28 April 2024; Accepted: 01 July 2024;
Published: 17 July 2024.
Edited by:
Guillaume Beyrend, Université de Lille, FranceReviewed by:
Fangmin Zhong, Nanchang University, ChinaCopyright © 2024 Li, Song, Dai, Zhang, Zhao, Mao, Gao, Jiang and Liang. This is an open-access article distributed under the terms of the Creative Commons Attribution License (CC BY). The use, distribution or reproduction in other forums is permitted, provided the original author(s) and the copyright owner(s) are credited and that the original publication in this journal is cited, in accordance with accepted academic practice. No use, distribution or reproduction is permitted which does not comply with these terms.
*Correspondence: Yang Liang, bGlhbmd5YW5nQHN5c3VjYy5vcmcuY24=; Yan Gao, Z2FveWFuQHN5c3VjYy5vcmcuY24=; Lu Jiang, amwxMTg5MUByamguY29tLmNu
Disclaimer: All claims expressed in this article are solely those of the authors and do not necessarily represent those of their affiliated organizations, or those of the publisher, the editors and the reviewers. Any product that may be evaluated in this article or claim that may be made by its manufacturer is not guaranteed or endorsed by the publisher.
Research integrity at Frontiers
Learn more about the work of our research integrity team to safeguard the quality of each article we publish.