 Drew A. Gillett1,2,3
 Noelle K. Neighbarger1,2,3
 Cassandra Cole1,2,3
 Rebecca L. Wallings1,2,3†
 Malú Gámez Tansey1,2,3,4*†
- 1Center for Translational Research in Neurodegenerative Disease, University of Florida, Gainesville, FL, United States
- 2Department of Neuroscience, University of Florida, Gainesville, FL, United States
- 3McKnight Brain Institute, University of Florida, Gainesville, FL, United States
- 4Norman Fixel Institute for Neurological Diseases, Gainesville, FL, United States
Introduction: Progranulin (PGRN) is a holoprotein that is internalized and taken to the lysosome where it is processed to individual granulins (GRNs). PGRN is critical for successful aging, and insufficient levels of PGRN are associated with increased risk for developing neurodegenerative diseases like AD, PD, and FTD. A unifying feature among these diseases is dysregulation of peripheral immune cell populations. However, considerable gaps exist in our understanding of the function(s) of PGRN/GRNs in immune cells and their role in regulating central-peripheral neuroimmune crosstalk. One of the most upregulated genes and proteins in humans with GRN haploinsufficiency and in aged Grn knock-out (KO) mice is glycoprotein non-metastatic B (GPNMB) but its normal role within the context of immune crosstalk has not been elucidated.
Methods: To address this gap, peritoneal macrophages (pMacs) from 5-to-6-month old WT and Grn KO mice were assessed for Gpnmb expression and stimulation-dependent cytokine release in the presence or absence of the Gpnmb extracellular domain (ECD). Cellular localization, as well as inhibition of, the microphthalmia-associated transcription factor (MITF) was assessed to determine its mechanistic role in Gpnmb overexpression in Grn KO pMacs.
Results: We observed an increase in GPNMB protein and mRNA as a result of insufficient progranulin in peripheral immune cells at a very early age relative to previous reports on the brain. Stimulation-dependent cytokine release was decreased in the media of Grn KO pMacs relative to WT controls; a phenotype that could be mimicked in WT pMacs with the addition og GPNMB ECD. We also found that MITF is dysregulated in Grn KO pMacs; however, its nuclear translocation and activity are not required to rescue the immune dysregulation of Grn KO macrophages, suggesting redundancy in the system.
Discussion: These findings highlight the fact that knowledge of early-stage disease mechanism(s) in peripheral populations may inform treatment strategies to delay disease progression at an early, prodromal timepoint prior to development of neuroinflammation and CNS pathology.
1 Introduction
Progranulin is a glycosylated holoprotein that is composed of seven and a half cysteine-enriched repeats, called granulins, that are distributed as “beads on a string” with short linker regions joining the repeats together (1). Nascent progranulin is translated into the endoplasmic reticulum (ER), where ER-resident chaperone and folding proteins aid in the cysteine-cysteine disulfide bonds that permit the beta-fold structure of the granulins. After glycosylation, progranulin can be secreted out of the cell or intracellularly trafficked to the endo-lysosomal pathway directly. Extracellular progranulin enters the cell via interaction with its receptor, sortilin (Sort1) (2), or by piggybacking onto a similar holoprotein, prosaposin, which is internalized with LRP1 and M6PR (3). Secreted progranulin circulates throughout the body fluids, including blood serum and cerebrospinal fluid (CSF) as a dimer (4). In this way, the level of progranulin expression is spread throughout the body, allowing even low-producing cells to take up sufficient amounts of progranulin.
Progranulin is critical for successful aging (5). Multiple mechanisms can influence progranulin expression, but loss of full progranulin expression, approximately 96-125ng per mL of blood serum (6, 7), can increase risk of disease. The silencing of one GRN allele is associated with an increased risk for Frontotemporal Dementia (FTD), but the silencing of both alleles results in Neuronal Ceroid Lipofuscinosis (NCL-11) (8, 9). Furthermore, other age-related neurodegenerative diseases, like Parkinson’s Disease (PD) and Alzheimer’s Disease (AD), are associated with decreased progranulin levels (10–18), suggesting common underlying mechanisms regarding the role of progranulin in healthy aging.
The specific functions of progranulin are multi-faceted and impact specific cell populations differently. Peripheral immune cells rely on progranulin. Clinically symptomatic GRN-mutation carriers showed increased soluble Cluster of Differentiation 163 (CD163) and CC Chemokine Ligand 18 (CCL18) serum levels relative to healthy controls, suggesting increased peripheral macrophage activity (19). In addition, lipopolysaccharide binding protein (LBP) levels correlated with white-matter changes in the frontal lobe and Clinical Dementia Rating (CDR)-FTLD sum of boxes (SB) scores of clinically symptomatic GRN-FTD patients, indicating that peripheral immune activity correlates with region-specific brain changes and clinically relevant behavior. When macrophages isolated from progranulin-deficient mice were challenged with lipopolysaccharide (LPS), they showed increased transcription of Mcp-1, Il-12p40, and Tnf, as well as decreased Il-10 transcription, relative to wild-type (WT) controls (20).
In the brain, progranulin is associated with neuroprotection. The precise mechanism(s) are unclear, but progranulin modulates neuroinflammation and reduces brain volume loss in stroke and head injury paradigms (21, 22) and also prevented dopaminergic neuron loss in an MPTP model (23). Recent work identified a specific increase in the expression of glycoprotein non-metastatic B (GPNMB) in GRN-FTD patient brain lysate relative to both non-demented controls and other FTD related mutations (24). In addition, CSF from GRN-FTD patients showed increased amounts of GPNMB relative to non-demented controls (24). This indicates a specific increase in GPNMB expression with the loss of progranulin. When a mouse model of progranulin deficiency was investigated, an age-dependent increase in the expression of GPNMB was discovered. Brain lysate from young 3-month-old Grn knock-out (KO) mice did not show a significant change relative to age-matched wild-type (WT) controls, but 12-month-old Grn KO mice replicated the increase in GPNMB expression seen in the GRN-FTD patients (24). This gives further support that extended periods of insufficient progranulin results in increased GPNMB expression, likely in a compensatory mechanism(s) related to endo-lysosomal dysfunction.
Originally identified in a cancer cell line (25), GPNMB is a glycoprotein that is present both on the cell membrane and intracellularly in the autophagy pathway and is highly expressed on myeloid cells. ADAM/MMPs can cleave off the extracellular domain, generating a soluble extracellular fragment (ECF) (26), which has been demonstrated to serve a signaling role in a paracrine and an autocrine manner (27, 28). CD44 and Syndecan-4 are the published cell-surface receptors for GPNMB, but the effect of binding the GPNMB ECF is cell-type dependent (29, 30). Within the cell, GPNMB localizes with LC3+ vesicles, where it is believed to support the recruitment of the lysosome to autophagosomes (31), allowing for autophagic cargo to be successfully degraded. Given that progranulin has a profound effect on the endo-lysosomal pathway, it seems logically consistent that GPNMB would increase in an attempt to aid autophagolysosomal function. However, the mechanisms behind GPNMB regulation are not entirely well known. Microphthalmia-associated transcription factor (MITF) has been demonstrated to regulate GPNMB in dendritic cells (32), a class of immune cells with similar properties to macrophages.
Under basal conditions, mTORC1 phosphorylates the MiT/TFE transcription factor family of proteins (MITF, TFE3, TFEB, and TFEC), preventing their translocation to the nucleus by promoting interaction with the 14-3-3 cytosolic protein (33–35). In conditions with decreased mTORC1 activity, such as serum starvation and/or endo-lysosomal dysfunction, MiT/TFE transcription factors are not phosphorylated by mTORC1 and can drive the expression of CLEAR (Coordinated Lysosomal Expression and Regulation) genes (36), that push the cell towards increased autophagy and endo-lysosomal activity in an attempt to regain cellular homeostasis. However, there are a number of unknowns surrounding if and how these elements interact to contribute to the age-dependent increase in GPNMB expression in myeloid cells. This work seeks to close these gaps in knowledge by extending the investigation of GPNMB expression into the peripheral immune system and exploring candidate regulatory mechanism(s) that have been implicated to regulate GPNMB expression in the context of progranulin-deficiency.
2 Materials and Methods
2.1 Animals
C57BL/B6J mice and Grn KO (20) (The Jackson Laboratory, strain #:013175) mice were generated and maintained in the McKnight Brain Institute vivarium (University of Florida) at 22°C at 60-70% humidity with a 12-hour light/dark cycle and ad libitum access to standard rodent chow and water. C57BL/6J (B6) (Strain #000664) controls were used for all studies. All animal procedures were approved by the University of Florida Institutional Animal Care and Use Committee and were in accordance with the National Institute of Health Guide for the Care and Use of Laboratory Animals (NIH Publications No. 80-23, 8th edition, revised 2011). Mice of both genotypes were co-housed and aged to 5-6 months.
On Day 1, WT and Grn KO mice were injected with 1mL of sterile 3% (m/v) BBL Thioglycollate Medium Brewer Modified (Becton Dickson, 211716) in diH2O. Mice also received Buprenorphine Sustained-Release (Zoopharm; Windsor, CO) every 48 hours for pain relief. On day 4, mice were sacrificed by cervical dislocation and their peritoneal membrane was exposed by carefully dissecting the skin and fur away from the midline. Great care was taken to avoid disrupting the integrity of the peritoneal membrane. 10mL of ice-cold RPMI media (Gibco #11875) was injected into the peritoneal cavity with a 27g syringe and gentle shaking was applied to loosen adherent cells into suspension. The media was then aspirated out with a 25g syringe and dispensed into a 15mL conical and placed on ice. After all of the cells were collected, the cell suspensions were filtered through a 70um pre-wet filter overlaid a 50mL conical and rinsed twice with ice-cold 1x HBSS -/- (Gibco #14175). The resulting suspension was spun at 400 x g for 5 minutes at 4°C. To remove red blood cells that may have contaminated the peritoneal cell suspension, the cell pellet was treated with 2mL of ACK Lysis Buffer (0.15 M NH4Cl 10mM KHCO3 0.1mM EDTA) and gently vortexed until the pellet was resuspended. The ACK buffer was allowed to incubate until the red blood cells lysed, approximately 1-2 minutes. The reaction was quenched with 5mL of HBSS -/-, and the cell suspension was spun again at 400 x g for 5 minutes at 4°C. The resulting pellets were transferred into a sterile hood and the HBSS-ACK supernatant was aspirated away. The cells were resuspended in 3mL of warm complete RPMI media (Gibco RPMI #14175, 10% FBS, 1x Pen/Strep (Gibco #15140)) and counted and viability recorded using trypan-blue exclusion on an automated cell-counter (Countess™; Thermo). 2x10⁶ cells were plated in each well of a 6-well dish. Cells were incubated at 37°C, 5% CO2 for five to six hours to allow macrophages to adhere. Wells were washed twice with warm 1x DPBS -/- (Gibco #14190) to remove non-adherent peritoneal cells, leaving the adherent peritoneal macrophages behind. Warm complete RPMI media was applied to the macrophages until the experimental paradigm began the following day.
2.2 pMac treatment paradigms
ML329, an MITF inhibitor, (MedChemExpress, catalog number HY-101464) was reconstituted in DMSO under sterile conditions and diluted to a final concentration of 5uM and 10uM in warm RPMI media and applied for 24 or 48 hours. An equal volume of DMSO as the 10uM ML329 treatment was used as the vehicle control.
Recombinant mouse GPNMB ECD (Aviscera Biosciences, product code 00719-03-10) was diluted in pre-warmed complete RPMI to a final concentration of 0.5ug/ml and 1.0ug/mL and was applied for 4 hours. At the end of the treatment, the media that contained the GPNMB ECD was aspirated off of the cells. Pre-warmed 1x DBPS was used to wash the pMacs after the GPNMB-ECD treatment was finished to remove any remaining GPNMB-ECD. After the wash, lipopolysaccharide (LPS, from Escherichia coli O111:B4, Sigma-Aldrich) treatment was started. LPS-only and no-treatment controls were given a media change of fresh media at the same time. LPS was diluted to a final concentration of 1ug/mL, approximately 3,000 endotoxin units (EU), in pre-warmed complete RPMI media and applied to the macrophages for 3 hours. No treatment controls received an additional media change at the same time.
Recombinant mouse progranulin (R&D Systems, catalog #: 2557-PG) was diluted in complete RPMI media to a final concentration of 4 ug/mL and applied for 48 hours. No treatment controls received a media change at the same time.
2.3 Protein Fractionation and Western Blotting
At the end of the experimental paradigm(s), the plates containing the macrophages were removed from the incubator and placed on ice. Media was collected from select groups for downstream analysis before the macrophages were rinsed twice with ice-cold 1x PBS. After the PBS was aspirated off the second time, the cells were scraped up into the cytoplasmic fractionation buffer (150 mm sodium chloride, 50 mm Tris, pH 8.0, and 0.5% Triton X-100) with 1x protease and phosphatase inhibitors (c0mplete™ Protease Inhibitor Cocktail, Roche, product number 04693159001; PhosSTOP™, Roche, product number 04906837001). The resulting lysate was transferred to a labeled 1.5mL tube and placed on ice. Cell lysate was spun at 20,000 x g for 20 minutes at 4°C. After the spin was complete, the supernatant containing the soluble cytoplasmic proteins was transferred to a new labeled 1.5mL tube. The insoluble pellet was washed by adding the same volume of cytoplasmic fractionation buffer and vortexed briefly before being spun again at 13,000 x g for 20 minutes at 4°C. The supernatant was aspirated off, and the nuclear fractionation buffer (150 mm sodium chloride, 1.0% NP-40, 0.5% sodium deoxycholate, 0.1% SDS, and 50 mm Tris, pH 8.0) was added to the cell pellet. The pellet was briefly sonicated with a probe sonicator (QSonica, Q125 Sonicator, 125 Watts, 20 kHz) for 5 seconds and spun for a final time at 13,000 x g for 20 minutes at 4°C. The supernatant containing the soluble nuclear proteins was transferred to a separate labeled 1.5mL tube. The remaining pellet was discarded.
A BCA assay (Pierce™ BCA Protein Assay Kit, category number 23225) was used to determine the concentration of the resulting protein fractions. The indicated mass of protein was boiled for 5 minutes at 95°C with 4x Laemmeli Buffer (BioRad #1610747) supplemented with 2.5% (v/v) beta-mercaptoethanol and run on a 4-20% TGX gel (BioRad #5671094 and #5671095). Protein was transferred to polyvinylidene difluoride (PVDF) membrane (BioRad #1704273) using a Trans-Blot Turbo Transfer System (BioRad). Licor Revert 700 Total protein stain (Licor, P/N: 926-11011) was used to stain the total protein on the membrane and imaged on the Odyssey FC imaging system (Licor). Blots were incubated in primary antibodies (Table 1) overnight in 5% milk 1x TBS 0.1% Tween-20 pH 7.4. The blots were removed from primary and washed for five minutes in 1x TBS 0.1% Tween-20 pH 7.4. Blots were washed two more times for a total of three washes. The blots were incubated in secondary antibody in 5% Milk 1x TBS 0.1% Tween-20 pH 7.4 for 1 hour at RT with gentle rocking. After the 1-hour incubation, the blots were removed from the secondary antibody solution and washed as before three more times. To elicit signal from the HRP conjugated antibodies, SuperSignal West Femto Maximum Sensitivity Substrate (ThermoScientific™, category number 34096) reagents were combined at a 1:1 ratio. The reagents were quickly applied to the blot, and image collection began immediately. All images were collected using the Odyssey FC imaging system (Licor). Multiple images were collected for each blot with new Femto reagent applied after a short wash in 1x TBS 0.1% Tween-20 pH 7.4. ImageStudioLite was used to quantify the intensity of the bands. For the MITF and PGRN antibodies, fixation with 4% PFA in TBS for 10 minutes at RT was performed.
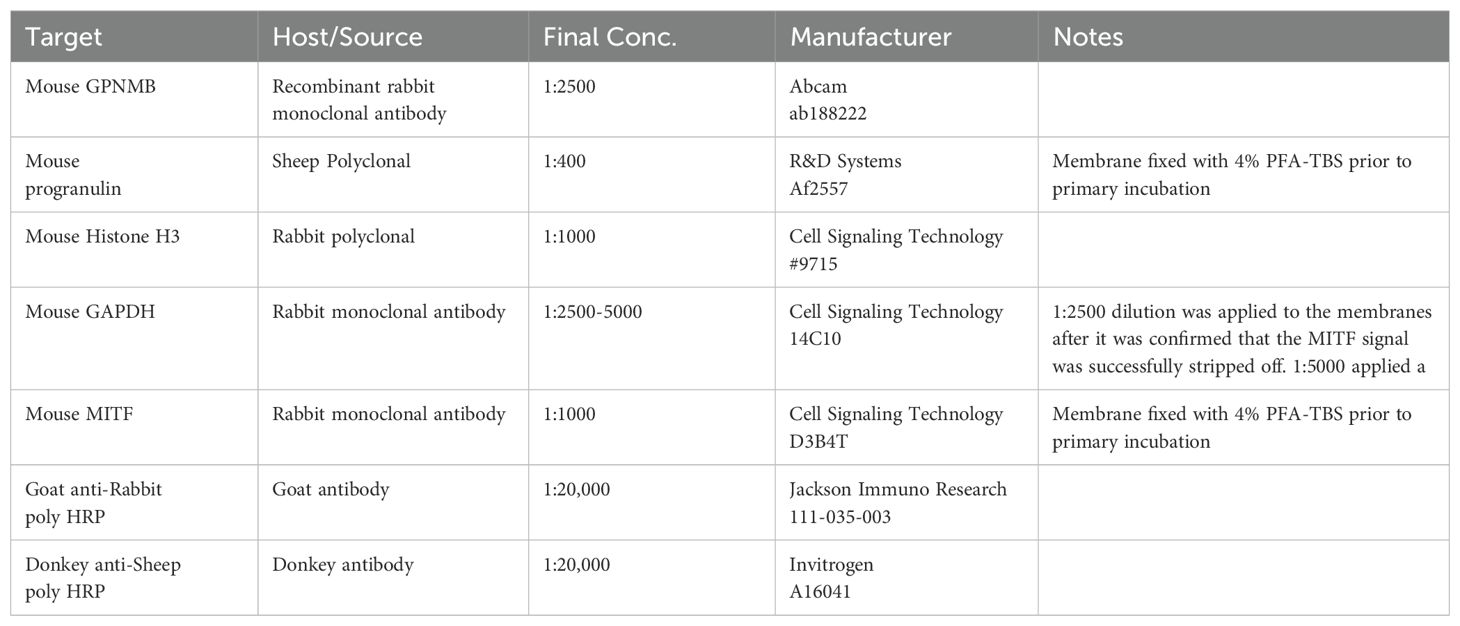
Table 1. List of primary and secondary antibodies for proteins of interest.
The membrane was stripped between the probe of MITF and GAPDH using a buffer containing a final concentration of 1 M Tris, 20% SDS, and 0.7% BME. The solution was pre-warmed to 50°C and applied to the membrane for 15 minutes at 50°C. The membrane was blocked in 5% Milk TBS- Tw for 30 minutes after stripping. An additional probe with Femto reagent was performed to determine the success of the stripping protocol. Signal was normalized to the surrounding background before being normalized to GAPDH or H3 loading control for each band.
2.4 RNA and qPCR
RNA was isolated using a Qiagen Mini-kit (Qiagen, category number 74104), following manufacturer instructions with minimal alterations. The concentration of BME was increased to a final concentration of 20uM to inhibit endogenous RNase activity. After elution, RNA concentration was determined using a Denovix spectrophotometer. cDNA was generated using a High-Capacity cDNA Reverse Transcription Kit (Applied Biosystems™, catalog number 4374966) following kit instructions.
2x Universal SYBR Green Fast qPCR Mix (Abclonal, RK21203) was used with the indicated primers (Table 2) for detection.
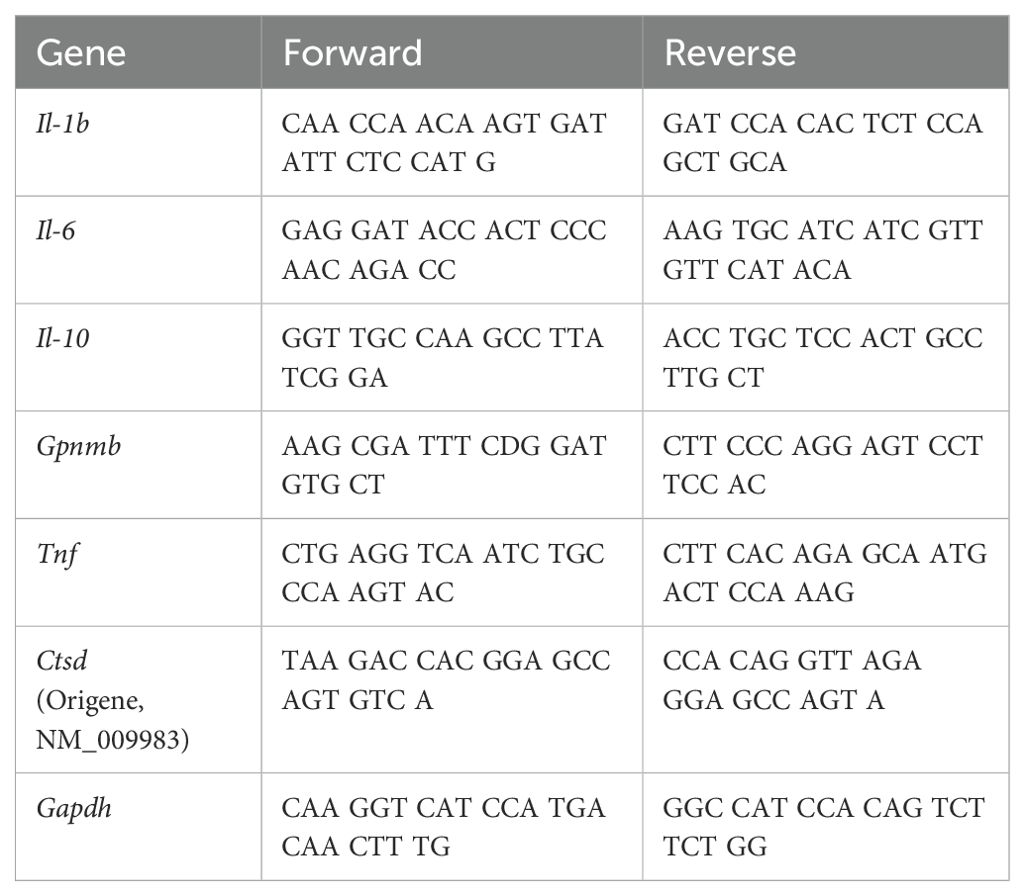
Table 2. List of qPCR primers for genes of interest.
All primer sequences were generated and validated in house, except the Ctsd primer set, which was sourced from Origene (NM_009983). To generate primers, the University of Santa Cruz Genomics Institute Genome Browser was used to identify exon spanning sequences for the genes of interest in the appropriate species. Multiple exon spanning sequences were selected and the NIH BLAST tool was used to check for specificity. Next, the spanning sequences were copied into the online Primer3Plus tool. Candidate primer sequences were generated and reviewed for the following criteria: primer length between 20-27 bases, product length is around 100bp, GC content is 40-60%, and the Tm difference between the primers is less than 4°C. The reviewed sequences were ordered as custom oligos from IDT with standard desalting purification.
Once the primer sequences arrived, the tubes were briefly spun down to collect the powder in the bottom of the tube. The indicated amount of nuclease-free ultrapure water was added to each tube to generate 100µM stock. The primers were vortexed for 15 seconds to reconstitute them. Working stock concentrations were generated by adding 12.5uL of each forward and reverse primer for each gene into 975uL of nuclease-free ultrapure water. The working stocks were made homogenous with a brief vortex.
To validate in-house primer sequences: a five-fold dilution series was generated using cDNA from a source with high expression of the genes of interest. qPCR was plated to determine how Ct values change with decreased cDNA concentration. A cyclophilin primer set was used as a positive control for amplification and the standard curve was generated by plotting the fold change of the mass of cDNA against the detected Ct values for each primer set. A primer is considered valid if the R value is 0.97 or higher and the slope of the line is m=-3.3 ± 0.1.
Plate qPCR to determine how the Ct value changes with decreasing cDNA concentration. Use a cyclophilin primer set as a positive control for amplification and the standard curve generated by plotting the fold change in the mass of cDNA and the detected Ct value (example graph below). A primer is considered valid if the R2 value is 0.97 or higher and the slope of the line is m=-3.3 ± 0.1.
A final mass of 6.25ng of cDNA and a final concentration of 0.15µM of each forward and reverse primer was used per well. The PCR data was collecting using a Quantstudio5 system with the following cycle: 50°C for 2 minutes, 95°C for 10 minutes, 40 cycles (95°C for 15 seconds and 60°C for 1 minute), 95°C for 15 seconds, 60°C for 15 seconds, and 95°C for 55 seconds. Each sample was run in triplicate per gene. Samples with variance beyond 0.4 standard deviations from the sample’s average were excluded.
2.5 ELISA
Conditioned media was collected from the pMacs at the indicated times. After being transferred to a 1.5mL tube, the media was centrifugated at 10,000 x g for 10 minutes at 4°C to remove any cell debris. The supernatant was transferred to a new tube and stored at -20°C for later analysis. Endogenous GPNMB ECF was measured using a Biotechne GPNMB ELISA Kit (Biotechne/R&D Systems, DY2330) following manufacturer instructions with minor modifications. A four-parameter logistic(4-PL) curve was generated from the GPNMB ECF standards included in the kit. The standard curve was created with an online 4-PL curve calculator from AAT Bioquest (https://www.aatbio.com/tools/four-parameter-logistic-4pl-curve-regression-online-calculator). The equation from the 4-PL curve was used to determine the concentration of GPNMB ECF in the test samples.
3 Results
3.1 GPNMB is dysregulated in Grn KO pMacs
Previous work identified a novel increase in GPNMB signal in brain-resident cells, presumed to be microglia, in Grn KO mice beginning at 12-months old (24). An age series allowed the authors to conclude that there is an age-dependent increase in GPNMB signal in the central nervous system (CNS) of Grn KO mice. To extend on this finding, we investigated the relative abundance of GPNMB in peripheral myeloid cells by isolating thioglycollate-elicited peritoneal macrophages (pMacs) from Grn KO mice. Western blot analysis confirmed the absence of progranulin and also showed a significant increase in GPNMB protein in pMacs collected from 5–6-month-old Grn KO mice relative to B6 controls in both male and female mice (Figures 1A–C). All three bands present in the probe for GPNMB were quantified. The lowest band, approximately 68 kDa, is the nascent protein, and the two higher weight bands, around 95 and 110 kDa, have been glycosylated and may have additional post-translational modifications.
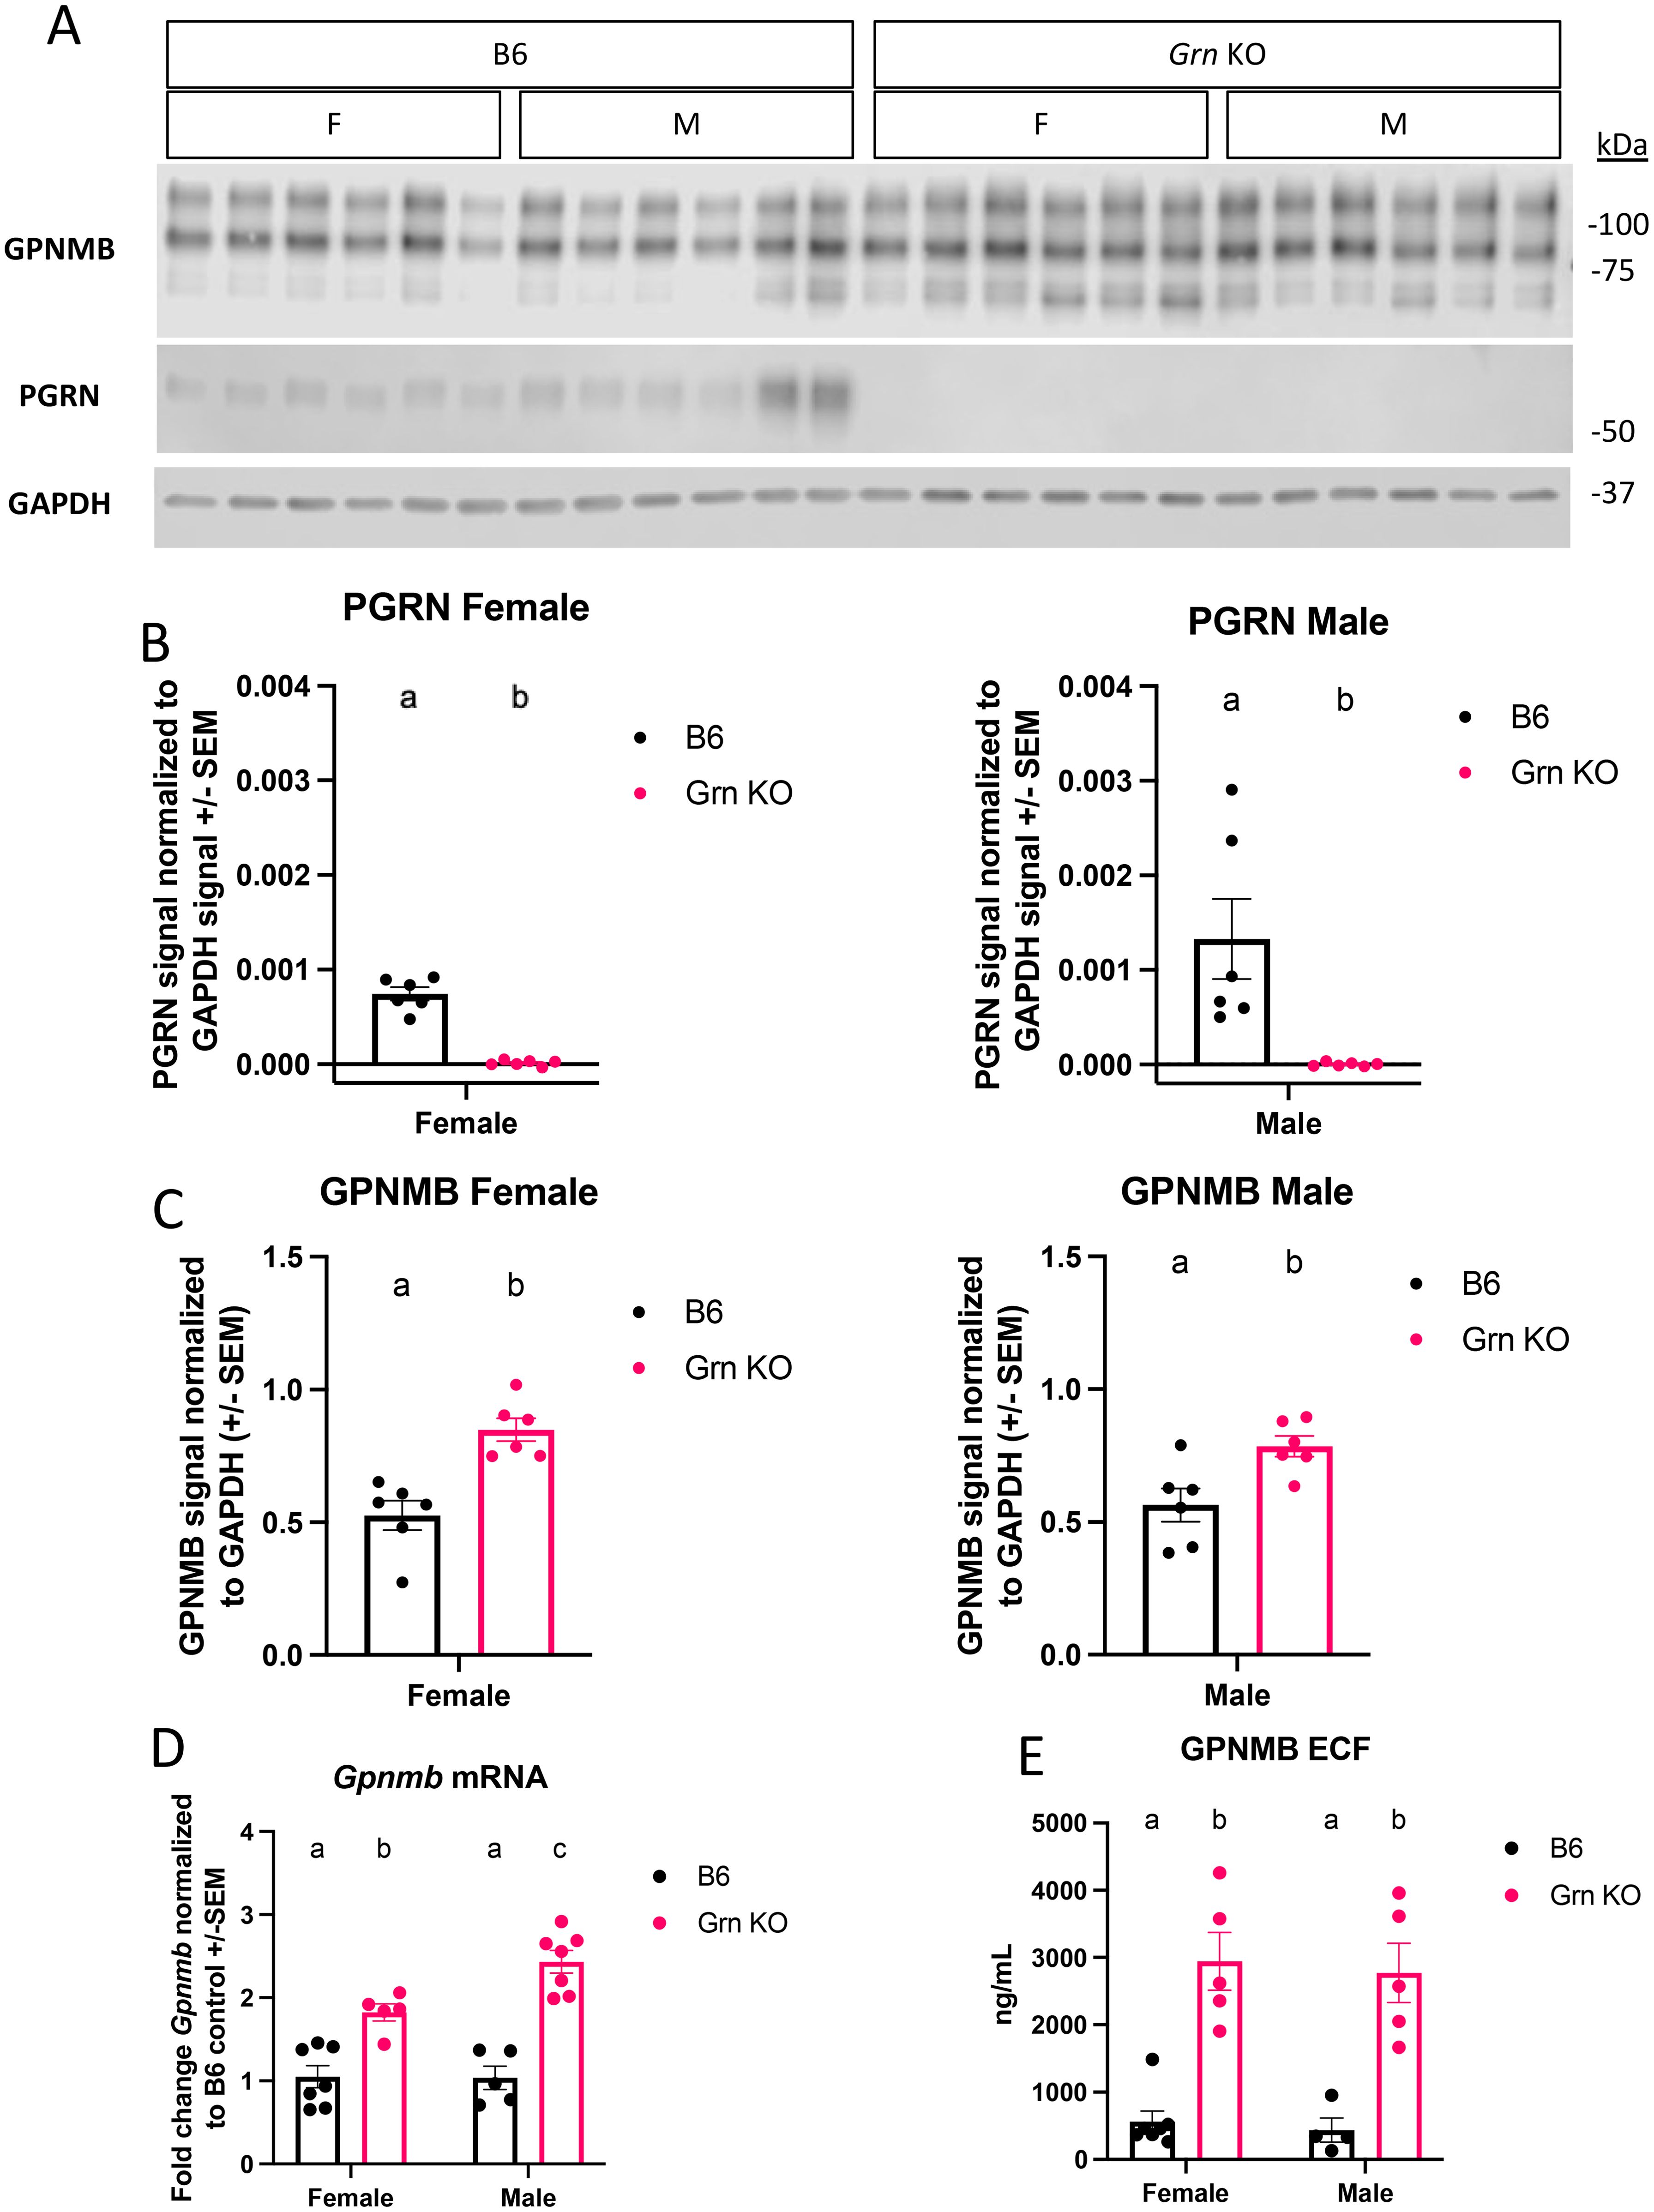
Figure 1. GPNMB protein is overproduced in Grn KO pMacs (A) Representative western blot images of GPNMB, PGRN, and GAPDH from B6 and Grn KO pMacs (B) Quantification of PGRN signal normalized to GAPDH. (C) Quantification of GPNMB signal normalized to GAPDH, n=6 per sex and genotype, n = 5-6 per sex and genotype, unpaired t-test, bars represent mean +/- SEM. (D) qPCR data on baseline Gpnmb transcript from bothB6 and Grn KO pMac, n=5-7 per sex and genotype, two-way ANOVA with Sidak’s multiple comparisons test. (E) GPNMB ELISA measurement of GPNMB ECF in culture media generated by pMacs over 48 hours, n=4-5 per sex and genotype, two-way ANOVA with Sidak’s multiple comparisons test. Letter(s) above the bar graphs represent the results of the post-hoc tests. Groups that share the same letter are not significantly different from one another.
However, it was previously unclear if the relative increase in GPNMB protein abundance was a non-specific intracellular accumulation as a result of endo-lysosomal dysfunction without sufficient progranulin expression. Using qPCR, we determined that pMacs from 5-6-month-old Grn KO mice had a significant increase in Gpnmb mRNA relative to B6 controls, with male Grn KO pMacs expressing significantly higher amounts than female Grn KO pMacs. (Figure 1D). This supports that this increase in GPNMB protein is a result of increased expression and not an endo-lysosomal bystander. Previous work has established that GPNMB is subject to cleavage events by extracellular proteases like ADAM10 that produces a soluble extracellular fragment (ECF) (26). Given the increase in GPNMB protein substrate, we investigated the amount of GPNMB ECF that was produced in pMac media. Using an ELISA specific for endogenous GPNMB ECF, we determined that there is a significant increase in the amount of GPNMB ECF generated in pMacs collected from 5–6-month-old male and female Grn KO mice relative to B6 controls (Figure 1E). Together, this data demonstrates that there is an active increase in both GPNMB protein and the soluble ECF generated from it, in progranulin-deficient macrophages.
3.2 Grn KO pMacs show diminished expression of early inflammatory genes
Having discovered an increase in the GPNMB ECF generated by Grn KO pMacs, we wanted to investigate any functional effect of recombinant GPNMB extracellular domain (ECD) treatment on the behaviour of these pMacs. Previous work has identified a decrease in inflammatory gene expression with recombinant GPNMB ECD treatment in Gpnmb KO pMacs (28). We adapted their paradigm to our own purposes, pre-treating two groups of cells with two doses of recombinant GPNMB ECD for four hours prior to three hours of LPS stimulation with an LPS only and no treatment control. This paradigm allows us to determine the differences in inflammatory gene expression between Grn KO and B6 pMacs during LPS stimulation, but it also permits us to detect any changes in inflammatory gene expression with GPNMB ECD pre-treatment.
qPCR analysis demonstrated multiple notable differences in the expression of inflammatory genes between genotypes. Il-1b transcript was increased with LPS only stimulation in both sexes of B6 pMacs, but there was a diminished though significant increase in Il-1b transcript in Grn KO male pMacs and no change at all in Grn KO female pMacs with LPS only stimulation (Figures 2A, D). There was no significant increase in Il-6 transcript abundance in B6 and Grn KO female pMacs stimulated with only LPS relative to no treatment controls, but males of both genotypes had a significant, if smaller, increase in Il-6 transcript with only LPS stimulation (Figures 2B, E). Tnf transcript was also significantly different between the genotypes following only LPS stimulation, but neither sex significantly differed from their respective B6 controls (Figures 2C, F). In contrast, no differences in Il-10 transcript between any genotype of either sex were observed (Figures 2G, H).
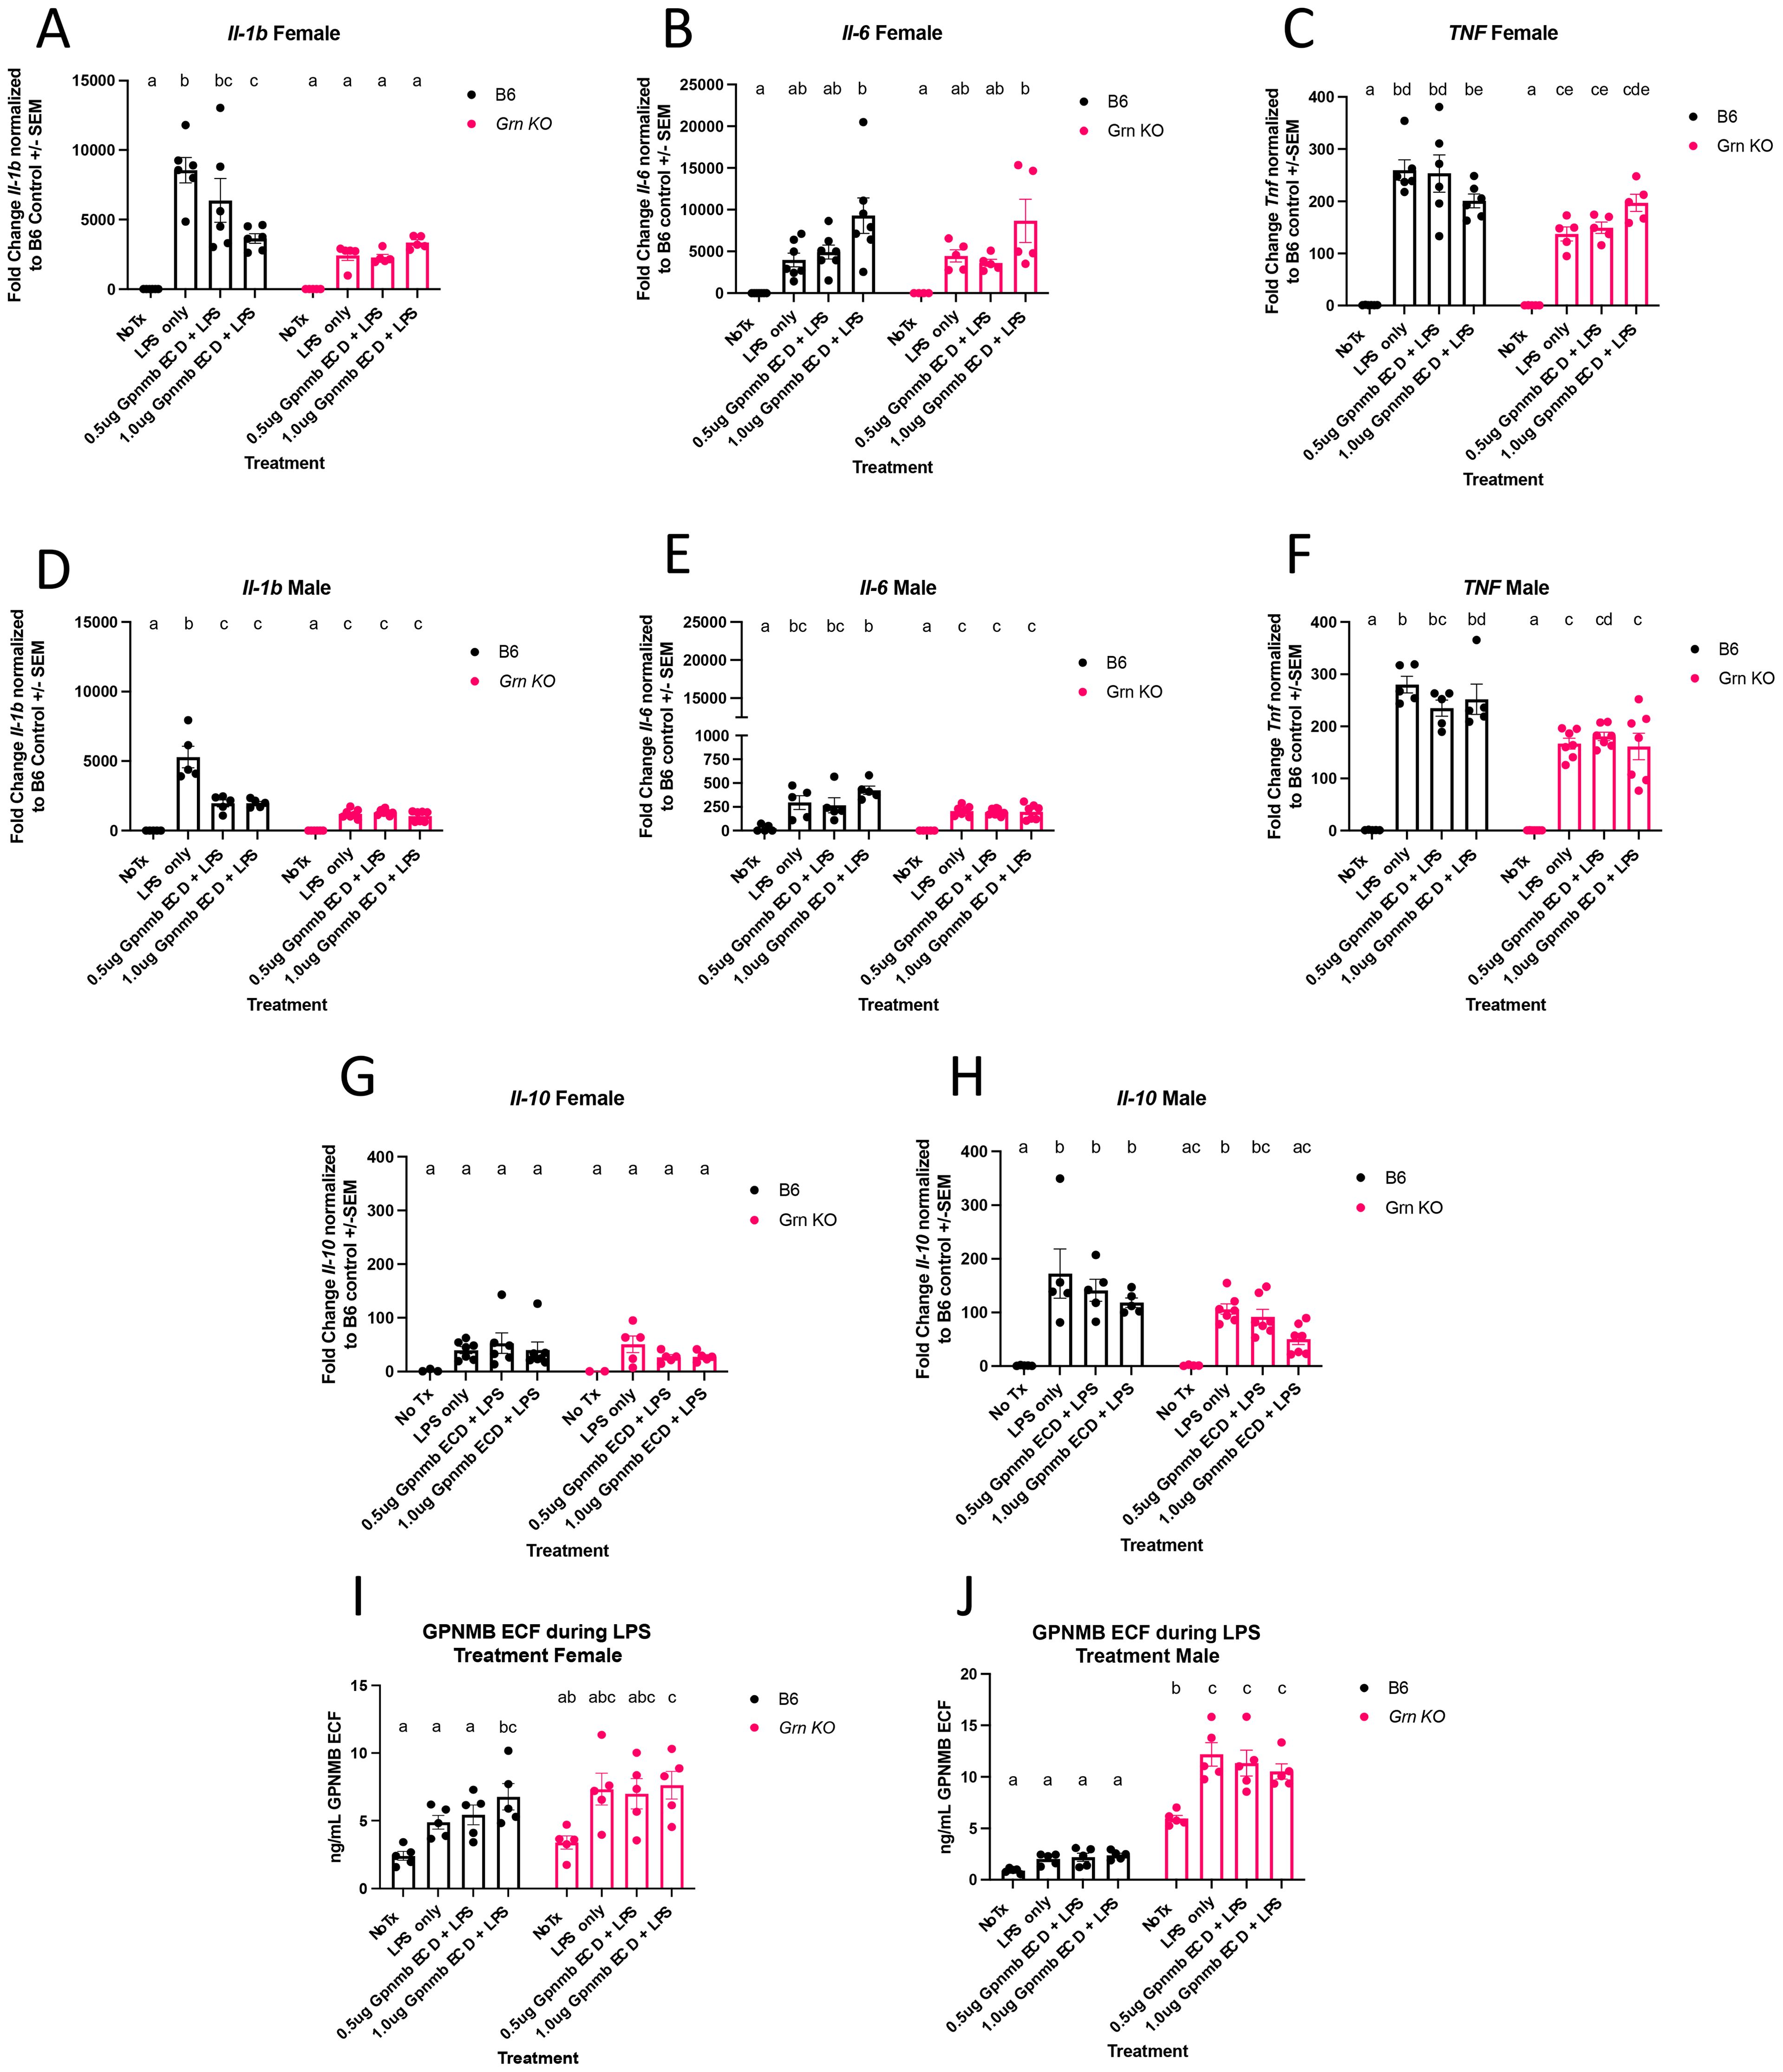
Figure 2. Grn KO pMacs display reduced LPS-dependent expression of early inflammatory genes (A) qPCR for Il-1b expression in female B6 and Grn KO pMacs. (B) qPCR for Il-6 expression in female B6 and Grn KO pMacs. (C) qPCR for Tnf expression in female B6 and Grn KO pMacs. (D) qPCR for Il-1b expression in male B6 and Grn KO pMacs. (E) qPCR for Il-6 expression in male B6 and Grn KO pMacs. (F) qPCR for Tnf expression in male B6 and Grn KO pMacs. (G) qPCR for Il-10 expression in female B6 and Grn KO pMacs. (H) qPCR for Il-10 expression in male B6 and Grn KO pMacs. (I, J) GPNMB ELISA measurement of GPNMB ECF in culture media generated by pMacs during experimental paradigm. Two-way ANOVA with Sidak’s multiple comparisons test for every panel, n = 5-7, bars mean represent +/- SEM. Groups that share the same letter are not significantly different from one another.
The effect of the GPNMB ECD pre-treatment is less impactful than the genotype. In both male and female B6 pMacs, there is significantly decreased Il-1b transcript relative to the LPS only control, suggesting that GPNMB ECD pre-treatment was sufficient to blunt the LPS-mediated increase (Figures 2A, D). Additionally, female pMacs from both genotypes show no significant increase in Il-6 transcript with LPS stimulation relative to the no treatment control except for when pre-treated with 1ug/mL of GPNMB ECD (Figure 2B). However, no significant effect of GPNMB pre-treatment on Il-6 was observed in pMacs from B6 males (Figure 2E). Tnf transcript levels did not significantly change with pre-exposure to either dose of GPNMB ECD (Figures 2C, F). Finally, Il-10 transcript showed no change due to GPNMB ECD treatment, with the exception of the Grn KO males, where both doses of GPNMB ECD reduced the Il-10 transcript to levels that are not significantly different from the no treatment control (Figure 2H).
Finally, we investigated if GPNMB ECD pre-treatment and/or LPS only treatment altered the amount of GPNMB ECF that was released into the media by pMacs. In both genotypes of female pMacs, GPNMB ECF concentration increased with LPS but did not reach statistical significance until pre-treated with 1ug of GPNMB ECD (Figure 2I). In contrast, the B6 male pMacs did not change the amount of GPNMB ECF with any treatment, but the Grn KO pMacs generated a significant increase in GPNMB ECF with LPS stimulation regardless of GPNMB ECD pre-treatment (Figure 2J). Collectively, this data demonstrates a key significant decrease in critical pro-inflammatory cytokine expression in Grn KO pMacs, and the ability of GPNMB ECD to blunt the LPS-mediated increase in Il-1b expression in B6 pMacs.
3.3 Re-addition of progranulin rescues GPNMB phenotype in Grn KO pMacs
To investigate the regulation of GPNMB in progranulin-deficient macrophages, we treated both B6 and Grn KO pMacs with recombinant mouse progranulin. Using western blot analysis, we determined that the relative abundance of GPNMB protein was significantly increased in Grn KO pMacs that did not receive progranulin but was not significantly different from B6 controls after treatment with recombinant progranulin (Figures 3A–D). We detected no significant change in GPNMB with the addition of exogenous progranulin in B6 pMacs (Figures 3A–D). This data suggests that the re-addition of progranulin is sufficient to significantly decrease GPNMB levels in Grn KO pMacs, but the exogenous progranulin had no significant effects on the expression of GPNMB in B6 pMacs.
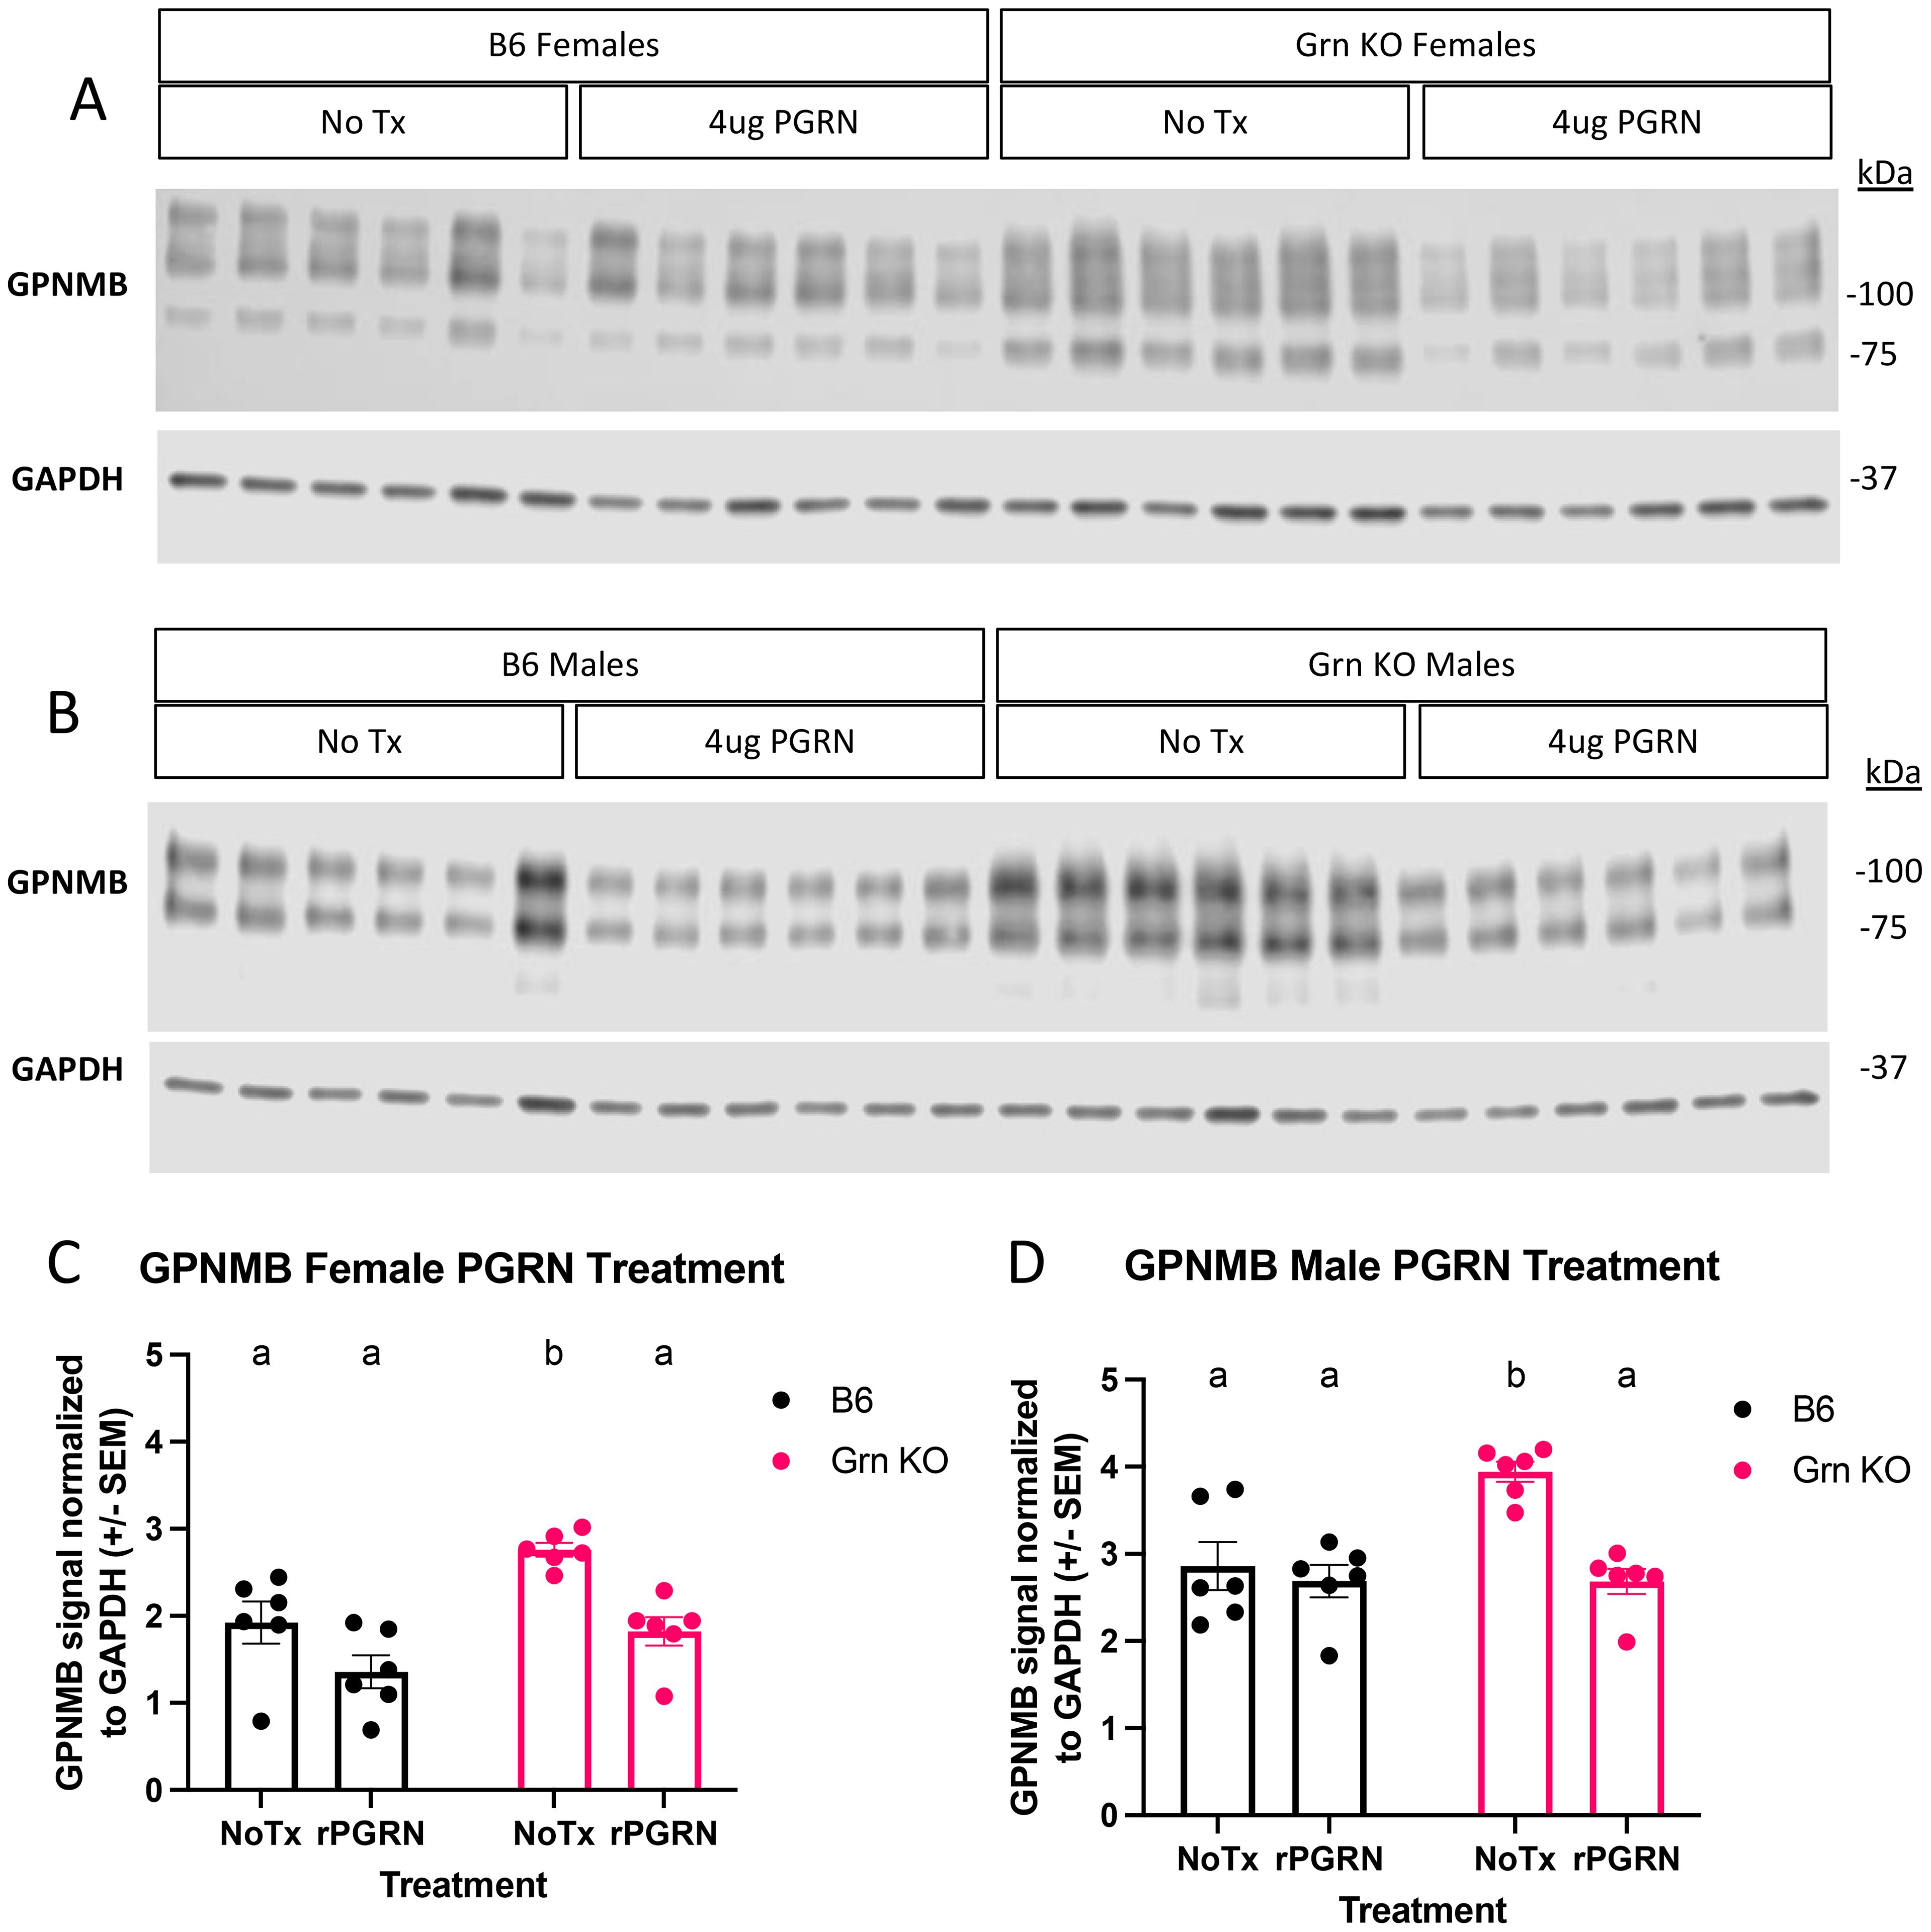
Figure 3. Re-addition of progranulin protein rescues GPNMB dysregulation in Grn KO pMacs (A) Representative western blot images of GPNMB and GAPDH from female B6 and Grn KO pMacs with and without 48 hours of 4ug/mL of recombinant progranulin treatment. (B) Representative western blot images of GPNMB and GAPDH from male B6 and Grn KO pMacs with and without 48 hours of 4ug/mL of recombinant progranulin treatment. (C) Quantification of GPNMB signal normalized to GAPDH. (D) Quantification of GPNMB signal normalized to GAPDH. Two-way ANOVA with Sidak’s multiple comparisons test, n = 6 per genotype, bars represent mean +/- SEM. Groups that share the same letter are not significantly different from one another.
3.4 MITF is dysregulated in Grn KO pMacs
Previous reports have implicated the transcription factor MITF to regulate GPNMB in dendritic cells (32), RAW264.7 cells (37), and osteoclasts (37). Given our observation of increased GPNMB expression in Grn KO pMacs, we investigated the regulation of MITF in both the presence and absence of recombinant progranulin treatment (Figure 3). To best determine the relative abundance of MITF, we used biochemical fractionation to concentrate nuclear and cytosolic proteins into separate lysates. Subsequent western blot analysis identified distinct patterns of MITF abundance in the nuclear and cytosolic fractions of B6 and Grn KO pMacs. B6 pMacs have a greater amount of MITF in the cytosolic fraction but very little in the nuclear fraction (Figures 4A–C). In contrast, Grn KO pMacs have little cytosolic MITF relative to B6, but instead have greater nuclear MITF relative to B6 pMacs. Re-addition of recombinant progranulin for 48 hours did not rescue the dysregulated nuclear MITF in Grn KO pMacs (Figures 4A, C).
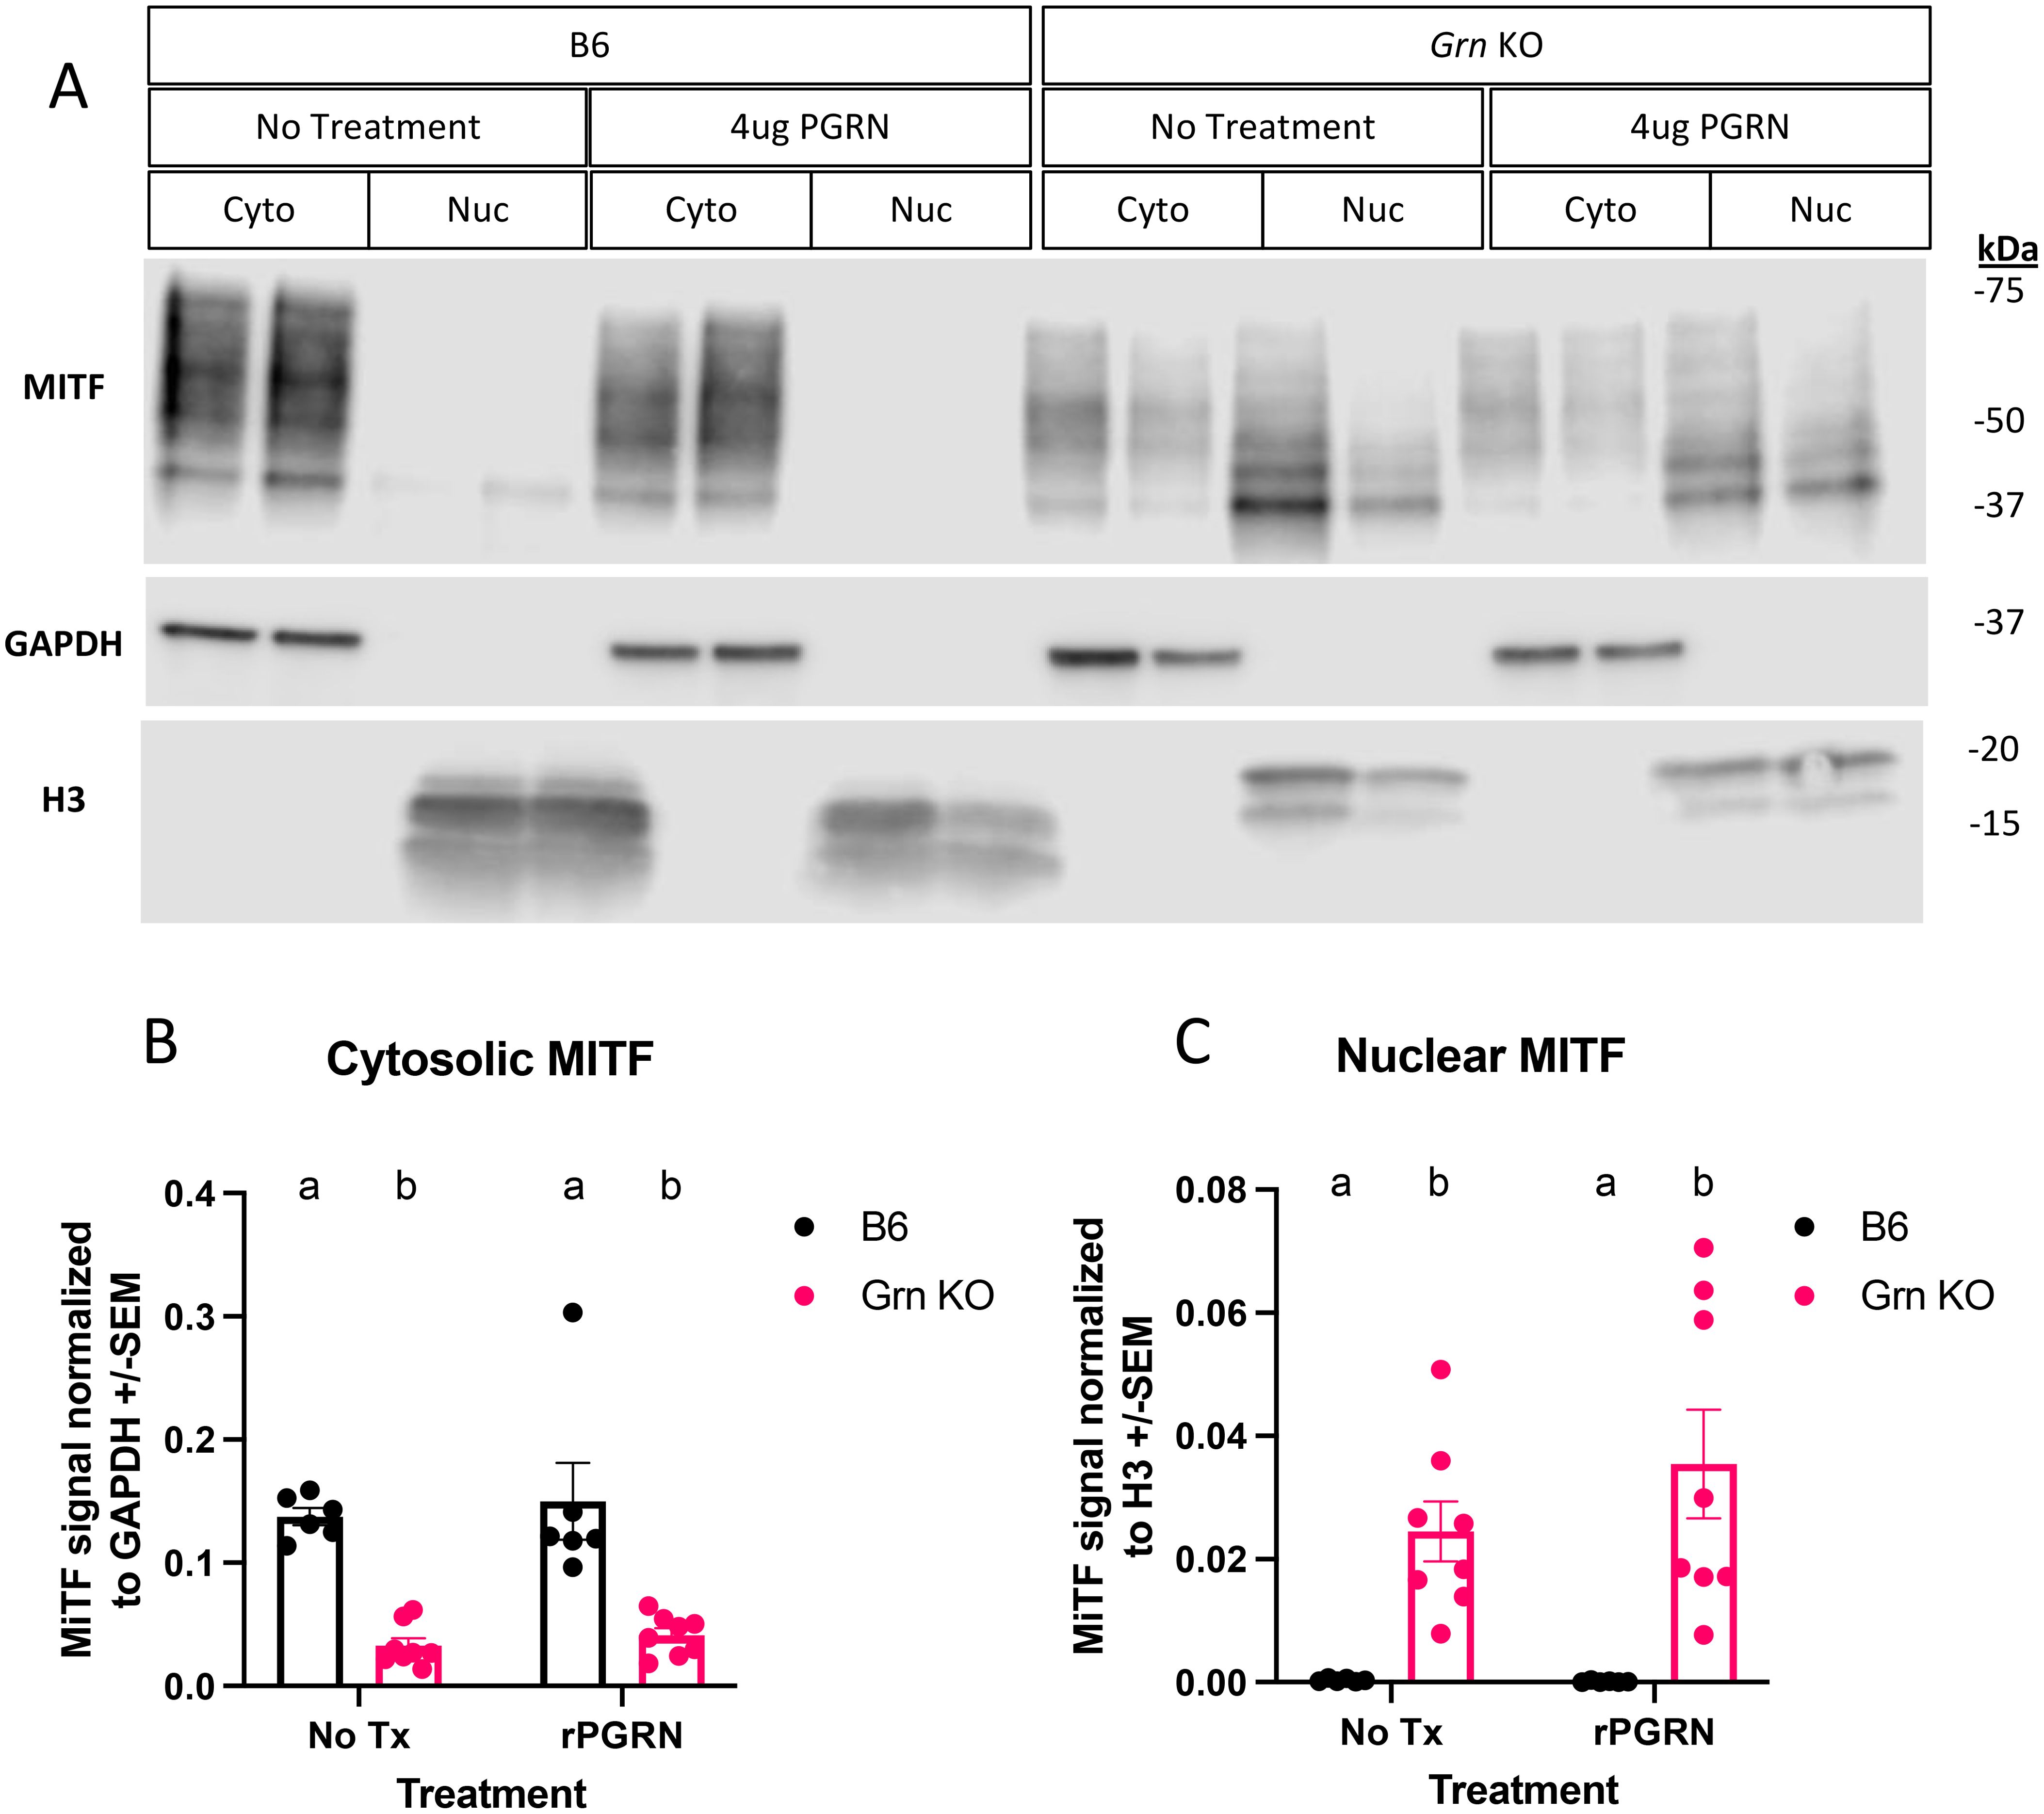
Figure 4. MITF localization is primarily nuclear in Grn KO pMacs and unresponsive to progranulin re-addition. (A) Representative western blot images of MITF, GAPDH, and H3 from B6 and Grn KO pMacs with and without 48 hours of 4ug/mL of recombinant progranulin treatment. (B) Quantification of MITF signal normalized to GAPDH signal. (C) Quantification of MITF signal normalized to H3 signal. Two-way ANOVA with Sidak’s multiple comparisons test, n = 6 per genotype, bars represent mean +/- SEM. Groups that share the same letter are not significantly different from one another.
This lack of MITF rescue was initially surprising, but to better understand the underlying dynamics, we performed western blot analysis for progranulin itself on the cohort of pMacs treated with recombinant progranulin (Figure 5). In the 48 hours following the re-addition of progranulin, both sexes of Grn KO pMacs have almost completely degraded the input progranulin and show little signal beyond background in the no treatment group (Figures 5A–D). In contrast, the female B6 pMacs that were treated with exogenous progranulin have significantly elevated cytosolic progranulin levels (Figures 5A, C). B6 male pMacs given exogenous progranulin had no significant change from the no treatment baseline (Figures 5B, D). The lack of MITF rescue in the Grn KO pMacs (Figure 3, Figure 4) correlates with the lack of available intact progranulin (Figure 5). While GPNMB was rescued with 48 hours of recombinant progranulin treatment (Figure 3), the timepoint and/or dose of progranulin was insufficient to demonstrate a progranulin-mediated rescue in MITF localization in Grn KO pMacs (Figures 4, 5).
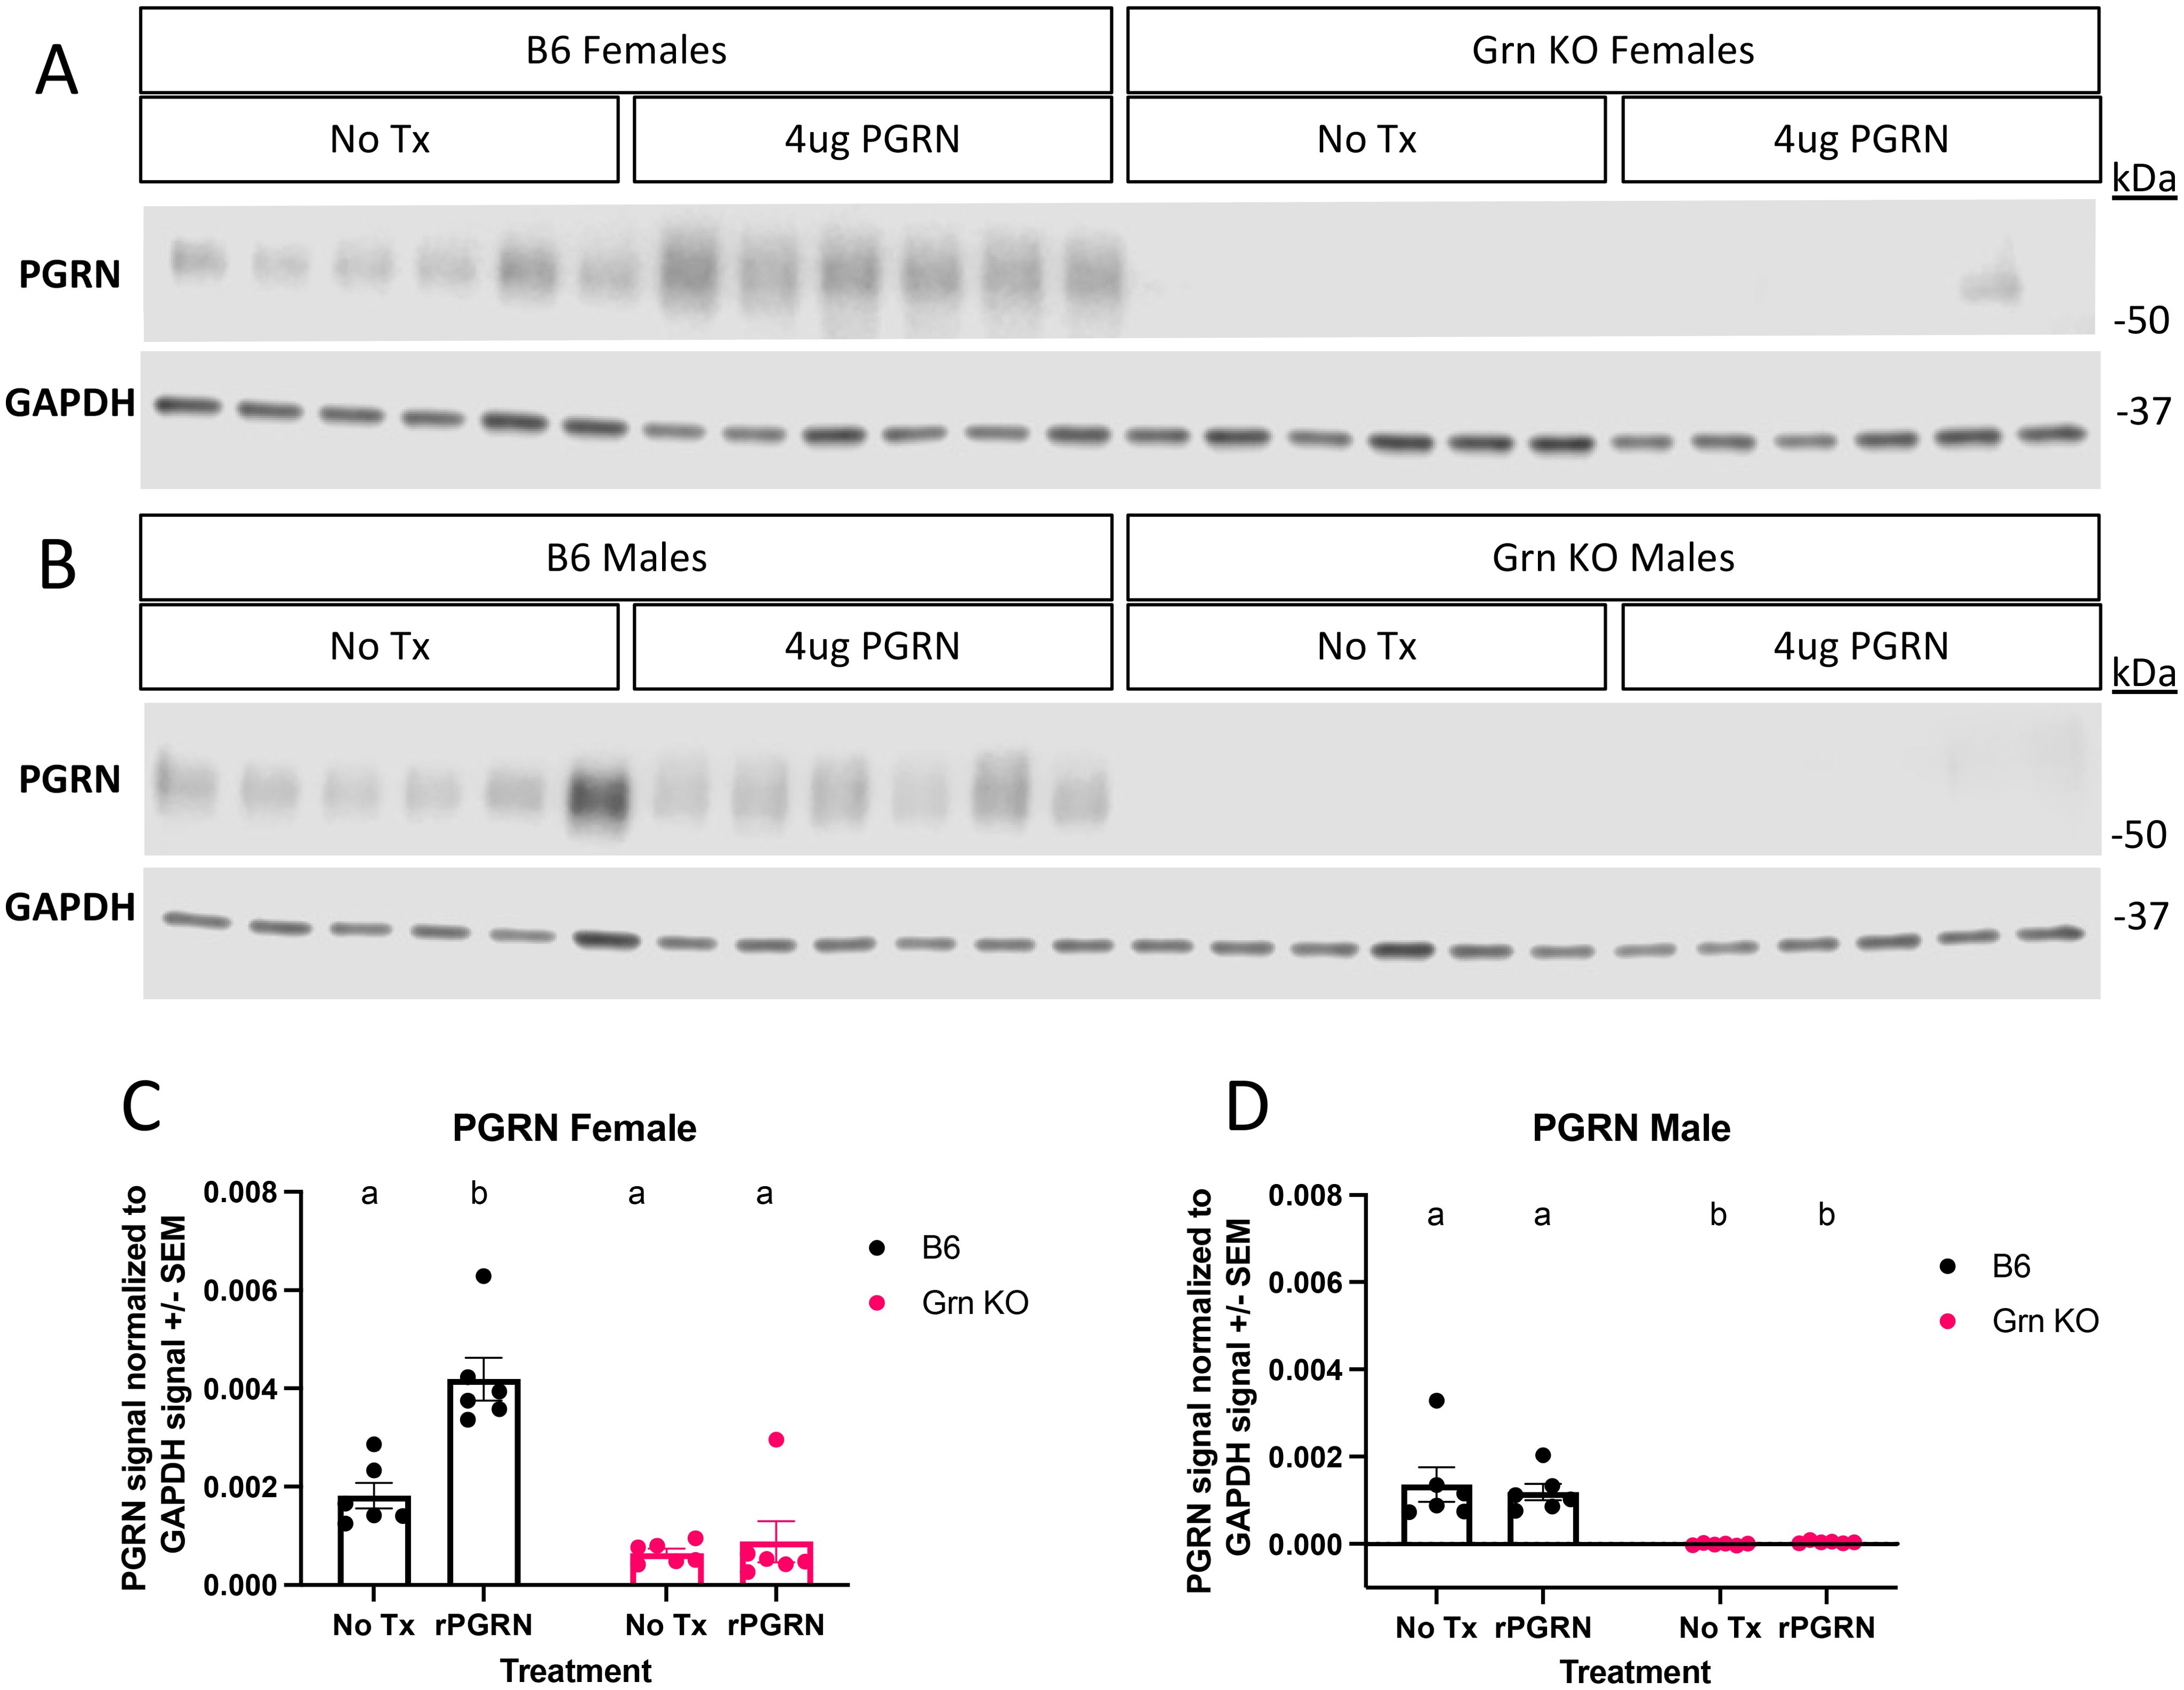
Figure 5. Recombinant progranulin is processed with faster kinetics in Grn KO pMacs relative to WT pMacs. (A) Representative western blot images of PGRN and GAPDH signal from pMacs collected from female B6 and Grn KO with and without 48 hours of 4ug/mL of recombinant progranulin treatment. (B) Representative western blot images of PGRN and GAPDH signal from pMacs collected from male B6 and Grn KO with and without 48 hours of 4ug/mL of recombinant progranulin treatment. (C) Quantification of PGRN signal normalized to GAPDH signal from female B6 and Grn KO pMacs with and without 48 hours of 4ug/mL recombinant progranulin treatment. (D) Quantification of PGRN signal normalized to GAPDH signal from male B6 and Grn KO pMacs with and without 48 hours of 4ug/mL recombinant progranulin treatment. Two-way ANOVA with Sidak’s multiple comparison test, n=6 per genotype, per treatment, bars represent mean +/-SEM. Groups that share the same letter are not significantly different from one another.
3.5 MITF-inhibition does not rescue the GPNMB phenotype in Grn KO pMacs
The lack of significant effect of recombinant progranulin on MITF localization in pMacs prompted us to question the involvement of MITF in the regulation of GPNMB in this model. To investigate this further, we treated pMacs with an MITF inhibitor, ML329, for 24 hours prior to lysate collection. Western blot analysis indicated that, relative to DMSO vehicle control, neither dose of ML329 significantly changed the abundance of GPNMB in any genotype or sex within 24 hours of addition (Figures 6A–D). However, to rule out the possibility that the half-life of GPNMB in an unstimulated state was longer than 24 hours, we repeated the experiment by treating with 5uM of ML329 for either 24 or 48 hours, collecting RNA and probing for changes in Gpnmb and, a CLEAR gene control, Ctsd mRNA via qPCR. At 24 hours of 5uM ML329 treatment, Gpnmb transcript levels were appreciably decreased but did not reach the threshold of statistical significance relative to DMSO vehicle control, with the exception of Grn KO males (Figures 6E, F). However, at the 48-hour timepoint, Gpnmb transcript levels were comparable to vehicle control levels in all groups (Figures 6E, F). For Cstd transcription, ML329 had no significant effect on B6 pMacs, but did have a significant decrease in Ctsd transcription in Grn KO pMacs with 24 hours of treatment (Figures 6G, H). At 48 hours of treatment, Grn KO pMacs isolated from female mice had levels of Ctsd expression insignificantly different from vehicle controls, but Grn KO pMacs isolated from males showed further decrease Ctsd transcripts. Together, these data suggest MITF activity may contribute to the GPNMB phenotype in Grn KO pMacs but is ultimately not required for the increased GPNMB expression in the absence of progranulin, suggesting redundancy in the regulatory cascade of GPNMB production and other CLEAR genes.
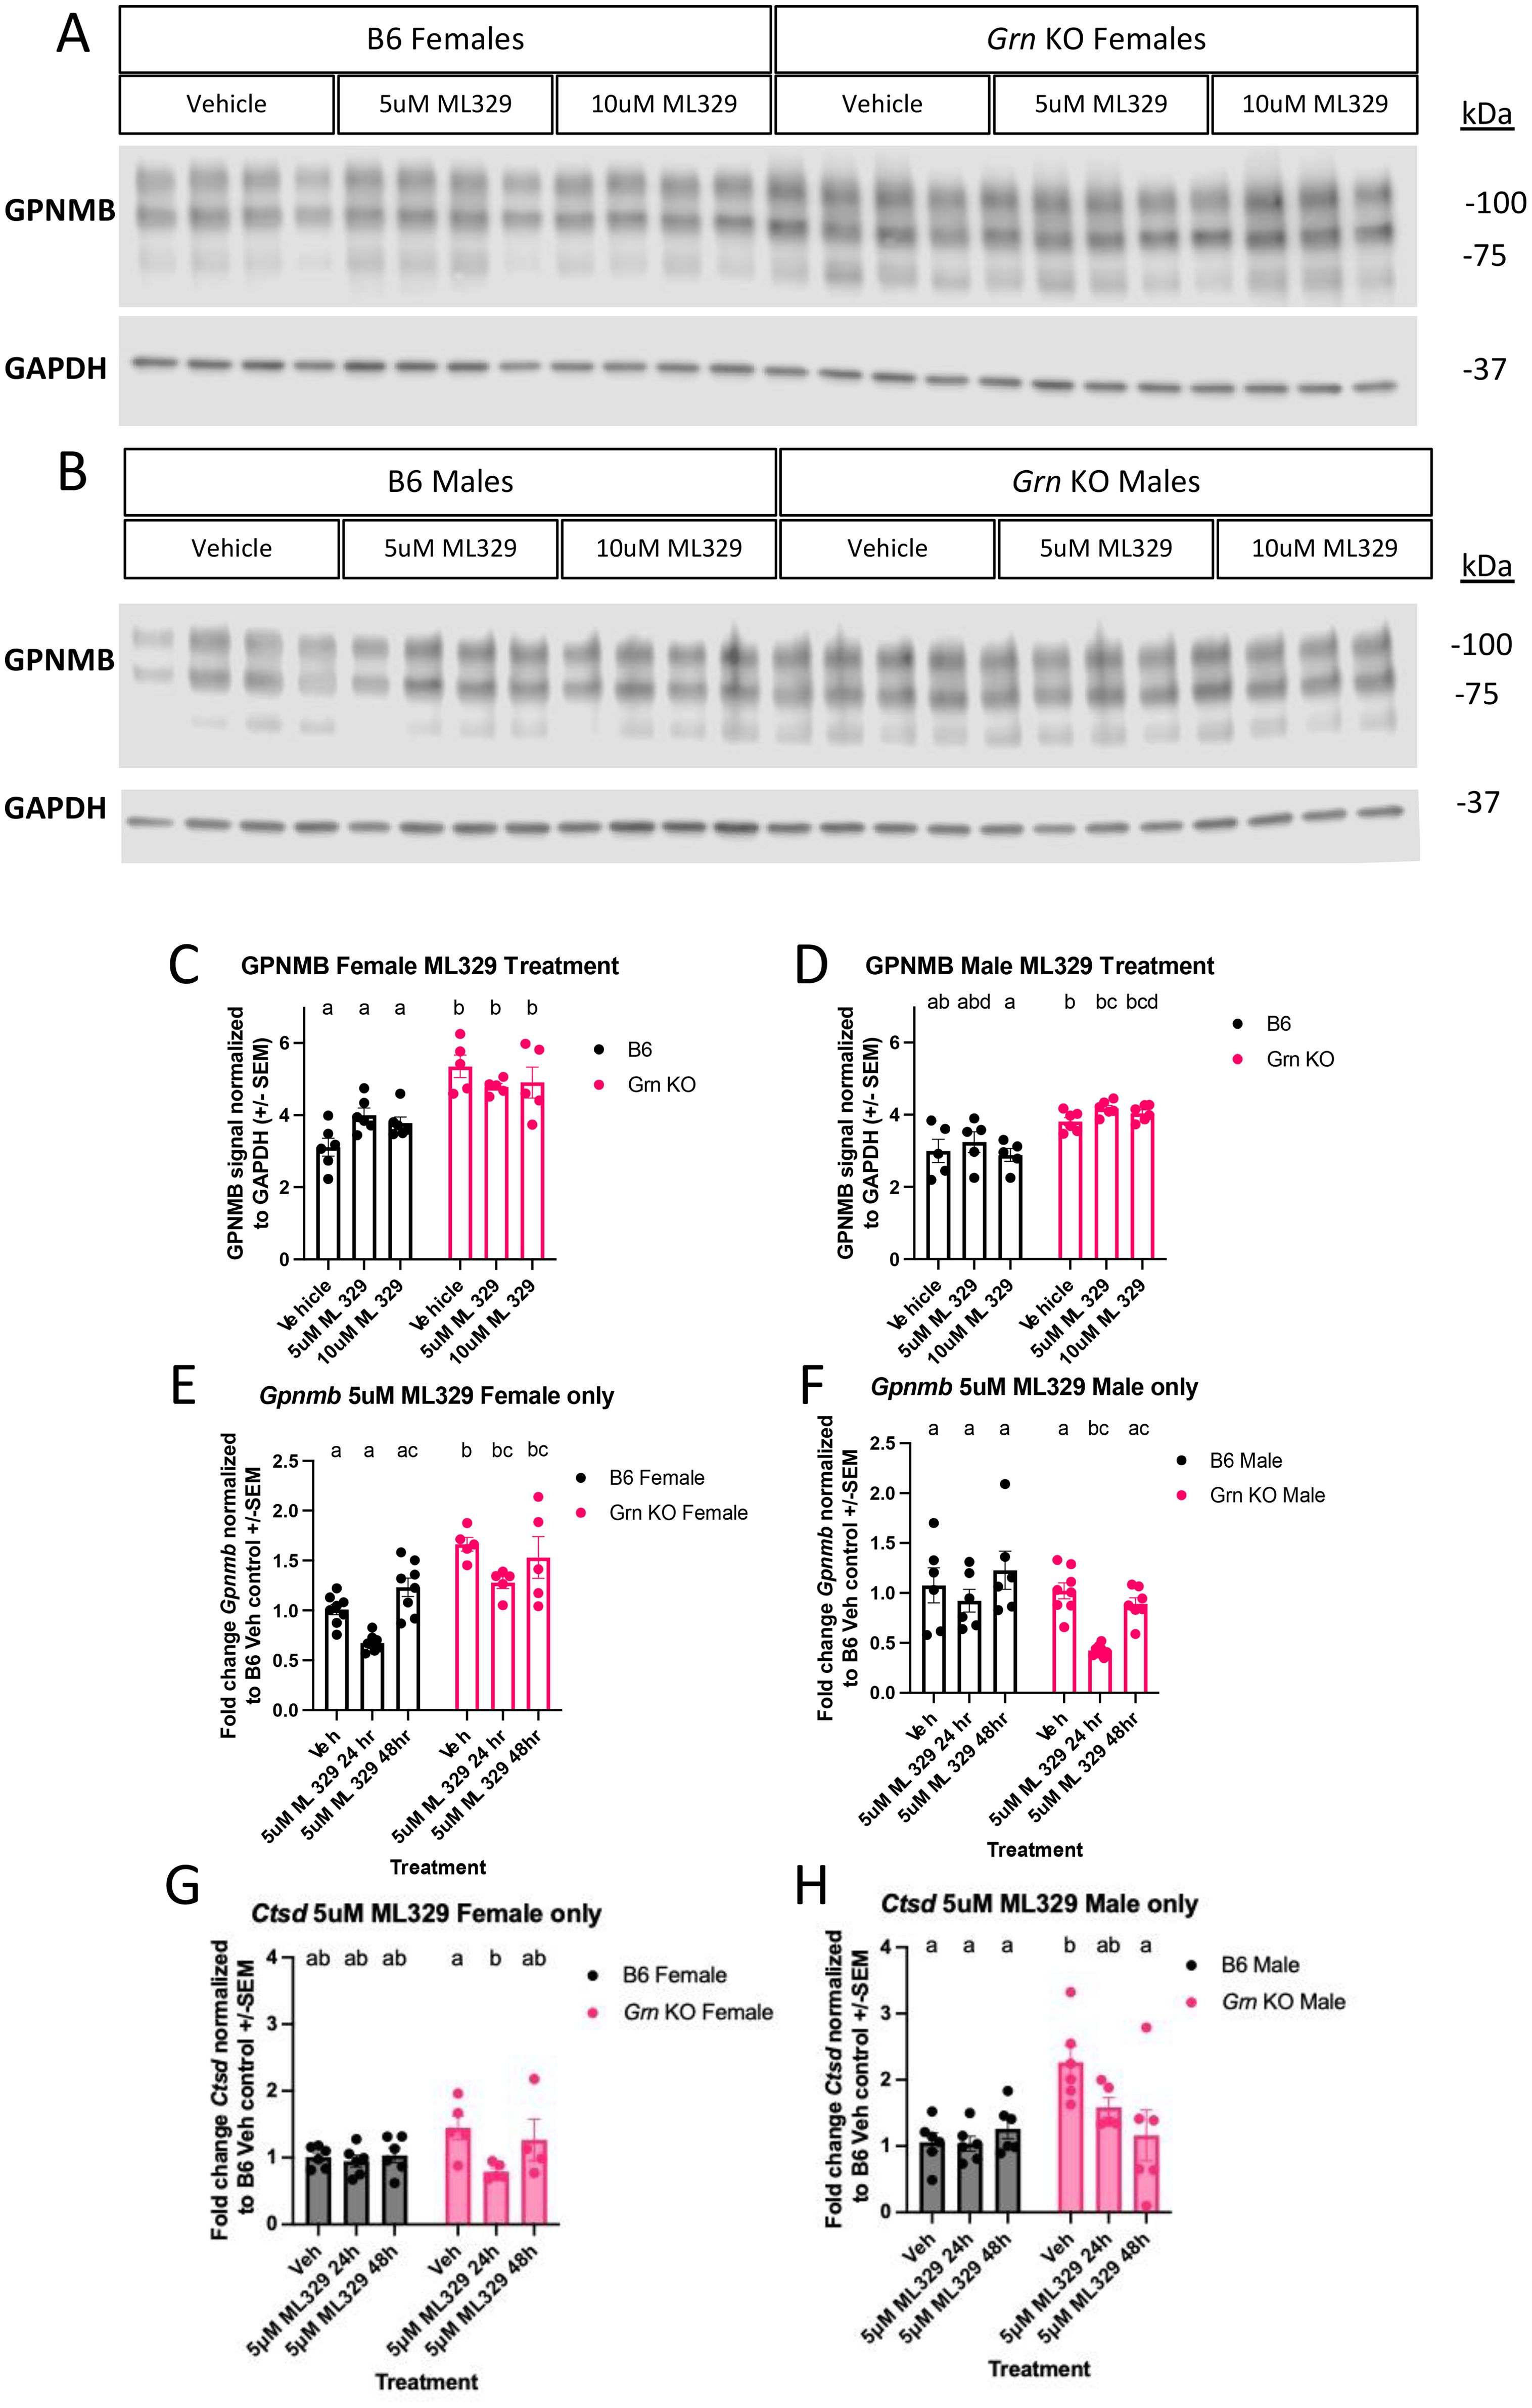
Figure 6. Inhibition of MITF activity alone does not rescue the overproduction of GPNMB transcript or protein in Grn KO pMacs (A) Representative western blot images of B6 and Grn KO female pMacs treated with vehicle (DMSO), 5uM, or 10uM of ML329 for 24 hours. (B) Representative western blot images of B6 and Grn KO male pMacs treated with vehicle (DMSO), 5uM, or 10uM of ML329 for 24 hours. (C) Quantification of GPNMB signal normalized to GAPDH from female pMacs, n=-5-6 per genotype and treatment. Two-way ANOVA with Sidak’s multiple comparisons test. (D) Quantification of GPNMB signal normalized to GAPDH from male pMacs, n=-5-6 per genotype and treatment, bars represent mean +/- SEM. Two-way ANOVA with Sidak’s multiple comparisons test. (E) qPCR for Gpnmb expression in female B6 and Grn KO pMacs, n=5-8 per genotype per treatment. (F) qPCR for Gpnmb expression in male B6 and Grn KO pMacs, n=5-8 per genotype per treatment, bars represent mean +/-SEM. Two-way ANOVA with Sidak’s multiple comparisons test. (G) qPCR for Ctsd expression in female B6 and Grn KO pMacs, n=5-8 per genotype per treatment, bars represent mean +/-SEM. (H) qPCR for Ctsd expression in male B6 and Grn KO pMacs, n=5-8 per genotype per treatment, bars represent mean +/-SEM. Two-way ANOVA with Sidak’s multiple comparisons test. Groups that share the same letter are not significantly different from one another.
4 Discussion
Overall, our work demonstrates, for the first time, that GPNMB is dysregulated in peripheral macrophages in the absence of progranulin at a significantly earlier time point than previously reported for its dysregulation in the CNS in proganulin-deficient mice. Furthermore, our findings reveal that this increase in GPNMB is driven by increased expression of Gpnmb transcript and dynamically regulated by progranulin levels. Finally, we report another novel finding involving MITF dysregulation in Grn KO pMacs that correlates with, but does not appear to be required for, the dysregulated expression of GPNMB in progranulin-deficiency. Taken together, these data demonstrate the vital role of progranulin in modulating the peripheral immune environment and also raise the interesting possibility that events in the periphery may pre-empt those in the CNS in progranulin-deficient states. These findings provide new insight into the mechanisms involved in dysregulation of central-peripheral neuroimmune crosstalk and may represent unique opportunities for early intervention by targeting the periphery to delay or prevent dysregulation in the CNS.
First, the studies presented herein not only confirm the phenotype of increased GPNMB expression in progranulin-deficient myeloid cells reported previously (24) but also extend these observations into the peripheral immune system, revealing increases in GPNMB at a significantly earlier time point than previously reported for microglia in the CNS. Additionally, our data demonstrate that this increase is a dynamic and possibly compensatory response to insufficient progranulin levels that is able to be resolved with restoration of sufficient progranulin treatment and also results in a significant increase in the concentration of the soluble signaling fragment generated from GPNMB (GPNMB ECF) which has been reported to have anti-inflammatory effects (27, 28). Therefore, to investigate the potential effects of elevated GPNMB ECF on macrophage behaviour in response to the loss of progranulin expression, we adapted a paradigm involving pre-treatment with a recombinant fragment of the extracellular domain of GPNMB (GPNMB ECD) prior to LPS stimulation (28). First, when comparing the effects of LPS stimulation to LPS-untreated controls, we found that Grn KO pMacs overall contained reduced transcripts for classic inflammatory genes relative to B6 pMacs. This may seem counterintuitive, as progranulin is typically associated with anti-inflammatory effects, and previously published results suggest increased expression of inflammatory genes in response to LPS-stimulation, but caution is advised with interpreting an early snapshot of the inflammatory cascade as an accurate representation of the integrated immune response. Specifically, robust inflammatory responses are necessary to maintain organismal health but requires strict regulation to prevent deleterious outcomes. In our view, this lagging response to LPS stimulation in the Grn KO pMacs is an indication of the dysfunction related to insufficient progranulin levels.
It’s possible that the lack of sufficient progranulin resulted in altered inflammatory dynamics, where the peak of inflammation is at a later point in LPS stimulation, and Grn KO pMacs do generate more inflammatory markers than B6. Alternatively, it’s possible that insufficient progranulin levels prevents or modifies the regulation of inflammation, and while Grn KO pMacs do not have a higher expression of inflammatory genes than B6 pMacs at any specific point, the aggregate expression of inflammatory genes is greater in the Grn KO relative to the B6. An additional factor to consider is the method of generating pMacs for study. Macrophage biologists typically utilize bone marrow derived macrophages (BMDMs) or pMacs for ex vivo assessment of the innate immune system. We used thioglycolate-elicited pMacs for our work to increase macrophage yield in the peritoneum which can then be harvested without the need for further differentiation ex vivo, an advantage over the use of BMDMs, whereby bone marrow is isolated from mouse femurs, and stem cells are further differentiated in culture to macrophages with major colony stimulation factor (M-CSF) or conditioned media from the mouse fibroblast cell line L929 (20, 38). pMacs therefore provide a readout of the responsiveness of the innate immune system in the background of the animal from which they are isolated, of particular importance for knockout or genetically modified animals when assessing effects of genotype at different ages (39). Differences between our results and other published results are likely the result of different methods of macrophage isolation and culturing as well as differences in the dose and duration of LPS stimulation.
Next, pre-treatment of B6 pMacs with GPNMB ECD prior to LPS stimulation achieved a blunting of select pro-inflammatory genes like Il-1b in both sexes. Other early inflammatory genes did not appear to be significantly affected by the GPNMB ECD pre-treatment in B6 pMacs, but it is known that peak expression for inflammatory genes following LPS treatment or an immune challenge differ significantly (40, 41), so a single time point is insufficient to make a definitive conclusion about the possible effects that GPNMB ECD pre-treatment may have on the kinetics of inflammatory gene expression. In contrast, there was no significant effect of GPNMB ECD pre-treatment in Grn KO pMacs with or without LPS challenge. However, we found that Grn KO pMacs generate significantly more GPNMB ECF than B6 pMacs while at rest; therefore, it is possible that the GPNMB ECF generated into the culture media between the time the cells were plated and the beginning of the stimulation paradigm affected this response and should be taken into account in the interpretation of the effects of exogenously added GPNMB ECF on inflammatory genes generated following LPS stimulation. It is possible that this inevitable “pre-pre-treatment” desensitized the Grn KO pMacs to any possible further response to additional GPNMB ECD administered during the LPS stimulation paradigm. Additionally, this effect may be responsible for the diminished inflammatory responses noted in Grn KO pMacs. Future studies will focus on addressing these and other possibilities.
Importantly, we successfully demonstrate that progranulin re-addition is sufficient to rescue the increase in GPNMB protein in Grn KO pMacs, but we ruled out that normalization of MITF activity is required for this rescue. Specifically, based on previous work highlighting the role of MITF in driving the expression of CLEAR genes and the ability of MITF to drive GPNMB expression in dendritic cells, we sought to test the hypothesis that MITF was involved in the rescue mechanism. In support of our hypothesis, we found clear differences in the basal regulation of MITF in B6 versus Grn KO pMacs. Specifically, western blots of cytosolic and nuclear fractions revealed a clear and significant decrease in cytosolic MITF and a corresponding increase in nuclear MITF in Grn KO pMacs relative to B6 controls. We interpret this to represent altered MITF regulation in Grn KO pMacs. To further interrogate the involvement of MITF in the progranulin-mediated rescue of GPNMB expression, we then compared the baseline fractions to fractions taken from B6 and Grn KO pMacs treated with recombinant mouse progranulin. The same treatment was able to rescue the GPNMB phenotype in Grn KO pMacs, but there was no significant shift in the ratio of nuclear or cytosolic MITF in Grn KO pMacs that received the same treatment, suggesting that although MITF may be involved in the rescue, translocation of MITF is not required to mediate the progranulin-mediated reduction in GPNMB expression. Therefore, the precise mechanism behind this rescue remains unclear, but there may be several reasons for this outcome. First, it is possible that 48 hours of 4ug/mL of progranulin treatment was not a sufficient length of time or dose of progranulin to allow significant clearance of MITF from the nucleus, and/or progranulin re-addition may have only affected the activity of MITF rather than its abundance and subcellular localization. We also showed that treatment with an MITF inhibitor was insufficient to significantly change the amount of GPNMB protein in both B6 and Grn KO pMacs within 24 hours. Further investigation into ML329 treatment showed that 24 hours of 5uM significantly decreased Gpnmb transcript abundance relative to vehicle control in Grn KO males, with smaller, insignificant effects appreciable in other groups at the same timepoint. However, 48 hours with 5uM ML329 did not significantly alter Gpnmb transcript in any group. To provide more context about the effect of ML329, we also measured cathepsin D transcript expression in both B6 and Grn KO pMacs. The vehicle controls show that Grn KO males have increased Ctsd transcript abundance relative to vehicle treated B6 male pMacs, while vehicle treated female pMacs show no significant difference regardless of genotype. 24 hours of ML329 treatment had a significant decrease in Ctsd transcripts in both male and female Grn KO pMacs with no significant change in B6 pMacs. 48 hours of ML329 treatment, however, showed differences between male and female Grn KO pMacs, where males continue to have decreased Ctsd transcript abundance, but females return to vehicle control levels. This suggests that MITF may contribute to Gpnmb transcription, and possibly other CLEAR genes, but is not required. This also suggests that there are other mechanisms that regulate Gpnmb transcription as 48 hours of the same concentration of ML329 had higher Gpnmb transcript levels than 24 hours of ML329 treatment. Further investigation using Cut&Run analysis of MITF-bound genes would provide deeper insight into MITF activity in pMacs in both the presence or absence of progranulin. In addition, future studies will focus on investigating involvement of other TFEB family proteins in this process.
Throughout this work, we have reported differences between genotypes, but we also demonstrate some appreciable differences with sex. This highlights one of the strengths of using pMacs differentiated within the host animal, and ongoing research is investigating functional outcomes of the GPNMB phenotype in progranulin-deficient macrophages with respect to sex. Presently, our findings represent a significant contribution to discovering additional early-stage dysregulated proteins (GPNMB and MITF) in progranulin-deficient peripheral immune cells which have known contributions to peripheral immune cell activity. GPNMB has been demonstrated to impact macrophage and T cell activity (29, 30, 42) and while the mechanism(s) are unclear, GPNMB has been previously associated with risk for PD (18, 43) and, with some controversy, found to be increased in AD patients and mouse models of AD (44–48). MITF also has significant association to immune cells. Multiple co-factors and transcription factors, including PU.1, and NFATc1, interact with MITF, influencing the differentiation of immune cells (49–51). Elucidating the consequences of the dysregulation of MITF and perhaps other TFEB family factors on the composition and integrity of progranulin-deficient peripheral immune cell populations is a novel avenue of research that will permit further insight into the role of central-peripheral crosstalk in neurodegenerative diseases.
Data availability statement
The raw data supporting the conclusions of this article will be made available by the authors, without undue reservation.
Ethics statement
The animal study was approved by International Animal Care and Use Committee at the University of Florida. The study was conducted in accordance with the local legislation and institutional requirements.
Author contributions
DG: Writing – original draft, Writing – review & editing, Formal Analysis, Methodology. NN: Writing – original draft, Writing – review & editing, Methodology, Resources. CC: Writing – original draft, Writing – review & editing, Methodology, Resources. RW: Writing – original draft, Writing – review & editing, Supervision. MT: Writing – original draft, Writing – review & editing, Funding acquisition, Supervision.
Funding
The author(s) declare that financial support was received for the research, authorship, and/or publication of this article. The authors are supported by Grant RF1NS28800 from the National Institute of Health and the National Institute of Neurological Disorders and Stroke (MT), and an Alzheimer’s disease and related dementias (ADRD) teaching fellowship funded by the National Institute of Health (T32AG061892) at the University of Florida (DG).
Acknowledgments
The authors would like to acknowledge our lab manager, Jenny Holt, for her technical assistance. Portions of this content have been released as a pre-print (52).
Conflict of interest
The authors declare that the research was conducted in the absence of any commercial or financial relationships that could be construed as a potential conflict of interest.
Publisher’s note
All claims expressed in this article are solely those of the authors and do not necessarily represent those of their affiliated organizations, or those of the publisher, the editors and the reviewers. Any product that may be evaluated in this article, or claim that may be made by its manufacturer, is not guaranteed or endorsed by the publisher.
References
1. Hrabal R, Chen Z, James S, Bennett HP, Ni F. The hairpin stack fold, a novel protein architecture for a new family of protein growth factors. Nat Struct Mol Biol. (1996) 3:747–52. doi: 10.1038/nsb0996-747
2. Zhou X, Sullivan PM, Sun L, Hu F. The interaction between progranulin and prosaposin is mediated by granulins and the linker region between saposin B and C. J Neurochemistry. (2017) 143:236–43. doi: 10.1111/jnc.2017.143.issue-2
3. Nguyen A, Nguyen T, Cenik B, Yu G, Herz J, TC W, et al. Secreted progranulin is a homodimer and is not a component of high density lipoproteins (HDL). J Biol Chem. (2013) 288:8627–35. doi: 10.1074/jbc.M112.441949
4. Ahmed Z, Sheng H, Xu Y, Lin WL, Innes AE, Gass J, et al. Accelerated lipofuscinosis and ubiquitination in granulin knockout mice suggest a role for progranulin in successful aging. Am J Pathology. (2010) 177:311–24. doi: 10.2353/ajpath.2010.090915
5. Galimberti D, Fumagalli G, Fenoglio C, Cioffi S, Arighi A, Serpente M, et al. Progranulin plasma levels predict the presence of GRN mutations in asymptomatic subjects and do not correlate with brain atrophy: results from the GENFI study. Neurobiol Aging. (2018) 62:245.e9–12. doi: 10.1016/j.neurobiolaging.2017.10.016
6. Sellami L, Rucheton B, Ben Younes I, Camuzat A, Saracino D, Rinaldi D, et al. Plasma progranulin levels for frontotemporal dementia in clinical practice: a 10-year French experience. Neurobiol Aging. (2020) 91:167.e1–9. doi: 10.1016/j.neurobiolaging.2020.02.014
7. Lee WC, Almeida S, Prudencio M, Caulfield TR, Zhang YJ, Tay WM, et al. Targeted manipulation of the sortilin–progranulin axis rescues progranulin haploinsufficiency. Hum Mol Genet. (2013) 23:1467–78. doi: 10.1093/hmg/ddt534
8. Baker M, Mackenzie IR, Pickering-Brown SM, Gass J, Rademakers R, Lindholm C, et al. Mutations in progranulin cause tau-negative frontotemporal dementia linked to chromosome 17. Nature. (2006) 442:916–9. doi: 10.1038/nature05016
9. Cruts M, Gijselinck I, van der Zee J, Engelborghs S, Wils H, Pirici D, et al. Null mutations in progranulin cause ubiquitin-positive frontotemporal dementia linked to chromosome 17q21. Nature. (2006) 442:920–4. doi: 10.1038/nature05017
10. Nalls MA, Blauwendraat C, Sargent L, Vitale D, Leonard H, Iwaki H, et al. Evidence for GRN connecting multiple neurodegenerative diseases. Brain Commun. (2021) 3. doi: 10.1093/braincomms/fcab095
11. Brouwers N, Nuytemans K, van der Zee J, Engelborghs S, Theuns J, Kumar-Singh S, et al. Alzheimer and parkinson diagnoses in progranulin null mutation carriers in an extended founder family. Arch neurology. (2007) 64(10):1436–6. doi: 10.1001/archneur.64.10.1436
12. Brouwers N, Sleegers K, Engelborghs S, Maurer-Stroh S, Gijselinck I, van der Zee J, et al. Genetic variability in progranulin contributes to risk for clinically diagnosed Alzheimer disease. Neurology. (2008) 71:656–64. doi: 10.1212/01.wnl.0000319688.89790.7a
13. Cortini F, Fenoglio C, Guidi I, Venturelli E, Pomati S, Marcone A, et al. Novel exon 1 progranulin gene variant in Alzheimer’s disease. Eur J Neurology. (2008) 15:1111–7. doi: 10.1111/j.1468-1331.2008.02266.x
14. Fenoglio C, Galimberti D, Cortini F, Kauwe JSK, Cruchaga C, Venturelli E, et al. Rs5848 variant influences GRN mRNA levels in brain and peripheral mononuclear cells in patients with alzheimer’s disease. J Alzheimer’s Disease. (2009) 18:603–12. doi: 10.3233/JAD-2009-1170
15. Kämäläinen A, Viswanathan J, Natunen T, Helisalmi S, Kauppinen T, Pikkarainen M, et al. GRN variant rs5848 reduces plasma and brain levels of granulin in alzheimer’s disease patients. J Alzheimer’s Disease. (2012) 33:23–7. doi: 10.3233/JAD-2012-120946
16. Lee MJ, Chen TF, Cheng TH, Chiu MJ. rs5848 variant of progranulin gene is a risk of alzheimer’s disease in the Taiwanese population. Neurodegenerative Diseases. (2011) 8:216–20. doi: 10.1159/000322538
17. Leverenz JB, Yu CE, Montine TJ, Steinbart E, Bekris LM, Zabetian C, et al. A novel progranulin mutation associated with variable clinical presentation and tau, TDP43 and alpha-synuclein pathology. Brain. (2007) 130:1360–74. doi: 10.1093/brain/awm069
18. Chen Y, Li S, Su L, Sheng J, Wen L, Chen G, et al. Association of progranulin polymorphism rs5848 with neurodegenerative diseases: a meta-analysis. J Neurology. (2015) 262:814–22. doi: 10.1007/s00415-014-7630-2
19. Ljubenkov PA, Miller ZA, Mumford P, Zhang J, Allen IE, Mitic LL, et al. Peripheral innate immune activation correlates with disease severity in GRN haploinsufficiency. Front Neurology. (2019) 10. doi: 10.3389/fneur.2019.01004
20. Yin F, Banerjee R, Thomas B, Zhou P, Qian L, Jia T, et al. Exaggerated inflammation, impaired host defense, and neuropathology in progranulin-deficient mice. J Exp Med. (2009) 207:117–28. doi: 10.1084/jem.20091568
21. Sun S, Zhou J, Li Z, Wu Y, Wang H, Zheng Q, et al. Progranulin promotes hippocampal neurogenesis and alleviates anxiety-like behavior and cognitive impairment in adult mice subjected to cerebral ischemia. CNS Neurosci Ther. (2022) 28:775–87. https://www.ncbi.nlm.nih.gov/pmc/articles/PMC8981488/.
22. Menzel L, Kleber L, Friedrich C, Hummel R, Dangel L, Winter J, et al. Progranulin protects against exaggerated axonal injury and astrogliosis following traumatic brain injury. Glia. (2016) 65:278–92. doi: 10.1002/glia.23091
23. Martens LH, Zhang J, Barmada SJ, Zhou P, Kamiya S, Sun B, et al. Progranulin deficiency promotes neuroinflammation and neuron loss following toxin-induced injury. J Clin Invest. (2012) 122:3955–9. doi: 10.1172/JCI63113
24. Huang M, Modeste E, Dammer E, Merino P, Taylor G, Duong DM, et al. Network analysis of the progranulin-deficient mouse brain proteome reveals pathogenic mechanisms shared in human frontotemporal dementia caused by GRN mutations. Acta Neuropathologica Commun. (2020) 8. doi: 10.1186/s40478-020-01037-x
25. Weterman MAJ, Ajubi N, van Dinter IMR, Degen WGJ, van Muijen GNP, Ruiter DJ, et al. nmb, a novel gene, is expressed in low-metastatic human melanoma cell lines and xenografts. Int J Cancer. (1995) 60:73–81. doi: 10.1002/ijc.2910600111
26. Rose AAN, Annis MG, Dong Z, Pepin F, Hallett M, Park M, et al. ADAM10 releases a soluble form of the GPNMB/osteoactivin extracellular domain with angiogenic properties. PLoS One. (2010) 5:e12093. doi: 10.1371/journal.pone.0012093
27. Liguori M, Digifico E, Vacchini A, Avigni R, Colombo F, Borroni EM, et al. The soluble glycoprotein NMB (GPNMB) produced by macrophages induces cancer stemness and metastasis via CD44 and IL-33. Cell Mol Immunol. (2020) 18:711–22. doi: 10.1038/s41423-020-0501-0
28. Prabata A, Ikeda K, Rahardini EP, Hirata KI, Emoto N. GPNMB plays a protective role against obesity-related metabolic disorders by reducing macrophage inflammatory capacity. J Biol Chem. (2021) 297:101232. doi: 10.1016/j.jbc.2021.101232
29. Chung J, Sato K, Dougherty I, Cruz PD, Ariizumi K. DC-HIL is a negative regulator of T lymphocyte activation. Blood. (2007) 109:4320–7. doi: 10.1182/blood-2006-11-053769
30. Ramani V, Chung JS, Ariizumi K, Cruz PD. Soluble DC-HIL/gpnmb modulates T-lymphocyte extravasation to inflamed skin. J Invest Dermatol. (2022) 142:1372–1380.e5. doi: 10.1016/j.jid.2021.10.004
31. Li B, Castano AP, Hudson TE, Nowlin BT, Lin SL, Bonventre JV, et al. The melanoma-associated transmembrane glycoprotein Gpnmb controls trafficking of cellular debris for degradation and is essential for tissue repair. FASEB J. (2010) 24:4767–81. doi: 10.1096/fj.10-154757
32. Gutknecht M, Geiger J, Joas S, Dörfel D, Salih HR, Müller M, et al. The transcription factor MITF is a critical regulator of GPNMB expression in dendritic cells. Cell Communication Signaling. (2015) 13. doi: 10.1186/s12964-015-0099-5
33. Jones E, Inoki K. Microphthalmia-associated transcription factors activate mTORC1 through RagD GTPase gene expression. Trans Cancer Res. (2017) 6:S1234–8. doi: 10.21037/tcr.2017.09.31
34. Roczniak-Ferguson A, Petit CS, Froehlich F, Qian S, Ky J, Angarola B, et al. The transcription factor TFEB links mTORC1 signaling to transcriptional control of lysosome homeostasis. Sci Signaling. (2012) 5:ra42–2. doi: 10.1126/scisignal.2002790
35. Asrani K, Woo J, Mendes AA, Schaffer E, Vidotto T, Villanueva CR, et al. An mTORC1-mediated negative feedback loop constrains amino acid-induced FLCN-Rag activation in renal cells with TSC2 loss. Nat Commun. (2022) 13:6808. https://pubmed.ncbi.nlm.nih.gov/36357396/.
36. Möller K, Sigurbjornsdottir S, Arnthorsson AO, Pogenberg V, Dilshat R, Fock V, et al. MITF has a central role in regulating starvation-induced autophagy in melanoma. Sci Rep. (2019) 9. doi: 10.1038/s41598-018-37522-6
37. Ripoll VM, Meadows NA, Raggatt LJ, Chang MK, Pettit AR, Cassady AI, et al. Microphthalmia transcription factor regulates the expression of the novel osteoclast factor GPNMB. Gene. (2008) 413:32–41. doi: 10.1016/j.gene.2008.01.014
38. Toda G, Yamauchi T, Kadowaki T, Ueki K. Preparation and culture of bone marrow-derived macrophages from mice for functional analysis. STAR Protoc. (2021) 2:100246. https://www.sciencedirect.com/science/article/pii/S2666166720302331.
39. Zajd CM, Ziemba AM, Miralles GM, Nguyen T, Feustel PJ, Dunn SM, et al. Bone marrow-derived and elicited peritoneal macrophages are not created equal: the questions asked dictate the cell type used. Front Immunol. (2020) 11. doi: 10.3389/fimmu.2020.00269
40. Lesur I, Textoris J, Loriod B, Courbon C, Garcia S, Leone M, et al. Gene expression profiles characterize inflammation stages in the acute lung injury in mice. PLoS One. (2010) 5:e11485. doi: 10.1371/journal.pone.0011485
41. Saban MR, Hellmich HL, Ngoc Bich N, Winston JH, Hammond TG, Saban R. Time course of LPS-induced gene expression in a mouse model of genitourinary inflammation. Physiol Genomics. (2001) 5:147–60. doi: 10.1152/physiolgenomics.2001.5.3.147
42. Xiong A, Zhang J, Chen Y, Zhang Y, Yang F. Integrated single-cell transcriptomic analyses reveal that GPNMB-high macrophages promote PN-MES transition and impede T cell activation in GBM. EBioMedicine. (2022) 83:104239–9. doi: 10.1016/j.ebiom.2022.104239
43. Murthy M, Blauwendraat C, UKBEC, Guelfi S, IPDGC, Hardy J, et al. Increased brain expression of GPNMB is associated with genome wide significant risk for Parkinson’s disease on chromosome 7p15.3. Neurogenetics. (2017) 18:121–33. doi: 10.1007/s10048-017-0514-8
44. Aichholzer F, Klafki HW, Ogorek I, Vogelgsang J, Wiltfang J, Scherbaum N, et al. Evaluation of cerebrospinal fluid glycoprotein NMB (GPNMB) as a potential biomarker for Alzheimer’s disease. Alzheimer’s Res Ther. (2021) 13. doi: 10.1186/s13195-021-00828-1
45. Satoh J, Kino Y, Yanaizu M, Ishida T, Saito Y. Microglia express GPNMB in the brains of Alzheimer’s disease and Nasu-Hakola disease. Intractable Rare Dis Res. (2019) 8:120–8. doi: 10.5582/irdr.2019.01049
46. Hüttenrauch M, Ogorek I, Klafki H, Otto M, Stadelmann C, Weggen S, et al. Glycoprotein NMB: a novel Alzheimer’s disease associated marker expressed in a subset of activated microglia. Acta Neuropathologica Commun. (2018) 6. doi: 10.1186/s40478-018-0612-3
47. Zhu Z, Liu Y, Li X, Zhang L, Liu H, Cui Y, et al. GPNMB mitigates Alzheimer’s disease and enhances autophagy via suppressing the mTOR signal. Neurosci Letters. (2022) 767:136300. doi: 10.1016/j.neulet.2021.136300
48. Wang H, Dey KK, Chen PC, Li Y, Niu M, Cho JH, et al. Integrated analysis of ultra-deep proteomes in cortex, cerebrospinal fluid and serum reveals a mitochondrial signature in Alzheimer’s disease. Mol Neurodegeneration. (2020) 15. doi: 10.1186/s13024-020-00384-6
49. Sharma SM, Bronisz A, Hu R, Patel K, Mansky KC, Sif S, et al. MITF and PU.1 Recruit p38 MAPK and NFATc1 to Target Genes during Osteoclast Differentiation. J Biol Chem. (2007) 282:15921–9. doi: 10.1074/jbc.M609723200
50. Carey HA, Hildreth BE, Samuvel DJ, Thies KA, Rosol TJ, Toribio RE, et al. Eomes partners with PU.1 and MITF to Regulate Transcription Factors Critical for osteoclast differentiation. iScience. (2019) 11:238–45. doi: 10.1016/j.isci.2018.12.018
51. Chopin M, Lun AT, Zhan Y, Schreuder J, Coughlan H, D’Amico A, et al. Transcription factor PU.1 promotes conventional dendritic cell identity and function via induction of transcriptional regulator DC-SCRIPT. Immunity. (2019) 50:77–90.e5. doi: 10.1016/j.immuni.2018.11.010
Keywords: progranulin, GPNMB, MITF, macrophage, inflammation
Citation: Gillett DA, Neighbarger NK, Cole C, Wallings RL and Tansey MG (2024) Investigating the role and regulation of GPNMB in progranulin-deficient macrophages. Front. Immunol. 15:1417836. doi: 10.3389/fimmu.2024.1417836
Received: 15 April 2024; Accepted: 05 September 2024;
Published: 26 September 2024.
Edited by:
Vijay Kumar, Morehouse School of Medicine, United StatesReviewed by:
Andrew Arrant, University of Alabama at Birmingham, United StatesAndrew Nguyen, Saint Louis University, United States
Copyright © 2024 Gillett, Neighbarger, Cole, Wallings and Tansey. This is an open-access article distributed under the terms of the Creative Commons Attribution License (CC BY). The use, distribution or reproduction in other forums is permitted, provided the original author(s) and the copyright owner(s) are credited and that the original publication in this journal is cited, in accordance with accepted academic practice. No use, distribution or reproduction is permitted which does not comply with these terms.
*Correspondence: Malú Gámez Tansey, bWd0YW5zZXlAdWZsLmVkdQ==
†These authors have contributed equally and share last authorship