 Nie Han1†
 Lin Jin
- 1Department of Ultrasound, Guanghua Hospital Affiliated to Shanghai University of Traditional Chinese Medicine, Shanghai, China
- 2Department of Radiology, Guanghua Hospital Affiliated to Shanghai University of Traditional Chinese Medicine, Shanghai, China
- 3Department of Pulmonary Function, Guanghua Hospital Affiliated to Shanghai University of Traditional Chinese Medicine, Shanghai, China
Objectives: Quantitatively assess the severity and predict the mortality of interstitial lung disease (ILD) associated with Rheumatoid arthritis (RA) was a challenge for clinicians. This study aimed to construct a radiomics nomogram based on chest computed tomography (CT) imaging by using the ILD-GAP (gender, age, and pulmonary physiology) index system for clinical management.
Methods: Chest CT images of patients with RA-ILD were retrospectively analyzed and staged using the ILD-GAP index system. The balanced dataset was then divided into training and testing cohorts at a 7:3 ratio. A clinical factor model was created using demographic and serum analysis data, and a radiomics signature was developed from radiomics features extracted from the CT images. Combined with the radiomics signature and independent clinical factors, a nomogram model was established based on the Rad-score and clinical factors. The model capabilities were measured by operating characteristic curves, calibration curves and decision curves analyses.
Results: A total of 177 patients were divided into two groups (Group I, n = 107; Group II, n = 63). Krebs von den Lungen-6, and nineteen radiomics features were used to build the nomogram, which showed favorable calibration and discrimination in the training cohort [AUC, 0.948 (95% CI: 0.910–0.986)] and the testing validation cohort [AUC, 0.923 (95% CI: 0.853–0.993)]. Decision curve analysis demonstrated that the nomogram performed well in terms of clinical usefulness.
Conclusion: The CT-based radiomics nomogram model achieved favorable efficacy in predicting low-risk RA-ILD patients.
1 Introduction
Rheumatoid arthritis (RA) is one of the most immune-mediated diseases that affects 0.5–1% of the global population. It is primarily characterized by joint swelling and tenderness, leading to the destruction of synovial joints (1). Beyond the joints, RA is associated with systemic inflammation that can result in multiple coexisting conditions and extra-articular manifestations (2). Pulmonary involvement is recognized as the most prevalent extra-articular complication in RA, encompassing a broad range of disorders such as airway diseases, pleural effusions, and rheumatoid nodules (3–5). Among these pulmonary complications, interstitial lung disease (ILD) has the highest prevalence (6). Importantly, RA-ILD is a significant cause of mortality among RA patients and contributes to considerable morbidity (7). Consequently, accurately assessing mortality risk associated with RA-ILD is of great clinical significance.
The ILD-GAP (gender, age, and pulmonary physiology) index, initially proposed by Ley et al. in 2012 (8), is a simple scoring system designed to predict mortality risk in patients with idiopathic pulmonary fibrosis. Utilizing variables such as gender, age, predicted forced vital capacity (FVC), and diffusion capacity for carbon monoxide (DLCO), which has been refined and validated for various types of ILD (9). Its accuracy in predicting outcomes for RA-ILD has been confirmed by multiple studies (10–12). However, pulmonary function tests (PFTs) necessitate active participation from patients, such as performing deep breaths or forceful exhalations (13). This can be particularly challenging for special populations, including those with cognitive impairments or concurrent pulmonary conditions, potentially compromising the precision of the test results. To our knowledge, there is an absence of universal, quantitative, non-invasive techniques for the staging of RA-ILD.
The current primary method for diagnosing RA-ILD remains Computed Tomography (CT) scan, owing to its noninvasive and sensitive nature in detecting lung involvement (14, 15). However, there are many features to determine the presence of ILD and inter-reader variability, especially in unexperienced readers, is an issue (16). Visual analysis of ILDs on CT images faces difficulties in providing prognosis information, as various stages of RA-ILD exhibit overlapping imaging features, making the diagnosis and assessment of severity challenging with conventional imaging modalities (17, 18). Radiomics technology, capable of extracting numerous high-dimensional features from CT images, emerges as a solution to address the limitations of visual assessment. Although radiomics has predominantly been explored in the context of various tumors (19, 20), its potential has been demonstrated in identifying the GAP staging of connective tissue disease-associated interstitial lung disease (CTD-ILD) (21, 22). However, ILD associated with different CTDs can be characterized by distinct clinical manifestations, imaging, and pathological features, indicating their unique developmental and regression patterns. In the context of RA-ILD, evidence from a small cohort study suggested that radiomics may hold the potential for predicting mortality (23). However, limited studies are focusing on the application of radiomics in the staging of RA-ILD. Therefore, it is still necessary to explore the discriminative value of radiomics in various stages of RA-ILD.
In this retrospective study, we aimed to establish a novel CT-based radiomics nomogram to differentiate between the different stages of RA-ILD.
2 Materials and methods
2.1 Patients
The study included patients clinically diagnosed with RA-ILD between April 2020 and December 2023 at Guanghua Hospital Affiliated with Shanghai University of Traditional Chinese Medicine. Inclusion criteria comprised patients meeting all of the following conditions: 1) diagnosed with RA according to the 2010 American College of Rheumatology criteria for RA (24); 2) diagnosed with ILD according to the American Thoracic Society, European Respiratory Society, Japanese Respiratory Society, and Latin American Thoracic Society (ATS/ERS/JRS/ALAT) criteria for ILD (25); 3) underwent a CT scan showing signs of ILD within 3 months after clinical diagnosis; and 4) underwent pulmonary function tests and laboratory examination within 30 days before or after the CT scan. Exclusion criteria were applied for patients meeting any of the following conditions: 1) those with pulmonary edema, infection, drug toxicity, allergy tumor, or heart disease; 2) diagnosed with a combination of other types of CTD; 3) incomplete demographic or clinical data. The flowchart of the study subjects is shown in Figure 1.

Figure 1 Flowchart of the patient cohort.
2.2 Pulmonary function test
The routine PFTs were conducted using the Master Screen Diffusion Pulmonary Function Instrument (Eric Jaeger, Germany). The following indicators were assessed: the percentage predicted values (% predicted) of forced expiratory volume in 1 s (FEV1), FVC, total lung capacity (TLC), and DLCO. The ILD-GAP index was calculated in accordance with the method proposed by Ryerson et al. (9). Subsequently, patients were categorized into two groups: Group I comprised patients with an ILD-GAP index ≤1, while Group II included patients with an ILD-GAP index >1.
2.3 CT image acquisition and evaluation
All enrolled patients underwent nonenhanced chest CT examinations using one of two multidetector CT systems: SOMATOM Definition Flash (Siemens Healthcare, Tokyo, Japan) or Access CT (Philips Healthcare, Andover, Massachusetts, USA). The parameters used for CT scanning were as follows: tube voltage of 120 kVp and tube current-time product of 60-220 mAs with automatic dose modulation; detector collimation of 64 × 0.6 mm; rotation time of 1.0 second; and matrix size of 512 × 512. All CT scans were reconstructed with a 1-mm slice thickness and lung convolution kernels. The semiquantitative CT (SQCT) assessment was carried out to calculate Goh score for each CT scan (26). RA-ILD findings from HRCT were classified as UIP or non-UIP patterns following recent IPF guidelines (25).
2.4 Three-dimensional lung segmentation
All image segmentation was executed using 3D Slicer software (version 5.6.1, www.slicer.org). The preprocessing steps were carried out as follows: 1) All CT images were reprocessed using the “Resample Scalar Volume” module by resampling them into 1-mm thick slices and normalizing the intensity values within the range of [–1, 1]. 2) Using the “Radiomics” module, the voxel intensity values were discretized with a fixed bin width of 25 HU to reduce noise and standardize intensity across the images. 3) Z-score normalization was performed on the image gray values to reduce the impact of inconsistent imaging parameters on the variability of radiomics features. 4) The region of interest (ROI) of the bilateral lungs was automatically segmented, encompassing blood vessels and the trachea in the lung lobes (window width = 1,250; window level = -875). A threshold-based region growing method was utilized. The seeding strategy involved the placement of a total of 13 seed points across different anatomical planes. On the axial plane, three seed points were positioned in the peripheral regions of the left and right lungs, respectively. A similar approach was adopted on the coronal plane. Additionally, one seed point was positioned at the location of the main bronchus. Subsequently, the segmentation results underwent manual correction by a radiologist with 5 years of experience in imaging diagnosis of chest diseases, and confirmation was obtained from another radiologist with 8 years of experience in imaging diagnosis of chest diseases.
Interclass and intraclass correlation coefficients (ICCs) were employed in the following manner: A total of 20 cases were randomly selected for region of interest (ROI) segmentation by Radiologist 1. Radiologist 2 then replicated the segmentation for these 20 cases. Subsequently, Radiologist 1 repeated the segmentation after a one-month interval. The segmentation was deemed well-matched in terms of interobserver reliability and intraobserver reproducibility when the ICC value surpassed 0.75.
2.5 Radiomics feature extraction and model establishment
Figure 2 shows the workflow of radiomics analysis in this study. The patient cohort was randomly split into training and test cohorts at a ratio of 7:3. Feature extraction was performed utilizing the open-source Pyradiomics software package (http://pypi.org/project/pyradiomics/). This package facilitates the extraction of a comprehensive suite of radiomics features, categorized into seven distinct classes: Gray Level Dependence Matrix (GLDM), Gray Level Co-occurrence Matrix (GLCM), Gray Level Run Length Matrix (GLRLM), Gray Level Size Zone Matrix (GLSZM), Neighboring Gray Tone Difference Matrix (NGTDM), First Order Statistics, and Shape-based features (3D). A detailed description of the extracted features is accessible via the Pyradiomics documentation (http://pyradiomics.readthedocs.io). A total of 1,834 radiomics features were extracted from the ROIs. Statistical analysis involved the Student’s t-test for normally distributed features and the Mann-Whitney U test for others. Features with a p-value ≤ 0.05 were retained, resulting in 1,171 features. Spearman’s rank correlation coefficient was then applied to identify robustly repeatable features, retaining one feature from pairs with a correlation coefficient > 0.75. A recursive elimination strategy further refined the features to a subset of 102. The dataset’s signature was constructed using the least absolute shrinkage and selection operator (LASSO) regression model. The optimal λ value was determined via tenfold cross-validation. Features with non-zero coefficients formed the Radiomics Signature, combining linearly to compute the radiomics score for each patient. Scikit-learn in Python was employed for LASSO regression, and logistic regression was used for model formulation after 10-fold cross-validation to verify model adequacy.
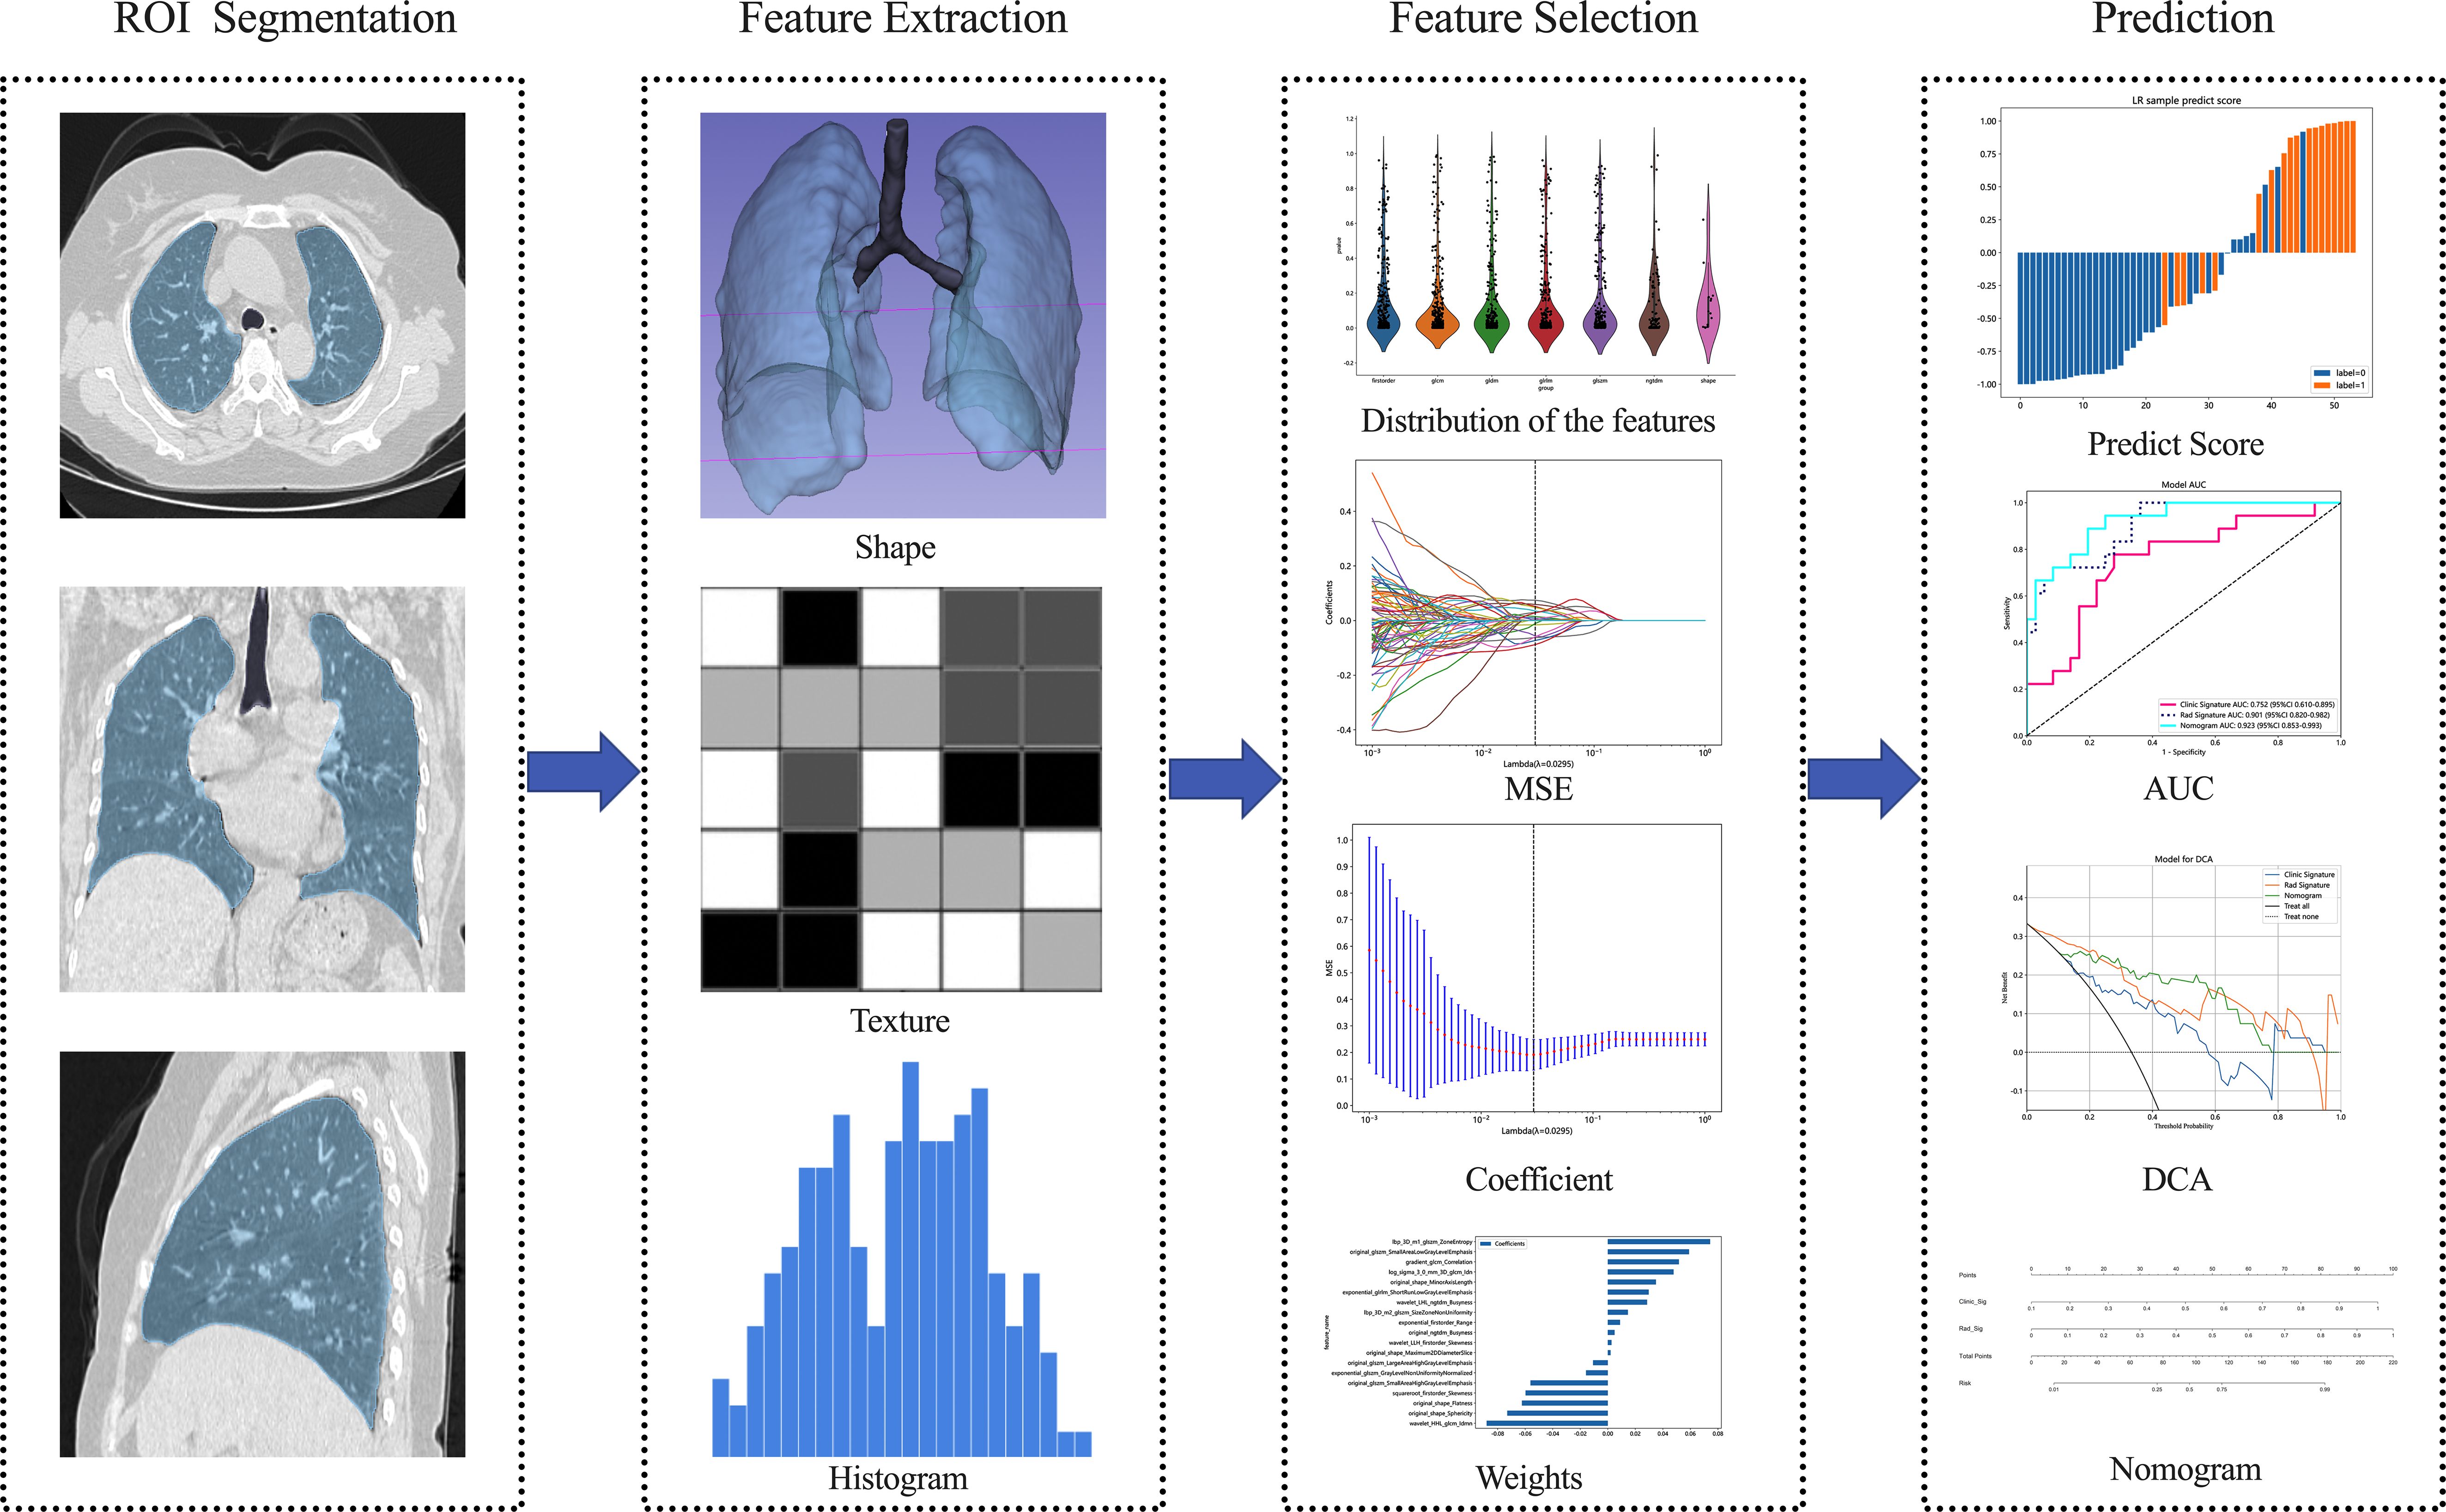
Figure 2 Overview workflow of radiomics analysis. Semi-automatic segmentation of the whole lung was performed on CT images, followed by manual adjustment of the confirmed dissection range, with the region of interest delineated in blue. Imaging-derived histologic features, including shape and texture characteristics, were extracted from CT images of both lungs. Feature selection was conducted using inter- and intra-observer reliability assessment as well as the LASSO method. The performance and clinical utility of predictive model were evaluated using ROC, DCA, and nomogram analysis. MSE Mean standard error, ROC Receiver operating characteristic, DCA Decision curve analysis.
2.6 Construction of the clinical model
The clinical factor model incorporated variables that were significantly different (p < 0.05) as determined by univariate logistic regression analysis. These variables included clinical data and laboratory examinations from the training cohort. Odds ratios (ORs) with 95% confidence intervals (CIs) were calculated for the significantly correlated variables. To mitigate the risk of data leakage within the models, gender, age, and PFT parameters were excluded.
2.7 The building of the clinical-radiomics nomogram
A multivariate logistic regression analysis, combining both the clinical signature and radiomics signature, was employed in a backward step-down selection procedure to develop the final integrated radiomics-clinical prediction model.
2.8 Statistical analysis
Statistical analyses were performed using SPSS (version 26.0; IBM Corp.). Statistical significance was defined as a two- sided p-value ≤ 0.05. Normally distributed data were analyzed using independent T-tests, and non-normally distributed data were presented as medians (interquartile range) using Mann-Whitney U tests. Categorical variables were analyzed using chi-square tests. The predictive performance of the three models was evaluated using receiver operating characteristic (ROC) curves, with the area under the ROC curve (AUC) calculated. Model performance was tested in both the training and test cohorts. The Delong test was applied to compare AUCs among the three models. Calibration efficiency of the nomogram was assessed through calibration curves, and the Hosmer–Lemeshow analytical fit was used to evaluate calibration ability. Decision curve analysis (DCA) was employed to evaluate the clinical utility of the radiomics-clinical model.
3 Results
3.1 Patient characteristics
A total of 177 patients with RA-ILD were enrolled in this study. Among these patients, 107, 63, and 7 were allocated to ILD-GAP stage I, II, and III, respectively. To prevent excessive data bias, the patients in ILD-GAP stage II and III were combined into a single group. Table 1 listed the baseline patient characteristics in group I and group II. Age, gender, FVC, FEV1, TLC, DLCO, and serum Krebs von den Lungen-6 (KL-6) level showed significant differences (p < 0.05) between the two groups, while the differences in smoking history, ACPA, RF-IgM, RF-IgA, and RF-IgG were not significant (p > 0.05). In addition, there was no significant statistical difference between the two groups in terms of ESR, CRP, TNFα, IFNγ, IFNα, as well as disease activity score (p > 0.05).

Table 1 Patient characteristics.
3.2 Development of the clinical model
Univariate logistic regression was performed to analyze the clinical data and laboratory examinations (Table 2). To ensure the reliability of the model construction, factors such as gender, age, and PFT parameters were excluded. Then, KL-6 (ORs = 1.007; 95% CI, 1.004-1.010; p < 0.001) was selected as independent clinical risk factors.
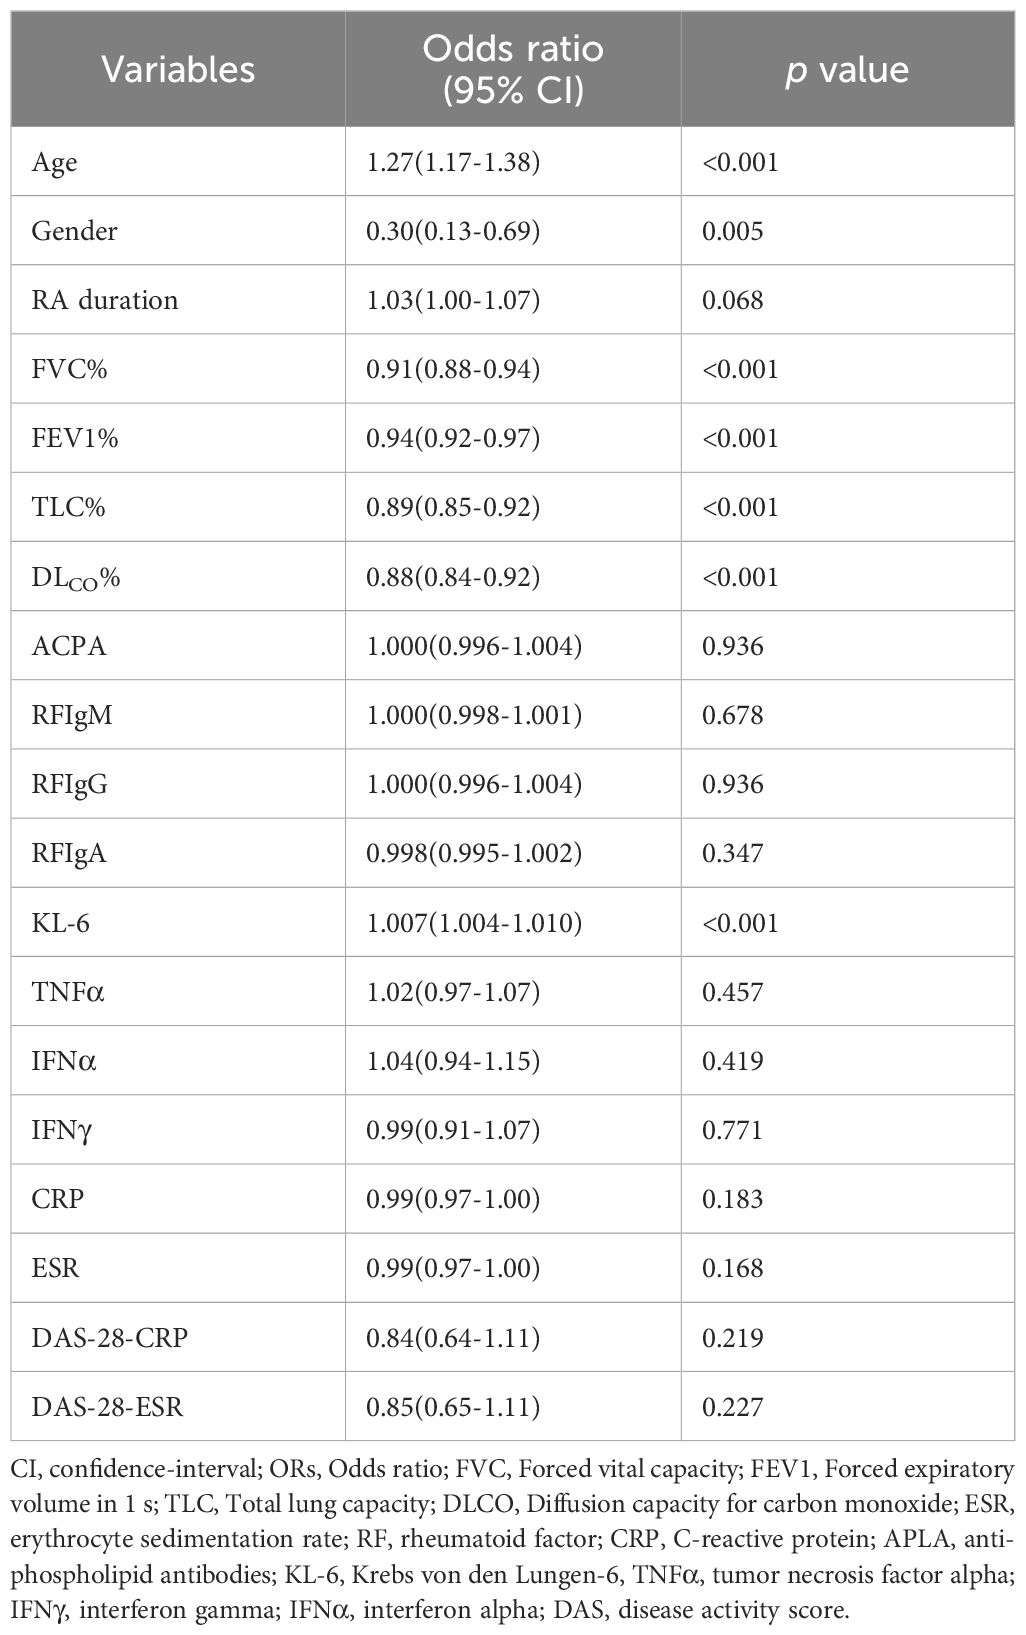
Table 2 Independent risk factors in training cohort.
3.3 Development of the radiomics model
A total of 1,834 radiomics features were extracted from the CT images, with 1,171 exhibiting promising interobserver and intraobserver agreement (intraclass correlation coefficient > 0.75). Through LASSO logistic regression analysis, 102 significantly different (p < 0.05) radiomics features were selected to identify optimally related features. Ultimately, 19 features were included in the construction of the radiomics model. Figures 3A,B show the coefficients and mean standard error (MSE) for the 10-fold validation, while Figure 3C presents the coefficient values for the final selection of non-zero features Rad score is shown as follows: Rad-score= 0.4227 + 0.0088 × exponential_firstorder_Range +0.0296 × exponential_glrlm_ShortRunLowGrayLevelEmphasis -0.0157 × exponential_glszm_GrayLevelNonUniformityNormalized +0.0516 × gradient_glcm_Correlation +0.0743 × lbp_3D_m1_glszm_ZoneEntropy +0.0146 × lbp_3D_m2_glszm_SizeZoneNonUniformity +0.0477 × log_sigma_3_0_mm_3D_glcm_Idn -0.0107 × original_glszm_LargeAreaHighGrayLevelEmphasis -0.0561 × original_glszm_SmallAreaHighGrayLevelEmphasis +0.0590 × original_glszm_SmallAreaLowGrayLevelEmphasis +0.0049 × original_ngtdm_Busyness -0.0623 × original_shape_Flatness +0.0020 × original_shape_Maximum2DDiameterSlice +0.0349 × original_shape_MinorAxisLength -0.0730 × original_shape_Sphericity -0.0597 × squareroot_firstorder_Skewness -0.0879 × wavelet_HHL_glcm_Idmn +0.0285 × wavelet_LHL_ngtdm_Busyness +0.0026 × wavelet_LLH_firstorder_Skewness.
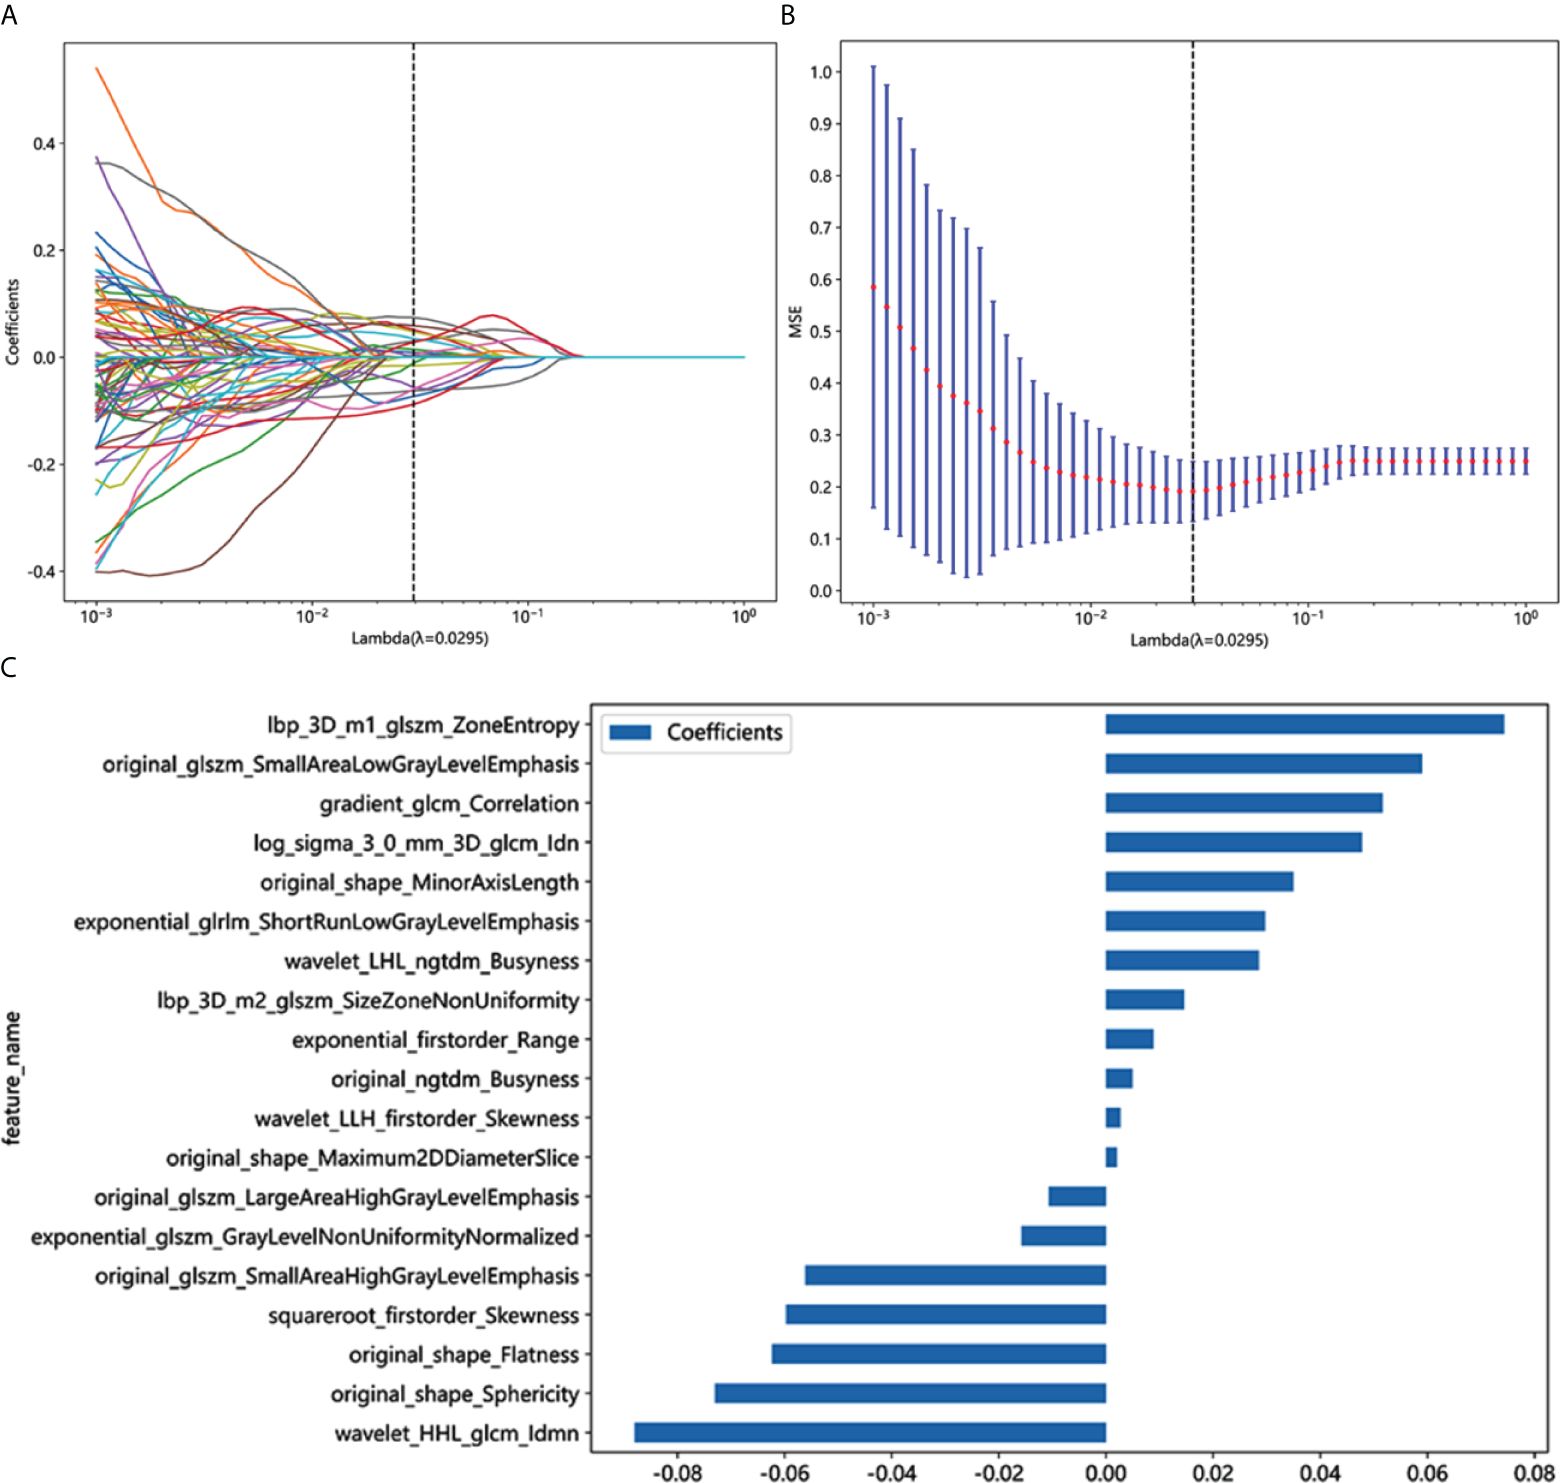
Figure 3 Radiomics feature selection based on LASSO algorithm and Rad score establishment. (A) LASSO coefficient profile plot with different log (λ)was shown. (B) Ten-fold cross-validated coefficients and 10-fold cross-validated MSE. (C) The histogram of the Rad score based on the selected features.
3.4 Comparison of clinical, radiomics, and nomogram models
As shown in Figure 4, for the AUC, the clinical features [0.736, 95%CI = 0.642–0.830) and the radiomics features (0.939, 95%CI = 0.892–0.985) were perfectly fitted for the training cohort. In the testing cohort, the clinical characteristics (0.752, 95%CI = 0.610–0.894) and the radiomics signature remained well-fitted (0.901, 95%CI = 0.820–0.982). As shown in Figure 5, The nomogram using the LR algorithm, combining clinical features and radiomics features, showed the best performance in the training (0.948, 95%CI = 0.910–0.987) and testing cohort (0.923, 95%CI = 0.853–0.993), respectively. The detailed diagnostic efficiency capability for each model is presented in Supplementary Table S1.
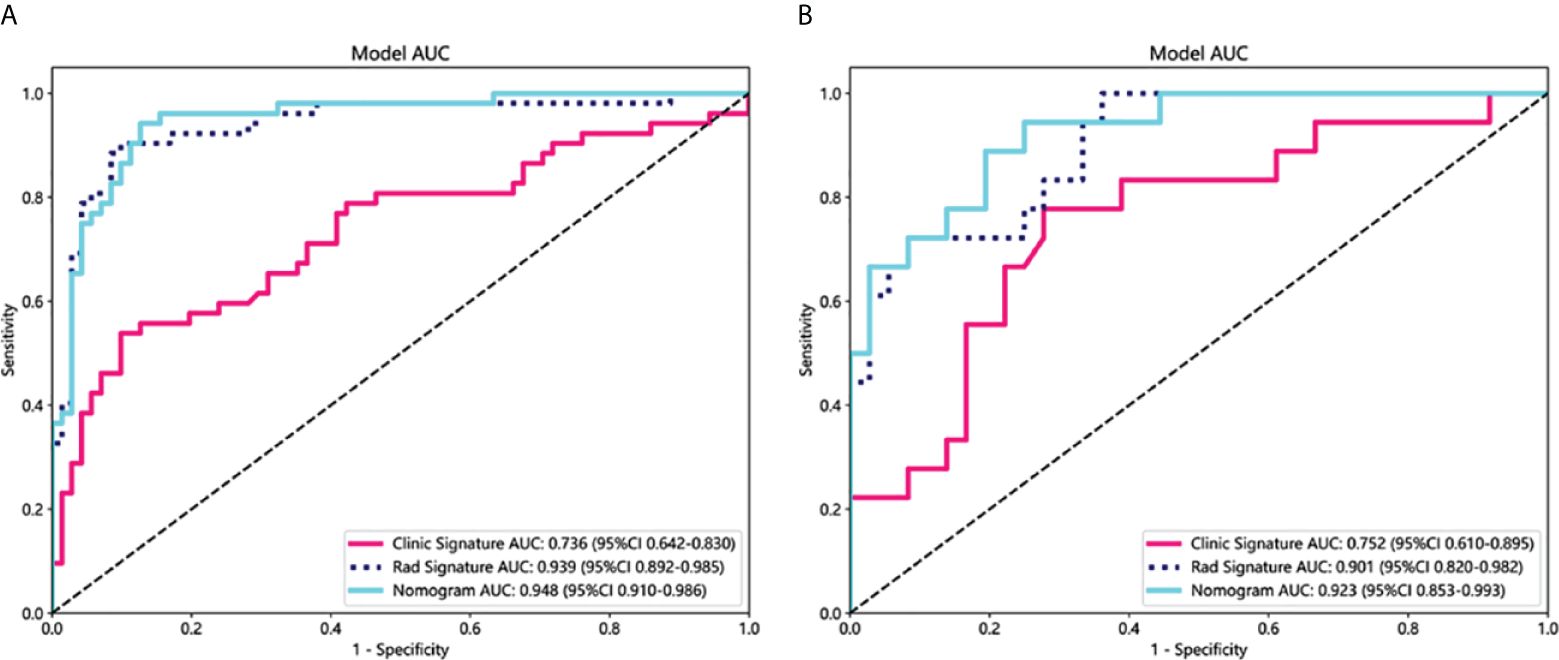
Figure 4 Comparison of receiver operating characteristic (ROC) curves for the clinical, radiomics, and nomogram models in the training (A) and testing (B) cohorts. The combined nomogram performed optimally in both the training and testing cohorts.
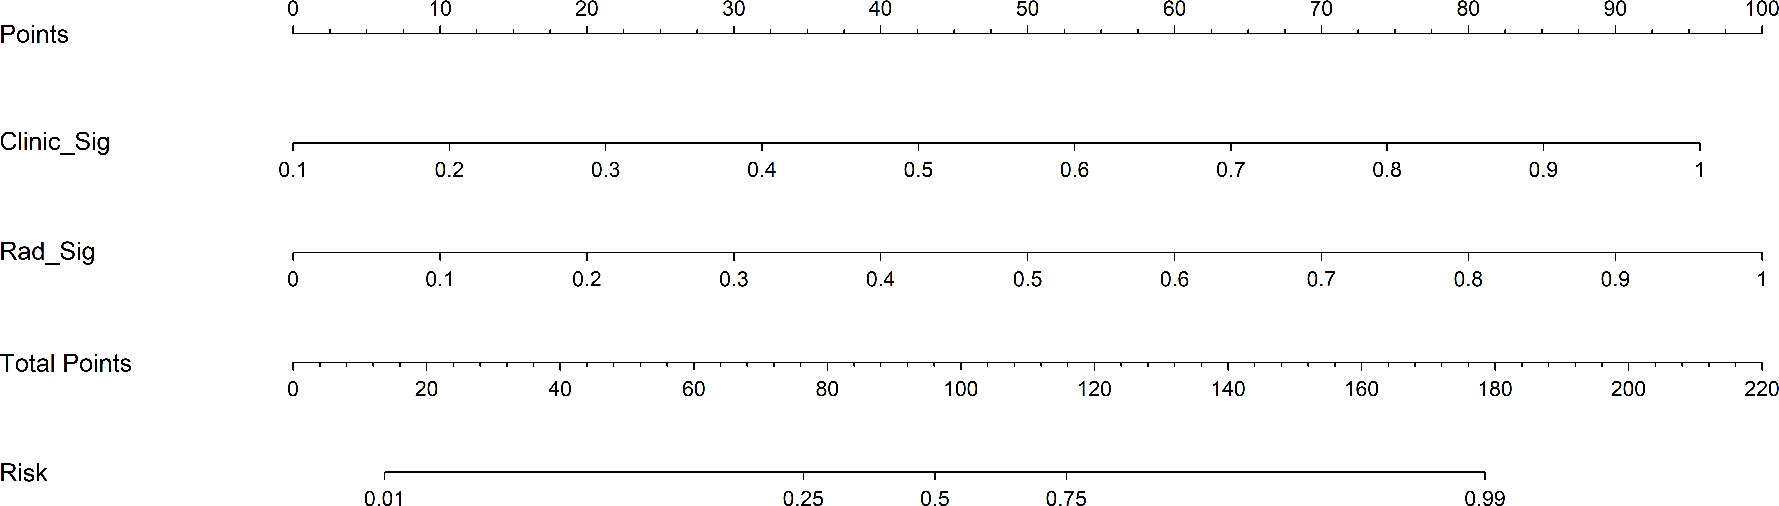
Figure 5 A constructed nomogram for predicting the GAP staging of RA-ILD.
To compare the clinical signature, radiomics signature, and nomogram, the Delong test was utilized (Supplementary Table 2). In the testing cohort, the results indicated that the AUC comparison between the nomogram and the clinical signature achieved 0.021, suggesting that the nomogram outperformed the clinical model in discriminating the GAP staging of RA-ILD. The AUC comparison between the nomogram and radiomics signature was 0.219, indicating that both models performed well in differentiating the GAP staging of RA-ILD.
3.5 Comparison of visual assessment, radiomics, and nomogram models
In the testing cohort, the Goh score achieved an AUC of 0.820 (95%CI=0.700-0.941; Supplementary Figure 1). Comparatively, both the radiomics model (0.901, 95% CI: 0.820-0.982) and the combined radiomics-KL-6 nomogram model (0.923, 95% CI: 0.853-0.993) showed superior AUC values relative to the Goh score.
3.6 Calibration curve and DCA of the models
The calibration curves for the training and testing cohorts were shown in Figure 6. The p-values from the Hosmer-Lemeshow test for clinical features, radiologic features, and nomograms were 0.557, 0.171, 0.305, and 0.193, 0.072, 0.160 in the training and test cohorts, respectively. These p-values suggest a perfect agreement for each model (Supplementary Table 3).
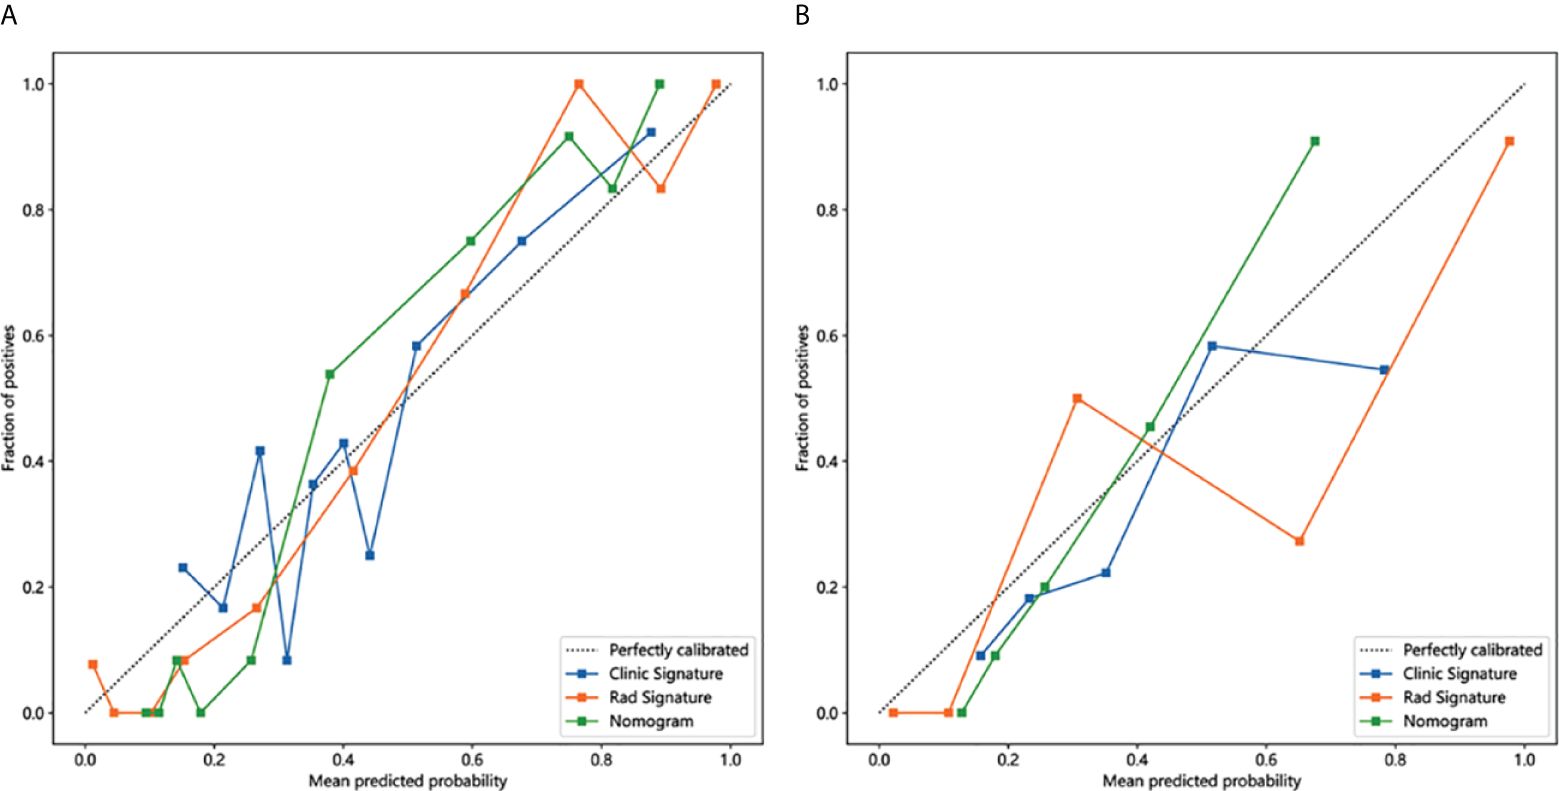
Figure 6 Calibration curves in the training and testing cohorts showing that the nomogram fits perfectly well in both the training (A) and testing cohorts (B).
As shown in Figure 7, the DCA for clinical features, radiographic features, and nomograms, covering predictive probabilities from 0.12 to 0.41, 0.02 to 0.91, and 0.1 to 0.78. The nomogram achieves the largest net benefit compared to other models when the threshold probability ranges from 0.23 to 0.58.
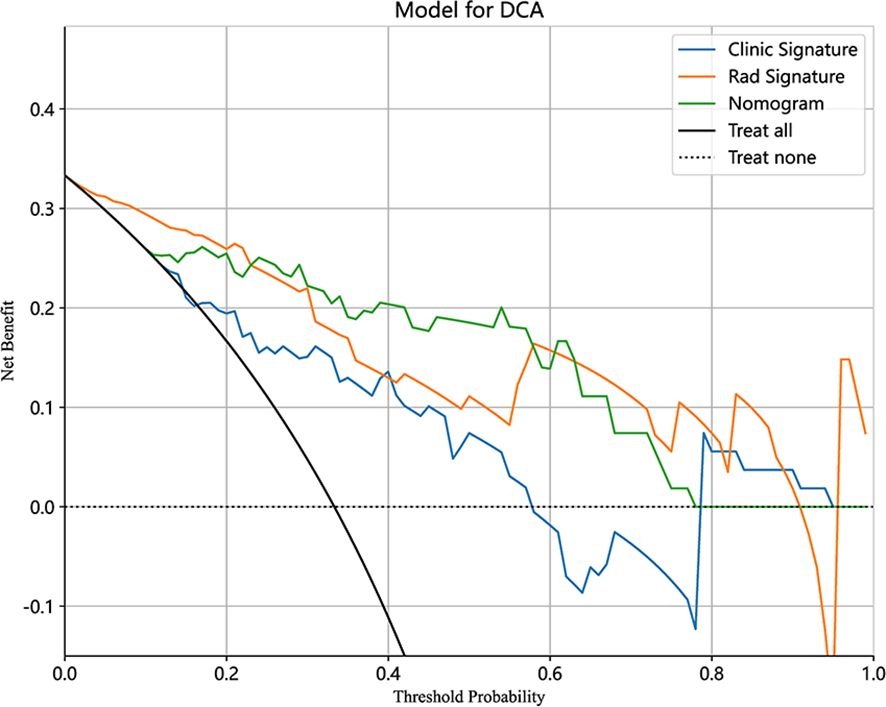
Figure 7 Decision curve analysis (DCA) of the clinical, radiomics, and nomogram models in the testing cohort.
4 Discussion
In our study, the radiomics model based on chest CT has great performance to distinguish different ILD-GAP stage patients with an AUC of 0.901 in validation cohort. The nomogram model, combining the radiomics model and serum KL-6, further enhanced the prediction efficiency of GAP staging with an AUC of 0.948 and 0.923 in the training and validation cohort, respectively.
Among the serological markers, anti-citrullinated protein antibodies (ACPA) have been implicated in the extra-articular manifestations of RA, including ILD (27–29). Correia et al. reported a correlation between ACPA titers and the risk of developing ILD (30). On the contrary, many studies have shown no association between ACPA and ILD, as well as related RF factors. Similarly, our study revealed no significant differences between ACPA and RF factors in different stages of RA-ILD. However, these different results may be attributed to the heterogeneity of ACPA specificity and search methods (5, 31). It is worth noting that treatment strategies may play a crucial role in the development and progression of RA-ILD. A higher proportion of biological agent use was revealed in the low-risk group by our analysis. This suggests that patients using biological agents may represent a cohort receiving early and aggressive treatment. The use of biological agents may interrupt the inflammatory cascade leading to ILD, thereby reducing the risk of developing severe ILD in later stages (32, 33).
In addition, older age and male sex have been strongly associated with RA-ILD (34). We excluded gender, age, and PFTs parameters from the clinical model to prevent data leakage, despite their status as independent risk factors. Eventually, univariate logistic regression analysis revealed that KL-6 was an independent predictor in our present study. KL-6 is a mucin-like glycoprotein which stimulates fibrosis and inhibits apoptosis of pulmonary fibroblasts (35, 36). Elevated serum KL-6 levels have been observed in RA patients with lung involvement, suggesting its potential utility in early detection of ILD. In a cohort of 50 RA patients, KL-6 levels positively correlated with the high-resolution computed tomography fibrosis score, indicating that high KL-6 levels are a significant biomarker for ILD and may serve as a predictor for ILD severity in RA patients (37). Moreover, a study suggests that high KL-6 levels might be an independent risk factor and useful for the prognosis in patients with RA-ILD (38). So far, the utility of serum KL-6 has been evaluated in several forms of ILD and its sensitivity and specificity for RA-ILD ranged from 67%-85% and 60%-90%, respectively, depending on the cutoff value (36, 37, 39). In our study, a clinical factor model to classify RA-ILD stages was developed based on KL-6, and then achieved an AUC of 0.752 in the testing cohorts.
Radiomics is an objective technique offering a reliable and comprehensive quantitative assessment of images, unaffected by inter-reader variability (40). Feature extraction involves mathematical operations on digital images to generate numerical descriptors of texture, shape, and other distinct characteristics. These descriptors can be computationally analyzed to explore potential associations with clinical parameters (41). Particularly useful for diseases challenging to describe through simple visual features, high-dimensional abstract features extracted from wavelet-transformed images can provide diverse perspectives in capturing hidden information not easily observed visually. Radiomics features have indeed proven their potential for severity estimation in Systemic sclerosis-ILD and guiding treatment decisions (42). At present, the literature on the application of radiomics is limited. Venerito et al. (23) retrieved the HRCTs of 30 RA-ILD patients and suggested that radiomics analysis could predict patient mortality. This finding suggests that HRCT could serve as a digital biomarker for RA-ILD, offering prognostic value that is independent of the clinical characteristics of the disease. Recently, some scholars have developed radiomics models based on CT images to differentiate GAP staging in CTD patients. Qin et al. (21) manually segmented the right lung of CTD-ILD patients and constructed a radiomics model from the 9 extracted texture features. The AUC of their radiomics models in the validation cohort was 0.787 and 0.718 in the internal and external test cohort, respectively. A similar study utilized a semi-automatic segmentation method to segment bilateral lungs, obtaining a total of 4 features (22). Their developed radiomics model demonstrated an AUC of 0.801 in the test cohort. Instead of focusing on all types of CTDs, we concentrated on patients with RA. In our work, totally1,834 radiomics features obtained from the CT images, 19 higher-order texture features extracted from wavelet transformed images were acquired as remarkable elements to build the radiomics model, resulting in an AUC of 0.939, and 0.901 in the training and testing cohorts, respectively. It is speculated that by targeted with ILD specifically caused by RA, to some extent excluded the imbalance of training data arising from the heterogeneous imaging characteristics of various CTD-ILD subtypes (43), which eventually screened out more features. In the current study, we constructed a nomogram model that integrates the radscore with serum KL-6 levels to further enhance the accuracy of predicting low-risk RA-ILD. In contrast to the GAP index, the nomogram model can predict GAP staging in patients with RA-ILD even when precise lung function parameters are challenging to obtain. This radiomics-based approach may serve as a supportive tool for assessing the severity of RA-ILD. Moreover, the proposed model can be readily implemented in clinical practice, as it leverages routinely acquired chest CT imaging and serum biomarker data to automate the computational process, thereby minimizing the operational burden on clinicians.
There are certain limitations in our study. Firstly, the single-center design with a relatively small overall sample size, especially the limited representation of more severe ILD-GAP stage III patients, may restrict the model ability. Future studies based on larger datasets from other centers are needed to evaluate model generalizability. Secondly, the exact mortality of the retrospective study verified by the GAP index system may less precise than actual mortality of patient. Nevertheless, as an available method to predict mortality, the GAP index system has been validated in RA-ILD. The precise assessment of mortality risk will be conducted in our further research. In addition, our study serves as a foundational exploration, offering valuable insights for selecting valuable imaging biomarkers in RA-ILD.
In conclusion, a novel nomogram model combining CT-based radiomics and serum KL-6 was developed in our study. It shows good prediction accuracy in predicting low-risk RA-ILD patients, which implies that this noninvasive and quantitative method may impact the clinical decision-making process, offering a more precise management strategy for patients with RA-ILD.
Data availability statement
The original contributions presented in the study are included in the article/Supplementary Material. Further inquiries can be directed to the corresponding authors.
Ethics statement
The study protocol was approved by the Ethics Committee of Guanghua Hospital Affiliated to Shanghai University of Traditional Chinese Medicine (2023-K-46). The studies were conducted in accordance with the local legislation and institutional requirements. Written informed consent for participation in this study was provided by the participants’ legal guardians/next of kin.
Author contributions
NH: Writing – original draft. ZG: Writing – original draft. DZ: Writing – original draft. YZ: Writing – original draft. YQ: Writing – original draft. GL: Writing – original draft. XG: Conceptualization, Supervision, Writing – review & editing. LJ: Conceptualization, Supervision, Writing – review & editing.
Funding
The author(s) declare that no financial support was received for the research, authorship, and/or publication of this article.
Conflict of interest
The authors declare that the research was conducted in the absence of any commercial or financial relationships that could be construed as a potential conflict of interest.
Publisher’s note
All claims expressed in this article are solely those of the authors and do not necessarily represent those of their affiliated organizations, or those of the publisher, the editors and the reviewers. Any product that may be evaluated in this article, or claim that may be made by its manufacturer, is not guaranteed or endorsed by the publisher.
Supplementary material
The Supplementary Material for this article can be found online at: https://www.frontiersin.org/articles/10.3389/fimmu.2024.1417156/full#supplementary-material
References
1. Em G, Gs F. Rheumatoid arthritis - common origins, divergent mechanisms. New Engl J Med. (2023) 388:529–42. doi: 10.1056/NEJMra2103726
2. Conforti A, Di Cola I, Pavlych V, Ruscitti P, Berardicurti O, Ursini F, et al. Beyond the joints, the extra-articular manifestations in rheumatoid arthritis. Autoimmun Rev. (2021) 20:102735. doi: 10.1016/j.autrev.2020.102735
3. Hyldgaard C, Hilberg O, Pedersen AB, Ulrichsen SP, Løkke A, Bendstrup E, et al. A population-based cohort study of rheumatoid arthritis-associated interstitial lung disease: comorbidity and mortality. Ann Rheum Dis. (2017) 76:1700–6. doi: 10.1136/annrheumdis-2017-211138
4. Olson AL, Swigris JJ, Sprunger DB, Fischer A, Fernandez-Perez ER, Solomon J, et al. Rheumatoid arthritis-interstitial lung disease-associated mortality. Am J Respir Crit Care Med. (2011) 183:372–8. doi: 10.1164/rccm.201004-0622OC
5. Koduri G, Norton S, Young A, Cox N, Davies P, Devlin J, et al. Interstitial lung disease has a poor prognosis in rheumatoid arthritis: results from an inception cohort. Rheumatol (Oxford). (2010) 49:1483–9. doi: 10.1093/rheumatology/keq035
6. Yunt ZX, Solomon JJ. Lung disease in rheumatoid arthritis. Rheum Dis Clin North Am. (2015) 41:225–36. doi: 10.1016/j.rdc.2014.12.004
7. Kadura S, Raghu G. Rheumatoid arthritis-interstitial lung disease: manifestations and current concepts in pathogenesis and management. Eur Respir Rev. (2021) 30:210011. doi: 10.1183/16000617.0011-2021
8. Ley B, Ryerson CJ, Vittinghoff E, Ryu JH, Tomassetti S, Lee JS, et al. A multidimensional index and staging system for idiopathic pulmonary fibrosis. Ann Intern Med. (2012) 156:684–91. doi: 10.7326/0003-4819-156-10-201205150-00004
9. Ryerson CJ, Vittinghoff E, Ley B, Lee JS, Mooney JJ, Jones KD, et al. Predicting survival across chronic interstitial lung disease. Chest. (2014) 145:723–8. doi: 10.1378/chest.13-1474
10. Nurmi HM, Purokivi MK, Kärkkäinen MS, Kettunen H-P, Selander TA, Kaarteenaho RL, et al. Are risk predicting models useful for estimating survival of patients with rheumatoid arthritis-associated interstitial lung disease? BMC Pulm Med. (2017) 17:16. doi: 10.1186/s12890-016-0358-2
11. Zamora-Legoff JA, Krause ML, Crowson CS, Ryu JH, Matteson EL. Patterns of interstitial lung disease and mortality in rheumatoid arthritis. Rheumatol (Oxford). (2017) 56:344–50. doi: 10.1093/rheumatology/kew391
12. Morisset J, Vittinghoff E, Lee BY, Tonelli R, Hu X, Elicker BM, et al. The performance of the GAP model in patients with rheumatoid arthritis associated interstitial lung disease. Respir Med. (2017) 127:51–6. doi: 10.1016/j.rmed.2017.04.012
13. Graham BL, Steenbruggen I, Miller MR, Barjaktarevic IZ, Cooper BG, Hall GL, et al. Standardization of spirometry 2019 update. An official american thoracic society and european respiratory society technical statement. Am J Respir Crit Care Med. (2019) 200:e70–88. doi: 10.1164/rccm.201908-1590ST
14. Paschalaki KE, Jacob J, Wells AU. Monitoring of lung involvement in rheumatologic disease. Respiration. (2016) 91:89–98. doi: 10.1159/000442890
15. Spagnolo P, Lee JS, Sverzellati N, Rossi G, Cottin V. The lung in rheumatoid arthritis: focus on interstitial lung disease. Arthritis Rheumatol. (2018) 70:1544–54. doi: 10.1002/art.40574
16. Walsh SLF, Calandriello L, Sverzellati N, Wells AU, Hansell DM, UIP Observer Consort. Interobserver agreement for the ATS/ERS/JRS/ALAT criteria for a UIP pattern on CT. Thorax. (2016) 71:45–51. doi: 10.1136/thoraxjnl-2015-207252
17. Gruden JF. CT in idiopathic pulmonary fibrosis: diagnosis and beyond. AJR Am J Roentgenol. (2016) 206:495–507. doi: 10.2214/AJR.15.15674
18. Tominaga J, Sakai F, Johkoh T, Noma S, Akira M, Fujimoto K, et al. Diagnostic certainty of idiopathic pulmonary fibrosis/usual interstitial pneumonia: The effect of the integrated clinico-radiological assessment. Eur J Radiol. (2015) 84:2640–5. doi: 10.1016/j.ejrad.2015.08.016
19. Chen M, Copley SJ, Viola P, Lu H, Aboagye EO. Radiomics and artificial intelligence for precision medicine in lung cancer treatment. Semin Cancer Biol. (2023) 93:97–113. doi: 10.1016/j.semcancer.2023.05.004
20. Bera K, Braman N, Gupta A, Velcheti V, Madabhushi A. Predicting cancer outcomes with radiomics and artificial intelligence in radiology. Nat Rev Clin Oncol. (2022) 19:132–46. doi: 10.1038/s41571-021-00560-7
21. Qin S, Jiao B, Kang B, Li H, Liu H, Ji C, et al. Non-contrast computed tomography-based radiomics for staging of connective tissue disease-associated interstitial lung disease. Front Immunol. (2023) 14:1213008. doi: 10.3389/fimmu.2023.1213008
22. Jiang X, Su N, Quan S, Linning E, Li R. Computed tomography radiomics-based prediction model for gender–age–physiology staging of connective tissue disease-associated interstitial lung disease. Acad Radiol. (2023) 30:2598–605. doi: 10.1016/j.acra.2023.01.038
23. Venerito V, Manfredi A, Lopalco G, Lavista M, Cassone G, Scardapane A, et al. Radiomics to predict the mortality of patients with rheumatoid arthritis-associated interstitial lung disease: A proof-of-concept study. Front Med (Lausanne). (2022) 9:1069486. doi: 10.3389/fmed.2022.1069486
24. Aletaha D, Neogi T, Silman AJ, Funovits J, Felson DT, Bingham CO, et al. 2010 Rheumatoid arthritis classification criteria: an American College of Rheumatology/European League Against Rheumatism collaborative initiative. Arthritis Rheum. (2010) 62:2569–81. doi: 10.1002/art.27584
25. Raghu G, Remy-Jardin M, Myers JL, Richeldi L, Ryerson CJ, Lederer DJ, et al. Diagnosis of idiopathic pulmonary fibrosis. An official ATS/ERS/JRS/ALAT clinical practice guideline. Am J Respir Crit Care Med. (2018) 198:e44–68. doi: 10.1164/rccm.201807-1255ST
26. Goh NSL, Desai SR, Veeraraghavan S, Hansell DM, Copley SJ, Maher TM, et al. Interstitial lung disease in systemic sclerosis: a simple staging system. Am J Respir Crit Care Med. (2008) 177:1248–54. doi: 10.1164/rccm.200706-877OC
27. Kelly CA, Saravanan V, Nisar M, Arthanari S, Woodhead FA, Price-Forbes AN, et al. Rheumatoid arthritis-related interstitial lung disease: associations, prognostic factors and physiological and radiological characteristics–a large multicentre UK study. Rheumatol (Oxford). (2014) 53:1676–82. doi: 10.1093/rheumatology/keu165
28. Zhang Y, Li H, Wu N, Dong X, Zheng Y. Retrospective study of the clinical characteristics and risk factors of rheumatoid arthritis-associated interstitial lung disease. Clin Rheumatol. (2017) 36:817–23. doi: 10.1007/s10067-017-3561-5
29. Yin Y, Liang D, Zhao L, Li Y, Liu W, Ren Y, et al. Anti-cyclic citrullinated Peptide antibody is associated with interstitial lung disease in patients with rheumatoid arthritis. PloS One. (2014) 9:e92449. doi: 10.1371/journal.pone.0092449
30. Correia CS, Briones MR, Guo R, Ostrowski RA. Elevated anti-cyclic citrullinated peptide antibody titer is associated with increased risk for interstitial lung disease. Clin Rheumatol. (2019) 38:1201–6. doi: 10.1007/s10067-018-04421-0
31. Sebastiani M, Manfredi A, Cerri S, Della Casa G, Luppi F, Ferri C. Radiologic classification of usual interstitial pneumonia in rheumatoid arthritis-related interstitial lung disease: correlations with clinical, serological and demographic features of disease. Clin Exp Rheumatol. (2016) 34:564–5.
32. Yunt ZX, Chung JH, Hobbs S, Fernandez-Perez ER, Olson AL, Huie TJ, et al. High resolution computed tomography pattern of usual interstitial pneumonia in rheumatoid arthritis-associated interstitial lung disease: Relationship to survival. Respir Med. (2017) 126:100–4. doi: 10.1016/j.rmed.2017.03.027
33. Kawano-Dourado L, Doyle TJ, Bonfiglioli K, Sawamura MVY, Nakagawa RH, Arimura FE, et al. Baseline characteristics and progression of a spectrum of interstitial lung abnormalities and disease in rheumatoid arthritis. Chest. (2020) 158:1546–54. doi: 10.1016/j.chest.2020.04.061
34. Doyle TJ, Patel AS, Hatabu H, Nishino M, Wu G, Osorio JC, et al. Detection of rheumatoid arthritis-interstitial lung disease is enhanced by serum biomarkers. Am J Respir Crit Care Med. (2015) 191:1403–12. doi: 10.1164/rccm.201411-1950OC
35. Kohno N, Akiyama M, Kyoizumi S, Hakoda M, Kobuke K, Yamakido M. Detection of soluble tumor-associated antigens in sera and effusions using novel monoclonal antibodies, KL-3 and KL-6, against lung adenocarcinoma. Jpn J Clin Oncol. (1988) 18:203–16.
36. Satoh H, Kurishima K, Ishikawa H, Ohtsuka M. Increased levels of KL-6 and subsequent mortality in patients with interstitial lung diseases. J Intern Med. (2006) 260:429–34. doi: 10.1111/j.1365-2796.2006.01704.x
37. Zheng M, Lou A, Zhang H, Zhu S, Yang M, Lai W. Serum KL-6, CA19-9, CA125 and CEA are diagnostic biomarkers for rheumatoid arthritis-associated interstitial lung disease in the chinese population. Rheumatol Ther. (2021) 8:517–27. doi: 10.1007/s40744-021-00288-x
38. Kim HC, Choi KH, Jacob J, Song JW. Prognostic role of blood KL-6 in rheumatoid arthritis-associated interstitial lung disease. PloS One. (2020) 15:e0229997. doi: 10.1371/journal.pone.0229997
39. Avouac J, Cauvet A, Steelandt A, Shirai Y, Elhai M, Kuwana M, et al. Improving risk-stratification of rheumatoid arthritis patients for interstitial lung disease. PloS One. (2020) 15:e0232978. doi: 10.1371/journal.pone.0232978
40. Lambin P, Rios-Velazquez E, Leijenaar R, Carvalho S, van Stiphout RGPM, Granton P, et al. Radiomics: extracting more information from medical images using advanced feature analysis. Eur J Cancer. (2012) 48:441–6. doi: 10.1016/j.ejca.2011.11.036
41. Barnes H, Humphries SM, George PM, Assayag D, Glaspole I, Mackintosh JA, et al. Machine learning in radiology: the new frontier in interstitial lung diseases. Lancet Digit Health. (2023) 5:e41–50. doi: 10.1016/S2589-7500(22)00230-8
42. Martini K, Baessler B, Bogowicz M, Blüthgen C, Mannil M, Tanadini-Lang S, et al. Applicability of radiomics in interstitial lung disease associated with systemic sclerosis: proof of concept. Eur Radiol. (2021) 31:1987–98. doi: 10.1007/s00330-020-07293-8
43. Travis WD, Costabel U, Hansell DM, King TE, Lynch DA, Nicholson AG, et al. An official American Thoracic Society/European Respiratory Society statement: Update of the international multidisciplinary classification of the idiopathic interstitial pneumonias. Am J Respir Crit Care Med. (2013) 188:733–48. doi: 10.1164/rccm.201308-1483ST
Keywords: computed tomography, radiomics, KL-6, rheumatoid arthritis, interstitial lung disease
Citation: Han N, Guo Z, Zhu D, Zhang Y, Qin Y, Li G, Gu X and Jin L (2024) A nomogram model combining computed tomography-based radiomics and Krebs von den Lungen-6 for identifying low-risk rheumatoid arthritis-associated interstitial lung disease. Front. Immunol. 15:1417156. doi: 10.3389/fimmu.2024.1417156
Received: 14 April 2024; Accepted: 22 July 2024;
Published: 01 August 2024.
Edited by:
Sandeep Kumar Mishra, Yale University, United StatesReviewed by:
Mayra Mejia, Instituto Nacional de Enfermedades Respiratorias, MexicoAlarico Ariani, University Hospital of Parma, Italy
Copyright © 2024 Han, Guo, Zhu, Zhang, Qin, Li, Gu and Jin. This is an open-access article distributed under the terms of the Creative Commons Attribution License (CC BY). The use, distribution or reproduction in other forums is permitted, provided the original author(s) and the copyright owner(s) are credited and that the original publication in this journal is cited, in accordance with accepted academic practice. No use, distribution or reproduction is permitted which does not comply with these terms.
*Correspondence: Xiaoli Gu, SHU5MDZAMTYzLmNvbQ==; Lin Jin, amlubGluMjA1QDE2My5jb20=
†These authors have contributed equally to this work