
94% of researchers rate our articles as excellent or good
Learn more about the work of our research integrity team to safeguard the quality of each article we publish.
Find out more
ORIGINAL RESEARCH article
Front. Immunol., 15 July 2024
Sec. B Cell Biology
Volume 15 - 2024 | https://doi.org/10.3389/fimmu.2024.1409434
This article is part of the Research TopicCommunity Series in BCR Signaling and B Cell Activation: Volume 2View all 8 articles
 Daniela Pérez-Pérez1,2
 Ezequiel M. Fuentes-Pananá3
 José Mizael Flores-Hermenegildo4
 Hector Romero-Ramirez4
 Leopoldo Santos-Argumedo4
 Manfred W. Kilimann5
 Juan Carlos Rodríguez-Alba6,7
 Gabriela Lopez-Herrera2*
Introduction: Lipopolysaccharide-responsive and beige-like anchor (LRBA) is a scaffolding protein that interacts with proteins such as CTLA-4 and PKA, the importance of which has been determined in various cell types, including T regulatory cells, B cells, and renal cells. LRBA deficiency is associated with an inborn error in immunity characterized by immunodeficiency and autoimmunity. In addition to defects in T regulatory cells, patients with LRBA deficiency also exhibit B cell defects, such as reduced cell number, low memory B cells, hypogammaglobulinemia, impaired B cell proliferation, and increased autophagy. Although Lrba-/- mice do not exhibit the immunodeficiency observed in humans, responses to B cell receptors (BCR) in B cells have not been explored. Therefore, a murine model is for elucidating the mechanism of Lrba mechanism in B cells.
Aim: To compare and evaluate spleen-derived B cell responses to BCR crosslinking in C57BL6 Lrba-/- and Lrba+/+ mice.
Materials and methods: Spleen-derived B cells were obtained from 8 to 12-week-old mice. Subpopulations were determined by immunostaining and flow cytometry. BCR crosslinking was assessed by the F(ab’)2 anti-μ chain. Activation, proliferation and viability assays were performed using flow cytometry and protein phosphorylation was evaluated by immunoblotting. The nuclear localization of p65 was determined using confocal microscopy. Nur77 expression was evaluated by Western blot.
Results: Lrba-/- B cells showed an activated phenotype and a decreased proportion of transitional 1 B cells, and both proliferation and survival were affected after BCR crosslinking in the Lrba-/- mice. The NF-κB pathway exhibited a basal activation status of several components, resulting in increased activation of p50, p65, and IκBα, basal p50 activation was reduced by the Plcγ2 inhibitor U73122. BCR crosslinking in Lrba-/- B cells resulted in poor p50 phosphorylation and p65 nuclear localization. Increased levels of Nur77 were detected.
Discussion: These results indicate the importance of Lrba in controlling NF-κB activation driven by BCR. Basal activation of NF-κB could impact cellular processes, such as, activation, differentiation, proliferation, and maintenance of B cells after antigen encounter.
LRBA is a ubiquitous protein whose functions have been described in immune, kidney, and neuronal cells. Since 2012, over 100 pathogenic variants of LRBA have been associated with common variable immunodeficiency (1–5)as well as autoimmune disorders such as neonatal insulin-dependent diabetes mellitus (IDDM) (6–12), autoimmune lymphoproliferative syndrome (ALPS)-like syndrome (1, 3, 13), immune dysregulation, polyendocrinopathy, enteropathy, and X-linked syndrome (IPEX)-like syndrome (1, 3, 13, 14).
LRBA is a high molecular weight protein that belongs to a family of proteins containing Beige and Chediak-Higashi (BEACH), pleckstrin homology (PH)-like proteins, and WD40 repeats, named BEACH domain-containing proteins (BDCPs). BDCP variants affect cellular processes, such as apoptosis, lysosome size, autophagy, granule size, and neuronal synapse formation (15). Additionally, some of LRBA’s predicted LRBA domains are related to vesicular trafficking, such as the Concanavalin A (ConA)-like, vacuolar protein sorting (VPS)-27, hepatocyte growth factor-regulated tyrosine kinase substrate (Hrs), and signal transducing adaptor molecule (STAM) VHS domains (16).
Moreover, LRBA functions as an A-kinase-anchoring protein (AKAP), enabling its interaction with the PKA regulatory subunit (17) and its substrates. This interaction facilitates the correct localization of signaling complexes, thereby ensuring their functionality (16, 18). Recent studies in Lrba-/-knockout mice indicated that Lrba is involved in the PKA phosphorylation of aquaporin 2 in kidney cells (19).
Although the molecular functions of LRBA protein have been described in the recycling of CTLA-4 in T regulatory cells (2), a significant proportion of patients with LRBA deficiency present defects in the number of memory B cells, low serum antibodies, and autoimmunity such as thrombocytopenia and hemolytic anemia (1), suggesting an additional mechanism of LRBA in the correct function of B cells.
B cells are essential components of the immune response and lead to the production of specific antibodies. They respond to extrinsic signals that activate signaling pathways through different receptors, resulting in proliferation, survival, and differentiation. The B-cell receptor (BCR) is crucial for B cells; it consists of a membrane Immunoglobulin (mIg) coupled to the heterodimer Igα/Igβ. Signaling through this receptor depends on the stage of B cell differentiation; in immature B cells, it promotes cell death, whereas in mature B cells, it leads to proliferation (20–22).
The cross-linking of mIg initiates BCR signaling after contact with the specific antigen, leading to the phosphorylation of immunoreceptor tyrosine-based activation motifs (ITAM) in Igα and Igβ proteins, which are then recognized and bound to Lyn kinase. Subsequently, Syk kinase participates in phosphorylating Bruton’s tyrosine-kinase (Btk) and the scaffolding B-cell linker protein (Blnk), allowing the converging signaling activation of mitogen-activated protein kinase (MAPK) and phospholipase-C gamma 2 (Plcγ2). MAPK kinase signaling culminates in the activation of transcription factors such as AP-1 and Elk, while Plcγ2 leads to the activation of nuclear factor of activated T-cells (NFAT) and nuclear factor kappa-light-chain-enhancer of activated B cells (NF-κB) (23).
NF-κB is a family of proteins with transcriptional activity involved in immune processes (24). The canonical pathway of NF-κB culminates in the nuclear translocation of p50/p65 dimers, allowing the targeting of genes. These proteins typically remain inactive in the cytosol thanks to the interaction with the inhibitor kappa B (IκBα). For p50/p65 activation, it is necessary the phosphorylation and subsequent degradation of IκBα driven by IKKα/IKKβ. When the p65/p50 is released, it is phosphorylated by IKKα and PKA, a process necessary for entry to the nucleus. Although NF-κB is a transcription factor broadly expressed in cells, its specific functions in the development, survival, and activation of B cells have been described (25).
LRBA human immunodeficiency manifests as substantial defects in B cells such as diminished B cell counts, reduced immunoglobulin production, and B cell proliferation. B cells also show poor survival and reduced autophagy (1), suggesting that proper LRBA function is crucial for B cell biology.
In this study, we explored B-cell defects in Lrba-/- mice. Peripheral B cell differentiation in the spleen showed a slightly lower but significant proportion of Transitional 1 B cells. Additionally, low B cell proliferation and altered survival were observed in response to BCR crosslinking. Additionally, in the absence of Lrba, molecules involved in BCR signaling are altered, and Btk, Plcγ2, IκBα, and p50 are overexpressed and hyperphosphorylated in basal conditions. Additionally, the phosphorylation of NF-κB components after BCR crosslinking showed a reduced response in Lrba-/- B cells, and p65 showed a nuclear localization in basal conditions. Nur77 was overexpressed, suggesting chronic BCR activation. Our results indicate that Lrba is essential for controlling the activation of BCR signaling molecules.
Antibodies and reagents used in this work including NF-κB p50 (E-10), phospho NF-κB p50 (Ser336) (A-8), RELA/NF-κB p65 (A-12), phospho-RELA/NF-κB p65 (Ser536) (27. Ser536), NFKBA/IKb alpha (H-4), beta Actin (C4), Plcγ2 (B-10) and Nur77 (C-5) were obtained from (Santa Cruz Biotechnology, CA, USA). Phospho-IκBα (Ser32/36) (5A5) mouse mAb #9246 was procured from (Cell Signaling Technology, MA, USA). Purified Anti-Human Btk antibody and BD Pharmingen Purified Mouse anti-Btk (Y551)/ItkY511 (24a/BTK) was purchased from BD Transduction Laboratories (NJ, USA), PE anti-Plcγ2 Phospho (Tyr759) Recombinant Antibody (QA20A56) from Biolegend (CA, USA), and Plcγ2 inhibitor U73122 (Merck Millipore, MA, USA). Additionally, PE anti mouse-Cd21/Cd35 Monoclonal Antibody (4E3), PerCP/Cy5.5 anti-mouse Cd44(IM7); (eBioscience, San Diego, CA, USA), goat anti-Mouse IgG (H+L) Secondary Antibody, Goat IgG anti-mouse Alexa Fluor 594 (Invitrogen), and Propidium Iodide (Thermo Scientific, MA, USA) were used. Polyclonal Anti-LRBA/BGL antibody was purchased from Abcam, Cambridge, UK). PE anti-mouse I-Ab Antibody (AF6-120.1), APC anti-mouse/human Cd45R/B220 Antibody (RA3-6B2), and PerCP/Cyanine5.5 anti-mouse Cd24 Antibody (M1/69) were purchased from BioLegend (CA, USA). AffiniPureTM F(ab’)2 Fragment Goat Anti-Mouse, μ chain specific (referred to as Anti-IgM), secondary antibodies Peroxidase AffiniPure™ Goat Anti-Mouse IgG (H+L) and Peroxidase AffiniPure™ Goat Anti-Rabbit IgG (H+L) were obtained from Jackson ImmunoResearch Laboratories Inc®, PA, USA. DAPI was purchased from Sigma-Aldrich (St. Louis, MO).
Lrba-/- mice were kindly donated by PhD Manfred W. Kilimann from the Max Planck Institute, Germany (26, 27). C57BL/6 Lrba-/- and Lrba+/+ mice were maintained in germ-free installations at the animal facility of the Centro de Investigacion y de Estudios Avanzados (CINVESTAV) according to the institutional animal guidelines for animal care and experimentation (Protocol number 0145-15, UPEAL-CINVESTAV-IPN). These mice have a deletion in exon four that drives the absence of the protein. For the experiments described here, the mice oscillated between 8 and 12 weeks of age. The mice were genotyped before the experiments were performed as described previously (26).
Mice were euthanized by cervical dislocation and spleens were obtained. The sizes and weights of the spleens were measured. Then, the spleens were disaggregated, and erythrocytes were lysed using a homemade solution (NH4Cl 0.15 M, KHCO3 10 mM, EDTA 100 Mm) for 5 min at 25 °C. After cell counting, the samples were prepared for the assays described below.
B cell subpopulations were determined using flow cytometry. Total splenocytes were stained with anti-B220-APC, anti-Cd21-PE, and anti-Cd23-PerCP/Cy5.5 and anti-IgM APC-Cy7 antibodies, incubated for 30 min, and washed once with PBS. For analysis using FlowJo (Becton Dickinson), B220-positive cells were gated among lymphocytes, and Cd23, Cd21, and IgM levels were used to determine the proportions of T1 (Cd23-Cd21lowIgM+), T2 (Cd23+Cd21hiIgM+), follicular B cells (Cd23+low Cd21lowIgMlow) and Marginal zone (MZ) B cells (Cd23+low Cd21highIgM+). Finally, absolute numbers for each subpopulation were calculated based on the percentages obtained for each B cell subpopulation. Data were acquired on a Northern Lights spectral flow cytometer (Cytek Biosciences, Fremont, CA, USA).
Splenocytes were incubated with anti-mouse PerCP/Cy5.5-Cd44, PE anti-mouse I-Ab, and APC anti-B220 (Biolegend) for 30 minutes to detect activation marker expression, then washed once with PBS. Data were acquired using a FACs Aria I flow cytometer (Beckton Dickinson). Median fluorescence intensities (MFI) for Cd44 and I-Ab were obtained using FlowJo software.
Proliferation assays were conducted using CellTrace™ CFSE (Life Technologies, Carlsbad, CA, USA). The splenocytes were harvested at a final concentration of 1 × 10⁶ cells and stained with CFSE at 0.5 μM. The stained splenocytes were then cultured in RPMI medium supplemented with 10% fetal bovine serum (FBS) (Gibco, NY, USA), penicillin-streptomycin 1X (Sigma-Aldrich®, MO, USA), and 100 ng/mL of recombinant murine IL-4 (Biolegend, CA, USA). Cells were plated in 24-well cell culture plates at a concentration of 2.5 × 10⁵ cells per well and stimulated with anti-IgM at a final concentration of 10 μg/ml. After 96 h of incubation, the cells were stained with anti-B220-APC and data acquisition was performed using a FACs Aria instrument (Becton Dickinson). Proliferation was analyzed from viable (propidium iodide negative) B220+ B cells.
Total splenocytes (5 × 10⁵ cells/ml) were cultured in 24-well cell culture plates for 4, 12, or 20 h. Anti-IgM stimuli were added at a concentration of 10 μg/mL. After incubation, cells were stained with anti-B220-APC and propidium iodide to evaluate cell viability. Analysis was performed using FlowJo software (Becton Dickinson).
B cell assays were conducted using samples enriched for B cells through negative selection with magnetic beads, employing the MojoSortTM Mouse Pan B Cell Isolation Kit and following the manufacturer’s instructions (Biolegend®, CA, USA). Briefly, cells were resuspended at a concentration of 1.5 × 10⁸ cells/mL in a handmade buffer for sorting B cells, consisting of PBS with 0.1% bovine serum albumin and 0.5 μM EDTA. Subsequently, 10 μl of the Biotin-Antibody cocktail from the MojoSortTM Mouse Pan B Cell Isolation Kit (Biolegend®, CA, USA) was added, and the mixture was incubated on ice for 15 min. After incubation, the cells were washed once and Streptavidin Nanobeads were added and incubated for another 15-min incubation. The cells were washed again, and B cells were isolated by incubating the cell suspension three times for 10 min each in a MojoSort™ Magnet (Biolegend®, CA, USA). The purified B cells were then resuspended in PBS at a concentration of 10 × 106 cells/mL and stimulated with Anti-IgM (10 μg/mL) for 10 and 20 min at 37°C. For inhibition assays, cells were treated similarly, however, they were preincubated with 0.25 μM U73122 for 2 h, and p50 phosphorylation was determined.
After stimulation, the cells were centrifuged and pellets were obtained. Whole-cell lysate was prepared by adding 100 μl of Cell Lysis Buffer 1× (Cell Signaling Technologies®, MA, USA) along with the complete ULTRA tablets’ protein inhibitor cocktail (ROCHE®, Switzerland). The cells were centrifuged at 17200 × g at 4°C for 10 min, and supernatants were collected. Protein concentration was determined using a DC™ Protein Assay Kit II (Bio-Rad, Hercules, CA, USA). The lysates were then mixed with 20 μl of Laemmli buffer 6X added with 5% β-mercaptoethanol was added, and the mixture was boiled at 95°C.
To evaluate the expression and/or phosphorylation of signaling proteins after BCR activation, samples were separated on a 12% acrylamide gel, and electrophoresis was performed for 3 h at 80V. Proteins were transferred to PVDF membranes for 25 min at 25V using a Trans-Blot Turbo Transfer System (Bio-Rad). The PVDF membranes were blocked for 30 min in a solution of 3% fat-free milk in TBS-Tween 0.1%. Primary antibodies including Btk, Plcγ2, p50, pSer336 p50, p65, pSer536, p65, IκBα, and pSer32/36 IκBα, diluted at 1:500, and β-Actin, diluted at 1:2000, were incubated overnight. Secondary antibodies (anti-mouse IgG-HRP or anti-rabbit IgG-HRP, diluted 1:3000) were added and incubated for 90 min. The membranes were washed three times after incubation with 1% TBS-Tween 0.1% in 5% fat-free milk for 10 min.
For protein detection, SuperSignal™ West Femto Maximum Sensitivity Substrate (Thermo Scientific®, MA, USA) was used, and membrane visualization was performed using the ChemiDocTM XRS+ imaging system, densitometric analysis was performed using the ImageLab™ Software (Bio-Rad®, CA, USA).
Splenocytes were stained with APC anti-B220 for 30 minutes, fixed, and permeabilized with BD Phosflow™ Fix Buffer I and Perm Buffer III (Becton Dickinson), and following manufacturer’s instructions. After permeabilization, the cells were incubated overnight with PE anti-pY759 Plcγ2. The cells were then washed with PBS containing 1% FCS and acquired using a flow cytometer. MFI was calculated for each sample, and an index of expression was obtained by dividing the MFI of pY759 Plcγ2 positive cells by the MFI of negative cells.
For p65 staining, 5 × 10⁵ splenocytes were stimulated with anti-IgM (10μg/mL) for 5 and 15 min, as described previously. After washing with PBS, cells were fixed with 4% paraformaldehyde in PBS for 15 min at 4°C. Then, cells were permeabilized with 0.2% Triton X-100 for 10 min at room temperature and blocked with 10% goat serum in PBS for 30 min at 37°C. Subsequently, cells were incubated with anti-p65 antibody diluted 1:150 and incubated for 1 h at 4°C. After incubation, cells were stained with anti-mouse IgG Alexa Fluor 596 (1:750) and DAPI (1:1000) for 30 min at 4°C.
Cells were mounted on coverslips previously coated with 0.01% Poly L-lysine (Sigma-Aldrich®, MO, USA) and incubated for 1 h at 37°C. The coverslips were then washed with PBS and mounted on slides using the Vectashield mounting medium (Vector Laboratories Inc., CA, USA).
For Nur77 detection, enriched B cells were lysed as described previously, and protein extracts were loaded into 12% acrylamide/bis-acrylamide gels and transferred onto nitrocellulose membranes. Procedures for Western blotting and protein detection were described in section 2.8.
An LSM 710-Live Duo Scan confocal microscope (Zeiss, Germany) was used to visualize the cells. Subsequently, images were analyzed using FIJI software (28). The co-localization test and Colocalization Finder Plugin were used to determine the nuclear localization of p65 and Pearson’s correlations.
Subpopulation proportions, proliferation, and viability were statistically analyzed using the Mann–Whitney U test. Densitometric data from the immunoblots were obtained using ImageLab™ software (Bio-Rad). The amount of total or phosphorylated proteins was normalized by calculating the ratio of total protein or phosphorylated protein to housekeeping proteins. Statistical differences were determined using the Mann-Whitney U test.
For nuclear localization of p65, colocalization with DAPI was determined, and Pearson’s coefficient was obtained using the FIJI software (28), where a coefficient close to one indicates strong nuclear localization of p65. Statistical analysis of variance (ANOVA) was performed to compare the nuclear localization of p65 in basal and BCR-crosslinked cells from both wild type (WT) and Lrba-/- mice. All statistical analyses were conducted using GraphPad Prism software version 8.0 for Windows (GraphPad Software, San Diego, CA, USA; www.graphpad.com).
In humans, LRBA deficiency results in an extended phenotype that includes recurrent infections, autoimmunity, lymphoproliferation, and splenomegaly. Although Lrba-/- mice appeared to have a healthy phenotype, evidence of splenomegaly was observed in this study. The weights of the spleens were measured (Figure 1A). The spleen weight of Lrba-/- mice was higher (0.1048 ± 0.009 g) than Lrba+/+ mice (0.0715 ± 0.0178 g), suggesting splenomegaly. Total splenocytes were obtained as previously described. In addition to the macroscopic data of the spleen (size and weight), the total splenocyte count was higher in Lrba-/- mice (179.9 ± 50.6 × 10⁶ cells) than in WT mice (127.5 ± 25.04 × 10⁶ cells) as shown in Figure 1A.
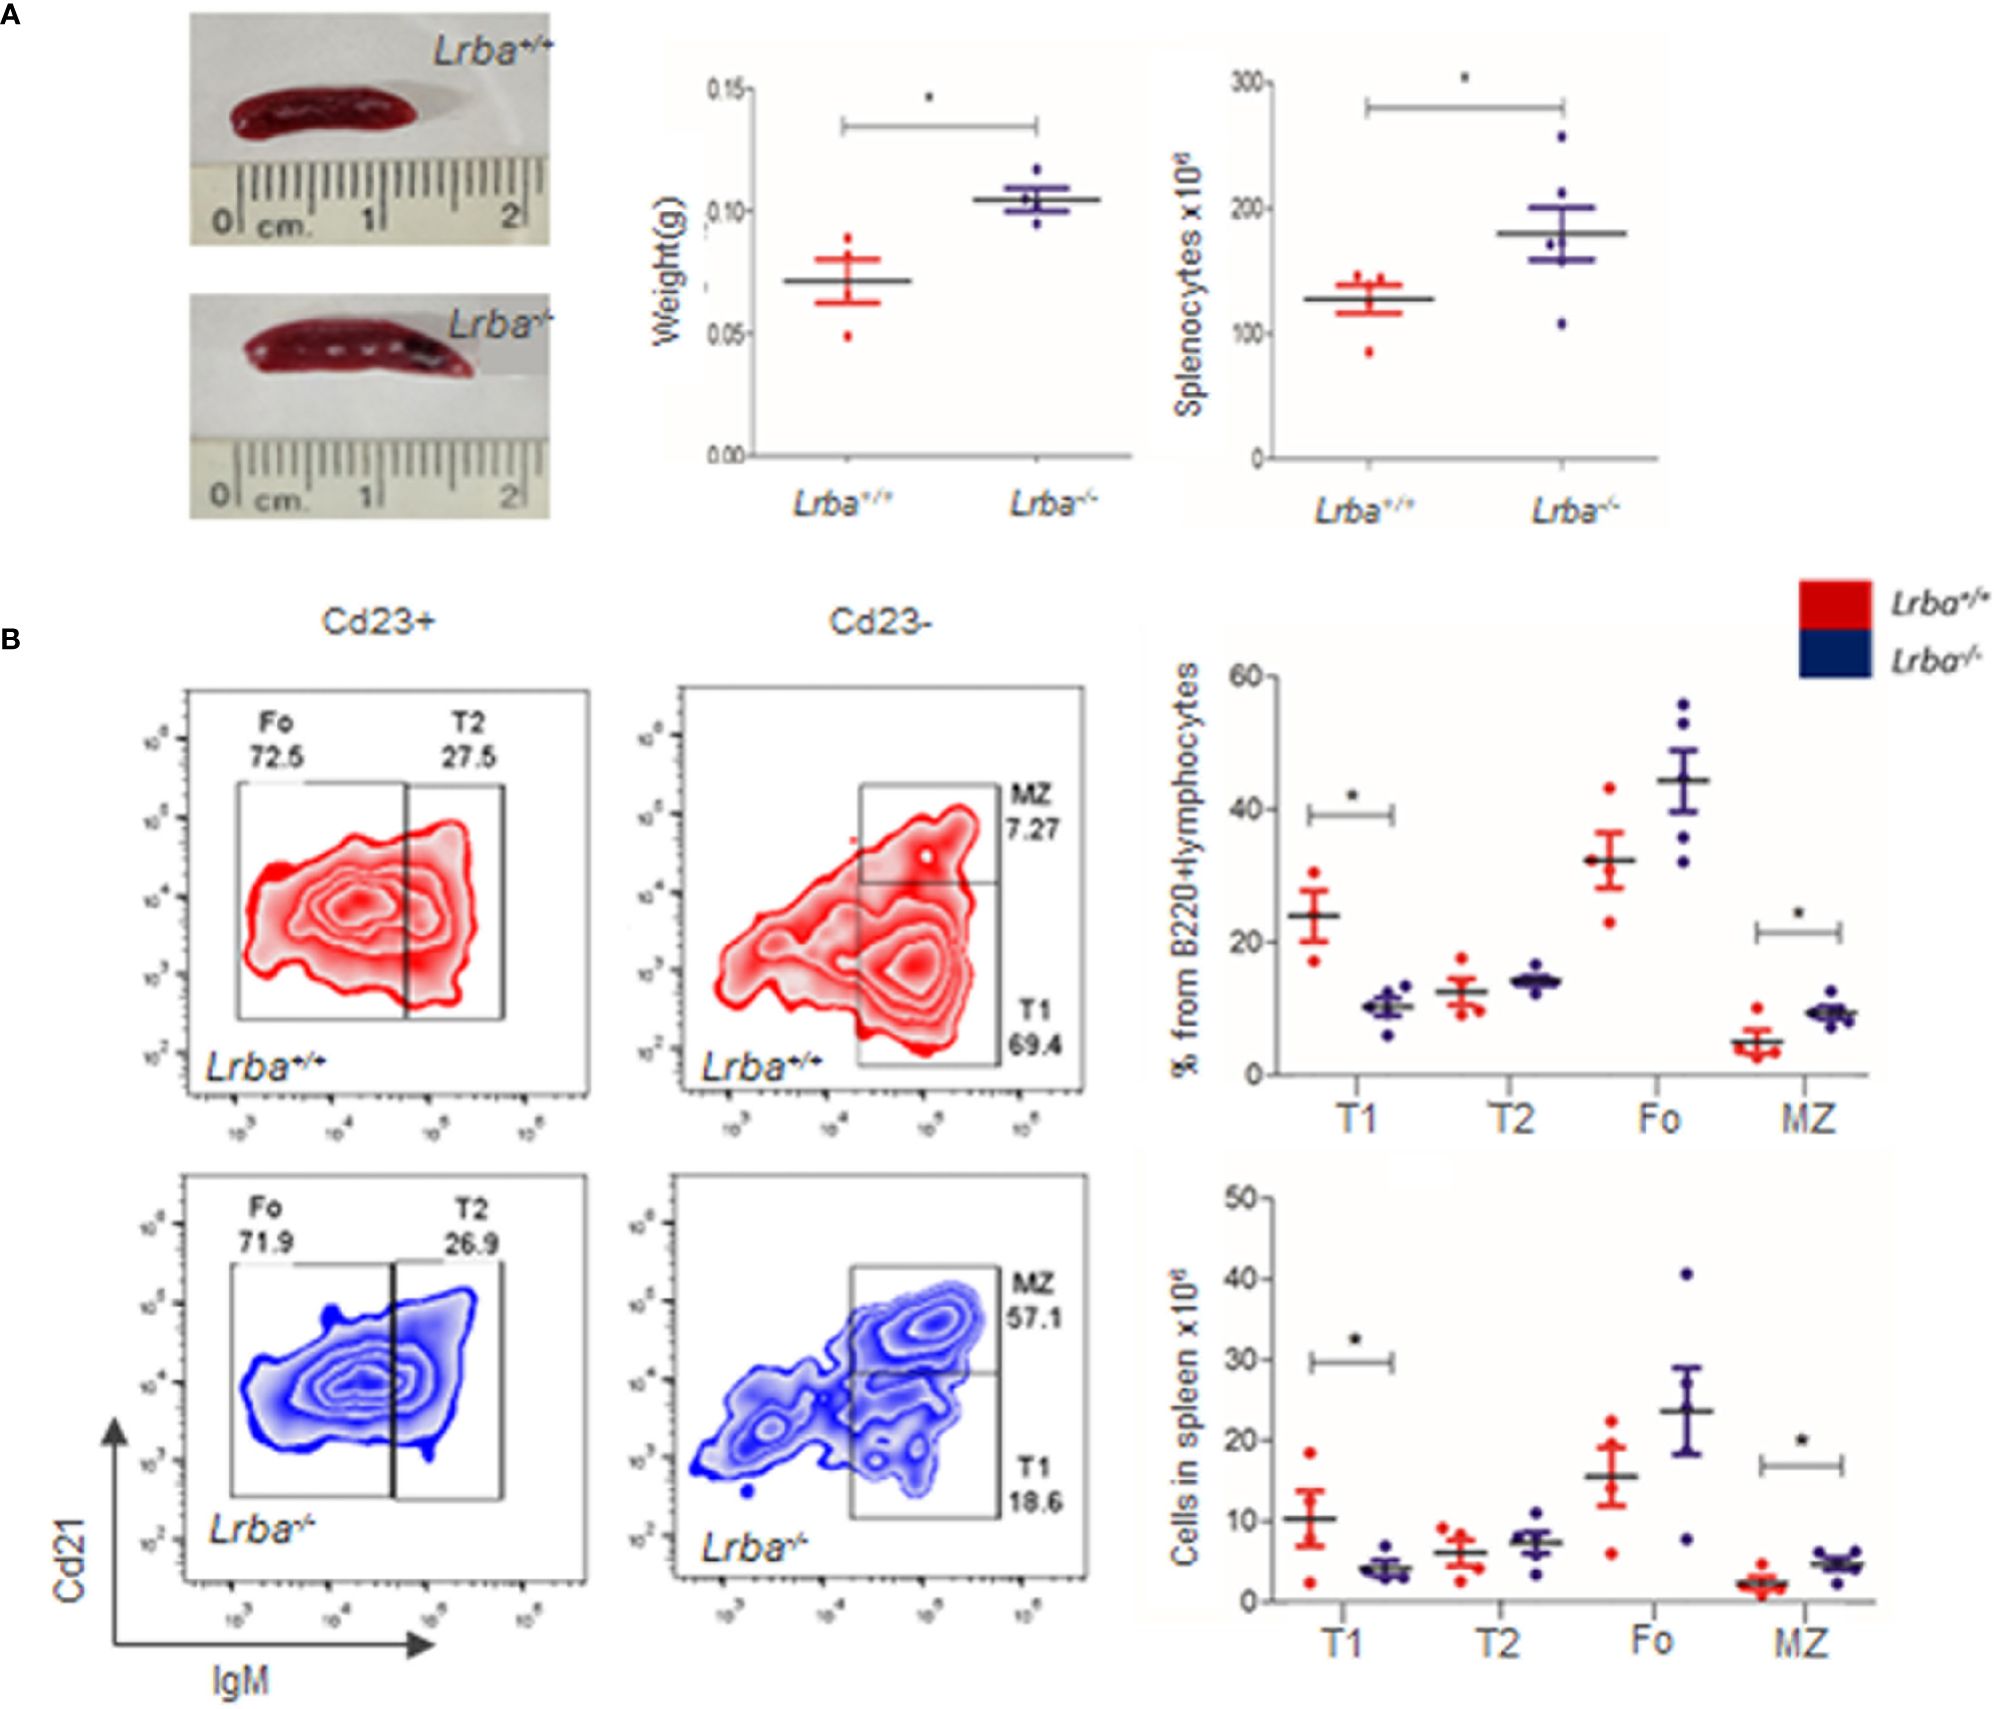
Figure 1 Peripheral B cell differentiation in Lrba deficient B cells. (A) Splenomegaly in Lrba-/- mice. Representative image of the spleen in Lrba-/- and Lrba+/+ mice (left). Spleen weight in Lrba-/- and Lrba+/+ mice, (n=4, middle). Total splenocytes in Lrba-/- and Lrba+/+ mice (right). (B) Peripheral B cells differentiation. Representative plots of Transitional 1 (T1), Transitional 2 (T2), Marginal Zone (MZ), and Follicular (Fo) B cells in the spleen from Lrba-/- and Lrba+/+ mice evaluated by Cd21 and IgM expression. Representative zebra plot of T1, T2, Fo, and MZ B cells in a Cd23+ or Cd23- gate (left). Proportions from total B cells and number of cells are indicated in Graphs (right, n=4). * = p<0.05.
Splenocytes were immediately stained with anti-Cd23, anti-Cd21, anti-IgM, and anti-B220 antibodies. There were no differences in the B cell proportion or total counts (Supplementary Figure 1A). The proportions of transitional 1 (T1), transitional 2 (T2), marginal zone (MZ), and follicular B cell subpopulations were determined by flow cytometry (Figure 1B). T1 cell proportions were lower in Lrba-/- mice (10.26 ± 2.93%) than in WT mice (23.98 ± 6.69%), which was statistically significant. T2 cell proportions were similar between both strains, with values of (14.24 ± 1.55%) for Lrba-/- and (12.56 ± 3.97%) for Lrba+/+. Follicular B cell proportions were similar in Lrba-/- mice (44.31 ± 10.35%) Lrba+/+ mice (32.37 ± 8.3%). Finally, there MZ cells are higher in Lrba-/- mice (9.37 ± 2.07%) versus Lrba+/+ mice (5.01 ± 3.44%), Figure 1B.
Absolute numbers of T1 B cells were lower in Lrba-/- mice (4.16 ± 1.86) than in Lrba+/+ mice (12.96 ± 5.33). Also, the numbers of MZ cells were higher in Lrba-/- mice (4.68 ± 1.63) than in Lrba+/+ mice (2.27 ± 1.63). No differences were observed with the total number of T2 (7.31 ± 2.85) in Lrba-/- mice and (6.04 ± 3.2) in Lrba+/+ mice; follicular B cells (23.66 ± 12.02) in Lrba-/- mice and (15.52 ± 7.22) in WT mice (Figure 1B).
When immature B cells enter the spleen, a second negative selection occurs in T1 cells. Therefore, BCR signaling at this stage of differentiation drives cell death. Following this line of thought, the differences in T1 proportions in the absence of Lrba suggest a possible altered response to BCR cross-linking. Proliferation was measured to determine if Lrba-/- B cells responded to BCR stimulation. Interestingly, the proportion of proliferating B cells stimulated with anti-IgM was lower in Lrba-/- B cells (22.56 ± 12.8%) than in WT mice (40.34 ± 15.88%). These differences were significant (Figure 2A). In contrast, Ki67 expression was measured as a marker for in situ proliferation, interestingly increased Ki67 expression was observed in Lrba-/- B cells (Supplementary Figure 1B).
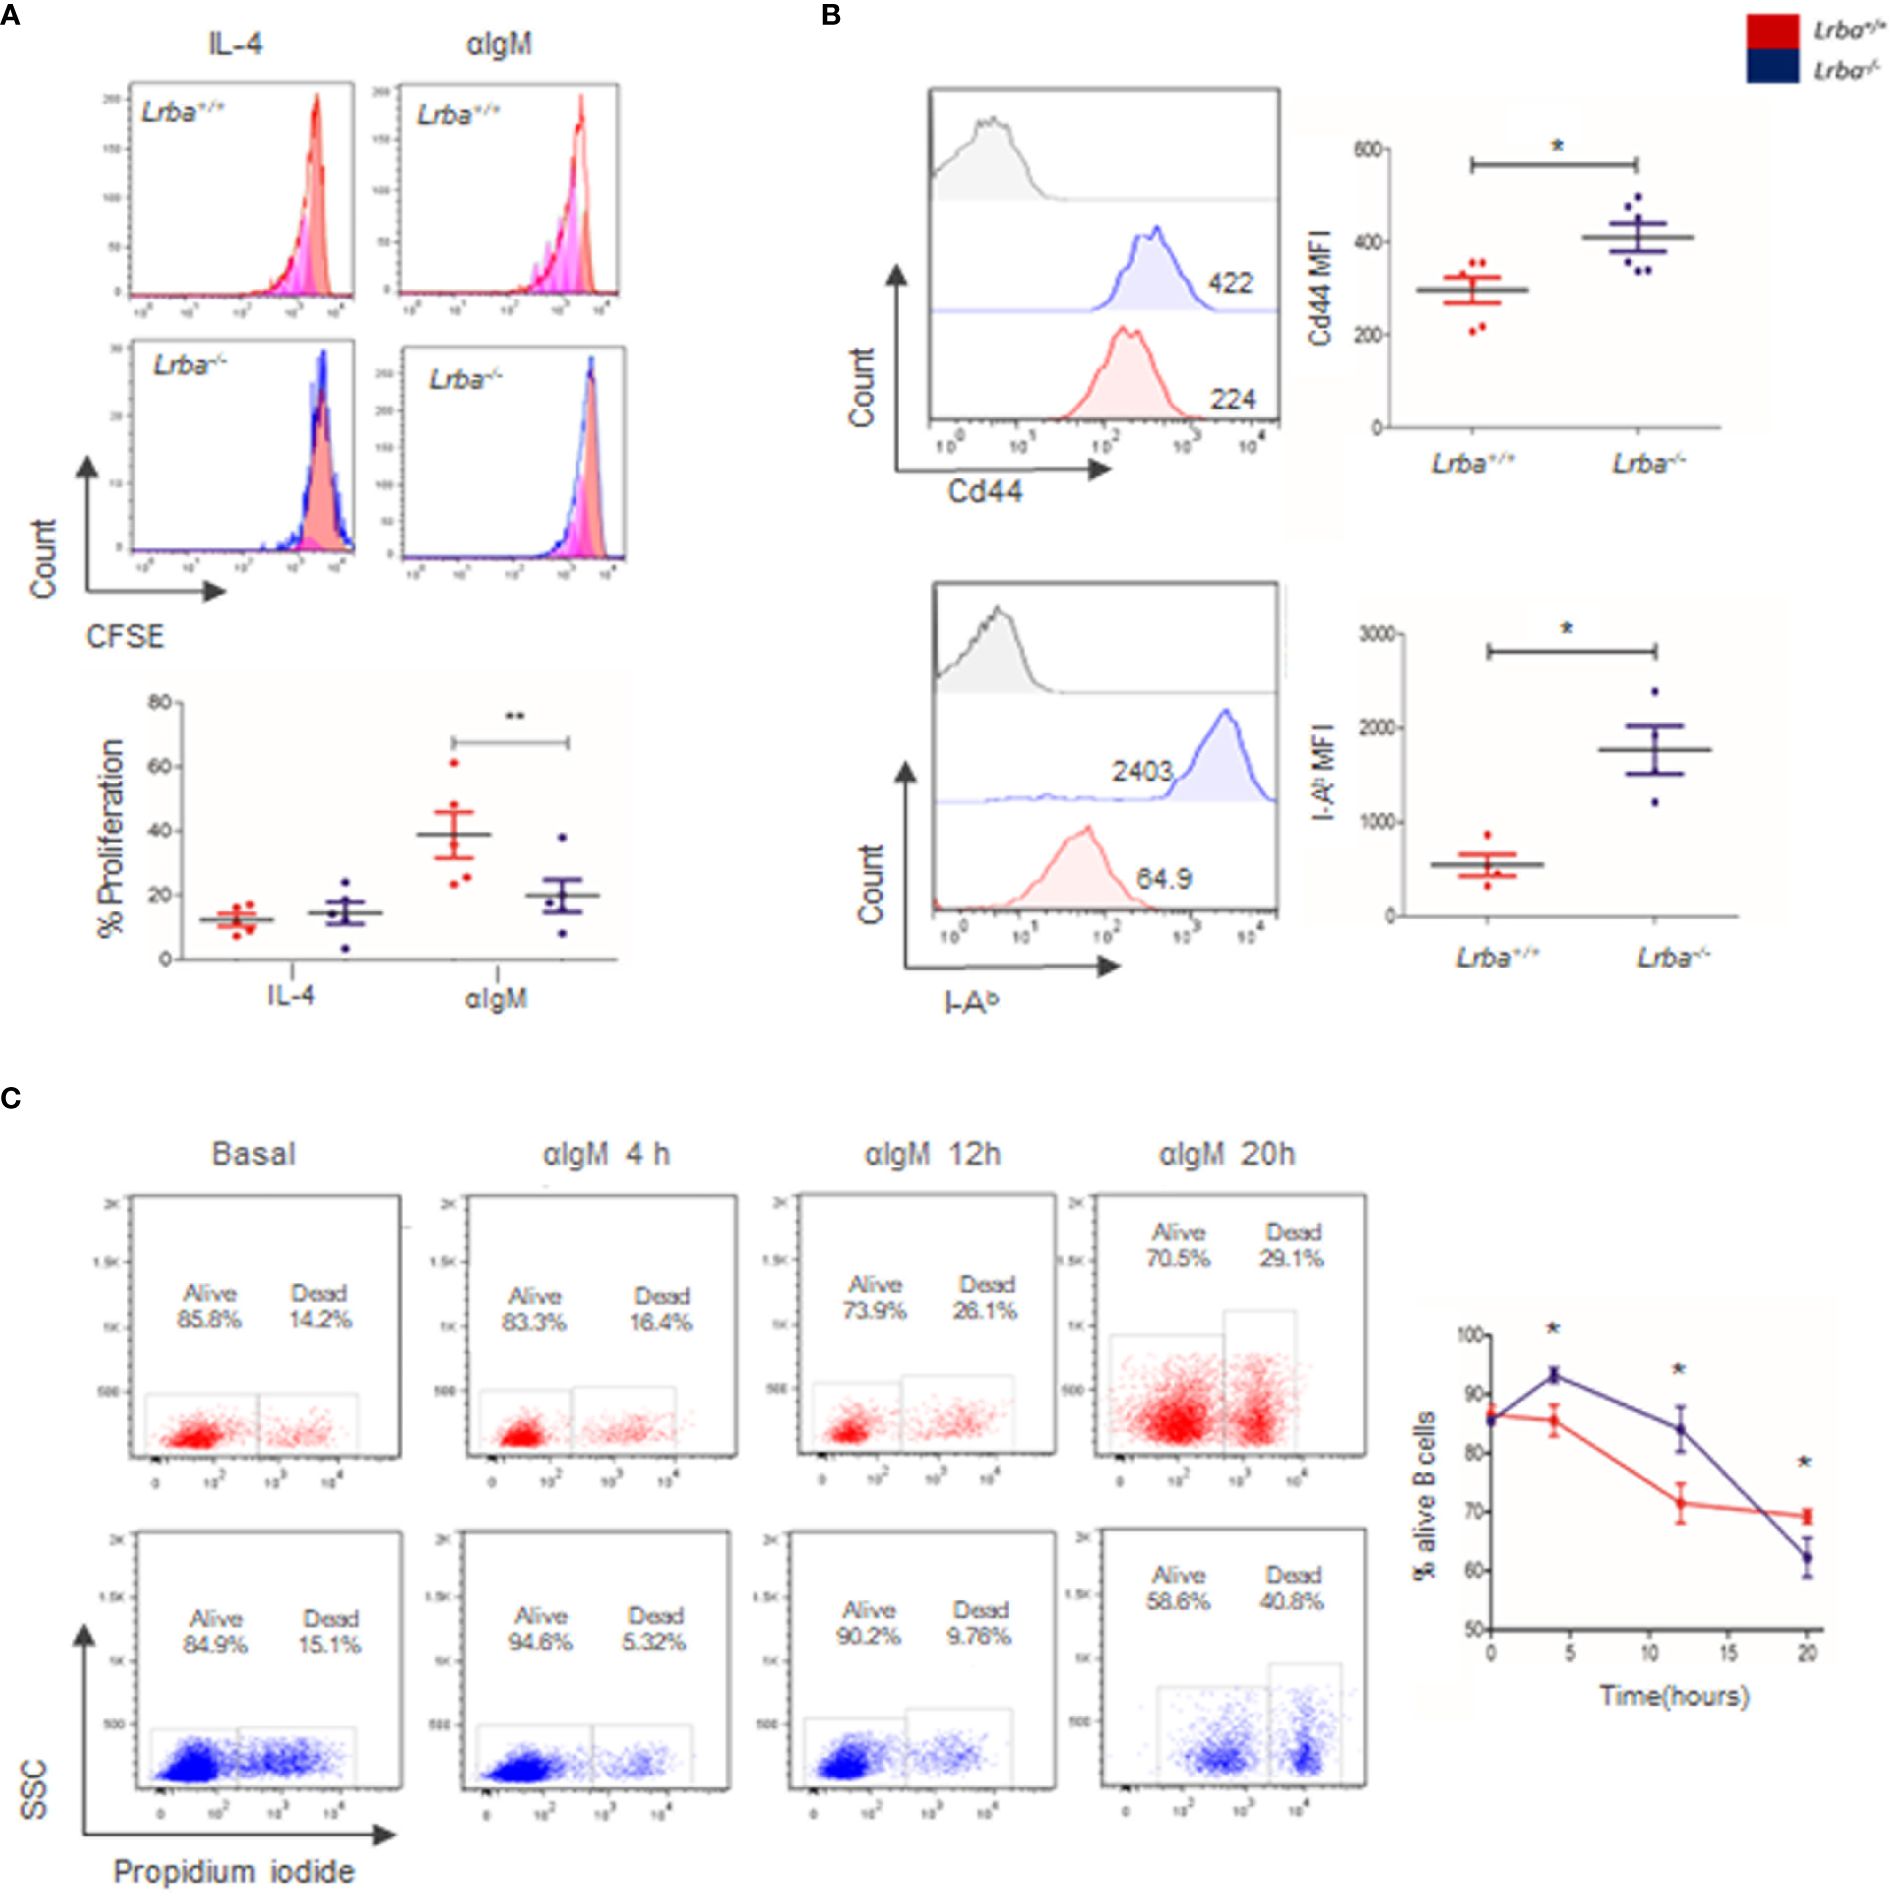
Figure 2 Proliferation, survival, and activation of B cells. (A) Representative histograms of CFSE staining of B cells cultured for 96 h with anti-IgM (left). Proportions of proliferating B cells activated through BCR and IL-4 (right). Results were gated from B220+ and Propidium iodide (PI) negative cells and analyzed by flow cytometry, n=5. (B) Basal activation of B cells. Cd44 and I-Ab expression were assessed by flow cytometry in B220+ cells. MFI were compared. Cd44 n=6; I-Ab n=4. * = p<0.05; ** = p<0.01. (C) B cell viability after BCR activation at 4, 12, and 20 (h) Representative plots were analyzed by flow cytometry (left). B cell viability at 4, 12, and 20 h of BCR stimulation (n=4, right).
Increased expression of activation markers, as CD44 and I-Ab were detected in B cells from Lrba-/- mice. In the case of CD44, MFI was 409 ± 73.3 for Lrba-/- and 296 ± 66.86 for Lrba+/+ B cells, while for I-Ab expression, MFI was 1768 ± 506.6 for Lrba-/- and 542.8 ± 230.9 for Lrba+/+ B cells (Figure 2B).
Lower proliferative responses detected in Lrba-/- mice could be the result of altered cell survival, as previously reported for B cells from LRBA-deficient patients (1). Therefore, B cell survival assays were performed on unstimulated and BCR-stimulated cells over time. The proportion of Propidium Iodide (PI)-negative cells was calculated within the B220+ gate (Figure 2C). At time 0 or under unstimulated conditions, B cells from both mice showed similar survival proportions (85.54% ± 1.9 for Lrba-/- and 86.57% ± 2.96 for WT). After 4 h of culture and BCR crosslinking, survival was significantly higher in Lrba-/- mice (93.27% ± 2.55) compared to that (85.55% ± 5.23) in WT mice. A similar trend was observed at 12 h of BCR activation: the proportion of viable B cells in Lrba-/- mice was 84.07% ± 7.65 compared to 71.46% ± 7.48 observed in B cells from the WT counterpart. Interestingly, after 20 h of stimulation, Lrba-/- B cell survival drastically decreased (62.26% ± 5.84) compared to WT B cell survival (69.21% ± 2.64) (Figure 2C). These data suggested that the low proliferative response after 96 h of stimulation may be due to reduced cell survival in response to BCR activation in B cells from Lrba-/- mice.
The inadequate proliferative and survival responses to BCR crosslinking suggested an inadequate response in this pathway. BCR signaling begins with the phosphorylation of ITAM motifs and activates kinases such as Syk and Lyn. Following this, Btk is phosphorylated, leading to the activation of Plcγ2. The evaluation of proximal BCR signaling protein expression revealed increased basal expression of Btk and Plcγ2; these results were statistically significant when densitometric analysis using β-actin as a control was performed (Figure 3A).
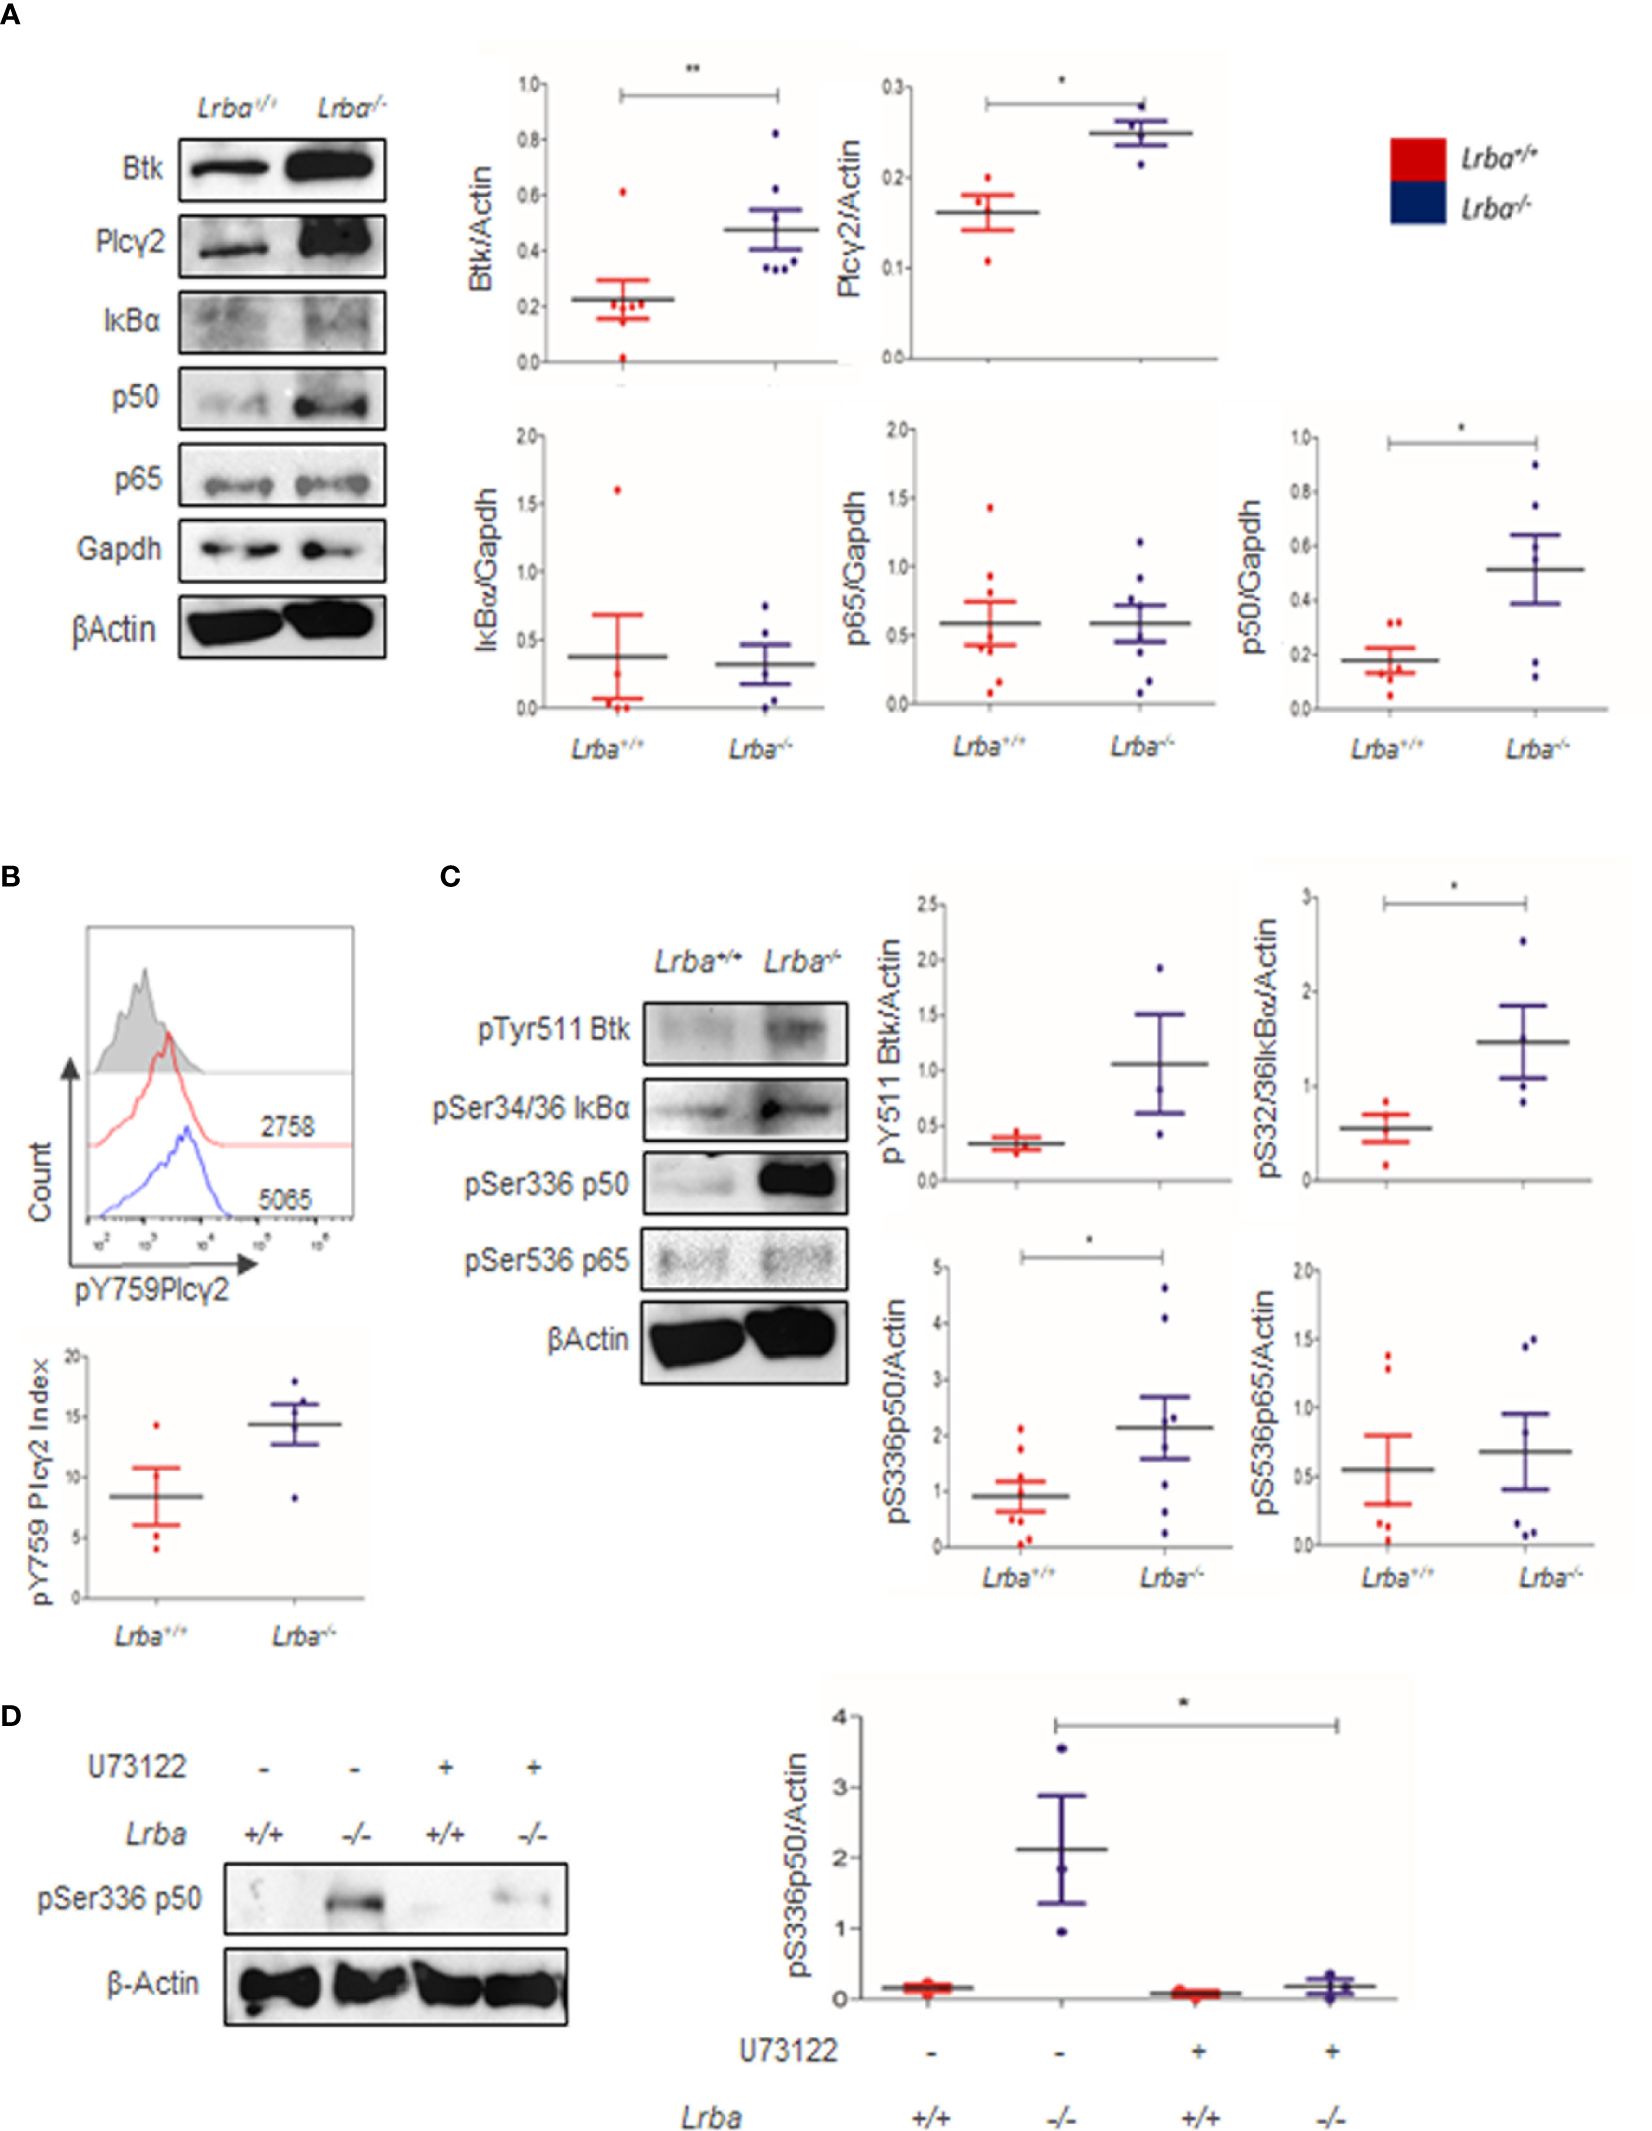
Figure 3 Btk, Plcγ2, IκBα, p50, and p65 expression in B cells. (A) Representative immunoblot of Btk, Plcγ2, IκBα, p50, and p65 expression in B cells in basal conditions (left). GAPDH or β-Actin were used as loading controls. Densitometric analysis of Btk, Plcγ2, IκBα, p50, and p65 in basal conditions (right, n=4 to 6). (B) Phosphorylated Plcγ2 expression in B cells assessed by Flow Cytometry (top). Index of MFI from positive divided by negative phospho-Plcγ2 in Lrba-/- and Lrba+/+ mice (bottom, n=4). (C) Representative immunoblot showing phosphorylated components of NF-κB, IκBα, p50, and p65 in B cells. (left). Densitometric analysis of phosphorylated components of pSer32/36 IκBα, pSer336 p50, and pSer536 p65 compared to the loading control. Phosphorylated residues are indicated (right), n=5. * = p<0.05; ** = p<0.01. (D) Plcγ2 inhibition assays with U73122, representative blot (left); densitometric analysis of Plcγ2 inhibition (right).
Diacylglycerol production after Plcγ2 activation has a direct impact on NF-κB activation. NF-κB is composed of IκBα, p50, and p65. Expression of IκBα and p65 was similar between Lrba-/- and Lrba+/+ B cells. However, p50 expression increased in Lrba-/- B cells (Figure 3A). The expression of IκBα, p50, and p65 was similar in total splenocytes (Supplementary Figure 2). Increased expression of proximal BCR signaling molecules suggests that this signaling pathway is altered. Therefore, we explored the phosphorylation status of NF-κB.
Plcγ2 phosphorylation was explored; however, as shown in Figure 3B, a tendency towards increased phosphorylation for Plcγ2 was observed (14.4 ± 3.69 for Lrba-/-, and 8.41 ± 4.72 for Lrba-/-), but the differences were not significant (Figure 3B), similar data was obtained for Btk phosphorylation, Figure 3C.
NF-κB is a family of transcription factors broadly expressed in different cell types, and importantly, in immune responses with significance in BCR signaling. Following the finding that proximal BCR signaling molecules were overexpressed, the impact of such high expression on the phosphorylation status of NF-κB components was explored. Notably, higher levels of phosphorylated p50 and IκB proteins were detected in basal conditions in Lrba-/- B cells, Figure 3C. These data indicated an exacerbated activated state without BCR crosslinking. However, p65 phosphorylation under basal conditions was similar to Lrba+/+ B cells. IκBα, p50, and p65 phosphorylation were similar in total splenocytes (Supplementary 2B), suggesting that the abnormalities are exclusive to B cells. Treatment with the Plcγ2 inhibitor U73122 notably reduced the levels of p50 phosphorylation (Figure 3D).
We next explored whether NF-κB components could be further activated when the BCR is cross-linked. Purified B cells were obtained by negative selection and activated for 10 or 20 min with anti-IgM. Consistent with previous results, in unstimulated cells (Figure 4A), IκBα and p50 were over phosphorylated in Lrba-/- B cells under basal conditions. Importantly, after 10 min of stimulation with anti-IgM, no increase in the levels of phosphorylation of IκBα, p50, and p65 was detected, in contrast to the observed response in Lrba+/+ B cells (Figure 4A). When the phosphorylation of IκBα, p50, and p65 was explored after 20 min of activation with anti-IgM, the phosphorylation remained at similar levels in Lrba-/- B cells than the unstimulated conditions; meanwhile, the levels of phosphorylation of these molecules in the Lrba+/+ B cells returned to basal values (Figure 4A). These data suggest that Lrba deficiency correlates with spontaneous B cell activation; however, such cells are unable to respond appropriately to BCR stimulation.
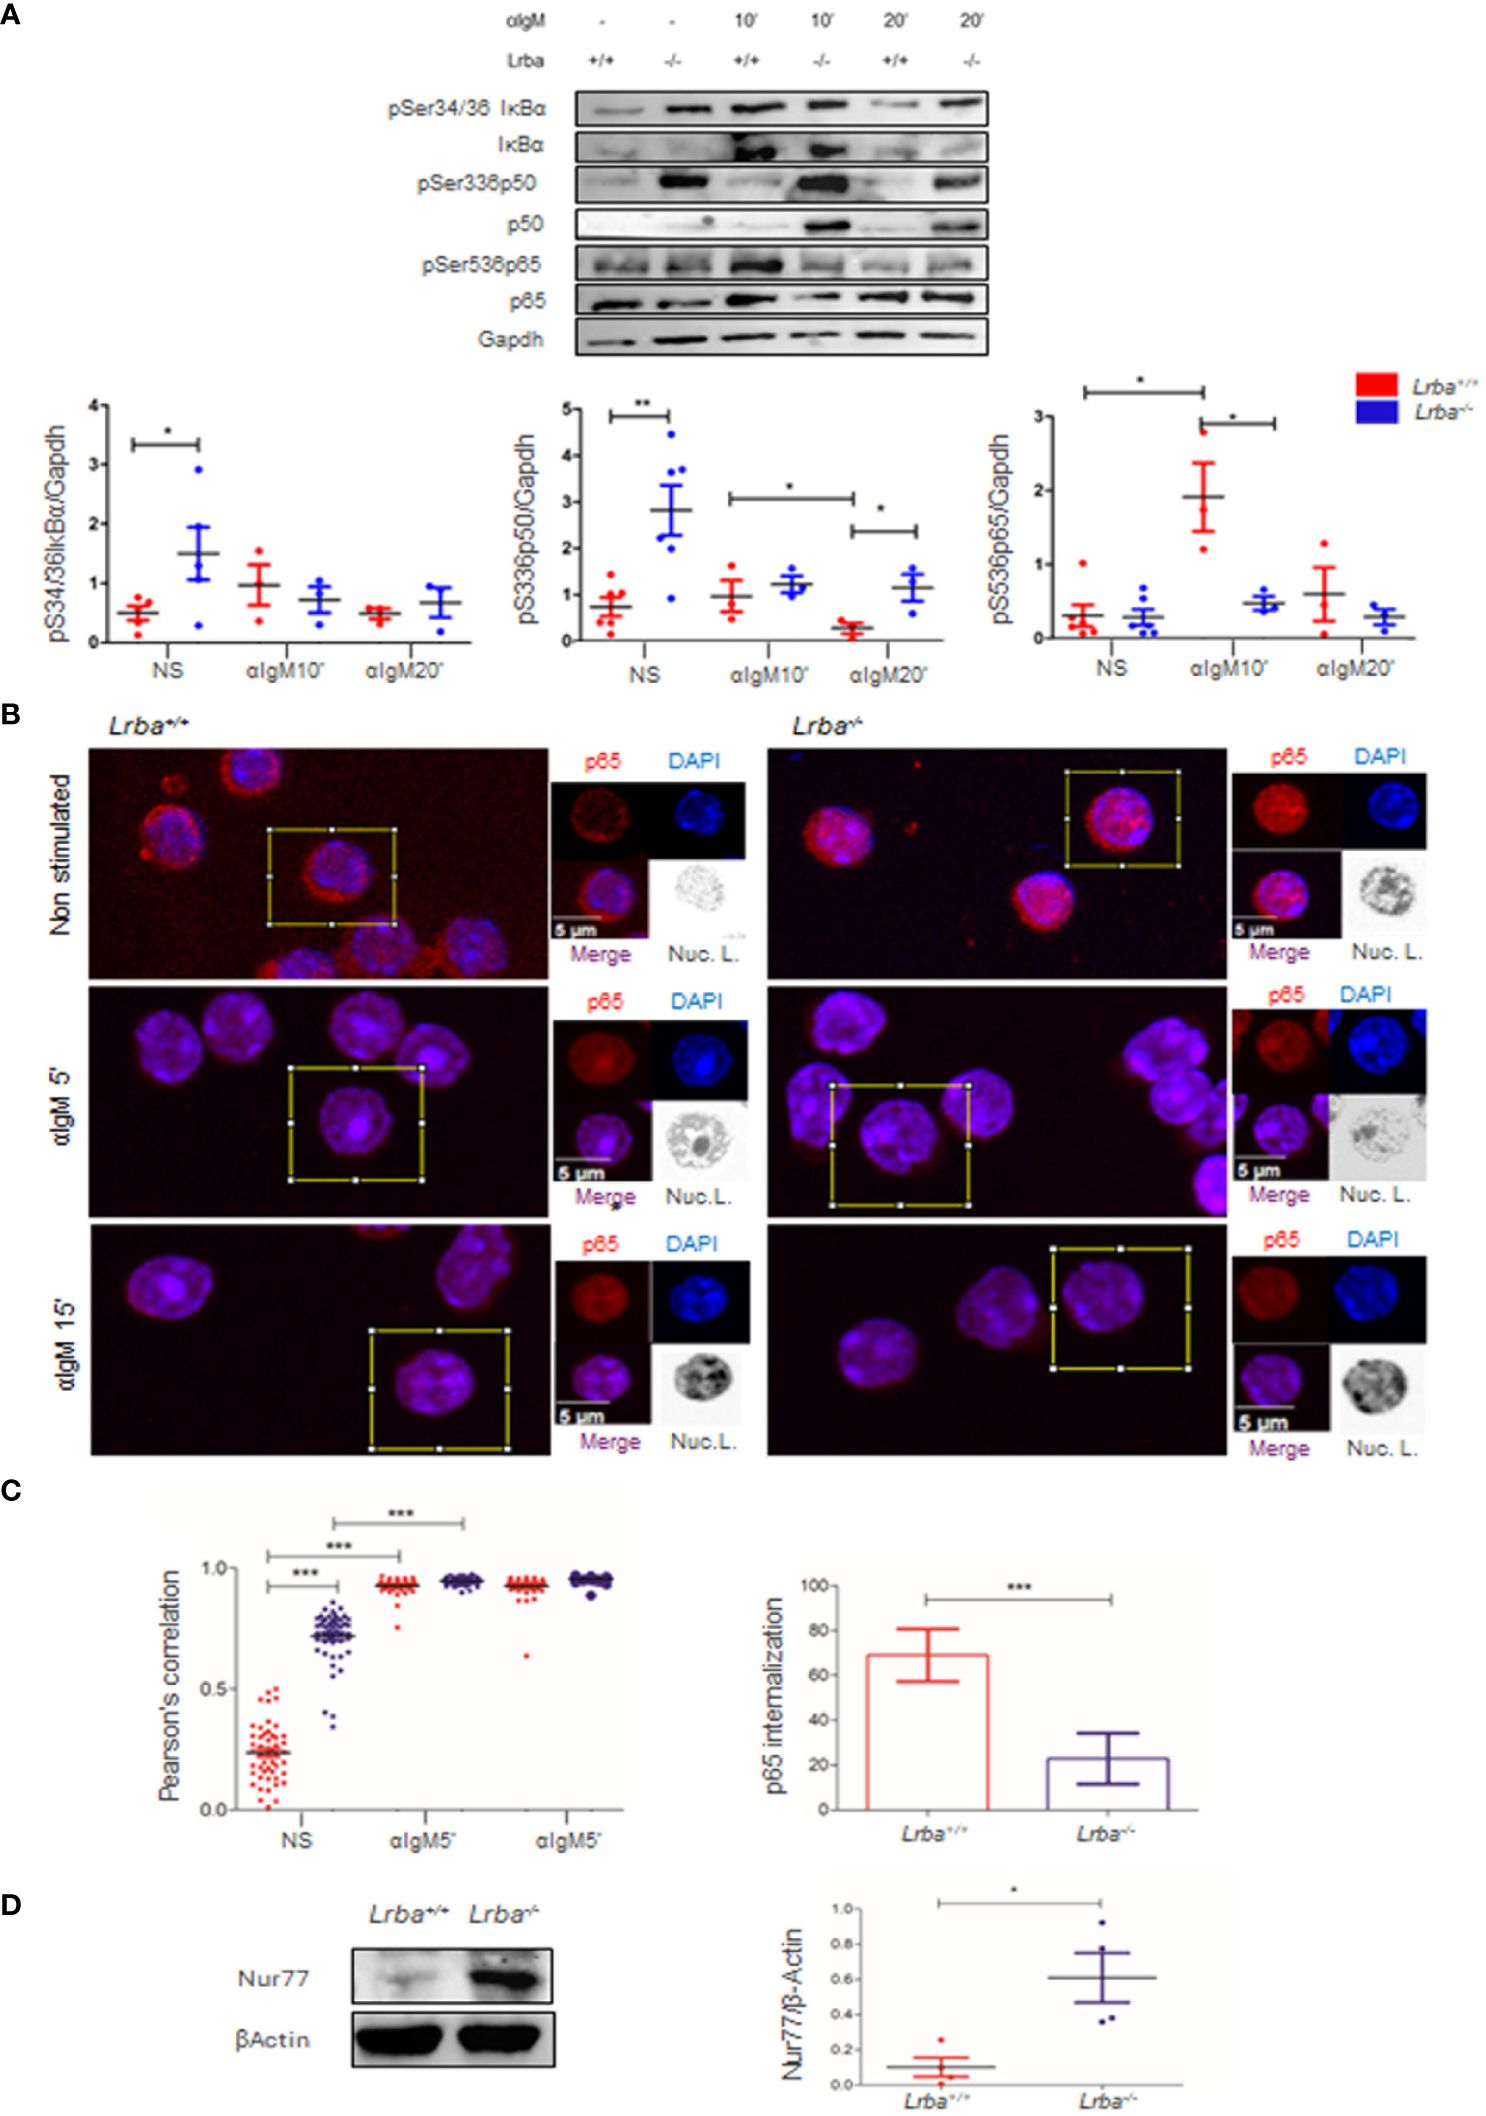
Figure 4 Activation of NF-κB in B cells after BCR crosslinking in vitro (A) B cells stimulated through BCR at 10 and 20 min, representative blot (left). Densitometric analysis of IκBα, p65, and p50 phosphorylation after BCR crosslinking (right). Phosphorylated residues are indicated. n=3. (B) Nuclear localization of p65. Representative images of p65 (red) in the nuclei (blue) in Lrba-/- and Lrba+/+ splenocytes analyzed by confocal microscopy. Merged fluorochromes and nuclear localization representation are indicated. (C) Pearson’s coefficient of nuclear localization of p65 in splenocytes from Lrba-/- and Lrba+/+ cells. n=50 cells per condition (top right). Increased nuclear p65 localization after 5 min of activation with anti-IgM (bottom right). (D) Representative blot for Nur77 expression in B cells from Lrba-/- and Lrba+/+ mice (left). Densitometric analysis for Nur77 expression (right, n=3). * = p<0.05; ** = p<0.01,*** = p<0.001.
NF-κB activation culminates in the entry of the transcription factor formed by p50/p65 into the nucleus, inducing transcription of genes important for survival, proliferation, and activation of B cells. Until now, IκBα and p50 have shown increased basal phosphorylation levels, and no further activation is observed in BCR-crosslinked B cells. However, p65 does not exhibit this behavior as it has low phosphorylation levels in unstimulated or BCR-crosslinked B cells. We wondered whether the high levels of p50 phosphorylation, the cellular location of p65 was affected. To investigate this, the nuclear localization of p65 in splenocytes was explored using confocal microscopy. Interestingly, higher nuclear colocalization of p65 was observed in Lrba-/- cells under unstimulated conditions. After five min of BCR crosslinking, nuclear p65 significantly increased in both Lrba-/- and WT mice. However, 15 min after activation, nuclear p65 levels remained unchanged in both mice (Figures 4B, C). The Pearson’s correlation analysis confirmed that these results were significant (Figure 4C). This data is consistent with the increased phosphorylation status of NF-κB in non-BCR activated Lrba-/- B cells.
In addition, BCR crosslinking after 5 and 15 min induced p65 nuclear localization in WT splenocytes; however, in Lrba-/- mice, the increase in the nuclear localization of p65 was less pronounced (Figure 4C).
Chronic B cell stimulation by BCR has been associated with Nur77 induction. Here, we evaluated Nur77 expression to show that the spontaneous activation of BCR signaling in Lrba-/- mice originates from a chronic process. As shown in Figure 4D, Nur77 was overexpressed in B cells from these mice.
LRBA deficiency is one of the most frequent monogenic causes of CVID (29) and is classified as a group of primary immunodeficiencies involving antibodies (30). Patients with LRBA deficiency exhibit hypogammaglobulinemia, splenomegaly, autoimmune disorders, reduced levels of total B-cells, and diminished peripheral differentiation into memory phenotypes (1–4, 31, 32). These findings suggest defects in B-cell function, which have been poorly explored in LRBA deficiency.
Here, we investigated possible defects in the function of Lrba-/- B cells in a previously described murine model in which the functions of Lrba in olfactory cilia, cochlear hair cells, and T regulatory cells have been described (26, 27, 33). Lrba-/- mice showed no defects in the number and response to stimuli as LPS in B2 cells. Other findings included elevated IgA and IgG2b levels and reduced numbers of B1 cells (13). However, some data from humans, such as splenomegaly, reduced circulating B cell counts, and poor differentiation of memory B cells (1–4, 32) led us to hypothesize that possible defects in response to BCR may occur.
To explore this hypothesis, we first evaluated the size and weight of the spleens in mice, as well as the total number of splenocytes (Figure 1A). In Lrba-/- mice, signs of splenomegaly were observed despite a healthy phenotype. These findings suggest lymphocyte expansion in the absence of infection, similar to that observed in patients with human LRBA deficiency. In addition, we evaluated the splenic stages of B cell differentiation. Naive B cells that egress from the bone marrow toward the spleen can be distinguished using cellular markers. These were categorized as transitional type 1 (T1) and T2 B cells (34, 35). Upon encountering antigens, T1 B cells undergo apoptosis. This process helps to deplete autoreactive B cells through apoptosis. T2 B cells respond positively to BCR crosslinking and proliferate to differentiate into mature B cells (35, 36). When T1, T2, and follicular B cells were examined, a slight yet significant reduction in the proportion of T1 cells was observed in Lrba-/- mice (Figure 1B). Similar data was obtained after the total counts of T1, T2, MZ and follicular B cells were calculated (Figure 1B) (13). Analysis of MZ B cells showed slightly increased proportions and total numbers in Lrba-/-mice. MZ B cells are important for immunity to encapsulated bacteria, and their development has been suggested to depend on BCR signaling strength (37, 38).
Because T2 and follicular B cells showed a proliferative response after BCR crosslinking (36), in vitro assays were conducted to determine the proliferative capacity of B cells in Lrba-/-mice after activation with anti-IgM. B cells from the Lrba-/- mice showed a lower proliferative response after 96 h of BCR activation (Figure 2A). Previous studies with Lrba-/- mice showed normal proliferation; however, under different conditions, such as LPS stimulation for 72 h (26), a defective proliferative response to BCR stimulation may be observed owing to an absent response to the stimuli, which may consequently lead to cellular death. Therefore, cell survival was evaluated for more than 20 h. Interestingly, Lrba-/-B cells showed higher survival after 4 and 12 h of activation than their WT counterparts; however, at 20 h, B cell survival decreased dramatically in Lrba-/-mice (Figure 2B). Reduced survival at 48 h was even more dramatic (Supplementary Figure 3). Expression of activated markers in basal conditions was also explored, CD44 and I-Ab were measured in B cells, both markers were observed in higher levels in Lrba-/-mice, indicating a basal activation status of these cells; both CD44 and MHC-II (I-Ab) are expressed in BCR-primed B cells, while I-Ab, Figure 2C (39, 40). Increased Ki67 expression was observed in Lrba-/- B cells indicating in situ B cell proliferation (Supplementary Figure 1C). Importantly, B cells depend on additional signals for a proper antibody response, such as T cell co-stimulation and activation through TLRs (41, 42). The survival and proliferative response improved in the presence of these signals in Lrba-/- B cells, suggesting that these pathways function properly (Supplementary Figure 3). Data regarding the reduced proliferation and survival of Lrba-/-B cells in response to BCR suggest defects in BCR signaling, which have not been described previously.
The first events following BCR crosslinking include the activation of Lyn, Syk, and Btk kinases. Then, the phosphorylation of Blnk allows its binding to Btk kinase and Plcγ2. Once activated Plcγ2 produces second messengers from membrane phospholipids, such as inositol 1,4,5-triphosphate (IP3) and diacylglycerol (DAG). DAG leads to activation of (NF-κB) (22). Here, we first explored the expression of proximal components. Notably, Lrba-/- B cells showed higher levels of Btk and Plcγ2 expression (Figures 2B, C), additionally, a tendency towards increased levels of phosphorylated Btk and Plcγ2 was detected, but not significant differences were observed (Figures 3B, C).
NF-kB component expression was also evaluated. NF-κB is a transcriptional factor expressed ubiquitously, but in lymphocytes, it is important for the response of antigen receptors (TCR and BCR) (25). The NF-κB complex is composed of p50, p65, and IκBα and its activation in B cells after BCR crosslinking drives the transcription of genes important for progression in the cell cycle and induces pro- and anti-apoptotic proteins as Bcl-2 and Bcl-xL (43). Importantly, p50 was also overexpressed in the Lrba-/- B cells, while p65 and IκBα showed similar levels of expression between both WT and Lrba-/- B cells (Figures 2C–E). These data confirmed altered BCR signaling in Lrba-/-B cells.
To determine if NF-κB is properly activated, the phosphorylation of NF-κB components was evaluated in non-stimulated or BCR-stimulated cells. Increased levels of phospho Ser32/36 IκBα and phospho Ser336 p50 were detected even in unstimulated Lrba-/- B cells (Figure 3C); phospho ser536 p65 levels were similar between Lrba-/- and WT mice (Figure 3D). Interestingly, Plcγ2 inhibition assays with U73122 notably reduced the levels of p50 phosphorylation indicating that the increased NF-kB activation is due to spontaneous BCR activation (Figure 3D). These data suggest that Lrba is important for controlling the expression and activation of downstream BCR signaling components. These findings coincide with a study conducted on a B cell line deficient in LRBA, where phosphorylation and activity of NF-κB showed higher levels than WT cell line. This study proposes a regulatory role for LRBA in NF-κB activation (44). Altogether, these data mean that in the absence of Lrba, spontaneous activation of BCR occurs.
Upon BCR crosslinking, no increase in the phosphorylation levels of IkBα, p50, and p65 was detected (Figure 4A), indicating that the exacerbated phosphorylation in IκBα and p50 at basal condition prevents a proper response in the Lrba-/- B cells to BCR crosslinking. Of note, p65 phosphorylation behaves differently than IκBα and p50 in Lrba-/- B cells, as p65 expression was similar between Lrba-/- and WT B cells and did not show increased levels of phosphorylation in basal conditions. Importantly, it did not increase phosphorylation levels after BCR crosslinking (Figure 4A).
Finally, we detected the presence of p65 in the nuclei of Lrba-/- splenocytes. Interestingly, p65 nuclear localization was significantly higher in Lrba-/- cells than in WT cells (Figure 4B). Upon BCR crosslinking p65 nuclear localization increased in both WT and Lrba-/- splenocytes, however, the increased proportion of nuclear p65 after 5 min of activation was much higher in the WT splenocytes (Figures 4B, C). These data agree with a higher activation of p65 in basal conditions but with a poor response of NF-κB upon BCR cross-linking. Importantly, BCR activation also induces the activation of additional branches of signaling, such as NF-AT and ERK (45), such pathways may also be affected, defects in the activation of these branches in the Lrba-/- B cells should be explored in future studies.
Basal activation of NF-kB may lead to B cell exhaustion. Chronic overactivation of B cells linked to HIV infection leads to a state of exhaustion characterized by the loss of CD21 expression in mature B cells and a lower capacity for proliferation (46). Other manifestations of B cell exhaustion include a decreased antibody response preceded by hypergammaglobulinemia provoked by initial polyclonal activation due to acute infection (47). However, B cell exhaustion is not exclusively caused by HIV infection; there are reports of B cell exhaustion in individuals who have had contact with the parasite Plasmodium falciparum (48). Additionally, B cell exhaustion could be significant in the development and progression of non-infectious diseases, such as chronic graft-versus-host disease (49) and colorectal cancer (50). Altogether, our results provide a new perspective, in which defects in the functions of B cells observed in patients with LRBA deficiency may stem from a poor response after chronic activation of B cells, which ultimately leads to the induction of B cell death or cessation of proliferation.
Chronic BCR activation has been correlated with increased Nur77 expression. This nuclear orphan receptor was significantly expressed at higher levels in Lrba-/- B cells (Figure 4D), suggesting that the increased basal activation observed in Lrba-/- mice is constant. The function of Nur77 in B cells is currently under investigation; it is known that its expression is high in anergic B cells, correlates with self-reactivity, and may be involved in apoptosis or anergy induction (51). The consequences of increased Nur77 expression in Lrba deficiency should be further explored.
This study provides new insights into the importance of Lrba in B cell function via BCR activation. The perspectives for this work are widely open to elucidating how this overactivation affects the expression of surviving and proliferation-associated genes, the mechanism by which Lrba interacts with components of BCR signaling, and to prove whether these phenomena are similar in humans.
The original contributions presented in the study are included in the article/Supplementary Material, further inquiries can be directed to the corresponding author/s.
The animal study was approved by Unidad de Producción y Experimentación en Animales de Laboratorio (UPEAL) del Centro de Investigaciones Avanzadas del Instituto Politécnico Nacional (CINVESTAV-IPN). The study was conducted in accordance with the local legislation and institutional requirements.
D-PP: Conceptualization, Validation, Writing – review & editing, Formal analysis, Investigation, Methodology, Writing – original draft. EM-FP: Writing – review & editing, Conceptualization, Supervision, Validation. JM-FH: Conceptualization, Methodology, Writing – review & editing. H-RR: Writing – review & editing, Resources. L-SA: Resources, Conceptualization, Writing – original draft. MW-K: Resources, Writing – original draft. JC-RA: Conceptualization, Writing – original draft. G-LH: Conceptualization, Funding acquisition, Resources, Supervision, Validation, Writing – original draft, Writing – review & editing.
The author(s) declare financial support was received for the research, authorship, and/or publication of this article. Financing was granted by the Recursos Fiscales del Instituto Nacional de Pediatria, Project number 2020/017, and by the CONAHCyT project numbers A1-S-26657 and CBF-2023-2024-376. D-PP received a CONAHCyT graduate scholarship (number 818438) to obtain her PhD.
This paper is part of the requirements for obtaining a doctoral degree at Posgrado en Ciencias Biológicas, UNAM. Authors acknowledge Adrian Munguia for assistance and teaching in spectral flow cytometry.
The authors declare that the research was conducted in the absence of any commercial or financial relationships that could be construed as a potential conflict of interest.
The author(s) declared that they were an editorial board member of Frontiers, at the time of submission. This had no impact on the peer review process and the final decision.
All claims expressed in this article are solely those of the authors and do not necessarily represent those of their affiliated organizations, or those of the publisher, the editors and the reviewers. Any product that may be evaluated in this article, or claim that may be made by its manufacturer, is not guaranteed or endorsed by the publisher.
The Supplementary Material for this article can be found online at: https://www.frontiersin.org/articles/10.3389/fimmu.2024.1409434/full#supplementary-material
1. Lopez-Herrera G, Tampella G, Pan-Hammarström Q, Herholz P, Trujillo-Vargas CM, Phadwal K, et al. Deleterious mutations in LRBA are associated with a syndrome of immune deficiency and autoimmunity. Am J Hum Genet. (2012) 90:986–1001. doi: 10.1016/j.ajhg.2012.04.015
2. Lo B, Zhang K, Lu W, Zheng L, Zhang Q, Kanellopoulou C, et al. Patients with LRBA deficiency show CTLA4 loss and immune dysregulation responsive to abatacept therapy. Sci (1979). (2015) 349:436–40. doi: 10.1126/science.aaa1663
3. Burns SO, Zenner HL, Plagnol V, Curtis J, Mok K, Eisenhut M, et al. LRBA gene deletion in a patient presenting with autoimmunity without hypogammaglobulinemia. J Allergy Clin Immunol. (2012) 130:1428–32. doi: 10.1016/j.jaci.2012.07.035
4. van Schouwenburg PA, Davenport EE, Kienzler AK, Marwah I, Wright B, Lucas M, et al. Application of whole genome and RNA sequencing to investigate the genomic landscape of common variable immunodeficiency disorders. Clin Immunol. (2015) 160:301–14. doi: 10.1016/j.clim.2015.05.020
5. Maffucci P, Filion CA, Boisson B, Itan Y, Shang L, Casanova JL, et al. Genetic diagnosis using whole exome sequencing in common variable immunodeficiency. Front Immunol. (2016) 7. doi: 10.3389/fimmu.2016.00220
6. Johnson MB, De Franco E, Lango Allen H, Al Senani A, Elbarbary N, Siklar Z, et al. Recessively inherited LRBA mutations cause autoimmunity presenting as neonatal diabetes. Diabetes. (2017) 66:2316–22. doi: 10.2337/db17-0040
7. Soler-Palacín P, Garcia-Prat M, Martín-Nalda A, Franco-Jarava C, Rivière JG, Plaja A, et al. LRBA deficiency in a patient with a novel homozygous mutation due to chromosome 4 segmental uniparental isodisomy. Front Immunol. (2018) 9. doi: 10.3389/fimmu.2018.02397
8. Schreiner F, Plamper M, Dueker G, Schoenberger S, Gámez-Díaz L, Grimbacher B, et al. Infancy-onset T1DM, short stature, and severe immunodysregulation in two siblings with a homozygous LRBA mutation. J Clin Endocrinol Metab. (2016) 101:898–904. doi: 10.1210/jc.2015-3382
9. Ung C, Sanchez AV, Shen L, Davoudi S, Ahmadi T, Navarro-Gomez D, et al. Whole exome sequencing identification of novel candidate genes in patients with proliferative diabetic retinopathy. Vision Res. (2017) 139:168–76. doi: 10.1016/j.visres.2017.03.007
10. Sanyoura M, Lundgrin EL, Subramanian HP, Yu M, Sodadasi P, Greeley SAW, et al. Novel compound heterozygous LRBA deletions in a 6-month-old with neonatal diabetes. Diabetes Res Clin Pract. (2021) 175:108798. doi: 10.1016/j.diabres.2021.108798
11. Yadav A, Kumar R, Rawat A, Venkatesan R. Neonatal diabetes with a rare LRBA mutation. BMJ Case Rep. (2022) 15:1–4. doi: 10.1136/bcr-2022-250243
12. Galati A, Muciaccia R, Marucci A, Di Paola R, Menzaghi C, Ortolani F, et al. Early-onset diabetes in an infant with a novel frameshift mutation in LRBA. Int J Environ Res Public Health. (2022) 19:1–7. doi: 10.3390/ijerph191711031
13. Gámez-Díaz L, August D, Stepensky P, Revel-Vilk S, Seidel MG, Noriko M, et al. The extended phenotype of LPS-responsive beige-like anchor protein (LRBA) deficiency. J Allergy Clin Immunol. (2016) 137:223–30. doi: 10.1016/j.jaci.2015.09.025
14. Gambineri E, Ciullini Mannurita S, Hagin D, Vignoli M, Anover-Sombke S, DeBoer S, et al. Clinical, immunological, and molecular heterogeneity of 173 patients with the phenotype of immune dysregulation, polyendocrinopathy, enteropathy, X-linked (IPEX) syndrome. Front Immunol. (2018) 9. doi: 10.3389/fimmu.2018.02411
15. Cullinane AR, Schäffer AA, Huizing M. The BEACH is hot: A LYST of emerging roles for BEACH -domain containing proteins in human disease. Traffic. (2013) 14:749–66. doi: 10.1111/tra.12069
16. Wang JW, Howson J, Haller E, Kerr WG. Identification of a novel lipopolysaccharide-inducible gene with key features of both a kinase anchor proteins and chs1/beige proteins. J Immunol. (2001) 166:4586–95. doi: 10.4049/jimmunol.166.7.4586
17. Moreno-Corona NC, Lopez-Ortega O, Flores Hermenegildo JM, Berron-Ruiz L, Rodriguez-Alba JC, Santos-Argumedo L, et al. Lipopolysaccharide-responsive beige-like anchor acts as a cAMP-dependent protein kinase anchoring protein in B cells. Scand J Immunol. (2020) 92:1–13. doi: 10.1111/sji.12922
18. Hou T, Li Y, Wang W. Prediction of peptides binding to the PKA RIIα subunit using a hierarchical strategy. Bioinformatics. (2011) 27:1814–21. doi: 10.1093/bioinformatics/btr294
19. Hara Y, Ando F, Oikawa D, Ichimura K, Yanagawa H, Sakamaki Y, et al. LRBA is essential for urinary concentration and body water homeostasis. Proc Natl Acad Sci. (2022) 119:2–10. doi: 10.1073/pnas.2202125119
20. Kurosaki T, Shinohara H, Baba Y. B cell signaling and fate decision. Annu Rev Immunol. (2010) 28:21–55. doi: 10.1146/annurev.immunol.021908.132541
21. Richards S, Watanabe C, Santos L, Craxton A, Clark EA. Regulation of B-cell entry into the cell cycle. Immunol Rev. (2008) 224:183–200. doi: 10.1111/j.1600-065X.2008.00652.x
22. Herzog S, Reth M, Jumaa H. Regulation of B-cell proliferation and differentiation by pre-B-cell receptor signalling. Nat Rev Immunol. (2009) 9:195–205. doi: 10.1038/nri2491
23. Treanor B. B-cell receptor: from resting state to activate. Immunology. (2012) 136:21–27. doi: 10.1111/j.1365-2567.2012.03564.x
24. Hayden MS, Ghosh S. NF-κB, the first quarter-century: remarkable progress and outstanding questions. Genes Dev. (2012) 26:203–34. doi: 10.1101/gad.183434.111
25. Gerondakis S, Siebenlist U. Roles of the NF- B pathway in lymphocyte development and function. Cold Spring Harb Perspect Biol. (2010) 2:1–30. doi: 10.1101/cshperspect.a000182
26. Gámez-Díaz L, Neumann J, Jäger F, Proietti M, Felber F, Soulas-Sprauel P, et al. Immunological phenotype of the murine Lrba knockout. Immunol Cell Biol. (2017) 95:789–802. doi: 10.1038/icb.2017.52
27. Kurtenbach S, Gießl A, Strömberg S, Kremers J, Atorf J, Rasche S, et al. The BEACH protein LRBA promotes the localization of the heterotrimeric G-protein golf to olfactory cilia. Sci Rep. (2017) 7:1–19. doi: 10.1038/s41598-017-08543-4
28. Schindelin J, Arganda-Carreras I, Frise E, Kaynig V, Longair M, Pietzsch T, et al. Fiji: an open-source platform for biological-image analysis. Nat Methods. (2012) 9:676–82. doi: 10.1038/nmeth.2019
29. Bogaert DJA, Dullaers M, Lambrecht BN, Vermaelen KY, De Baere E, Haerynck F. Genes associated with common variable immunodeficiency: one diagnosis to rule them all? J Med Genet. (2016) 53:575–90. doi: 10.1136/jmedgenet-2015-103690
30. Di Renzo M, Pasqui AL, Auteri A. Common variable immunodeficiency: a review. Clin Exp Med. (2004) 3:211–7. doi: 10.1007/s10238-004-0027-2
31. Alangari A, Alsultan A, Adly N, Massaad MJ, Kiani IS, Aljebreen A, et al. LPS-responsive beige-like anchor (LRBA) gene mutation in a family with inflammatory bowel disease and combined immunodeficiency. J Allergy Clin Immunol. (2012) 130:481–8. doi: 10.1016/j.jaci.2012.05.043
32. Alkhairy OK, Abolhassani H, Rezaei N, Fang M, Andersen KK, Chavoshzadeh Z, et al. Spectrum of phenotypes associated with mutations in LRBA. J Clin Immunol. (2016) 36:33–45. doi: 10.1007/s10875-015-0224-7
33. Vogl C, Butola T, Haag N, Hausrat TJ, Leitner MG, Moutschen M, et al. The BEACH protein LRBA is required for hair bundle maintenance in cochlear hair cells and for hearing. EMBO Rep. (2017) 18:2015–29. doi: 10.15252/embr.201643689
34. Chung JB, Silverman M, Monroe JG. Transitional B cells: step by step towards immune competence. Trends Immunol. (2003) 24:343–9. doi: 10.1016/S1471-4906(03)00119-4
35. Allman DM, Ferguson SE, Cancro MP. Peripheral B cell maturation. I. Immature peripheral B cells in adults are heat-stable antigenhi and exhibit unique signaling characteristics. J Immunol. (1992) 149:2533–40. doi: 10.4049/jimmunol.149.8.2533
36. Petro JB, Gerstein RM, Lowe J, Carter RS, Shinners N, Khan WN. Transitional type 1 and 2 B lymphocyte subsets are differentially responsive to antigen receptor signaling. J Biol Chem. (2002) 277:48009–19. doi: 10.1074/jbc.M200305200
37. Cariappa A, Tang M, Parng C, Nebelitskiy E, Carroll M, Georgopoulos K, et al. The follicular versus marginal zone B lymphocyte cell fate decision is regulated by aiolos, btk, and CD21. Immunity. (2001) 14:603–15. doi: 10.1016/S1074-7613(01)00135-2
38. Dammers PM, Kroese FGM. Recruitment and selection of marginal zone B cells is independent of exogenous antigens. Eur J Immunol. (2005) 35:2089–99. doi: 10.1002/eji.200526118
39. Camp RL, Kraus TA, Birkeland ML, Puré E. High levels of CD44 expression distinguish virgin from antigen-primed B cells. J Exp Med. (1991) 173:763–6. doi: 10.1084/jem.173.3.763
40. Cheng PC, Steele CR, Gu L, Song W, Pierce SK. MHC class II antigen processing in B cells: accelerated intracellular targeting of antigens. J Immunol. (1999) 162:7171–80. doi: 10.4049/jimmunol.162.12.7171
41. Huang C. Germinal center reaction. Adv Exp Med Biol. (2020) 1254:105–16. doi: 10.1007/978-981-15-3532-1_4
42. Suzuki K. Diversified igA–bacteria interaction in gut homeostasis. Adv Exp Med Biol. (2020) 1254:105–16. doi: 10.1007/978-981-15-3532-1_9
43. Cheng S, Hsia CY, Feng B, Liou ML, Fang X, Pandolfi PP, et al. BCR-mediated apoptosis associated with negative selection of immature B cells is selectively dependent on Pten. Cell Res. (2009) 19:196–207. doi: 10.1038/cr.2008.284
44. Wang J. Animal model and method for studying gene-gene interactions. USA: World Intellectual Property Organization. International Bureau. (2016).
45. Tanaka S, Baba Y. B cell receptor signaling. Adv Exp Med Biol. (2020) 1254:23–6. doi: 10.1007/978-981-15-3532-1_2
46. Amu S, Ruffin N, Rethi B, Chiodi F. Impairment of B-cell functions during HIV-1 infection. AIDS. (2013) 27:2323–34. doi: 10.1097/QAD.0b013e328361a427
47. Moir S, Ho J, Malaspina A, Wang W, DiPoto AC, O’Shea MA, et al. Evidence for HIV-associated B cell exhaustion in a dysfunctional memory B cell compartment in HIV-infected viremic individuals. J Exp Med. (2008) 205:1797–805. doi: 10.1084/jem.20072683
48. Weiss GE, Crompton PD, Li S, Walsh LA, Moir S, Traore B, et al. Atypical memory B cells are greatly expanded in individuals living in a malaria-endemic area. J Immunol. (2009) 183:2176–82. doi: 10.4049/jimmunol.0901297
49. Khoder A, Alsuliman A, Basar R, Sobieski C, Kondo K, Alousi AM, et al. Evidence for B cell exhaustion in chronic graft-versus-host disease. Front Immunol. (2018) 8. doi: 10.3389/fimmu.2017.01937
50. Sorrentino C, D’Antonio L, Fieni C, Ciummo SL, Di Carlo E. Colorectal cancer-associated immune exhaustion involves T and B lymphocytes and conventional NK cells and correlates with a shorter overall survival. Front Immunol. (2021) 12. doi: 10.3389/fimmu.2021.778329
Keywords: Lrba, B cells, B-cell receptor, BCR signaling, Plcγ2, NF-κB, p50 activation
Citation: Pérez-Pérez D, Fuentes-Pananá EM, Flores-Hermenegildo JM, Romero-Ramirez H, Santos-Argumedo L, Kilimann MW, Rodríguez-Alba JC and Lopez-Herrera G (2024) Lipopolysaccharide-responsive beige-like anchor is involved in regulating NF-κB activation in B cells. Front. Immunol. 15:1409434. doi: 10.3389/fimmu.2024.1409434
Received: 30 March 2024; Accepted: 21 June 2024;
Published: 15 July 2024.
Edited by:
Wanli Liu, Tsinghua University, ChinaCopyright © 2024 Pérez-Pérez, Fuentes-Pananá, Flores-Hermenegildo, Romero-Ramirez, Santos-Argumedo, Kilimann, Rodríguez-Alba and Lopez-Herrera. This is an open-access article distributed under the terms of the Creative Commons Attribution License (CC BY). The use, distribution or reproduction in other forums is permitted, provided the original author(s) and the copyright owner(s) are credited and that the original publication in this journal is cited, in accordance with accepted academic practice. No use, distribution or reproduction is permitted which does not comply with these terms.
*Correspondence: Gabriela Lopez-Herrera, bG9oZWdhYnlxYnBAZ21haWwuY29t; Z2FibG9wZXpoQHBlZGlhdHJpYS5nb2IubXg=
Disclaimer: All claims expressed in this article are solely those of the authors and do not necessarily represent those of their affiliated organizations, or those of the publisher, the editors and the reviewers. Any product that may be evaluated in this article or claim that may be made by its manufacturer is not guaranteed or endorsed by the publisher.
Research integrity at Frontiers
Learn more about the work of our research integrity team to safeguard the quality of each article we publish.