
94% of researchers rate our articles as excellent or good
Learn more about the work of our research integrity team to safeguard the quality of each article we publish.
Find out more
ORIGINAL RESEARCH article
Front. Immunol., 14 June 2024
Sec. Cytokines and Soluble Mediators in Immunity
Volume 15 - 2024 | https://doi.org/10.3389/fimmu.2024.1408710
 William C. Theune1†
 Ju Chen1,2†
 Eileen Victoria Theune1Xiaoyang Ye1
 Antoine Ménoret1
 Anthony T. Vella1
 Kepeng Wang1*
Background: Interleukin-17 (IL-17) family cytokines promote protective inflammation for pathogen resistance, but also facilitate autoimmunity and tumor development. A direct signal of IL-17 to regulatory T cells (Tregs) has not been reported and may help explain these dichotomous responses.
Methods: We generated a conditional knockout of Il17ra in Tregs by crossing Foxp3-YFP-Cre mice to Il17ra-flox mice (Il17raΔTreg mice). Subsequently, we adoptively transferred bone marrow cells from Il17raΔTreg mice to a mouse model of sporadic colorectal cancer (Cdx2-Cre+/ApcF/+), to selectively ablate IL-17 direct signaling on Tregs in colorectal cancer. Single cell RNA sequencing and bulk RNA sequencing were performed on purified Tregs from mouse colorectal tumors, and compared to those of human tumor infiltrating Treg cells.
Results: IL-17 Receptor A (IL-17RA) is expressed in Tregs that reside in mouse mesenteric lymph nodes and colon tumors. Ablation of IL-17RA, specifically in Tregs, resulted in increased Th17 cells, and exacerbated tumor development. Mechanistically, tumor-infiltrating Tregs exhibit a unique gene signature that is linked to their activation, maturation, and suppression function, and this signature is in part supported by the direct signaling of IL-17 to Tregs. To study pathways of Treg programming, we found that loss of IL-17RA in tumor Tregs resulted in reduced RNA splicing, and downregulation of several RNA binding proteins that are known to regulate alternative splicing and promote Treg function.
Conclusion: IL-17 directly signals to Tregs and promotes their maturation and function. This signaling pathway constitutes a negative feedback loop that controls cancer-promoting inflammation in CRC.
Chronic inflammation is a key driver of tumor development and contributes to approximately one-fifth of all human cancers (1). Patients with inflammatory bowel diseases (IBDs), such as ulcerative colitis (2) and Crohn’s disease (3) have an increased risk of colorectal cancer (CRC). Considerable evidence has demonstrated that the balance between regulatory T cell (Treg) and effector T cell populations are key to the pathogenesis of IBDs and other autoimmune disorders (4). In particular, the presence of Tregs is important for the maintenance of gut homeostasis and resistance to induced colitis in mice (5). Antibody depletion or genetic ablation of IL-2RA (CD25), a marker and functional moiety of Tregs, leads to reduced Treg number and suppressive function, and the development of lethal autoimmunity in these mice (6, 7). Ablation of IL-10, either globally or specifically in T cells, results in severe colitis and spontaneous development of colonic tumors (8–10). Similarly, loss of Ebi3, one of the two chains of dimeric cytokine IL-35, on T cells, induces colitis in mice (11). Treg-specific ablation of IL-35 reduced their suppressive function and rendered them ineffective in ameliorating IBD (12). Tregs are known to suppress Th17-mediated inflammation, as Ebi3 knockout mice exhibit a significant increase in Th17 cell populations, and recombinant IL-35 treatment reduced Th17 differentiation and function (11). Patients with IBDs confirm that an increase in Th17 cell number occurs commensurate with a reduction in Tregs (13).
Interleukin-17 (IL-17) family cytokines are proinflammatory cytokines that promote tumor development in multiple organs (14). IL-17 members include IL-17A- F and bind to both the canonical IL-17 receptors IL-17RA, B, C, D, and E, as well as the noncanonical receptor CD93 (15, 16). Engagement of IL-17 activates mitogen-activated protein kinases (MAPK), nuclear factor-kappa B (NF-κB) and CCAAT-enhancer binding protein (C/EBP) through adaptor proteins ACT1 and TRAF6 (17, 18). IL-17 family cytokines signal to diverse cellular targets, including epithelial cells, fibroblasts, and myeloid cells (15, 18). In CRC, IL-17 promotes cancer progression in transformed epithelial cells in sporadic and induced colorectal cancer models (19, 20). Ablation of IL-17RA, the common receptor of IL-17 family cytokines, in tumor cells, leads to a significant reduction in the number of tumors within the mouse colon (19, 21). This pro-tumor role of IL-17RA is activated mainly by IL-17A, C, and F, whose ablation reduced tumor development in the gut (20, 22, 23). The direct impact of IL-17 on T cells is less known, except for the signaling of IL-17C through IL-17RE on Th17 cells that potentiates a Th17 response and exacerbates autoimmunity (24). To our knowledge, there is no report on direct signaling of IL-17 on other T cells, such as Tregs. Therefore, the understanding of an IL-17-Treg interaction is limited to the role of Tregs in suppressing inflammation, and the indirect role of IL-17 in regulating Treg function by impacting other cell lineages.
To test if IL-17 directly impacts Treg function, we employed a Treg-specific Cre line Foxp3-YFP-Cre, and crossed it to Il17raF/F mice, to selectively ablate IL-17 signaling in Tregs. Further, we grafted bone marrow cells from these mice to a mouse model of sporadic CRC. Under this scheme and using scRNAseq, we interrogated the distribution of IL-17RA and its co-receptors in Tregs from colorectal tumors and draining lymph nodes, and demonstrated that IL-17 directly signals to tumor-infiltrating Tregs to support their immune suppressive function. This result highlights the potential utility of this axis in the treatment of CRC.
C57BL/6, ApcF/F (25), Cdx2-Cre (26) and Foxp3-YFP-Cre mice were obtained from the Jackson Laboratory. Il17raF/F mice (19) were obtained from Dr. Michael Karin’s laboratory at the University of California, San Diego.
To generate the mouse model of sporadic CRC, Cdx2-Cre and ApcF/F mice were crossed to generate Cdx2-Cre+/ApcF/+ mice. These mice were sacrificed at around 5 months of age for tumor analyses. The mouse colon was dissected, and colorectal tumors were measured with a caliper and excised with scissors. Tumor load was represented as the sum of the diameters of all tumors from each animal. Statistical significance of tumor number, size, and load was determined by Student’s t test for pairwise comparison, with p value < 0.05 considered significant.
All mice were maintained in specific-pathogen-free conditions in filter-topped cages on autoclaved food and water at UConn Health. All experiments used co-housed, gender-matched littermates to ensure the consistency of common microflora. Both male and female mice were used for all experiments. All animal experiments were approved by the IACUC of UConn Health.
Six- to eight-week-old recipient mice were irradiated twice in one day to achieve a lethal dose (2 x 600 rad) and intravenously injected with a single-cell suspension of 107 donor bone marrow cells. Recipients were co-housed littermates, which were transplanted with both gene-deficient (Foxp3-YFP-Cre+/Il17raF/F) and control (Foxp3-YFP-Cre+/Il17raF/WT) bone marrow for comparison. After transplantation the recipients were placed on sulfamethoxazole and trimethoprim in drinking water for two weeks, followed by regular water. Mice were sacrificed and analyzed for tumor development 3-4 months after transplantation.
Mouse colorectal tumors were minced with scissors and digested with 1mg/kg collagenase IV (Sigma Aldrich, Cat # C5138) for 20 minutes. Cells were filtered with a 70-μm cell sieve, and stained with Live/Dead fixable exclusion dye (Tonbo Bioscience, Cat # 13-0868), followed by fluorochrome-conjugated antibodies in PBS with 2% fetal bovine serum (FBS) and 1mM EDTA. Anti-CD3 (Cat # 100206), anti-CD4 (Cat # 100536), anti-CD45 (Cat # 103138), anti-IFN-γ (Cat # 505808) and anti-IL-17A (Cat # 506904) antibodies were from Biolegend. Anti-Foxp3 (Cat # 11-5773-82) antibody was from eBioscience. Anti-CD8α antibody (Cat # 558106) was from BD Bioscience. For intracellular cytokine staining, cells were stimulated with Cell Stimulation Cocktail (eBioscience, Cat # 00-4975-93) for 4 hours, followed with fixation and staining with Foxp3/transcription factor staining buffer set (eBioscience, Cat # 00-5523-00). Flow cytometry analyses were performed on a BD LSRII flow cytometer. Cell sorting was performed on a BD FACS ARIA II high-speed cell sorter. Data was analyzed with FlowJo software. Statistical significance between groups was determined by Student’s t-test for pairwise comparison (p < 0.05).
Total RNA was extracted with a RNeasy Plus kit (Qiagen, Cat # 74134) and reverse transcribed using an iScript kit (Biorad, Cat # 1708891). qRT-PCR was performed using SsoAdvanced Universal SYBR Green Supermix (Biorad Cat # 1725275) on a Biorad CFX96 machine. Expression data were normalized to Rpl32 mRNA levels. The data were calculated as 2(Ct(RPL32-gene of interest)) to compare experimental groups to controls, and are presented in arbitrary units. Students’ t test (p < 0.05) for pairwise comparison was used to determine significance. Primer sequences are listed in Table 1. Whenever possible, primers were intron-spanning, such that amplification is feasible on complementary DNA.
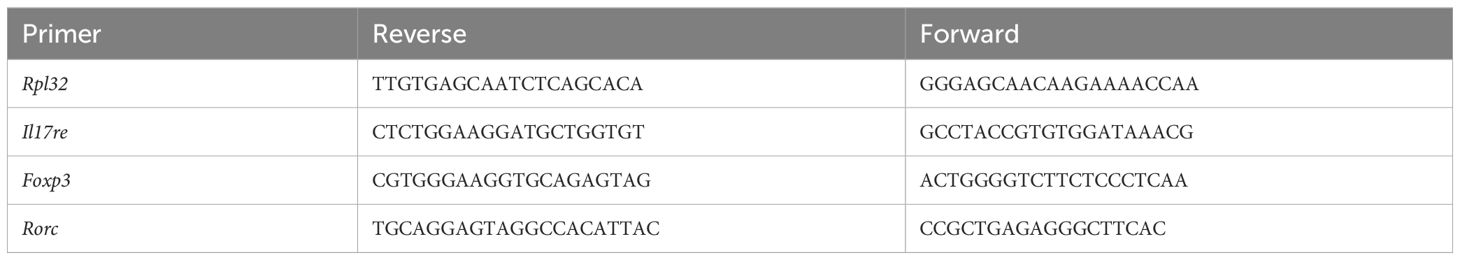
Table 1 Primer sequence for qPCR.
Naïve T cells were purified from C57BL/6 mouse spleen using EasySep™ Mouse Naïve CD4+ T Cell Isolation Kit (Cat # 19765) from STEMCELL Technologies. 6 x 10⁵ Naïve T cells were cultured with anti-CD3 monoclonal antibodies (2 μg/mL, coated) and anti-CD28 monoclonal antibodies (2 μg/mL, soluble) in a 24-well plate. To induce differentiation of Treg cells, TGF-β (10 ng/mL, PeproTech) and IL-2 (20 ng/mL, PeproTech) were added to the mouse cell culture media with 10% FBS for 72 h, followed by the treatment of 5 ng/mL IL-2 with or without 50 ng/mL IL-6 for 24h. Cells were harvested for q-RT-PCR analysis.
Bone marrow cells from Foxp3-YFP-Cre+/Il17raF/F (KO) and Foxp3-YFP-Cre+/Il17raF/+ (WT control) mice were adoptively transferred into 6-8-week-old Cdx2-Cre+/ApcF/+ mice. Bone marrow recipient mice were then sacrificed at 5 months of age, and their mesenteric lymph nodes (MLN) and tumors were digested with 1 mg/ml collagenase IV for 20 minutes. Cells were filtered with a 70-μm cell sieve and stained with Live/Dead fixable exclusion dye, followed by fluorochrome-conjugated antibodies in PBS with 2% fetal bovine serum (FBS) and 1mM EDTA. Live/CD45+/CD3+/CD4+/YFP+ cells were sorted and loaded for capture using the Chromium System with single-cell 3’ reagent kit v2 from 10X Genomics. After capture and lysis, cDNA synthesis and amplification were performed according to manufacturer protocol. Amplified cDNA was used to construct the Illumina sequencing library and sequenced on the NovaSeq 6000. Illumina basecall (.bcl) files were converted to FASTQ using bcl2fastq from the CellRanger pipeline. Fastq files were aligned to the mm39 mouse reference genome and transcriptome and cell-counts matrices were generated using 10x Genomics CellRanger v7.0 with default parameters. Single-cell RNA sequencing cell-counts matrices were analyzed using Seurat v4.3 (27) with RStudio v4.2. A merged Seurat object was generated, and QC was performed; retaining cells with >= 500 genes and <= 30% reads mapping to mitochondrial genes. Gene expression was normalized, scaled and dimensionality reduction was performed. UMAPs of clusters, experimental conditions and IL-17 receptor gene expression were generated using Seurat’s FeaturePlot function and the R package ggplot2. Dotplots, barplots and heatmaps were generated using the R package ggplot2. Differential gene expression was determined using Seurat’s FindMarkers function (adjusted p-value < 0.05, log2 Fold Change >= 0.25, min.pct >= 0.1).
RNA velocity in CRC Tregs from the MLN and tumor were analyzed using Velocyto (28). The output from CellRanger was analyzed using the run10x function from Velocyto with the GenCode mm39 primary assembly transcriptome and mm39 repeat masker file from the UCSC genome browser with all parameters as default. Using the loom file output from Velocyto, the trajectory UMAP of merged data was generated using the scVelo stochastic model (29) with the python modules scanpy v1.9.6 and scvelo v0.2.5.
Genes which were significantly differentially expressed (log2 Fold Change >= 0.25, min.pct >= 0.1, adjusted p-value < 0.05) were subject to pathway enrichment analysis using the R packages gprofiler2 (30), clusterProfiler (31), and enrichplot. Enrichment was conducted using the Gene Ontology database as the pathway source. Pathways with a fold enrichment >= 2 were rank sorted based on their significance (adjusted p-value < 0.05) and the top 20 enriched pathways were plotted as a barplot using ggplot2. The gene network of a subset of pathways was generated using the cnetplot function from enrichplot along with ggplot2.
All human scRNAseq datasets were obtained from the Gene Expression Omnibus (GEO). Pancreatic cancer data (32) was obtained from the GEO accession number GSE155698. Melanoma data (33) was obtained from GSE239750. Triple-negative breast cancer data (34) was obtained from GSE169246. Liver cancer data (35) was obtained from GSE98638. Non-small cell lung cancer data (36) was obtained from GSE99254. Colorectal cancer data (37) was obtained from GSE178341. Counts-matrices were merged, gene expression was normalized and scaled, and Tregs were subset according to the original author specification, where available, with confirmation by expression of Foxp3 in all cells. Conditions for each dataset (i.e. tumor, adjacent normal tissue, peripheral blood, etc.) were determined based on the original manuscripts’ specifications. The tumor Treg signature was generated by calculating the mean and standard error of the mean for the sum value of genes GADD45B, RGS2, NR4A1, TNFRSF9, CCL5, CXCR6, CREM, TNFRSF18, and TNFRSF4. The heatmap of the individual genes comprising the Treg signature was generated using ggplot2. Differential gene expression was determined using Seurat’s FindMarkers function (adjusted p-value < 0.05, log2 Fold Change >= 0.25, min.pct >= 0.1).
Similar to single-cell sequencing described above, MLN and tumor-infiltrating Treg cells were sorted, and their RNA was isolated using Qiagen RNeasy Plus Mini Kit. cDNA libraries were generated for poly-A selected RNA using the Illumina TruSeq mRNA Library Kit. 100 bp paired end reads were sequenced on the Illumina NextSeq 550 v2.5. Paired end reads in fastq format were aligned to the mm39 mouse genome and transcriptome using Hisat2 (38). Transcripts were assembled, gtf files for all conditions were merged, and read coverage tables were generated using StringTie (39) v2.2.1. Read counts were extracted using the prepDE python script from Stringtie, and normalization, calculation of FPKM values, and differential expression analysis were performed using the R package DESeq2 (40) (adjusted p-value < 0.05). Bar plots, heat scatter plots and heatmaps were generated using ggplot2 and coefficient of determination was calculated using the stats R package. Differential isoform usage, and splicing event enrichment were analyzed using the R packages DexSeq and IsoformSwitchAnalyzeR (41) Differential isoform usages were calculated with a dIF absolute value >= 0.1 and an adjusted p-value < 0.05. Splicing event enrichment was calculated using the extractSplicingEnrichmentComparison function from the R package isoformswitchanalyzeR with default parameters (alpha=0.05, dIFcutoff=0.1).
Statistical methods for RNA sequencing data analyses are described in previous sections. Otherwise, data were analyzed by the Student’s t-test for pair-wise comparisons. p values less than 0.05 were considered significant.
IL-17 family cytokines signal to diverse cellular targets, including epithelial cells, fibroblasts, and myeloid cells (15, 18). A direct signaling of IL-17 on Tregs is unknown, but we contend that it may be important for the function of Tregs and development of tumors. To this end, Foxp3-YFP-Cre mice were crossed to Il17raF/F mice to specifically ablate IL-17RA in Tregs (Foxp3-YFP-Cre+/Il17raF/F mice, hereby referred to as Il17raΔTreg mice). YFP transgene under the control of the Foxp3 promoter also serves as a marker of Tregs in vivo and was used to gate these cells for flow cytometry and cell sorting. To investigate how Il17ra KO impacts Tregs in CRC, we adoptively transferred bone marrow cells from Foxp3-YFP-Cre+/Il17raF/+(control) and Il17raΔTreg mice into recipient mice that develop sporadic CRC (Cdx2-Cre+/ApcF/+). These bone marrow recipient mice are herein referred to as “control CRC” and “Il17raΔTreg CRC” mice, respectively. 3.5 months after bone marrow transfer, control and Il17raΔTreg CRC mice were sacrificed, and Tregs were purified by cell sorting from the mesenteric lymph node (MLN) and colorectal tumors and subjected to single-cell RNA sequencing (scRNAseq) (Figure 1A). Unsupervised clustering of MLN and tumor Tregs revealed a total of 9 clusters within the merged dataset (Figure 1B). MLN Tregs were predominantly comprised of naïve, primed, and gut homing/tissue-infiltrating Tregs, while colorectal tumor contains tumor activated Tregs, proliferating Tregs and two tissue-resident immunosuppressive Treg clusters (Figure 1C). Treg clusters were named based on analysis of differentially expressed genes (Figure 1D): Naïve and primed Tregs in the MLN were marked by the expression of the transcription factor Bach2, which represses effector T cell programs and is required for maintaining naïve T cell state (Figure 1D) (42, 43). Following priming, Bach2 was downregulated, along with upregulation of activation markers Lag3 (44), CD44 (45), as well as gut homing signatures Ccr9 (46) and Itgae (Figure 1D) (47, 48). In the tumor, Treg clusters displayed a gradual increase in the expression of secondary costimulatory receptor OX40 (Tnfrsf9) (49) and tissue resident Treg markers Areg, Tff1 and Penk (Figure 1D) (50–52). The proliferating cluster, comprised of Tregs primed in the MLN and Tregs activated in the TME, was marked by expression of Mki67, Stmn1 and Top2a (Figure 1D) (53–55). These data indicate distinct clustering of tumor infiltrating Tregs compared to Tregs in peripheral lymphoid tissues. To validate the progressive transcriptomic shift in Treg identity between clusters, we analyzed RNA velocity in the Treg subpopulations. RNA velocity infers the temporal dynamics of gene expression within a population based on the proportion of spliced versus unspliced transcripts, under the assumption that steady state cell identity will result in a higher proportion of spliced transcripts compared to cells undergoing dynamic shifts in cell identity. For example, differentiation or activation, will display an increased proportion of unspliced transcripts, as transcription precedes mRNA processing (29). RNA velocity revealed a global transcriptomic shift beginning with the naïve and primed Treg clusters in the MLN towards the proliferating and activated Treg subpopulations in the tumor, and finally towards the immunosuppressive tissue resident Treg clusters in the tumor (Figure 1E). These data demonstrate that naïve Tregs in the MLN undergo priming and transcriptomic changes allowing for their gut homing and infiltration of colon tumors. Once in the tumor, they are activated, proliferate, and undergo further maturation, allowing for their immunosuppressive function within the tumor microenvironment (TME).
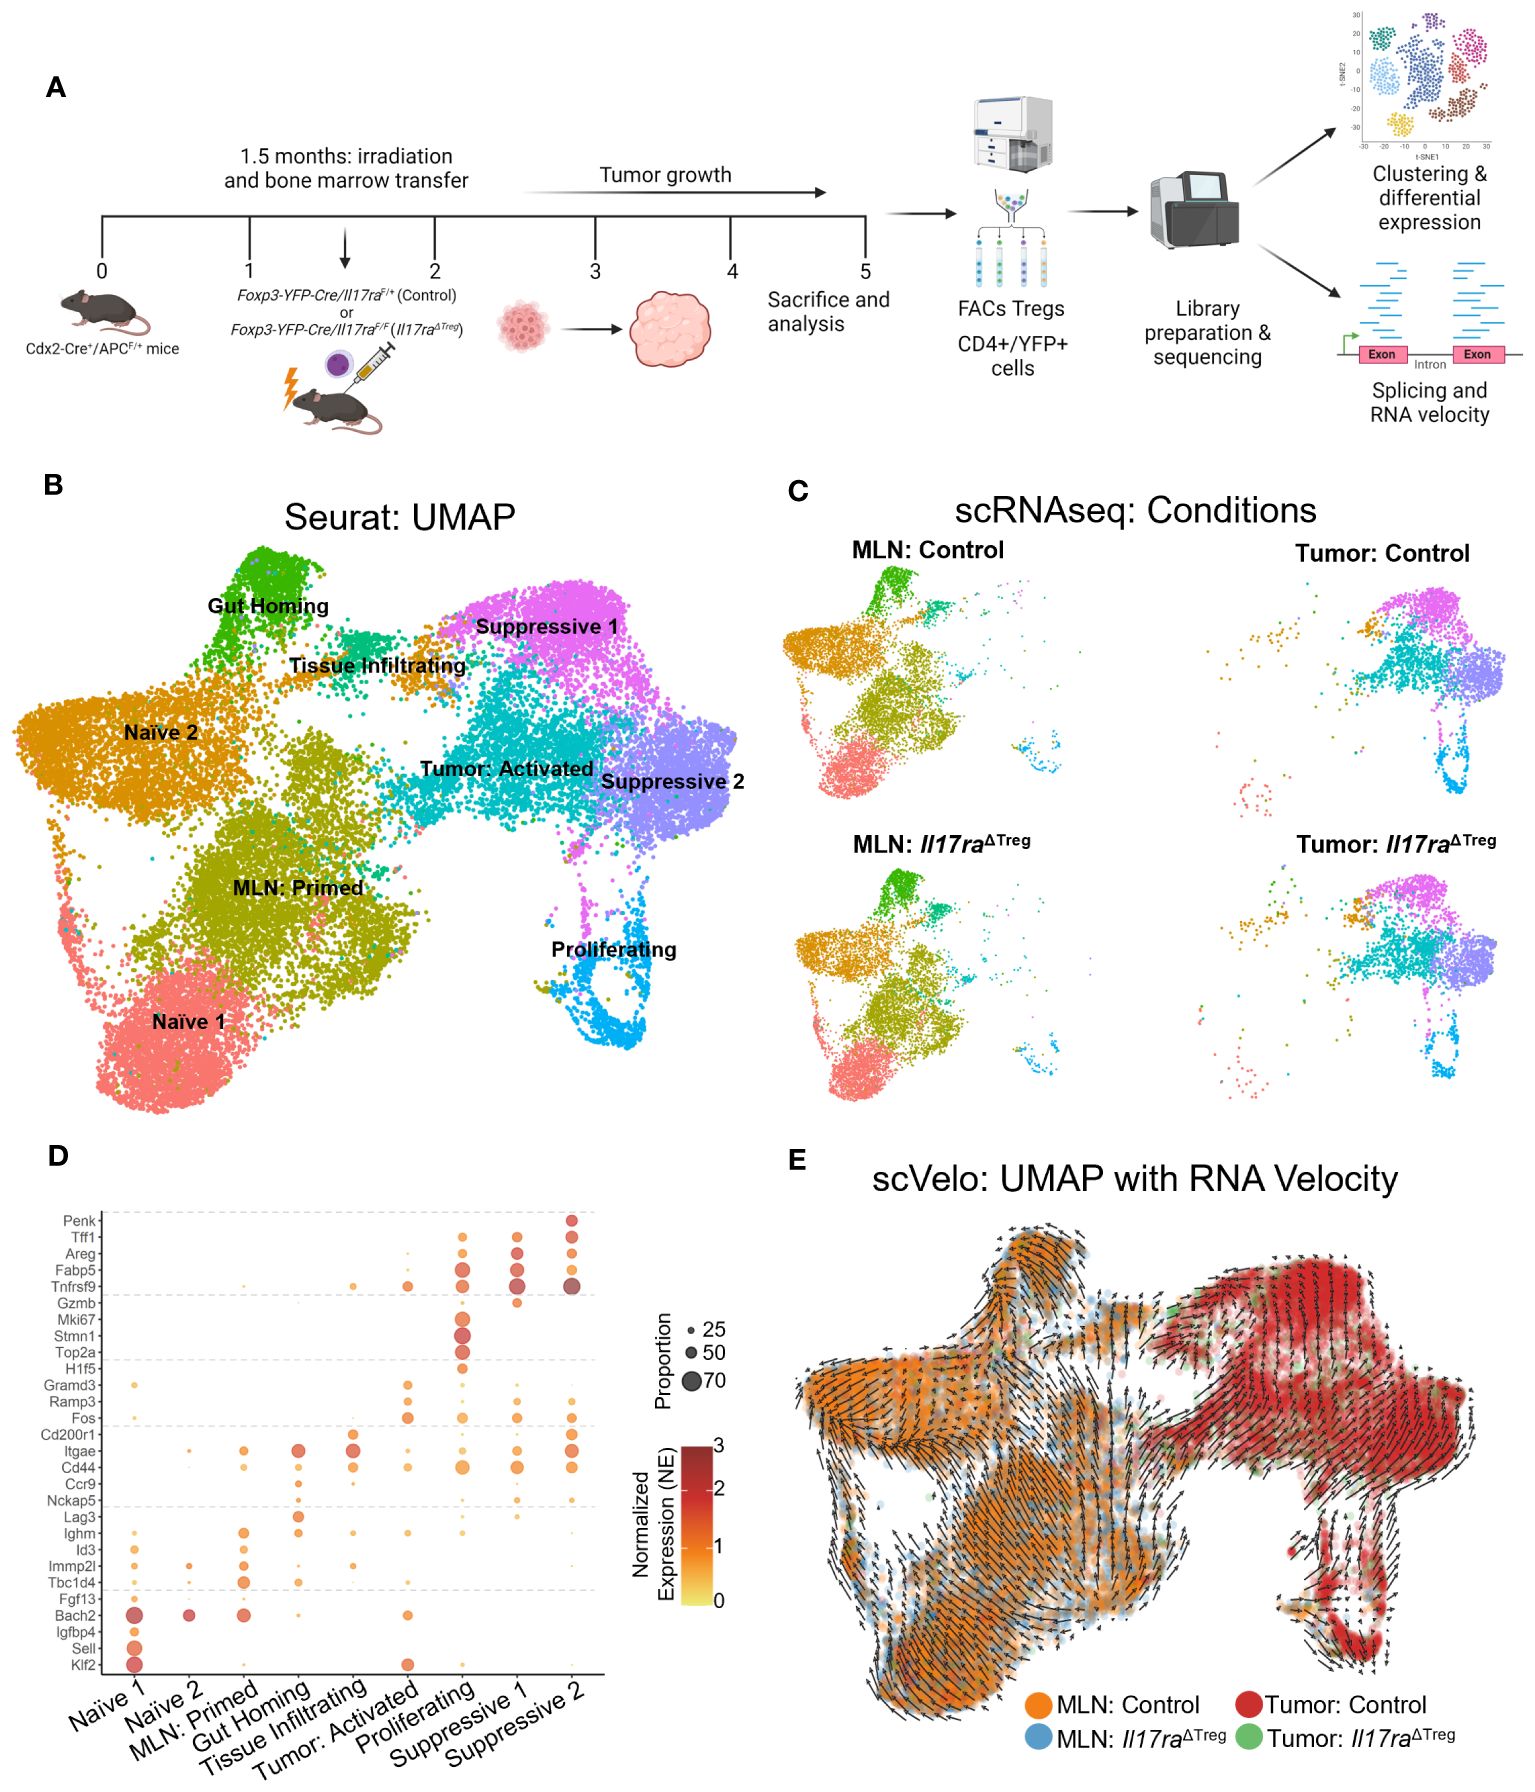
Figure 1 Tumor-infiltrating Tregs form distinct clusters compared to MLN Tregs. (A) Bone marrow cells from Il17raΔTreg and control mice were adoptively transferred into 6-8-week-old Cdx2-Cre+/ApcF/+ mice. Bone marrow recipient mice were then sacrificed at 5 months of age, and their mesenteric lymph nodes (MLN) and tumors were dissociated and FACS purified for live/CD45+/CD3+/CD4+/YFP+ cells. These cells were then subjected to single-cell RNA sequencing analysis. (B) Uniform manifold approximation and projection (UMAP) with clustering analysis for Treg scRNAseq data. Tregs isolated from the four conditions were merged and analysis revealed a total of 9 clusters across the datasets. (C) UMAPs of Treg scRNAseq data split by conditions. (D) Gene markers for each of the 9 scRNAseq clusters. Two naïve Treg subsets, primed, gut homing and tumor-infiltrating subsets were observed in the MLN, as well as tumor activated, proliferating and tissue-resident suppressive Tregs were observed within the tumor. (E) Analysis of RNA velocity from scRNAseq datasets using Velocyto. Trajectory UMAP of merged data was generated using the stochastic model from scvelo.
IL-17 mediated tumor-associated inflammation has been shown to promote tumor development in the gut (20, 22, 23). The IL-17 receptor is comprised of 5 currently identified members (14). IL-17RA forms heterodimers with the other IL-17 co-receptors to bind IL-17 ligands. For IL-17 to be able to directly signal to Tregs, these cells should express both IL-17RA and its co-receptors. Thus, we analyzed the expression of IL-17 receptor subunits within the Treg subpopulations. Il17ra was ubiquitously expressed throughout the Treg clusters in both the MLN and tumor (Figure 2A). IL-17RA interaction with IL-17RC allows binding of IL-17A, IL-17F, or the IL-17A/F heterodimer (56, 57). IL-17RA/IL-17RB heterodimer binds IL-17B and IL-17E, and IL-17RE interacts with IL-17RA to bind IL-17C (58, 59). Both Il17re and Il17rc were expressed within the proliferating and suppressive 1 clusters of tumor Tregs, whereas Il17rb was expressed within suppressive cluster 2 of the tumor Tregs (Figure 2A). IL-17RD, which can heterodimerize with IL-17RA to bind IL-17A, was not reasonably expressed in any clusters of the Treg scRNAseq data (Figure 2A) (60, 61). Additionally, the noncanonical IL-17 receptor gene Cd93, whose protein acts as a receptor for IL-17D, was not reasonably expressed in the Treg data (Figure 2A) (16). Examining the cells which could form functional IL-17 receptor heterodimers, based on co-expression of Il17ra with either Il17rb/c/e, suggested that while Il17ra was expressed throughout the Treg clusters, the tumor Treg clusters, specifically, suppressive 1, 2, and proliferating clusters, predominantly represented the cells capable of expressing the necessary co-receptors for IL-17 signaling (Figures 2B, C). We hypothesized that IL-17 receptors may be upregulated specifically in tumor infiltrating Tregs due to inflammatory signals in the TME. Amongst inflammatory cytokines within the TME, IL-6 is highly expressed in colorectal tumors and has been shown to promote Th17 differentiation and IL-17RE expression (24). To investigate whether IL-6 could contribute to the expression of Il17re on Tregs, we stimulated in vitro differentiated iTregs with IL-6. While Foxp3 mRNA levels were unchanged following stimulation, we observed a significant Il17re upregulation (p < 0.001) as well as a modest, but statistically significant increase in the expression of Rorc (encoding RORγt) (p < 0.05) (Figure 2D). Thus, IL-6 secretion by inflammatory cells within the TME, may lead to the upregulation of co-receptors necessary for IL-17 signaling on Tregs.
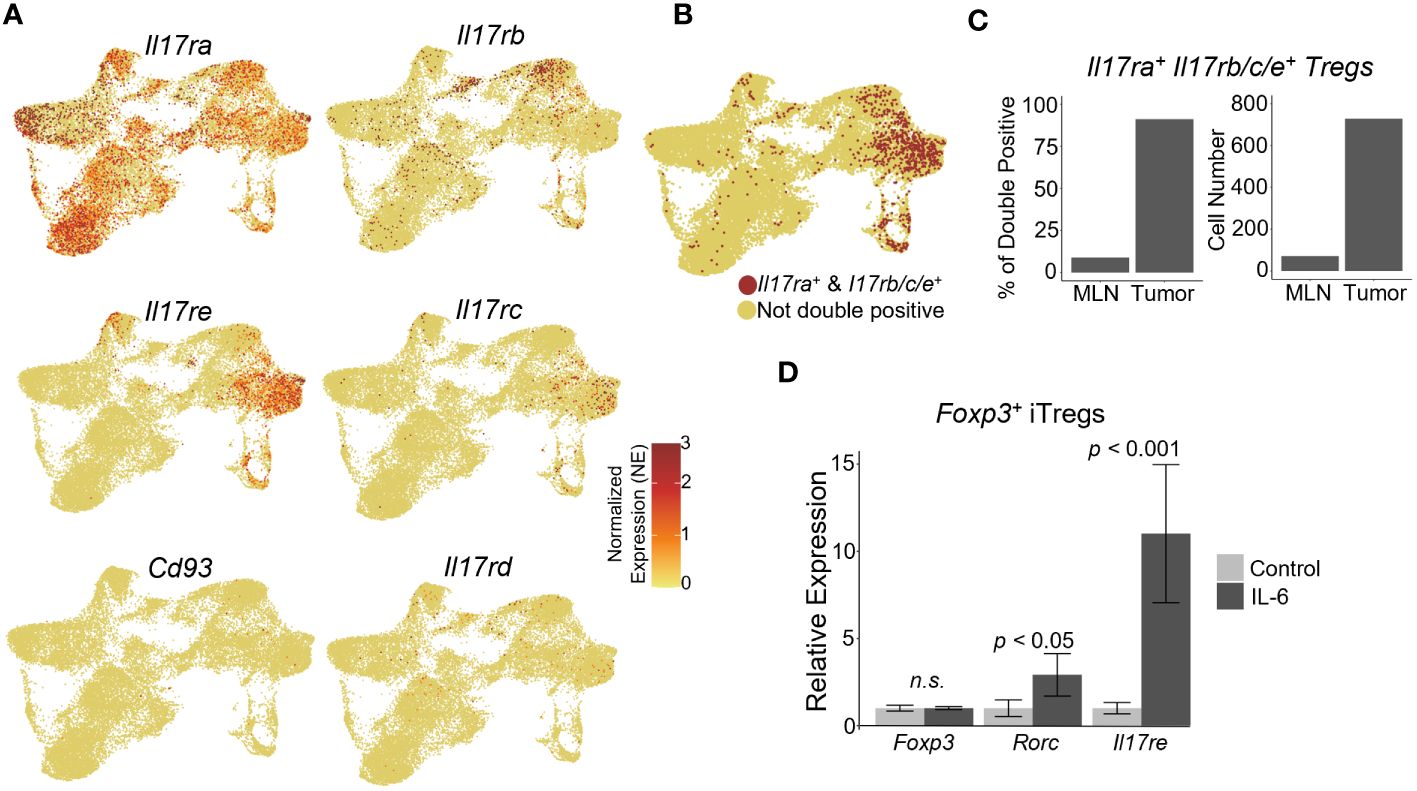
Figure 2 Tumor-infiltrating Tregs express IL-17 co-receptors necessary for sensing IL-17. (A) IL-17 receptor subunit gene expression analysis within scRNAseq data. Il17ra was expressed in both the MLN and Tumor subsets. Il17rb, Il17rc, and Il17re were enriched in the tumor. Il17re and Il17rc were expressed predominantly in suppressive cluster 1 and the proliferating cluster within the tumor, while Il17rb was expressed predominately in the suppressive cluster 2 and the tumor-infiltrating cluster. No robust expression of Il17rd or Cd93 were observed. (B) UMAP of cells expressing functional Il17 receptor heterodimers with Il17ra: Il17ra/rb, Il17ra/rc, Il17ra/re. (C) Proportion and normalized cell number of double positive cells in the MLN and tumor. (D) Naïve CD4+ T cells were isolated from mouse spleens with a naïve T cell isolation kit from STEMCELL, and differentiated into iTreg cells for 3 days. Differentiated iTregs were subsequently stimulated with 50 ng/ml IL-6 for 24 hours, and their RNA were subjected to qRT-PCR analysis (p-value < 0.05, n= 3, student’s t test).
As the tumor-infiltrating Tregs represented the population capable of responding to IL-17 signaling, we next analyzed the genes differentially expressed between WT vs Il17ra KO Tregs from tumors of control and Il17raΔTreg CRC mice (Figure 3A). Pathway enrichment analysis of genes significantly differentially expressed (log2 fold change >= 0.25, adjusted p-value < 0.05, min.pct >= 0.1) revealed that Il17ra KO tumor Tregs exhibited an increase in pathways related to translation, metabolism, and survival, with a decrease in pathways related to T cell function, namely leukocyte differentiation, integrin binding, and chemokine signaling (Figure 3B). Several highlighted pathways in Il17ra KO tumor Tregs (Figures 3C, D) show the upregulation of multiple ribosomal subunits, mitochondrial genes related to oxidative phosphorylation, and pro-survival signaling (Figure 3D). Oxidative phosphorylation has been shown to be crucial for Treg survival, especially in low glucose, high lactate environments, such as the intestinal tract (62, 63). Il17ra KO tumor Tregs also displayed a downregulation in established IL-17 signaling-related genes which are important for Treg function, including Junb (64, 65), Stat3 (66, 67) and genes related to MAPK cascade (68, 69) (Figure 3C). Secondary costimulatory molecule genes upregulated following T cell activation, Tnfrsf9 (4-1BB) (70, 71), Tnfrsf4 (OX40) (49, 72, 73), and Tnfrsf18 (GITR) (74) were also downregulated in Il17ra KO Tregs in the tumor (Figure 3C). Also downregulated were genes essential to Treg tissue homing and suppressive function including the αVβ8 integrin receptor genes Itgav and Itgab (75, 76), as well as CD81 (77) and the transcription factor Nr4a3 (78) (Figure 3C). A full list of DEGs can be found in Supplementary Table 1. We also analyzed the subset of Tregs which express IL-17RA co-receptor genes Il17rb/rc/re (Supplementary Figure 1A) and found a similar pattern of upregulated and downregulated genes (Supplementary Figure 1B). Also included amongst these DEGs were suppression-associated genes Ctla4 (79), Gzmb (80), Ikzf2 (encoding the transcription factor Helios) (81) and Tnfrsf18 (GITR) (82), tissue-resident Treg markers Areg, Penk, Tff1, and Odc1, and activation/maturation-associated genes Tnfrsf4, Tnrfsf9, Mt1, and Got1 (Supplementary Figures 1B, C). These data suggest that while Il17ra KO Tregs display an increased capacity for survival and mitochondrial function/metabolism, their function as suppressors of inflammation is reduced.
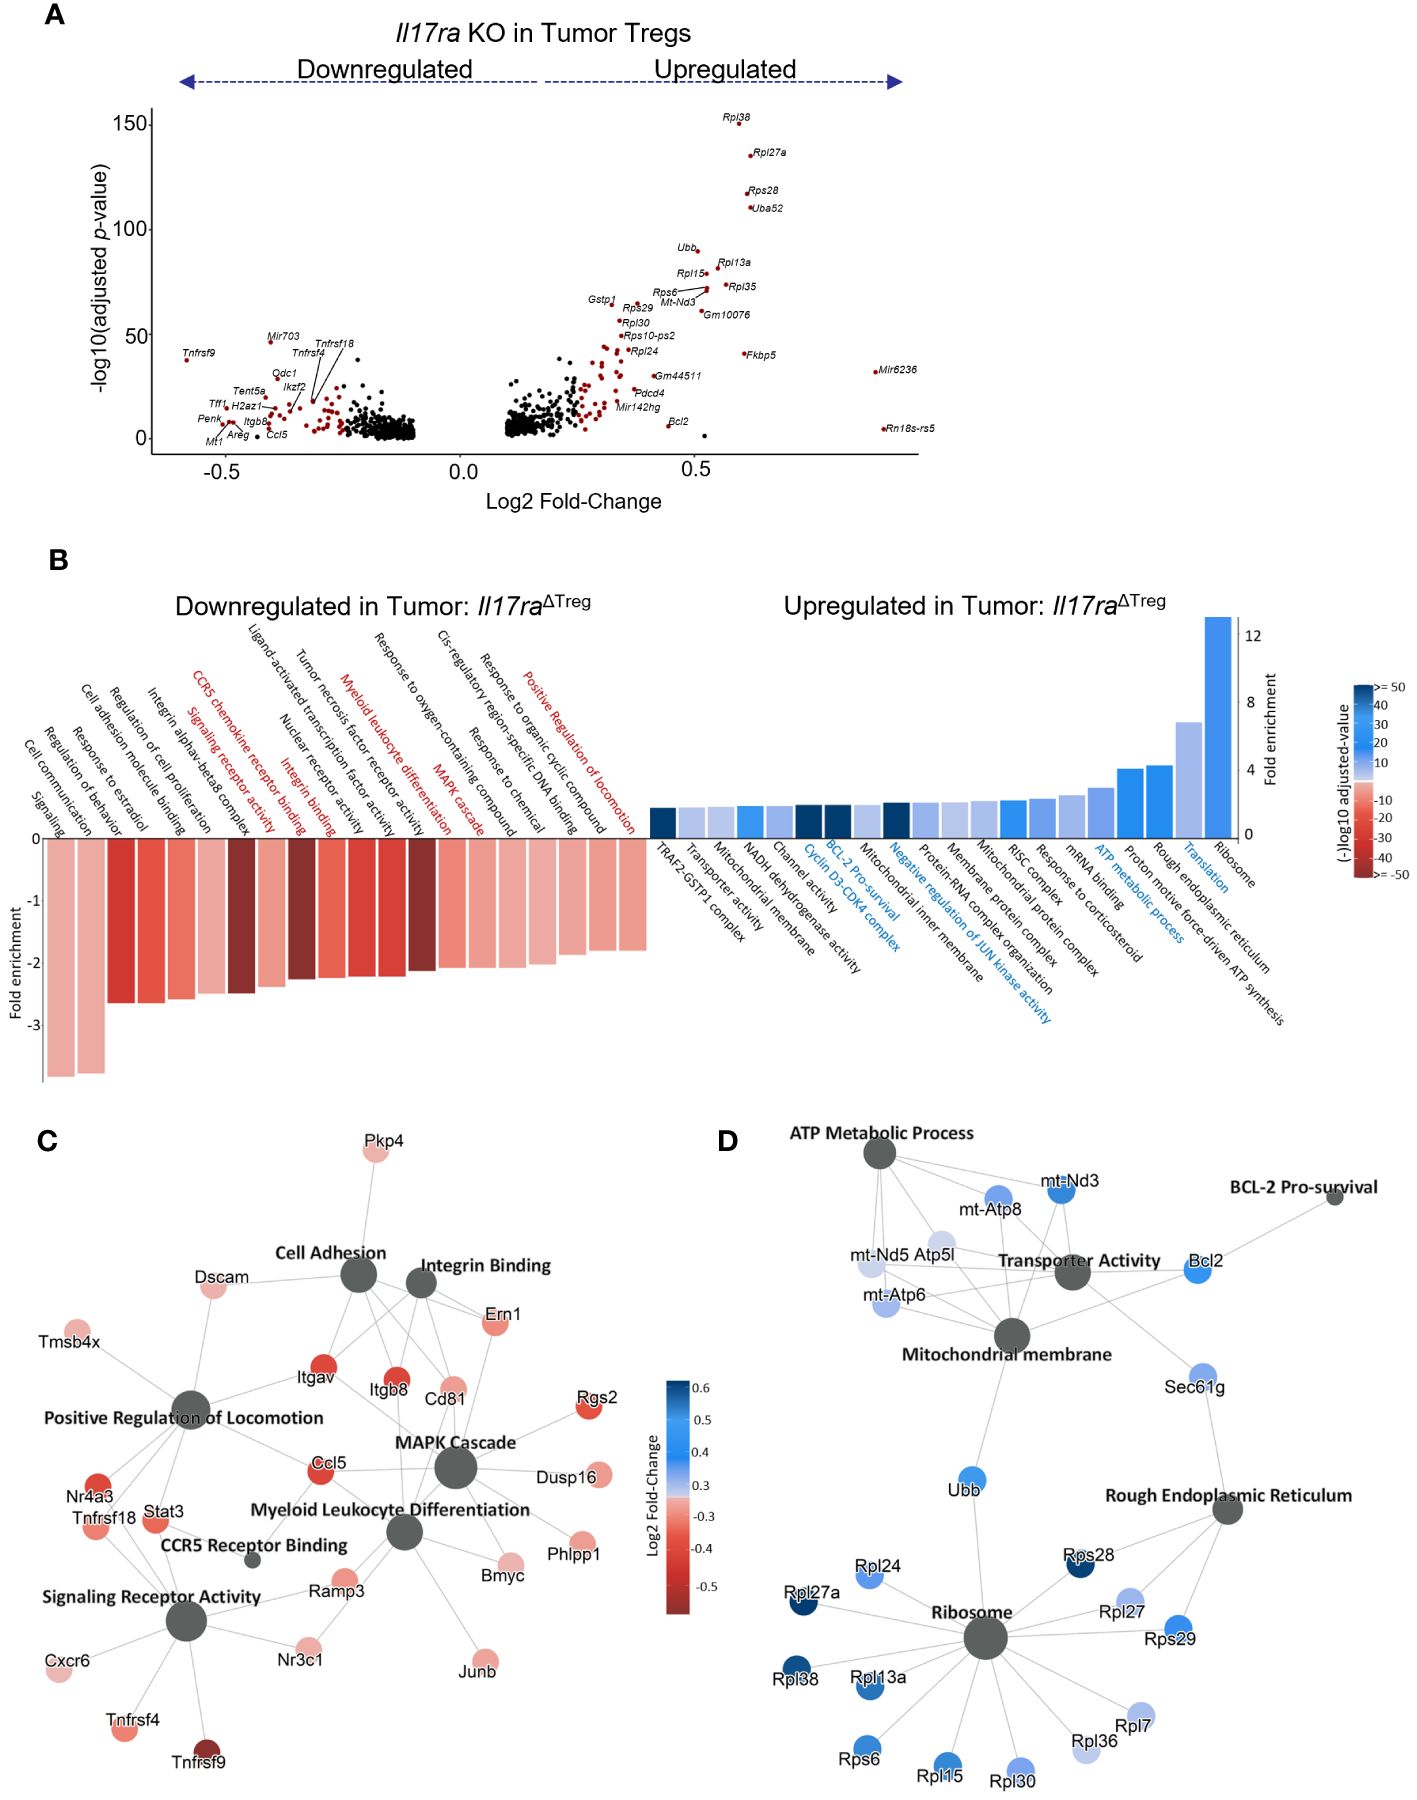
Figure 3 IL-17 promotes suppression gene signatures in tumor-infiltrating Tregs. (A) Volcano plot of statistically significant (log2FC >= 0.25, adjusted p-value < 0.05, min.pct >= 0.1) differentially expressed genes in scRNAseq data between Il17raΔTreg and control tumor-infiltrating Tregs. (B) Gene Ontology (GO) pathway enrichment analysis of genes significantly up or downregulated by Il17ra KO in tumor Tregs. (C, D) Gene network plots of a subset of pathways significantly enriched amongst the down (C) and upregulated (D) DEGs by IL-17 signaling.
A small fraction of Tregs in the tumor also upregulated IL-17, indicating plastic functions of these cells (Figures 4A, D), although the total number of FOXP3+ Tregs did not significantly change upon ablation of IL-17RA (Figure 4B). Consistent with our observation that IL-17 promotes Treg suppressive function, ablation of IL-17RA in Tregs leads to an increased proportion of CD4+ T cells that express IL-17 (Figure 4C). These IL-17 producing cells are either Foxp3+ or Foxp3-, suggesting both enhancement in Th17 population and increased Treg plasticity (Figures 4D, E). We did not observe a noticeable change in the proportions of CD4+ T cells that produce IFN-γ (Figures 4F, G), or changes in the proportion of CD4 or CD8 cells among all CD45+ cells in the tumor (Figures 4H, I). Importantly, ablation of IL-17 signaling in Tregs resulted in increased tumor number and tumor load in mice, demonstrating a previously unknown tumor-inhibitory role of IL-17R through its function in Tregs (Figures 4J–L).
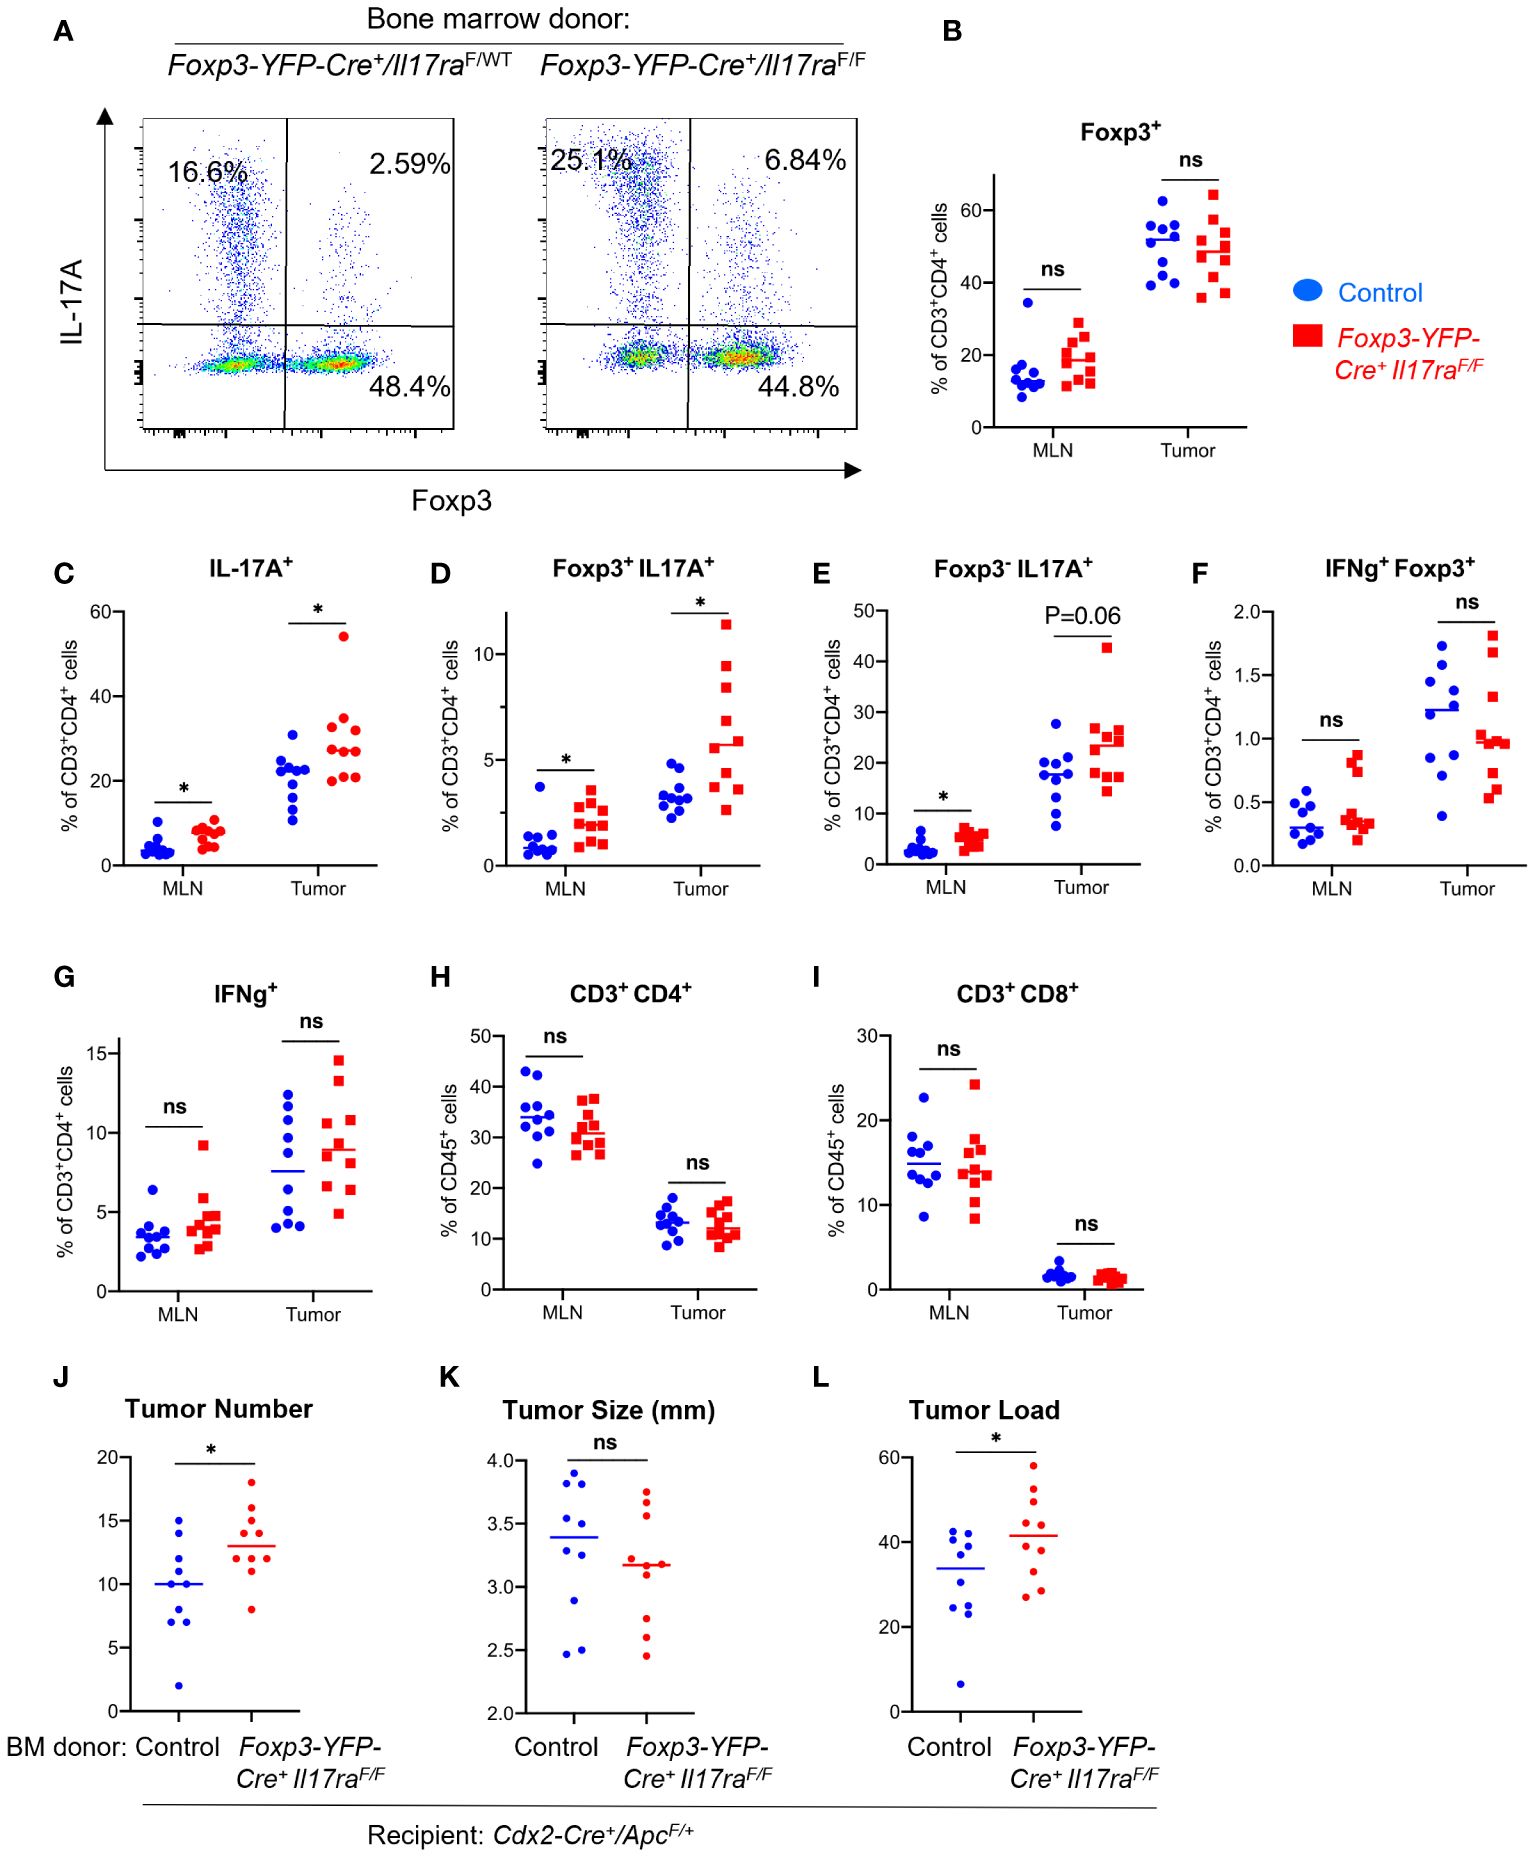
Figure 4 IL-17 signaling to Tregs controls Th17 population and inhibits CRC development. Cdx2-Cre+/ApcF/+ mice received adoptive transfer of bone marrow cells from Foxp3-YFP-Cre+/Il17raF/F (Il17raΔTreg) and Foxp3-YFP-Cre+/Il17raF/+ (control) mice, and were sacrificed at 5 months of age. MLN and tumor tissues were dissociated and subjected to flow cytometry analysis. (A–I) MLN and tumor cells from indicated mouse populations were stimulated with PMA/ionomycin in the presence of brefeldin A and monensin, and stained for intracellular cytokines and Foxp3. Stained cells were gated on the live/CD45+ population, n=10. (J–L) Colorectal tumors were measured with a caliper, and their numbers and average tumor diameters are shown, n=10. Tumor load was calculated as the sum of all tumors’ diameters of each animal. *p<0.05, Students’ t test. ns, not significant.
To further investigate how IL-17 signaling impacts Treg function, we analyzed human cancer patient scRNAseq datasets containing FOXP3+ Treg populations (32–37) (Figure 5A). Analysis of Treg populations within human tumors, normal adjacent tissues, and peripheral blood samples revealed genes associated with activation, differentiation, and suppressive function in the tumor. From these genes we created a tumor Treg signature which identified Tregs from the blood, adjacent tissue, and tumor that can be distinguished based on our gene signature (Figure 5B). The gene signature was comprised of genes associated with T cell activation, including RGS2 (83), Gadd45b (84), TNFRSF9 (4-1BB) (70, 71), TNFRSF4 (OX40) (49, 72, 73), and TNFRSF18 (GITR) (74). Also included were the Treg differentiation transcription factor NR4A1 (85), tumor Treg associated gene CCL5 (86), as well as immunosuppression-related genes CREM (87) and CXCR6 (88). A heatmap of the individual genes that comprised the Treg signature, along with unbiased hierarchical clustering of the tissue samples, grouped all tumor, adjacent normal tissue, and peripheral blood samples, irrespective of the cancer/tissue type of origin (Figure 5C). An examination of the mouse homolog genes in the scRNAseq datasets of MLN and tumor Tregs from control and Il17raΔTreg CRC mice revealed a similar pattern, with low expression in both the control and Il17raΔTreg CRC MLN Tregs, and high expression in the control tumor Tregs. Importantly, the Il17ra KO tumor Tregs had a reduced tumor Treg signature and were shifted towards the lower levels found in the MLN conditions (Figure 5D). A heatmap of the individual genes comprising the tumor Treg signature shows each gene is downregulated by Il17ra KO in the tumor Tregs (log2 fold-change >= 0.25, adjusted p-value < 0.05), but were not significantly altered by KO in Tregs in the MLN (Figure 5E). These data suggest a Treg gene signature which can unbiasedly distinguish blood, normal tissue, and tumor Tregs, regardless of cancer/tissue type. This gene signature associated with tumor Tregs is conserved between mouse and human and is significantly reduced by ablation of IL-17RA in these cells.
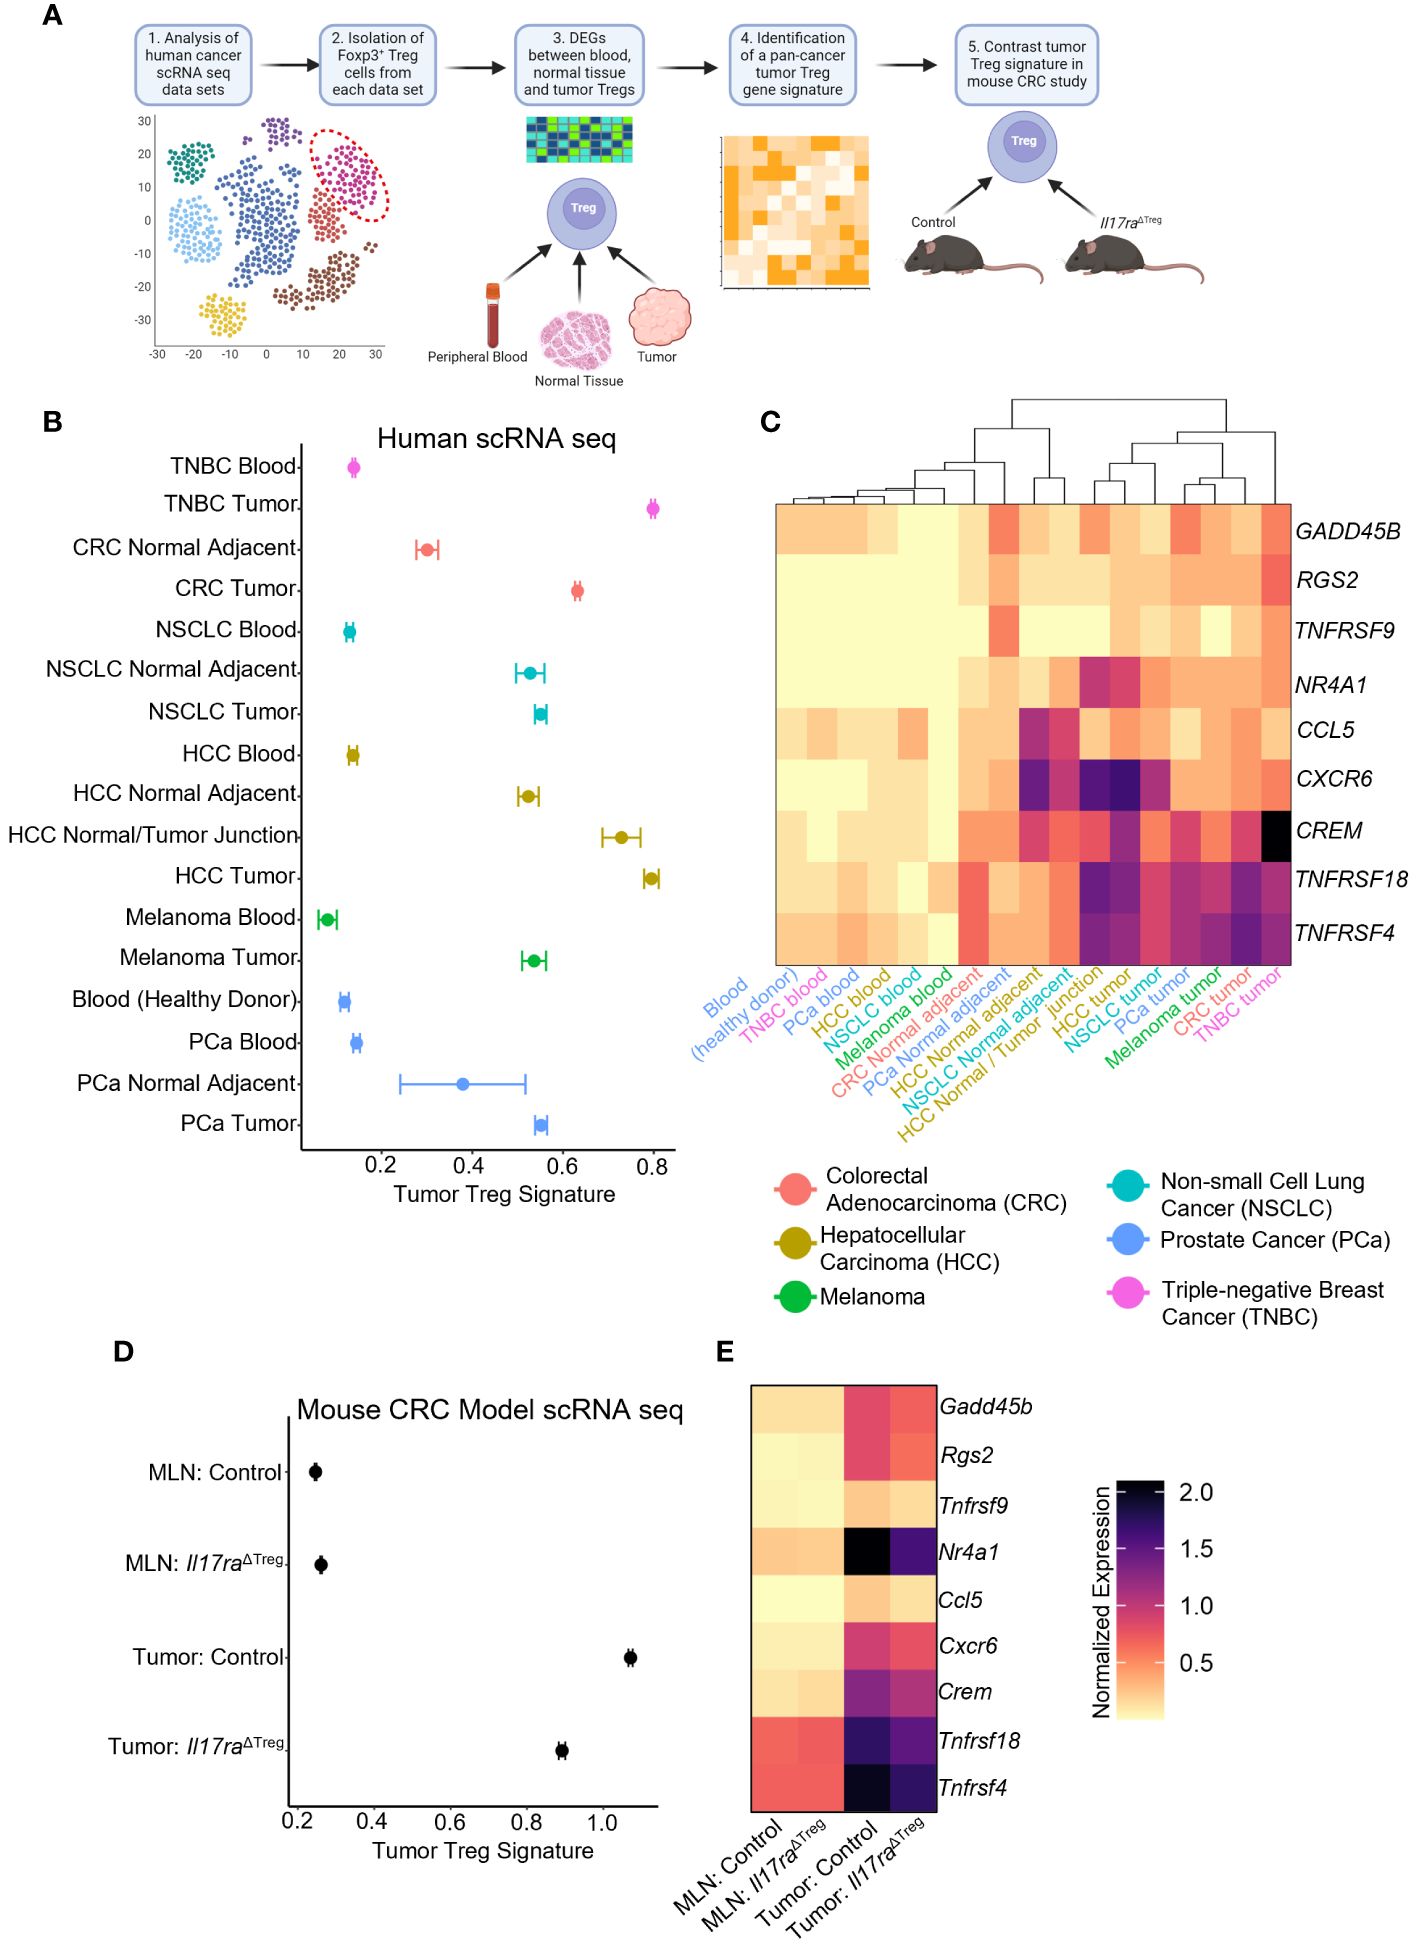
Figure 5 IL-17 promotes a “tumor Treg signature” in cancers. (A) Scheme of tumor Treg signature development. Human cancer scRNAseq datasets were analyzed for populations of Tregs. Treg cells were subset from each human cancer dataset based on the original authors’ cell-type assignments, where available, and confirmation of expression of FOXP3 in all immune cells. Differential expression analysis was performed between conditions (peripheral blood, normal tissue, tumor samples). Genes were filtered to retain those which were enriched in the tumor conditions (log2 fold-change >= 0.25, adjusted p-value < 0.05, min.pct >= 0.1) relative to their associated control conditions in all data sets to obtain a pan-cancer/tissue gene signature specific to tumor infiltrating Tregs. This signature was used for comparative study in the mouse CRC datasets. (B) Dotplot of Tumor Treg signature score for Tregs isolated from human cancer patient scRNAseq datasets. (C) Heatmap of the individual genes comprising the composite tumor Treg signature, for each of the human scRNAseq datasets with hierarchical clustering of datasets by heatmap dendrogram. (D) Tumor Treg signature in each of the four scRNAseq conditions from control and Il17raΔTreg Tregs isolated from the MLN and tumor. (E) Heatmap of individual genes comprising the tumor Treg score. All genes between tumor control and tumor Il17raΔTreg conditions were significant (log2 fold-change >= 0.25, adjusted p-value < 0.05, min.pct >= 0.1).
Analysis of RNA velocity in mouse Treg scRNAseq data revealed splicing changes resulting from Treg activation and tumor infiltration (Figure 1E). However, conventional techniques employed for scRNAseq limits the capacity for full or deep analysis of splicing due to the high rate of dropout, low sequencing depth and low coverage due to 3’ end sequencing of RNA (89, 90). Therefore, to investigate if Il17ra KO influences alternative splicing in Tregs, we isolated CD4+ FOXP3+ cells from the MLN and colon tumors and performed bulk RNA sequencing. An analysis of gene expression levels (FPKM) between control and Il17ra KO Tregs in the MLN showed a strong correlation between conditions (R2 = 0.976) (Figure 6A). However, in the tumor, the correlation between control and Il17ra KO was reduced (R2 = 0.809), with visible populations of differentially expressed genes between the two conditions (circled in red) (Figure 6B). These findings agree with our observation, through single-cell sequencing, that response to IL-17 signaling is limited to Tregs infiltrating the tumor environment, and that changes in gene expression profiles and Treg functions are tumor-specific. An analysis of differential isoform usage demonstrated that while few significant changes occurred in the MLN (-log10 adjusted p-value) there were robust isoform switches occurring between control and Il17ra KO Tregs in the tumor (Figures 6C, D). Consistent with our previous findings from scRNAseq, these data demonstrate that compared to Tregs in the MLN, where Tregs lack the necessary co-receptors of IL-17RA, tumor-infiltrating Tregs exhibit significant changes in isoform usage when Treg-specific Il17ra is knocked out. We next analyzed enrichment of splicing events between Il17ra WT and KO Tregs in the MLN and tumor. We found that while no significant changes were observed between Il17ra WT and KO Tregs in the MLN (Figure 6E), in the tumor, Il17ra KO Tregs exhibited significant reductions in alternative 3’ and 5’ donor sites, alternative transcription termination sites, exon/multiple-exon skipping, and an increase in intron retention, relative to control Tregs in the tumor (Figure 6F). As RNA binding proteins play an essential role in mRNA processing and generation of alternative isoforms (91), we analyzed the gene expression of known RNA binding proteins (RBPs) which were expressed in the Treg bulk RNAseq data. While in the MLN, RBP expression appears similar, in the tumor, Il17ra KO Tregs showed a substantial number of RBPs which were downregulated, and a smaller proportion which were upregulated, relative to control tumor Tregs (Figure 6G). Recently, several studies have identified RBPs which are key regulators of splicing in Tregs and essential for their function and immunosuppressive effects. In particular, the RBPs Srsf1 (92), Wtap (93), and Usp39 (94) were all significantly downregulated in Il17ra KO tumor Tregs (Figure 6H). Together, these data suggest that the downregulation of RBPs, in the absence of IL-17 signaling in tumor Tregs, leads to a reduction in alternative splicing that is important for Treg activation and function in the tumor.
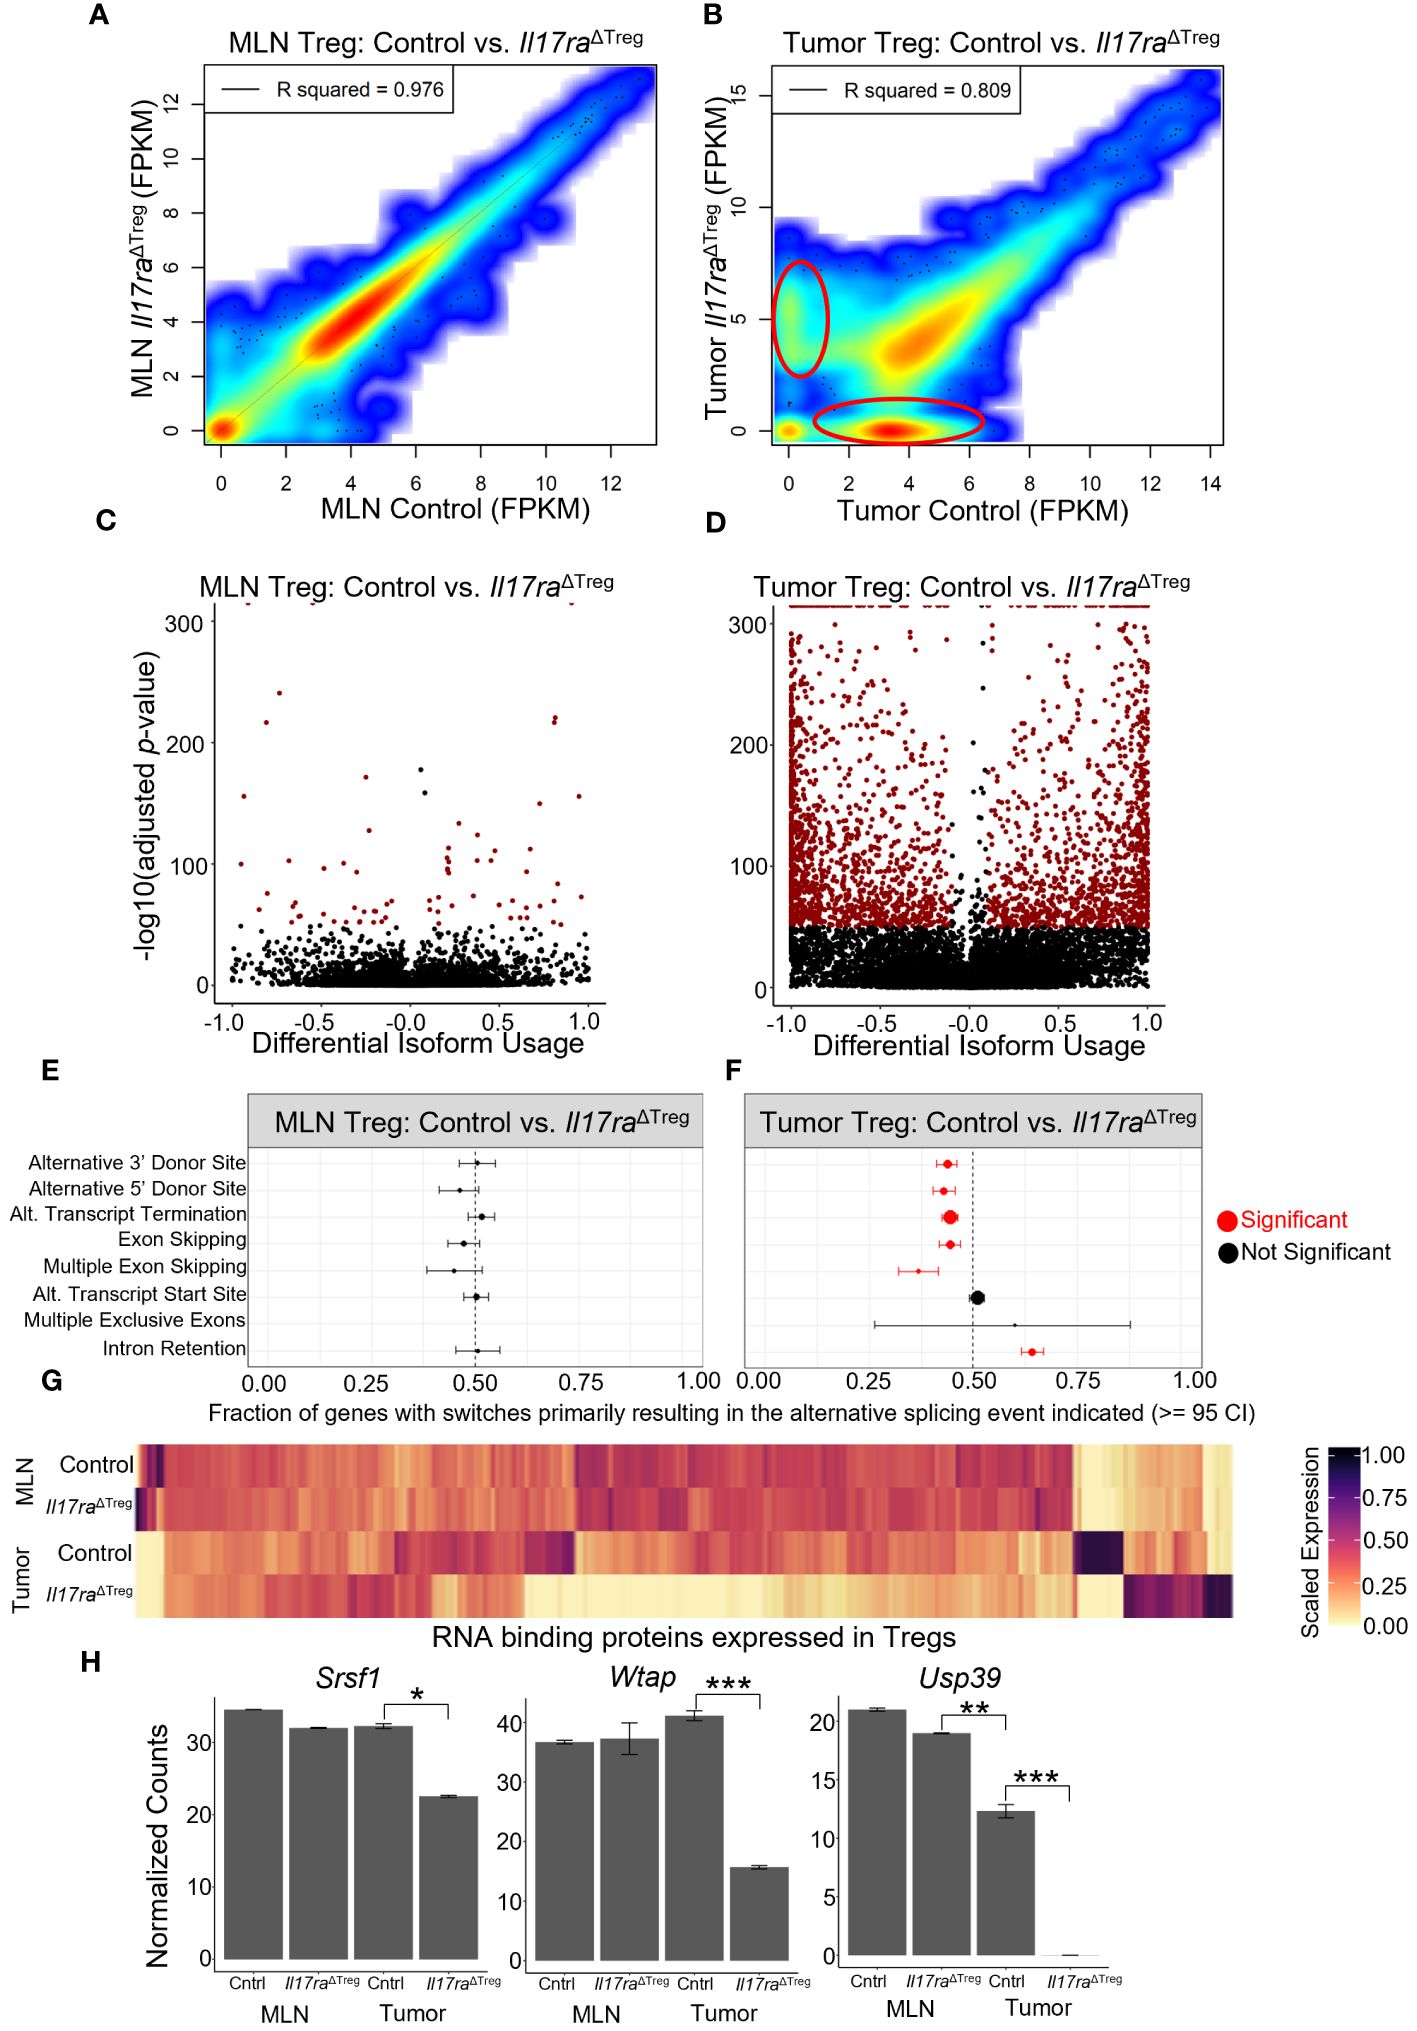
Figure 6 Treg-specific IL-17RA signaling modulates RNA splicing. (A, B) Scatter heat plot of FPKM values from bulk RNA sequencing (bulkRNAseq) data between control and Il17raΔTreg in the MLN (A) and tumor (B) analyzed using DESeq2. (C) Volcano plot of significant transcript isoform switches occurring between MLN WT and KO compared to (D) significant transcript isoform switches occurring between tumor WT and KO (highlighted in red: differential isoform usage >= 0.1, -log10(adjusted p-value) >= 50). (E, F) Analysis of splicing events occurring in transcripts between WT and KO conditions in the MLN (E) and tumor (F). Significant events highlighted in red (>= 95 confidence interval). (G) Heatmap of RNA binding protein genes (annotated as ‘RNA splicing’ by gene ontology) expressed in MLN or tumor Tregs. (H) Bar plots of significantly differentially expressed RNA splicing regulators Srsf1, Wtap, and Usp39 in bulk RNA sequencing of WT and KO conditions in the MLN and tumor. Adjusted p-values were determined using DESeq2 (*p<0.05, **p<0.001, ***p<0.0001).
In this study, we report a direct role of IL-17 in promoting Treg function in CRC (Figure 7). Contrary to what is known for the signaling of IL-17 to transformed epithelial cells (20, 22, 23), the IL-17/Treg pathway serves as a tumor suppressor, and its ablation resulted in increased tumor numbers and tumor load (Figures 4J, L). This observation is consistent with the known role of Tregs in downregulating tumor-promoting inflammation in early-stage colon cancer (8, 95–98). However, in late-stage cancers, a high intratumoral Treg : CD8 ratio typically signifies suppressed anti-tumor immunity and favors immune evasion of cancer (99). Treg number has been shown to correlate with poorer prognosis in multiple cancers (100–104). In addition to solid tumors, Tregs are also suggested to be a negative factor in the treatment of leukemias (105–107). It will be intriguing to also interrogate the interaction between IL-17 and Tregs in the setting of hematopoietic malignancies. Indeed, many therapies to prevent Treg suppressive function in the tumor environment are in development and in clinical trials (108). Our analysis on human tumor-infiltrating Tregs showed a unique tumor Treg signature that coincides with the mouse model of CRC, and downregulation of this signature by IL-17 in mice implies that direct IL-17/Treg signaling is plausible in human cancers. It remains to be interrogated if IL-17/Treg direct communication exacerbates immune evasion and/or sabotages cancer immunotherapy, and demonstrating this link will support the use of IL-17 blocking agents as adjuvant therapies for cancers.
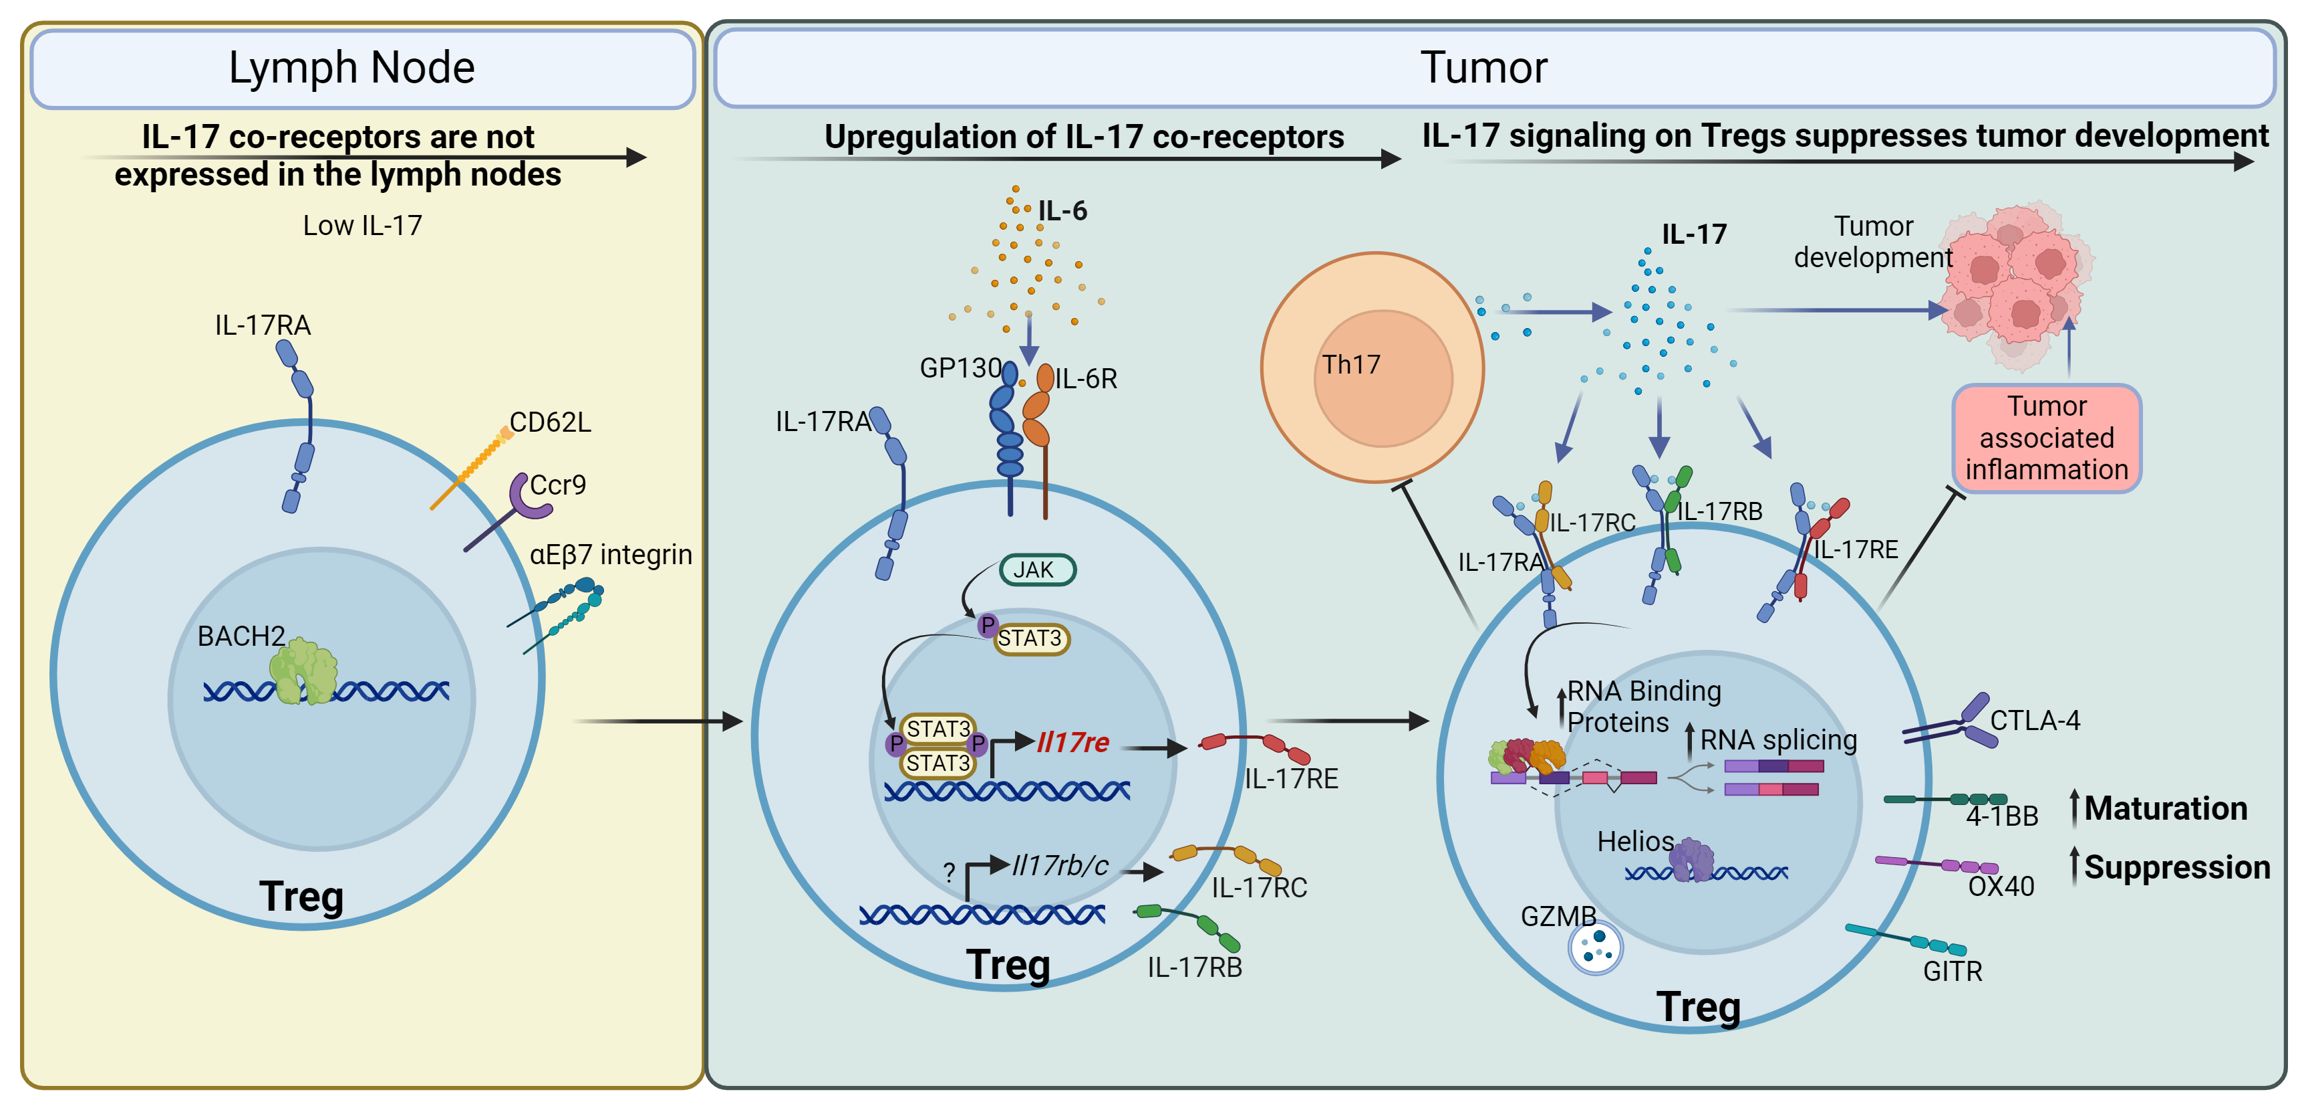
Figure 7 IL-17 promotes maturation and function of Tregs to control CRC development. Tregs in the mesenteric lymph node, where IL-17 is low, express Il17ra but do not express co-receptors required for IL-17 signaling. Upon entry to the tumor environment, Tregs are stimulated by IL-6 and other inflammatory cytokines to upregulate co-receptors for IL-17, such as IL-17RB, C, and E. IL-17 in turn signals to these Tregs and promotes their maturation and suppressive function. This is mediated by the upregulation of Treg surface receptors such as CTLA-4, 4-1BB (CD137), OX40 (CD134), and GITR, cytotoxicity effector Granzyme B, and transcription factor Helios. IL-17 also upregulates the expression of RNA binding proteins and facilitates RNA splicing in Tregs, which are important for Treg function. In turn, Tregs with enhanced activation and maturation markers suppress Th17 cells, leading to a reduction in IL-17 production, thus forming a negative regulatory loop to control IL-17-mediated inflammation. In the case of early-stage colorectal cancer, IL-17 mediated Treg maturation inhibits tumor-associated inflammation, and reduces tumor development in the gut.
Tregs are highly plastic and can co-express markers and secrete cytokines of conventional CD4+ T cell subsets (109). Tissue-resident Tregs express the Th2 transcription factor GATA3 in addition to FOXP3 (110). Additionally, while most IL-17 producing T cells are Th17, a small subset of FOXP3+/RORγt+ Tregs can produce IL-17A in both humans and mice (111–113). Our observation that Tregs upregulate IL-17 co-receptors following inflammatory cytokine stimulation also represents a form of plasticity in these cells. It is therefore plausible that peripheral Tregs, while devoid of IL-17 co-receptor expression, are attracted to the TME by chemokine gradients and aim at suppressing tumor associated inflammation/immunity. Once in the tumor environment, Tregs stimulated by cytokines, and possibly other environmental factors, upregulate IL-17 receptors. IL-17 in turn promotes further maturation of Tregs and enhances their function. It remains to be determined what signals in vivo activate IL-17 co-receptor expression in Tregs. However, we demonstrate that in vitro, iTregs respond to IL-6 by upregulating IL-17RE. On top of that, it is important to investigate if the TME is the only setting whereby Treg function is controlled by IL-17. Other promising targets include autoimmunity and chronic infection, where both IL-17 and Tregs play prominent roles. Indeed, in a model of MOG-immunization, a subset of Tregs were found to express both RORγt and CCR6 that is promoted by IL-6/STAT3 signaling in these cells (114). These “Tr17” cells also express IL-17RE, and are highly suppressive to antigen-specific Th1 and Th17 cells in vitro (114). The function of IL-17RE on these Tr17 cells is unknown. Investigating the IL-17/Treg signaling axis in these scenarios will provide new insight on the function and dysfunction of Tregs in human health and disease.
Raw and processed data from bulk RNA sequencing and single-cell RNA sequencing of CD4+ FOXP3+ Tregs from the tumor and mesenteric lymph node were deposited at the Gene Expression Omnibus (GEO). Bulk RNA sequencing data is available with accession number GSE262402 and single cell data is available with accession number GSE262405.
Ethical approval was not required for the studies on humans in accordance with the local legislation and institutional requirements because only commercially available established cell lines were used. The animal study was approved by University of Connecticut Health Center IACUC. The study was conducted in accordance with the local legislation and institutional requirements.
WCT: Conceptualization, Writing – original draft, Data curation, Formal analysis, Methodology, Software. JC: Conceptualization, Data curation, Formal analysis, Methodology, Writing – original draft, Investigation, Validation. EVT: Formal analysis, Investigation, Writing – review & editing. XY: Formal analysis, Investigation, Writing – review & editing, Data curation. AM: Data curation, Formal analysis, Investigation, Writing – review & editing, Methodology. ATV: Writing – review & editing, Conceptualization, Resources, Supervision, Visualization. KW: Conceptualization, Supervision, Writing – review & editing, Funding acquisition, Project administration, Writing – original draft.
The author(s) declare financial support was received for the research, authorship, and/or publication of this article. This work was supported by an American Association of Immunologists Careers in Immunology Fellowship to JC, National Institute of Health training grant (T90DE033006) to EVT, Boehringer Ingelheim endowed chair to ATV, and National Institute of Health/National Cancer Institute (NIH/NCI R01CA262430) to KW. The content is solely the responsibility of the authors and does not necessarily represent the official views of the National Institutes of Health. The funders had no role in study design, data collection, and interpretation, or the decision to submit the work for publication.
We thank Dr. Evan Jellison and Ms. Li Zhu at the UConn Health Flow Cytometry Core Facility for technical assistance. We also thank the Jackson Laboratory single-cell genomics lab and UConn Center for Genome Innovation for assistance in RNA sequencing and bioinformatics.
The authors declare that the research was conducted in the absence of any commercial or financial relationships that could be construed as a potential conflict of interest.
All claims expressed in this article are solely those of the authors and do not necessarily represent those of their affiliated organizations, or those of the publisher, the editors and the reviewers. Any product that may be evaluated in this article, or claim that may be made by its manufacturer, is not guaranteed or endorsed by the publisher.
The Supplementary Material for this article can be found online at: https://www.frontiersin.org/articles/10.3389/fimmu.2024.1408710/full#supplementary-material
1. Grivennikov SI, Greten FR, Karin M. Immunity, inflammation, and cancer. Cell. (2010) 140:883–99. doi: 10.1016/j.cell.2010.01.025
2. Ekbom A, Helmick C, Zack M, Adami HO. Ulcerative colitis and colorectal cancer. A population-based study. N Engl J Med. (1990) 323:1228–33. doi: 10.1056/NEJM199011013231802
3. Ekbom A, Helmick C, Zack M, Adami HO. Increased risk of large-bowel cancer in Crohn's disease with colonic involvement. Lancet. (1990) 336:357–9. doi: 10.1016/0140-6736(90)91889-I
4. Yan JB, Luo MM, Chen ZY, He BH. The function and role of the Th17/Treg cell balance in inflammatory bowel disease. J Immunol Res. (2020) 2020:8813558. doi: 10.1155/2020/8813558
5. Wang L, Ray A, Jiang X, Wang JY, Basu S, Liu X, et al. T regulatory cells and B cells cooperate to form a regulatory loop that maintains gut homeostasis and suppresses dextran sulfate sodium-induced colitis. Mucosal Immunol. (2015) 8:1297–312. doi: 10.1038/mi.2015.20
6. Sakaguchi S, Sakaguchi N, Asano M, Itoh M, Toda M. Immunologic self-tolerance maintained by activated T cells expressing IL-2 receptor alpha-chains (CD25). Breakdown of a single mechanism of self-tolerance causes various autoimmune diseases. J Immunol. (1995) 155:1151–64. doi: 10.4049/jimmunol.155.3.1151
7. Mullins GN, Valentine KM, Al-Kuhlani M, Davini D, Jensen KDC, Hoyer KK. T cell signaling and Treg dysfunction correlate to disease kinetics in IL-2Ralpha-KO autoimmune mice. Sci Rep. (2020) 10:21994. doi: 10.1038/s41598-020-78975-y
8. Dennis KL, Wang Y, Blatner NR, Wang S, Saadalla A, Trudeau E, et al. Adenomatous polyps are driven by microbe-instigated focal inflammation and are controlled by IL-10-producing T cells. Cancer Res. (2013) 73:5905–13. doi: 10.1158/0008-5472.CAN-13-1511
9. Davidson NJ, Leach MW, Fort MM, Thompson-Snipes L, Kuhn R, Muller W, et al. T helper cell 1-type CD4+ T cells, but not B cells, mediate colitis in interleukin 10-deficient mice. J Exp Med. (1996) 184:241–51. doi: 10.1084/jem.184.1.241
10. Berg DJ, Davidson N, Kuhn R, Muller W, Menon S, Holland G, et al. Enterocolitis and colon cancer in interleukin-10-deficient mice are associated with aberrant cytokine production and CD4(+) TH1-like responses. J Clin Invest. (1996) 98:1010–20. doi: 10.1172/JCI118861
11. Wirtz S, Billmeier U, McHedlidze T, Blumberg RS, Neurath MF. Interleukin-35 mediates mucosal immune responses that protect against T-cell-dependent colitis. Gastroenterology. (2011) 141:1875–86. doi: 10.1053/j.gastro.2011.07.040
12. Collison LW, Workman CJ, Kuo TT, Boyd K, Wang Y, Vignali KM, et al. The inhibitory cytokine IL-35 contributes to regulatory T-cell function. Nature. (2007) 450:566–9. doi: 10.1038/nature06306
13. Eastaff-Leung N, Mabarrack N, Barbour A, Cummins A, Barry S. Foxp3+ regulatory T cells, Th17 effector cells, and cytokine environment in inflammatory bowel disease. J Clin Immunol. (2010) 30:80–9. doi: 10.1007/s10875-009-9345-1
14. Meehan EV, Wang K. Interleukin-17 family cytokines in metabolic disorders and cancer. Genes (Basel). (2022) 13(9), 1643. doi: 10.3390/genes13091643
15. McGeachy MJ, Cua DJ, Gaffen SL. The IL-17 family of cytokines in health and disease. Immunity. (2019) 50:892–906. doi: 10.1016/j.immuni.2019.03.021
16. Huang J, Lee HY, Zhao X, Han J, Su Y, Sun Q, et al. Interleukin-17D regulates group 3 innate lymphoid cell function through its receptor CD93. Immunity. (2021) 54:673–86 e4. doi: 10.1016/j.immuni.2021.03.018
17. Iwakura Y, Ishigame H, Saijo S, Nakae S. Functional specialization of interleukin-17 family members. Immunity. (2011) 34:149–62. doi: 10.1016/j.immuni.2011.02.012
18. Reynolds JM, Angkasekwinai P, Dong C. IL-17 family member cytokines: regulation and function in innate immunity. Cytokine Growth Factor Rev. (2010) 21:413–23. doi: 10.1016/j.cytogfr.2010.10.002
19. Wang K, Kim MK, Di Caro G, Wong J, Shalapour S, Wan J, et al. Interleukin-17 receptor a signaling in transformed enterocytes promotes early colorectal tumorigenesis. Immunity. (2014) 41:1052–63. doi: 10.1016/j.immuni.2014.11.009
20. Chae WJ, Gibson TF, Zelterman D, Hao L, Henegariu O, Bothwell AL. Ablation of IL-17A abrogates progression of spontaneous intestinal tumorigenesis. Proc Natl Acad Sci USA. (2010) 107:5540–4. doi: 10.1073/pnas.0912675107
21. Grivennikov SI, Wang K, Mucida D, Stewart CA, Schnabl B, Jauch D, et al. Adenoma-linked barrier defects and microbial products drive IL-23/IL-17-mediated tumour growth. Nature. (2012) 491:254–8. doi: 10.1038/nature11465
22. Song X, Gao H, Lin Y, Yao Y, Zhu S, Wang J, et al. Alterations in the microbiota drive interleukin-17C production from intestinal epithelial cells to promote tumorigenesis. Immunity. (2014) 40:140–52. doi: 10.1016/j.immuni.2013.11.018
23. Chae WJ, Bothwell AL. IL-17F deficiency inhibits small intestinal tumorigenesis in ApcMin/+ mice. Biochem Biophys Res Commun. (2011) 414:31–6. doi: 10.1016/j.bbrc.2011.09.016
24. Chang SH, Reynolds JM, Pappu BP, Chen G, Martinez GJ, Dong C. Interleukin-17C promotes Th17 cell responses and autoimmune disease via interleukin-17 receptor E. Immunity. (2011) 35:611–21. doi: 10.1016/j.immuni.2011.09.010
25. Shibata H, Toyama K, Shioya H, Ito M, Hirota M, Hasegawa S, et al. Rapid colorectal adenoma formation initiated by conditional targeting of the Apc gene. Science. (1997) 278:120–3. doi: 10.1126/science.278.5335.120
26. Hinoi T, Akyol A, Theisen BK, Ferguson DO, Greenson JK, Williams BO, et al. Mouse model of colonic adenoma-carcinoma progression based on somatic Apc inactivation. Cancer Res. (2007) 67:9721–30. doi: 10.1158/0008-5472.CAN-07-2735
27. Butler A, Hoffman P, Smibert P, Papalexi E, Satija R. Integrating single-cell transcriptomic data across different conditions, technologies, and species. Nat Biotechnol. (2018) 36:411–20. doi: 10.1038/nbt.4096
28. La Manno G, Soldatov R, Zeisel A, Braun E, Hochgerner H, Petukhov V, et al. RNA velocity of single cells. Nature. (2018) 560:494–8. doi: 10.1038/s41586-018-0414-6
29. Bergen V, Lange M, Peidli S, Wolf FA, Theis FJ. Generalizing RNA velocity to transient cell states through dynamical modeling. Nat Biotechnol. (2020) 38:1408–14. doi: 10.1038/s41587-020-0591-3
30. Kolberg L, Raudvere U, Kuzmin I, Vilo J, Peterson H. gprofiler2 – an R package for gene list functional enrichment analysis and namespace conversion toolset g:Profiler. F1000Res. (2020) 9: ELIXIR-709. doi: 10.12688/f1000research.24956.1
31. Yu G, Wang LG, Han Y, He QY. clusterProfiler: an R package for comparing biological themes among gene clusters. OMICS. (2012) 16:284–7. doi: 10.1089/omi.2011.0118
32. Steele NG, Carpenter ES, Kemp SB, Sirihorachai VR, The S, Delrosario L, et al. Multimodal mapping of the tumor and peripheral blood immune landscape in human pancreatic cancer. Nat Cancer. (2020) 1:1097–112. doi: 10.1038/s43018-020-00121-4
33. Shan F, Cillo AR, Cardello C, Yuan DY, Kunning SR, Cui J, et al. Integrated BATF transcriptional network regulates suppressive intratumoral regulatory T cells. Sci Immunol. (2023) 8:eadf6717. doi: 10.1126/sciimmunol.adf6717
34. Zhang Y, Chen H, Mo H, Hu X, Gao R, Zhao Y, et al. Single-cell analyses reveal key immune cell subsets associated with response to PD-L1 blockade in triple-negative breast cancer. Cancer Cell. (2021) 39:1578–93.e8. doi: 10.1016/j.ccell.2021.09.010
35. Zheng C, Zheng L, Yoo JK, Guo H, Zhang Y, Guo X, et al. Landscape of infiltrating T cells in liver cancer revealed by single-cell sequencing. Cell. (2017) 169:1342–56 e16. doi: 10.1016/j.cell.2017.05.035
36. Guo X, Zhang Y, Zheng L, Zheng C, Song J, Zhang Q, et al. Global characterization of T cells in non-small-cell lung cancer by single-cell sequencing. Nat Med. (2018) 24:978–85. doi: 10.1038/s41591-018-0045-3
37. Pelka K, Hofree M, Chen JH, Sarkizova S, Pirl JD, Jorgji V, et al. Spatially organized multicellular immune hubs in human colorectal cancer. Cell. (2021) 184:4734–52 e20. doi: 10.1016/j.cell.2021.08.003
38. Kim D, Paggi JM, Park C, Bennett C, Salzberg SL. Graph-based genome alignment and genotyping with HISAT2 and HISAT-genotype. Nat Biotechnol. (2019) 37:907–15. doi: 10.1038/s41587-019-0201-4
39. Pertea M, Pertea GM, Antonescu CM, Chang TC, Mendell JT, Salzberg SL. StringTie enables improved reconstruction of a transcriptome from RNA-seq reads. Nat Biotechnol. (2015) 33:290–5. doi: 10.1038/nbt.3122
40. Love MI, Huber W, Anders S. Moderated estimation of fold change and dispersion for RNA-seq data with DESeq2. Genome Biol. (2014) 15:550. doi: 10.1186/s13059-014-0550-8
41. Vitting-Seerup K, Sandelin A. IsoformSwitchAnalyzeR: analysis of changes in genome-wide patterns of alternative splicing and its functional consequences. Bioinformatics. (2019) 35:4469–71. doi: 10.1093/bioinformatics/btz247
42. Roychoudhuri R, Hirahara K, Mousavi K, Clever D, Klebanoff CA, Bonelli M, et al. BACH2 represses effector programs to stabilize Treg-mediated immune homeostasis. Nature. (2013) 498:506–10. doi: 10.1038/nature12199
43. Tsukumo S-I, Unno M, Muto A, Takeuchi A, Kometani K, Kurosaki T, et al. Bach2 maintains T cells in a naive state by suppressing effector memory-related genes. Proc Natl Acad Sci. (2013) 110:10735–40. doi: 10.1073/pnas.1306691110
44. Huard B, Gaulard P, Faure F, Hercend T, Triebel F. Cellular expression and tissue distribution of the human LAG-3-encoded protein, an MHC class II ligand. Immunogenetics. (1994) 39:213–7. doi: 10.1007/BF00241263
45. Budd RC, Cerottini JC, Horvath C, Bron C, Pedrazzini T, Howe RC, et al. Distinction of virgin and memory T lymphocytes. Stable acquisition of the Pgp-1 glycoprotein concomitant with antigenic stimulation. J Immunol. (1987) 138:3120–9. doi: 10.4049/jimmunol.138.10.3120
46. Zabel BA, Agace WW, Campbell JJ, Heath HM, Parent D, Roberts AI, et al. Human G protein-coupled receptor GPR-9-6/CC chemokine receptor 9 is selectively expressed on intestinal homing T lymphocytes, mucosal lymphocytes, and thymocytes and is required for thymus-expressed chemokine-mediated chemotaxis. J Exp Med. (1999) 190:1241–56. doi: 10.1084/jem.190.9.1241
47. Cerf-Bensussan N, Jarry A, Brousse N, Lisowska-Grospierre B, Guy-Grand D, Griscelli C. A monoclonal antibody (HML-1) defining a novel membrane molecule present on human intestinal lymphocytes. Eur J Immunol. (1987) 17:1279–85. doi: 10.1002/eji.1830170910
48. Kilshaw PJ, Baker KC. A unique surface antigen on intraepithelial lymphocytes in the mouse. Immunol Lett. (1988) 18:149–54. doi: 10.1016/0165-2478(88)90056-9
49. Paterson DJ, Jefferies WA, Green JR, Brandon MR, Corthesy P, Puklavec M, et al. Antigens of activated rat T lymphocytes including a molecule of 50,000 Mr detected only on CD4 positive T blasts. Mol Immunol. (1987) 24:1281–90. doi: 10.1016/0161-5890(87)90122-2
50. Li J, Xia N, Li D, Wen S, Qian S, Lu Y, et al. Aorta regulatory T cells with a tissue-specific phenotype and function promote tissue repair through Tff1 in abdominal aortic aneurysms. Adv Sci (Weinh). (2022) 9:e2104338. doi: 10.1002/advs.202104338
51. Shime H, Odanaka M, Tsuiji M, Matoba T, Imai M, Yasumizu Y, et al. Proenkephalin(+) regulatory T cells expanded by ultraviolet B exposure maintain skin homeostasis with a healing function. Proc Natl Acad Sci USA. (2020) 117:20696–705. doi: 10.1073/pnas.2000372117
52. Zaiss DM, van Loosdregt J, Gorlani A, Bekker CP, Grone A, Sibilia M, et al. Amphiregulin enhances regulatory T cell-suppressive function via the epidermal growth factor receptor. Immunity. (2013) 38:275–84. doi: 10.1016/j.immuni.2012.09.023
53. Capranico G, Tinelli S, Austin CA, Fisher ML, Zunino F. Different patterns of gene expression of topoisomerase II isoforms in differentiated tissues during murine development. Biochim Biophys Acta. (1992) 1132:43–8. doi: 10.1016/0167-4781(92)90050-A
54. Rubin CI, Atweh GF. The role of stathmin in the regulation of the cell cycle. J Cell Biochem. (2004) 93:242–50. doi: 10.1002/jcb.20187
55. Gerdes J, Schwab U, Lemke H, Stein H. Production of a mouse monoclonal antibody reactive with a human nuclear antigen associated with cell proliferation. Int J Cancer. (1983) 31:13–20. doi: 10.1002/ijc.2910310104
56. Wright JF, Guo Y, Quazi A, Luxenberg DP, Bennett F, Ross JF, et al. Identification of an interleukin 17F/17A heterodimer in activated human CD4+ T cells. J Biol Chem. (2007) 282:13447–55. doi: 10.1074/jbc.M700499200
57. Yao Z, Fanslow WC, Seldin MF, Rousseau AM, Painter SL, Comeau MR, et al. Herpesvirus Saimiri encodes a new cytokine, IL-17, which binds to a novel cytokine receptor. Immunity. (1995) 3:811–21. doi: 10.1016/1074-7613(95)90070-5
58. Shi Y, Ullrich SJ, Zhang J, Connolly K, Grzegorzewski KJ, Barber MC, et al. A novel cytokine receptor-ligand pair. Identification, molecular characterization, and in vivo immunomodulatory activity. J Biol Chem. (2000) 275:19167–76. doi: 10.1074/jbc.M910228199
59. Lee J, Ho WH, Maruoka M, Corpuz RT, Baldwin DT, Foster JS, et al. IL-17E, a novel proinflammatory ligand for the IL-17 receptor homolog IL-17Rh1. J Biol Chem. (2001) 276:1660–4. doi: 10.1074/jbc.M008289200
60. Rong Z, Wang A, Li Z, Ren Y, Cheng L, Li Y, et al. IL-17RD (Sef or IL-17RLM) interacts with IL-17 receptor and mediates IL-17 signaling. Cell Res. (2009) 19:208–15. doi: 10.1038/cr.2008.320
61. Su Y, Huang J, Zhao X, Lu H, Wang W, Yang XO, et al. Interleukin-17 receptor D constitutes an alternative receptor for interleukin-17A important in psoriasis-like skin inflammation. Sci Immunol. (2019) 4(36):eaau9657. doi: 10.1126/sciimmunol.aau9657
62. Howie D, Cobbold SP, Adams E, Ten Bokum A, Necula AS, Zhang W, et al. Foxp3 drives oxidative phosphorylation and protection from lipotoxicity. JCI Insight. (2017) 2:e89160. doi: 10.1172/jci.insight.89160
63. Angelin A, Gil-de-Gomez L, Dahiya S, Jiao J, Guo L, Levine MH, et al. Foxp3 reprograms T cell metabolism to function in low-glucose, high-lactate environments. Cell Metab. (2017) 25:1282–93 e7. doi: 10.1016/j.cmet.2016.12.018
64. Koizumi SI, Sasaki D, Hsieh TH, Taira N, Arakaki N, Yamasaki S, et al. JunB regulates homeostasis and suppressive functions of effector regulatory T cells. Nat Commun. (2018) 9:5344. doi: 10.1038/s41467-018-07735-4
65. Angkasekwinai P, Park H, Wang YH, Wang YH, Chang SH, Corry DB, et al. Interleukin 25 promotes the initiation of proallergic type 2 responses. J Exp Med. (2007) 204:1509–17. doi: 10.1084/jem.20061675
66. Chaudhry A, Rudra D, Treuting P, Samstein RM, Liang Y, Kas A, et al. CD4+ regulatory T cells control TH17 responses in a Stat3-dependent manner. Science. (2009) 326:986–91. doi: 10.1126/science.1172702
67. Gu FM, Li QL, Gao Q, Jiang JH, Zhu K, Huang XY, et al. IL-17 induces AKT-dependent IL-6/JAK2/STAT3 activation and tumor progression in hepatocellular carcinoma. Mol Cancer. (2011) 10:150. doi: 10.1186/1476-4598-10-150
68. Adler HS, Kubsch S, Graulich E, Ludwig S, Knop J, Steinbrink K. Activation of MAP kinase p38 is critical for the cell-cycle-controlled suppressor function of regulatory T cells. Blood. (2007) 109:4351–9. doi: 10.1182/blood-2006-09-047563
69. Hata K, Andoh A, Shimada M, Fujino S, Bamba S, Araki Y, et al. IL-17 stimulates inflammatory responses via NF-kappaB and MAP kinase pathways in human colonic myofibroblasts. Am J Physiol Gastrointest Liver Physiol. (2002) 282:G1035–44. doi: 10.1152/ajpgi.00494.2001
70. Kwon BS, Weissman SM. cDNA sequences of two inducible T-cell genes. Proc Natl Acad Sci U S A. (1989) 86:1963–7. doi: 10.1073/pnas.86.6.1963
71. Vinay DS, Kwon BS. 4-1BB (CD137), an inducible costimulatory receptor, as a specific target for cancer therapy. BMB Rep. (2014) 47:122–9. doi: 10.5483/BMBRep.2014.47.3.283
72. Calderhead DM, Buhlmann JE, van den Eertwegh AJ, Claassen E, Noelle RJ, Fell HP. Cloning of mouse Ox40: a T cell activation marker that may mediate T-B cell interactions. J Immunol. (1993) 151:5261–71. doi: 10.4049/jimmunol.151.10.5261
73. Mallett S, Fossum S, Barclay AN. Characterization of the MRC OX40 antigen of activated CD4 positive T lymphocytes–a molecule related to nerve growth factor receptor. EMBO J. (1990) 9:1063–8. doi: 10.1002/j.1460-2075.1990.tb08211.x
74. Nocentini G, Giunchi L, Ronchetti S, Krausz LT, Bartoli A, Moraca R, et al. A new member of the tumor necrosis factor/nerve growth factor receptor family inhibits T cell receptor-induced apoptosis. Proc Natl Acad Sci USA. (1997) 94:6216–21. doi: 10.1073/pnas.94.12.6216
75. Berlin C, Berg EL, Briskin MJ, Andrew DP, Kilshaw PJ, Holzmann B, et al. Alpha 4 beta 7 integrin mediates lymphocyte binding to the mucosal vascular addressin MAdCAM-1. Cell. (1993) 74:185–95. doi: 10.1016/0092-8674(93)90305-A
76. Wagner N, Lohler J, Kunkel EJ, Ley K, Leung E, Krissansen G, et al. Critical role for beta7 integrins in formation of the gut-associated lymphoid tissue. Nature. (1996) 382:366–70. doi: 10.1038/382366a0
77. Vences-Catalan F, Rajapaksa R, Srivastava MK, Marabelle A, Kuo CC, Levy R, et al. Tetraspanin CD81 promotes tumor growth and metastasis by modulating the functions of T regulatory and myeloid-derived suppressor cells. Cancer Res. (2015) 75:4517–26. doi: 10.1158/0008-5472.CAN-15-1021
78. Sekiya T, Kashiwagi I, Yoshida R, Fukaya T, Morita R, Kimura A, et al. Nr4a receptors are essential for thymic regulatory T cell development and immune homeostasis. Nat Immunol. (2013) 14:230–7. doi: 10.1038/ni.2520
79. Wing K, Onishi Y, Prieto-Martin P, Yamaguchi T, Miyara M, Fehervari Z, et al. CTLA-4 control over Foxp3+ regulatory T cell function. Science. (2008) 322:271–5. doi: 10.1126/science.1160062
80. Cao X, Cai SF, Fehniger TA, Song J, Collins LI, Piwnica-Worms DR, et al. Granzyme B and perforin are important for regulatory T cell-mediated suppression of tumor clearance. Immunity. (2007) 27:635–46. doi: 10.1016/j.immuni.2007.08.014
81. Kim HJ, Barnitz RA, Kreslavsky T, Brown FD, Moffett H, Lemieux ME, et al. Stable inhibitory activity of regulatory T cells requires the transcription factor Helios. Science. (2015) 350:334–9. doi: 10.1126/science.aad0616
82. Ono M, Shimizu J, Miyachi Y, Sakaguchi S. Control of autoimmune myocarditis and multiorgan inflammation by glucocorticoid-induced TNF receptor family-related protein(high), Foxp3-expressing CD25+ and CD25- regulatory T cells. J Immunol. (2006) 176:4748–56. doi: 10.4049/jimmunol.176.8.4748
83. Oliveira-Dos-Santos AJ, Matsumoto G, Snow BE, Bai D, Houston FP, Whishaw IQ, et al. Regulation of T cell activation, anxiety, and male aggression by RGS2. Proc Natl Acad Sci USA. (2000) 97:12272–7. doi: 10.1073/pnas.220414397
84. Lu B, Ferrandino AF, Flavell RA. Gadd45beta is important for perpetuating cognate and inflammatory signals in T cells. Nat Immunol. (2004) 5:38–44. doi: 10.1038/ni1020
85. Fassett MS, Jiang W, D'Alise AM, Mathis D, Benoist C. Nuclear receptor Nr4a1 modulates both regulatory T-cell (Treg) differentiation and clonal deletion. Proc Natl Acad Sci USA. (2012) 109:3891–6. doi: 10.1073/pnas.1200090109
86. Miragaia RJ, Gomes T, Chomka A, Jardine L, Riedel A, Hegazy AN, et al. Single-cell transcriptomics of regulatory T cells reveals trajectories of tissue adaptation. Immunity. (2019) 50:493–504.e7. doi: 10.1016/j.immuni.2019.01.001
87. Bodor J, Fehervari Z, Diamond B, Sakaguchi S. ICER/CREM-mediated transcriptional attenuation of IL-2 and its role in suppression by regulatory T cells. Eur J Immunol. (2007) 37:884–95. doi: 10.1002/eji.200636510
88. Godefroy E, Alameddine J, Montassier E, Mathe J, Desfrancois-Noel J, Marec N, et al. Expression of CCR6 and CXCR6 by gut-derived CD4(+)/CD8alpha(+) T-regulatory cells, which are decreased in blood samples from patients with inflammatory bowel diseases. Gastroenterology. (2018) 155:1205–17. doi: 10.1053/j.gastro.2018.06.078
89. Liu S, Zhou B, Wu L, Sun Y, Chen J, Liu S. Single-cell differential splicing analysis reveals high heterogeneity of liver tumor-infiltrating T cells. Sci Rep. (2021) 11:5325. doi: 10.1038/s41598-021-84693-w
90. Haque A, Engel J, Teichmann SA, Lonnberg T. A practical guide to single-cell RNA-sequencing for biomedical research and clinical applications. Genome Med. (2017) 9:75. doi: 10.1186/s13073-017-0467-4
91. Marasco LE, Kornblihtt AR. The physiology of alternative splicing. Nat Rev Mol Cell Biol. (2023) 24:242–54. doi: 10.1038/s41580-022-00545-z
92. Katsuyama T, Moulton VR. Splicing factor SRSF1 is indispensable for regulatory T cell homeostasis and function. Cell Rep. (2021) 36:109339. doi: 10.1016/j.celrep.2021.109339
93. Wang Z, Qi Y, Feng Y, Xu H, Wang J, Zhang L, et al. The N6-methyladenosine writer WTAP contributes to the induction of immune tolerance post kidney transplantation by targeting regulatory T cells. Lab Invest. (2022) 102:1268–79. doi: 10.1038/s41374-022-00811-w
94. Ding R, Yu X, Hu Z, Dong Y, Huang H, Zhang Y, et al. Lactate modulates RNA splicing to promote CTLA-4 expression in tumor-infiltrating regulatory T cells. Immunity. (2024) 57(3):528–40.e6. doi: 10.1016/j.immuni.2024.01.019
95. Erdman SE, Sohn JJ, Rao VP, Nambiar PR, Ge Z, Fox JG, et al. CD4+CD25+ regulatory lymphocytes induce regression of intestinal tumors in ApcMin/+ mice. Cancer Res. (2005) 65:3998–4004. doi: 10.1158/0008-5472.CAN-04-3104
96. Gounaris E, Blatner NR, Dennis K, Magnusson F, Gurish MF, Strom TB, et al. T-regulatory cells shift from a protective anti-inflammatory to a cancer-promoting proinflammatory phenotype in polyposis. Cancer Res. (2009) 69:5490–7. doi: 10.1158/0008-5472.CAN-09-0304
97. Erdman SE, Poutahidis T, Tomczak M, Rogers AB, Cormier K, Plank B, et al. CD4+ CD25+ regulatory T lymphocytes inhibit microbially induced colon cancer in Rag2-deficient mice. Am J Pathol. (2003) 162:691–702. doi: 10.1016/S0002-9440(10)63863-1
98. Erdman SE, Rao VP, Poutahidis T, Ihrig MM, Ge Z, Feng Y, et al. CD4(+)CD25(+) regulatory lymphocytes require interleukin 10 to interrupt colon carcinogenesis in mice. Cancer Res. (2003) 63:6042–50.
99. Sato E, Olson SH, Ahn J, Bundy B, Nishikawa H, Qian F, et al. Intraepithelial CD8+ tumor-infiltrating lymphocytes and a high CD8+/regulatory T cell ratio are associated with favorable prognosis in ovarian cancer. Proc Natl Acad Sci USA. (2005) 102:18538–43. doi: 10.1073/pnas.0509182102
100. Gao Q, Qiu SJ, Fan J, Zhou J, Wang XY, Xiao YS, et al. Intratumoral balance of regulatory and cytotoxic T cells is associated with prognosis of hepatocellular carcinoma after resection. J Clin Oncol. (2007) 25:2586–93. doi: 10.1200/JCO.2006.09.4565
101. Fu J, Xu D, Liu Z, Shi M, Zhao P, Fu B, et al. Increased regulatory T cells correlate with CD8 T-cell impairment and poor survival in hepatocellular carcinoma patients. Gastroenterology. (2007) 132:2328–39. doi: 10.1053/j.gastro.2007.03.102
102. Gobert M, Treilleux I, Bendriss-Vermare N, Bachelot T, Goddard-Leon S, Arfi V, et al. Regulatory T cells recruited through CCL22/CCR4 are selectively activated in lymphoid infiltrates surrounding primary breast tumors and lead to an adverse clinical outcome. Cancer Res. (2009) 69:2000–9. doi: 10.1158/0008-5472.CAN-08-2360
103. Bates GJ, Fox SB, Han C, Leek RD, Garcia JF, Harris AL, et al. Quantification of regulatory T cells enables the identification of high-risk breast cancer patients and those at risk of late relapse. J Clin Oncol. (2006) 24:5373–80. doi: 10.1200/JCO.2006.05.9584
104. Curiel TJ, Coukos G, Zou L, Alvarez X, Cheng P, Mottram P, et al. Specific recruitment of regulatory T cells in ovarian carcinoma fosters immune privilege and predicts reduced survival. Nat Med. (2004) 10:942–9. doi: 10.1038/nm1093
105. Sander FE, Nilsson M, Rydstrom A, Aurelius J, Riise RE, Movitz C, et al. Role of regulatory T cells in acute myeloid leukemia patients undergoing relapse-preventive immunotherapy. Cancer Immunol Immunother. (2017) 66:1473–84. doi: 10.1007/s00262-017-2040-9
106. Niedzwiecki M, Budzilo O, Zielinski M, Adamkiewicz-Drozynska E, Maciejka-Kemblowska L, Szczepanski T, et al. CD4(+)CD25(high)CD127(low/-)FoxP(3)(+) regulatory T cell subpopulations in the bone marrow and peripheral blood of children with ALL: brief report. J Immunol Res. (2018) 2018:1292404. doi: 10.1155/2018/1292404
107. Maharaj K, Uriepero A, Sahakian E, Pinilla-Ibarz J. Regulatory T cells (Tregs) in lymphoid Malignancies and the impact of novel therapies. Front Immunol. (2022) 13:943354. doi: 10.3389/fimmu.2022.943354
108. Li Q, Lu J, Li J, Zhang B, Wu Y, Ying T. Antibody-based cancer immunotherapy by targeting regulatory T cells. Front Oncol. (2023) 13:1157345. doi: 10.3389/fonc.2023.1157345
109. Qiu R, Zhou L, Ma Y, Zhou L, Liang T, Shi L, et al. Regulatory T cell plasticity and stability and autoimmune diseases. Clin Rev Allergy Immunol. (2020) 58:52–70. doi: 10.1007/s12016-018-8721-0
110. Wohlfert EA, Grainger JR, Bouladoux N, Konkel JE, Oldenhove G, Ribeiro CH, et al. GATA3 controls Foxp3(+) regulatory T cell fate during inflammation in mice. J Clin Invest. (2011) 121:4503–15. doi: 10.1172/JCI57456
111. Downs-Canner S, Berkey S, Delgoffe GM, Edwards RP, Curiel T, Odunsi K, et al. Suppressive IL-17A(+)Foxp3(+) and ex-Th17 IL-17A(neg)Foxp3(+) T(reg) cells are a source of tumour-associated T(reg) cells. Nat Commun. (2017) 8:14649. doi: 10.1038/ncomms14649
112. Voo KS, Wang YH, Santori FR, Boggiano C, Wang YH, Arima K, et al. Identification of IL-17-producing FOXP3+ regulatory T cells in humans. Proc Natl Acad Sci U S A. (2009) 106:4793–8. doi: 10.1073/pnas.0900408106
113. Bhaskaran N, Cohen S, Zhang Y, Weinberg A, Pandiyan P. TLR-2 signaling promotes IL-17A production in CD4+CD25+Foxp3+ Regulatory cells during oropharyngeal candidiasis. Pathogens. (2015) 4:90–110. doi: 10.3390/pathogens4010090
Keywords: interleukin-17, regulatory T cells, colorectal cancer, RNA splicing, inflammation
Citation: Theune WC, Chen J, Theune EV, Ye X, Ménoret A, Vella AT and Wang K (2024) Interleukin-17 directly stimulates tumor infiltrating Tregs to prevent cancer development. Front. Immunol. 15:1408710. doi: 10.3389/fimmu.2024.1408710
Received: 28 March 2024; Accepted: 27 May 2024;
Published: 14 June 2024.
Edited by:
Athanasia Mouzaki, University of Patras, GreeceReviewed by:
Maciej Zieliński, Medical University of Gdańsk, PolandCopyright © 2024 Theune, Chen, Theune, Ye, Ménoret, Vella and Wang. This is an open-access article distributed under the terms of the Creative Commons Attribution License (CC BY). The use, distribution or reproduction in other forums is permitted, provided the original author(s) and the copyright owner(s) are credited and that the original publication in this journal is cited, in accordance with accepted academic practice. No use, distribution or reproduction is permitted which does not comply with these terms.
*Correspondence: Kepeng Wang, a2V3YW5nQHVjaGMuZWR1
†These authors have contributed equally to this work
Disclaimer: All claims expressed in this article are solely those of the authors and do not necessarily represent those of their affiliated organizations, or those of the publisher, the editors and the reviewers. Any product that may be evaluated in this article or claim that may be made by its manufacturer is not guaranteed or endorsed by the publisher.
Research integrity at Frontiers
Learn more about the work of our research integrity team to safeguard the quality of each article we publish.