 Tanya Georgieva‡
 Jolien Diddens†‡
 Verena Friedrich†Gildas LepennetierRosa Margareta Brand
 Klaus Lehmann-Horn*
- Department of Neurology, TUM School of Medicine and Health, Technical University of Munich, Munich, Germany
Background and objectives: B cell depleting anti-CD20 monoclonal antibodies (aCD20 mAbs) are highly effective in treatment of multiple sclerosis (MS) but fail to halt the formation of meningeal ectopic lymphoid tissue (mELT) in the murine model experimental autoimmune encephalomyelitis (EAE). While mELT can be examined in EAE, it is not accessible in vivo in MS patients. Our key objectives were to compare the immune cells in cerebrospinal fluid (CSF), which is accessible in patients, with those in mELT, and to study the effects of aCD20 mAbs on CSF and mELT in EAE.
Methods: Applying single cell RNA sequencing, we compared gene expression profiles in immune cells from (1) CSF with mELT and (2) aCD20 mAbs treated with control treated mice in a spontaneous 2D2xTh EAE model.
Results: The immune cell composition in CSF and mELT was very similar. Gene expression profiles and pathway enrichment analysis revealed no striking differences between the two compartments. aCD20 mAbs led not only to a virtually complete depletion of B cells in the CSF but also to a reduction of naïve CD4+ T cells and marked increase of macrophages. No remarkable differences in regulated genes or pathways were observed.
Discussion: Our results suggest that immune cells in the CSF may serve as a surrogate for mELT in EAE. Future studies are required to confirm this in MS patients. The observed increase of macrophages in B cell depleted CSF is a novel finding and requires verification in CSF of aCD20 mAbs treated MS patients. Due to unresolved technical challenges, we were unable to study the effects of aCD20 mAbs on mELT. This should be addressed in future studies.
Introduction
Anti-CD20 monoclonal antibodies (aCD20 mAbs), depleting B cells, are very efficient in treatment of relapsing-remitting forms of multiple sclerosis (MS) (1, 2). Studies have also shown moderate beneficial effects in treatment of progressive MS (PMS), particularly in progression independent of relapse activity (PIRA) in early relapsing-remitting MS and in active primary PMS (3, 4). B cell-rich inflammatory cellular infiltrates in the meninges have been observed in patients with MS and in its murine model, experimental autoimmune encephalomyelitis (EAE). We designated these structures as meningeal ectopic lymphoid tissue (mELT). The presence of mELT in MS patients correlates with an earlier disease onset, a more rapid disease progression, and subpial cortical damage (5–10). mELT resembles secondary lymphoid organs (SLO) (11) to varying degrees and previous studies suggest that it may have similar functions, particularly germinal center activity (12–14). Interestingly, the B cells compartments in peripheral blood and CSF of MS patients are clonally related and exchange across the blood brain barrier (BBB) (15).
Based on the paradigm that 1) mELT contributes to progression in MS by facilitating smoldering inflammation in the central nervous system (CNS) behind the BBB and 2) assuming that B cells are an integral and pivotal component of mELT, we investigated the effects of aCD20 mAbs on mELT in a previous study (16). Applying murine aCD20 mAbs in a spontaneous chronic EAE model that has myelin oligodendrocyte glycoprotein (MOG) specific B and T cells (2D2/TCRMOG × Th/IgHMOG mice) and features mELT in the spinal cord (17, 18), we could confirm previous findings that aCD20 mAbs do not alter the disease course in this particular model (19). One possible explanation for this is, that large amounts of MOG-binding antibodies, which are present even after sustained B cell depletion, in collaboration with TCRMOG 2D2 T cells, are sufficient to induce and maintain EAE. Like in a case in which rituximab depleted B cells from cerebral perivascular spaces (20), we could demonstrate in our previous study that aCD20 mAbs depleted virtually all B cells from the meningeal compartment in EAE. The surprising finding, however, was that mELT forms anyway, despite the absence of B cells to a comparable extent (16). This raises important questions regarding the function of mELT in CNS autoimmunity and whether mELT even without B cells may have a role in MS. If mELT devoid of B cells still contributes to EAE pathogenesis, this may provide an alternative explanation why B cell depleted EAE mice develop EAE like B cell competent control animals and, potentially, why we observe disease progression in MS patients treated with aCD20 mAbs. Thus, a primary objective of this study was to address potential differences and common features of mELT with or without B cells. To address this question, the 2D2xTh EAE model is suitable, even though it does not respond to B cell depletion clinically.
Studying mELT functionally relies predominantly on experimental models. Extracting or otherwise accessing mELT in MS patients is challenging and can be reasonably achieved only in post-mortem tissue. Since cerebrospinal fluid (CSF) is in a spatial relationship with the meningeal compartment and can be readily and routinely obtained in patients, the second objective was to examine similarities and differences between the mELT and CSF compartments in respect to their immune cell composition and phenotype.
In the present study, we applied single cell RNA sequencing to investigate how B cell depletion by aCD20 mAb changes the cellular composition and immune cell phenotypes in mELT and CSF. We here fore used the same murine EAE model introduced above. We compared the immune cell composition in mELT and CSF in B cell competent conditions. Due to technical challenges, which precluded us from obtaining sufficient data from one experimental condition, the aCD20 mAb-treated mELT compartment, we could only approach our primary objective indirectly. After confirming that the immune profile of CSF and mELT in B cell competent mice was quite similar, we used the CSF compartment as a surrogate for mELT when examining the effects of aCD20 mAbs on the meningeal compartment. Our study revealed that the cellular composition and gene expression profiles of mELT and CSF are very similar. aCD20 mAbs efficiently depleted CSF B cells and concomitantly led to a reduction of naïve CD4+ T cells and increase of macrophages.
Materials and methods
2D2×Th mice
2D2xTh EAE mice – which develop spontaneous chronic EAE and meningeal inflammatory lesions in the spinal cord - were generated, held and clinically assessed as previously described (16–18). All animal procedures were approved by the standing committee for experimentation with laboratory animals of the administration of Upper Bavaria (ROB-55.2-2532.Vet_02-16-100).
Anti-CD20 treatment and B cell depletion
Six mice were initially used in the current experiment. Mice were randomly assigned to either the treatment or control group. The treatment was initiated when a mouse reached an EAE score ≥ 3 and was conducted as previously described (16). In brief, B cell depletion was achieved by weekly injection of 100 μg murine aCD20 mAbs (clone 18B12, provided by Roche). In vivo grade mouse IgG2a kappa isotype control (Crown bio, Cat: C0006) was used in the control group. One mouse from the treated group was excluded from further analysis due to insufficient effect of the aCD20 treatment. Figure 1A shows the experimental design. Table 1 lists the clinical characteristics of the 5 mice included in the final analyses and Figure 1B their clinical disease course.
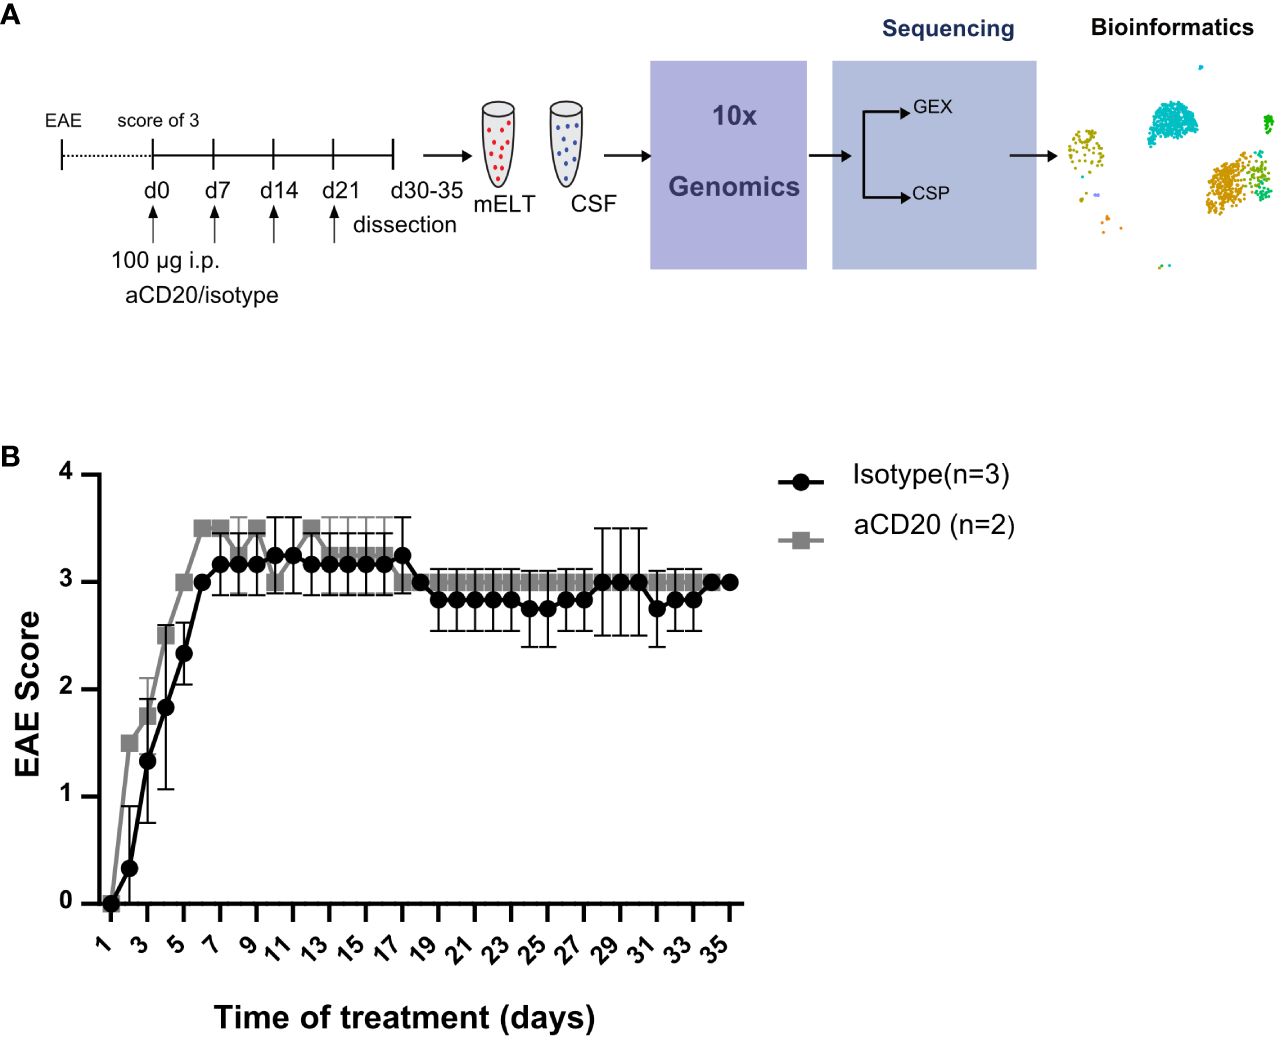
Figure 1 Study design and EAE score. (A) Mice were treated with a weekly dose of 100 μg of aCD20 mAb (n = 2) or isotype control (n = 3). On day 30-35, mice were dissected, and cell surface protein (CSP) and gene expression (GEX) libraries prepared and sequenced using 10x Genomics technology before bioinformatics analyses. (B) Daily evaluated EAE scores over the experimental period. Error bars show +/- SEM for the control group only.
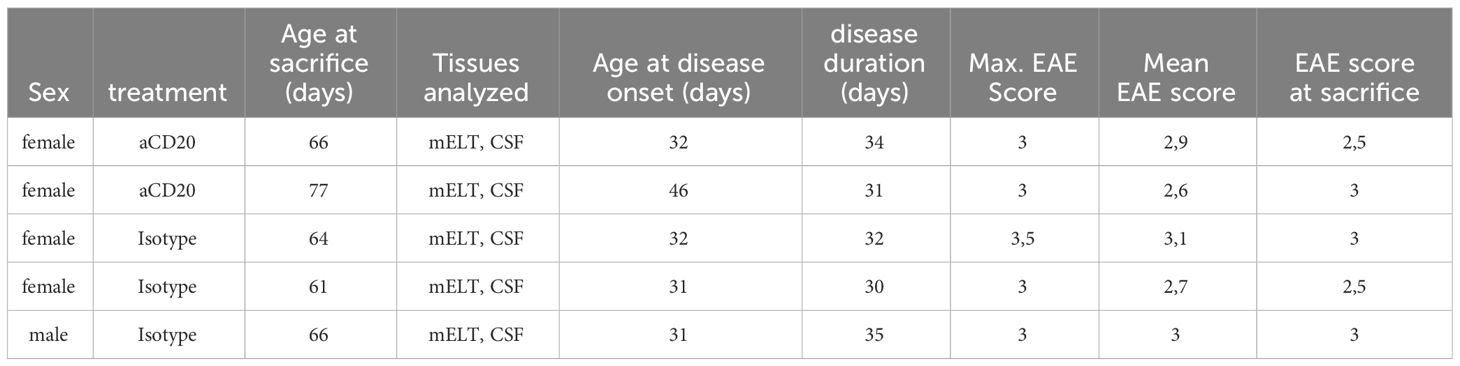
Table 1 Characteristics of all mice utilized in the experiment.
Sample collection and single-cell preparation
Mice from both groups were sacrificed 30-35 days after the first injection. Animals were first anesthetized, after which CSF was obtained by puncture of the cisterna magna and stored on ice. Subsequently mice were sacrificed. After thorough perfusion with ice cold PBS, the spinal cord was dissected. A small test piece was cut from the thoracolumbar part of the spinal cord, which was used to histologically confirm the presence of mELT. Meninges were gently separated from the spinal cord in a petri dish with PBS and, using fine forceps, cut into small pieces under a dissection microscope. Subsequently meninges were digested in 600 µl digestion mix consisting of 4µl DNase, 60µl Collagenase IV and 536µl RPMI Medium for 30 minutes at 37°C on a shaker. Cells were isolated from the digested meninges by passing through 30 µl cell strainers, and washed. Cells from meninges and CSF were finally centrifuged (450xg, 5 min, 4 degrees) and resuspended in 100 µl FACS Buffer.
A brief incubation (10 min, 4°C) with Fc Block reagent was performed to block nonspecific antibody binding. Next, samples were labelled with DNA barcoded TotalSeq antibodies against mouse CD4, CD8a, CD19, Ly6G, and NK1.1, as previously described (11). At the same time, samples were incubated with 2 different TotalSeq Hashtag antibodies, in order to allow pooling samples per two: CSF und meningeal cells were incubated (20 minutes at 4° in the dark) with TotalSeq-C 0301 anti-mouse #1 (clone M1/42; 30-F11, Biolegend, dilution 1:400 in FACS buffer) and TotalSeq anti-mouse 0302 #2 (clone M1/42;30-F11, Biolegend, dilution 1:400 in FACS buffer), respectively. The incubation was followed by 3 wash steps with FACS Buffer and cell counting (Cellometer Auto 2000, Nexcelom Bioscience). Ultimately, the cell concentration was adjusted to 1x10³ cells/µl in RPMI/10% FCS, and CSF and meningeal cells were pooled together in a 1:4 ratio per mouse.
Library preparation and sequencing
Cells were loaded onto 10x Genomics Chromium Next GEM Chip G and the Chromium Controller was run according to the manufacturer’s instructions (10x Genomics, USA) with a targeted cell recovery of 10,000 cells. Library preparation of Cell Surface Protein Library (CSP Library) and Gene Expression Library (GEX Library) was performed using Chromium Next GEM Single Cell V(D)J Reagent Kits v1.1, following the 10x Genomics protocol CG000208. The quality of library preparation was assessed using the Agilent 2100 Bioanalyzer.
Library quantification and single cell RNA-seq
Real-Time PCR was performed to quantify the libraries. All single cell gene expression, BCR and cell surface protein (CSP) libraries were multiplexed and sequenced using Illumina NovaSeq 6000 (S2 Flow cell), to obtain 26 x 91 bp paired-end reads for gene expression, cell surface protein and BCR libraries, taking into account the differences in read depth requirements. Novaseq sequencing was performed at the Helmholtz Zentrum München (HMGU) by the Genomics Core Facility.
Bioinformatical analysis
Single cell data processing and batch correction
Data processing and batch correction were done on all 5 samples as described before (11). In order to exclude dead/dying cells and reduce potential doublets, we kept only cells with >200 and <2,000 genes, >100 and <10,000 read count, <5% of reads mapping to mitochondrial genes and hemoglobin genes. 33.9% of the cells were removed by this quality filtering to obtain 17,226 cells at the end.
Cluster annotation
Gene markers for each cluster were defined using FindAllMarkers function (Seurat R library) (v 4.0.0). Each cluster was annotated automatically using CIPR (version 0.1.0) based on the “immgen” database. In order to confirm cluster annotation and, detect specific cell types that did not exist in the database, we used Nebulosa (version 1.0.0) to display gene expression density for several gene markers. Plasma cells could not be detected by the annotation of the clusters using CIPR, we therefore used the Sdc1 and Tnfrsf17 gene markers to annotate those cells. Glial cells and CD8+ T cells were annotated using the same approach using the Slc1a2 gene and Cd8a gene respectively. After extracting the gene markers for each cluster and inspecting them visually, we decided to name the “Pre-T cell” group “T cell”, as it fits better the biological reality.
Cell surface protein data processing and doublet filtering
TotalSeq antibody barcodes were processed in 2 separate assays: one for the tissue of origin and one for the cell type. We used the centred log-ratio (CLR) normalization method, then the HTODemux function (Seurat) was used to label each cell. Unfortunately, hashtag oligo (HTO), indicating the tissue of origin, for mELT had a relatively lower expression and yielded only 5% of the total cells, as compared to 31% cells labeled as CSF. In addition, 54% of the cells were HTO-negative. To improve the yield and differentiate between tissues, we used a 1.5-fold difference in HTO expression per cell. This approach allowed us to rescue mELT cells not labeled because of the low expression of the mELT tag compared to the CSF tag. Using this approach, we could label 44% of cells as CSF origin and 33% as mELT (77% HTO-positive), with 23% still unknown (HTO-negative) for a total of 17,226 cells. The HTO-negative cells were removed.
The cell type specific CSP antibody barcodes defined by HTODemux yielded 3% CD19, 17% CD4, 2% CD8a, 2% Ly6G, 2% NK, 60% unknown (putative doublet) and 14% negative cells. We did not filter out these putative doublets, because of the low confidence in the CSP-data, instead we used the DoubletFinder R package (v2.0.3) to identify doublets that were not filtered in the previous steps based on the gene expression.
We used the CSP information to remove cells that were confidently labelled as one cell type but clustering with a different cell cluster (Example: cells tagged with the antibody for NK cells but found in the B cell cluster). In addition, we also used the BCR-sequencing information to remove cells having B cell information but not in the plasma cell or B cell cluster. Contaminating glia cells, oligodendrocytes and erythroid cells were removed. The remaining 9,585 cells, annotated in 11 cell types, were used for the differential gene expression analysis, that was performed when a condition had at least 50 cells.
Differential gene expression
Differential gene expression was analyzed as described before (11). Clusters comprising fewer than 50 cells were excluded from the analysis. Significant genes (adjusted p-value <0.05) were ranked based on their average log2FC values. The genes mentioned in the text are the 10 most upregulated and 10 most downregulated genes in both comparisons (CSF aCD20 vs CSF isotype and mELT isotype vs CSF isotype).
Pathway enrichment analysis
Using the web-based analytical resource Metascape, we identified significant differences in biological pathways between mELT and CSF, as well as between aCD20-treated and untreated mice (21). We utilized the December 18, 2021 version of Metascape and employed mouse data as input, which was analyzed as if it were human data. The following pathway types were chosen for analysis: GO-Biological processes, WikiPathways, Reactome, and KEGG Pathways. Enrichment analysis was conducted against a custom background gene list, containing all genes considered in the differential gene expression analysis. Pathways with an adjusted p-value <0.001 were considered. Ribosomal genes were excluded from the analysis.
Results
Immune cells in CSF and mELT form 11 clusters
We aimed to examine and compare the immune cell composition of CSF and mELT. Furthermore, we aimed to analyze the cellular differences in these tissues between the aCD20 treated (B cell depleted) and the control treated (B cell competent) mice. After filtering out low quality cells and corrections using “harmony” library, we obtained the transcriptome from a total of 9,585 single cells: 5,445 cells from mELT and 4,140 cells from CSF. We performed clustering and, in this way, classified the cells into 11 final cell clusters (Figure 2). Based on a combination of automatic cluster annotation (CIPR version 0.1.0, “immgen” database) and marker gene expression (see Methods section), we identified the following 11 cell types: T cells (Cd3e), more specifically naïve CD4+ T cells (Cd4, Ccr7, Sell), activated CD4+ T cells (Cd4, Rora, Pdcd1, Il2), CD8+ T cells (Cd8a), and regulatory T cells (Foxp3), B cells (Cd79a, Cd19) and plasma cells (Sdc1, Tnfrsf17), a cluster containing natural killer (NK) cells and NKT cells (Klrb1c, Klrk1), myeloid lineage cells, separated into dendritic cells (DC) (Flt3), macrophages (Cd68, Adgre1), monocytes (Cd68), and granulocytes (S100a8 and S100a9). Erythroid cells (Hbb-bt) and oligodendrocytes (Olig1), probably coming from blood or CNS contamination respectively, were not considered in further analyses.
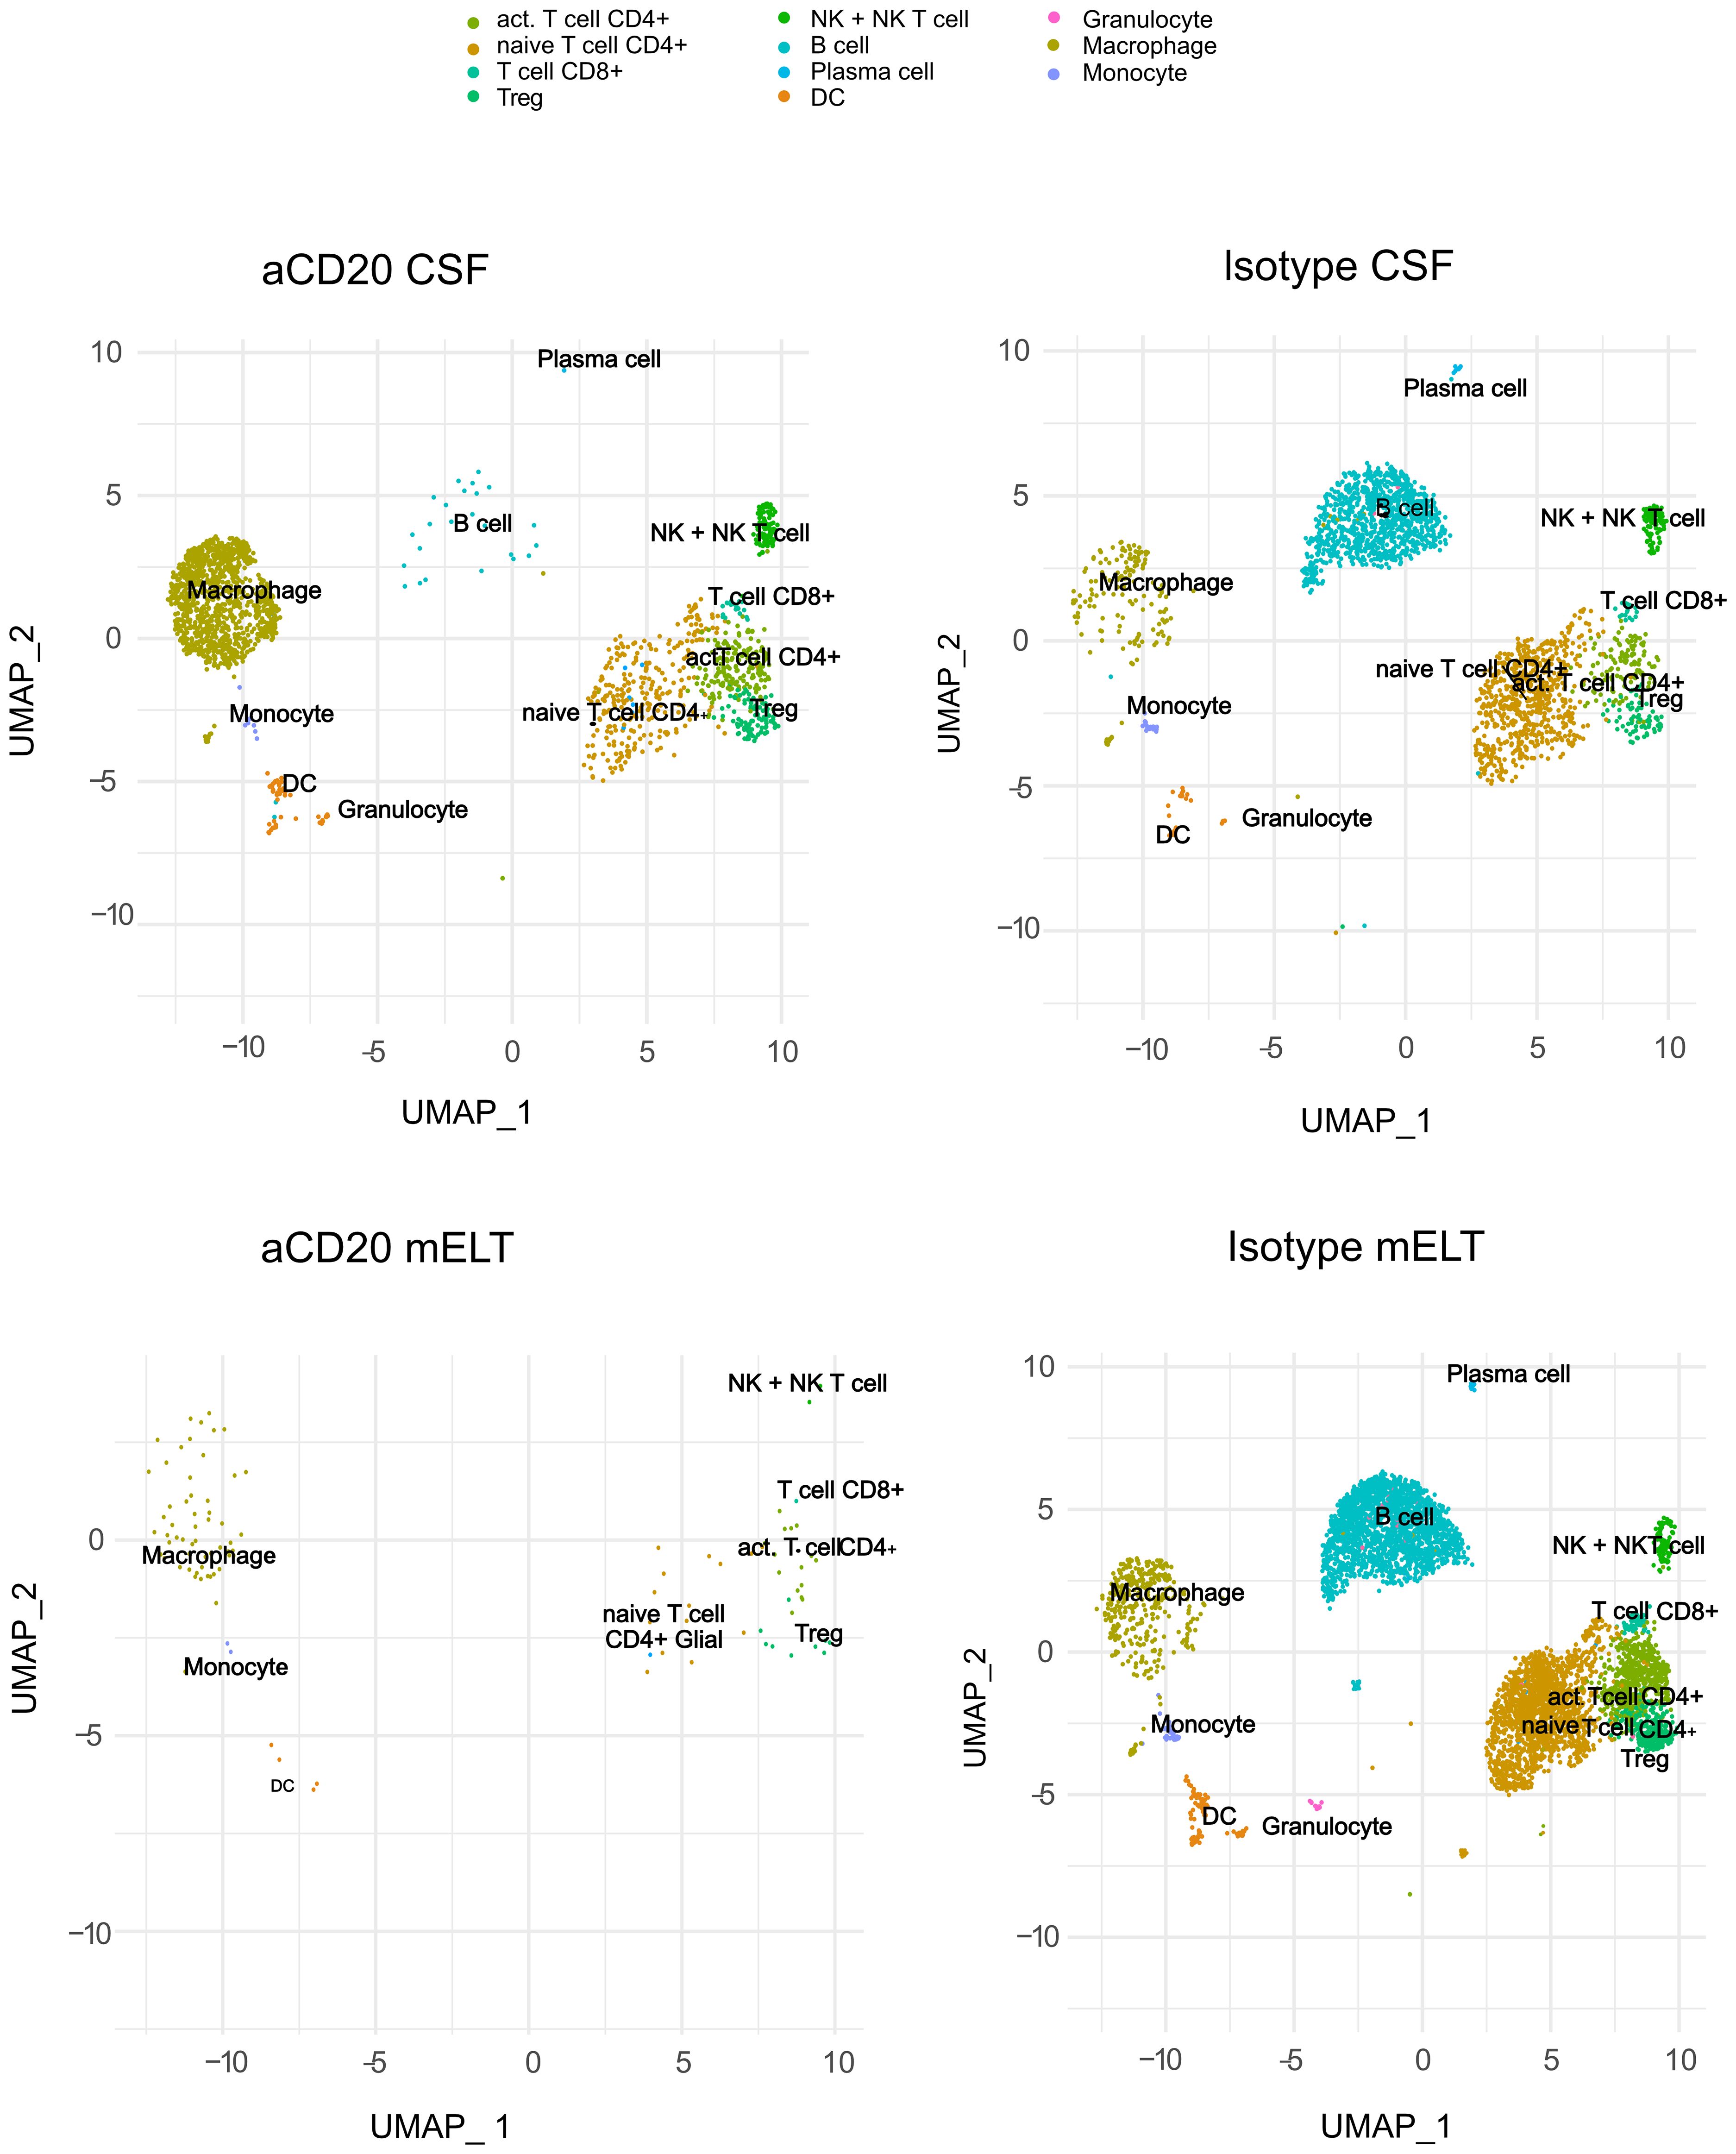
Figure 2 Uniform manifold approximation and projection (UMAP) plot representing 11 color-coded cell clusters identified in using single cell sequencing, split per tissue (CSF and mELT) and per treatment (aCD20 treated mice and control treated mice).
mELT and CSF have a similar cellular composition
Figure 3 and Table 2 illustrate the cell composition of mELT and CSF from control treated (B cell competent) mice. Both CSF and mELT consist mainly of B and CD4+ T lymphocytes. Their relative numbers (percentage) were comparable in both tissues (Table 2). Other cell types like monocytes, plasma cells, NK cells, macrophages and granulocytes are also equally represented in both CSF and mELT from control treated mice. Overall, regarding the immune cell composition, CSF and mELT were closely related in control treated 2D2xTh EAE mice.
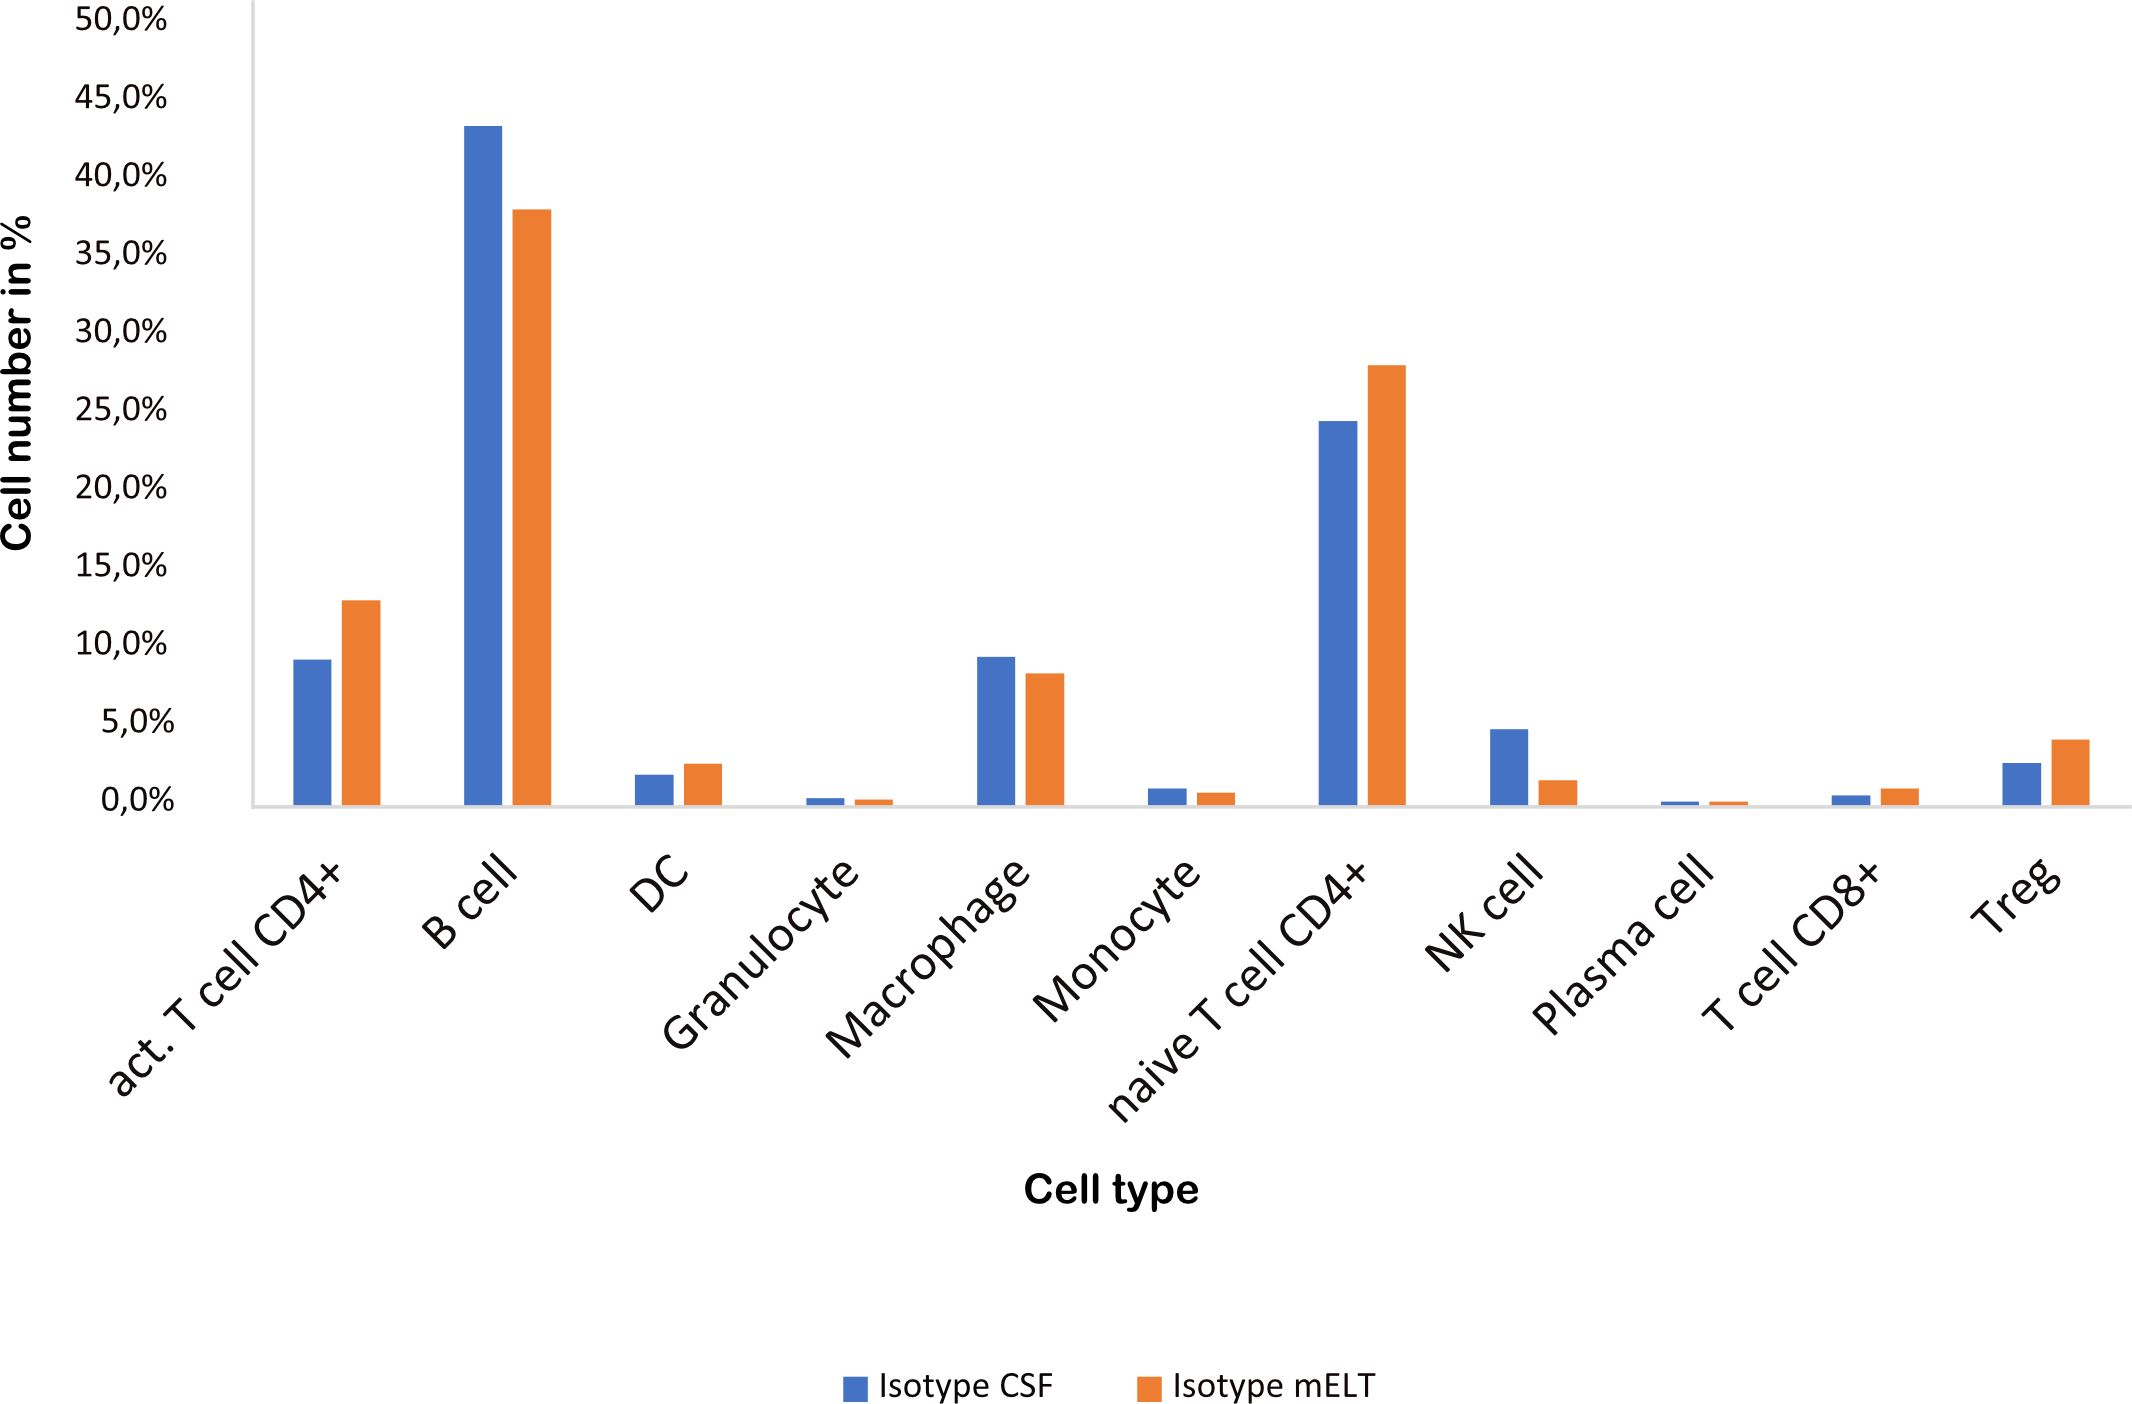
Figure 3 Cell numbers in CSF from control treated mice vs. mELT in control treated mice are similar. The percentage of the respective cell types is shown.

Table 2 Cell composition per tissue.
CSF from aCD20 treated mice contains less B cells and naïve CD4+ T cells but more macrophages
As previously shown (16), aCD20 treatment did not alter the EAE course (Figure 1B). The cellular composition of B cell depleted, aCD20 treated CSF seems to be considerably different compared to the B cell competent control group. Due to insufficient data for the mELT aCD20 condition (Table 2), we compared CSF from aCD20 treated versus control treated mice as a surrogate (Figure 4, Table 2). Like previously shown for mELT (16), aCD20 treatment depleted virtually all B cells from CSF. In addition, aCD20 treated CSF contained less naïve CD4+ T-cells. Similarly, we observed a reduction of monocytes, granulocytes, and plasma cells, but their number was relatively low overall. Interestingly, we observed a substantial increase of macrophages in CSF samples from the aCD20 treated group when compared to the control treated group (1,277 vs. 227 cells; 62,5% vs. 9,6%). Numbers of activated CD4+ T cells, NK cells, Tregs, CD8+ T cells were similar in both conditions.
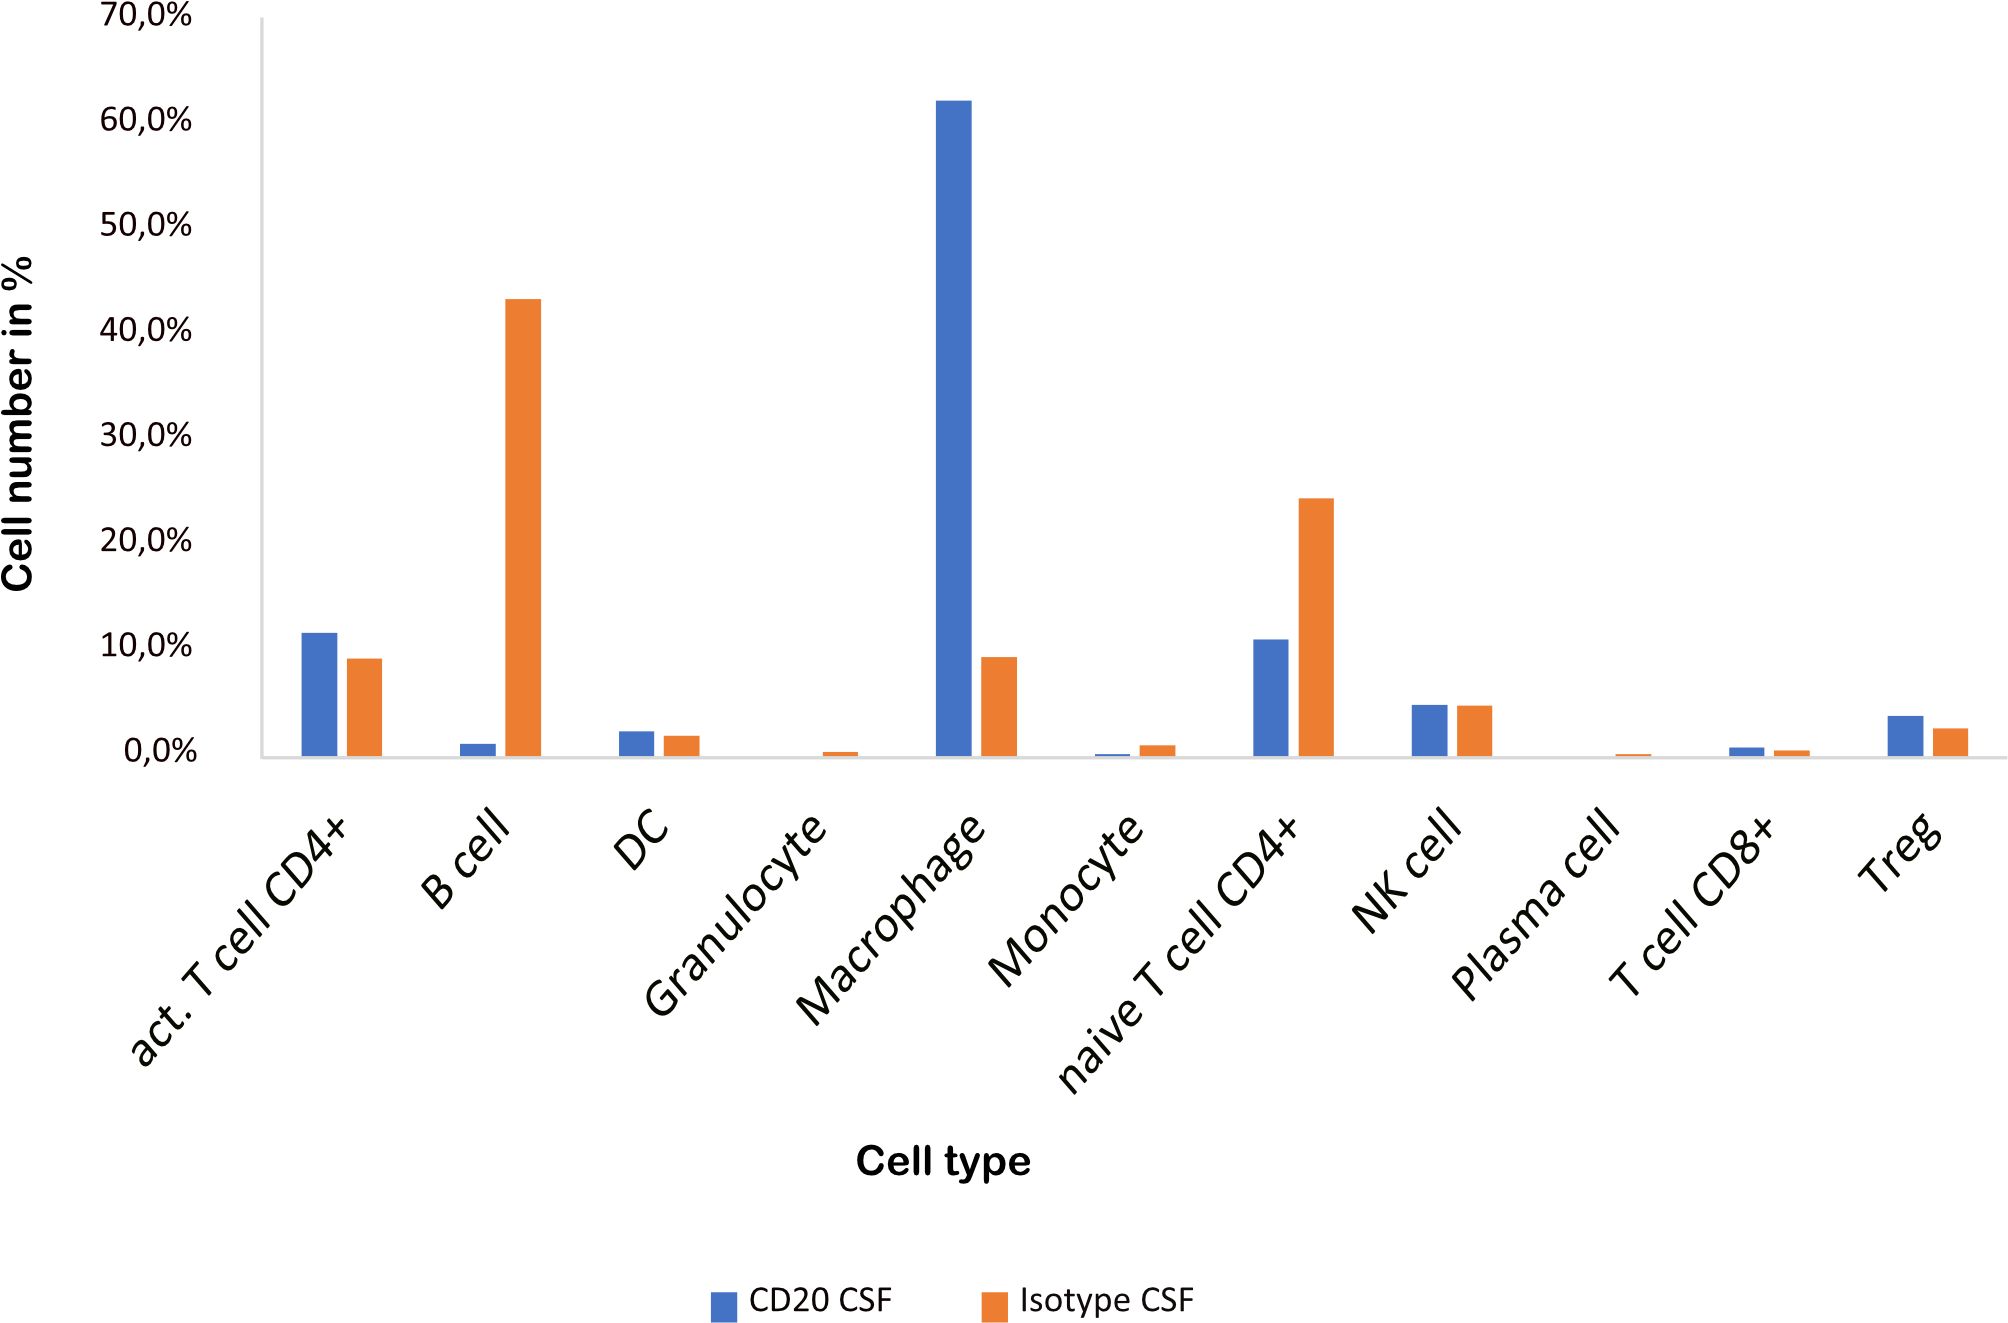
Figure 4 CSF from aCD20 treated mice has less B cells and naïve CD4+ T cells, but more macrophages than CSF from control treated mice. The percentage of the respective cell types is shown.
aCD20 treatment results in heterogeneous up- and downregulation of proinflammatory genes
In order to identify differences in gene expression in CSF between the aCD20 and isotype conditions, a differential gene expression analysis was conducted for each cell cluster within the respective tissue samples. Only those cell types were included in the analysis, where >50 cells were available in both conditions. Figure 5 illustrates the 10 genes with highest fold change among the significant upregulated and downregulated genes in CSF from aCD20 treated mice compared to the control treated group. A full list of significant genes can be found in Supplementary Table 1.
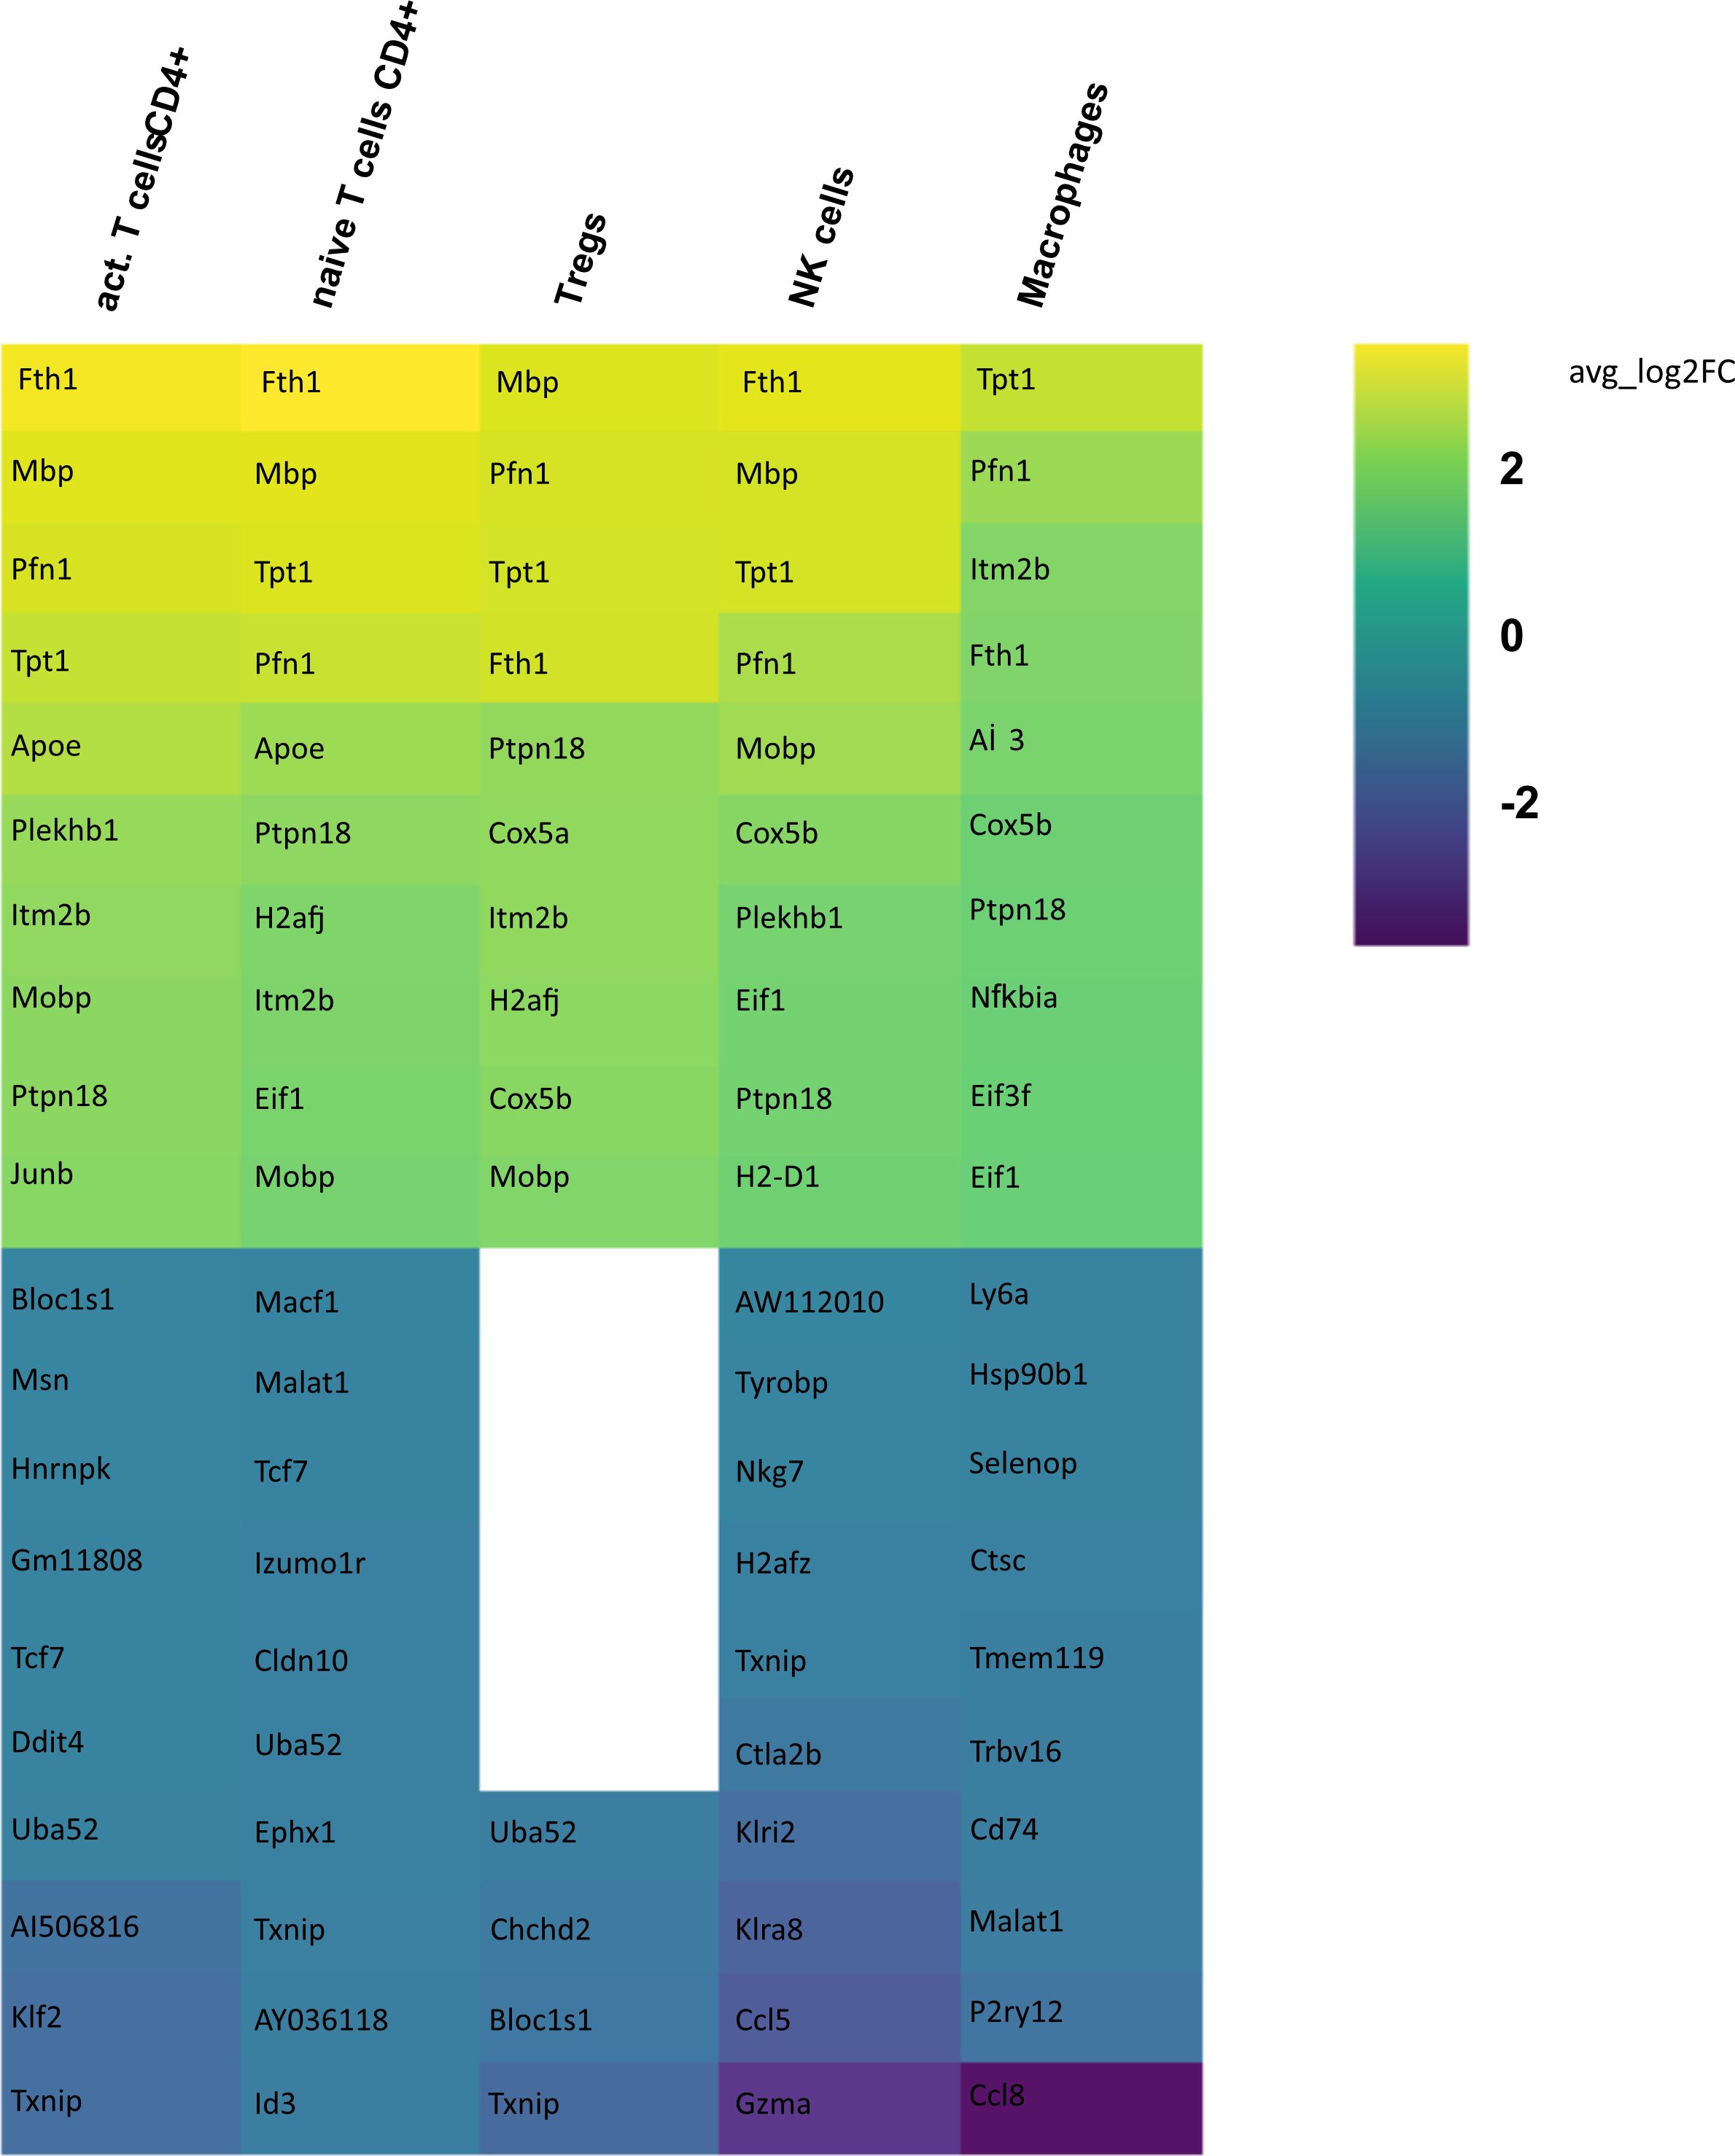
Figure 5 Heatmap representing differentially expressed genes (DEGs) between CSF from aCD20 treated and CSF from isotype treated mice for each cell type. Gene expression analysis was conducted only for cell counts >50. Thus, not all cell types are shown. The top 10 up- and downregulated genes are shown, ranked according to average log2 fold-change (avg_log 2FC). Positive avg_log 2FC represent upregulated genes in CSF from aCD20 treated mice, negative values correspond to downregulated genes.
Differential gene expression analysis showed that the majority of differentially regulated genes was upregulated in the aCD20 treated group in comparison to the control group (Figure 6). One of the most differentially expressed genes, upregulated in the aCD20 treated group in each of the examined cell types, was Ferritin Heavy Chain 1 (Fth1), which has a major function in iron storage. Studies have demonstrated an upregulation of the Fth1 gene in brain tissue of patients with MS lesions (22). However, an association with upregulated Fth1 gene in immune cells of CSF is currently unknown. Another highly upregulated gene in all examined cell types was Mbp. The Mbp gene encodes for the myelin basic protein, which is a structural component of myelin sheath. Thus, Mbp expression in our data may represent contamination by myelin. However, according to Marty et al, Mbp expression is detected in T cells isolated from lymph nodes and spleen (23). Several variations in the Mbp gene have been associated with an increased susceptibility to developing MS and its clinical course (24). Furthermore, we observed a significant upregulation of the Pfn1 gene in all immune cell populations. Even though no association with MS has been observed yet, studies have shown that excessive Pfn1 activity can result in the immune system targeting the body’s own cells resulting in other autoimmune diseases (25). Apoe was among the top 10 upregulated genes in activated and naïve CD4+ T cells. Apoe exhibits notable immunomodulatory properties by attenuating immune activation through downregulation of immune stimulatory proteins on antigen-presenting cells. Multiple scientific investigations have established a potential association between Apoe and autoimmune conditions, including MS (26–28). Interestingly, both Apoe and Mbp also showed higher expression in mELT than in spleen and lymph nodes in many immune celltypes in our previous study, comparing mELT with secondary lymphoid organs (11). Macrophages in CSF of B cell depleted mice exhibited upregulated expression of Atf3. Atf3 correlates with macrophages infiltration and plays a role in inflammation, cell division, and apoptosis (29). Additionally, we observed an upregulation of the Junb gene in immune cells from aCD20 treated mice. Junb has been identified as a significant contributor to the activation of T cells and the differentiation and proliferation of Tregs (30). In addition, several subunits of cytochrome c oxidase (Cox5a, Cox5b, Cox8a, Cox6a1), which play an important role in regulation of ATP synthesis via oxidative phosphorylation (OXPHOS) (31), were found to be upregulated after CD20 treatment in all studied cell types. Typically, resting lymphocytes generate energy through oxidative phosphorylation and fatty acid oxidation, whereas activated lymphocytes rapidly shift to glycolysis (32). Finally, also translation initiation factors including Eif1, and Eif3f, were upregulated by CD20 treatment in all studied cell types. Interestingly, another translation initiation factor has been found to play a role in MS development (33). aCD20 mAb treatment leads to an increased expression of proinflammatory chemokines CCL3 and CCL4 in macrophages, which can lead to the attraction of more macrophages and monocytes. In addition, also CXCL14 and CCRL2 were increased in aCD20 mAb-treated CSF samples.
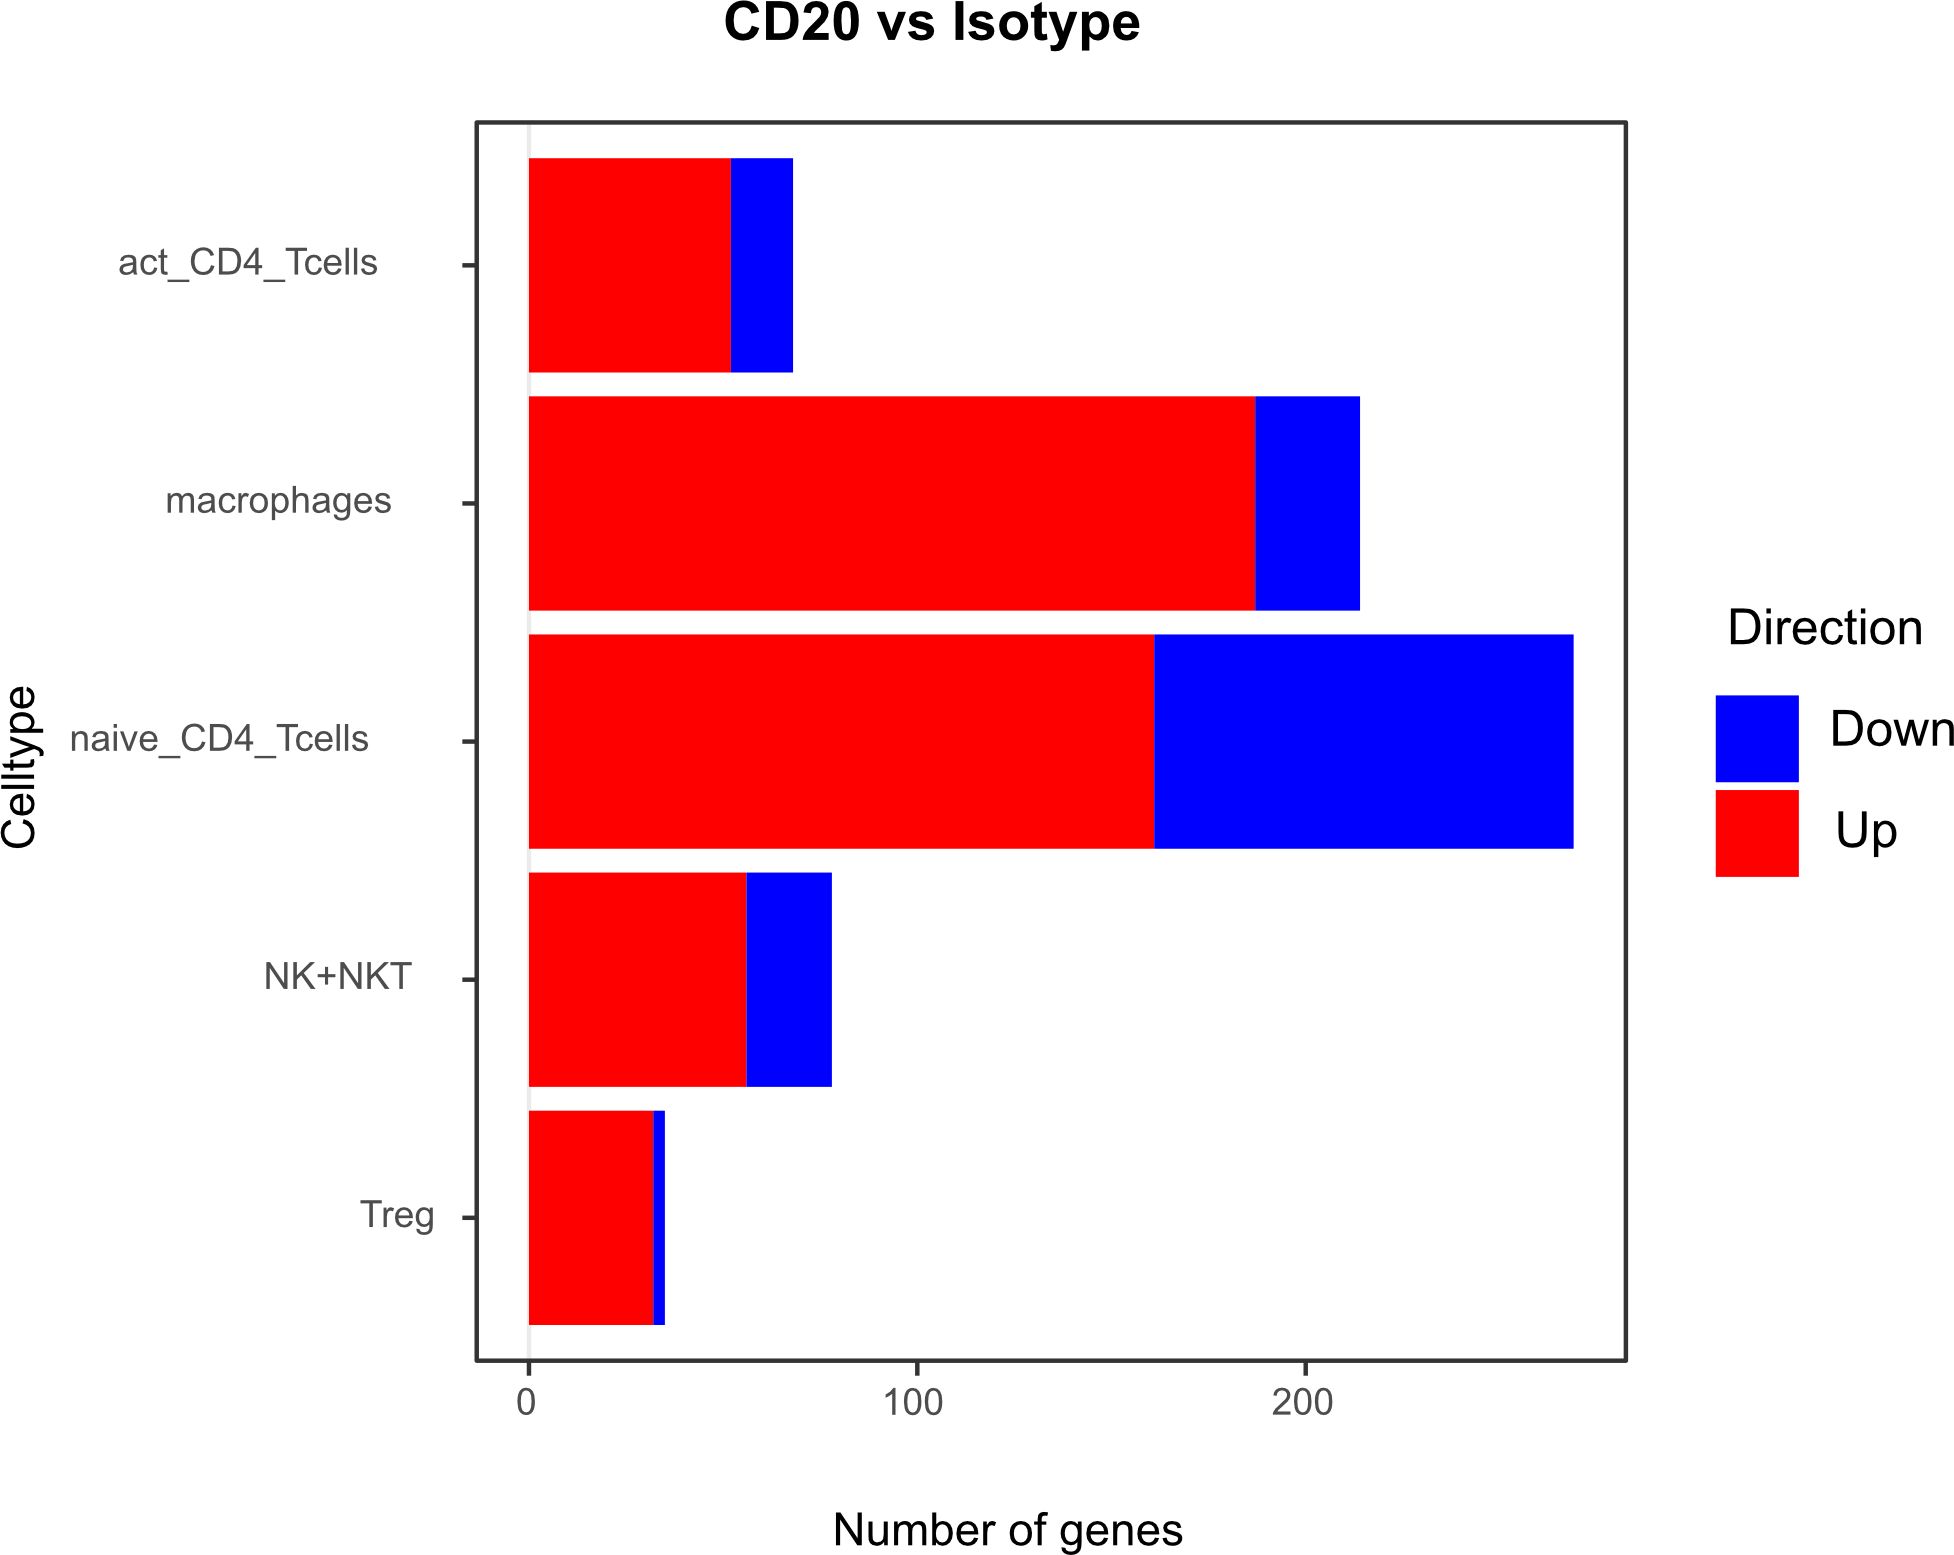
Figure 6 Number of genes that exhibit upregulation or downregulation in aCD20 treated mice compared to control treated mice.
While genes upregulated after aCD20 treatment show more consistency across the different cell types, there is more variability observed in downregulated genes between different cell types. Among the genes found to be downregulated in the CSF after aCD20 treatment was Txnip, which was downregulated in activated CD4+ T cells, naive CD4+ T cells, Tregs, and NK cells. The Txnip gene has been investigated for its role in inflammatory activation and its implication in neurodegenerative disorders (34). In NK cells, the Gzma gene is downregulated in CSF from aCD20 treated mice. The Gzma gene, also known as Granzyme A, encodes a serine protease enzyme that is primarily found in the granules of cytotoxic T lymphocytes (CTLs) and NK cells. Gzma has been associated with immune activation and promotion of inflammation (35). A downregulated gene in macrophages is the Ccl8 (C-C Motif Chemokine Ligand 8) gene. Ccl8 has been linked to a severe disease course in MS (36). Furthermore, Ccl8 is also known for its role in the induction of inflammation and is highly expressed in tumor-associated macrophages (37).
Although some of the top downregulated genes seemed to be related to inflammation and some of the top upregulated genes are related to regulation of inflammation, overall, gene expression analyses comparing CSF immune cells of B cell depleted and non-depleted mice did not show a uniform pro- or anti-inflammatory pattern.
The majority of differentially expressed genes were downregulated in mELT compared to CSF
Secondly, we compared the gene expression profiles of immune cells in mELT with CSF in control treated, B cell competent EAE mice. In mELT compared to CSF, overall, more genes were downregulated than upregulated (Figures 7, 8). A full list of significant genes is in Supplementary Table 2.
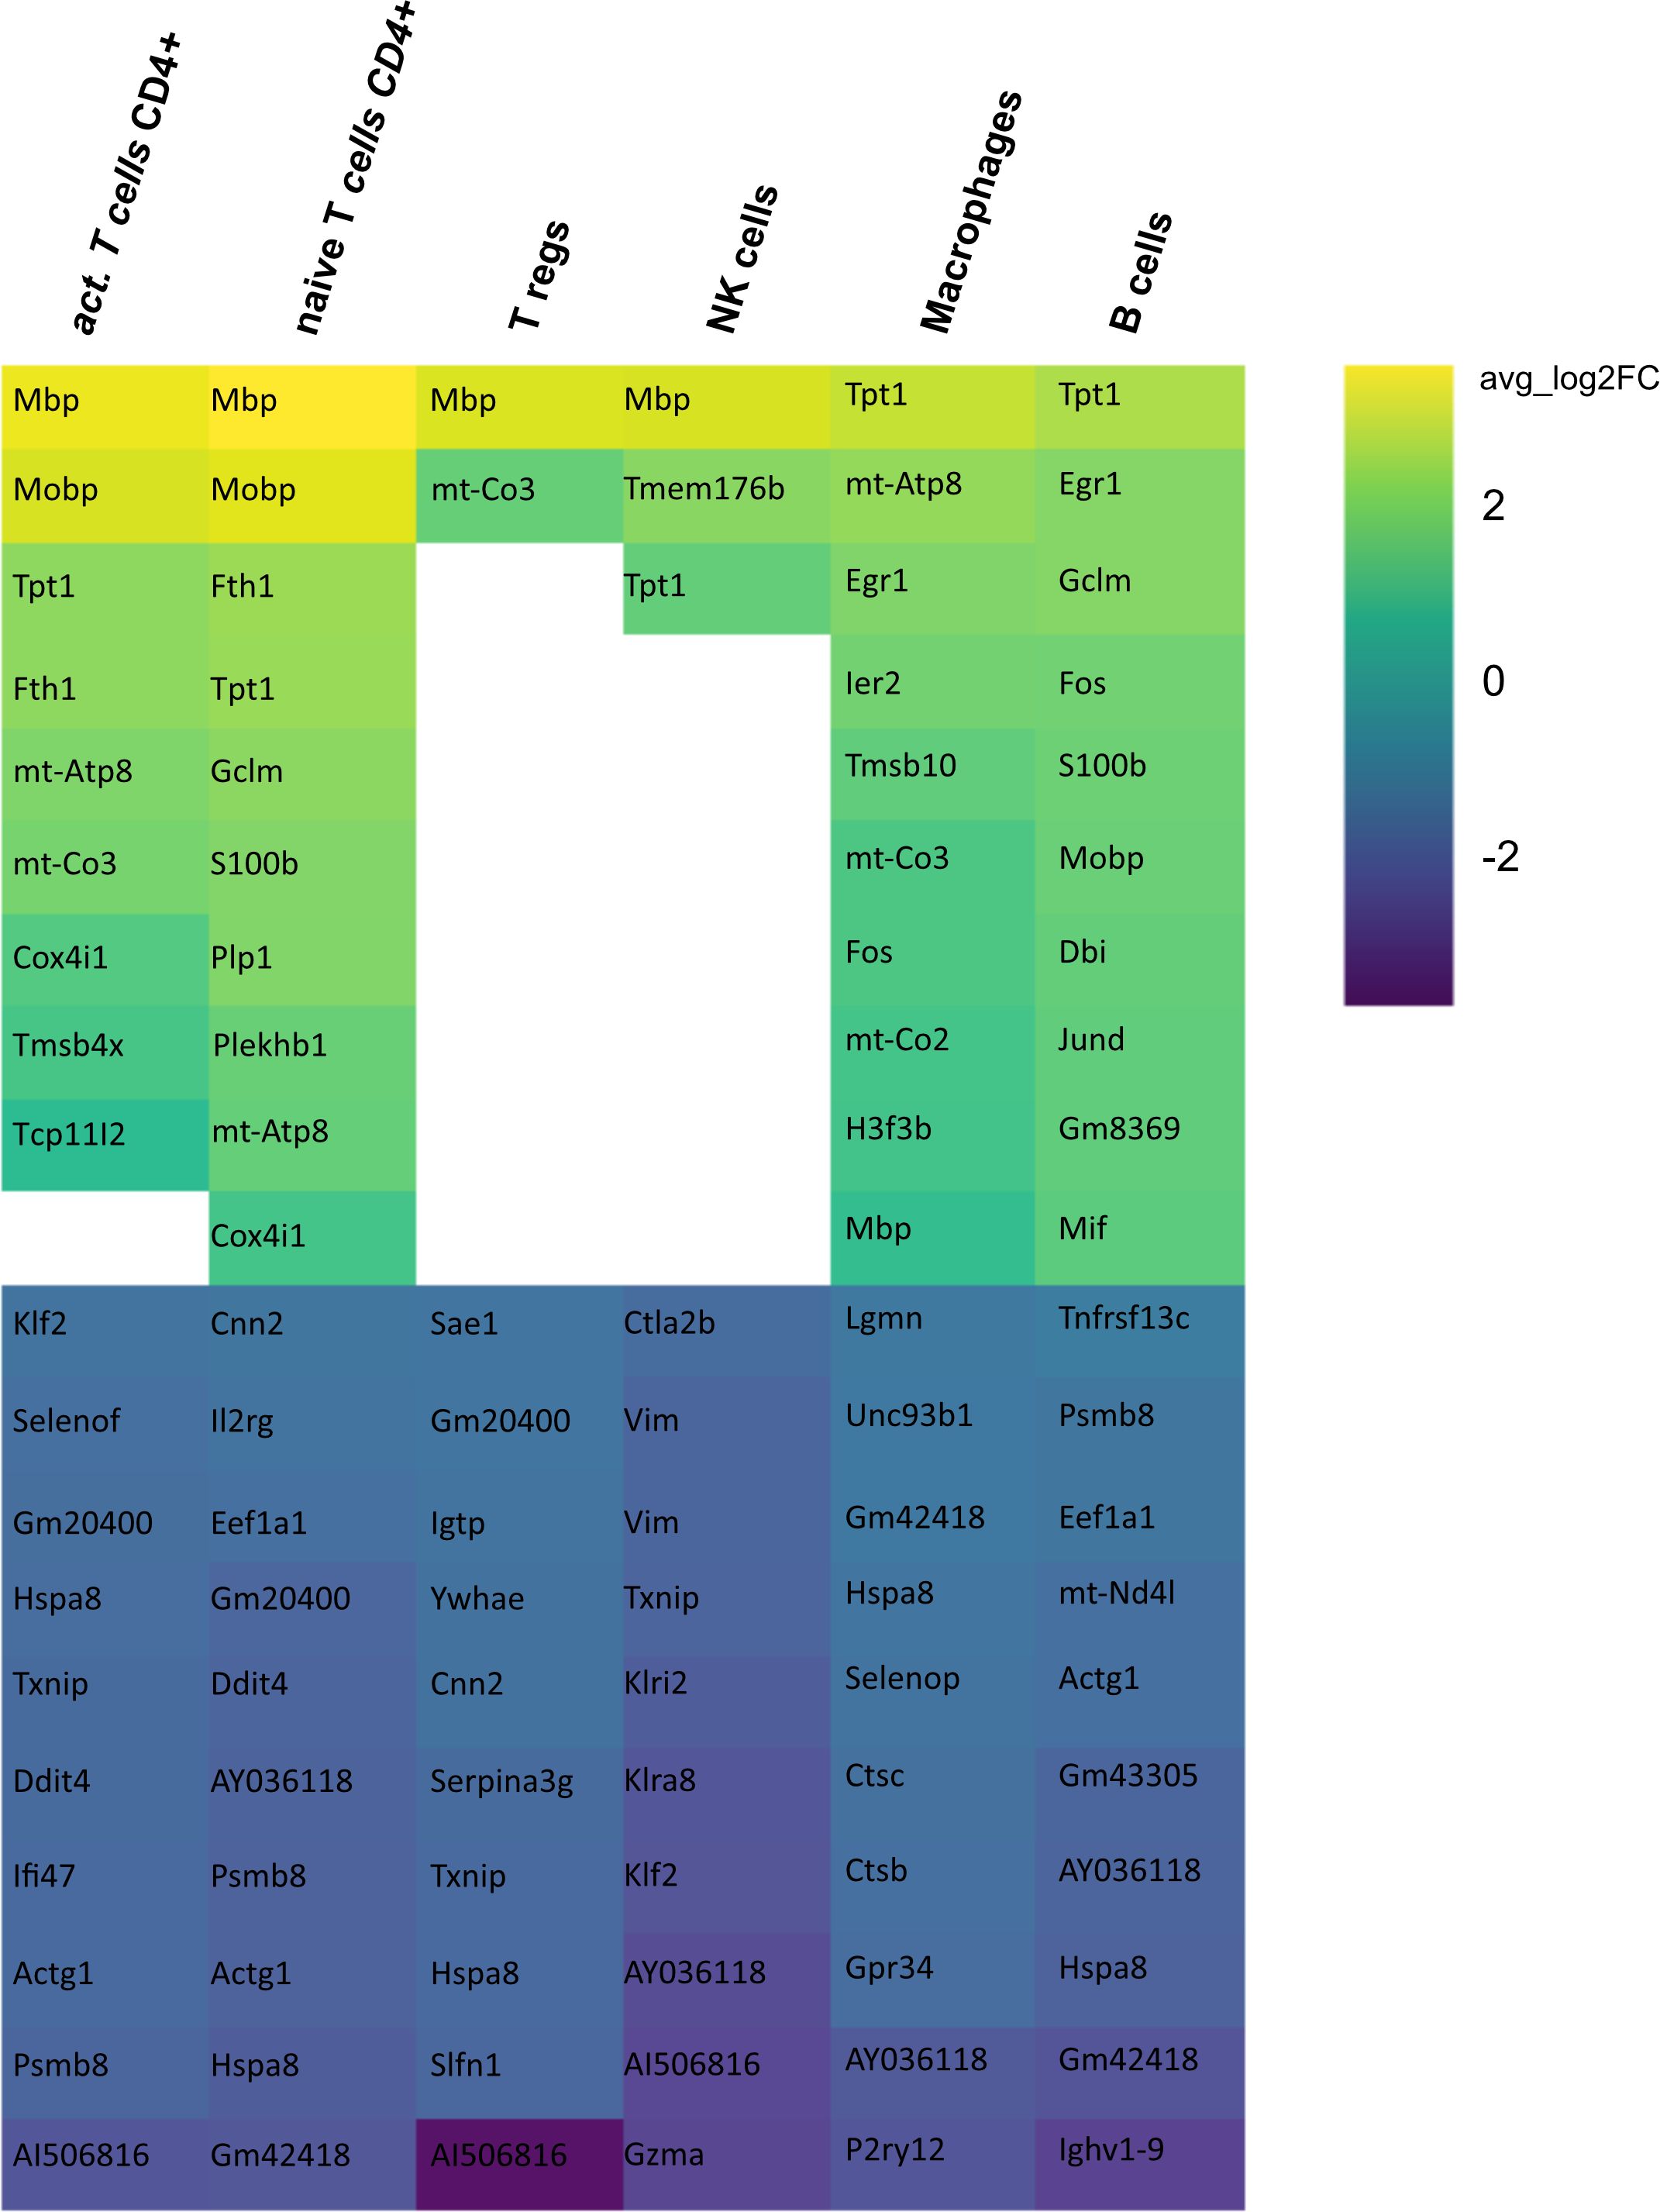
Figure 7 Heatmap representing differentially expressed genes (DEGs) between mELT from control treated and CSF from control treated mice for each cell type. Gene analysis was conducted only for cell counts >50. Thus, not all cell types are shown. The top 10 up- and downregulated genes in mELT from control treated mice when compared to CSF from control treated mice are shown. Genes were ranked according to average log2 fold-change (avg_log 2FC). Positive avg_log 2FC represent upregulated genes in mELT from control treated mice (green), negative values correspond to downregulated genes (blue).
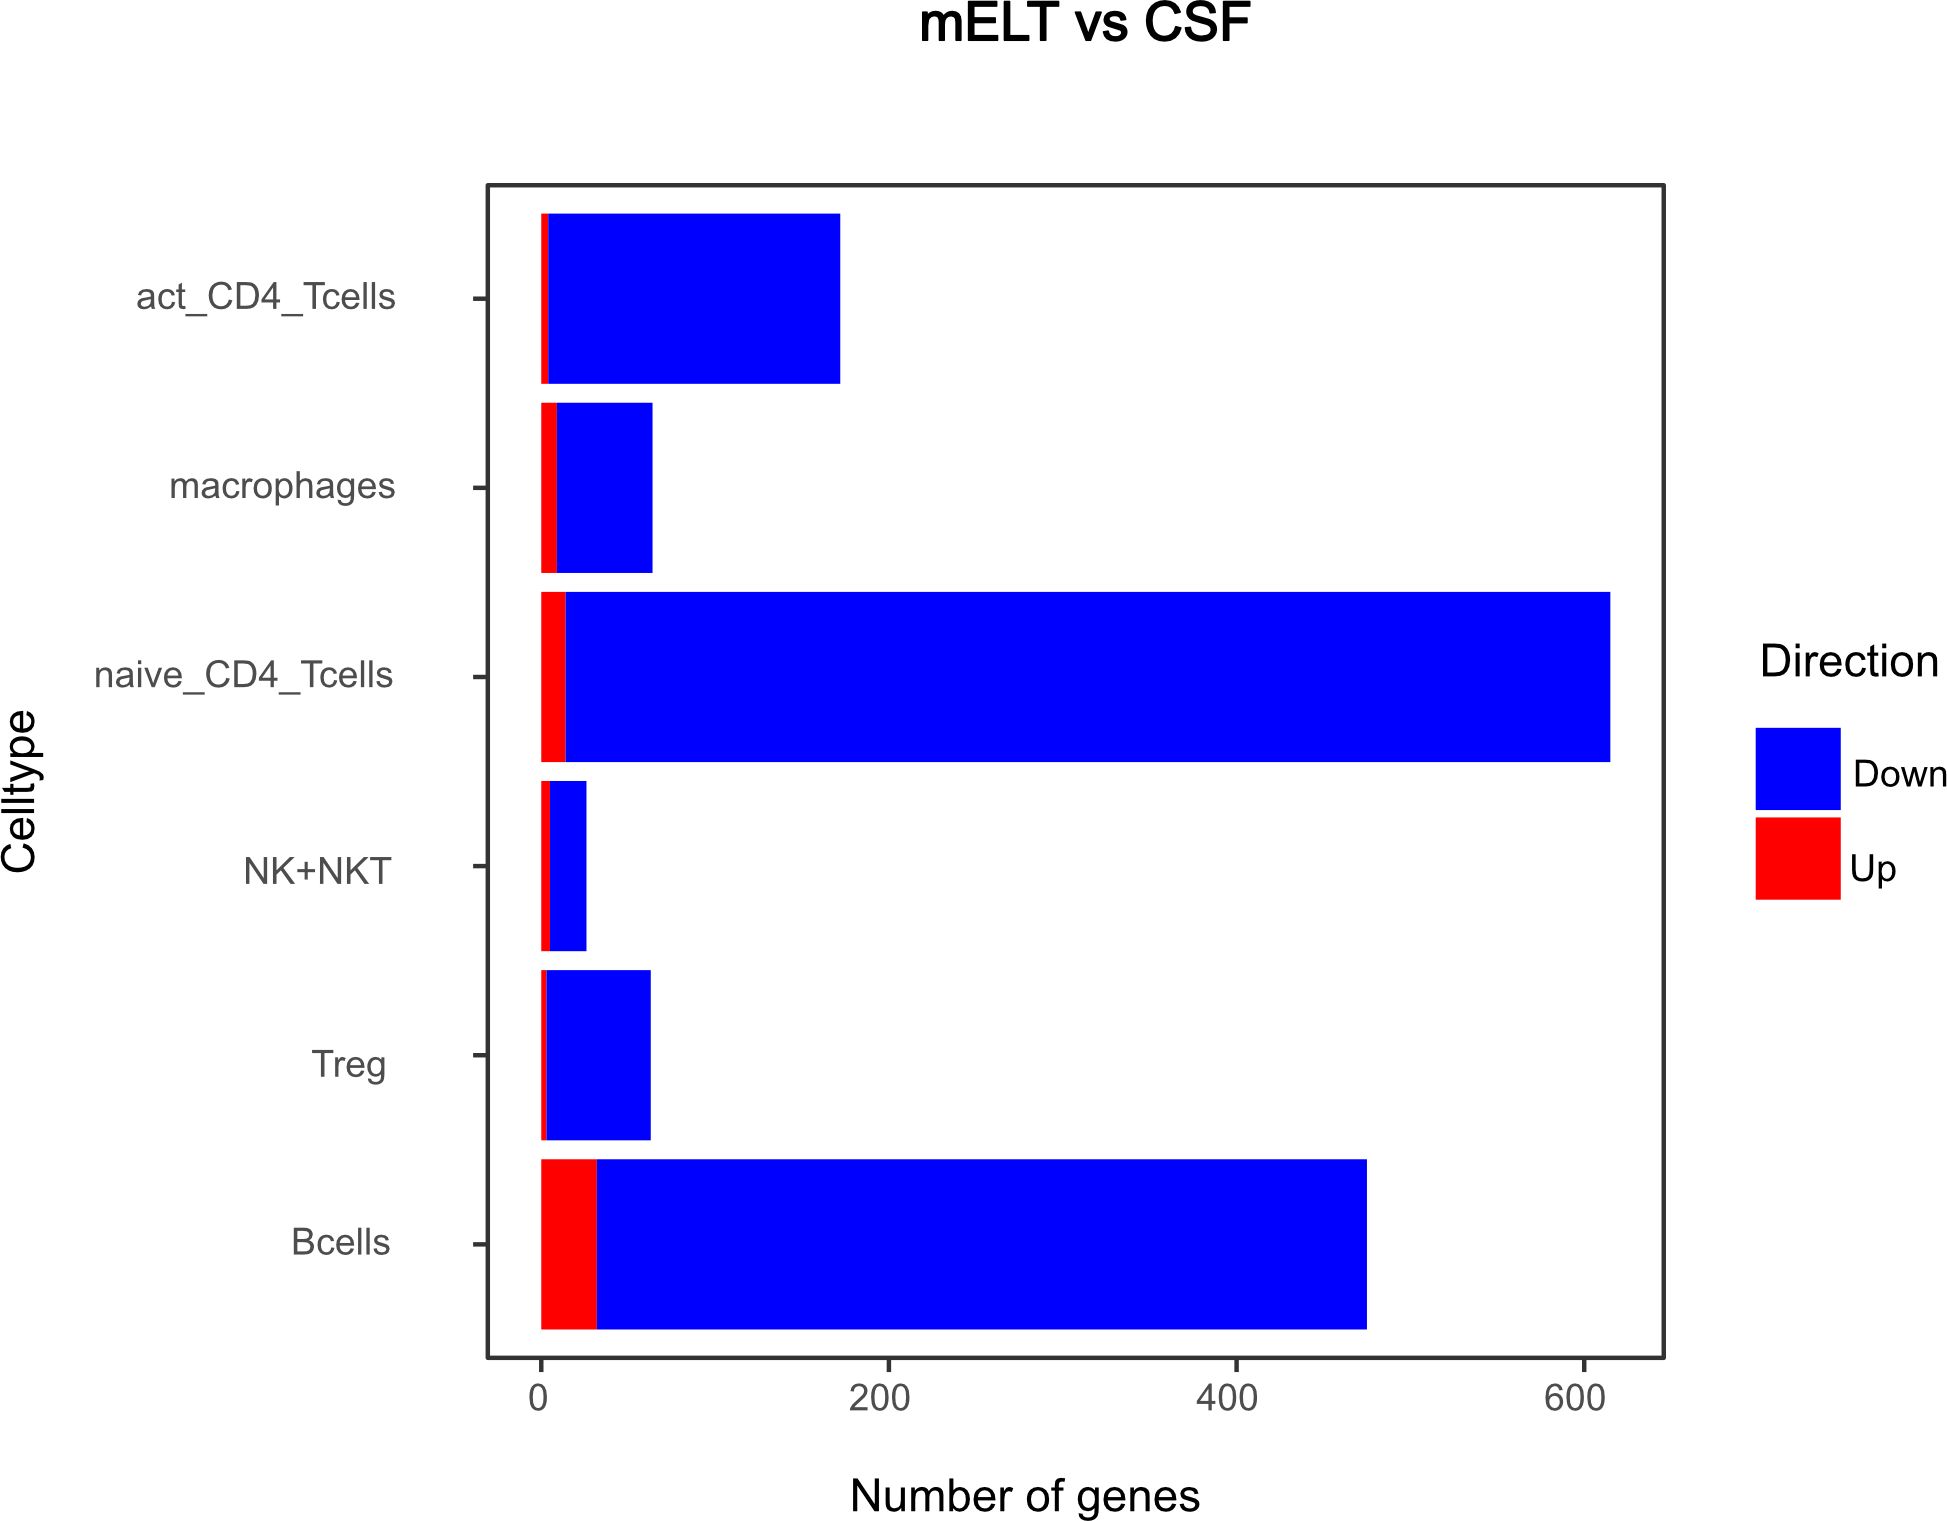
Figure 8 Number of genes that exhibit upregulation or downregulation in mELT in comparison to their expression levels in CSF.
However, there was an overlap between the top 10 upregulated genes when comparing mELT versus CSF in the control treatment condition (Figure 7) with CSF in aCD20 treatment versus CSF in control treatment (Figure 5). Among the top 10 upregulated genes were once again Mbp, Mobp, Fth1, and Tpt1. These genes have been consistently associated with crucial biological processes, including myelin formation (Mbp, Mobp), iron homeostasis (Fth1), and cellular stress response (Tpt1). The expression of Mbp, Mobp and Plp1, which is also among the top 10 upregulated genes in the naïve CD4+ T cell dataset, could possibly represent myelin contamination in mELT. In B cells, the expression of immediate early genes (IEGs) such as Egr1, Jund, and Fos, which are rapidly induced in response to antigen receptor or cytokine stimulation (38), exhibited higher levels of expression in mELT compared to CSF. Interestingly, we found IEG also to be higher expressed in mELT compared to lymph nodes and spleen in our previous study (11). It is noteworthy that one of the most upregulated genes in B cells was Fos. Previous studies have associated Fos with MS (39).
The majority of genes was downregulated in mELT compared to CSF, including the Klf2 gene, also referred to as Krüppel-like factor 2, downregulated in activated CD4+ T cells and NK cells, naïve CD4+ T cells and B cells. Klf2 is recognized as a negative regulator of EAE-induced neuroinflammation through the inhibition of pro-inflammatory factors. It has been demonstrated that the absence of Klf2 exacerbates neurological dysfunction and neuroinflammation (40). Furthermore, in mELT of control-treated mice, there were additional downregulated genes that seem noteworthy - Hspa8 (all cell types), and Gzma (NK cells). Gzma has been introduced above. Hspa8 belongs to the Hsp70 family of chaperones and exhibits a protective potential in neurodegenerative diseases (41). Additionally, Hsp70 serves as a marker for inflammatory processes in MS. It has been demonstrated that patients with MS have an elevated level of Hsp70 in their serum. Specifically, clinically isolated syndrome and relapsing-remitting MS are associated with higher serum concentrations of Hsp70 compared to progressive MS (42).
In summary, gene downregulation outweighed upregulation in control treated mELT compared to CSF – a finding that remains difficult to interpret.
Pathway enrichment analysis suggests that B cell depletion from CSF has little effect on immune-related pathways in remaining cells
Pathway enrichment analysis was used to identify differentially regulated pathways among differentially expressed genes (both up and downregulated) from 1) the CSF in the aCD20 vs. control treated conditions and 2) B cell competent immune cells between mELT and CSF.
For the first analysis, the top 5 pathways per cell type are shown in Figure 9. The most relevant seem to be T cell activation (in naïve T cells), antigen processing and presentation of exogenous peptide antigen and cytokine signaling in immune system (both macrophages). Moreover, oxidative phosphorylation, which is known to be important for many immune cell functions (32), was among the top pathways for all cell types. Yet, the majority of regulated pathways seem not to be primarily linked to inflammation. Overall, this analysis suggests that the absence of B cells in the CSF does not significantly change the inflammatory state of the remaining immune cells, whereas the phenotype (cell type composition) is clearly different.
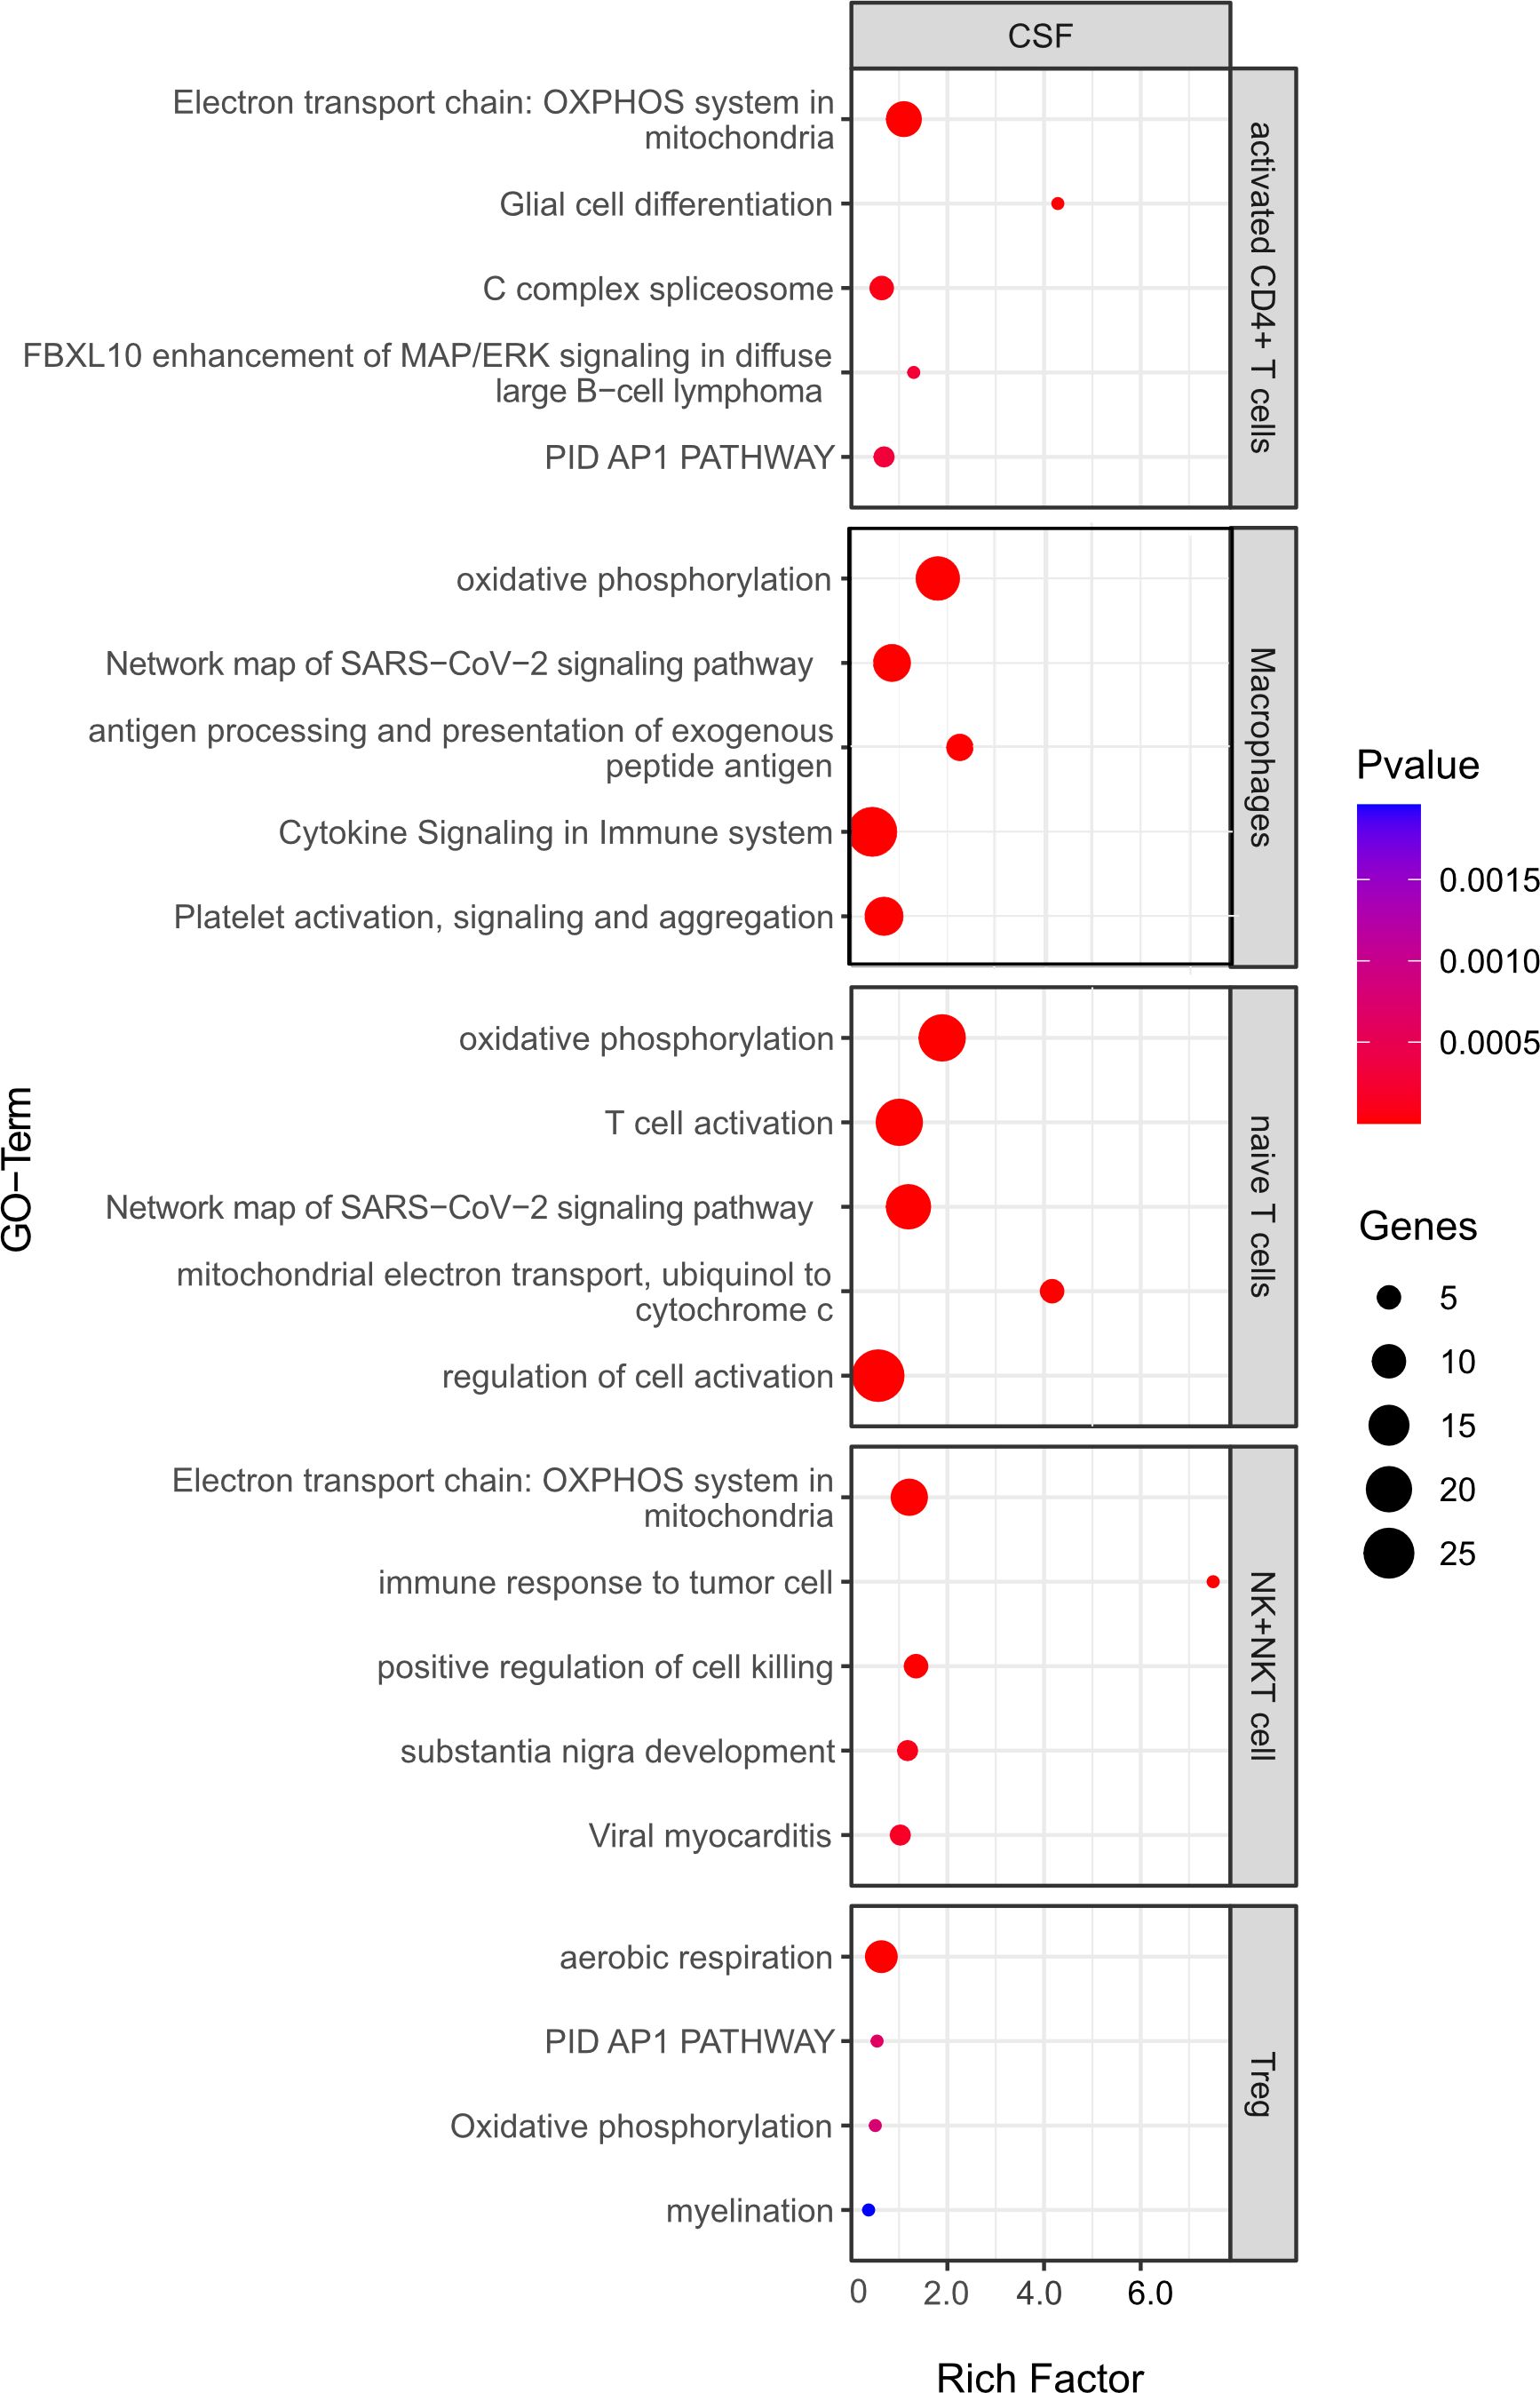
Figure 9 Functional enrichment analysis for genes differentially expressed between CSF from aCD20 treated mice and CSF from control treated mice using Metascape. The top 5 GO-terms are shown (For Tregs, only four pathways were significant). For similar gene ontology (GO) terms, only the top-ranked GO term was shown. The dot size reflects the number of genes enriched in the GO term and its color the corresponding statistical significance (p-value). Rich factor is the ratio of differentially expressed gene numbers annotated in this GO-term to all gene numbers annotated in this GO term.
Comparing B cell competent immune cells between mELT and CSF (Figure 10), we found an enrichment of relevant immune-related pathways, for example response to cytokine stimulus/signaling in activated CD4+ T cells, adaptive immune system response in B cells and naïve CD4+ T cells, and activation, cell-cell recognition and TCR signaling in naïve T cells.
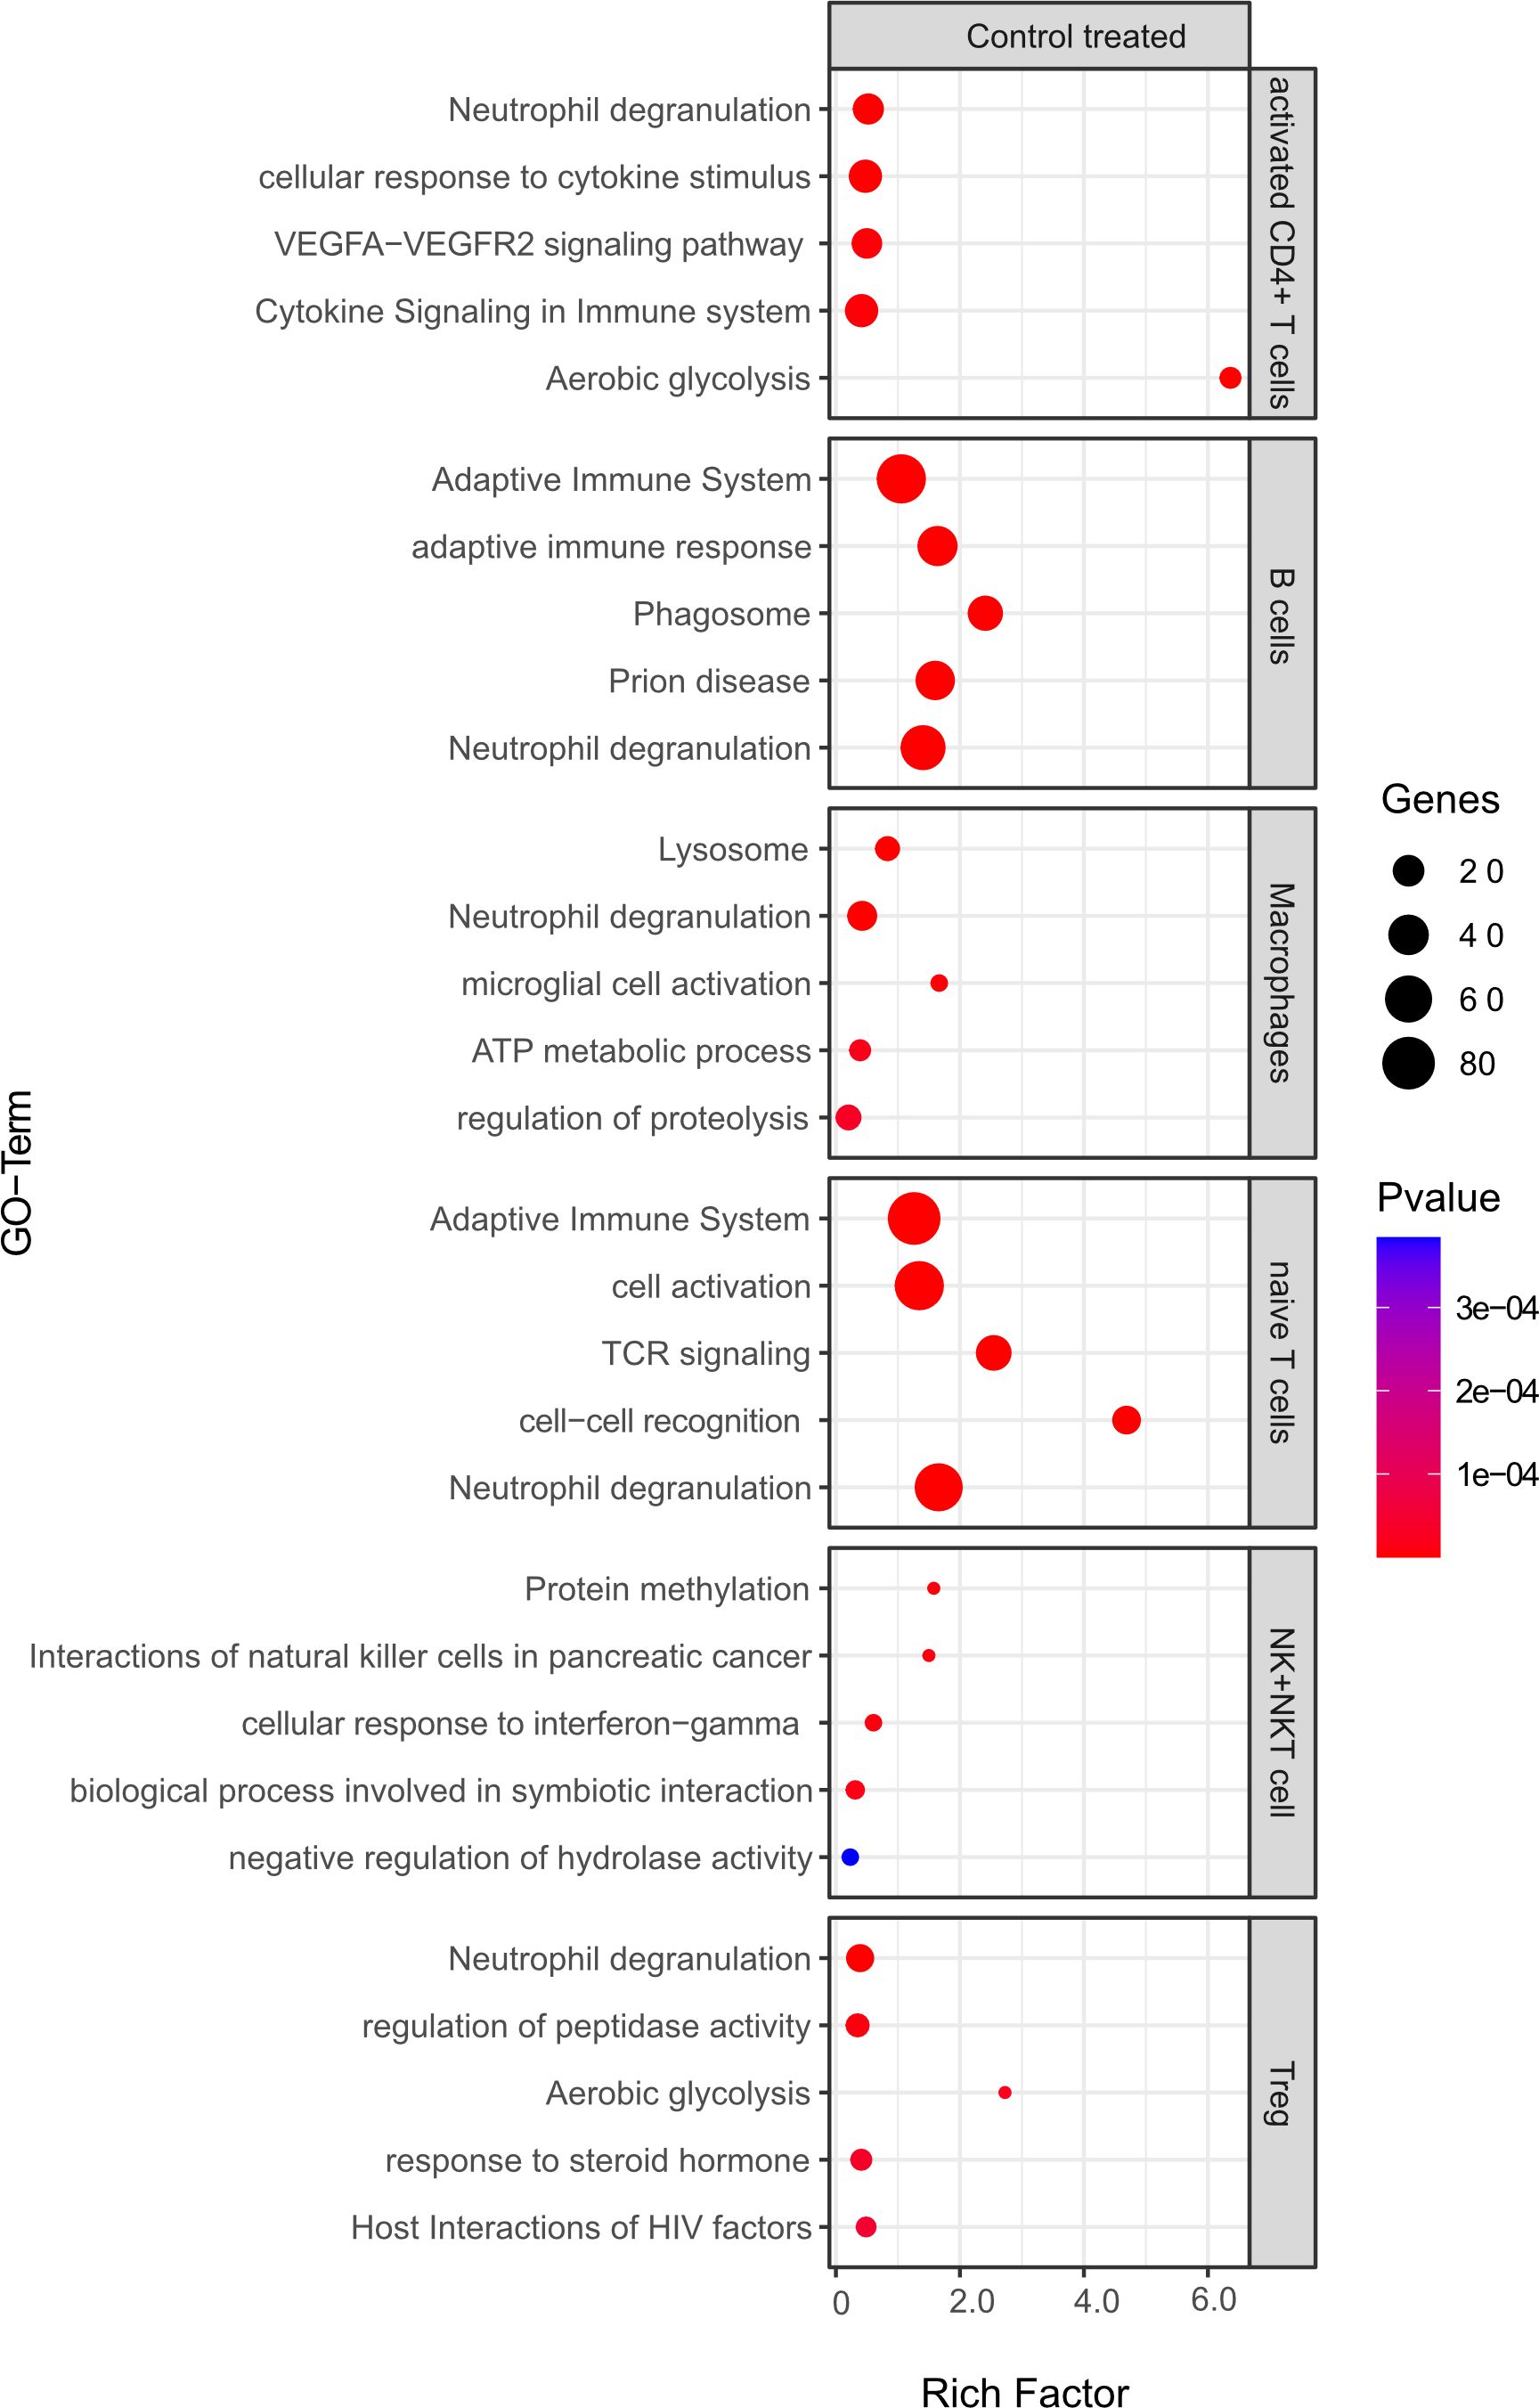
Figure 10 Functional enrichment analysis for genes differentially expressed between mELT from control treated mice and CSF from control treated mice using Metascape. The top 5 GO-terms are shown. For similar gene ontology (GO) terms, only the top-ranked GO term was shown. The dot size reflects the number of genes enriched in the GO term and its color the corresponding statistical significance (p-value). Rich factor is the ratio of differentially expressed gene numbers annotated in this GO term to all gene numbers annotated in this GO term.
Discussion
Based on our previously published observation, that aCD20 mAbs efficiently deplete B cells from mELT in spontaneous EAE but do not prevent or inhibit mELT formation, we set out to compare mELT that contained B cells with mELT in which B cells were depleted by single cell RNA sequencing. Unfortunately, due to unresolved technical challenges, we were unable to obtain, process and analyze enough cells from mELT in aCD20 mAbs treated mice to generate meaningful results in this condition. However, sufficient data could be obtained from control treated (B cell competent) mELT and from the CSF of aCD20 mAbs treated and control treated mice. Thus, we addressed our second objective first: whether the CSF and mELT compartment are related. Our data suggest that the immune cell composition, and to some degree gene expression profile, in the CSF mirrors that in mELT in B cell competent spontaneous EAE mice. Both, CSF and mELT, are predominated by B and CD4+ T lymphocytes. While other studies have highlighted certain aspects of the cellular composition of mELT, mostly based on morphological and immunohistochemical features (6, 16), our previous study has established mELT as a tertiary lymphoid organ closely resembling secondary lymphoid organs (11). Our current report is the first to study murine CSF in EAE by single cell RNA sequencing and comparing it with mELT. The cellular composition and immune phenotype of CSF cells in MS patients and healthy individuals has been studied quite intensively. While the CSF of healthy individuals contains < 5 leukocytes per µl, which are predominantly CD4+ T lymphocytes and fewer monocytes (43), CSF in MS patients may feature mild pleocytosis and a substantial increase in B cells (44). The cellular composition of murine CSF has not been described, to our knowledge. Our data suggests that CSF cells may serve as a surrogate for mELT in our model.
Analyzing the effects of aCD20 mAbs on the CSF compartment revealed, as expected, near complete depletion of B cells. We have previously demonstrated virtually complete B cell depletion from mELT by aCD20 mAbs in the same model using immunohistochemistry (16). Another study demonstrated that aCD20 mAbs could deplete B cells from the meninges, in a model that does not feature mELT (45). Interestingly, we observed a concomitant decrease of naïve CD4+ T cells in the absence of B cells in the CSF. It seems possible that a fraction of CSF T cells, that expressed CD20 on their cell surface, may directly be depleted by aCD20 mAbs (46). Monocytes, plasma cells and granulocytes were also decreased. In contrast, macrophages were markedly increased. This increase exceeded a mere relative, compensatory increase of other cell types in the absence of B cells but seems to be a distinct finding. Our previous study has suggested that macrophages in mELT may stimulate the recruitment of other immune cells to the inflamed CNS (11). We speculate that similar mechanisms may apply to the CSF. Peripheral blood CD11b+ monocytes/macrophages in B cell depleted patients have a more pro-inflammatory phenotype compared to B cell competent patients (47). Possibly, this altered phenotype favors accumulation of those myeloid cells in the CSF. In line with our data, studies have demonstrated that B cell depletion by aCD20 mAbs like rituximab and ocrelizumab in MS patients led to a strong reduction of CSF B cells and, to a lesser degree, T cells (48–50). To our knowledge, no data regarding CSF macrophages in B cell depleted CSF has been published.
Gene expression and pathway enrichment analyses comparing B cell competent mELT with CSF immune cells on the one hand and aCD20 mAbs versus control treated CSF on the other hand did not reveal striking differences with regard to immune cell phenotypes. Despite minor variations, no overarching theme directing any of the conditions in a specific way, either pro- or anti-inflammatory, could be identified. Given the remarkable efficacy of B cell depleting mAbs in treatment of MS, one could have expected a less inflammatory profile in B cell depleted CSF. This may be a limitation of the model we used, as it does not respond to aCD20 mAbs clinically.
This study faced other challenges and limitations. We discussed above how we were unable to obtain sufficient cells from B cell depleted mELT. We did not expect this challenge, since we knew from our previous study that mELT forms under B cell depleted conditions. However, B cell depleted mELT is less dense and structured. Thus, we speculate that this may have caused our difficulties in dissecting enough cells. Another major limitation was that we had to exclude one mouse from the aCD20 treated group due to insufficient B cell depletion after aCD20 mAbs treatment, and CSF cells could not be obtained from one control treated mouse. This prevented statistical analyses. For cost reasons, this study was planned with 3 mice per group, which is also a limitation to the study. Another limitation of our study is that we isolated immune cells from the entire meninges. Therefore, it is possible that, next to immune cells from mELT, our mELT samples may also contain immune cells present in the meningeal compartment outside of mELT.
In summary, one major finding of our study was that the immune cells in the CSF closely resemble those in mELT in 2D2xTh EAE mice. This included particularly the cellular composition and, to some degree, gene expression profiles. Given the relatively easy accessibility of CSF in MS patients, it would be helpful to be able to use CSF as a surrogate for mELT in MS. Future studies will have to verify this finding in humans. Another major finding was the increase of macrophages in the CSF that we observed when B cells were depleted. This also needs to be investigated in CSF of aCD20 mAb treated MS patients. While PIRA remains a challenge in the B cell depletion treatment era in MS, understanding the essential mechanisms of smoldering CNS inflammation, including in mELT and the CSF, is of great importance. It remains to be seen if Bruton’s tyrosine kinase (BTK) inhibitors or other novel agents will be able to stop smoldering inflammation in the CNS, e.g. by inhibiting the formation of mELT.
Data availability statement
The names of the repository/repositories and accession number(s) can be found below: GEO repository, https://www.ncbi.nlm.nih.gov/geo/, GSE181506.
Ethics statement
The animal study was approved by standing committee for experimentation with laboratory animals of the administration of Upper Bavaria (ROB-55.2-2532.Vet_02-16-100). The study was conducted in accordance with the local legislation and institutional requirements.
Author contributions
TG: Conceptualization, Data curation, Formal analysis, Validation, Writing – original draft, Investigation, Visualization. JD: Data curation, Formal analysis, Investigation, Validation, Visualization, Supervision, Writing – review & editing. VF: Formal analysis, Investigation, Supervision, Validation, Writing – review & editing, Conceptualization. GL: Formal analysis, Writing – review & editing, Data curation, Software, Visualization. RB: Formal analysis, Writing – review & editing, Investigation. KL-H: Formal analysis, Writing – review & editing, Conceptualization, Data curation, Funding acquisition, Resources, Supervision, Validation, Writing – original draft.
Funding
The author(s) declare financial support was received for the research, authorship, and/or publication of this article. KL-H received research support from the Deutsche Forschungsgemeinschaft (SFB-TR-128, projects A4 and A12, and LE 3079/3-1), the Hertie Foundation (MyLab program), and the US National Multiple Sclerosis Society (NMSS) (G-1508-07064).
Acknowledgments
The authors would like to thank Monika Pfaller, Francesca Romana de Frachis, Melina Pekic Hajdarbasic, Beatrix Lunk (all TUM) for excellent technical assistance. The authors acknowledge support from F. Hoffmann-La Roche for providing the anti-mouse CD20 antibody 18B12. RB is a fellow of the Hertie Foundation (medMS Doctoral Program). Sequencing was performed at the Helmholtz Zentrum München (HMGU) by the Genomics Core Facility.
Conflict of interest
KL-H has received research support to TUM from Novartis and honoraria and compensation for travel expenses from Novartis, FHLR, Biogen, Teva, Hexal, Bayer, and Merck Serono.
The remaining authors declare that the research was conducted in the absence of any commercial or financial relationships that could be constructed as a potential conflict of interest.
Publisher’s note
All claims expressed in this article are solely those of the authors and do not necessarily represent those of their affiliated organizations, or those of the publisher, the editors and the reviewers. Any product that may be evaluated in this article, or claim that may be made by its manufacturer, is not guaranteed or endorsed by the publisher.
Supplementary material
The Supplementary Material for this article can be found online at: https://www.frontiersin.org/articles/10.3389/fimmu.2024.1400641/full#supplementary-material
References
1. Hauser SL, Waubant E, Arnold DL, Vollmer T, Antel J, Fox RJ, et al. B-cell depletion with rituximab in relapsing-remitting multiple sclerosis. N Engl J Med. (2008) 358:676–88. doi: 10.1056/NEJMoa0706383
2. Hauser SL, Bar-Or A, Comi G, Giovannoni G, Hartung HP, Hemmer B, et al. Ocrelizumab versus interferon beta-1a in relapsing multiple sclerosis. N Engl J Med. (2017) 376:221–34. doi: 10.1056/NEJMoa1601277
3. Kappos L, Wolinsky JS, Giovannoni G, Arnold DL, Wang Q, Bernasconi C, et al. Contribution of relapse-independent progression vs relapse-associated worsening to overall confirmed disability accumulation in typical relapsing multiple sclerosis in a pooled analysis of 2 randomized clinical trials. JAMA Neurol. (2020) 77:1132–40. doi: 10.1001/jamaneurol.2020.1568
4. Montalban X, Hauser SL, Kappos L, Arnold DL, Bar-Or A, Comi G, et al. Ocrelizumab versus placebo in primary progressive multiple sclerosis. N Engl J Med. (2017) 376:209–20. doi: 10.1056/NEJMoa1606468
5. Serafini B, Rosicarelli B, Magliozzi R, Stigliano E, Aloisi F. Detection of ectopic B-cell follicles with germinal centers in the meninges of patients with secondary progressive multiple sclerosis. Brain Pathol. (2004) 14:164–74. doi: 10.1111/j.1750-3639.2004.tb00049.x
6. Magliozzi R, Howell O, Vora A, Serafini B, Nicholas R, Puopolo M, et al. Meningeal B-cell follicles in secondary progressive multiple sclerosis associate with early onset of disease and severe cortical pathology. Brain. (2007) 130:1089–104. doi: 10.1093/brain/awm038
7. Howell OW, Reeves CA, Nicholas R, Carassiti D, Radotra B, Gentleman SM, et al. Meningeal inflammation is widespread and linked to cortical pathology in multiple sclerosis. Brain. (2011) 134:2755–71. doi: 10.1093/brain/awr182
8. Lucchinetti CF, Popescu BF, Bunyan RF, Moll NM, Roemer SF, Lassmann H, et al. Inflammatory cortical demyelination in early multiple sclerosis. N Engl J Med. (2011) 365:2188–97. doi: 10.1056/NEJMoa1100648
9. Choi SR, Howell OW, Carassiti D, Magliozzi R, Gveric D, Muraro PA, et al. Meningeal inflammation plays a role in the pathology of primary progressive multiple sclerosis. Brain. (2012) 135:2925–37. doi: 10.1093/brain/aws189
10. Reali C, Magliozzi R, Roncaroli F, Nicholas R, Howell OW, Reynolds R. B cell rich meningeal inflammation associates with increased spinal cord pathology in multiple sclerosis. Brain Pathol. (2020) 30:779–93. doi: 10.1111/bpa.12841
11. Diddens J, Lepennetier G, Friedrich V, Schmidt M, Brand RM, Georgieva T, et al. Single-cell profiling indicates a proinflammatory role of meningeal ectopic lymphoid tissue in experimental autoimmune encephalomyelitis. Neurol Neuroimmunol Neuroinflamm. (2024) 11:e200185. doi: 10.1212/NXI.0000000000200185
12. Lehmann-Horn K, Wang SZ, Sagan SA, Zamvil SS, von Budingen HC. B cell repertoire expansion occurs in meningeal ectopic lymphoid tissue. JCI Insight. (2016) 1:e87234. doi: 10.1172/jci.insight.87234
13. Pikor NB, Prat A, Bar-Or A, Gommerman JL. Meningeal tertiary lymphoid tissues and multiple sclerosis: A gathering place for diverse types of immune cells during CNS autoimmunity. Front Immunol. (2015) 6:657. doi: 10.3389/fimmu.2015.00657
14. Jones GW, Jones SA. Ectopic lymphoid follicles: inducible centres for generating antigen-specific immune responses within tissues. Immunology. (2016) 147:141–51. doi: 10.1111/imm.12554
15. Greenfield AL, Dandekar R, Ramesh A, Eggers EL, Wu H, Laurent S, et al. Longitudinally persistent cerebrospinal fluid B cells can resist treatment in multiple sclerosis. JCI Insight. (2019) 4. doi: 10.1172/jci.insight.126599
16. Brand RM, Friedrich V, Diddens J, Pfaller M, Romana de Franchis F, Radbruch H, et al. Anti-CD20 depletes meningeal B cells but does not halt the formation of meningeal ectopic lymphoid tissue. Neurol Neuroimmunol Neuroinflamm. (2021) 8. doi: 10.1212/NXI.0000000000001012
17. Krishnamoorthy G, Lassmann H, Wekerle H, Holz A. Spontaneous opticospinal encephalomyelitis in a double-transgenic mouse model of autoimmune T cell/B cell cooperation. J Clin Invest. (2006) 116:2385–92. doi: 10.1172/JCI28330
18. Bettelli E, Baeten D, Jager A, Sobel RA, Kuchroo VK. Myelin oligodendrocyte glycoprotein-specific T and B cells cooperate to induce a Devic-like disease in mice. J Clin Invest. (2006) 116:2393–402. doi: 10.1172/JCI28334
19. Kinzel S, Lehmann-Horn K, Torke S, Hausler D, Winkler A, Stadelmann C, et al. Myelin-reactive antibodies initiate T cell-mediated CNS autoimmune disease by opsonization of endogenous antigen. Acta Neuropathol. (2016) 132:43–58. doi: 10.1007/s00401-016-1559-8
20. Martin Mdel P, Cravens PD, Winger R, Kieseier BC, Cepok S, Eagar TN, et al. Depletion of B lymphocytes from cerebral perivascular spaces by rituximab. Arch Neurol. (2009) 66:1016–20. doi: 10.1001/archneurol.2009.157
21. Zhou Y, Zhou B, Pache L, Chang M, Khodabakhshi AH, Tanaseichuk O, et al. Metascape provides a biologist-oriented resource for the analysis of systems-level datasets. Nat Commun. (2019) 10:1523. doi: 10.1038/s41467-019-09234-6
22. Hametner S, Wimmer I, Haider L, Pfeifenbring S, Bruck W, Lassmann H. Iron and neurodegeneration in the multiple sclerosis brain. Ann Neurol. (2013) 74:848–61. doi: 10.1002/ana.23974
23. Marty MC, Alliot F, Rutin J, Fritz R, Trisler D, Pessac B. The myelin basic protein gene is expressed in differentiated blood cell lineages and in hemopoietic progenitors. Proc Natl Acad Sci U.S.A. (2002) 99:8856–61. doi: 10.1073/pnas.122079599
24. Zhou Y, Simpson S Jr., Charlesworth JC, van der Mei I, Lucas RM, Ponsonby AL, et al. Variation within MBP gene predicts disease course in multiple sclerosis. Brain Behav. (2017) 7:e00670. doi: 10.1002/brb3.670
25. Naneh O, Avcin T, Bedina Zavec A. Perforin and human diseases. Subcell Biochem. (2014) 80:221–39. doi: 10.1007/978-94-017-8881-6_11
26. Zhang HL, Wu J, Zhu J. The immune-modulatory role of apolipoprotein E with emphasis on multiple sclerosis and experimental autoimmune encephalomyelitis. Clin Dev Immunol. (2010) 2010:186813. doi: 10.1155/2010/186813
27. Bonacina F, Coe D, Wang G, Longhi MP, Baragetti A, Moregola A, et al. Myeloid apolipoprotein E controls dendritic cell antigen presentation and T cell activation. Nat Commun. (2018) 9:3083. doi: 10.1038/s41467-018-05322-1
28. Tenger C, Zhou X. Apolipoprotein E modulates immune activation by acting on the antigen-presenting cell. Immunology. (2003) 109:392–7. doi: 10.1046/j.1365-2567.2003.01665.x
29. Gilchrist M, Henderson WR Jr., Morotti A, Johnson CD, Nachman A, Schmitz F, et al. A key role for ATF3 in regulating mast cell survival and mediator release. Blood. (2010) 115:4734–41. doi: 10.1182/blood-2009-03-213512
30. Katagiri T, Kameda H, Nakano H, Yamazaki S. Regulation of T cell differentiation by the AP-1 transcription factor JunB. Immunol Med. (2021) 44:197–203. doi: 10.1080/25785826.2021.1872838
31. Cunatova K, Reguera DP, Houstek J, Mracek T, Pecina P. Role of cytochrome c oxidase nuclear-encoded subunits in health and disease. Physiol Res. (2020) 69:947–65. doi: 10.33549/physiolres
32. Iwasaki Y, Takeshima Y, Fujio K. Basic mechanism of immune system activation by mitochondria. Immunol Med. (2020) 43:142–7. doi: 10.1080/25785826.2020.1756609
33. Zahoor I, Haq E, Asimi R. Multiple sclerosis and EIF2B5: A paradox or a missing link. Adv Exp Med Biol. (2017) 958:57–64. doi: 10.1007/978-3-319-47861-6_5
34. Tsubaki H, Tooyama I, Walker DG. Thioredoxin-interacting protein (TXNIP) with focus on brain and neurodegenerative diseases. Int J Mol Sci. (2020) 21. doi: 10.3390/ijms21249357
35. Metkar SS, Menaa C, Pardo J, Wang B, Wallich R, Freudenberg M, et al. Human and mouse granzyme A induce a proinflammatory cytokine response. Immunity. (2008) 29:720–33. doi: 10.1016/j.immuni.2008.08.014
36. Vyshkina T, Sylvester A, Sadiq S, Bonilla E, Perl A, Kalman B. CCL genes in multiple sclerosis and systemic lupus erythematosus. J Neuroimmunol. (2008) 200:145–52. doi: 10.1016/j.jneuroim.2008.05.016
37. Zhang X, Chen L, Dang WQ, Cao MF, Xiao JF, Lv SQ, et al. CCL8 secreted by tumor-associated macrophages promotes invasion and stemness of glioblastoma cells via ERK1/2 signaling. Lab Invest. (2020) 100:619–29. doi: 10.1038/s41374-019-0345-3
38. Gururajan M, Simmons A, Dasu T, Spear BT, Calulot C, Robertson DA, et al. Early growth response genes regulate B cell development, proliferation, and immune response. J Immunol. (2008) 181:4590–602. doi: 10.4049/jimmunol.181.7.4590
39. Shang Z, Sun W, Zhang M, Xu L, Jia X, Zhang R, et al. Identification of key genes associated with multiple sclerosis based on gene expression data from peripheral blood mononuclear cells. PeerJ. (2020) 8:e8357. doi: 10.7717/peerj.8357
40. Shi H, Sheng B, Zhang C, Nayak L, Lin Z, Jain MK, et al. Myeloid Kruppel-like factor 2 deficiency exacerbates neurological dysfunction and neuroinflammation in a murine model of multiple sclerosis. J Neuroimmunol. (2014) 274:234–9. doi: 10.1016/j.jneuroim.2014.06.023
41. Zatsepina OG, Evgen'ev MB, Garbuz DG. Role of a heat shock transcription factor and the major heat shock protein hsp70 in memory formation and neuroprotection. Cells. (2021) 10. doi: 10.3390/cells10071638
42. Lechner P, Buck D, Sick L, Hemmer B, Multhoff G. Serum heat shock protein 70 levels as a biomarker for inflammatory processes in multiple sclerosis. Mult Scler J Exp Transl Clin. (2018) 4:2055217318767192. doi: 10.1177/2055217318767192
43. de Graaf MT, de Jongste AH, Kraan J, Boonstra JG, Sillevis Smitt PA, Gratama JW. Flow cytometric characterization of cerebrospinal fluid cells. Cytometry B Clin Cytom. (2011) 80:271–81. doi: 10.1002/cyto.b.20603
44. Eggers EL, Michel BA, Wu H, Wang SZ, Bevan CJ, Abounasr A, et al. Clonal relationships of CSF B cells in treatment-naive multiple sclerosis patients. JCI Insight. (2017) 2. doi: 10.1172/jci.insight.92724
45. Lehmann-Horn K, Kinzel S, Feldmann L, Radelfahr F, Hemmer B, Traffehn S, et al. Intrathecal anti-CD20 efficiently depletes meningeal B cells in CNS autoimmunity. Ann Clin Trans Neurol. (2014) 1:490–6. doi: 10.1002/acn3.71
46. Ochs J, Nissimov N, Torke S, Freier M, Grondey K, Koch J, et al. Proinflammatory CD20(+) T cells contribute to CNS-directed autoimmunity. Sci Transl Med. (2022) 14:eabi4632. doi: 10.1126/scitranslmed.abi4632
47. Lehmann-Horn K, Schleich E, Hertzenberg D, Hapfelmeier A, Kumpfel T, von Bubnoff N, et al. Anti-CD20 B-cell depletion enhances monocyte reactivity in neuroimmunological disorders. J Neuroinflamm. (2011) 8:146. doi: 10.1186/1742-2094-8-146
48. Stuve O, Cepok S, Elias B, Saleh A, Hartung HP, Hemmer B, et al. Clinical stabilization and effective B-lymphocyte depletion in the cerebrospinal fluid and peripheral blood of a patient with fulminant relapsing-remitting multiple sclerosis. Arch Neurol. (2005) 62:1620–3. doi: 10.1001/archneur.62.10.1620
49. Cross AH, Stark JL, Lauber J, Ramsbottom MJ, Lyons JA. Rituximab reduces B cells and T cells in cerebrospinal fluid of multiple sclerosis patients. J Neuroimmunol. (2006) 180:63–70. doi: 10.1016/j.jneuroim.2006.06.029
Keywords: multiple sclerosis, single-cell sequencing, experimental autoimmune encephalomyelitis, B cells, anti-CD20 treatment, ectopic lymphoid tissue
Citation: Georgieva T, Diddens J, Friedrich V, Lepennetier G, Brand RM and Lehmann-Horn K (2024) Single-cell profiling indicates a high similarity between immune cells in the cerebrospinal fluid and in meningeal ectopic lymphoid tissue in experimental autoimmune encephalomyelitis. Front. Immunol. 15:1400641. doi: 10.3389/fimmu.2024.1400641
Received: 13 March 2024; Accepted: 08 May 2024;
Published: 12 June 2024.
Edited by:
Philipp Albrecht, Heinrich Heine University of Düsseldorf, GermanyReviewed by:
Martin S. Weber, University Medical Center Göttingen, GermanyVeit Rothhammer, Department of Neurology University Hospital FAU Erlangen Nuernberg, Germany
Copyright © 2024 Georgieva, Diddens, Friedrich, Lepennetier, Brand and Lehmann-Horn. This is an open-access article distributed under the terms of the Creative Commons Attribution License (CC BY). The use, distribution or reproduction in other forums is permitted, provided the original author(s) and the copyright owner(s) are credited and that the original publication in this journal is cited, in accordance with accepted academic practice. No use, distribution or reproduction is permitted which does not comply with these terms.
*Correspondence: Klaus Lehmann-Horn, a2xhdXMubGVobWFubi1ob3JuQHR1bS5kZQ==
†Present addresses: Jolien Diddens, Department of Behavioural Neurobiology, Max Planck Institute for Biological Intelligence, Seewiesen, Germany Verena Friedrich, Institute of Medical Microbiology, Immunology and Hygiene, TUM School of Medicine and Health, Technical University of Munich, Munich, Germany
‡These authors have contributed equally to this work