 Sarah Alice Long1*
 Virginia S. Muir2
 Britta E. Jones1
 Valerie Z. Wall1Alyssa Ylescupidez3
 Anne M. Hocking1Stephan Pribitzer2Jerill Thorpe1Bryce Fuchs1
 Alice E. Wiedeman1Megan Tatum1
 Katharina Lambert1Hannes Uchtenhagen1
 Cate Speake3Bernard Ng4,5,6Alexander T. Heubeck7
 Troy R. Torgerson7
 Adam K. Savage7
 Michael A. Maldonado8Neelanjana Ray8Vadim Khaychuk8Jinqi Liu8
 Peter S. Linsley2
 Jane H. Buckner1*
- 1Center for Translational Immunology, Benaroya Research Institute at Virginia Mason, Seattle, WA, United States
- 2Center for Systems Immunology, Benaroya Research Institute at Virginia Mason, Seattle, WA, United States
- 3Center for Interventional Immunology, Benaroya Research Institute at Virginia Mason, Seattle, WA, United States
- 4VA National Rheumatology Program, Specialty Care Program Office, Washington, DC, United States
- 5Rheumatology Section, VA Puget Sound Health Care System, Seattle, WA, United States
- 6Department of Medicine, Division of Rheumatology, University of Washington, Seattle, WA, United States
- 7Allen Institute for Immunology, Seattle, WA, United States
- 8Bristol Myers Squibb, Princeton, NJ, United States
Exhausted CD8 T cells (TEX) are associated with worse outcome in cancer yet better outcome in autoimmunity. Building on our past findings of increased TIGIT+KLRG1+ TEX with teplizumab therapy in type 1 diabetes (T1D), in the absence of treatment we found that the frequency of TIGIT+KLRG1+ TEX is stable within an individual but differs across individuals in both T1D and healthy control (HC) cohorts. This TIGIT+KLRG1+ CD8 TEX population shares an exhaustion-associated EOMES gene signature in HC, T1D, rheumatoid arthritis (RA), and cancer subjects, expresses multiple inhibitory receptors, and is hyporesponsive in vitro, together suggesting co-expression of TIGIT and KLRG1 may broadly define human peripheral exhausted cells. In HC and RA subjects, lower levels of EOMES transcriptional modules and frequency of TIGIT+KLRG1+ TEX were associated with RA HLA risk alleles (DR0401, 0404, 0405, 0408, 1001) even when considering disease status and cytomegalovirus (CMV) seropositivity. Moreover, the frequency of TIGIT+KLRG1+ TEX was significantly increased in RA HLA risk but not non-risk subjects treated with abatacept (CTLA4Ig). The DR4 association and selective modulation with abatacept suggests that therapeutic modulation of TEX may be more effective in DR4 subjects and TEX may be indirectly influenced by cellular interactions that are blocked by abatacept.
Introduction
Chronic antigen exposure leads to the progressive differentiation of exhausted CD8 T cells (TEX) that are functionally, transcriptionally, and epigenetically distinct from effector CD8 T cells (1). TEX progressively lose inflammatory cytokine production from precursor and early TEX states to terminal states. This loss of pro-inflammatory function is mediated, in part, by constitutive expression of multiple inhibitory receptors (e.g., PD-1, TIGIT, TIM3). In cancer and chronic viral settings, where lytic properties of CD8 T cells are required to clear the tumor or virus, an increase in TEX abundance that are terminally dysfunctional is associated with worse outcome (2). Likewise, a greater abundance of TEX in cancer is associated with worse outcome and progression can be reversed by therapeutically depleting terminal TEX or reinvigorating early TEX with checkpoint inhibitors (3–5).
Although autoimmunity may involve chronic antigen exposure like cancer and chronic viral infections, less is known about TEX in the context of autoimmune disease (6, 7). As opposed to reduced TEX being beneficial in cancer, reduced TEX has been associated with disease progression and increased severity in some autoimmune diseases including systemic lupus erythematosus (SLE), antineutrophil cytoplasmic antibody-associated vasculitis, and type 1 diabetes (T1D) (8–11). Conversely, elevated TEX has been associated with better response to therapy in individuals with autoimmune disease; Specifically, elevated TEX following treatment of T1D was associated with better response to two T cell targeted therapies, teplizumab (anti-CD3) (12, 13) and alefacept (LFA3Ig) (14). TEX levels do not differ at baseline, but the TEX that expand following therapy in T1D co-express inhibitory receptors including TIGIT, PD-1, and KLRG1, and share an EOMES gene signature that overlaps with exhaustion and differs from senescence (14), suggesting an exhausted-like phenotype (12, 13). Despite these findings, it remains to be determined whether TEX are qualitatively similar across diseases and which factors may contribute to variation in TEX levels across subjects. This lack of clarity is due, in part, to variability in the measures used to define TEX across studies and disease specific variability in co-factors that contribute to TEX.
In this current study, we address these gaps in knowledge by leveraging existing cross-sectional and longitudinal cohorts as well as existing datasets from recent clinical trials. Comparison across cohorts was facilitated by defining a broad and common human peripheral blood TEX population that co-expresses the inhibitory receptors TIGIT and KLRG1 and is associated with an EOMES transcriptional signature. Looking across studies, we determined that the frequency of TIGIT+KLRG1+ TEX is influenced by a genetic component. Specifically, reduced TEX frequencies are associated with the human leukocyte antigen (HLA) class II alleles DRB1*0401, 0404, 0405, 0408, and 1001 associated with risk of RA in both healthy individuals and individuals with RA. Moreover, this relationship was also evident in the setting of clinical trials where TIGIT+KLRG1+ TEX selectively increased in individuals carrying RA HLA risk alleles but not in carriers of non-risk alleles after treatment with abatacept (CTLA4Ig). Together these data suggest that HLA or linked genes contribute to the level of TEX in a manner that is modulated by abatacept.
Methods
Ethics statement
All subjects in the longitudinal healthy control cohort and the whole blood RNA-seq cohort gave written informed consent in accordance with the Declaration of Helsinki, the IRB-approved protocols at the Benaroya Research Institute at Virginia Mason (IRB07109), and the VA Puget Sound Health Care System (MIRB#00755). The clinical trial cohorts were approved by independent IRBs at each participating clinical site, as described in the original clinical trial reports (15–17). Participants in each of these trials also provided informed consent prior to participation.
Study design
The phenotype, frequency, function, and modulation of TEX were assessed using complementary assays and cohorts (Supplementary Figure 1, Table 1). Cross-sectional samples were used from T1D, RA, and renal cancer carcinoma (RCC) patients with age- and sex-matched health controls (HC). Longitudinal samples were analyzed from HC subjects and published clinical trials (15, 17, 18). Whole blood transcriptional analyses were performed from tempus tube collections. For all cellular analyses, peripheral blood mononuclear cells (PBMCs) were isolated from whole blood and cryopreserved until used. Additional transcriptional analyses were performed on sorted populations from PBMCs. When assessing the influence of age on TEX in HCs, male and female subjects were selected for even representation across all ages. All assays were run and analyzed in a blinded manner, and staining batches included an internal control.
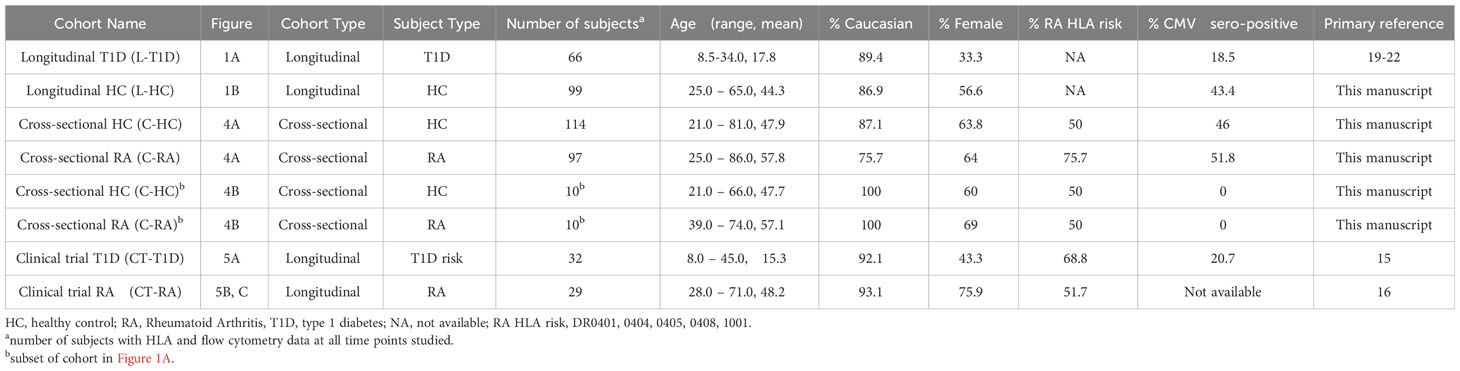
Table 1 Longitudinal and clinical cohorts.
Cohort descriptions
Table 1 lists cohorts used in this study, including demographics, percentage of RA HLA risk carriers and percentage of cytomegalovirus (CMV)-seropositive subjects. The longitudinal T1D cohort in Figure 1A consisted of 66 subjects with recent onset T1D who were placebo arms of Immune Tolerance Network and TrialNet trials (19–22). The longitudinal HC cohort in Figure 1B consisted of 99 HC subjects with no personal or family history of autoimmune disease who were recruited through the Sound Life Project led by the Benaroya Research Institute (BRI) in partnership with the Allen Institute for Immunology. The cross-sectional HC, T1D, and RCC cohorts in Figure 2 were from the BRI Registry and Repository; the HC had no personal history or first-degree relatives with autoimmune disease. The cross-sectional HC cohort in Figure 3F consisted of 30 individuals who had no personal history or first-degree relatives with autoimmune disease who were recruited through the BRI Registry and Repository. The whole blood RNA-seq cohort in Figure 4A is a cross-sectional cohort consisting of 97 seropositive RA subjects and 114 HC subjects matched for age, sex, and race. The RA subjects carried a diagnosis of RA based on the 2010 American College of Rheumatology criteria, were positive for ACPA and were recruited from the Virginia Mason Medical Center and the VA Puget Sound Health Care System. HC subjects had no first-degree relatives with autoimmune disease and were recruited through the BRI Registry and Repository. The clinical trial cohort in Figure 5A was from the teplizumab (anti-CD3) trial in individuals at risk for T1D conducted by the Type 1 Diabetes TrialNet (15) and consisted of 32 subjects. The clinical trial cohort in Figures 5B, C was from the Early AMPLE trial (16) and consisted of 29 individuals with new onset RA.
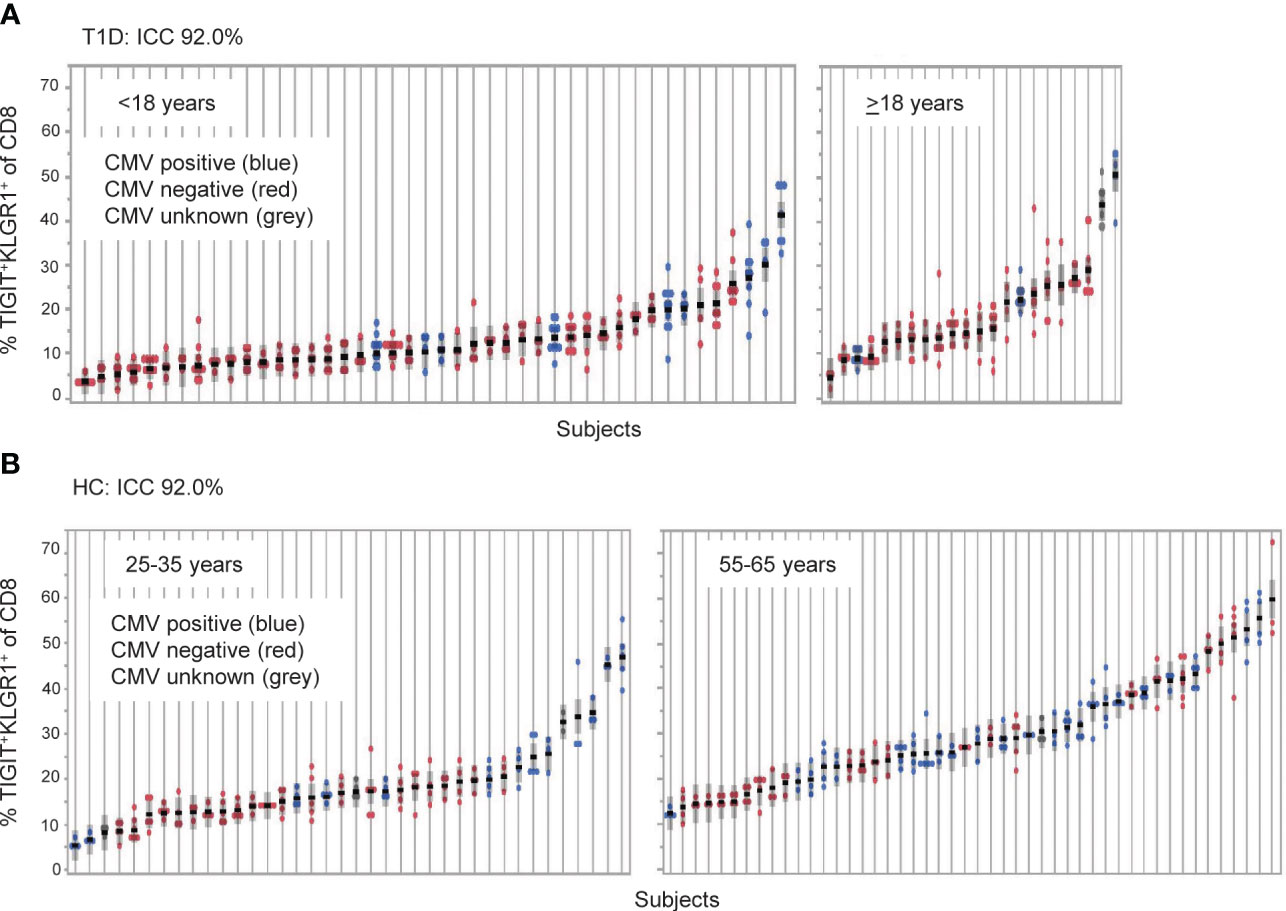
Figure 1 TIGIT+KLRG1+ CD8 T cells are a stable cell type that varies across individuals. TIGIT+KLRG1+ CD8 T cells were measured by flow cytometry in longitudinal samples from (A) Individuals with type 1 diabetes (T1D; n = 66) and (B) healthy control subjects (HC; n = 99). T1D samples were collected at 6-month intervals over 2 years. HC samples were collected over a median of 8.7 months (inter-quartile range 7.2 to 14.2). Multiple samples (data points) isolated from individual subjects, each shown on a line, are graphed for both cohorts. Individuals are ordered by mean % TIGIT+KRLG1+ and annotated for CMV seropositivity by color. ICC, Intraclass correlation coefficient.
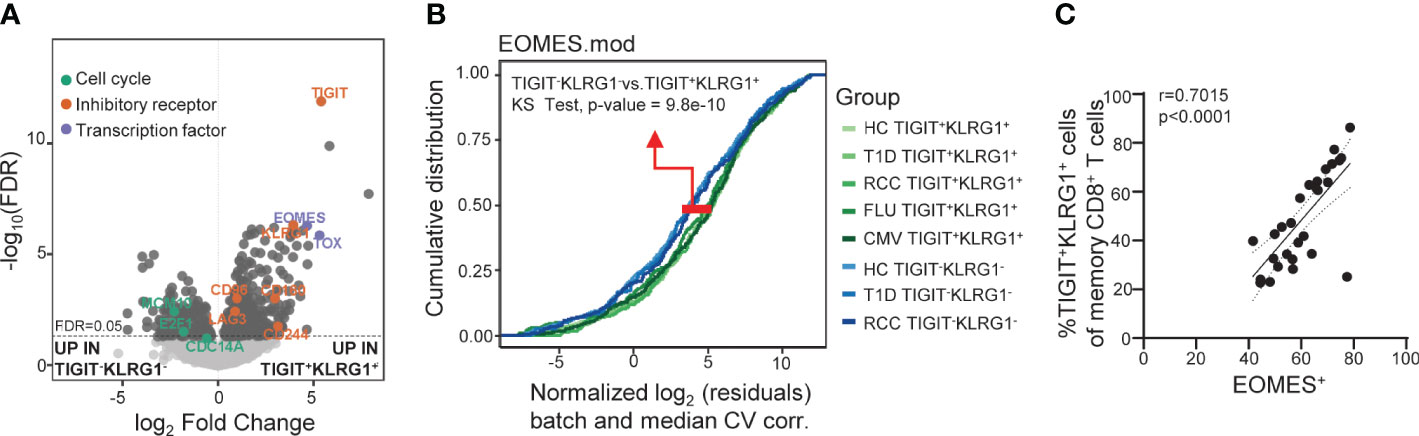
Figure 2 Across disease settings, co-expression of TIGIT and KLRG1 marks memory CD8 T cells with an EOMES-associated transcriptional signature. (A) Bulk RNA-seq data from sorted TIGIT+KLRG1+ and TIGIT-KLRG1- CD8 memory (not CD45RA+CCR7+ naïve) T cells isolated from healthy control subjects (HC) (n = 4) following 16-hour anti-CD3/CD28 stimulation. Selected markers of cell cycle, inhibitory receptor and transcription factor expression are annotated. (B) Comparison of sorted TIGIT+KLRG1+ and TIGIT-KLRG1- memory CD8+ T cells across multiple disease settings: age- and gender-matched HC; type 1 diabetes (T1D); renal cell carcinoma (RCC); cytomegalovirus infection (CMV-pentamer positive cells); and influenza infection (FLU-pentamer positive cells). (C) Correlation of EOMES protein expression and TIGIT+KLRG1+ in memory (not CD45RA+CCR7+ naïve) CD8 T cells in HC (n = 29), Spearman test with 95% confidence interval (dotted lines). Gating for sorts and analyses are shown in Supplementary Figure 2.
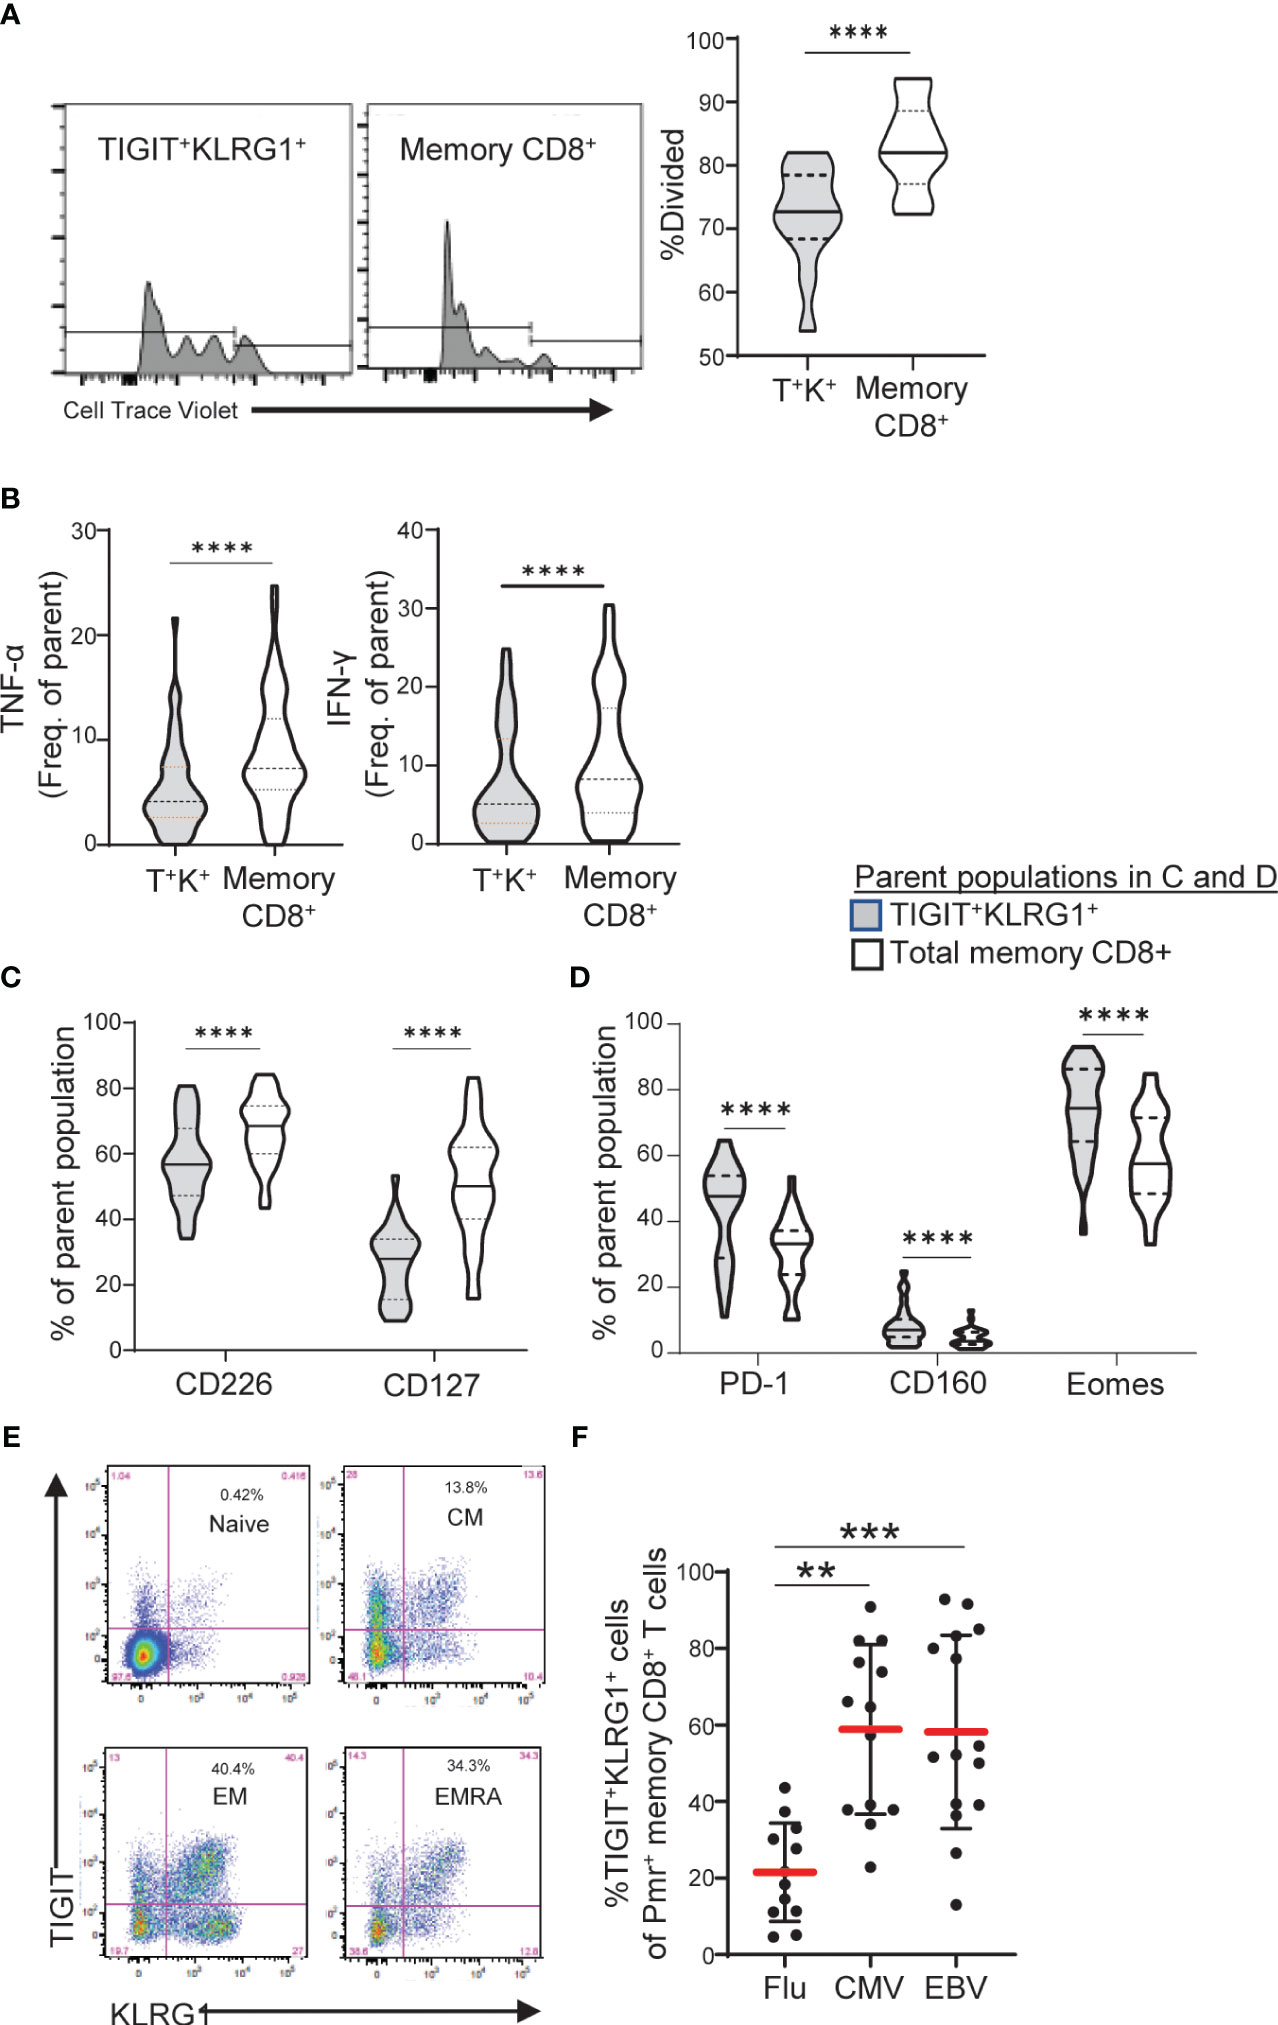
Figure 3 TIGIT+KLRG1+ memory CD8 T cells are dysfunctional in healthy control subjects and increased in terminal cell subsets and chronic viral reactive cells. (A) Proliferation following 3-day anti-CD3/CD28 stimulation of TIGIT+KLRG1+ (T+K+) memory cells relative to total memory CD8+ T cells from healthy control (HC) subjects (n = 12). Proliferation of memory CD45RO+ cells was measured by percentage of divided cells using a flow cytometry dye dilution assay. (B) Pro-inflammatory cytokine production (TNF-α and IFN-γ) following 24-hour anti-CD3/CD28 stimulation by gated T+K+ memory cells relative to total memory CD8+ T cells in HC subjects (n = 56). Cytokine production was measured by intracellular cytokine staining. (C) Effector cell surface marker expression (CD226 and CD127) and (D) Inhibitory receptor expression in the absence of T cell activation in gated T+K+ cells relative to total memory CD8+ T cells from HC subjects (n = 28). Wilcoxon matched-pairs signed-rank test was used in all comparisons. (E) Distribution of TIGIT+KLRG1+ cells within naïve (CD45RO-CCR7+), central memory (CM: CD45RO+CCR7+), effector memory (EM: CD45RO+CCR7-) and RA+ effector memory (EMRA: CD45RO-CCR7-). One representative HC sample shown from C. (F) TIGIT+KLRG1+ distribution in a subset of HLA-A2 subjects stained with Flu-, CMV- and EBV-specific Class I Pentamer (Pmr). Kruskal-Wallis test with Dunn’s correction for multiple tests. Gating for memory TIGIT+KLRG1+ is shown in Supplementary Figure 2, gating for activating and inhibitory markers is shown in Supplementary Figure 4. **=0.05, ***=0.005, ****=0.0005 p-values.
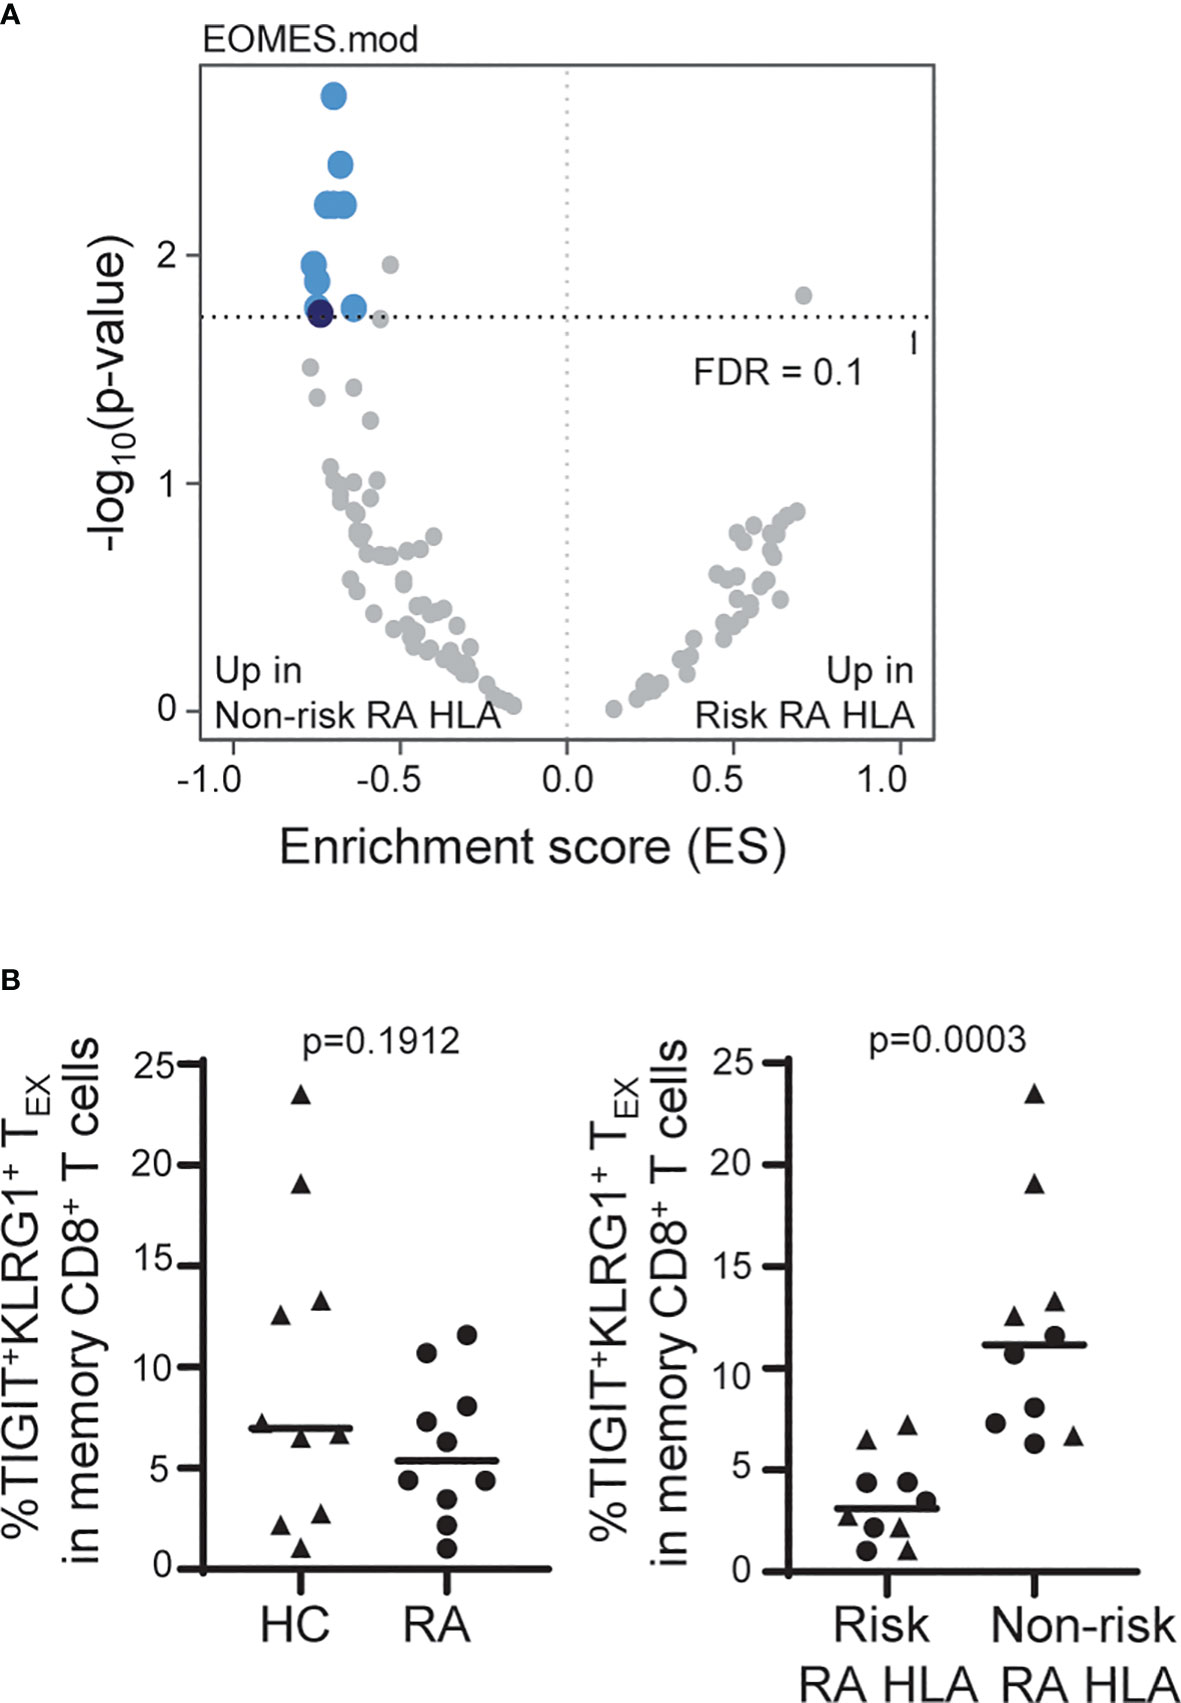
Figure 4 The frequency of TIGIT+KLRG1+ TEX is influenced by RA HLA risk alleles. (A) Whole blood RNA-seq data of age- and sex-matched HC (n = 114) and RA (n = 97) subjects were parsed by RA-associated HLA risk genotype (DRB1*0401, 0404, 0405, 0408, 1001). Dark blue, EOMES module; light blue, EOMES module overlap; gray, no overlap with EOMES module. (B) Frequency of TIGIT+KLRG1+ memory CD8 T cells in age- and sex-matched HC and RA subjects (n = 10/cohort) selected for top or bottom tercile EOMES signature: Left, HC versus RA; Right, Risk RA HLA versus non-risk RA HLA. Mann-Whitney test. Gating shown in Supplementary Figure 2.
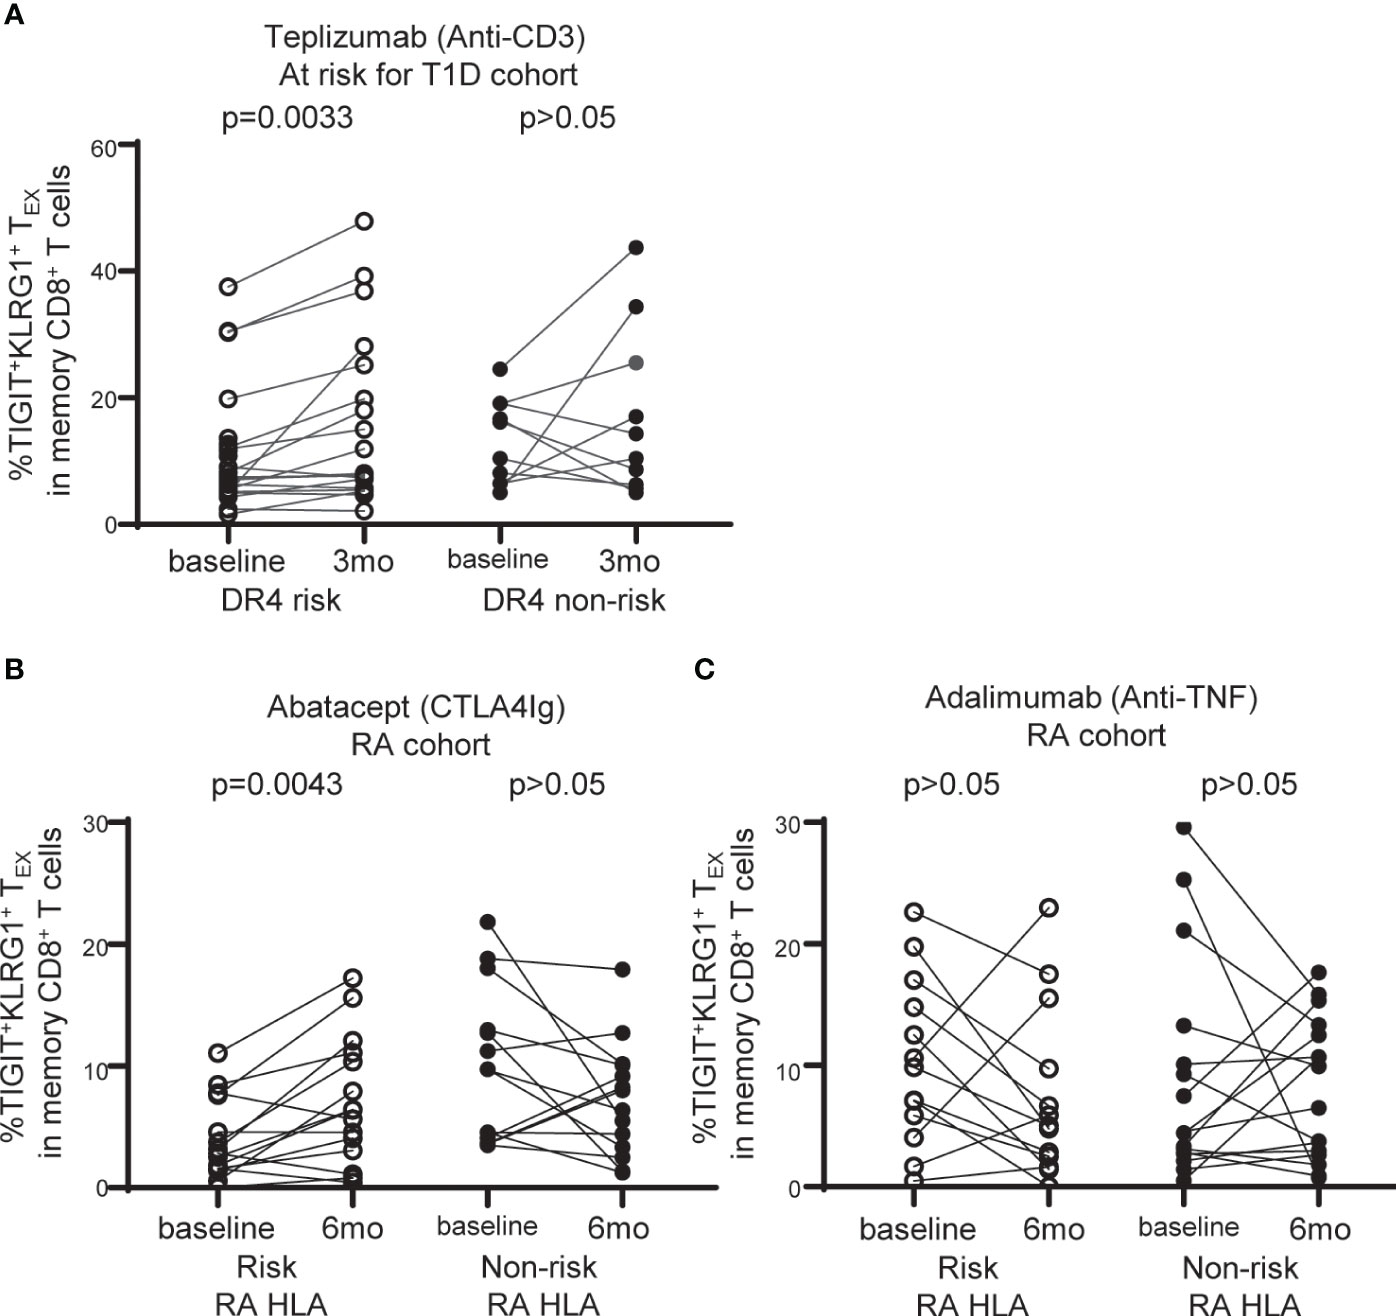
Figure 5 TIGIT+KLRG1+TEX are selectively increased with abatacept therapy in RA subjects carrying RA HLA risk alleles. (A) Frequency of TIGIT+KLRG1+ TEX in memory CD8+ T cell compartment in individuals at risk for T1D treated with teplizumab (anti-CD3) stratified by DR4 risk and DR4 non-risk. (B) Frequency of TIGIT+KLRG1+ TEX in memory CD8+ T cell compartment in individuals with new onset rheumatoid arthritis (RA) treated with abatacept (CTLA4-Ig) stratified by risk RA HLA and non-risk RA HLA. (C) Frequency of TIGIT+KLRG1+ TEX in memory CD8+ T cell compartment in individuals with new onset RA adalimumab (anti-TNF) stratified by risk RA HLA and non-risk RA HLA. In B and C, risk RA HLA carried either DRB1*0401, 0404, 0405, 0408, or 1001 and non-risk RA HLA did not. In all three trials, age and CMV status (where available) did not differ between HLA groups. Wilcoxon matched-pairs signed-rank test was used for each risk group in all studies. Gating shown in Supplementary Figure 2.
Transcriptional analyses of CD8 cell subsets
PBMCs from subjects with T1D, RA, RCC and age/gender-matched HC were stimulated with antibodies against CD3 (1 µg/ml plate-bound, UCHT1) and CD28 (2 µg/ml plate-bound, CD28.2) for 16 hours with and sorted for memory (CD45RO+) CD8 T cells that either co-expressed KLRG1 and TIGIT or lacked both markers as a comparison population using the cell sorting panel (Supplementary Table 1). Sytox Green (1:1000, Invitrogen) was added to samples prior to acquisition to differentiate dead cells. For comparisons across cells of differing antigen specificities, cells from HC were enriched for CD8 T cells following the 16-hour stimulation protocol, then stained with Class I pentamer to identify CMV, Epstein-Bar Virus (EBV), and Flu antigens (Supplementary Table 1) as described below.
The indicated populations were sorted directly into SMARTer v3 or SMARTseq v4 lysis reagents (Clontech). Cells were lysed and cDNA was synthesized. After amplification, sequencing libraries were prepared using the Nextera XT DNA Library Preparation Kit (Illumina) according to C1 protocols (Fluidigm). Barcoded libraries were pooled and quantified using a Qubit® Fluorometer (Life Technologies). Single-read sequencing of the pooled libraries was carried out on a HiSeq2500 sequencer (Illumina) for 74 cycles, using TruSeq v3 or v4, and SBS kits (Illumina). Target read depths were ~5-10 million raw reads per sample.
Characterization of T cell activation/exhaustion by flow cytometry
Supplementary Table 1 lists antibodies used for each flow cytometry panel, including target, fluorophore, clone, and manufacturer. For assessment of cytokines, cells were treated with anti-CD3 (1 µg/ml plate-bound, OKT3) and anti-CD28 (2 µg/ml plate-bound, CD28.2) for 24 hours or Phorbol-Myristate-Acetate (PMA, Sigma) and Ionomycin (I, Sigma) for 6 hours and Brefeldin A (BioLegend) and Monensin (BioLegend) were each added at 1X for the last 4 hours. Dead cells were detected (Zombie NIR Kit, BioLegend), surface markers were added in brilliant stain buffer (BD Biosciences) for 20 minutes at RT and intracellular markers were detected (30 minutes RT) following permeabilization (FoxP3/Transcription factor staining buffer set, eBioscience, 30 minutes at 4°C). For assessment of antigen-specific phenotype, cells were enriched for CD8 T cells using negative selection (CD8+ T cell isolation Kit, Miltenyi) and incubated with dasatinib (50 nM, 250 µl/2 million cells, LC Laboratories) for 8-10 minutes at 37°C prior to staining with 25 µL solution containing 1.5 µL of commercially obtained Class I pentamer (ProImmune) for 15 minutes at 37°C, followed by surface marker detection in the T1D antigen-specific panel (Supplementary Figure 2).
Cell tracking assay
PBMCs were labeled (Cell Trace Violet, Invitrogen), stained with surface markers of the cell sorting panel (Supplementary Table 1, Supplementary Figure 3) and Sytox Green to differentiate dead cells (1:1000, Invitrogen). PBMCs were sorted using a BD Aria II until 3-5 × 10³ CD8 T cells were obtained per condition which co-expressed KLRG1 and TIGIT or lacked both markers. Sorted cells were mixed back into whole PBMCs from the same subject and stimulated with anti-CD3 (1 µg/ml plate-bound, UCHT1). Percent divided were assessed in labeled cells using FlowJo proliferation modeling. Labeled cells were also assessed for changes in KLRG1 and TIGIT expression following stimulation (% Stable = purity of labeled population following stimulation/purity of labeled population at baseline × 100).
Whole blood RNA-sequencing
RNA isolation, RNA-seq, and pipeline analyses including differential expression (Limma-Voom) and protein-protein networks were performed as described previously (23).
Single nucleotide polymorphisms association analysis
Whole blood libraries from the 211 HC and RA subjects in Figure 4A were TMM normalized and batch corrected for age, percent lymphocytes and percent duplication, a quality metric associated with PC1. SNPs were generated with an Affymetrix Axiom PMRA chip and single nucleotide polymorphisms (SNPs) on chromosome six (containing the HLA region) were selected for study. SNPs exhibiting little variance or frequent missing genotypes were removed from the analysis. The most significant DRB1*04 associated SNP (rs72492350) and an unassociated SNP (Chr6:32183175) were used as phenotypes in separate GSEA analyses (24) with 100-gene modules (25).
Statistical analyses
A linear mixed-effects model with a random effect for subject was used to calculate intraclass correlation coefficient (ICC), which quantifies the proportion of biomarker variation that is within and between subjects. Age and CMV seropositivity were added as covariates to investigate their association with biomarker frequency. Summary statistics include mean, range, median, and inter-quartile range; 95% confidence intervals are reported where appropriate. Spearman’s correlation coefficients were used for associations, Kolmogorov-Smirnov tests were used for cumulative distribution comparisons, Wilcoxon matched-pairs signed-rank tests were used for paired comparisons, and Mann-Whitney test was used for unpaired comparisons while a Kruskal-Wallis test with Dunn’s correction for multiple tests was used for multiple unpaired comparisons. All P values < 0.05 were considered significant.
Results
The frequency of TIGIT+KLRG1+ TEX varies more across than within subjects
We previously reported that co-expression of TIGIT and KLRG1 marked CD8+ T cells that had phenotypic and functional features of exhaustion, including an EOMES signature, and that these cells expanded following teplizumab (anti-CD3) therapy in individuals with T1D (12, 13). To address variation of TIGIT+KLRG1+ CD8 T cells in the absence of therapy, we first investigated the stability of these cells in vivo in a T1D cohort (Table 1, Supplementary Figure 1) measuring the proportion of TIGIT+KLRG1+ CD8+ T cells at multiple time points over two years (Figure 1A). We found that the frequency of TIGIT+KLRG1+ CD8 T cells varied little within T1D subjects over two years (mean within-subject range 8.2% [95% CI: 6.9-9.5]) but varied greatly between T1D subjects with a mean frequency range of 2.9% to 50.6%. To confirm that this stability is not unique to T1D, we measured the proportion of TIGIT+KLRG1+ CD8+ T cells at multiple time points over two years in a HC cohort (Table 1, Figure 1B). We found that the frequency of TIGIT+KLRG1+ CD8 T cells also varied little within HC over time (mean within-subject range 6.5% [95% CI: 5.6-7.4]) while the mean frequency ranged from 4.2 to 59.8%. Lack of variation within subjects is supported by high intraclass correlation coefficient (ICC) values (83.7% and 92.0%, respectively), a measure comparing variability within versus across subjects.
A known contributor to increased T cell exhaustion in an individual is age and chronic viral infection (1). In both the HC and T1D cohorts (Figure 1), increasing years of age (effect of 0.32 [95% CI: 0.20, 0.45], P = <0.0001) and CMV seropositivity (effect of 3.67 [95% CI: 2.06, 5.28], P = <0.0001) were significantly associated with TIGIT+KLRG1+ CD8 T cell frequency in a linear mixed-effects model. However, disease status did not have a significant effect (P = 0.65, fixed effect test) and variance contributed by age and CMV status were significant but not robust (age effect, 0.32, CMV effect, 3.67) suggesting that other factors also contribute to TIIGT+KLRG1+ variation across subjects.
We also investigated the stability of TIGIT+KLRG1+ TEX in vitro using an in vitro assay system designed to track the frequency of TIGIT+KLRG1+ TEX cells that maintain co-expression of TIGIT and KLRG1 upon activation. Specifically, memory TIGIT+KLRG1+ cells were sorted and labelled with a cell trace dye to identify them as TIGIT+KLRG1+ prior to activation. Sorted cells were then mixed with autologous PBMCs before activation with anti-CD3/anti-CD28 antibodies (Supplementary Figure 3A). Labelled cells were monitored over time for maintenance of TIGIT and KLRG1 expression. Measuring maintenance of this phenotype, we found that TIGIT+KLRG1+ CD8 T cells were stable for 8 days following anti-CD3/CD28 activation (Supplementary Figure 3B).
TIGIT and KLRG1 co-expression marks EOMES+CD8+ TEX across human diseases
We previously reported that co-expression of TIGIT and KLRG1 marked CD8+ T cells that had phenotypic and functional features of exhaustion, including an EOMES signature, and that these cells expanded following teplizumab (anti-CD3) therapy in individuals with T1D (12–14). To expand the functional characterization of TIGIT+KLRG1+ CD8 T cells in the absence of therapy, we compared the transcriptome of TIGIT+KLRG1+ memory CD8+ T cells and TIGIT-KLRG1- memory CD8+ T cells from HC. Similar to our previous finding in the setting of T1D and immunotherapy (12), TIGIT+KLRG1+ memory CD8+ T cells had increased expression of T cell exhaustion markers including the transcription factor TOX and inhibitory receptors (i.e., LAG-3, CD160, CD244), and reduced expression of cell cycle genes (Figure 2A, Supplementary Table 2). To determine whether TIGIT+KLRG1+ memory CD8+ T cells are similar across disease settings, we compared EOMES module expression in sorted TIGIT+KLRG1+ memory CD8+ T cells and TIGIT-KLRG1- memory CD8+ T cells from HC, individuals with T1D, and individuals with RCC; RCC was included because cancer is a setting where exhaustion is expected (1). We also included TIGIT+KLRG1+ CD8+ T memory cells sorted from both acute (influenza (FLU) and chronic (CMV) viral-specific T cells identified using pentamer staining (Supplementary Figure 2). Across all disease settings tested, TIGIT+KLRG1+ memory CD8+ T cells differed from memory CD8+ T cells lacking TIGIT and KLRG1 expression (K-S test, P = 9.8e-10) (Figure B).
We assessed similarity of the TIGIT+KLRG1+ EOMES signature with other published signatures of TEX identified across disease settings using cumulative distribution function (CDF) curves, asking whether other published signatures can discriminate TIGIT+KLRG1+ cells from TIGIT-KLRG1- cells. Published TEX signatures included four murine TEX subsets (3), common human cancer TEX signatures (26) and the exhaustion-associated EOMES module that we previously identified in T1D subjects treated with teplizumab (anti-CD3) (12). Given that TIGIT and KLRG1 co-expression were identified in peripheral blood of T1D subjects, the T1D EOMES signature (12) best discriminated transcriptional profiles of TIGIT+KLRG1+ and TIGIT-KLRG1- populations (K-S test, P = 9.8e-10). Terminal TEX signatures from the mouse and cancer data sets were also more similar to TIGIT+KLRG1+ cells (K-S test, P = 4.3e-03 and P = 9e-06, respectively). Moreover, we confirmed that EOMES protein expression correlates with co-expression of TIGIT and KLRG1 on memory CD8 T cells from HC using flow cytometry (Spearman test: r = 0.7015) (Figure 2C). Together, these data suggest that the TIGIT+KLRG1+ CD8+ T cell population is primarily composed of TEX and is present in the peripheral blood in healthy individuals, individuals with autoimmune disease, and cancer.
TIGIT+KLRG1+ memory CD8 T cells exhibit reduced effector function
To demonstrate that TIGIT+KLRG1+ memory CD8+ T cells are functionally exhausted and display reduced proliferation and cytokine production, we compared HC TIGIT+KLRG1+ memory CD8+ T cells to the total memory CD8+ T cell population which includes all memory CD8+ T cell subsets (Supplementary Figure 4). Compared to total memory CD8, TIGIT+KLRG1+ memory CD8+ T cells divided fewer times (Figure 3A) and produced lower levels of TNF-α and IFN-γ upon T cell receptor stimulation (Figure 3B). This reduced effector function corresponded with phenotypic features of exhausted cells. Markers of effector function (CD127, CD226) were reduced, while inhibitory markers (PD-1, CD160, EOMES) were increased (Figures 3C, D). Thus, co-expression of TIGIT and KLRG1 on memory CD8+ T cells marks phenotypically and functionally exhausted TIGIT+KLRG1+ CD8+ T cells with reduced effector functions. For simplicity, henceforth, we refer to this population as TIGIT+KLRG1+ TEX.
To confirm that TIGIT+KLRG1+ TEX are increased in settings previously reported to display increased CD8 T cell exhaustion, we parsed TIGIT+KLRG1+ TEX by progressive differentiation states and acute or chronic viral specificity. TIGIT+KLRG1+ cells were present in all subsets of CD8+ T cells with the majority being memory cells (Figure 3E, Supplementary Figure 2). Within TIGIT+KLRG1+ CD8 T cells, effector memory were the most abundant (61%) with central memory (13%) and CD45RA+ effector memory (18%) being next abundant in the same dataset analyzed in Figure 3E. Consistent with an increase of T cell exhaustion in chronic as compared to acute viral infections (1), we found increased frequencies of TIGIT+KLRG1+ TEX in CMV- and EBV-specific T cells identified by pentamer reagents as compared to influenza-specific T cells (Figure 3F). Thus, TIGIT+KLRG1+ TEX can be identified across lineages, but are found primarily in effector cells and settings previously associated with increased TEX (1).
The frequency of TIGIT+KLRG1+ TEX is influenced by RA HLA risk alleles
Due to the TIGIT+KLRG1+ TEX stability within and high variation across subjects, we were able to leverage cross-sectional datasets to explore autoimmune-related factors that influence the frequency of TIGIT+KLRG1+ TEX. We examined whole blood RNA sequencing (RNA-seq) data from a large cohort of age- and sex-matched HC and RA subjects (Table 1). While we found transcriptional differences between HC and RA, we also observed enrichment in the expression of genes that comprise the EOMES signature previously associated with CD8 T cell exhaustion (12) (Figure 2) when stratifying the combined cohorts by RA HLA autoimmune risk alleles (Figure 4A). Specifically, we focused on the HLA DRB1*04 alleles (*0401, 0404, 0405 and 0408) and the closely related DRB1*1001 genes most strongly associated with RA (odds ratios > 4.2) (27), and refer to carriers of these alleles as risk RA HLA and non-carriers as non-risk RA HLA. The HLA distribution for the risk RA HLA subjects is shown in Supplementary Table 3. Further investigation showed that the enrichment of EOMES modules in the non-risk RA HLA cohort was not due to CMV positivity since CMV-positive subjects were actually underrepresented (46%) in the non-risk RA HLA cohort as compared to the risk RA HLA cohort (52%). Likewise, the EOMES signature does not appear to be secondary to disease as similar enrichment in the non-risk RA HLA cohort was observed when HC were analyzed separately (Supplementary Table 4). Last, complementary SNP association analyses within the HLA-DRB1 locus confirmed decreased RNA-seq EOMES module association with risk RA HLA alleles (Supplementary Figure 5). Together, these findings support the association of an EOMES signature with the lack of RA HLA risk.
To determine whether the composition of the EOMES signatures in carriers of risk and non-risk RA HLA differ, we compared EOMES module expression in TIGIT+KLRG1+ memory CD8+ T cells isolated from HC carriers of risk and non-risk RA HLA. As in Figure 2B, we found the TIGIT+KLRG1+ cells isolated from both risk and non-risk RA HLA subjects were more similar to each other than their TIGIT-KLRG1- counterparts (Supplementary Figure 6A). Risk and non-risk RA HLA TIGIT+KLRG1+ memory CD8 T cells also shared interconnected genes common with genes identified in TIGIT+KLRG1+ TEX as visualized in a protein-protein interaction network and were functionally similar (Supplementary Figure 6B).
Given the consistency of increased EOMES signature across disease settings and the correlation with TIGIT+KLRG1+ protein expression (Figure 2), we predicted that the increased EOMES signature in non-risk RA HLA subjects would also be reflected at the protein level. For this experiment, we measured the frequency of EOMES-associated TIGIT+KLRG1+ TEX in CMV-negative age- and sex-matched HC and RA subjects selected for high versus low EOMES signature, defined by upper and lower terciles (Table 1). We did not observe differences in the frequency of EOMES-associated TIGIT+KLRG1+ TEX between HC and RA subjects; nor were TIGIT+KLRG1+ TEX functionally different (Supplementary Figure 7) as assessed by similarly low IFNγ production. However, there was a significant increase in TIGIT+KLRG1+ TEX abundance in the non-risk RA HLA subjects as compared with risk RA HLA subjects (Figure B). Thus, these data suggest the autoimmune-associated RA HLA genotype or linked genes contributes to variation in the frequency of TIGIT+KLRG1+ TEX in a cohort of HC and RA subjects.
TIGIT+KLRG1+ TEX are increased selectively in RA HLA risk subjects treated with abatacept (CTLA4Ig)
DR4 is a common risk allele between RA and T1D (28) and is associated with better outcome in a clinical trial of teplizumab (anti-CD3) therapy in individuals at risk for T1D (15). Given the association of TEX with better response to therapy in autoimmune disease (12, 13, 15), we explored the relationship between TIGIT+KLRG1+ TEX frequency and HLA risk alleles in the setting of immune interventions leveraging recent clinical trials. We first asked whether TIGIT+KLRG1+ TEX are selectively modulated in DR4 T1D subjects, examining the teplizumab (anti-CD3) trial in individuals at risk for T1D since DR4 was previously identified as a weak correlate of response (15). We found a significant increase in TIGIT+KLRG1+ TEX among DR4 risk subjects (P = 0.0033), but not DR4 non-risk subjects (P = 0.2650) (Figure 5A). Note, CMV seropositivity and mean age did not differ between DR4 risk and non-risk subjects. Thus, we link the previous DR4 association with response to a selective increase in TIGIT+KLRG1+ TEX in DR4 subjects.
We analyzed CyTOF data from the Early AMPLE trial (ClinicalTrials.gov: NCT02557100), a randomized, head-to-head, single-blind study comparing abatacept (CTLA4Ig) and adalimumab (anti-TNF) in new-onset RA (16). The results from this trial in biologic naïve patients demonstrated a superior response in the abatacept arm that was more pronounced in subjects who carried the shared epitope alleles (HLA DR1, DR4, DR10) (16). Here, we examined TIGIT+KLRG1+ TEX in the abatacept-treated group based on risk and non-risk RA HLA as defined in Figure 4. We did not find an increase in TIGIT+KLRG1+ TEX with treatment across all subjects but there was notable heterogeneity. When stratifying by RA HLA risk, we observed a significant increase in the frequency of TIGIT+KLRG1+ TEX in risk RA HLA subjects (P = 0.0043), but not non-risk RA HLA subjects (P = 0.1250) following treatment with abatacept (Figure 5B). In contrast, there was no change in the frequency of TIGIT+KLRG1+ TEX in RA HLA risk subjects after adalimumab treatment in either risk or non-risk RA HLA subjects (Figure 5C). Mean age of RA HLA risk groups did not differ in either study. Collectively, these findings suggest that TIGIT+KLRG1+ TEX frequency depends, in part, on HLA risk alleles and may be modulated by some immunotherapies.
Discussion
TEX are clearly associated with worse outcome in chronic viral infection and cancer (1), yet the opposing association of reduced TEX with autoimmunity is more nuanced. For example, reduced TEX have been associated with disease progression or severity (8, 10, 11) but not disease onset; in T1D, the frequency of TEX does not discriminate HC from T1D, only rate of disease progression (10). Here, we associate reduced TEX with RA HLA risk alleles in both HC and RA subjects, linking TEX to predisposition to autoimmunity. In addition, co-stimulation blockade selectively increased TEX in risk RA HLA subjects, suggesting this risk phenotype may be modulated with therapy. These findings may help determine who may respond best to TEX augmenting therapies.
Reduced TEX in HC and RA subjects carrying RA HLA risk alleles was enabled by identification of markers (TIGIT and KLRG1), which together broadly defined dysfunctional CD8 T cells across disease cohorts. The foundation of this observation lies in the EOMES transcriptional signature that we first defined and associated with TIGIT+ KLRG1+ CD8 T cells in T1D responders to teplizumab (anti-CD3) therapy (12) and here extended to HC, cancer, and chronic viral infection. EOMES has long been associated with TEX when expressed at high levels in combination with other TEX-associated genes (29, 30) and is a common feature of multiple TEX signatures (31–35), in which high levels of nuclear EOMES drives PD-1 expression (36), a common inhibitory receptor of TEX. Moreover, one of the co-expressed genes within the TIGIT+KLRG1+ EOMES signature is TOX which is a transcription factor known to promote TEX differentiation, phenotype, and persistence (37, 38). Thus, TIGIT and KLRG1 surface co-expression broadly define TEX. However, it should be noted that this population broadly defines TEX with different degrees of exhaustion suggesting that some subsets of TIGIT+KRLG1+ cells may be more exhausted than others (e.g. early and late memory) and is limited to application in humans since KLRG1 expression dynamics and association with TEX differ in mice (39, 40).
The RA HLA risk association with lower TIGIT+KLRG1+ TEX is unique in two ways. First, to our knowledge, this is the first linkage of an autoimmune-associated risk allele and TEX. HLA associations in RA have suggested involvement of antibody and CD4 T cell responses to date, not CD8 T cells (41). Although EOMES (42) and CD8 T cell differentiation states (43) have been linked to autoimmune-associated SNPs, association with RA HLA alleles has not previously been described. We suggest that the robust RA HLA association with TEX that we identified was due to our experimental design, which used a broad definition of TEX (as opposed to TEX subsets), built from the observation that age and CMV seropositivity are not the only factors that contribute to increased TIGIT+KLRG1+ TEX, as well as the risk and non-risk RA HLA groups being matched for disease co-factors including age and stage of disease. Second, reduced TEX are associated with a risk allele, not disease progression. This suggests that reduced TEX in risk RA HLA subjects may play a role in autoimmune susceptibility as well as contributing to faster progression and increased severity (7, 9, 10). Thus, while antigen is a main driver of exhaustion, additional factors may reduce the frequency of TEX including young age, a lack of environmental exposures (e.g., CMV seropositivity), and RA HLA risk alleles.
We identified a CD8 T cell subset that is associated with a Class II HLA allele. This is unusual since HLA Class II associations directly implicate a role for antigen-presenting cells and CD4 T cell help. For example, autoimmune-associated HLA alleles in RA and T1D are associated with the presence of specific autoantibodies (44). However, indirect linkage of T cell help and potential CD8 responses is not unprecedented; reduced autoantibody responses to specific islet antigens in T1D have been associated with the Class I HLA*24 allele (45). Our findings from therapeutic intervention also support an indirect influence of HLA on TEX frequency. The fact that TEX also increase in some non-risk RA HLA subjects, suggests that abatacept is not a driver of TEX, but instead, it influences factors that may promote expansion of TEX. Abatacept is known to block APC-CD4 T cell interactions resulting in reduced CD4 helper cells across multiple autoimmune diseases (46–51). Also, teplizumab (anti-CD3) therapy can result in T cell receptor activation without co-stimulation, which may limit CD4 T cell help. It has been shown that reduced T cell help can augment TEX in other contexts (8, 52, 53). Further studies are needed to dissect the potential role of CD4 T cell help on TEX in risk RA HLA subjects.
The HLA locus is complex and co-factors differ across diseases, leaving some questions. Unlike in HC and RA, reduced TIGIT+KLRG1+ TEX were not associated with T1D HLA DR4 risk alleles at baseline in individuals with T1D. T1D shares some HLA risk alleles with RA including DRB1*0401, 0404, and 0405 but is uniquely associated with DRB1*0402 with an odds ratio higher than 8 (44). In addition, while the RA HLA-TEX association is recapitulated in baseline samples from abatacept- (CTLA4Ig) treated RA subjects, it was not in the adalimumab (anti-TNF) RA treatment cohort; although, this may be due to higher baseline TEX proportions; TEX were significantly higher (P = 0.0036) at baseline in adalimumab- as compared to abatacept-treated RA subjects. Together these data suggest that the TIGIT+KLRG1+ TEX association with HLA is not absolute and T1D-specific disease-related co-factors (e.g., age, stage of disease) may contribute to the lack of an RA HLA-TEX association that is found in HC and RA. Alternatively, TEX may be associated with an HLA linked gene that is less prevalent in T1D. These results justify a focused and larger follow-up study powered to address individual HLAs.
There are several limitations to this study. By focusing on a broad definition of TEX, we were not able determine associations with early, partial, or late TEX, however, based on the variability in the degree of reduced function, the TIGIT+KLRG1+ TEX population is likely heterogeneous. We lack validation of the selective augmentation of TEX in abatacept-treated RA subjects and do not have access to samples to ask about the transient or persistent nature of these increases. Identifying clinical correlates of immune response in the Early AMPLE trial (18) was challenging since the majority of subjects responded to abatacept. Thus, our studies do not support or discount the possibility that increasing TEX with therapy improves outcome (decreases disease activity, ACPA or rheumatoid factor levels) in RA as has been shown in T1D with teplizumab (anti-CD3) therapy (12, 13). Moreover, the impact of abatacept may be subtle, as an EOMES signature of response was not found in individuals with T1D treated with abatacept; although, this could also be due to the timing of sampling (54). Nonetheless, some studies do suggest that modulating TEX may influence RA disease outcome; immune checkpoint blockade reduces TEX and can result in onset of RA (55, 56) and a reduction of CD28- T cells (that may include TEX) has been associated with clinical response to abatacept (20).
In summary, we demonstrate that increased autoimmune genetic risk is associated with lower levels of hypofunctional TIGIT+KLRG1+ TEX. TIGIT+KLRG1+ TEX in RA HLA risk subjects can be selectively augmented by treatment with abatacept (CTLA4Ig) in RA and by teplizumab (anti-CD3) in T1D. More broadly, these studies demonstrate that variability in TEX frequencies is not only associated with disease severity or progression, but also disease risk, and lower levels of TEX may be used as a selection criterion for treatments that augment TEX.
Data availability statement
The RNA-seq data is available through the GEO Repository (GSE216680). Flow cytometry data is accessible through TrialNet, ITN or Allen Institute portals or IMPORT. All other data are available in the main text or the Supplementary Materials.
Ethics statement
The studies involving humans were approved by Benaroya Research Institute (IRB07109) and VA Puget Sound Health Care System (MIRB#00755). The studies were conducted in accordance with the local legislation and institutional requirements. The participants provided their written informed consent to participate in this study.
Author contributions
SL: Conceptualization, Data curation, Formal analysis, Funding acquisition, Investigation, Methodology, Project administration, Resources, Supervision, Validation, Visualization, Writing – original draft, Writing – review & editing. VM: Data curation, Formal analysis, Investigation, Methodology, Visualization, Writing – review & editing. BJ: Data curation, Formal analysis, Investigation, Methodology, Visualization, Writing – review & editing. VW: Data curation, Formal analysis, Investigation, Methodology, Visualization, Writing – review & editing. AY: Formal analysis, Visualization, Writing – review & editing. AMH: Writing – original draft, Writing – review & editing. SP: Formal analysis, Methodology, Visualization, Writing – review & editing. JT: Formal analysis, Investigation, Methodology, Visualization, Writing – review & editing. BF: Formal analysis, Investigation, Visualization, Writing – review & editing. AW: Formal analysis, Investigation, Methodology, Visualization, Writing – review & editing. MT: Formal analysis, Investigation, Visualization, Writing – review & editing. KL: Formal analysis, Investigation, Methodology, Visualization, Writing – review & editing. HU: Formal analysis, Investigation, Visualization, Writing – review & editing. CS: Investigation, Resources, Writing – review & editing. BN: Investigation, Resources, Writing – review & editing. ATH: Investigation, Resources, Writing – review & editing. TT: Investigation, Resources, Writing – review & editing. AS: Investigation, Resources, Writing – review & editing. MM: Investigation, Resources, Writing – review & editing. NR: Investigation, Resources, Writing – review & editing. VK: Investigation, Resources, Writing – review & editing. JL: Investigation, Resources, Writing – review & editing. PL: Conceptualization, Data curation, Formal analysis, Investigation, Methodology, Visualization, Writing – review & editing. JB: Conceptualization, Data curation, Formal analysis, Funding acquisition, Investigation, Methodology, Project administration, Resources, Supervision, Validation, Visualization, Writing – original draft, Writing – review & editing.
Funding
The author(s) declare financial support was received for the research, authorship, and/or publication of this article. This work was supported by a JDRF grant, 2-SRA-2016-307-S-B to SL and PL and an NIH grant, R01 AI141952 to SL. It was also supported by NIH R01 AI132774, NIH R21 AR073508, funding from the Allen Institute for Immunology, and the Office of the Assistant Secretary of Defense for Health Affairs through the Peer Reviewed Medical Research Program (PRMRP) Investigator-Initiated Research Award under Award No. W81XWH-15-1-0003 to JB. All opinions, interpretations, conclusions, and recommendations are those of the authors and are not necessarily endorsed by the Department of Defense.
Acknowledgments
We are grateful to also T.S. Nguyen and the Center for Interventional Immunology team for expert management of clinical samples and associated data; Sheila Scheiding in the BRI Human Immunophenotyping Core for assistance in generating supplemental gating figures; and Dr. Taylor Lawson for review, feedback, and editing of the manuscript.
Conflict of interest
SL has past and current research projects sponsored by Janssen and SonomaBio. She is a member of the Type 1 Diabetes TrialNet Study Group. VM is currently employed by The Janssen Pharmaceutical Companies of Johnson & Johnson. HU is currently employed by Anocca AB. VW is currently employed by Notch Therapeutics. JT is currently employed by Bristol Myers Squibb. PL is a consultant for Link Therapeutics. JB is a Scientific Co-Founder and Scientific Advisory Board member of GentiBio, a consultant for Bristol Myers Squibb, Neoleukin Therapeutics and Hotspot Therapeutics, and has past and current research projects sponsored by Amgen, Bristol Myers Squibb, Janssen, Novo Nordisk, and Pfizer. She is a member of the Type 1 Diabetes TrialNet Study Group, a partner of the Allen Institute for Immunology, and a member of the Scientific Advisory Boards for the La Jolla Institute for Allergy and Immunology, Oklahoma Medical Research Foundation, and BMS Immunology. JB also has a patent for tenascin-C autoantigenic epitopes in rheumatoid arthritis.
The remaining authors declare that the research was conducted in the absence of any commercial or financial relationships that could be construed as a potential conflict of interest.
The author(s) declared that they were an editorial board member of Frontiers, at the time of submission. This had no impact on the peer review process and the final decision.
Publisher’s note
All claims expressed in this article are solely those of the authors and do not necessarily represent those of their affiliated organizations, or those of the publisher, the editors and the reviewers. Any product that may be evaluated in this article, or claim that may be made by its manufacturer, is not guaranteed or endorsed by the publisher.
Supplementary material
The Supplementary Material for this article can be found online at: https://www.frontiersin.org/articles/10.3389/fimmu.2024.1383110/full#supplementary-material
References
1. McLane LM, Abdel-Hakeem MS, Wherry EJ. CD8 T cell exhaustion during chronic viral infection and cancer. Annu Rev Immunol. (2019), 37457–95. doi: 10.1146/annurev-immunol-041015-055318
2. Hashimoto M, Kamphorst AO, Im SJ, Kissick HT, Pillai RN, Ramalingam SS, et al. CD8 T cell exhaustion in chronic infection and cancer: opportunities for interventions. Annu Rev Med. (2018), 69301–18. doi: 10.1146/annurev-med-012017-043208
3. Beltra JC, Manne S, Abdel-Hakeem MS, Kurachi M, Giles JR, Chen Z, et al. Developmental relationships of four exhausted CD8(+) T cell subsets reveals underlying transcriptional and epigenetic landscape control mechanisms. Immunity. (2020) 52:825–41 e8. doi: 10.1016/j.immuni.2020.04.014
4. Miller BC, Sen DR, Al Abosy R, Bi K, Virkud YV, LaFleur MW, et al. Subsets of exhausted CD8(+) T cells differentially mediate tumor control and respond to checkpoint blockade. Nat Immunol. (2019) 20:326–36. doi: 10.1038/s41590-019-0312-6
5. Kallies A, Zehn D, Utzschneider DT. Precursor exhausted T cells: key to successful immunotherapy? Nat Rev Immunol. (2020) 20:128–36. doi: 10.1038/s41577-019-0223-7
6. Collier JL, Weiss SA, Pauken KE, Sen DR, Sharpe AH. Not-so-opposite ends of the spectrum: CD8(+) T cell dysfunction across chronic infection, cancer and autoimmunity. Nat Immunol. (2021) 22:809–19. doi: 10.1038/s41590-021-00949-7
7. McKinney EF, Smith KG. T-cell exhaustion: understanding the interface of chronic viral and autoinflammatory diseases. Immunol Cell Biol. (2016) 94:935–42. doi: 10.1038/icb.2016.81
8. McKinney EF, Lee JC, Jayne DRW, Lyons PA, Smith KGC. T-cell exhaustion, co-stimulation and clinical outcome in autoimmunity and infection. Nature. (2015) 523:612–6. doi: 10.1038/nature14468
9. McKinney EF, Lyons PA, Carr EJ, Hollis JL, Jayne DR, Willcocks LC, et al. A CD8+ T cell transcription signature predicts prognosis in autoimmune disease. Nat Med. (2010) 16:586–91. doi: 10.1038/nm.2130
10. Wiedeman AE, Muir VS, Rosasco MG, DeBerg HA, Presnell S, Haas B, et al. Autoreactive CD8+ T cell exhaustion distinguishes subjects with slow type 1 diabetes progression. J Clin Invest. (2020) 130:480–90. doi: 10.1172/JCI126595
11. Lima G, Trevino-Tello F, Atisha-Fregoso Y, Llorente L, Fragoso-Loyo H, Jakez-Ocampo J. Exhausted T cells in systemic lupus erythematosus patients in long-standing remission. Clin Exp Immunol. (2021) 204:285–95. doi: 10.1111/cei.13577
12. Long SA, Thorpe J, DeBerg HA, Gersuk V, Eddy J, Harris KM, et al. Partial exhaustion of CD8 T cells and clinical response to teplizumab in new-onset type 1 diabetes. Sci Immunol. (2016) 1:1–9. doi: 10.1126/sciimmunol.aai7793
13. Sims EK, Bundy BN, Stier K, Serti E, Lim N, Long SA, et al. Teplizumab improves and stabilizes beta cell function in antibody-positive high-risk individuals. Sci Transl Med. (2021) 13:eabc8980. doi: 10.1126/scitranslmed.abc8980
14. Diggins KE, Serti E, Muir VS, Rosasco MG, Lu T, Balmas E, et al. Exhausted-like CD8 T cell phenotypes linked to C-peptide preservation in alefacept-treated T1D subjects. JCI Insight. (2021) 6:e142680. doi: 10.1172/jci.insight.142680
15. Herold KC, Bundy BN, Long SA, Bluestone JA, DiMeglio LA, Dufort MJ, et al. An anti-CD3 antibody, teplizumab, in relatives at risk for type 1 diabetes. N Engl J Med. (2019) 381:603–13. doi: 10.1056/NEJMoa1902226
16. Rigby W, Buckner JH, Louis Bridges S Jr., Nys M, Gao S, Polinsky M, et al. HLA-DRB1 risk alleles for RA are associated with differential clinical responsiveness to abatacept and adalimumab: data from a head-to-head, randomized, single-blind study in autoantibody-positive early RA. Arthritis Res Ther. (2021) 23:245. doi: 10.1186/s13075-021-02607-7
17. Greenbaum CJ, Serti E, Lambert K, Weiner LJ, Kanaparthi S, Lord S, et al. IL-6 receptor blockade does not slow β cell loss in new-onset type 1 diabetes. JCI Insight. (2021) 6:e150074. doi: 10.1172/jci.insight.150074
18. Jabado O, Maldonado MA, Schiff M, Weinblatt ME, Fleischmann R, Robinson WH, et al. Differential changes in ACPA fine specificity and gene expression in a randomized trial of abatacept and adalimumab in rheumatoid arthritis. Rheumatol Ther. (2022) 9:391–409. doi: 10.1007/s40744-021-00404-x
19. Haller MJ, Long SA, Blanchfield JL, Schatz DA, Skyler JS, Krischer JP, et al. Low-dose anti-thymocyte globulin preserves C-peptide, reduces HbA1c, and increases regulatory to conventional T-cell ratios in new-onset type 1 diabetes: two-year clinical trial data. Diabetes. (2019) 68:1267–76. doi: 10.2337/db19-0057
20. Herold KC, Gitelman SE, Ehlers MR, Gottlieb PA, Greenbaum CJ, Hagopian W, et al. Teplizumab (anti-CD3 mAb) treatment preserves C-peptide responses in patients with new-onset type 1 diabetes in a randomized controlled trial: Metabolic and immunologic features at baseline identify a subgroup of responders. Diabetes. (2013) 62:3766–74. doi: 10.2337/db13-0345
21. Gitelman SE, Gottlieb PA, Rigby MR, Felner EI, Willi SM, Fisher LK, et al. Antithymocyte globulin treatment for patients with recent-onset type 1 diabetes: 12-month results of a randomized, placebo-controlled, phase 2 trial. Lancet Diabetes Endocrinol. (2013) 1:306–16. doi: 10.1016/S2213-8587(13)70065-2
22. Rigby MR, Harris KM, Pinckney A, DiMeglio LA, Rendell MS, Felner EI, et al. Alefacept provides sustained clinical and immunological effects in new-onset type 1 diabetes patients. J Clin Invest. (2015) 125:3285–96. doi: 10.1172/JCI81722
23. Linsley PS, Greenbaum CJ, Rosasco M, Presnell S, Herold KC, Dufort MJ. Elevated T cell levels in peripheral blood predict poor clinical response following rituximab treatment in new-onset type 1 diabetes. Genes Immun. (2018) 20:293–307. doi: 10.1038/s41435-018-0032-1
24. Subramanian A, Tamayo P, Mootha VK, Mukherjee S, Ebert BL, Gillette MA, et al. Gene set enrichment analysis: a knowledge-based approach for interpreting genome-wide expression profiles. Proc Natl Acad Sci U.S.A. (2005) 102:15545–50. doi: 10.1073/pnas.0506580102
25. Linsley PS, Chaussabel D, Speake C. The relationship of immune cell signatures to patient survival varies within and between tumor types. PloS One. (2015) 10:e0138726. doi: 10.1371/journal.pone.0138726
26. Zheng L, Qin S, Si W, Wang A, Xing B, Gao R, et al. Pan-cancer single-cell landscape of tumor-infiltrating T cells. Science. (2021) 374:abe6474. doi: 10.1126/science.abe6474
27. Raychaudhuri S, Sandor C, Stahl EA, Freudenberg J, Lee HS, Jia X, et al. Five amino acids in three HLA proteins explain most of the association between MHC and seropositive rheumatoid arthritis. Nat Genet. (2012) 44:291–6. doi: 10.1038/ng.1076
28. Baranzini SE. The genetics of autoimmune diseases: a networked perspective. Curr Opin Immunol. (2009) 21:596–605. doi: 10.1016/j.coi.2009.09.014
29. Paley MA, Kroy DC, Odorizzi PM, Johnnidis JB, Dolfi DV, Barnett BE, et al. Progenitor and terminal subsets of CD8+ T cells cooperate to contain chronic viral infection. Science. (2012) 338:1220–5. doi: 10.1126/science.1229620
30. Li J, He Y, Hao J, Ni L, Dong C. High levels of eomes promote exhaustion of anti-tumor CD8(+) T cells. Front Immunol. (2018) 92981:2981. doi: 10.3389/fimmu.2018.02981
31. Li C, Phoon YP, Karlinsey K, Tian YF, Thapaliya S, Thongkum A, et al. A high OXPHOS CD8 T cell subset is predictive of immunotherapy resistance in melanoma patients. J Exp Med. (2022) 219:e20202084. doi: 10.1084/jem.20202084
32. Oliveira G, Stromhaug K, Klaeger S, Kula T, Frederick DT, Le PM, et al. Phenotype, specificity and avidity of antitumor CD8(+) T cells in melanoma. Nature. (2021) 596:119–25. doi: 10.1038/s41586-021-03704-y
33. Wu TD, Madireddi S, de Almeida PE, Banchereau R, Chen YJ, Chitre AS, et al. Peripheral T cell expansion predicts tumor infiltration and clinical response. Nature. (2020) 579:274–8. doi: 10.1038/s41586-020-2056-8
34. Bengsch B, Ohtani T, Khan O, Setty M, Manne S, O'Brien S, et al. Epigenomic-guided mass cytometry profiling reveals disease-specific features of exhausted CD8 T cells. Immunity. (2018) 48:1029–45 e5. doi: 10.1016/j.immuni.2018.04.026
35. Giles JR, Manne S, Freilich E, Oldridge DA, Baxter AE, George S, et al. Human epigenetic and transcriptional T cell differentiation atlas for identifying functional T cell-specific enhancers. Immunity. (2022) 55:557–74 e7. doi: 10.1016/j.immuni.2022.02.004
36. McLane LM, Ngiow SF, Chen Z, Attanasio J, Manne S, Ruthel G, et al. Role of nuclear localization in the regulation and function of T-bet and Eomes in exhausted CD8 T cells. Cell Rep. (2021) 35:109120. doi: 10.1016/j.celrep.2021.109120
37. Alfei F, Kanev K, Hofmann M, Wu M, Ghoneim HE, Roelli P, et al. TOX reinforces the phenotype and longevity of exhausted T cells in chronic viral infection. Nature. (2019) 571:265–9. doi: 10.1038/s41586-019-1326-9
38. Scott AC, Dundar F, Zumbo P, Chandran SS, Klebanoff CA, Shakiba M, et al. TOX is a critical regulator of tumor-specific T cell differentiation. Nature. (2019) 571:270–4. doi: 10.1038/s41586-019-1324-y
39. Chen Z, Ji Z, Ngiow SF, Manne S, Cai Z, Huang AC, et al. TCF-1-centered transcriptional network drives an effector versus exhausted CD8 T cell-fate decision. Immunity. (2019) 51:840–55 e5. doi: 10.1016/j.immuni.2019.09.013
40. Herndler-Brandstetter D, Ishigame H, Shinnakasu R, Plajer V, Stecher C, Zhao J, et al. KLRG1(+) effector CD8(+) T cells lose KLRG1, differentiate into all memory T cell lineages, and convey enhanced protective immunity. Immunity. (2018) 48:716–29 e8. doi: 10.1016/j.immuni.2018.03.015
41. Kim K, Bang SY, Lee HS, Bae SC. Update on the genetic architecture of rheumatoid arthritis. Nat Rev Rheumatol. (2017) 13:13–24. doi: 10.1038/nrrheum.2016.176
42. Parnell GP, Gatt PN, Krupa M, Nickles D, McKay FC, Schibeci SD, et al. The autoimmune disease-associated transcription factors EOMES and TBX21 are dysregulated in multiple sclerosis and define a molecular subtype of disease. Clin Immunol. (2014) 151:16–24. doi: 10.1016/j.clim.2014.01.003
43. Roederer M, Quaye L, Mangino M, Beddall MH, Mahnke Y, Chattopadhyay P, et al. The genetic architecture of the human immune system: a bioresource for autoimmunity and disease pathogenesis. Cell. (2015) 161:387–403. doi: 10.1016/j.cell.2015.02.046
44. Jerram ST, Leslie RD. The genetic architecture of type 1 diabetes. Genes (Basel). (2017) 8:209. doi: 10.3390/genes8080209
45. Long AE, Gillespie KM, Aitken RJ, Goode JC, Bingley PJ, Williams AJ. Humoral responses to islet antigen-2 and zinc transporter 8 are attenuated in patients carrying HLA-A*24 alleles at the onset of type 1 diabetes. Diabetes. (2013) 62:2067–71. doi: 10.2337/db12-1468
46. Edner NM, Heuts F, Thomas N, Wang CJ, Petersone L, Kenefeck R, et al. Follicular helper T cell profiles predict response to costimulation blockade in type 1 diabetes. Nat Immunol. (2020) 21:1244–55. doi: 10.1038/s41590-020-0744-z
47. Glatigny S, Hollbacher B, Motley SJ, Tan C, Hundhausen C, Buckner JH, et al. Abatacept targets T follicular helper and regulatory T cells, disrupting molecular pathways that regulate their proliferation and maintenance. J Immunol. (2019) 202:1373–82. doi: 10.4049/jimmunol.1801425
48. Alenazy MF, Saheb Sharif-Askari F, Omair MA, El-Wetidy MS, Omair MA, Mitwalli H, et al. Abatacept enhances blood regulatory B cells of rheumatoid arthritis patients to a level that associates with disease remittance. Sci Rep. (2021) 11:5629. doi: 10.1038/s41598-021-83615-0
49. Alvarez-Quiroga C, Abud-Mendoza C, Doniz-Padilla L, Juarez-Reyes A, Monsivais-Urenda A, Baranda L, et al. CTLA-4-Ig therapy diminishes the frequency but enhances the function of Treg cells in patients with rheumatoid arthritis. J Clin Immunol. (2011) 31:588–95. doi: 10.1007/s10875-011-9527-5
50. Linsley PS, Greenbaum CJ, Speake C, Long SA, Dufort MJ. B lymphocyte alterations accompany abatacept resistance in new-onset type 1 diabetes. JCI Insight. (2019) 4:e126136. doi: 10.1172/jci.insight.126136
51. Orban T, Beam CA, Xu P, Moore K, Jiang Q, Deng J, et al. Reduction in CD4 central memory T-cell subset in costimulation modulator abatacept-treated patients with recent-onset type 1 diabetes is associated with slower C-peptide decline. Diabetes. (2014) 63:3449–57. doi: 10.2337/db14-0047
52. Aubert RD, Kamphorst AO, Sarkar S, Vezys V, Ha SJ, Barber DL, et al. Antigen-specific CD4 T-cell help rescues exhausted CD8 T cells during chronic viral infection. Proc Natl Acad Sci U.S.A. (2011) 108:21182–7. doi: 10.1073/pnas.1118450109
53. Frank GM, Lepisto AJ, Freeman ML, Sheridan BS, Cherpes TL, Hendricks RL. Early CD4(+) T cell help prevents partial CD8(+) T cell exhaustion and promotes maintenance of Herpes Simplex Virus 1 latency. J Immunol. (2010) 184:277–86. doi: 10.4049/jimmunol.0902373
54. Orban T, Bundy B, Becker DJ, Dimeglio LA, Gitelman SE, Goland R, et al. Co-stimulation modulation with abatacept in patients with recent-onset type 1 diabetes: follow-up one year after cessation of treatment. Diabetes Care. (2014) 37:1069–75. doi: 10.2337/dc13-0604
55. Jamal S, Hudson M, Fifi-Mah A, Ye C. Immune-related adverse events associated with cancer immunotherapy: A review for the practicing rheumatologist. J Rheumatol. (2020) 47:166–75. doi: 10.3899/jrheum.190084
Keywords: T cell exhaustion, autoimmunity, HLA risk alleles, rheumatoid arthritis, abatacept
Citation: Long SA, Muir VS, Jones BE, Wall VZ, Ylescupidez A, Hocking AM, Pribitzer S, Thorpe J, Fuchs B, Wiedeman AE, Tatum M, Lambert K, Uchtenhagen H, Speake C, Ng B, Heubeck AT, Torgerson TR, Savage AK, Maldonado MA, Ray N, Khaychuk V, Liu J, Linsley PS and Buckner JH (2024) Abatacept increases T cell exhaustion in early RA individuals who carry HLA risk alleles. Front. Immunol. 15:1383110. doi: 10.3389/fimmu.2024.1383110
Received: 06 February 2024; Accepted: 26 March 2024;
Published: 08 April 2024.
Edited by:
Veena Taneja, Mayo Clinic, United StatesReviewed by:
Hans Dooms, National Jewish Health, United StatesStuart Ian Mannering, University of Melbourne, Australia
Copyright © 2024 Long, Muir, Jones, Wall, Ylescupidez, Hocking, Pribitzer, Thorpe, Fuchs, Wiedeman, Tatum, Lambert, Uchtenhagen, Speake, Ng, Heubeck, Torgerson, Savage, Maldonado, Ray, Khaychuk, Liu, Linsley and Buckner. This is an open-access article distributed under the terms of the Creative Commons Attribution License (CC BY). The use, distribution or reproduction in other forums is permitted, provided the original author(s) and the copyright owner(s) are credited and that the original publication in this journal is cited, in accordance with accepted academic practice. No use, distribution or reproduction is permitted which does not comply with these terms.
*Correspondence: Jane H. Buckner, amJ1Y2tuZXJAYmVuYXJveWFyZXNlYXJjaC5vcmc=; Sarah Alice Long, YWxvbmdAYmVuYXJveWFyZXNlYXJjaC5vcmc=