- 1The First Rehabilitation Hospital of Shanghai, Clinic Center for Brain and Spinal Cord Research, School of Medicine and Advanced Institute of Translational Medicine, Tongji University, Shanghai, China
- 2Pre-clinical College, Dali University, Dali, Yunnan, China
- 3Xiang-Xing College, Hunan University of Traditional Chinese Medicine, Changsha, China
- 4The Third Xiangya Hospital, Central South University, Changsha, Hunan, China
- 5Department of Clinical Laboratory, Shanghai Songjiang District Central Hospital, Shanghai, China
- 6Suzhou Institute of Biomedical Engineering and Technology, Chinese Academy of Sciences, Suzhou, China
- 7School of Biomedical Engineering (Suzhou), Division of Life Sciences and Medicine, University of Science and Technology of China, Hefei, China
- 8Jiangxi Provincial Key Laboratory of Digestive Diseases, Department of Gastroenterology, The First Affiliated Hospital, Jiangxi Medical College, Nanchang University, Nanchang, Jiangxi, China
Introduction: Inflammatory bowel disease (IBD) is a chronic disease involving multiple genes, and the current available targeted drugs for IBD only deliver moderate efficacy. Whether there is a single gene that systematically regulates IBD is not yet known. MiR-146a plays a pivotal role in repression of innate immunity, but its function in the intestinal inflammation is sort of controversy, and the genetic regulatory networks regulated by miR-146a in IBD has not been revealed.
Methods: RT-qPCR was employed to detect the expression of miR-146a in IBD patients and in a mouse IBD model induced by dextran sulfate sodium (DSS), and then we generated a miR-146a knock-out mouse line with C57/Bl6N background. The disease activity index was scored in DSS-treated miR-146a deficiency mice and their wild type (WT) littermates. Bulk RNA-sequencing, RT-qPCR and immunostaining were done to illustrate the downstream genetic regulatory networks of miR-146a in flamed colon. Finally, the modified miR-146a mimics were used to treat DSS-induced IBD in miR-146a knock-out and WT IBD mice.
Results: We showed that the expression of miR-146a in the colon was elevated in dextran sulfate sodium (DSS)-induced IBD mice and patients with IBD. DSS induced dramatic body weight loss and more significant rectal bleeding, shorter colon length, and colitis in miR-146a knock-out mice than WT mice. The miR-146a mimics alleviated DSS-induced symptoms in both miR-146a-/- and WT mice. Further RNA sequencing illustrated that the deficiency of miR-146a de-repressed majority of DSS-induced IBD-related genes that cover multiple genetic regulatory networks in IBD, and supplementation with miR-146a mimics inhibited the expression of many IBD-related genes. Quantitative RT-PCR or immunostaining confirmed that Ccl3, Saa3, Csf3, Lcn2, Serpine1, Serpine2, MMP3, MMP8, MMP10, IL1A, IL1B, IL6, CXCL2, CXCL3, S100A8, S100A9, TRAF6, P65, p-P65, and IRAK1 were regulated by miR-146a in DSS induced IBD. Among them, MMP3, MMP10, IL6, IL1B, S100A8, S100A9, SERPINE1, CSF3, and IL1A were involved in the active stage of IBD in humans.
Discussion: Our date demonstrated that miR-146a acts as a top regulator in C57/BL6N mice to systematically repress multiple genetic regulatory networks involved in immune response of intestine to environment factors, and combinatory treatment with miR-146a-5p and miR-146a-3p mimics attenuates DSS-induced IBD in mice through down-regulating multiple genetic regulatory networks which were increased in colon tissue from IBD patients. Our findings suggests that miR-146a is a top inhibitor of IBD, and that miR-146a-5p and miR-146a-3p mimics might be potential drug for IBD.
Introduction
Genetic susceptibility and environment are the two main risk factors for inflammatory bowel disease (IBD) that affects approximately 1% of the population (1, 2). IBD mainly includes Crohn’s disease (CD) and ulcerative colitis (UC) (1, 3, 4). During the development of IBD, continuous inflammation progressively causes damage of intestinal epithelial barrier and vascular endothelium, and consequently affects digestion and absorption and leads to rectal bleeding and body weight loss (1, 5). The progression of IBD is known to be promoted by upregulated genetic regulatory networks of chemokines, cytokines, other pro-inflammatory factors (S100A8/A9, CSF3, etc.), extracellular matrix breakdown enzymes, and coagulation (2, 5–13). Because of the involvement of multiple genetic regulatory networks, IBD is a complicated and heterogeneous disease and remains difficult to cure. Although conventional drugs such as 5-aminosalicylates, corticosteroids, and immunomodulators have limited efficacy and unavoidable side effects, they are still used as first-line agents for the treatment of mild to moderate IBD (3, 14). Even recently developed drugs, such as antibodies against TNFα, α4β7 integrins, and interleukins, as well as inhibitors of Janus kinase, confer only 30% to 60% efficacy for remission of IBD in clinical trials (3, 15, 16). The reason for the limited efficacy of IBD drugs is the fact that these drugs can only inhibit one genetic regulatory network of IBD; thus, discovering top regulators of IBD is necessary for developing new drugs to target all genetic regulatory networks involved in IBD to obtain higher efficacy.
MicroRNA (miRNA) can regulate hundreds to even up to thousands of direct target genes; therefore, it could be a top regulator for chronic diseases with multiple genes involved. For example, the miR-183-96-182 cluster regulates approximately 80% of genes in genetic regulatory network of peripheral injury-induced neuropathic pain, including the sodium channel network and the calcium channel network (17–19). It is known that miR-146a regulates innate immune responses through repressing two targets, IL-1 receptor-associated kinase 1 (IRAK1) and TNF receptor-associated factor 6 (TRAF6), in a negative feedback manner (20–24), and that miR-146a-deficient mice with a 129.B6, but not C57BL/6, genetic background have an elevated serum level of IL6 and develop aging-related autoimmune diseases with multiorgan (liver, kidneys, and lungs) inflammation (25). However, the role of miRNA-146a in intestinal inflammation is controversial (26, 27), and all genetic regulatory networks regulated by miR-146a and the function of miR-146a in IBD have not been fully uncovered. Here, we showed that miR-146a-deficient mice developed severe IBD after induction of dextran sulfate sodium (DSS) through de-repression of multiple genetic regulatory networks, and the combination of the modified miR-146a-5p and miR-146a-3p mimics (and not when administered on their own) can attenuate IBD symptoms in both miR-146a-null and WT mice via repressing the genetic regulatory networks.
Materials and methods
Animals
In this study, all animals were housed at 21°C with 50% humidity, on a 12-h light:12-h dark schedule in the standard animal facility, five per cage, in accordance with the guidelines of Tongji University, and all animal work was conducted under ethical permission from the Tongji University ethical review panel.
MiR-146a+/- mice were generated by Cyagen Biosciences Inc. (Guangzhou, China) using CRISPR/Cas9 technology. Briefly, in vitro transcribed Cas9 mRNA and gRNA (gRNA1: TGCACCACCCATGATAGGGCAGG, gRNA2: GCTTCGCTTTTCCCAACCGGAGG) were injected into fertilized eggs of C57BL/6N mice. PCR product sequencing using two pairs of primers (miR-146a F1, 5′ AAGGGAAGGATTGAACATGACACA 3′, miR-146a R1 5′ TTATTGCCTCTCTACAAGGACCTG 3′, and miR-146a R2 5′ ACCATCAATAGCAGAGATGACTGG 3′) was performed to identify F0-generation mice carrying a miR-146a knock-out allele. The positive F0-generation mice were then mated with wild-type C57BL/6N mice to obtain F1-generation mice, and the F1-generation miR-146a+/- mice were identified by PCR, and Sanger sequencing confirmed a deletion of 1,467 bp, which did not affect the gene sequence of the gene Gm12148 which is close to miR-146a. Male and female experimental WT C57BL/6N mice were purchased from Vital River Laboratory Animal Technology Co., Ltd. (Zhejiang, China).
Collection of human samples
During colonoscopy, biopsy samples were collected from 22 adult patients with ongoing gut symptoms by the Department of Gastroenterology, The Third Xiangya Hospital, Central South University according to the ethics permit (R19057) approved by the Ethics Committee of The Third Xiangya Hospital. All fresh samples from patients who requested biopsy examination and agreed to donate biopsy tissue for our research were included in this study, with no exclusion criteria. Among them, six subjects were without IBD (non-IBD), and seven and nine patients were with IBD in the active stage (active IBD) or inactive stage (inactive IBD). The information of patients with IBD is provided in Table S1. Biopsy samples were immediately frozen in dry ice and stored in a −80°C freezer until further analysis.
DSS-induced experimental colitis and treatment
Experiment 1: 2% DSS (molecular weight of 36–50 kDa, MP Biomedicals, Irvine, CA, USA) in water was used to induce C57BL/6N mice and miR-146a+/- mice to become IBD models. WT and miR-146a+/- mice were randomly divided into four groups: WT control group, miR-146a+/- control group, DSS-treated WT group, and DSS-treated miR-146a+/- group. Control group mice had free access to tap water, and DSS group mice and three additional miR-146a-/- mice were given 2% DSS in drinking water for 6 days to induce experimental colitis and fed with water on day 7. Mice were sacrificed on day 7 and samples were collected.
Experiment 2: To investigate the efficacy of miR-146a mimics in DSS-induced miR-146a-/- IBD mice, miR-146a-/- mice were randomly divided into three groups: saline control group, saline + DSS group, and miR-146a mimics + DSS group. Saline control group mice had free access to tap water and treated with vehicle saline. Saline + DSS group and miR-146a mimics + DSS group mice were given 2.5% DSS (a new batch from the same supplier) in drinking water for 7 days to induce experimental colitis; meanwhile, saline and miR-146a mimics [the modified miR-146a-5p mimics (40 pg per gram of body weight) and miR-146a-3p mimics (80 pg per gram of body weight)] were purchased from Suzhou Biosyntech Co. Suzhou, China (Supplementary Table S2) and administrated via gavage and intraperitoneal injection every other day from day 1 for five times, respectively. Mice were sacrificed on day 9 and samples were collected.
Experiment 3: To examine the efficacy of miR-146a mimics in DSS-induced WT mice, C57BL/6N mice were randomly divided into three groups: saline control group, saline + DSS group, and miR-146a mimics + DSS group. Saline control group mice had free access to tap water and treated with vehicle saline. Saline + DSS group and miR-146a mimics + DSS group mice were fed with 2.5% DSS containing water on day 1 and followed with 2% DSS containing water from day 2 to day 6, and treated with vehicle saline and miR-146a mimics [the modified miR-146a-5p mimics (6.5 pg per g body weight) and miR-146a-3p mimics (3.25 pg per g body weight)], respectively, via intraperitoneal injection every other day from day 1 for five times. Mice were sacrificed on day 9 and samples were collected.
Evaluation of the disease activity index
The disease activity index (DAI) was determined by weight loss, stool consistency, and fecal occult blood.
The weight loss score is as follows: 0 points, <1%; 1 point, 1%–5%; 2 points, 5%–10%; 3 points, 10%–20%; and 4 points, >20%. The stool consistency is divided into three conditions: 0 points, normal stool; 2 points, loose stool; and 4 points, water-like stool. The feces was stained with the fecal occult blood test kit (Zhuhai BaSO Biotechnology Co., Zhuhai, China), and the fecal occult blood was scored according to the following scale: 0 points, negative; 2 points, positive; and 4 points, obvious blood on feces. Note that spouted rectal bleeding, which was indicated by bloodstain on mouse tail, was not counted in the score of fecal occult blood.
Collection of mouse colon tissues and measurement
Colons were quickly removed from mice, and their length was measured and photographed. After removing the content, the colon was washed twice with cold saline. Dissected colon tissues were snap-frozen and stored at −80°C for RT-qPCR detection. For immunofluorescence and histochemical staining detection, colons were immersed in 4% PFA overnight and embedded in paraffin after progressive dehydration.
RNA sequencing
Total RNA was isolated from colons using Trizol Reagent (Thermo Fisher Scientific, Massachusetts, USA) and 1 µg of total RNA was used for library preparation according to Illumina standard instruction (VAHTS Universal V6 RNA-seq Library Prep Kit for Illumina®). An Agilent 4200 bioanalyzer was employed to evaluate the concentration and size distribution of cDNA library before sequencing with an Illumina novaseq6000. The protocol of high-throughput sequencing was followed according to the manufacturer’s instructions (Illumina). The raw reads were filtered by Seqtk before mapping to genome using Hisat2 (version: 2.0.4) (28). The gene fragments were counted using stringtie (v1.3.3b) followed by TMM (trimmed mean of M values) normalization (29–31). Significant differentially expressed genes (DEGs) were identified as those with a p value < 0.01 and fold change >2 using the edgeR software (32). The RNA-seq raw data as well as gene read counts for individual samples are accessible at Gene Expression Omnibus (GEO) under accession number GSE247433.
Real-time quantitative RT-PCR
Total RNA was extracted from mouse colons and human samples using Trizol reagent (Thermo Fisher Science, Massachusetts, USA) and 2 μg of total RNA was reverse-transcribed with the Revert Aid First Strand Gene Synthesis Kit (Thermo Fisher Science, Massachusetts, USA). Using SYB-Green and the ABI QuantStudio 3 machine (Thermo Fisher Scientific, Massachusetts, USA), the expression level of Mmp3, Mmp8, Mmp10, Il6, Il1a, Il1b, Cxcl2, Cxcl3, S100a8, S100a9, Lcn2, Serpine1, Serpine2, Ccl3, Saa3, and Csf3 was quantified by real-time PCR with specific primers listed in Supplementary Table S3 and normalized to Gapdh RNA. For miRNA detection, 1 μg of total RNA was polyadenylated and reverse-transcribed using the Catch-All™ miRNA & mRNA RT-PCR Kit (Pengekiphen, Suzhou, China) according to the manufacturer’s instructions. Subsequently, qRT-PCR assays were conducted using the Catch-All™ miRNA & mRNA universal PCR primer as the reverse primer, and the specific miRNA forward primers listed in Supplementary Table S3 or as previously described (18). The amplification conditions were as follows: an initial step at 95°C for 10 min, and 40 cycles of 15 s at 95°C and 1 min at 60°C. All assays were performed in triplicate and negative controls were included by omitting the template. The Ct value was recorded for each reaction, and the expression level of miRNAs was calculated relative to U6, a ubiquitously expressed snRNA.
Hematoxylin and eosin staining
Paraffin sections with a thickness of 4 µm were stained using a hematoxylin and eosin (HE) staining kit (Solarbio Life Sciences, Beijing, China) according to the user manual. The slides were evaluated blindly by experienced pathologists, and histological scores were evaluated according to previous studies (33, 34) based on the following parameters: the area affected by inflammatory infiltration and tissue damage.
Histological analysis and grades
Three random areas of each colon sample were photographed, with the grades of inflammatory cell infiltration and tissue damage scored according to the following criteria: (1) Inflammatory cell infiltration: 0 point, no inflammatory infiltration; 1 point, less inflammatory infiltration in the lamina propria; 2 points, the muscular layer of the mucosa infiltrates, thickening of the mucosa; 3 points, inflammatory cells penetrate the submucosa; (2) tissue damage: 0 point, no epithelial cell changes; 1 point, goblet cell deletion; 2 points, a large area of goblet cells is missing, crypt is missing; 3 points, extensive destruction of the structure of the mucosa and extension to the muscular layer of the intestine. The mean of scores of the three areas represented the grade of colitis in each animal.
Immune fluorescence staining and measurement
Immunostainings on 4-μm paraffin sections were performed as described previously (35). The following primary antibodies were used: MMP3 antibody (Abcam, #AB52915, 1:100), MMP8 antibody (Abcam, #AB53017, 1:1,000), MMP10 antibody (Abcam, #AB261733, 1:100), IL6 antibody (CST, #12912s, 1:200), IL1A antibody (Abcam, #AB300499, 1:50), IL1B antibody (Abcam, #ab234437, 1:50), CXCL2 antibody (Thermo, #MA5-23737, 1:100), CXCL3 antibody (Abcam, #ab220431, 1:1,000), S100A8/S100A9 antibody (Abcam, #ab288715, 1:500), NF-κB p65 antibody (Abcam, #ab16502, 1:1,000), Phospho-NF-κB p65 antibody (CST, #3033, 1:1,000), TRAF6 antibody (Abcam, #ab33915, 1:1,000), and IRAK-1 antibody (Abcam, #ab218130, 1:200). Secondary antibodies were conjugated with AlexaFluor 488 (Thermo Fisher Scientific, Massachusetts, USA, 1:1,000). Nuclei were counterstained with DAPI (Sigma, #MBD0015, 1:10,000). Fluorescent images were captured with a confocal laser microscope (Spin SR10, Olympus, Japan) and processed with Adobe Photoshop software.
The fluorescence signal intensities of MMP3, MMP8, MMP10, IL6, IL1A, IL1B, CXCL2, CXCL3, S100A8+S100A9, NF-κB (p65), Phospho-NF-κB (p65), TRAF6 and IRAK1 were measured using ImageJ on three sections, which came from every ninth serial sections from distal colon of three WT mice and three miR-146a+/- mice; three DSS-treated WT mice and three DSS-treated miR-146a+/- mice in experiment 1, and every ninth serial sections from distal colon of three saline treated miR-146a-/- mice, three saline + DSS treated miR-146a-/- mice and four mimics + DSS miR-146a-/- mice in experiment 2, and three every ninth serial sections from distal colon of three saline treated WT mice, three saline + DSS treated WT mice and four mimics + DSS WT mice.
Cy3-conjugated mimics treatment
Sixteen 8-week-old C57BL/6N mice were randomly divided into four groups and fasted for 6 h, and then mice were intraperitoneally injected or administrated via gavage with miR-146a-5p mimics (6.5 pg per gram of body weight) and miR-146a-3p mimics (3.25 pg per gram of body weight), or treated in combination with miR-146a-5p mimics (6.5 pg per gram of body weight) and miR-146a-3p mimics (3.25 pg per gram of body weight), or served as untreated controls. Colon tissues were collected 4 h after treatment of miR-146a mimics and fixed in 4% PFA overnight. Colon tissues were embedded in OCT after immersion in 15% sucrose and 30% sucrose overnight, and sectioned in a cryostar (NX50, Thermo Fisher Scientific) at a thickness of 14 μm. The colon cryosections were stained with DAPI and photographed using a confocal microscope (Zeiss 710, Germany).
Results
Haploinsufficiency of miR-146a augmented DSS-induced IBD
To investigate whether miR-146a is involved in IBD, we employed RT-qPCR to quantify the expression level of miR-146a in the colon of patients, and the results demonstrated that miR-146a-3p was significantly expressed higher in the colon of patients with IBD in both the active stage and the inactive stage than that in non-IBD patients who had other types of bowel disease, and that there was an increasing trend in expression level of miR-146a-5p in the colon of patients with IBD compared to patients without IBD (Figure 1A). Since the expression of miR-146a could be increased in patients with other types of bowel diseases (36) and it is difficult to obtain colon tissues from healthy people, we generated an IBD mouse model by induction with 2.5% DSS and found that both miR-146a-5p and miR-146a-3p were upregulated by more than two fold in the colon of DSS-treated wild type (WT) mice when compared to untreated control WT mice (Figure 1B). These findings suggest that miR-146a-5p and miR-146a-3p were involved in the development of IBD.
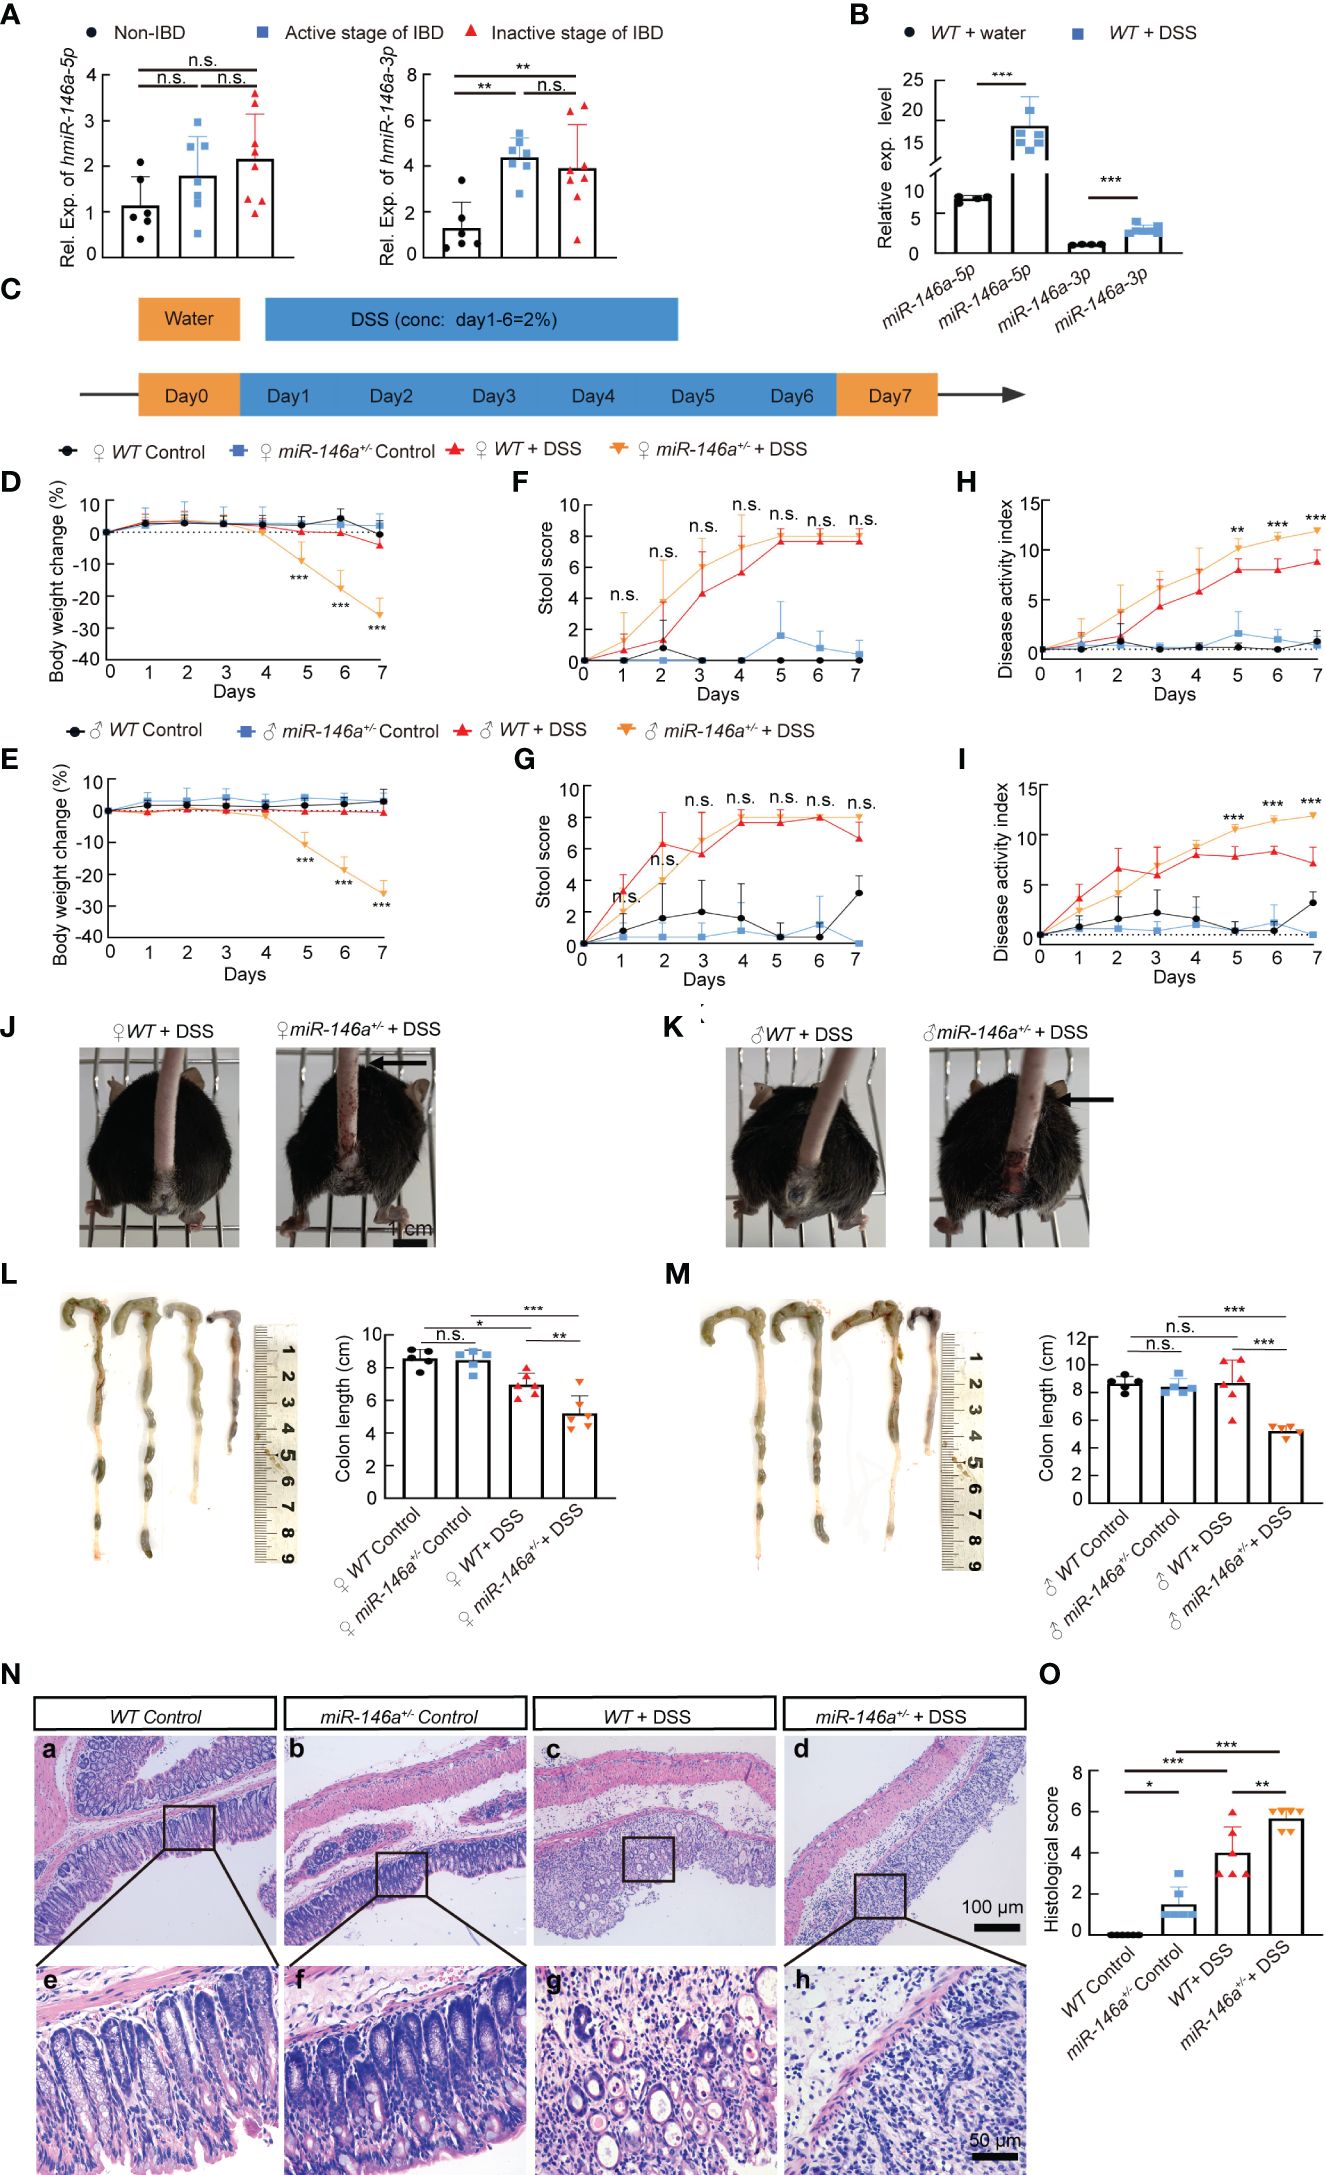
Figure 1 Haploinsufficiency of miR-146a led to severe inflammatory bowel disease (IBD). (A) The expression levels of miR-146a-5p and miR-146a-3p in the colon of patients without IBD (n = 6) or with IBD in the active stage (n = 7) or the inactive stage (n = 8) was quantified by RT-qPCR; the results represent two independent experiments with triplicates of each sample. (B) The expression level of miR-146a-5p and miR-146a-3p in the colon of WT mice treated with (n = 4) or without DSS (n = 7); the results represent two independent experiments with triplicates of each sample. (C) The schematic view of the experiment procedure of the DSS-induced IBD mouse model. (D–I) Body weight change (D, E), stool score (F, G), and disease activity index (H, I) of female [(D, F, H), n = 5, 5, 6, and 8] and male [(E, G, I), n = 5, 5, 6, and 8] WT and miR-146a+/- mice with or without 2% DSS treatment for 6 days. The results represent three independent animal experiments. (J, K) All 2% DSS-treated female [(J), image on the right] and male [(K), image on the right] miR-146a+/- mice had massive rectal bleeding (arrows point to the end of bloodstain on tails), but none of the 2% DSS-treated WT female [(G), left] and male [(H), left] mice did. (L, M) Colon length of female [(L), n = 5, 5, 6, and 6], and male [(M), n = 5, 5, 6, and 5] WT and miR-146a+/- mice treated with or without 2% DSS. Mean ± SD: female groups: WT Control = 8.56 ± 0.56 cm, miR-146a+/- Control = 8.46 ± 0.62 cm, WT+DSS = 6.967± 0.70 cm, miR-146a+/-+DSS = 5.2 ± 0.38 cm; male groups: WT Control = 8.64 ± 0.52 cm, miR-146a+/- Control = 8.42 ± 0.58 cm, WT+DSS = 8.7 ± 1.64 cm, miR-146a+/- DSS = 5.22 ± 0.38 cm. (N, O) Hematoxylin and eosin (HE) staining of the sagittal section of the colon derived from WT and miR-146a+/- mice treated with or without 2% DSS (N) and histological score of HE-stained sections (O), n = 6. All data were shown as mean ± SD *p < 0.05, **p < 0.01, ***p < 0.001, Student’s t-test was used in (A, B), two-way ANOVA analysis was performed in (D–I), and one-way ANOVA was applied in (L–O). n.s., no significance.
To further decipher the function of miR-146a in IBD, we generated a global miR-146a knock-out (KO) mouse line using CRISPR/Cas9 technology (Supplementary Figures S1A–C) and used DSS to induce mice for the development of colitis symptoms (Figure 1C). During the treatment of 2% DSS in drinking water from day 1 to day 6, the body weight of DSS-treated female (Figure 1D) and male (Figure 1E) miR-146a+/- mice dropped significantly from day 5 to day 7 compared with DSS-treated WT mice, untreated control miR-146a+/-, and WT mice, while DSS-treated female and male WT mice did not show significant body weight loss when compared to untreated WT control mice (Figures 1D, E). The stool scores of both DSS-treated WT and miR-146a+/- mice were dramatically increased from day 3 when compared to untreated controls, but there was no significant difference in stool score between DSS-treated WT and miR-146a+/- mice (Figures 1F, G). The DAI was significantly higher in DSS-treated female and male miR-146a+/- mice than in DSS-treated female and male WT mice (Figures 1H, I) from day 5 to day 7. Moreover, all 2% DSS-treated female and male miR-146a+/- mice had bloodstain on their tails, which indicated massive rectal bleeding, while 2% DSS-treated WT female and male mice did not (Figures 1J, K). Colon length and histological score are two key parameters that indicate the severity of colitis. The results showed that there was no difference in colon length between untreated WT and miR-146a+/- mice, and that 2% DSS treatment significantly shortened colon length (19%) in WT female, but not male, mice and the colon lengths of DSS-treated female and male miR-146a+/- mice were shortened by 39% and 38% when compared to untreated female and male miR-146a+/- control mice, and were also significantly shorter than DSS-treated female and male WT mice, respectively (Figures 1L, M). Colon sections of different groups were histologically stained and examined. We found that DSS treatment caused significant destruction of epithelial layer and induced inflammation in the colon of WT mice when compared to untreated WT control, and the colon derived from DSS-treated miR-146a+/- mice showed a higher histological score, with more inflammatory cell infiltration and tissue damage, than untreated miR-146a+/- and DSS-treated WT mice. Interestingly, untreated miR-146a+/- mice exhibited a slightly higher histological score, which can be attributed to inflammation when compared to untreated WT mice, indicating that miR-146a represses inflammation responses under physiological conditions (Figures 1N, O). These findings indicate that the insufficiency of miR-146a promotes the development of IBD from three aspects: colitis, bleeding, and body weight loss, and suggest that miR-146a plays a vital role in preventing the development of IBD.
MiR-146a repressed multiple genetic regulatory networks in IBD
We next investigated the genetic regulatory network regulated by miR-146a in IBD. Total RNA was extracted from colons of three untreated WT mice, three 2% DSS-treated WT mice, and three DSS-treated miR-146a-/- mice. RNA sequencing data demonstrated that 479 and 512 genes that met the criteria of p < 0.01 and |log2(Fold change)| > 1 were up- and downregulated in WT mice after DSS treatment, respectively (Figure 2A; Supplementary Table S4). However, much more genes (1,465 versus 479) were upregulated and 791 genes were downregulated in DSS-treated miR-146a-/- mice with the same criteria compared to untreated WT mice (Figure 2B; Supplementary Table S4). Maintaining p < 0.01 but lowering fold-change criteria from sixfold to fourfold or to twofold led to a disproportionate increase in upregulated genes shared between DSS-treated WT and miR-146a-/- mice and maintaining close to 67% shared gene regardless of fold-change threshold (Figures 2C, D). A disproportionate increase in IBD-related genes was also observed to be shared between DSS-treated WT and miR-146a-/- mice when lowering the fold-change criteria and maintaining more than 77% shared IBD-related gene from change thresholds of twofold (77%) to sixfold (98%) (Figures 2E, F). When increasing fold-change threshold to 10, 28 out of 71 upregulated genes in DSS-treated WT mice were IBD-related genes, while 128 out of 381 upregulated genes in DSS-treated miR-146a-/- mice were IBD-related genes, and 29 (such as Il1a, Il11, Il5ra, Il1r2, Cxcl13, Cxcl5, Osm, Arg1, Igfbp5, and Vsig4) out of 128 genes were predicted to be direct target genes of miR-146a by TargetScan8.0 (Supplementary Figures S2A, B; Supplementary Table S5). When further elevating fold-change threshold to 45, the number of upregulated IBD-related genes in DSS-treated miR-146a-/- mice was 10 times more (55 versus 5) than that in DSS-treated WT mice (Supplementary Figures S2C, D). However, the number of genes downregulated more than 10-fold in DSS-treated miR-146a-/- mice was not remarkably increased when compared to DSS-treated WT mice (64 versus 45, Supplementary Figures S2E, F; Supplementary Table S5). These findings suggest that miR-146a mainly inhibits expression of DSS-induced genes, especially IBD-related genes.
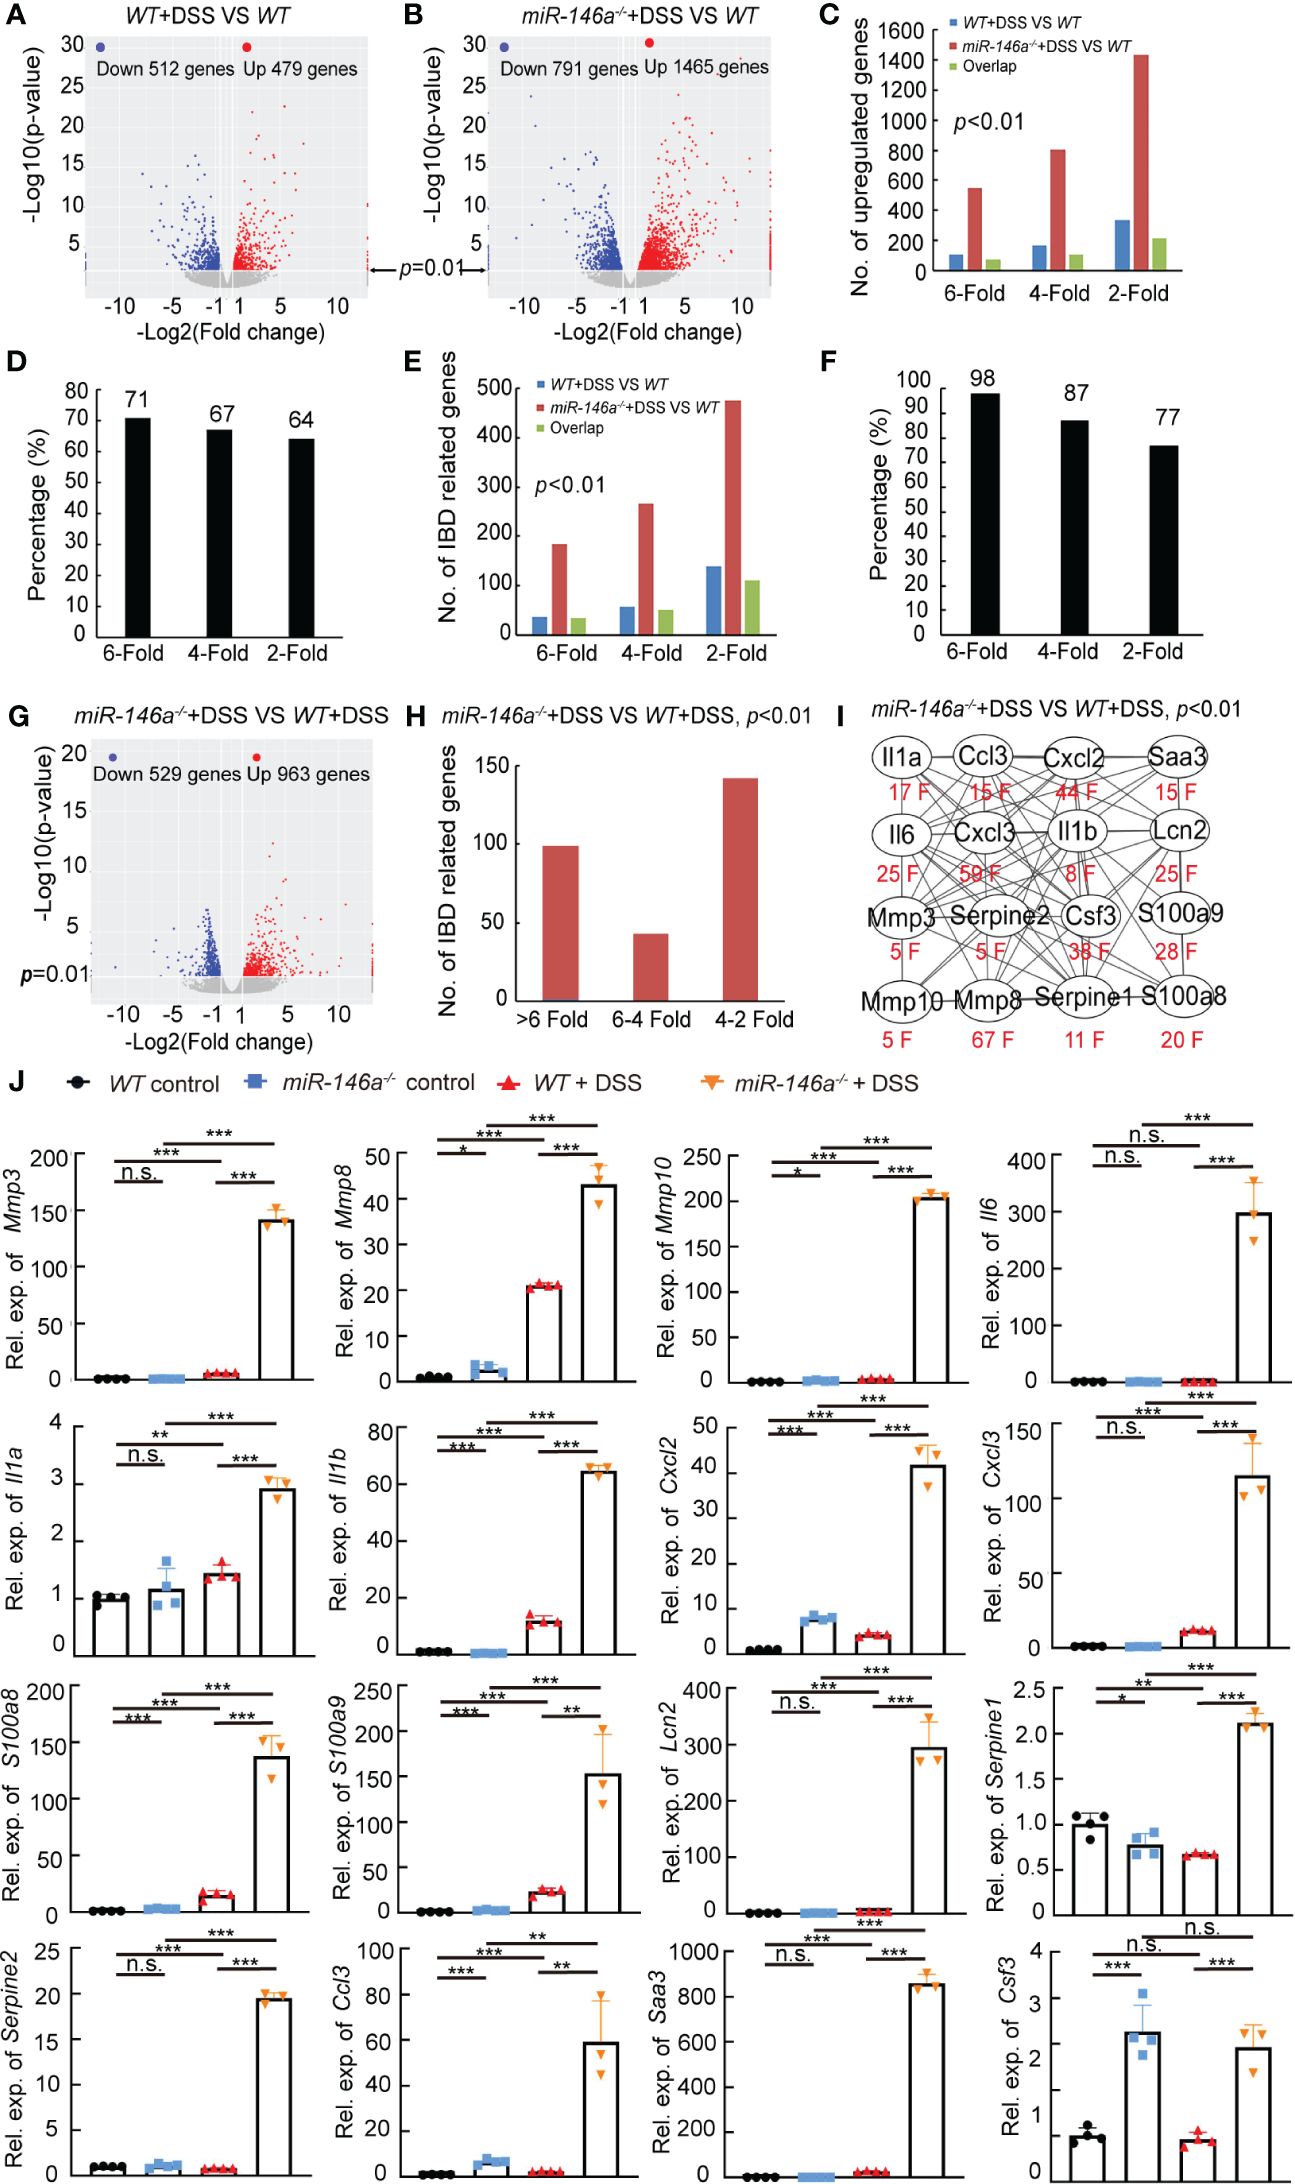
Figure 2 MiR-146a repressed DSS-induced IBD-related genes. (A, B) Volcano map of gene expressions (p < 0.01, |log2(Fold change)| > 1) in colons of DSS-treated WT (A) or miR-146a-/- mice (B) when compared to untreated WT mice. (C) Shared regulated genes in colons increased between DSS-treated WT and miR-146a-/- mice with different inclusion criteria. (D) Similar percentage of shared regulated genes in the colon between DSS-treated WT and miR-146a-/- mice with different inclusion criteria. (E) Number of shared regulated IBD-related genes in colons increased between DSS-treated WT and miR-146a-/- mice with different inclusion criteria. (F) Comparable percentage of shared regulated IBD-related genes in colons between DSS-treated WT and miR-146a-/- mice with different inclusion criteria. (G) Volcano plot of differentially expressed genes in colons of DSS-treated miR-146a-/- mice when compared to DSS-treated WT mice. (H) The number of upregulated IBD-related genes in colons of miR-146a-/- mice when compared to DSS-treated WT mice. (I) The fold change and the interaction network of selected representative upregulated IBD-related genes, Il1a, Il1b, Il6, Ccl3, Cxcl2, Cxcl3, Saa3, Csf3, Lcn2, Mmp3, Mmp8, Mmp10, Serpine1, Serpine2, S100a8, and S100a9. String APP in Cytoscape was used to analyze the protein functional network (37, 38). (J) The expression levels of Mmp3, Mmp8, Mmp10, Il6, Il1a, Il1b, Cxcl2, Cxcl3, S100a8, S100a9, Lcn2, Serpine1, Serpine2, Ccl3, Saa3, and Csf3 in colons of WT control, DSS-treated WT, miR-146a-/,- and DSS-treated miR-146a-/- mice measured by RT-qPCR; the results represent two independent experiments with triplicates of each sample. Data were shown as mean ± SD *p < 0.05, **p < 0.01, ***p < 0.001, Student’s t-test, n = 4, 4, and 3. n.s., no significance.
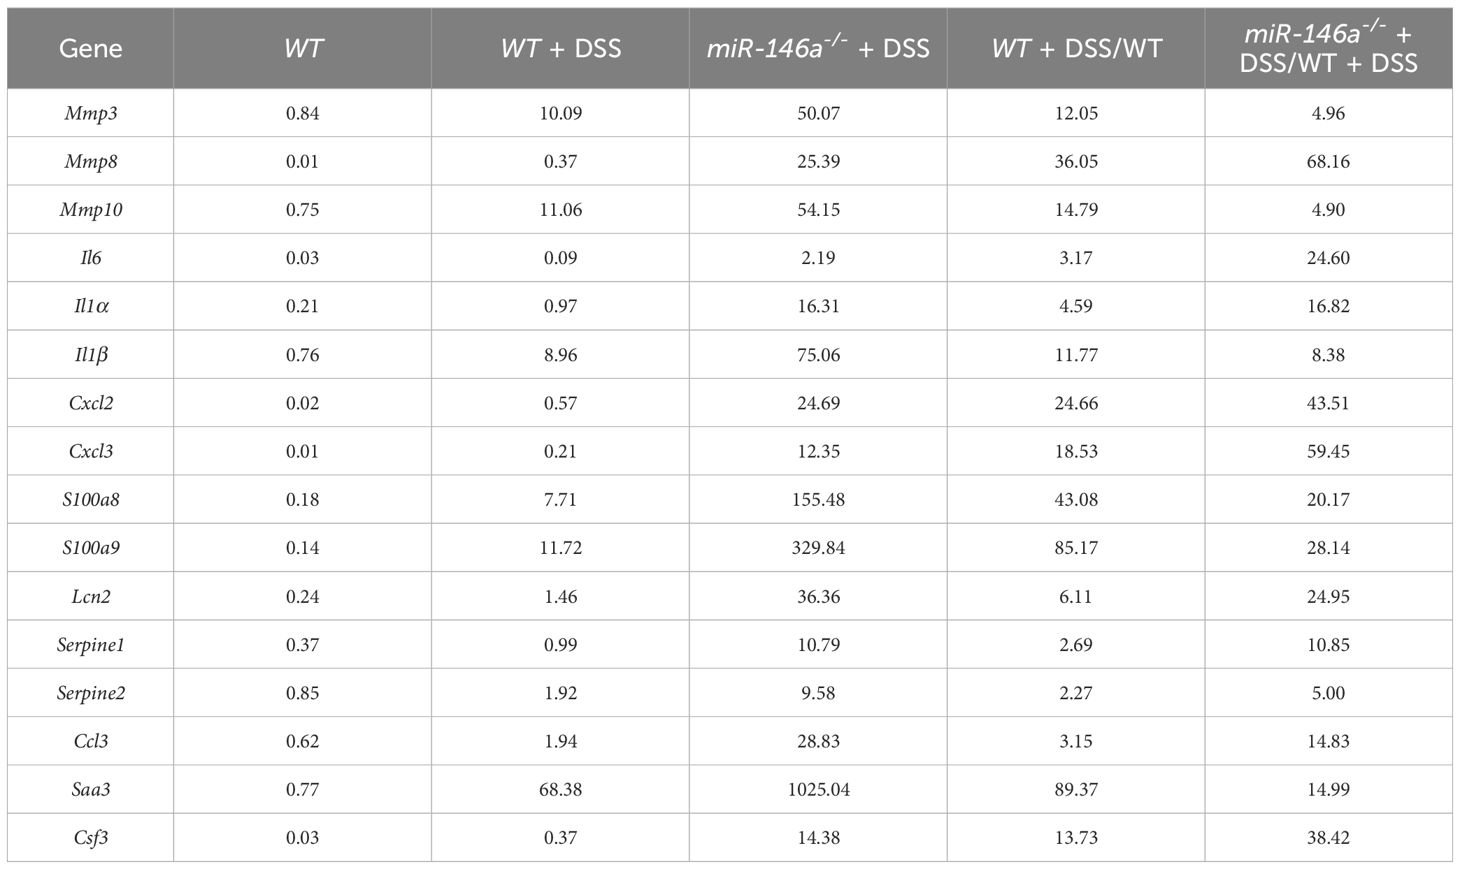
Further analyses found that 963 and 529 genes that met the criteria of p < 0.01 and |log2(fold change)| > 1 were up- and downregulated in DSS-treated miR-146a-/- when compared to DSS-treated WT mice, respectively (Figure 2G; Supplementary Figure S3A). Principal component analysis also showed that the mRNA expression profile in the colon of DSS-treated miR-146a-/- mice was separated from DSS-treated WT mice and naïve mice (Supplementary Figure S3B).When increasing fold-change threshold to 10, 225 and 41 genes were up- and downregulated in DSS-treated miR-146a-/- mice when compared to DSS-treated WT mice, respectively, and 64 out of 225 were IBD-related genes (Supplementary Figures S3C, D). Hundreds of IBD-related genes were further induced by DSS in miR-146a-/- mice more than twofold and 141 IBD-related genes were upregulated by more than fourfold when compared to DSS-treated WT mice (Figure 2H; Supplementary Figure S3E). These upregulated IBD-related genes belong to genetic regulatory networks of innate immune responses, intestinal epithelial and vascular endothelial barriers, and coagulation, corresponding to all symptoms of IBD (colitis, bleeding, bowel problems, and body weight loss) (Supplementary Figures S3C, E). It is known that cytokines, chemokines, and other pro-inflammatory factors are upregulated in patients with IBD (39–41). Matrix metalloproteinases (MMPs) destroy the extracellular matrix, damage the intestinal epithelial barrier and vascular endothelial barrier, and subsequently affect digestion and absorption, leading to bleeding (6). Another reason for massive bleeding is dysfunction in coagulation (13). Thus, 16 out of 141 further upregulated more than fourfold genes, which shows that multiple genetic regulatory networks involved in IBD were selected for validation: Il1a, Il1b, and Il6 from the cytokine family; Ccl3, Cxcl2, and Cxcl3 from the chemokine family; Serum Amyloid A3 (Saa3), colony stimulating factor 3 (Csf3), Lipocalin-2 (Lcn2), S100a8, and S100a9 from pro-inflammatory factors; Mmp3, Mmp8, and Mmp10 from the MMP family; and Serpine1 and Serpine2 from the Serpin family, which inhibits serine proteases including thrombin, urokinase, and plasmin and is related to coagulation (Figure 2I; Table 1).
Quantitative RT-PCR confirmed the dramatic upregulation of these 16 genes in the colon of DSS-treated miR-146a-/- mice compared to DSS-treated WT mice, and the expression levels of Mmp3, Mmp8, Mmp10, Il1a, Il1b, Cxcl2, Cxcl3, S100a8, S100a9, Lcn2, Ccl3, and Saa3 increased in the colon of DSS-treated WT mice compared to WT control mice (Figure 2J). It is also interesting to find that the expression levels of Mmp8, Mmp10, Cxcl2, Cxcl3, S100a8, S100a9, Ccl3, and Csf3 increased in the colon of DSS-treated WT mice comparing to WT control mice (Figure 2J). Further immunostaining demonstrated that the protein expression levels of MMP3, MMP8, MMP10, IL1A, IL1B, IL6, CXCL2, CXCL3, S100A8, and S100A9 significantly increased in the colon of WT mice after DSS treatment, and further increased in the colon of DSS-treated miR-146a+/- mice. Since it was reported that miR-146a negatively regulated TRAF6 and IRAK1, and that p65 (RelA) is a predicted target of miR-146a-3p, we examined and found that the expression of TRAF6, IRAK1, p65, and p-p65 (phosphorylated p65) was also further upregulated in the colon of DSS-treated miR-146a+/- mice when compared to DSS-treated WT mice (Figures 3A, B). Note that the expression levels of MMP3, MMP8, MMP10, IL1A, IL1B, IL6, CXCL2, CXCL3, S100A8, S100A9, TRAF6, P65, pP65, and IRAK1 increased in the colon of untreated miR-146a+/- mice when compared to untreated WT mice, indicating that miR-146a prevents the allergic response of the intestine to a normal environment (Figures 3A, B). These findings suggest that de-repression of genetic regulatory networks of immunity, intestinal epithelial and vascular endothelial barriers, and coagulation is the molecular mechanism for massive bleeding and body weight loss in DSS-treated miR-146a KO mice.
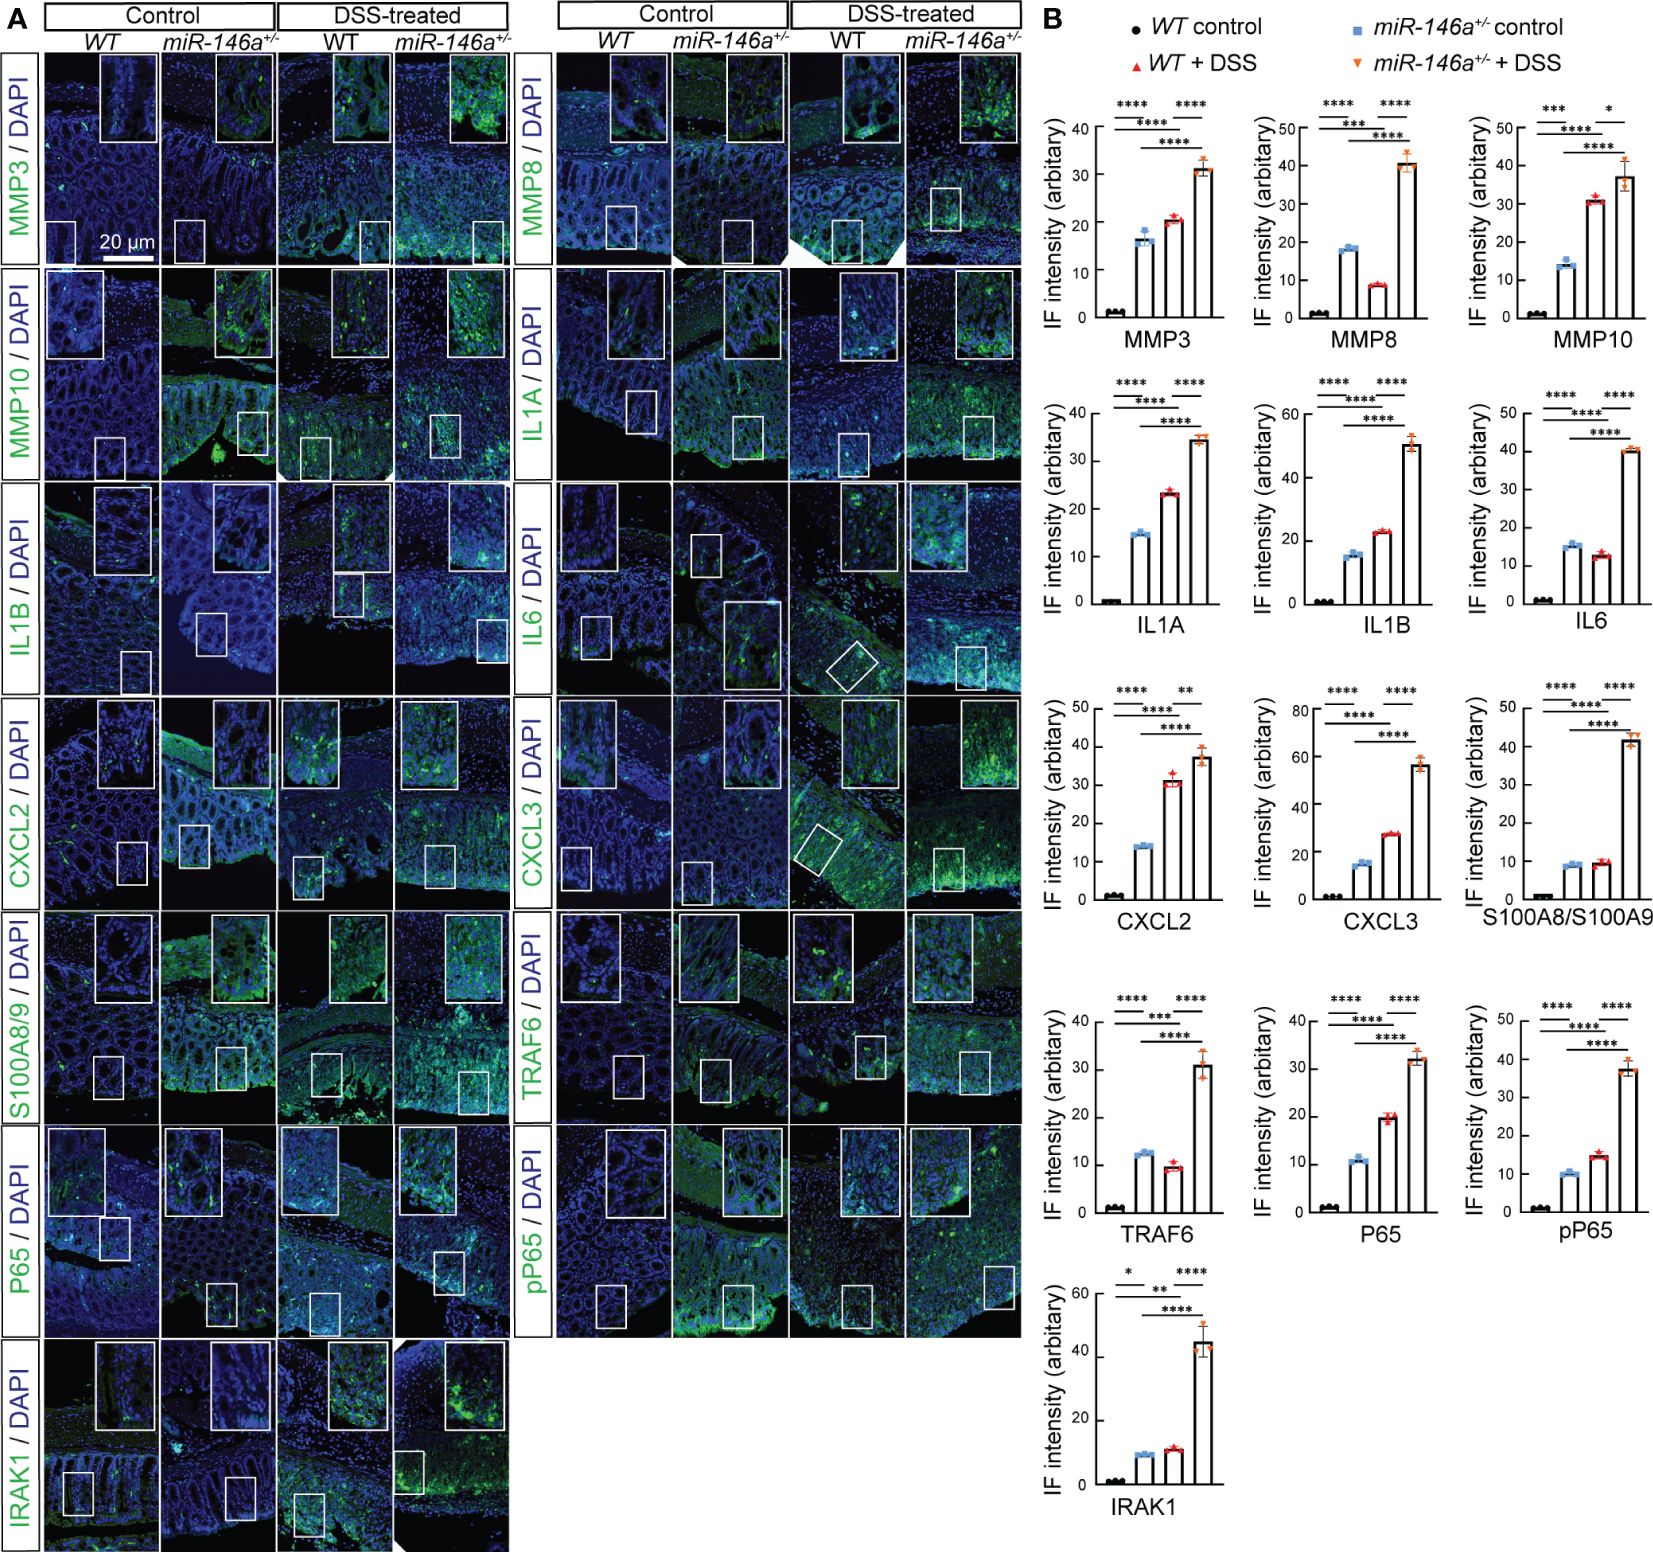
Figure 3 Haploinsufficiency of miR-146a led to further upregulation of DSS-induced IBD-related genes. (A) Double staining with DAPI (blue) and antibody (green) against MMP3, MMP8, MMP10, IL1A, IL1B, IL6, CXCL2, CXCL3, S100A8/A9, TRAF6, P65, pP65, or IRAK1 on colon sections derived from control WT, DSS-treated WT, and DSS-untreated and -treated miR-146a+/- mice. The inset images are the high-magnification view of the boxed area on the bottom of the corresponding images. (B) Quantification of immune fluorescence intensity. Data were shown as mean ± SD *p < 0.05, **p < 0.01, ***p < 0.001, ****p < 0.001, one-way ANOVA, n = 3. The results represent three independent staining experiments.
Supplementation with miR-146a mimics attenuated DSS-induced IBD in miR-146a-/- mice
Next, we examined whether supplementation with miR-146a mimics could relieve DSS-induced IBD in miR-146a-/- mice. MiR-146a-/- mice were divided into three groups, treatment with saline, treatment with 2% DSS and saline, treatment with 2% DSS and miR-146a mimics (Figure 4A). The results showed that 2% DSS induced severe IBD in miR-146a-/- mice with obvious body weight loss and an increase in stool score and DAI, and that the combination of gavage administration and intraperitoneal injection of the modified miR-146a-5p and miR-146a-3p mimics for four times every other day significantly reduced body weight loss, stool score, and DAI in DSS-treated miR-146a-/- mice when compared to DSS + saline-treated miR-146a-/- mice (Figures 4B–D). DSS-induced spouted bleeding of miR-146a-/- mice was eliminated by supplementation with miR-146a mimics (Figure 4E). MiR-146a mimics prevented 32% DSS-induced reduction in the colon length and attenuated the destruction of the intestine as well as inflammatory cell filtration (Figures 4F–H). These results demonstrated that supplementation with miR-146a mimics can relieve DSS-induced IBD in miR-146a-/- mice.
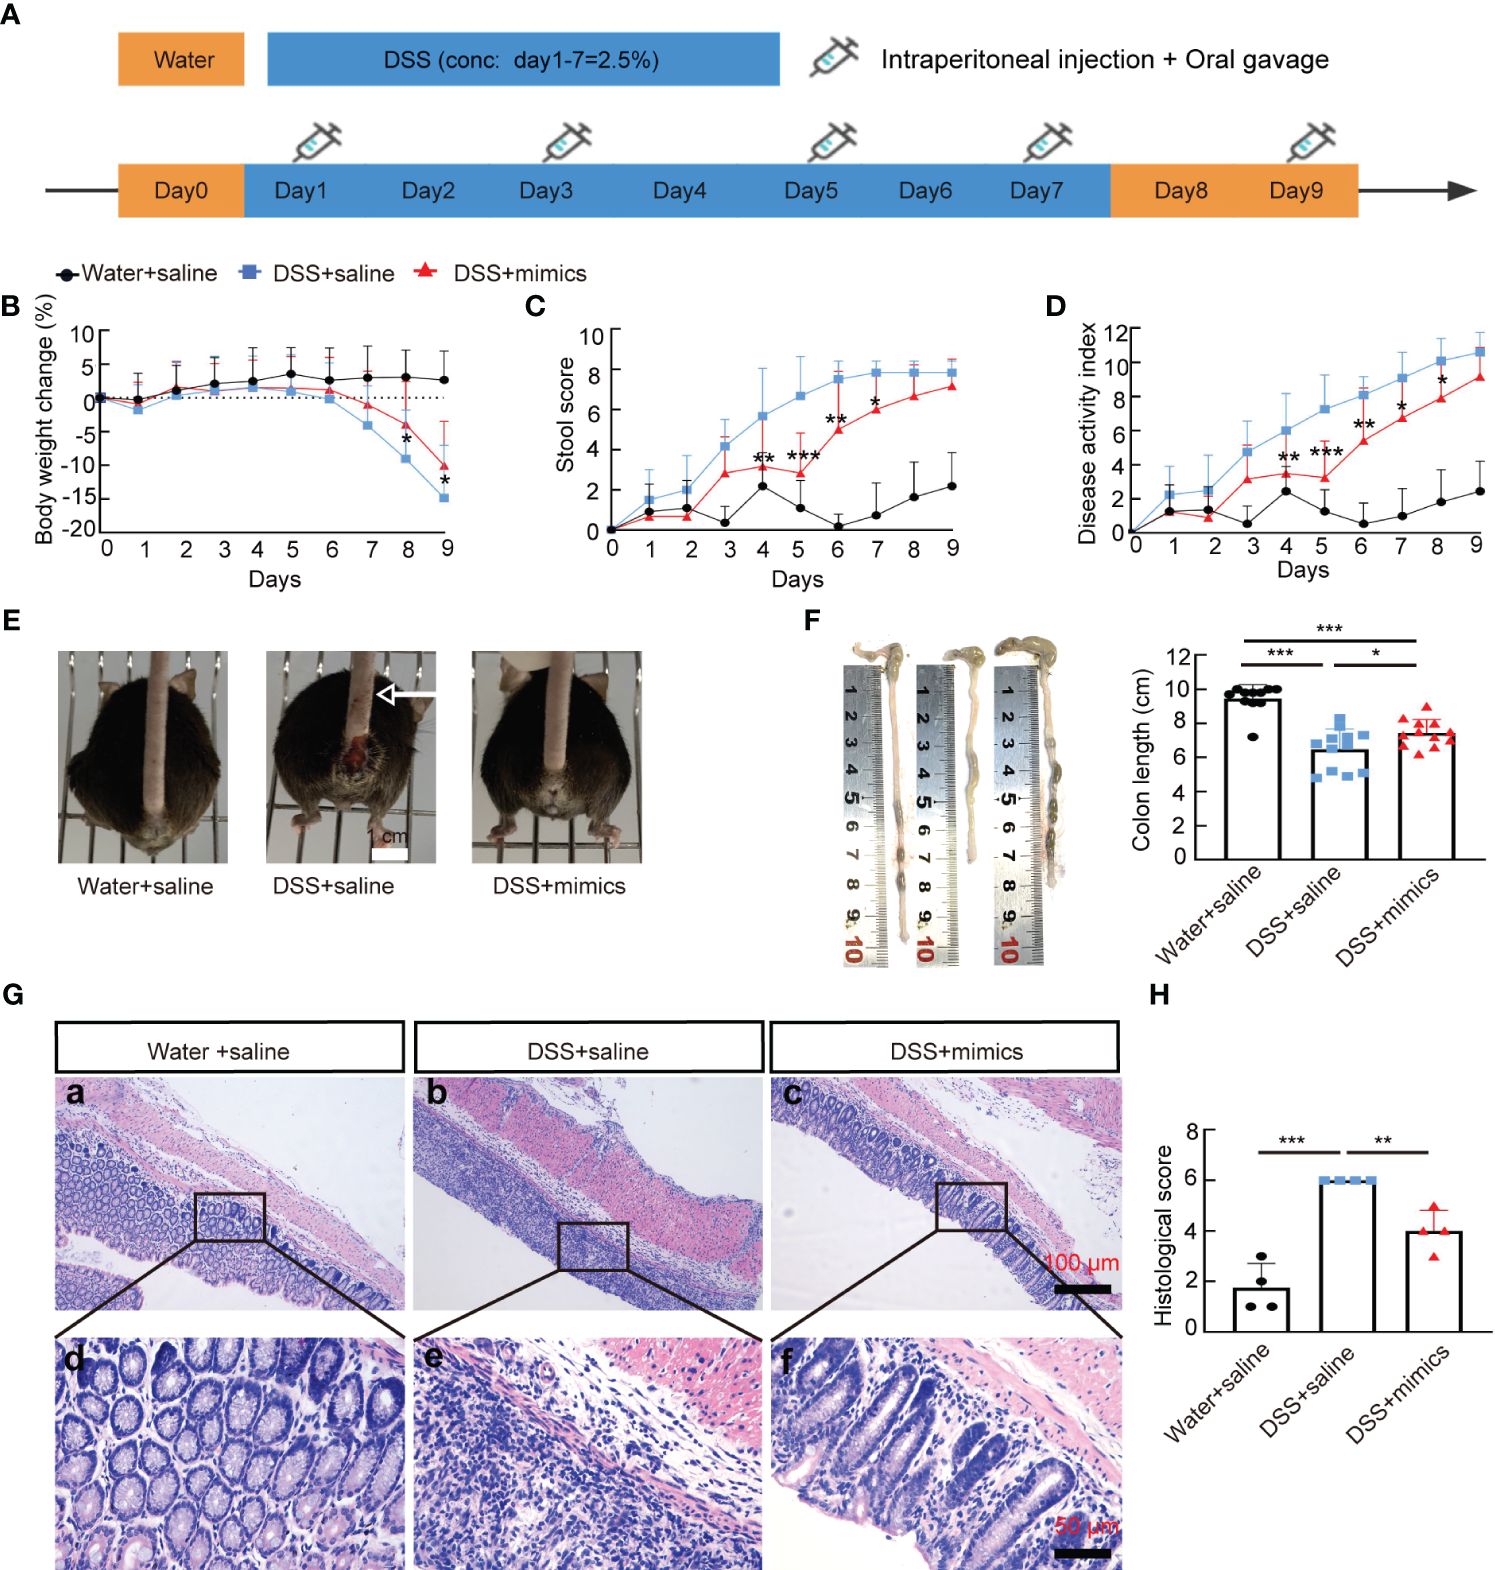
Figure 4 MiR-146a mimics alleviated DSS-induced IBD in miR-146a-/- mice. (A) The scheme of the rescue experiment. (B–D) Body weight change (B), stool score (C), and disease activity index (D) of saline-treated (n = 11), DSS + saline-treated (n = 12), and DSS + miR-146a mimics-treated (n = 12) miR-146a-/- mice. The results represent three independent animal experiments. (E) All 2% DSS + saline-treated miR-146a-/- mice (middle) had severe rectal bleeding (arrows point to the end of bloodstain on tails), but neither of the saline-treated nor DSS + miR-146a mimics-treated miR-146a-/- mice did. (F) Colon length of saline-treated (n = 11), DSS + saline-treated (n = 12), and DSS + miR-146a mimics-treated (n = 12) miR-146a-/- mice. Mean ± SD: Water + saline = 9.455 ± 0.81 cm, DSS + saline = 6.475 ± 1.2 cm, and DSS + mimics = 7.442 ± 0.79 cm. (G, H) HE staining of the sagittal section of colons derived from saline-treated, DSS + saline-treated, and DSS + miR-146a mimics-treated miR-146a-/- mice (G) and histological score of HE-stained sections (H), n = 4. All data were shown as mean ± SD *p < 0.05, **p < 0.01, ***p < 0.001, two-way ANOVA was used in (B–D) and one-way ANOVA was used in (F–H).
MiR-146a mimics represses expression of multiple genetic regulatory networks
To identify the downregulated IBD-related genes by miR-146a mimics, RNA sequencing was performed and the results illustrated that 135 and 69 genes that met the criteria of p < 0.01 and |log2(Fold change)| > 1 were down- and upregulated in the colon of miR-146a mimics + DSS-treated miR-146a-/- mice, when compared to DSS + saline-treated miR-146a-/- mice, respectively, and 50 out of the 135 genes were downregulated IBD-related genes (Figures 5A, B; Supplementary Table S6). Principal component analysis showed that the mimics treatment pulled the expression profile back towards health status (Supplementary Figure S4). Quantitative RT-PCR showed that the expression levels of Mmp3, Mmp8, Mmp10, Il1a, Il6, Il1b, Cxcl2, Cxcl3, S100a8, S100a9, Lcn2, Serpine1, Serpine2, Ccl3, Saa3, and Csf3 were induced in the colon of DSS + saline-treated miR-146a-/- mice, but reversed by miR-146a mimics (Figure 5C). Further immunostaining demonstrated that the expression levels of MMP3, MMP8, MMP10, IL1A, IL1B, IL6, CXCL2, CXCL3, S100A8, S100A9, TRAF6, p65, p-p65, and IRAK1 were induced by DSS in the colon of miR-146a-/- mice, but repressed by miR-146a mimics (Figures 6A, B).
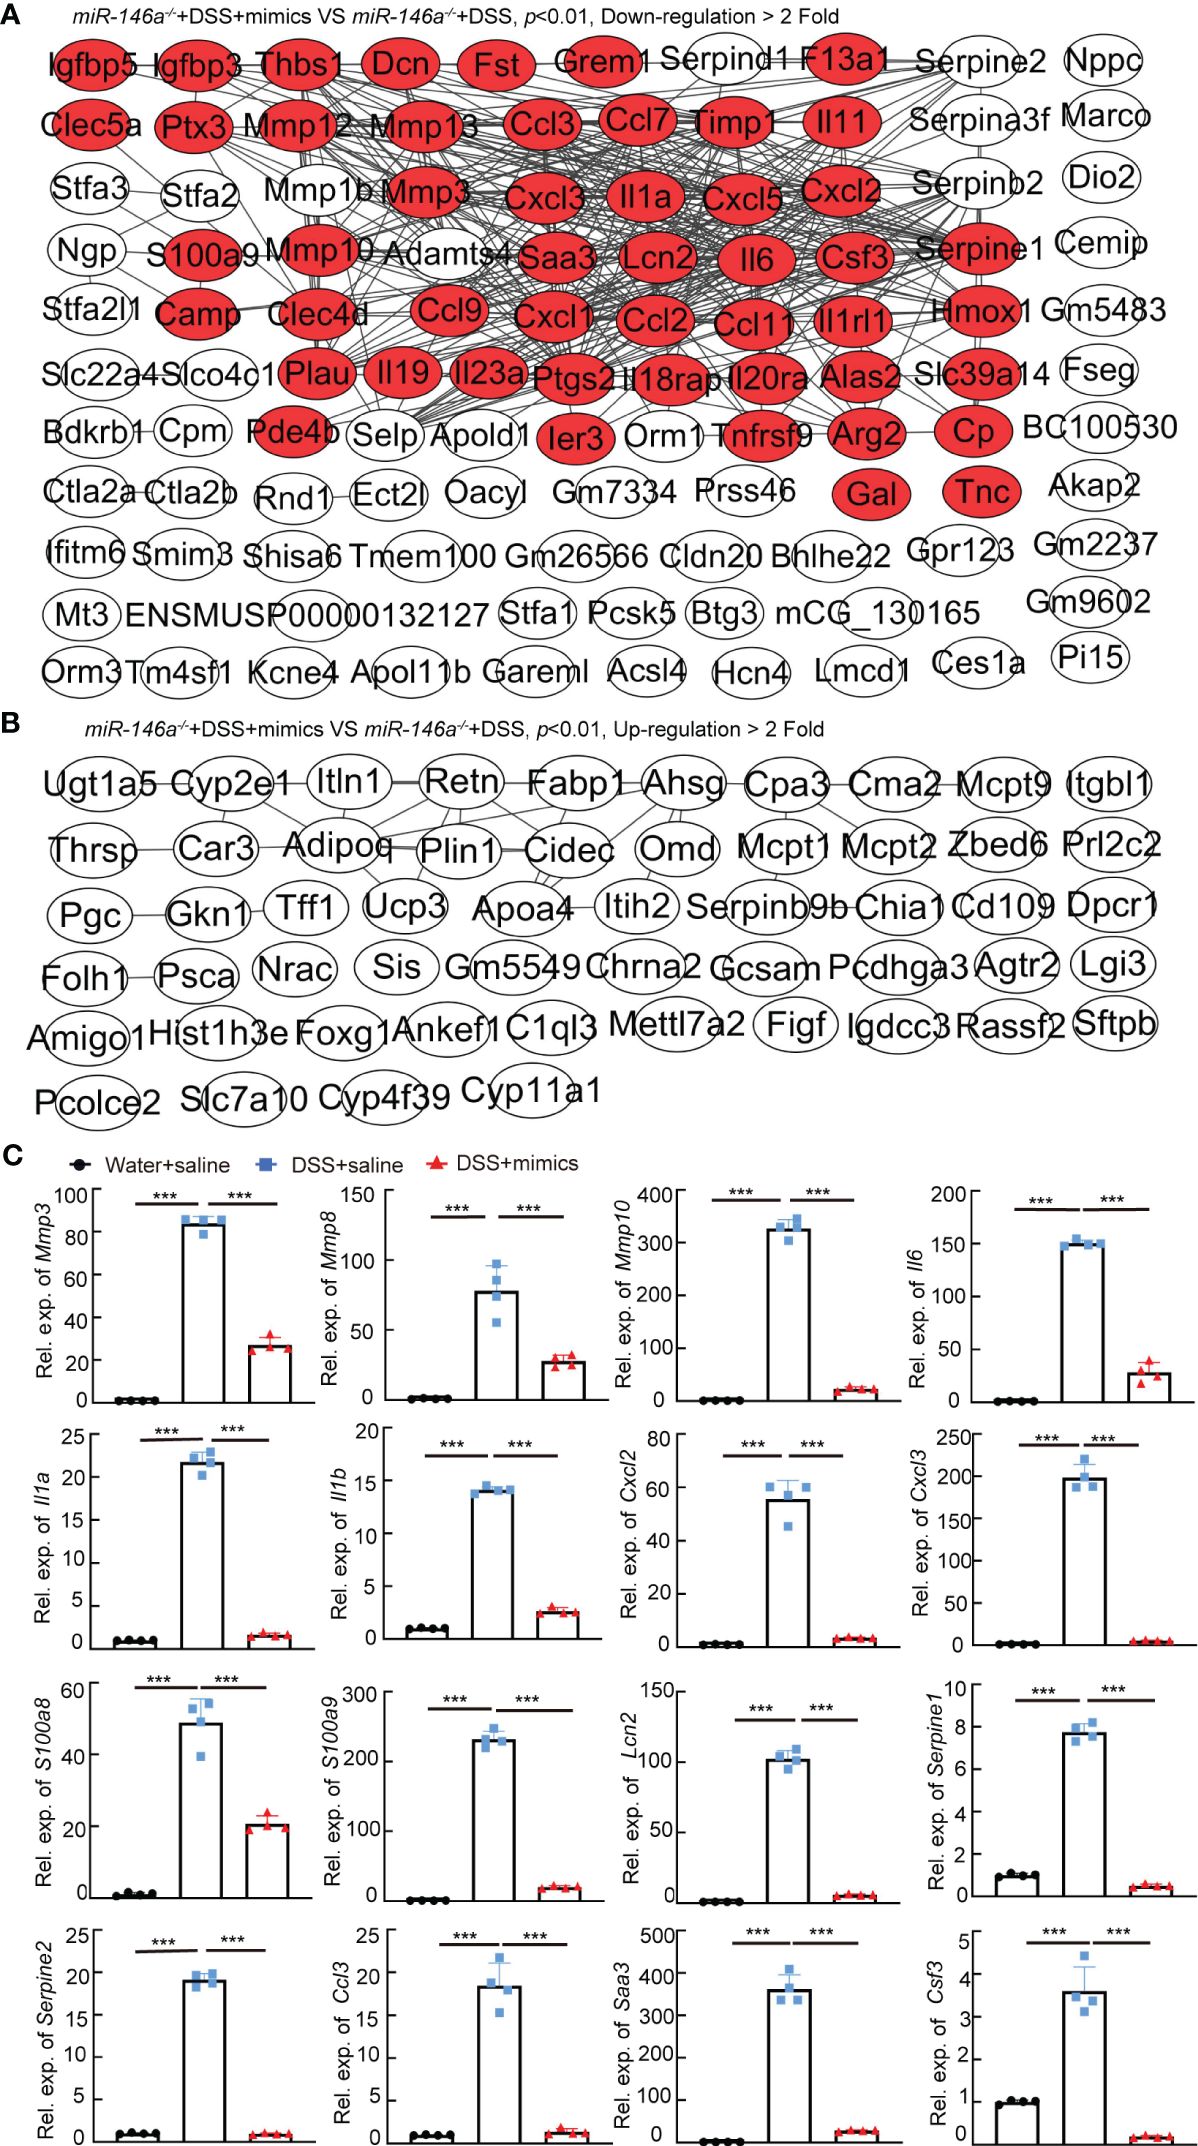
Figure 5 The regulatory effects of miR-146a mimics on DSS-induced gene regulatory network in colons of miR-146a-/- mice. (A) The functional interaction network of downregulated genes by miR-146a mimics in the colon of DSS-treated miR-146a-/- mice was analyzed using String database APP in Cytoscape. Out of the 135 downregulated genes, 108 with or without predicted connections (gray lines, inclusion criteria: downregulated fold ≥ 2 and p value <0.01) were shown. Red marked IBD-related genes. Data were derived from five miR-146a mimics + DSS-treated miR-146a-/- mice and six saline + DSS-treated miR-146a-/- mice. (B) The functional interaction network of upregulated genes by miR-146a mimics in colons of DSS-treated miR-146a-/- mice was analyzed using String database APP in Cytoscape. Out of the 69 upregulated genes, 54 with or without predicted connections (gray lines, inclusion criteria: upregulated fold ≥ 2 and p value <0.01) were shown. (C) The expression levels of Mmp3, Mmp8, Mmp10, Il6, Il1a, Il1b, Cxcl2, Cxcl3, S100a8, S100a9, Lcn2, Serpine1, Serpine2, Ccl3, Saa3, and Csf3 in colons of saline-treated, DSS + saline-treated, and DSS + miR-146a mimics-treated miR-146a-/- mice measured by RT-qPCR; the results represent two independent experiments with triplicates of each sample. Data were shown as mean ± SD ***p < 0.001, one-way ANOVA, n = 4, 4, and 4.
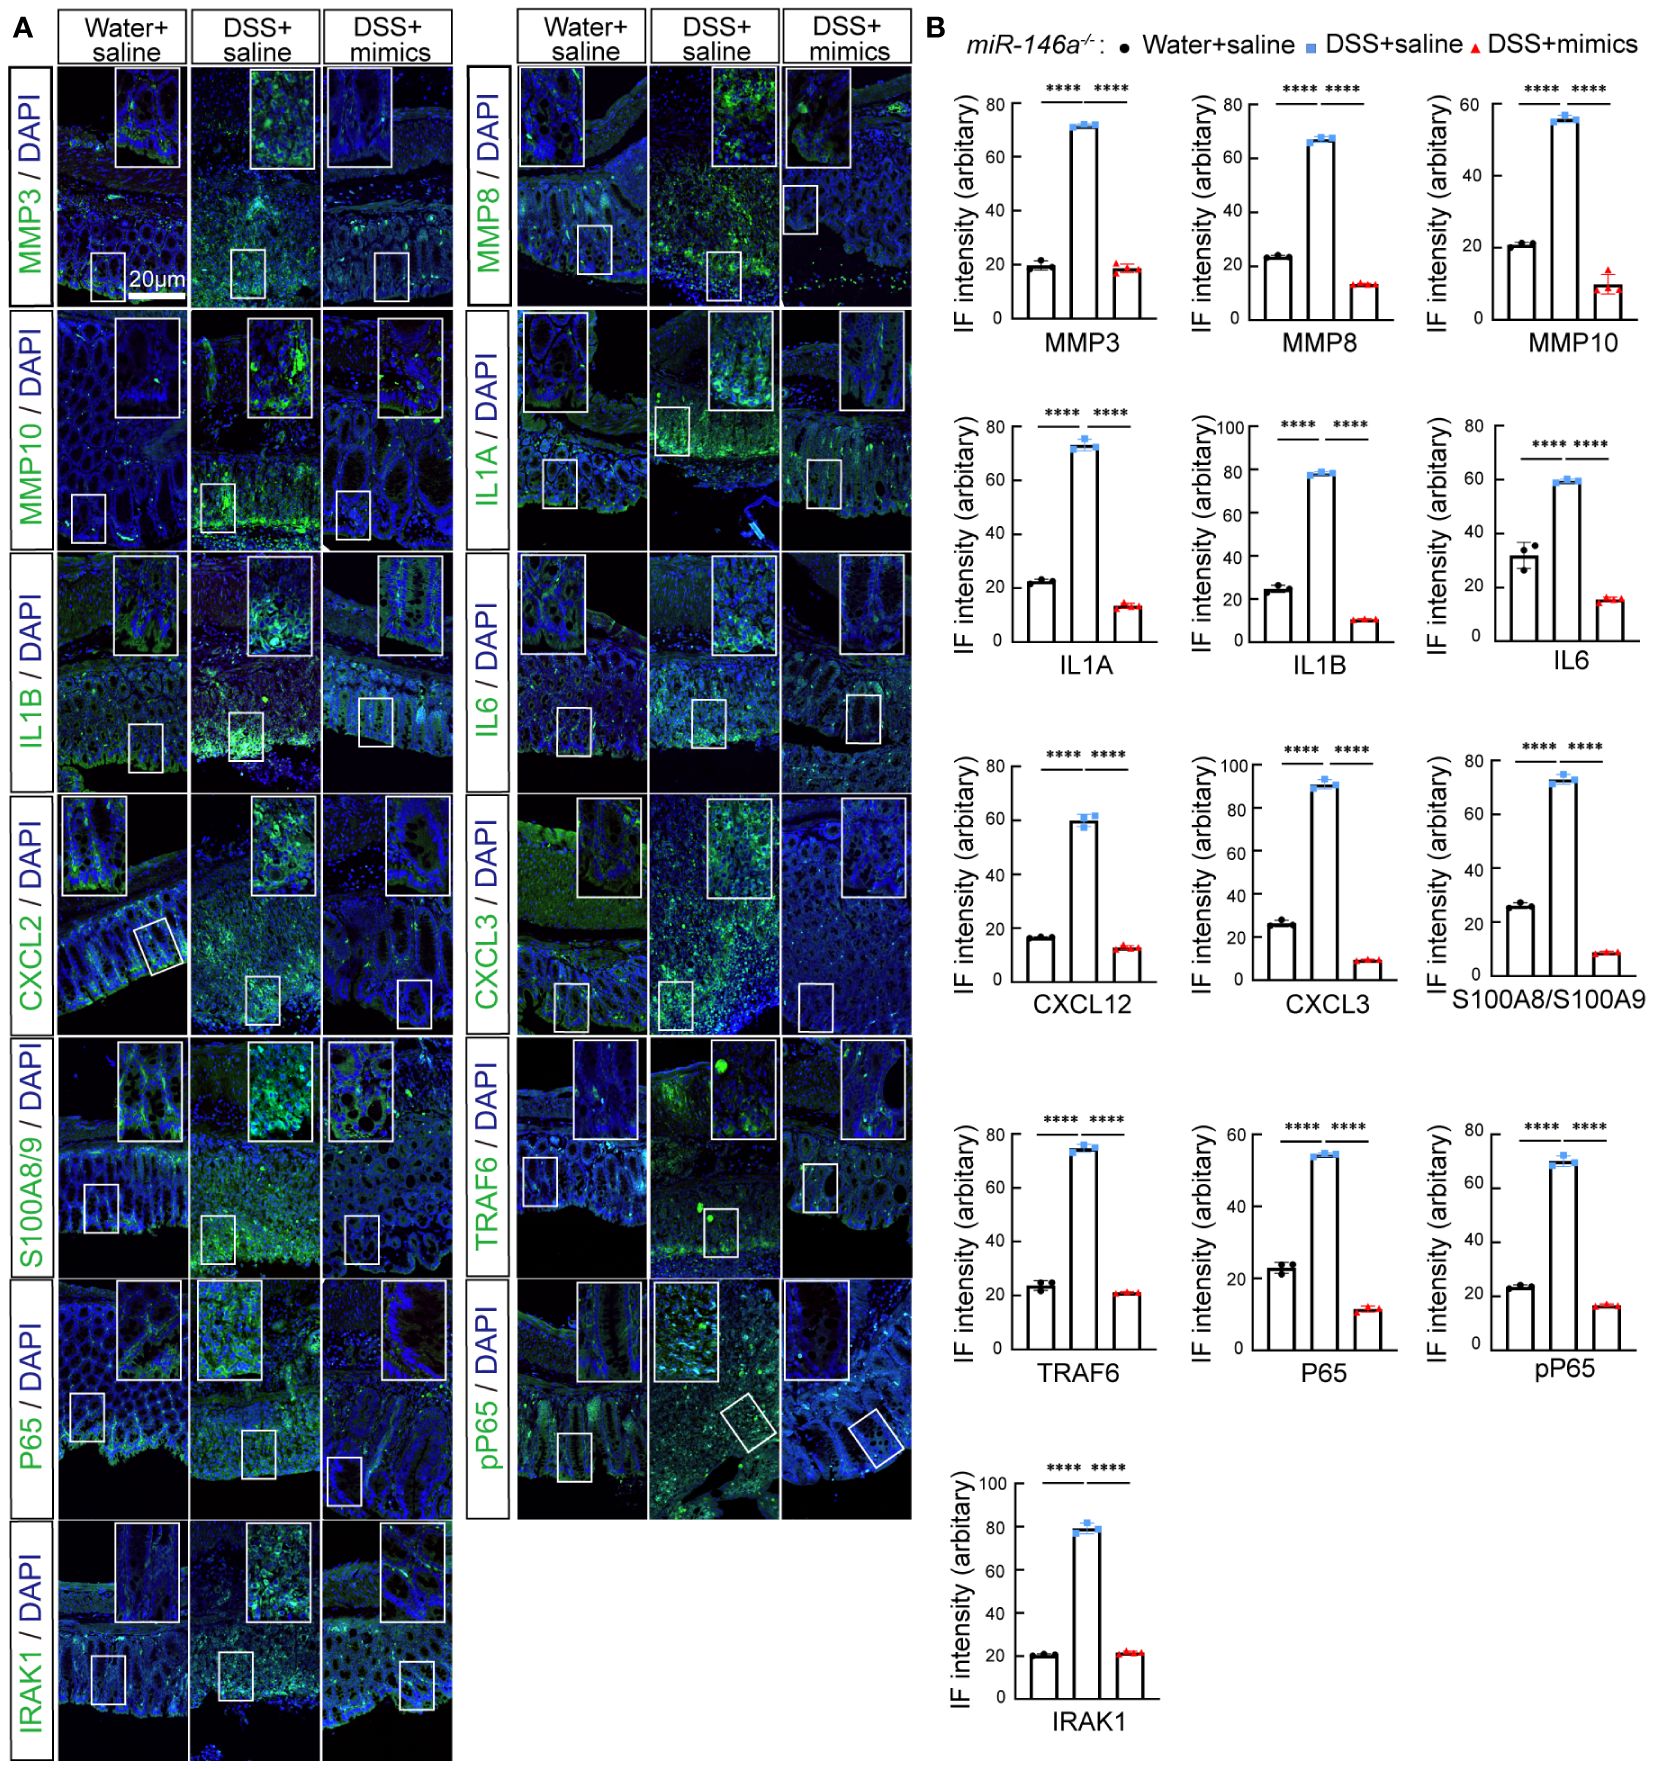
Figure 6 MiR-146a mimics repressed DSS-induced IBD-related genes in colons of miR-146a-/- mice. (A) Double staining with DAPI (blue) and antibody (green) against MMP3, MMP8, MMP10, IL1A, IL1B, IL6, CXCL2, CXCL3, S100A8/A9, TRAF6, P65, pP65, or IRAK1 on colon sections derived from saline-treated, DSS + saline-treated, and DSS + miR-146a mimics-treated miR-146a-/- mice. The inset images are the high-magnification view of the boxed area on the bottom of the corresponding images. (B) Quantification of immune fluorescence intensity. Data were shown as mean ± SD ****p < 0.001, one-way ANOVA, (n = 3, 3, and 4). The results represent three independent staining experiments.
MiR-146a mimics relieved DSS-induced colitis in WT mice
We next examined whether miR-146a mimics could attenuate DSS-induced IBD in WT mice. WT mice were divided into three groups. Two groups of mice were fed with 2.5% DSS in water on day 1, followed by 2% DSS from day 2 to day 6, and water on day 7; the other group of mice were fed with water (Figure 7A). The results showed that DSS induced severe IBD in WT mice with obvious body weight loss and an increase in stool score and DAI, and that intraperitoneal injection of miR-146a-5p and miR-146a-3p mimics for four times every other day did not reduce body weight loss, but decreased stool score and DAI in DSS-treated WT mice when compared to DSS + saline-treated WT mice (Figures 7B–D). Moreover, miR-146a mimics prevented DSS-induced reduction in colon length of WT mice (Figure 7E), and decreased damage to the intestine as well as inflammatory cell filtration (Figure 7F). Quantitative RT-PCR showed that the expression levels of Mmp3, Mmp8, Mmp10, Il6, Il1a, Cxcl2, Cxcl3, S100a8, S100a9, and Lcn2 were induced in the colon of DSS + saline-treated WT mice, but significantly downregulated by miR-146a mimics (Figure 7G). The upregulation of Saa3 was not significantly repressed by miR-146a mimics, and downregulation of Serpine1, Serpine2, and Csf3 was detected in DSS + saline-treated WT mice when compared to saline-treated WT mice. MiR-146a mimics restored the expression levels of Serpine1 and Csf3 (Figure 7G). Surprisingly, the expression of Il1b and Ccl3 was further increased in the colon of miR-146a mimics + DSS-treated WT mice compared to DSS + saline-treated WT mice. Further immunostaining illustrated that the expression levels of MMP3, MMP8, MMP10, IL1A, IL1B, IL6, CXCL2, CXCL3, S100A8, S100A9, TRAF6, p65, p-p65, and IRAK1 were induced by DSS in the colon of WT mice, but reversed by miR-146a mimics (Figure 8). To investigate whether the modified miR-146a mimics were uptaken by intestinal cells, Cy3-conjugated miR-146a-5p mimics and Cy3-conjugated miR-146a-3p mimics were administrated into WT mice via gavage or intraperitoneal injection or combinatory injection, and the fluorescence images captured by confocal microscopy showed that miR-146a mimics were uptaken by intestinal cells 4 h after administration, and more absorption of miR-146a mimics was found in the gavage and intraperitoneal injection combination group (Supplementary Figure S5).
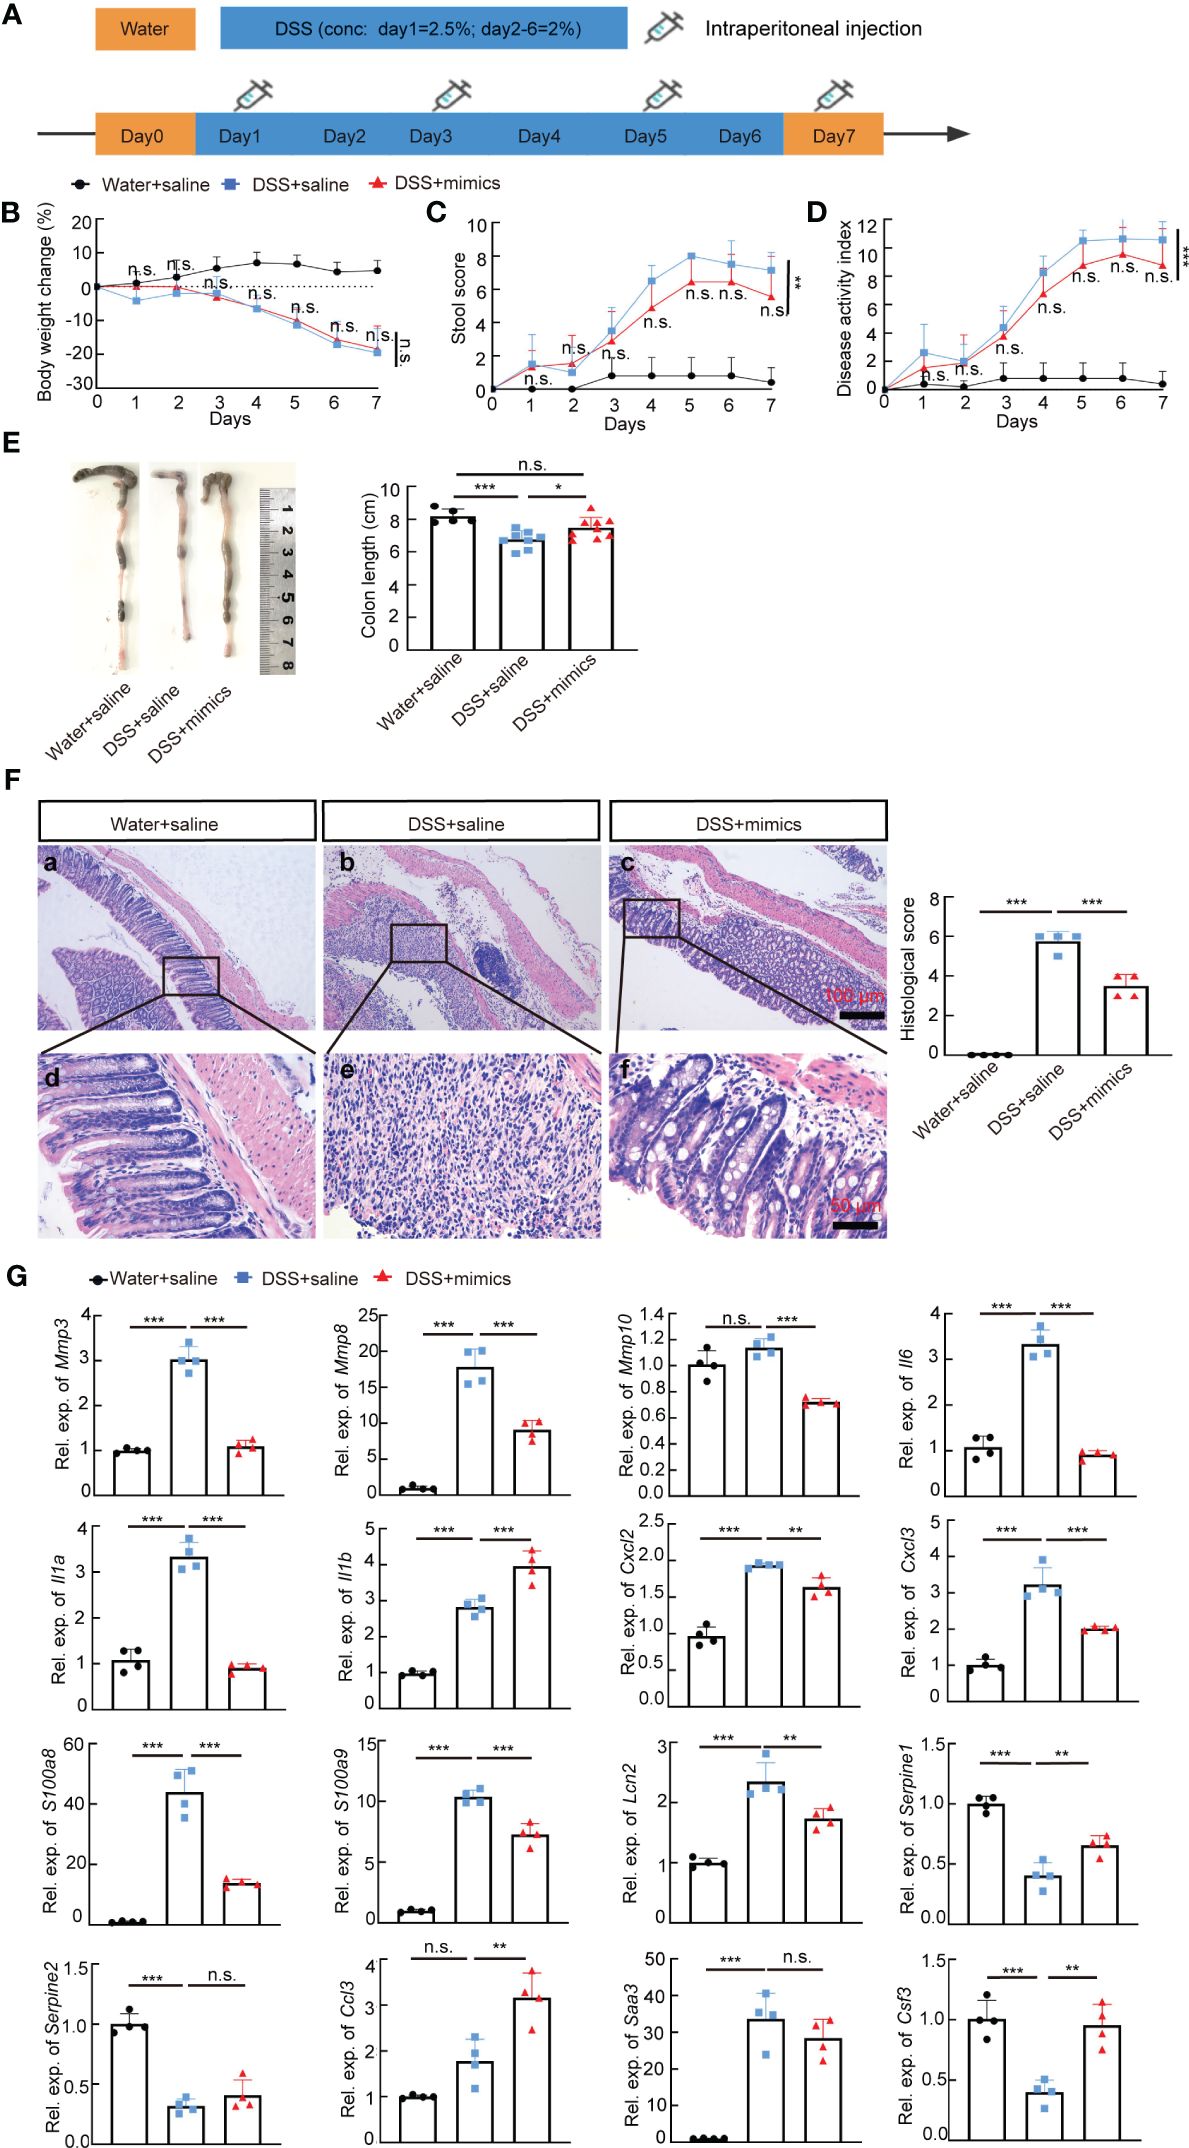
Figure 7 MiR-146a mimics relieved IBD symptoms through regulating DSS-induced IBD-related genes in WT mice. (A) The scheme of the experiment procedure. (B–D) Body weight change (B), stool score (C), and disease activity index (D) of saline-treated, DSS + saline-treated, and DSS + miR-146a mimics-treated WT mice, n = 5, 8, and 9. (E) Colon length of saline-treated, DSS + saline-treated, and DSS+miR-146a mimics-treated WT mice, n = 5, 8, and 9. Mean ± SD: Water + saline = 8.18 ± 0.44 cm, DSS + saline = 6.75 ± 0.54 cm, and DSS + mimics = 7.467 ± 0.644 cm. The results represent three independent animal experiments. (F) HE staining of sagittal sections of colon derived from saline-treated, DSS + saline-treated, and DSS + miR-146a mimics-treated WT mice and histological score of HE-stained sections, n = 4. (G) The expression levels of Mmp3, Mmp8, Mmp10, Il6, Il1a, Il1b, Cxcl2, Cxcl3, S100a8, S100a9, Lcn2, Serpine1, Serpine2, Ccl3, Saa3, and Csf3 in colons of saline-treated, DSS + saline-treated, and DSS + miR-146a mimics-treated WT mice measured by RT-qPCR. n = 4, 4, and 4. All data were shown as mean ± SD *p < 0.05, **p < 0.01, ***p < 0.001, two-way ANOVA was used in (B–D) and one-way ANOVA was used in (E–G). n.s., no significance.
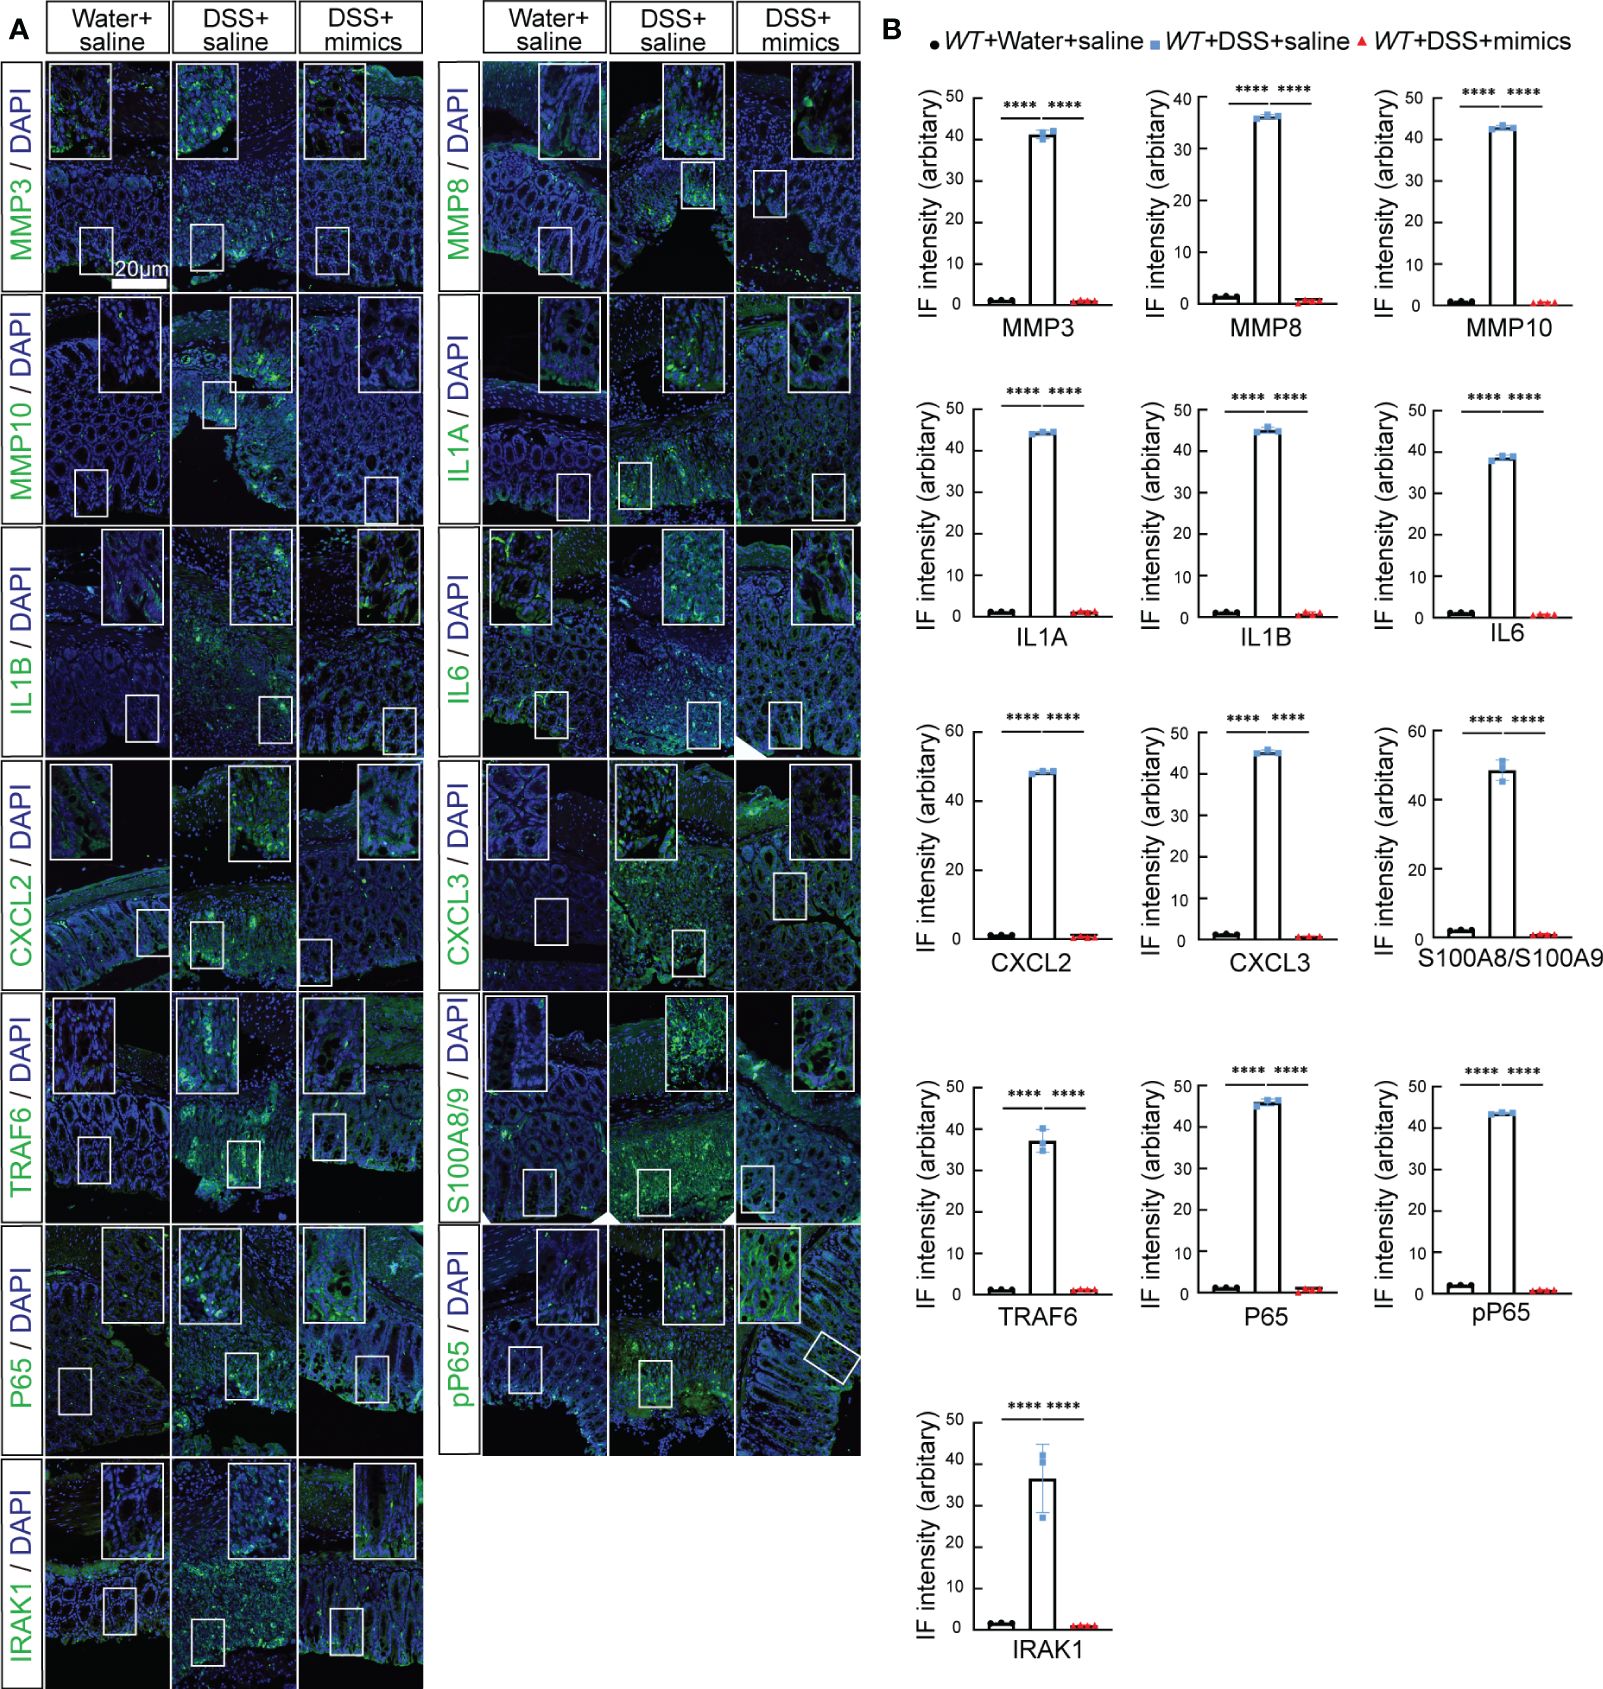
Figure 8 MiR-146a mimics repressed DSS-induced IBD-related genes in colons of WT mice. (A) Double staining with DAPI (blue) and antibody (green) against MMP3, MMP8, MMP10, IL1A, IL1B, IL6, CXCL2, CXCL3, S100A8/A9, TRAF6, P65, pP65, or IRAK1 on colon sections derived from saline-treated, DSS + saline-treated, and DSS + miR-146a mimics-treated WT mice. The inset images are the high-magnification view of the boxed area on the bottom of the corresponding images. (B) Quantification of immune fluorescence intensity. Data were shown as mean ± SD, ****p < 0.0001, one-way ANOVA, n = 3, 3, and 4. The results represent three independent staining experiments.
The expression level of IBD-related genes in colon samples from patients with IBD
We next determined whether targets regulated by miR-146a increased in the colon of patients with IBD. Quantitative RT-PCR showed that the expression levels of MMP3, MMP10, IL6, IL1B, S100A8, S100A9, SERPINE1, and CSF3 were higher in the colon of patients with active IBD than non-IBD subjects and patients with IBD in the inactive stage, and the expression level of IL1A was downregulated in patients with IBD in the inactive stage when compared to patients with active IBD (Figure 9). However, MMP8, CXCL2, CXCL3, LCN2, SERPINE2, and CCL3 were not upregulated in the colon of patients with active IBD when compared to non-IBD subjects and patients with IBD in the inactive stage (Figure 9), but we should bear in mind that non-IBD subjects and patients with IBD in the inactive stage do not have health conditions, and these genes could be upregulated in these two groups of patients. Nevertheless, these findings suggest that MMP3, MMP10, IL6, IL1B, S100A8, S100A9, SERPINE1, CSF3, and IL1A are involved in active IBD.
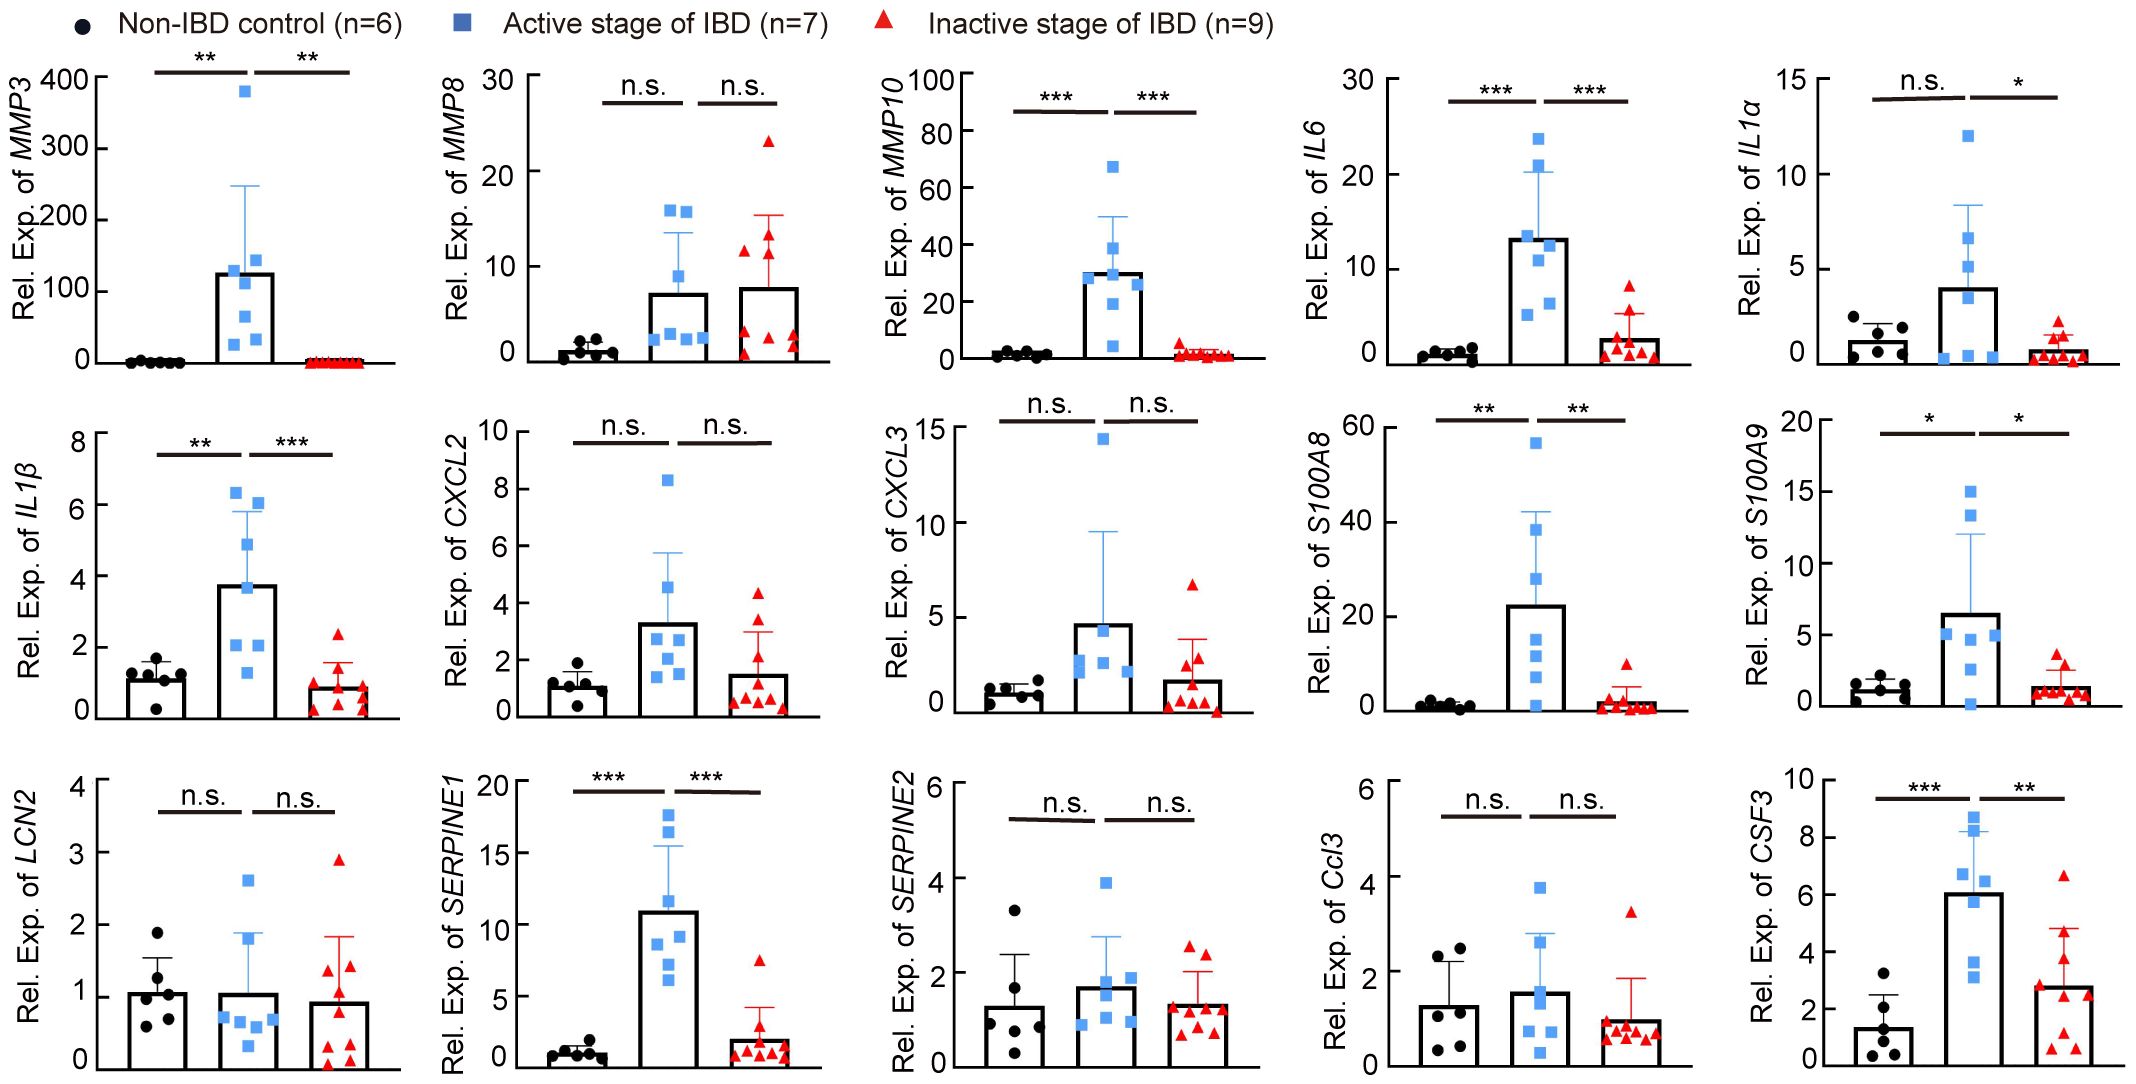
Figure 9 The expression level of IBD-related genes in human colon samples. The expression levels of MMP3, MMP8, MMP10, IL6, IL1a, IL1b, CXCL2, CXCL3, S100A8, S100A9, LCN2, SERPINE1, SERPINE2, CCL3, and CSF3 in colon specimens of patients without IBD, or with IBD in the active stage or the inactive stage was measured by RT-qPCR; the results represent two independent experiments with triplicates of each sample. n = 6, 7, and 9. Data were shown as mean ± SD. *p < 0.05, **p < 0.01, ***p < 0.001, one-way ANOVA, n.s., no significance.
Discussion
Here, we showed that the deficiency of miR-146a in mice with a C57BL/6N genetic background facilitates an immune response in the intestine to a normal environment and accelerates the severity of DSS-induced IBD, and that MiR-146a-5p and miR-146a-3P mimics are able to attenuate symptoms of DSS-induced IBD in mice (Figure 10). The underlying molecular mechanism is that miR-146a represses genetic regulatory networks of immune response, extracellular matrix breakdown enzymes, and coagulation in the intestine.
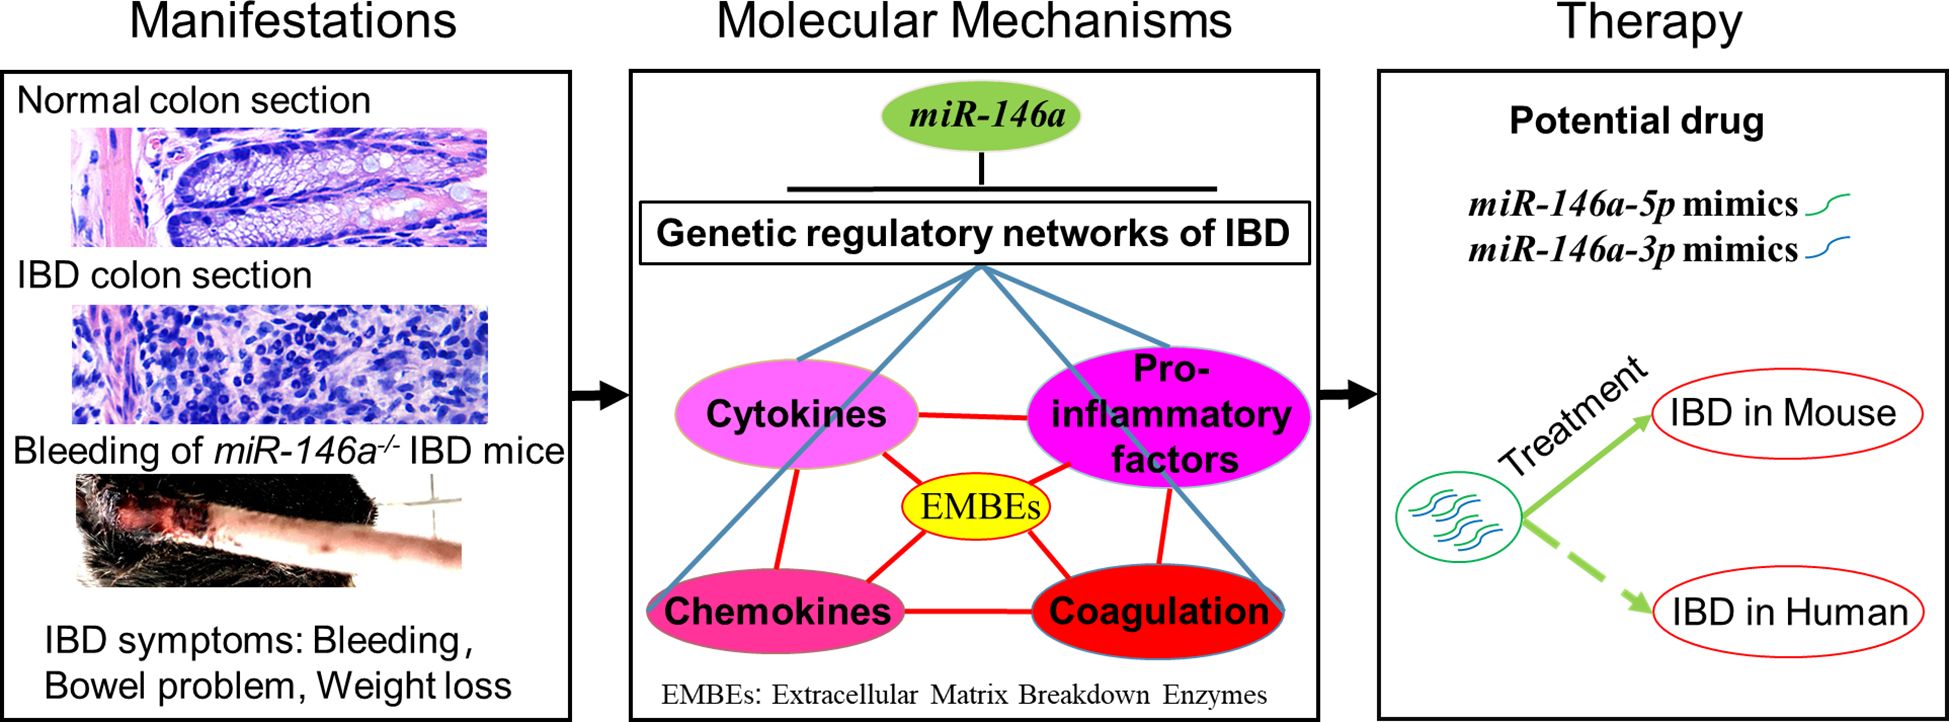
Figure 10 MiR-146a is a top regulator and potential drug of IBD. Deficiency of MiR-146a augments IBD due to de-repression of multiple genetic regulatory networks involved in IBD, and miR-146a-5p and miR-146a-3p mimics are potential drugs for IBD.
DSS induction in the miR-146a-deficient mice led to dramatic body weight loss, massive rectal bleeding, severe colitis, and damage to the intestine, mimicking the UC in humans, the main type of chronic IBD, which is characterized by recurrent and diffuse colorectal mucosa rupture, inflammation, and bleeding (3, 4). Moreover, miR-146a systematically represses close to 80% IBD genes, which cover multiple genetic regulatory networks of the cytokine family, chemokine family, pro-inflammatory factors, extracellular matrix breakdown enzymes, and coagulation. These findings suggest that miR-146a deficiency might represent major genetic susceptibilities for IBD, and that the miR-146a knock-out mouse is an ideal animal model for the induction of experimental IBD for drug screening and validation. Consistent with our data, Anzola et al. reported that the expression of miR-146a was increased in the colon of TNBS- or DSS-induced mouse models of colitis (42), and Runtsch et al. also demonstrated that the expression of miR-146a was higher in colonic biopsies from patients with UC than in those from healthy controls (27). However, conflicting data reported that the miR-146a knock-out mice with a C57BL/6 genetic background were resistant to DSS-induced colitis due to an enhanced intestinal barrier (27). The inconsistent response to DSS between our miR-146a knock-out mice with a C57BL/6N genetic background and the miR-146a knock-out mice with C57BL/6 is possible due to SNP variants on the direct targets of miR-146a, because it was reported that SNPs between C57BL/6J and C57BL/6N cause phenotypic variances (43), and that two miR-146a knock-out mouse lines were generated by using the same targeting vector, and only the miR-146a knock-out mice with a mixed C57BL/6 × 129/sv (but not C57BL/6) genetic background developed auto-immune diseases (25), which suggests that some pro-inflammatory targets are less repressed by miR-146a in the context of C57BL/6 genetic background. It seems that miR-146a represses inflammatory genes more than intestinal barrier-related genes in C57BL/6N mice, and it is the opposite in C57BL/6 mice. Thus, further investigation of the SNP variants in C57BL/6, 129/sv, and C57BL/6N mice would help develop a precise miR-146a mimic drug for subtypes of patients with IBD.
The RNA profile of the intestine derived from naïve miR-146a knock-out C57BL/6 mice unbiasedly demonstrated that miR-146a regulates many intestinal barrier-related genes, such as the Reg3 family (Reg3α, Reg3β, and Reg3γ), the Muc family (Muc3, Muc4, and Muc13), the Ceacam family (Ceacam1, Ceacam20, and Ceacam18), Epcam, claudins, occludin, and e-Cadherin, as well as a few inflammatory genes, such as Saa1, IL-18, and IL18bp (27). However, keep in mind that many pro-inflammatory genes are not expressed under physiological conditions. Thus, whether miR-146a would regulate more pro-inflammatory genes in the inflamed intestine of C57BL/6 mice is not known. Our RNA profiling data revealed the entire genetic regulatory network regulated by miR-146a in the inflammatory colon of C57BL/6N mice. Previous studies mostly focused on two direct targets of miR-146a, IRAK1 and TRAF6, to address the role of miR-146a in immune response (20, 44, 45). We found that, besides downregulating IRAK1 and TRAF6, miR-146a represses many other potential direct targets, such as Il1a, Il11, Il5ra, Il1r2, Cxcl13, Cxcl5, Osm, Arg1, Igfbp5, and Vsig4. Thus, miR-146a directly targets a number of critical immune response genes to systematically repress the majority of IBD genes induced by the toxic environment factor DSS. Because miRNA is a post-transcriptional regulator that may inhibit the protein translation of direct targets, instead of inducing degradation of target mRNAs under certain circumstances, the percentage of IBD-related genes repressed by miR-146a is likely higher than the corresponding gene number illustrated by RNA sequencing data. An example to support this speculation is that the mRNA levels of Irak1, Traf6, and p65 (RelA) were not significantly increased (Supplementary Table S3), but their protein expression was induced in DSS-treated miR-146a knock-out mice. Our data from DSS-treated miR-146a knock-out mice and RNA expression profile support that miR-146a is a top regulator of IBD and acts as a powerful brake and even a terminator of immune response.
MiRNAs are promising targets for IBD treatment (46–48). Our data demonstrated that the modified miR-146a-5p and miR-146a-3p mimics could attenuate DSS-induced IBD in both miR-146a-deficient and WT mice. We also found that the administration of miR-146a-5p mimics or miR-146a-3p mimics alone was insufficient to substantially relieve IBD in miR-146a-deficient mice (data not shown), indicating that miR-146a-3p also plays an important role in the regulation of IBD. Indeed, many predicted direct targets of miR-146a-3p were upregulated in DSS-treated miR-146a-deficient mice, e.g., p65 (RelA), which is predicted to be targeted by miR-146a-3p, not miR-146a-5p, increased in DSS-treated and untreated miR-146a-deficient mice. In line with our findings that show a significant increase in miR-146a-3p and an increasing trend of miR-146a-5p in patients with IBD compared to non-IBD patients, other laboratories reported that the SNP of miR-146a is associated with IBD (49, 50). For the purpose of late potential translational research, we used a human miR-146a-3p sequence instead of a mouse miR-146a-3p sequence (one nucleotide differs in seed sequence between them, see Supplementary Table S2) in the treatment experiments of mouse models; thus, it is believed that a better efficacy would be achieved if the sequence of the miR-146a-3p mimic matches the applied species. The lower efficacy of the miR-146a-3p mimics relative to endogenous miR-146a-3p explains why miR-146a-deficient mice, which had no endogenous miR-146a-3p, required more miR-146a-3p mimics than WT mice, which had endogenous miR-146a-3p. Given the sequences of mature miR-146a-5p and miR-146a-3p and that the binding sites on their target genes are highly conserved among mouse, rat, and human (51, 52), our findings suggest that miR-146a-5p and miR-146a-3p mimics confer great promise for IBD treatment. Note that the effect of 80 pg/g of miR-146a-5p mimics and 80 pg/g of miR-146a-3p mimics was not as good as the dosage of 40 pg/g of miR-146a-5p mimics and 80 pg/g of miR-146a-3p mimics (data not shown). This suggests that the higher dose of miR-146a-5p mimics could bring side effects, since miR-146a also represses the intestinal barrier function (27). Another possible risk from miR-146a mimics treatment could be an increase in infection as innate immunity was repressed. Thus, the dose of miR-146a mimics is critical for the treatment of IBD.
We also found that the administration of miR-146a mimics only via gavage did not significantly relieve DSS-induced IBD in mice (data not shown), and that only the combination of gavage and intraperitoneal injection did. Intraperitoneal injection enables high concentration of miR-146a mimics in blood to regulate the function of immune cells, which is consistent with the previous reports that show that miR-146a deficiency affects the function of T cells through STAT1, NF-κB, TNF, IRAK1, and TRAF6 (53–55) and B cells via regulating the germinal center response and the secretion of IL1 and IL6 (56–59). Thus, our data suggest that the inhibition of both intestinal inflammation and activation of immune cells is necessary for miR-146a mimics to efficiently treat IBD.
In conclusion, miR-146a acts as a top regulator to systematically repress multiple genetic regulatory networks involved in the immune response of the intestine to environment factors, and the combinatory treatment using miR-146a-5p and miR-146a-3p mimics attenuates DSS-induced IBD in mice through downregulating multiple genetic regulatory networks that were increased in colon tissue from patients with IBD. Our data suggest that the miR-146a knock-out mice with a C57/BL6N genetic background treated with DSS can be a useful model for colitis studies, and that miR-146a-5p and miR-146a-3p mimics may be potential therapeutic drugs for IBD.
Data availability statement
The datasets presented in this study can be found in online repositories. The names of the repository/repositories and accession number(s) can be found below: GSE247433 (GEO).
Ethics statement
The studies involving humans were approved by the Ethics Committee of The Third Xiangya Hospital. The studies were conducted in accordance with the local legislation and institutional requirements. Written informed consent for participation in this study was provided by the participants’ legal guardians/next of kin. The animal study was approved by Tongji University ethical review panel. The study was conducted in accordance with the local legislation and institutional requirements.
Author contributions
FZ: Writing – original draft, Software, Methodology, Investigation, Formal analysis, Data curation. TY: Writing – original draft, Methodology, Investigation, Formal analysis. MN: Writing – review & editing, Methodology, Formal analysis. YLiu: Writing – review & editing, Methodology, Formal analysis. WX: Writing – review & editing, Methodology. YF: Writing – review & editing, Methodology. TW: Writing – review & editing, Methodology. MZ: Writing – review & editing, Methodology. RX: Writing – review & editing, Methodology. RQ: Writing – review & editing, Methodology. YLi: Writing – review & editing, Methodology. MS: Writing – review & editing. JL: Writing – review & editing. LT: Writing – review & editing, Resources, Methodology, Investigation. QZ: Writing – review & editing. XY: Writing – review & editing, Supervision. CP: Writing – review & editing, Writing – original draft, Supervision, Project administration, Funding acquisition, Conceptualization.
Funding
The author(s) declare financial support was received for the research, authorship, and/or publication of this article. CP was supported by grants from the National Natural Science Foundation of China (32070977, 51971236, and 31871063) and from the National Major Science and Technology Projects of China (2018ZX09733001-006-005). YLiu was supported by grants from the Hunan Province health and Wellness Committee (202203104051).
Acknowledgments
We thank the staff members of the Integrated Laser Microscopy System at the National Facility for Protein Science in Shanghai (NFPS), Shanghai Advanced Research Institute, Chinese Academy of Sciences, China for data collection and analysis.
Conflict of interest
CP, FZ, and XY are co-inventors on a pending patent CN 202310086313.2 covering the use of the miR-146a-5p and miR-146a-3p mimics for IBD treatment.
The remaining authors declare that the research was conducted in the absence of any commercial or financial relationships that could be construed as a potential conflict of interest.
Publisher’s note
All claims expressed in this article are solely those of the authors and do not necessarily represent those of their affiliated organizations, or those of the publisher, the editors and the reviewers. Any product that may be evaluated in this article, or claim that may be made by its manufacturer, is not guaranteed or endorsed by the publisher.
Supplementary material
The Supplementary Material for this article can be found online at: https://www.frontiersin.org/articles/10.3389/fimmu.2024.1366319/full#supplementary-material
References
1. Bruner LP, White AM, Proksell S. Inflammatory bowel disease. Primary Care. (2023) 50:411–27. doi: 10.1016/j.pop.2023.03.009
2. Scharl M, Rogler G. Inflammatory bowel disease pathogenesis: what is new? Curr Opin Gastroenterol. (2012) 28:301–9. doi: 10.1097/MOG.0b013e328353e61e
3. Gros B, Kaplan GG. Ulcerative colitis in adults: A review. Jama. (2023) 330:951–65. doi: 10.1001/jama.2023.15389
4. Włodarczyk M, Makaro A, Prusisz M, Włodarczyk J, Nowocień M, Maryńczak K, et al. The role of chronic fatigue in patients with crohn's disease. Life (Basel Switzerland). (2023) 13:1-13. doi: 10.3390/life13081692
5. Cromer WE, Mathis JM, Granger DN, Chaitanya GV, Alexander JS. Role of the endothelium in inflammatory bowel diseases. World J Gastroenterol. (2011) 17:578–93. doi: 10.3748/wjg.v17.i5.578
6. O'Sullivan S, Gilmer JF, Medina C. Matrix metalloproteinases in inflammatory bowel disease: an update. Mediators Inflamm. (2015) 2015:964131. doi: 10.1155/2015/964131
7. Camba-Gómez M, Arosa L, Gualillo O, Conde-Aranda J. Chemokines and chemokine receptors in inflammatory bowel disease: Recent findings and future perspectives. Drug Discov Today. (2022) 27:1167–75. doi: 10.1016/j.drudis.2021.12.004
8. Neurath MF. Targeting cytokines in inflammatory bowel disease. Sci Trans Med. (2022) 14:eabq4473. doi: 10.1126/scitranslmed.abq4473
9. Rogler G, Andus T. Cytokines in inflammatory bowel disease. World J Surg. (1998) 22:382–9. doi: 10.1007/s002689900401
10. Manolakis AC, Kapsoritakis AN, Tiaka EK, Potamianos SP. Calprotectin, calgranulin C, and other members of the s100 protein family in inflammatory bowel disease. Digestive Dis Sci. (2011) 56:1601–11. doi: 10.1007/s10620-010-1494-9
11. Shi YJ, Hu SJ, Zhao QQ, Liu XS, Liu C, Wang H. Toll-like receptor 4 (TLR4) deficiency aggravates dextran sulfate sodium (DSS)-induced intestinal injury by down-regulating IL6, CCL2 and CSF3. Ann Trans Med. (2019) 7:713. doi: 10.21037/atm
12. Bonneau J, Dumestre-Perard C, Rinaudo-Gaujous M, Genin C, Sparrow M, Roblin X, et al. Systematic review: new serological markers (anti-glycan, anti-GP2, anti-GM-CSF Ab) in the prediction of IBD patient outcomes. Autoimmun Rev. (2015) 14:231–45. doi: 10.1016/j.autrev.2014.11.004
13. Boccatonda A, Balletta M, Vicari S, Hoxha A, Simioni P, Campello E. The journey through the pathogenesis and treatment of venous thromboembolism in inflammatory bowel diseases: A narrative review. Semin Thromb hemostasis. (2023) 49:744–55. doi: 10.1055/s-0042-1758869
14. Damião A, de Azevedo MFC, Carlos AS, Wada MY, Silva TVM, Feitosa FC. Conventional therapy for moderate to severe inflammatory bowel disease: A systematic literature review. World J Gastroenterol. (2019) 25:1142–57. doi: 10.3748/wjg.v25.i9.1142
15. Vermeire S, D'Haens G, Baert F, Danese S, Kobayashi T, Loftus EV, et al. Efficacy and safety of subcutaneous vedolizumab in patients with moderately to severely active crohn's disease: Results from the VISIBLE 2 randomised trial. J Crohn's colitis. (2022) 16:27–38. doi: 10.1093/ecco-jcc/jjab133
16. Gerner RR, Moschen AR, Tilg H, Targeting T. and B lymphocytes in inflammatory bowel diseases: lessons from clinical trials. Digestive Dis (Basel Switzerland). (2013) 31:328–35. doi: 10.1159/000354687
17. Sun L, Xia R, Jiang J, Wen T, Huang Z, Qian R, et al. MicroRNA-96 is required to prevent allodynia by repressing voltage-gated sodium channels in spinal cord. Prog Neurobiol. (2021) 202:102024. doi: 10.1016/j.pneurobio.2021.102024
18. Peng C, Li L, Zhang MD, Bengtsson Gonzales C, Parisien M, Belfer I, et al. miR-183 cluster scales mechanical pain sensitivity by regulating basal and neuropathic pain genes. Science. (2017) 356:1168–71. doi: 10.1126/science.aam7671
19. Dambal S, Shah M, Mihelich B, Nonn L. The microRNA-183 cluster: the family that plays together stays together. Nucleic Acids Res. (2015) 43:7173–88. doi: 10.1093/nar/gkv703
20. Taganov KD, Boldin MP, Chang KJ, Baltimore D. NF-kappaB-dependent induction of microRNA miR-146, an inhibitor targeted to signaling proteins of innate immune responses. Proc Natl Acad Sci USA. (2006) 103:12481–6. doi: 10.1073/pnas.0605298103
21. Echavarria R, Mayaki D, Neel JC, Harel S, Sanchez V, Hussain SN. Angiopoietin-1 inhibits toll-like receptor 4 signalling in cultured endothelial cells: role of miR-146b-5p. Cardiovasc Res. (2015) 106:465–77. doi: 10.1093/cvr/cvv120
22. Kirchmeyer M, Servais FA, Hamdorf M, Nazarov PV, Ginolhac A, Halder R, et al. Cytokine-mediated modulation of the hepatic miRNome: miR-146b-5p is an IL-6-inducible miRNA with multiple targets. J leukocyte Biol. (2018) 104:987–1002. doi: 10.1002/JLB.MA1217-499RR
23. Paterson MR, Kriegel AJ. MiR-146a/b: a family with shared seeds and different roots. Physiol Genomics. (2017) 49:243–52. doi: 10.1152/physiolgenomics.00133.2016
24. Hou J, Wang P, Lin L, Liu X, Ma F, An H, et al. MicroRNA-146a feedback inhibits RIG-I-dependent Type I IFN production in macrophages by targeting TRAF6, IRAK1, and IRAK2. J Immunol (Baltimore Md. 1950). (2009) 183:2150–8. doi: 10.4049/jimmunol.0900707
25. Boldin MP, Taganov KD, Rao DS, Yang L, Zhao JL, Kalwani M, et al. miR-146a is a significant brake on autoimmunity, myeloproliferation, and cancer in mice. J Exp Med. (2011) 208:1189–201. doi: 10.1084/jem.20101823
26. Chassin C, Hempel C, Stockinger S, Dupont A, Kübler JF, Wedemeyer J, et al. MicroRNA-146a-mediated downregulation of IRAK1 protects mouse and human small intestine against ischemia/reperfusion injury. EMBO Mol Med. (2012) 4:1308–19. doi: 10.1002/emmm.201201298
27. Runtsch MC, Hu R, Alexander M, Wallace J, Kagele D, Petersen C, et al. MicroRNA-146a constrains multiple parameters of intestinal immunity and increases susceptibility to DSS colitis. Oncotarget. (2015) 6:28556–72. doi: 10.18632/oncotarget.v6i30
28. Kim D, Langmead B, Salzberg SL. HISAT: a fast spliced aligner with low memory requirements. Nat Methods. (2015) 12:357–60. doi: 10.1038/nmeth.3317
29. Mortazavi A, Williams BA, McCue K, Schaeffer L, Wold B. Mapping and quantifying mammalian transcriptomes by RNA-Seq. Nat Methods. (2008) 5:621–8. doi: 10.1038/nmeth.1226
30. Pertea M, Kim D, Pertea GM, Leek JT, Salzberg SL. Transcript-level expression analysis of RNA-seq experiments with HISAT, StringTie and Ballgown. Nat Protoc. (2016) 11:1650–67. doi: 10.1038/nprot.2016.095
31. Robinson MD, Oshlack A. A scaling normalization method for differential expression analysis of RNA-seq data. Genome Biol. (2010) 11:R25. doi: 10.1186/gb-2010-11-3-r25
32. Robinson MD, McCarthy DJ, Smyth GK. edgeR: a Bioconductor package for differential expression analysis of digital gene expression data. Bioinformatics. (2010) 26:139–40. doi: 10.1093/bioinformatics/btp616
33. Matsunaga T, Hashimoto S, Yamamoto N, Kawasato R, Shirasawa T, Goto A, et al. Protective effect of daikenchuto on dextran sulfate sodium-induced colitis in mice. Gastroenterol Res Pract. (2017) 2017:1298263. doi: 10.1155/2017/1298263
34. Ning MM, Yang WJ, Guan WB, Gu YP, Feng Y, Leng Y. Dipeptidyl peptidase 4 inhibitor sitagliptin protected against dextran sulfate sodium-induced experimental colitis by potentiating the action of GLP-2. Acta Pharmacol Sin. (2020) 41:1446–56. doi: 10.1038/s41401-020-0413-7
35. Peng C, Aron L, Klein R, Li M, Wurst W, Prakash N, et al. Pitx3 is a critical mediator of GDNF-induced BDNF expression in nigrostriatal dopaminergic neurons. J Neurosci Off J Soc Neurosci. (2011) 31:12802–15. doi: 10.1523/JNEUROSCI.0898-11.2011
36. Maralani M, Shanehbandi D, Asadi M, Hashemzadeh S, Hajiasgharzadeh K, Mashhadi Abdolahi H, et al. Expression profiles of miR-196, miR-132, miR-146a, and miR-134 in human colorectal cancer tissues in accordance with their clinical significance : Comparison regarding KRAS mutation. Wien Klin Wochenschr. (2021) 133:1162–70. doi: 10.1007/s00508-021-01933-9
37. Shannon P, Markiel A, Ozier O, Baliga NS, Wang JT, Ramage D, et al. Cytoscape: a software environment for integrated models of biomolecular interaction networks. Genome Res. (2003) 13:2498–504. doi: 10.1101/gr.1239303
38. Szklarczyk D, Kirsch R, Koutrouli M, Nastou K, Mehryary F, Hachilif R, et al. The STRING database in 2023: protein-protein association networks and functional enrichment analyses for any sequenced genome of interest. Nucleic Acids Res. (2023) 51:D638–d646. doi: 10.1093/nar/gkac1000
39. Leach ST, Yang Z, Messina I, Song C, Geczy CL, Cunningham AM, et al. Serum and mucosal S100 proteins, calprotectin (S100A8/S100A9) and S100A12, are elevated at diagnosis in children with inflammatory bowel disease. Scand J Gastroenterol. (2007) 42:1321–31. doi: 10.1080/00365520701416709
40. Kmieć Z. Cytokines in inflammatory bowel disease. Arch Immunol Ther Exp (Warsz). (1998) 46:143–55.
41. Banks C, Bateman A, Payne R, Johnson P, Sheron N. Chemokine expression in IBD. Mucosal chemokine expression is unselectively increased in both ulcerative colitis and Crohn's disease. J Pathol. (2003) 199:28–35. doi: 10.1002/path.1245
42. Anzola A, González R, Gámez-Belmonte R, Ocón B, Aranda CJ, Martínez-Moya P, et al. miR-146a regulates the crosstalk between intestinal epithelial cells, microbial components and inflammatory stimuli. Sci Rep. (2018) 8:17350. doi: 10.1038/s41598-018-35338-y
43. Simon MM, Greenaway S, White JK, Fuchs H, Gailus-Durner V, Wells S, et al. A comparative phenotypic and genomic analysis of C57BL/6J and C57BL/6N mouse strains. Genome Biol. (2013) 14:R82. doi: 10.1186/gb-2013-14-7-r82
44. Li Y, Tan S, Shen Y, Guo L. miR−146a−5p negatively regulates the IL−1β−stimulated inflammatory response via downregulation of the IRAK1/TRAF6 signaling pathway in human intestinal epithelial cells. Exp Ther Med. (2022) 24:615. doi: 10.3892/etm
45. Wu H, Fan H, Shou Z, Xu M, Chen Q, Ai C, et al. Extracellular vesicles containing miR-146a attenuate experimental colitis by targeting TRAF6 and IRAK1. Int Immunopharmacol. (2019) 68:204–12. doi: 10.1016/j.intimp.2018.12.043
46. Boros É, Hegedűs Z, Kellermayer Z, Balogh P, Nagy I. Global alteration of colonic microRNAome landscape associated with inflammatory bowel disease. Front Immunol. (2022) 13:991346. doi: 10.3389/fimmu.2022.991346
47. Yarani R, Shojaeian A, Palasca O, Doncheva NT, Jensen LJ, Gorodkin J, et al. Differentially expressed miRNAs in ulcerative colitis and crohn's disease. Front Immunol. (2022) 13:865777. doi: 10.3389/fimmu.2022.865777
48. Lin Z, Xie X, Gu M, Chen Q, Lu G, Jia X, et al. microRNA-144/451 decreases dendritic cell bioactivity via targeting interferon-regulatory factor 5 to limit DSS-induced colitis. Front Immunol. (2022) 13:928593. doi: 10.3389/fimmu.2022.928593
49. Zhu M, Li D, Jin M, Li M. Association between microRNA polymorphisms and the risk of inflammatory bowel disease. Mol Med Rep. (2016) 13:5297–308. doi: 10.3892/mmr.2016.5157
50. Gazouli M, Papaconstantinou I, Stamatis K, Vaiopoulou A, Zeglinas C, Vassiliou I, et al. Association study of genetic variants in miRNAs in patients with inflammatory bowel disease: preliminary results. Digestive Dis Sci. (2013) 58:2324–8. doi: 10.1007/s10620-013-2640-y
51. Agarwal V, Bell GW, Nam JW, Bartel DP. Predicting effective microRNA target sites in mammalian mRNAs. eLife. (2015) 4:1-38. doi: 10.7554/eLife.05005
52. McGeary SE, Lin KS, Shi CY, Pham TM, Bisaria N, Kelley GM, et al. The biochemical basis of microRNA targeting efficacy. Sci (New York N.Y.). (2019) 366:1-30. doi: 10.1126/science.aav1741
53. Lu LF, Boldin MP, Chaudhry A, Lin LL, Taganov KD, Hanada T, et al. Function of miR-146a in controlling Treg cell-mediated regulation of Th1 responses. Cell. (2010) 142:914–29. doi: 10.1016/j.cell.2010.08.012
54. Yang L, Boldin MP, Yu Y, Liu CS, Ea CK, Ramakrishnan P, et al. miR-146a controls the resolution of T cell responses in mice. J Exp Med. (2012) 209:1655–70. doi: 10.1084/jem.20112218
55. Stickel N, Prinz G, Pfeifer D, Hasselblatt P, Schmitt-Graeff A, Follo M, et al. MiR-146a regulates the TRAF6/TNF-axis in donor T cells during GVHD. Blood. (2014) 124:2586–95. doi: 10.1182/blood-2014-04-569046
56. Jiang S, Hu Y, Deng S, Deng J, Yu X, Huang G, et al. miR-146a regulates inflammatory cytokine production in Porphyromonas gingivalis lipopolysaccharide-stimulated B cells by targeting IRAK1 but not TRAF6. Biochim Biophys Acta Mol basis Dis. (2018) 1864:925–33. doi: 10.1016/j.bbadis.2017.12.035
57. Zhang J, Jia G, Liu Q, Hu J, Yan M, Yang B, et al. Silencing miR-146a influences B cells and ameliorates experimental autoimmune myasthenia gravis. Immunology. (2015) 144:56–67. doi: 10.1111/imm.12347
58. Cho S, Lee HM, Yu IS, Choi YS, Huang HY, Hashemifar SS, et al. Differential cell-intrinsic regulations of germinal center B and T cells by miR-146a and miR-146b. Nat Commun. (2018) 9:2757. doi: 10.1038/s41467-018-05196-3
Keywords: miR-146a-5p, miR-146a-3p, inflammatory bowel disease, genetic regulatory networks, MMPs, chemokines, cytokines, therapy
Citation: Zhu F, Yang T, Ning M, Liu Y, Xia W, Fu Y, Wen T, Zheng M, Xia R, Qian R, Li Y, Sun M, Liu J, Tian L, Zhou Q, Yu X and Peng C (2024) MiR-146a alleviates inflammatory bowel disease in mice through systematic regulation of multiple genetic networks. Front. Immunol. 15:1366319. doi: 10.3389/fimmu.2024.1366319
Received: 06 January 2024; Accepted: 08 April 2024;
Published: 10 May 2024.
Edited by:
Shuai Wang, Guangzhou University of Chinese Medicine, ChinaReviewed by:
Cong Zhang, Guangzhou Medical University, ChinaShi Xue Dai, Guangdong Provincial People’s Hospital, China
Minna Wu, Xinxiang Medical University, China
Copyright © 2024 Zhu, Yang, Ning, Liu, Xia, Fu, Wen, Zheng, Xia, Qian, Li, Sun, Liu, Tian, Zhou, Yu and Peng. This is an open-access article distributed under the terms of the Creative Commons Attribution License (CC BY). The use, distribution or reproduction in other forums is permitted, provided the original author(s) and the copyright owner(s) are credited and that the original publication in this journal is cited, in accordance with accepted academic practice. No use, distribution or reproduction is permitted which does not comply with these terms.
*Correspondence: Changgeng Peng, Y2hhbmdnZW5nLnBlbmdAdG9uZ2ppLmVkdS5jbg==; Xin Yu, ZGFsYWh1LmNvb2xAZ21haWwuY29t; Qian Zhou, emhvdXFpYW44MEAxNjMuY29t; Li Tian, dGlhbmxpeHkzQGNzdS5lZHUuY24=
†These authors have contributed equally to this work
 Fengting Zhu1,2†
 Minxuan Sun
 Li Tian
 Changgeng Peng