
95% of researchers rate our articles as excellent or good
Learn more about the work of our research integrity team to safeguard the quality of each article we publish.
Find out more
ORIGINAL RESEARCH article
Front. Immunol. , 11 April 2024
Sec. Cancer Immunity and Immunotherapy
Volume 15 - 2024 | https://doi.org/10.3389/fimmu.2024.1364728
This article is part of the Research Topic Peripheral Blood-Based Biomarkers for Immune Monitoring of Cancer and Cancer Therapy View all 19 articles
 Hongjuan Ji1†
 Bona Liu1†Peng Jin2†Yingchun Li3Lili Cui1Shanxiu Jin4Jingran Wu4Yongqi Shan5
 Zhenyong Zhang6
 Jian Ming3*
 Liang Zhang7*Cheng Du1*
Background: Creatinine-to-cystatin C ratio (CCR) and body composition (BC) parameters have emerged as significant prognostic factors in cancer patients. However, the potential effects of CCR in gastric cancer (GC) remains to be elucidated. This multi-center retrospective study explored the predictive and prognostic value of CCR and BC-parameters in patients with metastatic GC receiving PD-1 inhibitors-based combination therapy.
Methods: One hundred and thirteen GC patients undergoing PD-1 inhibitors-based combination therapy were enrolled at three academic medical centers from January 2021 to July 2023. A deep-learning platform based on U-Net was developed to automatically segment skeletal muscle index (SMI), subcutaneous adipose tissue index (SATI) and visceral adipose tissue index (VATI). Patients were divided into two groups based on the median of CCR or the upper tertile of BC-parameters. Logistic and Cox regression analysis were used to determine the effect of CCR and BC-parameters in predicting response rates and survival rates.
Results: The CCR was positively correlated with SMI (r=0.43; P<0.001), but not with SATI or VATI (P>0.05). Multivariable logistic analysis identified that both low CCR (OR=0.423, P=0.066 for ORR; OR=0.026, P=0.005 for DCR) and low SATI (OR=0.270, P=0.020 for ORR; OR=0.149, P=0.056 for DCR) were independently associated with worse objective response rate (ORR) and disease control rate (DCR). Patients with low CCR or low SATI had significantly lower 8-month progression-free survival (PFS) rate and 16-month overall survival (OS) rate than those with high CCR (PFS rate, 37.6% vs. 55.1%, P=0.011; OS rate, 19.4% vs. 44.9%, P=0.002) or those with high SATI (PFS rate, 37.2% vs. 53.8%, P=0.035; OS rate, 8.0% vs. 36.0%, P<0.001). Multivariate Cox analysis showed that low CCR (HR=2.395, 95% CI: 1.234-4.648, P=0.010 for PFS rate; HR=2.528, 95% CI: 1.317-4.854, P=0.005 for OS rate) and low SATI (HR=2.188, 95% CI: 1.050-4.560, P=0.037 for PFS rate; HR=2.818, 95% CI: 1.381-5.752, P=0.004 for OS rate) were both independent prognostic factors of poor 8-month PFS rate and 16-month OS rate. A nomogram based on CCR and BC-parameters showed a good performance in predicting the 12- and 16-month OS, with a concordance index of 0.756 (95% CI, 0.722-0.789).
Conclusions: Low pre-treatment CCR and SATI were independently associated with lower response rates and worse survival in patients with metastatic GC receiving PD-1 inhibitors-based combination therapy.
Gastric cancer (GC) is among the most common cancer which lead to cancer-related mortality (1). A significant portion of patients receives a diagnosis at an advanced and inoperable stage. The introduction of immune checkpoint inhibitors (ICIs) has substantially improved the survival rates of patients with metastatic GC. Nevertheless, the response to PD-1 monotherapy is limited to a small subset of patients, potentially due to the heterogeneous nature of GC. Even with combinatorial therapy, the objective response rate remains constrained at 50-60% (2, 3). Therefore, it is crucial to identify novel factors influencing or predicting the efficacy and prognosis of PD-1 inhibitors in GC patients.
Serum creatinine and Cystatin C serve as biochemical markers for estimating the glomerular filtration rate (eGFR) and renal function in clinical practice. Creatinine, primarily originating from muscle metabolism, exhibits lower blood levels in cancer patients with reduced muscle mass, particularly in those with sarcopenia or cachexia (4). Cystatin C, a low molecular weight protein, is uniformly secreted by all nucleated cells with consistent productivity, unaffected by muscular metabolic processes (5). Leveraging the characteristics of creatinine and Cystatin C, the creatinine-to-cystatin C ratio (CCR) was initially proposed by Kashani et al. as a simplified method for diagnosing sarcopenia in patients (6). Since then, CCR has been extensively studied and established as a biomarker for the prognosis in patients with critically illness (7, 8), hypertension (9), type 2 diabetes (10, 11) and cancer (12–17). Recently, a retrospective study reported that low CCR was an independent biomarker of poor prognosis in non-small cell lung cancer (NSCLC) patients treated with PD-1 monotherapy (18). However, the potential role of CCR in predicting the treatment efficacy of ICIs combination therapy and prognosis in GC patients remains to be investigated.
The most important parameters of body composition (BC) are skeletal muscle index (SMI), subcutaneous adipose tissue index (SATI) and visceral adipose tissue index (VATI). These indices have undergone extensive study in past decades to elucidate their prognostic values in various cancer types (19–21). Sarcopenia, defined as a decline in both muscle mass and function, has long been established as a prognostic risk factor in cancer patients treated with ICIs (22, 23). In contrast to sarcopenia, studies evaluating the prognostic value of subcutaneous or visceral adipose tissue in cancer patients are still controversial (24), with the prognostic value reported as protective, detrimental or no effect. It may be due to the differences in disease contexts or treatment regimens. Notably, the potential impact of subcutaneous or visceral adipose tissue on treatment efficacy and prognosis in patients with metastatic GC receiving PD-1 inhibitors-based combination therapy remains unknown.
In this study, we aimed to explore whether the CCR and BC-parameters are associated with efficacy and prognosis in patients with metastatic GC receiving PD-1 inhibitors-based combination therapy.
In this study, we retrospectively enrolled 113 metastatic GC patients treated with PD-1 inhibitors-based combination therapy at three academic medical centers from January 2021 to July 2023. Inclusion criteria consisted of (a) age ≥ 18 years, (b) pathologically confirmed GC, (c) treated with at least one dose of PD-1 based combinatorial regimen. The exclusion criteria were as follows: (a) receiving PD-1 monotherapy or PD-L1 therapy, (b) high microsatellite instability (MSI-H) phenotype, (c) renal function impairment (eGFR<60ml/min/1.73m2).
The following clinical variables, including age, gender, ECOG Performance Status (PS), height, weight, number of previous therapies, presence or absence of ascites, degree of differentiation, number of organs with metastases, PD-L1 status, treatment regimen, creatinine (mg/dL), cystatin C (mg/L), platelet absolute (P×109/L), neutrophil absolute (N×109/L), and lymphocyte absolute (L×109/L) were extracted from electronic medical records. PD-L1 positive was defined as a combined positive score (CPS) of ≥1 or a tumor proportion score (TPS) of ≥1%. All biochemical and routine blood parameters were measured in accredited laboratories. The relevant indicators were calculated as: CCR=creatinine/cystatin C×100; SII=P×N/L. CCR and SII were considered binary variables and dichotomized based on the median values.
We developed a deep-learning model based on U-Net to automatically segment CT images of SAT, VAT, and skeletal muscle at the third lumbar vertebra (L3) level. The model is available at https://body-compositions-assessment-tool.streamlit.app/. The performance of the model is summarized in Supplementary Materials (Supplementary Table 1; Supplementary Figure 1). According to the criteria commonly referenced in Asian cancer patients, sarcopenia was defined as SMI ≤40.8 cm2/m2 in men and ≤34.9 cm2/m2 in women (25). Additionally, we conducted calculations using X-tile analysis to determine the cut-off points of body composition parameters. The upper tertile of all indicators could clearly stratify the survival outcome. Therefore, based on both the reproducibility of the study and previous reports (26), we chose the upper tertile to classify the SATI, VATI and SMI.
The primary endpoints were 8-month PFS rate and 16-month OS rate, and the secondary endpoints were ORR and DCR. The assessment of treatment response was conducted according to the RECIST V.1.1 criteria (27). Objective response rate (ORR) and disease control rate (DCR) were defined as the proportion of patients who achieved a complete (CR) or partial response (PR) and CR, PR or stable disease (SD), respectively. Progression-free survival (PFS) rate at 8 months was calculated from PD-1 treatment initiation to death or progression disease (PD) with maximal follow-up of 8 months. Overall survival (OS) rate at 16 months was calculated from PD-1 treatment initiation to death or last follow-up with maximal follow-up of 16 months.
Statistical analysis was performed using SPSS 26.0. All continuous variables were reported as median and interquartile range (IQR), and categorical variables were reported as frequency and percentage. Multiple imputation (MI) was used to account for missing data on PD-L1 status and differentiation grade. Spearman correlation coefficient was performed to determine the association between CCR and BC-parameters. Univariable and multivariable logistic regression analysis were used to explore the factors influencing efficacy. The efficacy of predicting treatment response was compared by drawing receiver operating characteristic (ROC) curves, and the area under the ROC curves (AUCs) was compared using the Delong test. The variance inflation factor (VIF) method was used to select covariates with a maximum threshold of 5 to control for multicollinearity. Cox regression models were established to identify independent factors associated with PFS/OS. Kaplan-Meier analysis and log-rank test were utilized to compare the survival rates between groups. A prognostic nomogram was established to predict 12- and 16-month OS. The discriminant ability and predictive accuracy were evaluated by the Concordance index (C-index) and decision curve analysis (DCA). All tests were two-sided, and p values <0.05 were considered statistically significant.
A total of 113 patients were included in the study. The median age was 63 years (IQR: 57-69) and 96 (85.0%) of the patients were male. Overall, 99 (87.6%) patients exhibited good performance status (ECOG PS 0-1) and 47 (41.6%) had a low degree of differentiation. 89 (78.8%) patients received PD-1 combined with chemotherapy and 94 (83.2%) patients were treated for the first line. Some missing data were observed in our study cohort. To enhance statistical power and decrease bias due to missing data, we used multiple-imputation to deal with missing data on PD-L1 status and differentiation grade. We also performed sensitivity analyses using a complete-case analysis for comparison. The results were still statistically significant. (Supplementary Table 2). Other detailed clinicopathological characteristics of the patients were depicted in Table 1. Representative images for U-Net-based segmentation were shown in Figure 1.

Table 1 Patient characteristics.

Figure 1 U-Net-based segmentation of body composition using CT images. Yellow=SMA, Blue=SATA, Green=VATA. (A) Representative of patients with high SMA and TATA. (B) Representative of patients with high SMA and low TATA. (C) Representative of patients with low SMA and high TATA. SMA, skeletal muscle area; SATA, subcutaneous adipose tissue area; VATA, visceral adipose tissue area, TATA, total adipose tissue area.
The CCR was positively correlated with SMA (r=0.49; P<0.001) and SMI (r=0.43; P<0.001), but not with SATI (r=-0.04; P>0.05) or VATI (r=0.15; P>0.05). No significant association between SII and BC-parameters was observed (Figure 2).
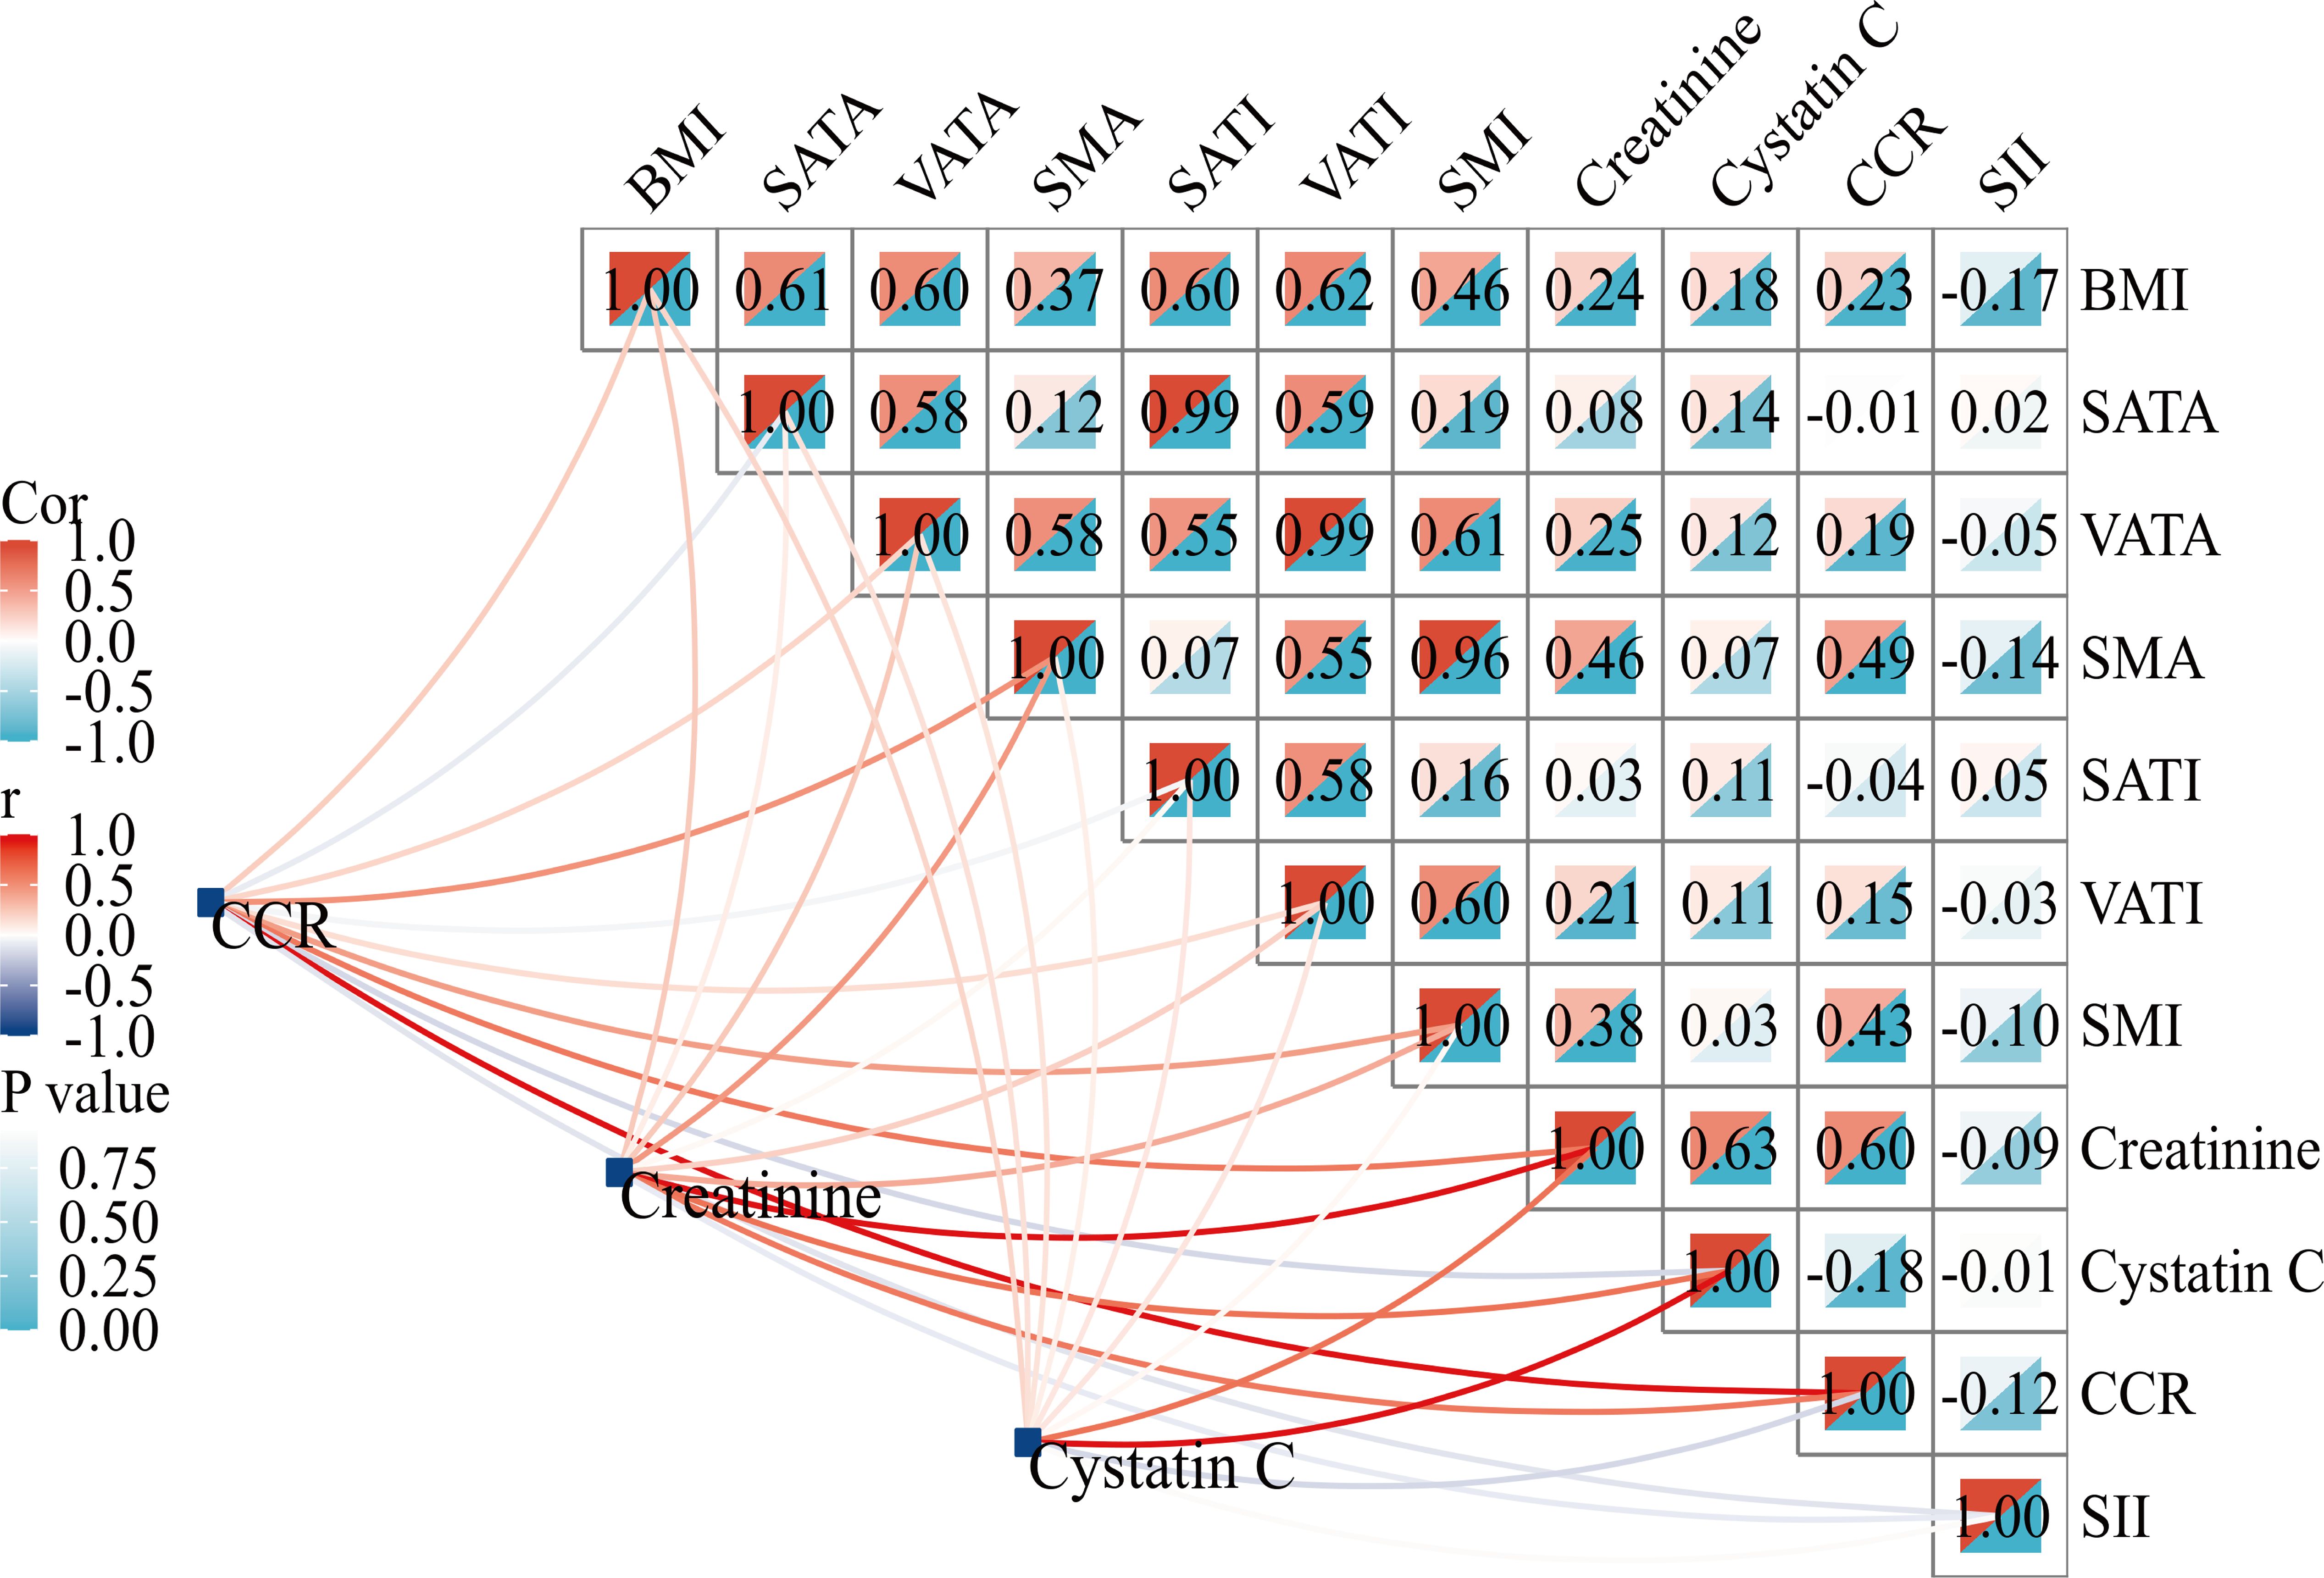
Figure 2 Correlation matrix between CCR and body composition parameters. BMI, body mass index; SATA, subcutaneous adipose tissue area; VATA, visceral adipose tissue area; SMA, skeletal muscle area; SATI, subcutaneous adipose tissue index; VATI, visceral adipose tissue index; SMI, skeletal muscle index; CCR, creatinine-to-cystatin C ratio; SII, systemic immune-inflammation index.
As shown in Table 2, low CCR and low SATI were significantly associated with worse ORR. Low CCR, low SATI, low SMI, sarcopenia, two or more lines of therapy and presence of ascites were highly linked to worse DCR. The results of multivariable logistic regression analysis showed that low SATI (OR=0.270, 95% CI: 0.090-0.814, P=0.020) was an independent risk factor for ORR, while low CCR (OR=0.423, 95% CI: 0.169-1.059, P=0.066) tend to be independently associated with ORR. Low CCR (OR=0.026, 95% CI: 0.002-0.335, P=0.005), two or more lines of therapy (OR=0.015, 95% CI: 0.001-0.190, P=0.001) and presence of ascites (OR=0.023, 95% CI: 0.002-0.299, P=0.004) were independent risk factors for DCR, while low SATI (OR=0.149, 95% CI: 0.021-1.051, P=0.056) tended to be significant (Table 3). Furthermore, ROC curves were calculated to compare the performance of different variables in predicting treatment response. The AUCs of the CCR, SMI and SATI were 0.616 (95% CI: 0.497-0.735), 0.570 (95% CI: 0.439-0.702) and 0.594 (95% CI: 0.473-0.715) for ORR and 0.787 (95% CI: 0.694-0.881), 0.773 (95% CI: 0.666-0.880) and 0.606 (95% CI: 0.460-0.752) for DCR, respectively (Figure 3). The AUC of CCR (0.787) was significantly higher than that of SATI (0.606) (Delong test: P=0.043) in predicting DCR. The differences between AUCs of other groups were not statistically significant in predicting of ORR or DCR. The predictive accuracy of the CCR, SMI and SATI for ORR/DCR were shown in Table 4. Therefore, it is believed that the CCR seems to be superior to other indexes in predicting treatment efficacy.
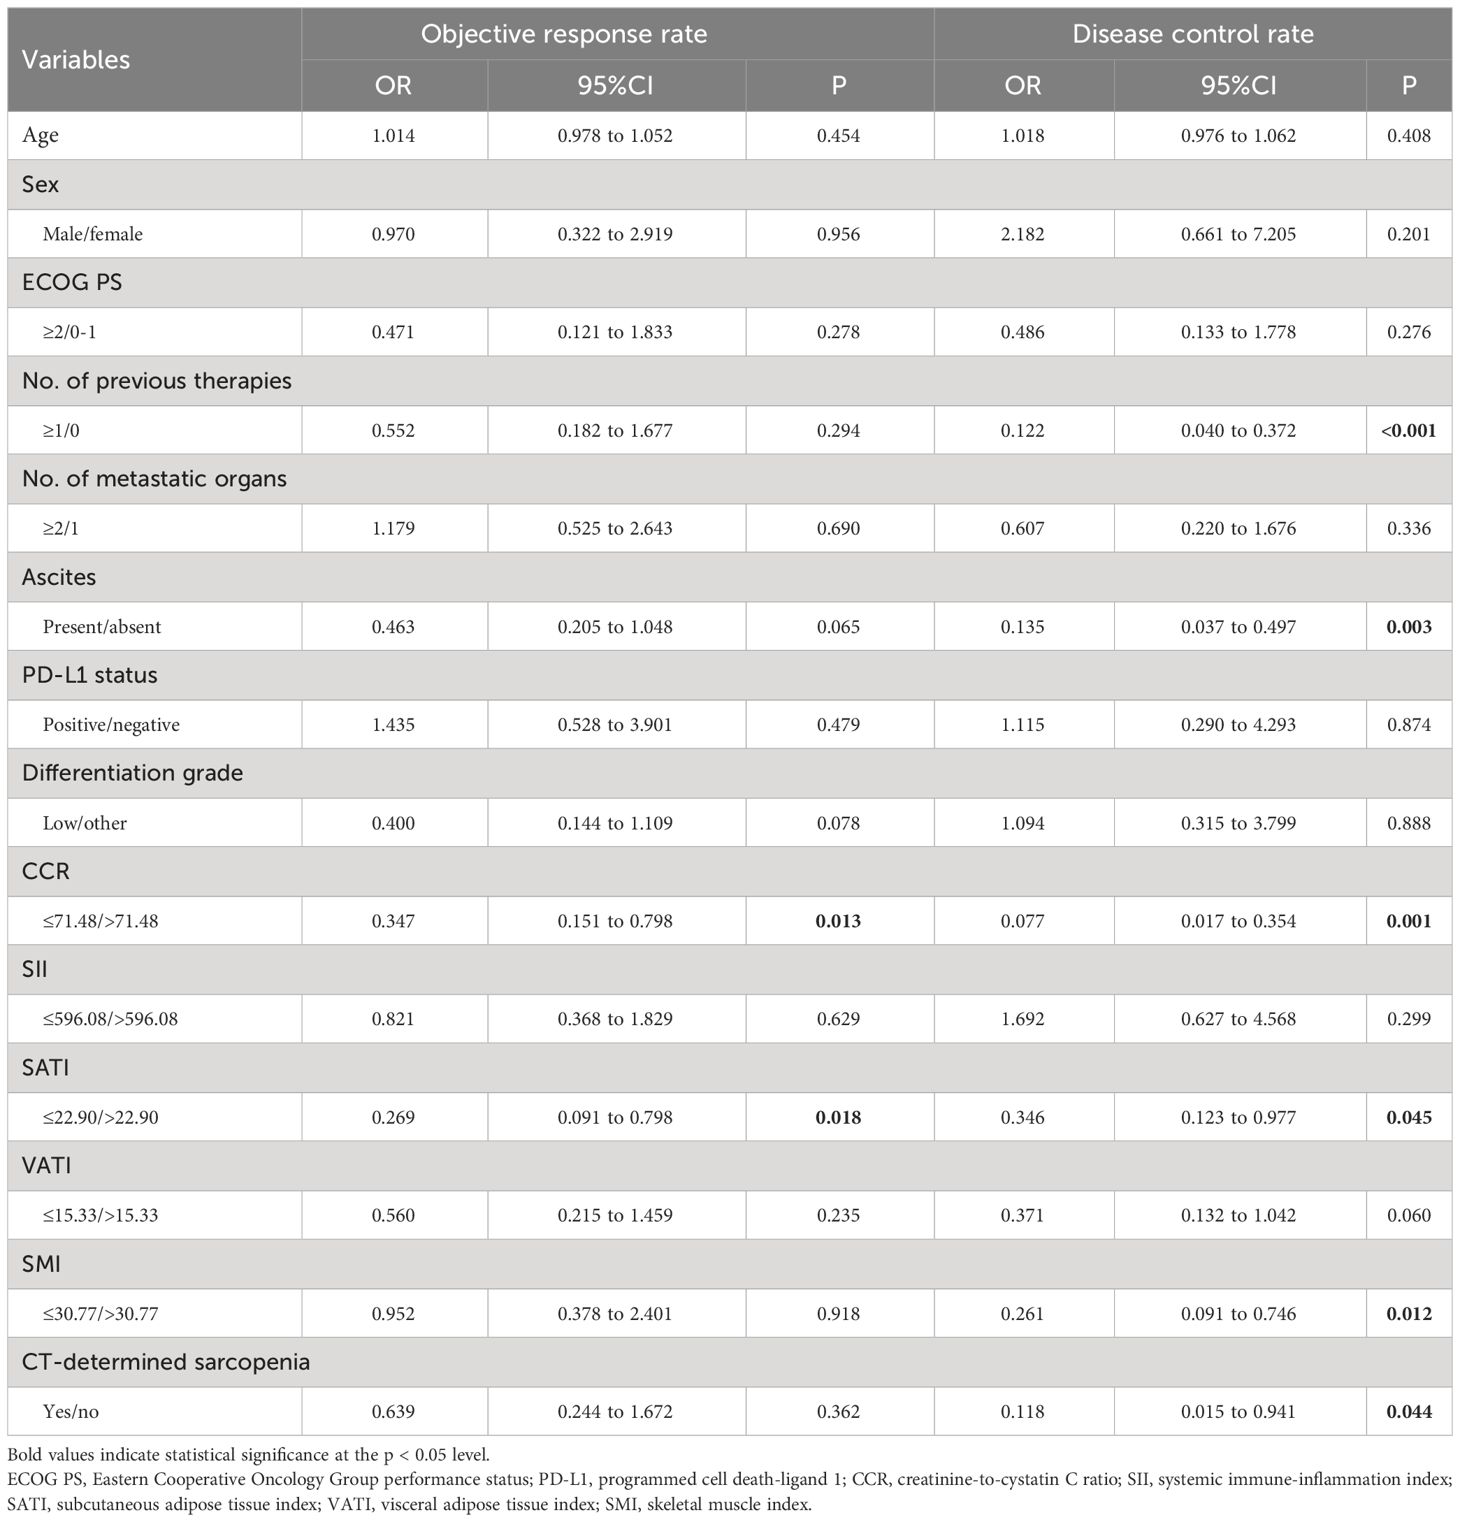
Table 2 Univariable logistic regression analysis for ORR and DCR.
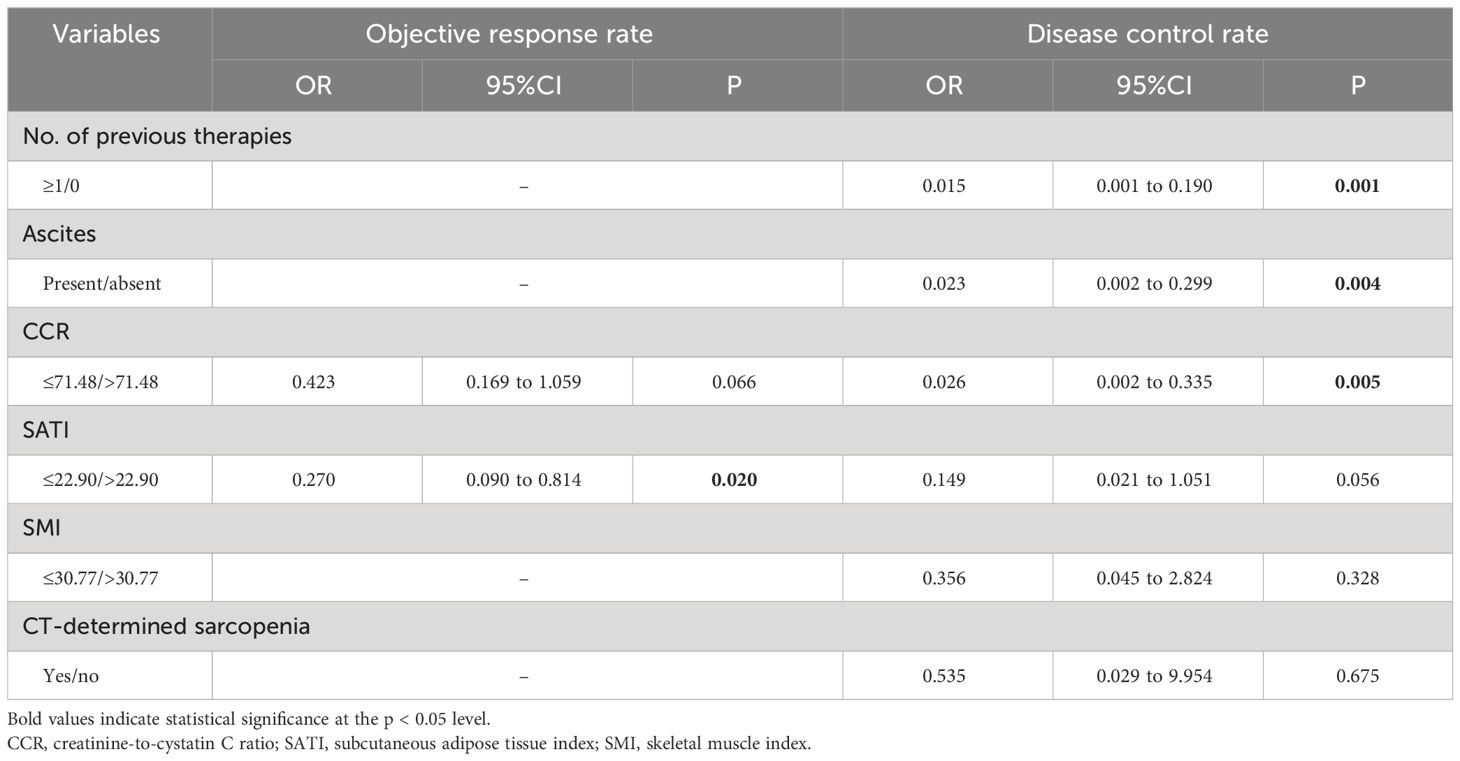
Table 3 Multivariable logistic regression analysis for ORR and DCR.
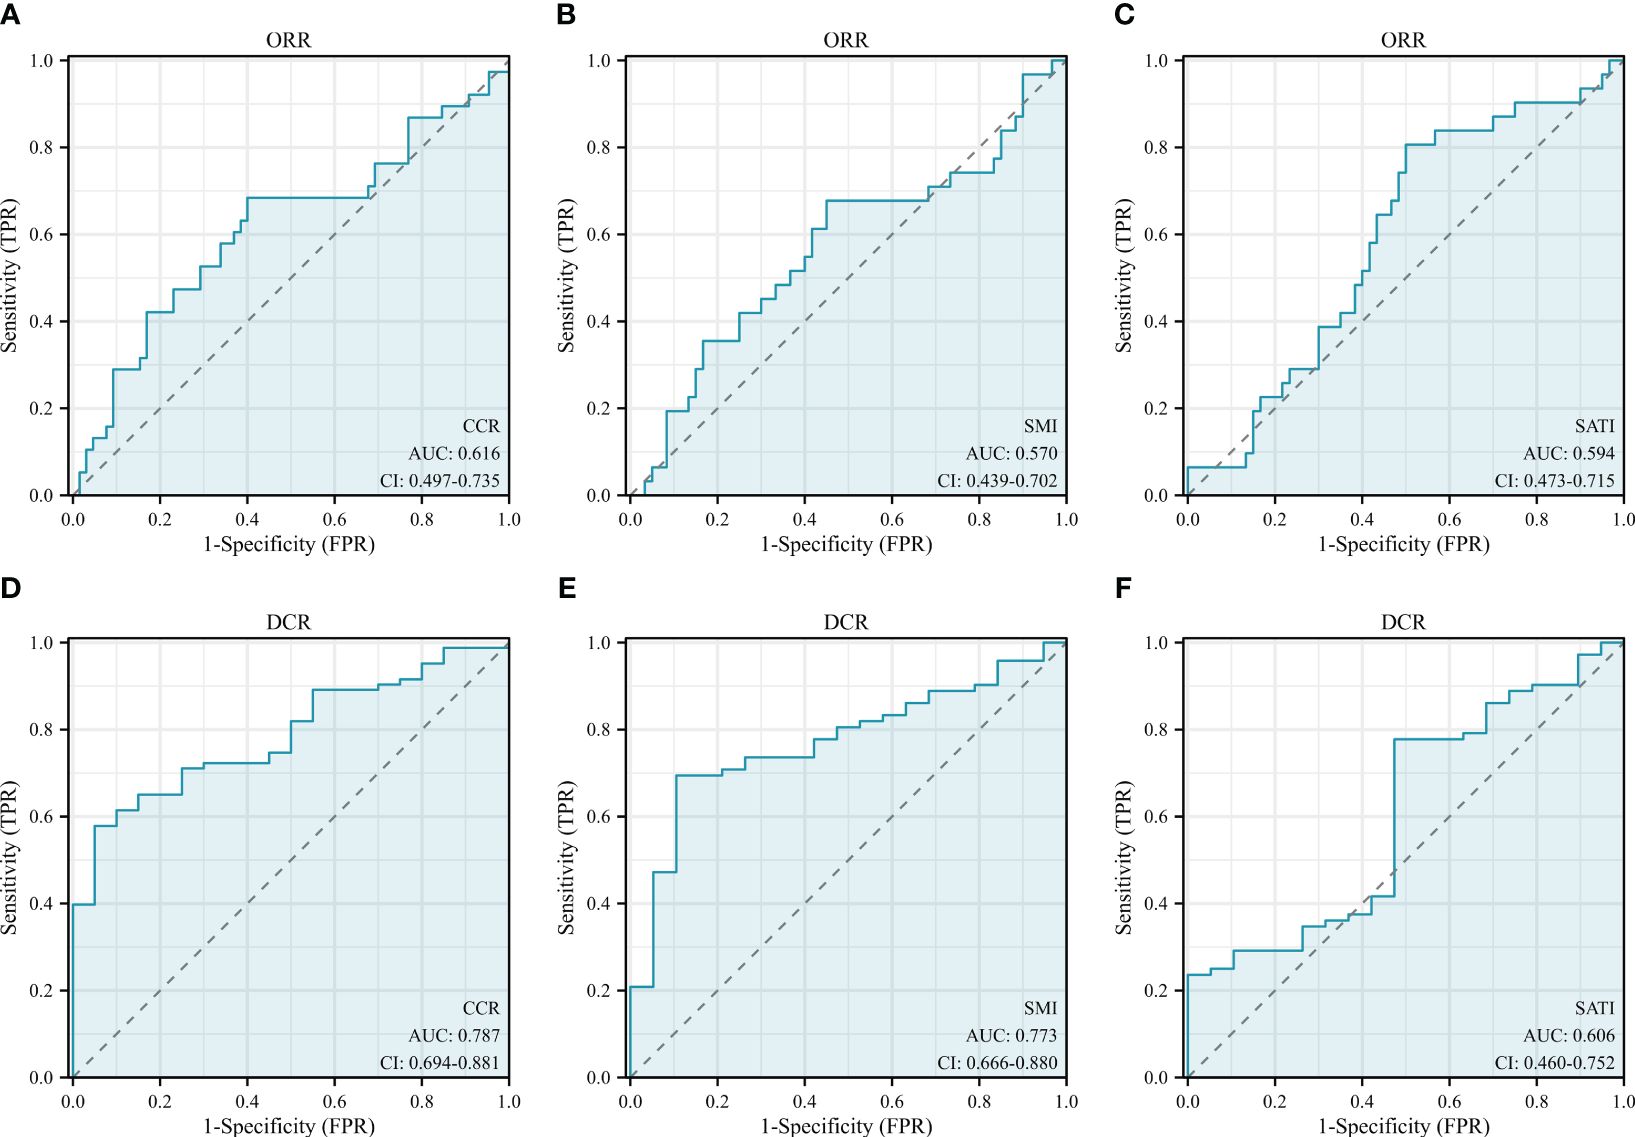
Figure 3 ROC curves of the (A, D) CCR, (B, E) SMI and (C, F) SATI for predicting treatment response. CCR, creatinine-to-cystatin C ratio; SMI, skeletal muscle index; SATI, subcutaneous adipose tissue index; ORR, objective response rate; DCR, disease control rate.
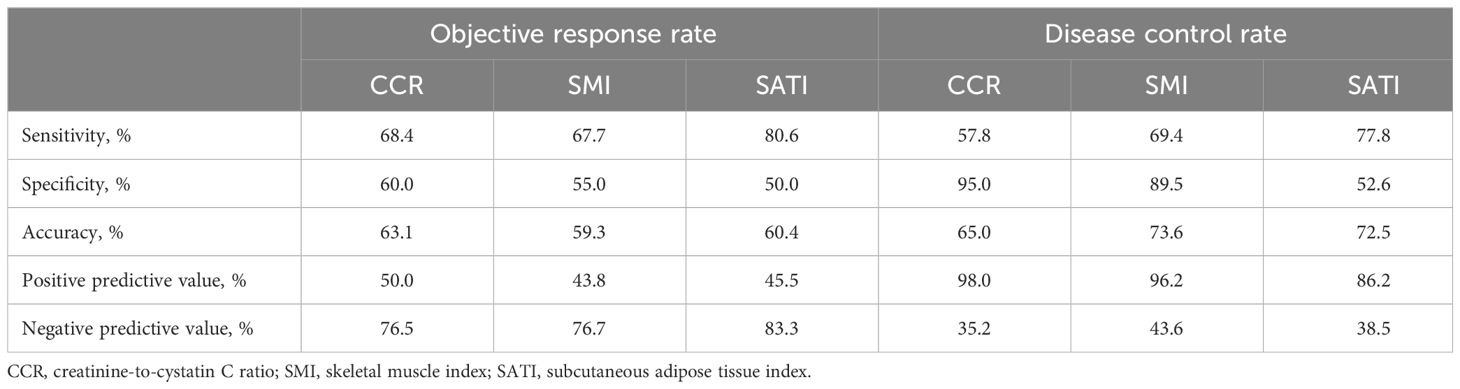
Table 4 Predictive accuracy of CCR, SMI and SATI for ORR/DCR.
Univariate Cox regression analysis showed that low CCR, low SATI, low VATI, sarcopenia, high ECOG PS, two or more lines of therapy and presence of ascites were significantly associated with poor 8-month PFS rate. On multivariate analysis, low CCR (HR=2.395, 95% CI: 1.234-4.648, P=0.010), low SATI (HR=2.188, 95% CI: 1.050-4.560, P=0.037), two or more lines of therapy (HR=4.513, 95% CI: 2.073-9.826, P<0.001) and high ECOG PS (≥2) (HR=2.365, 95% CI: 1.089-5.138, P=0.030) remained independent prognostic factors for inferior 8-month PFS rate (Table 5). The Kaplan-Meier analysis highlighted those patients with low CCR had a significantly decreased 8-month PFS rate compared to those with high CCR (37.6% vs. 55.1%, P=0.011). Similar results were observed in patients with low SATI and low VATI compared to those with high SATI (37.2% vs. 53.8%, P=0.035) and high VATI (30.5% vs. 56.8%, P=0.014), respectively (Figure 4).

Table 5 Univariable and Multivariable Cox regression for 8-month PFS rate.
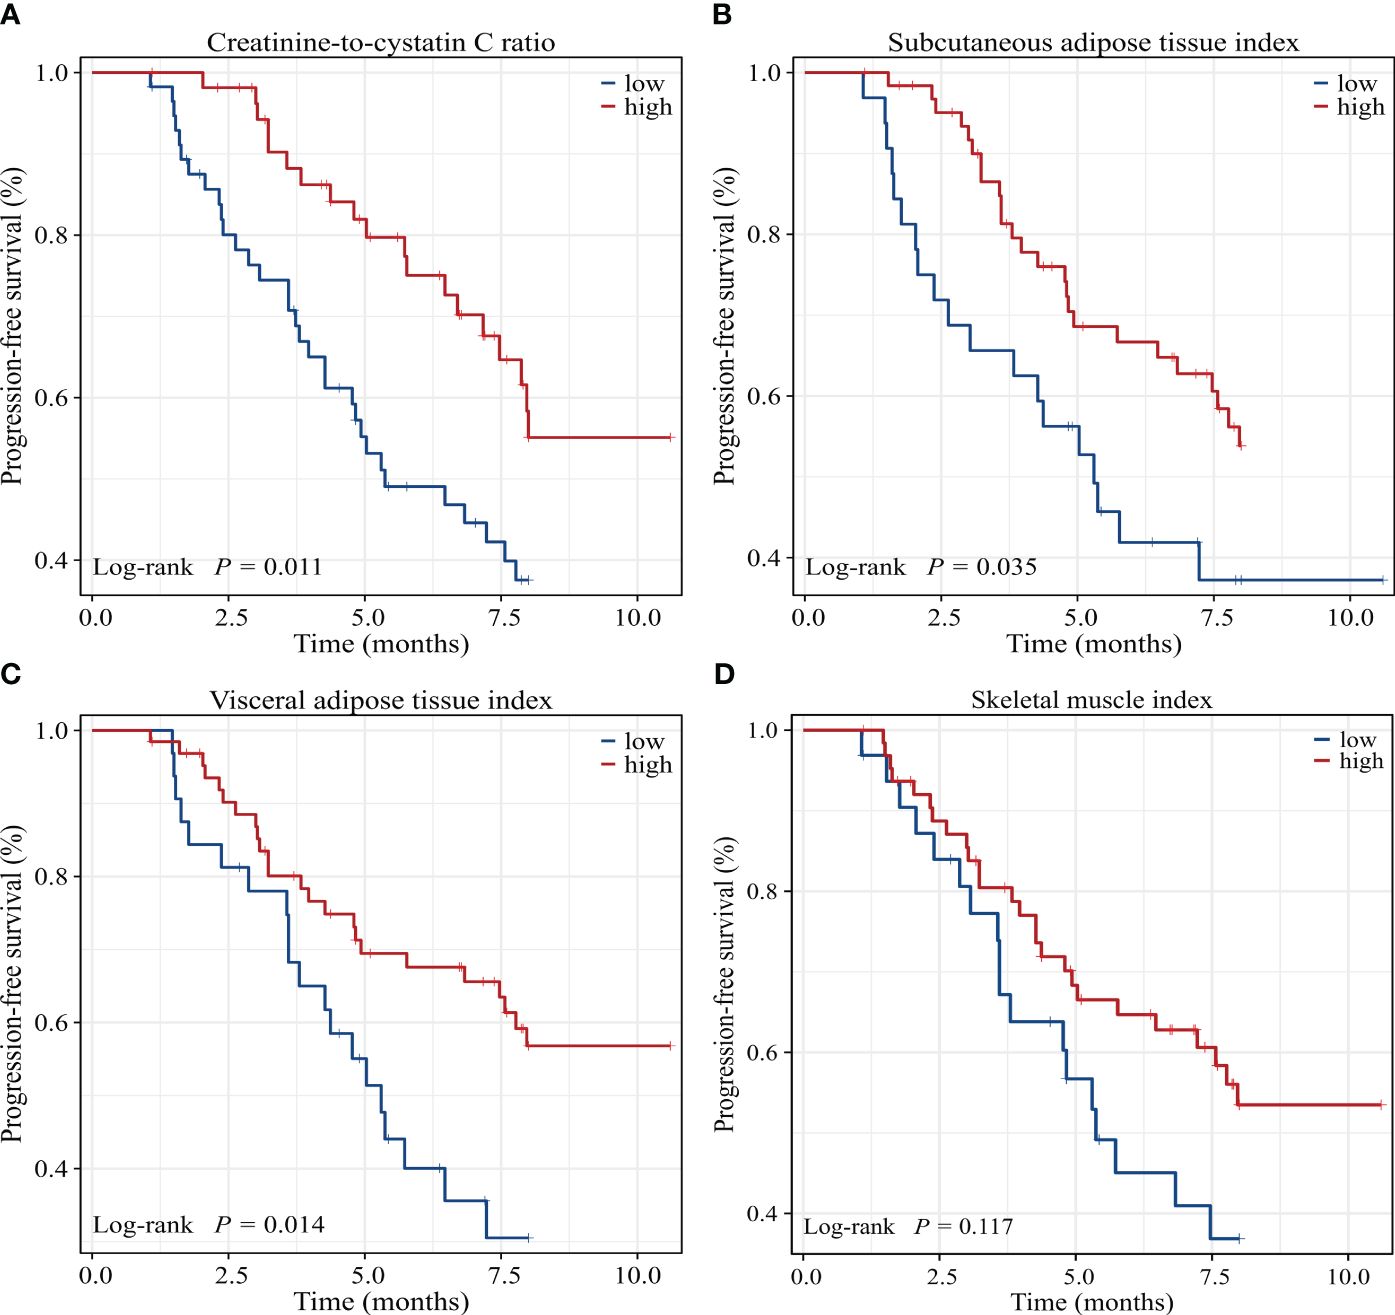
Figure 4 Kaplan-Meier survival curves of 8-month progression-free survival rate for GC patients dichotomized with (A) CCR, (B) SATI, (C) VATI and (D) SMI. CCR, creatinine-to-cystatin C ratio; SATI, subcutaneous adipose tissue index; VATI, visceral adipose tissue index; SMI, skeletal muscle index.
Univariate Cox regression analysis showed that low CCR, low SATI, low VATI, low SMI, sarcopenia, high ECOG PS, two or more lines of therapy and presence of ascites were significantly associated with poor 16-month OS rate. On multivariate analysis, low CCR (HR=2.528, 95% CI: 1.317-4.854, P=0.005), low SATI (HR=2.818, 95% CI: 1.381-5.752, P=0.004), two or more lines of therapy (HR=3.008, 95% CI: 1.417-6.387, P=0.004) and high ECOG PS (≥2) (HR=3.231, 95% CI: 1.512-6.905, P=0.002) remained independent prognostic factors for inferior 16-month OS rate (Table 6). When adjusting for CCR, SMI or sarcopenia alone, both CCR and SMI, but not sarcopenia were independent prognostic factors (Supplementary Table 3). The Kaplan-Meier analysis highlighted those patients with low CCR had a significantly decreased 16-month OS rate compared to those with high CCR (19.4% vs. 44.9%, P=0.002). Similar results were observed in patients with low SATI, low VATI and low SMI compared to those with high SATI (8.0% vs. 36.0%, P<0.001), high VATI (12.7% vs. 36.6%, P=0.009) and high SMI (18.7% vs. 33.5%, P=0.029), respectively (Figure 5).
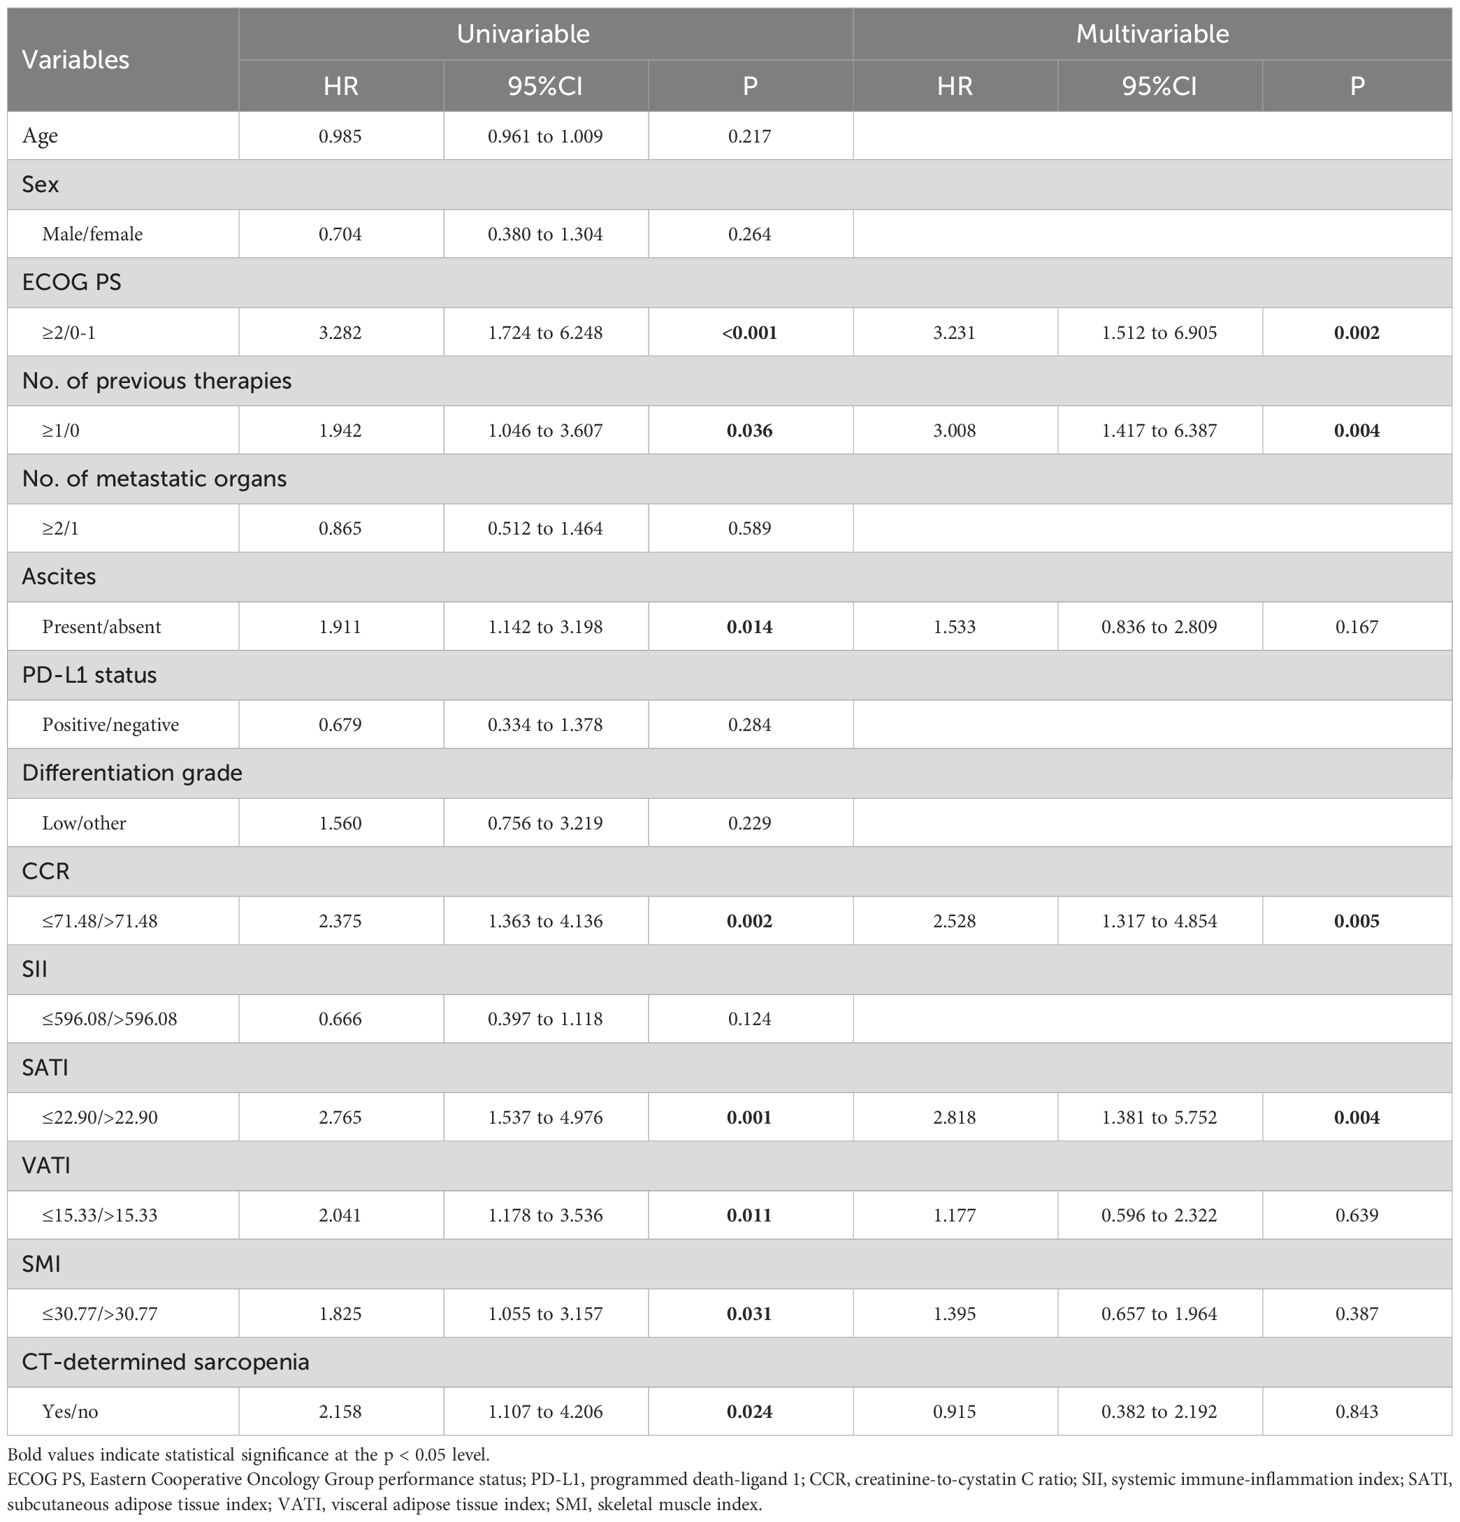
Table 6 Univariable and Multivariable Cox regression for 16-month OS rate.
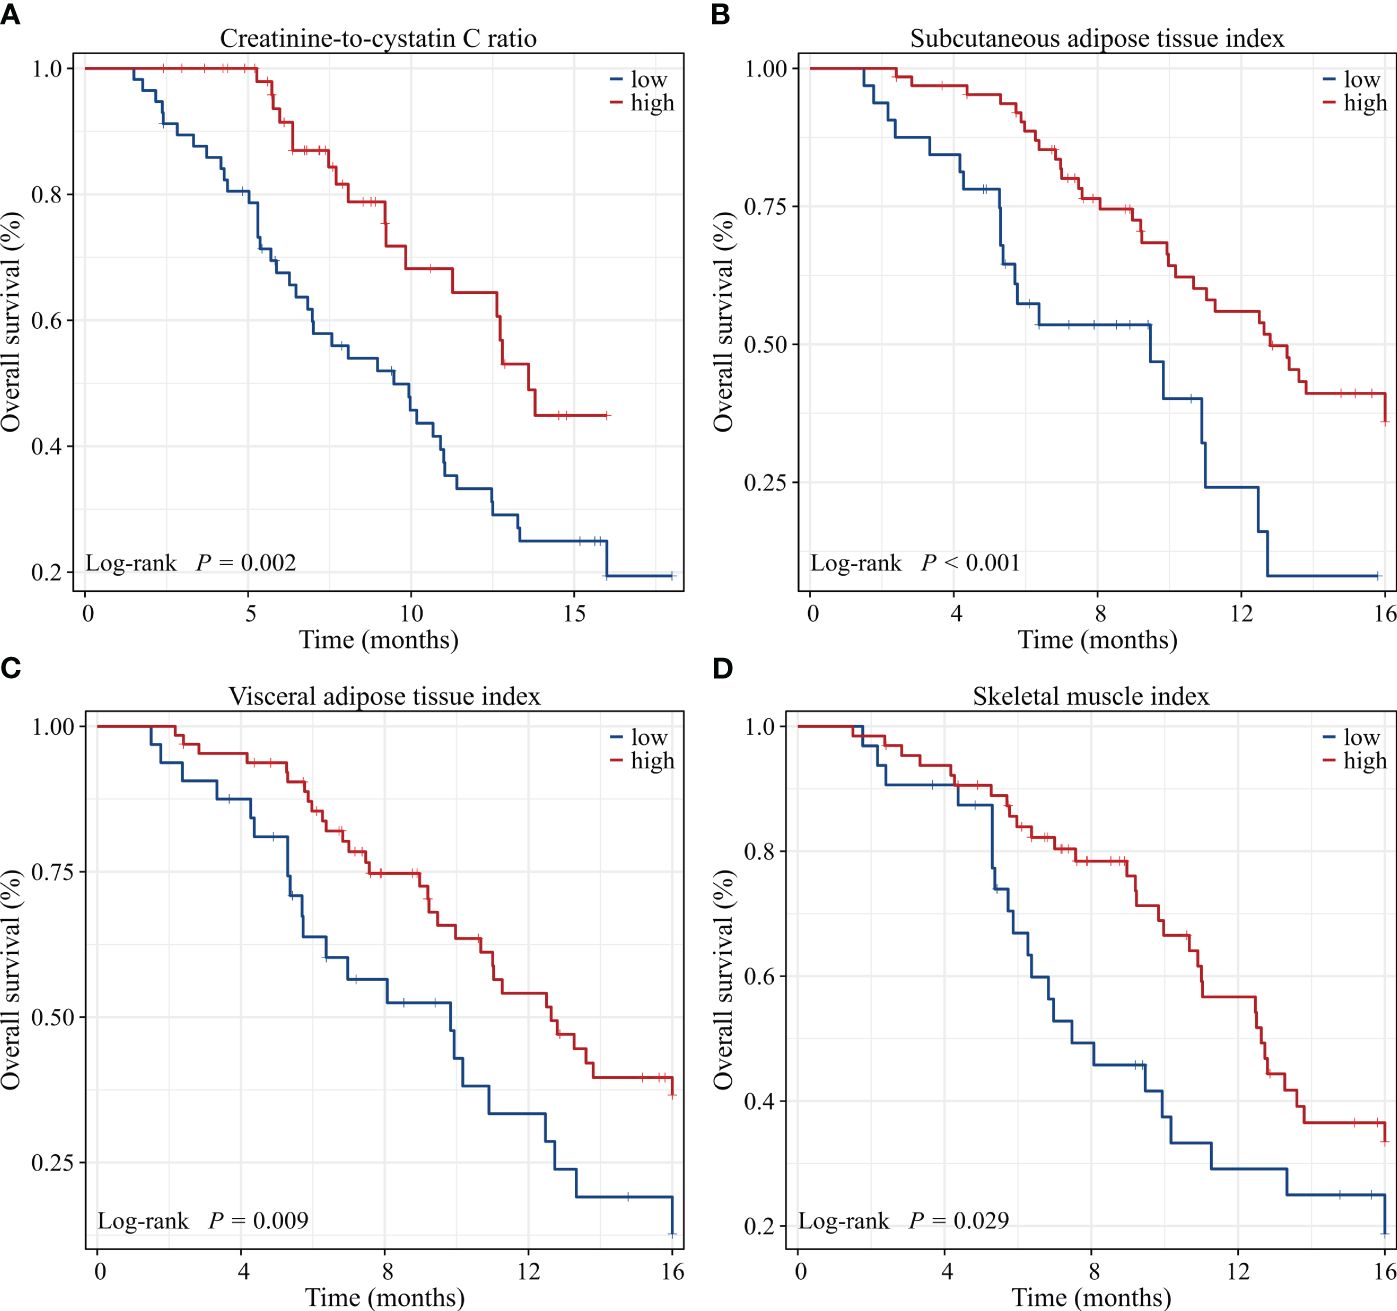
Figure 5 Kaplan-Meier survival curves of 16-month overall survival rate for GC patients dichotomized with (A) CCR, (B) SATI, (C) VATI and (D) SMI. CCR, creatinine-to-cystatin C ratio; SATI, subcutaneous adipose tissue index; VATI, visceral adipose tissue index; SMI, skeletal muscle index.
To evaluate the prognosis of GC comprehensively, we established a nomogram including ECOG PS, number of previous therapies, presence of ascites, CCR, SATI and VATI (Figure 6). Nomogram C-index was 0.756 (95% CI, 0.722-0.789), indicating an outstanding performance. In addition, DCA curves suggested that the combined model had a more significant predictive accuracy than the single model (Figure 7).
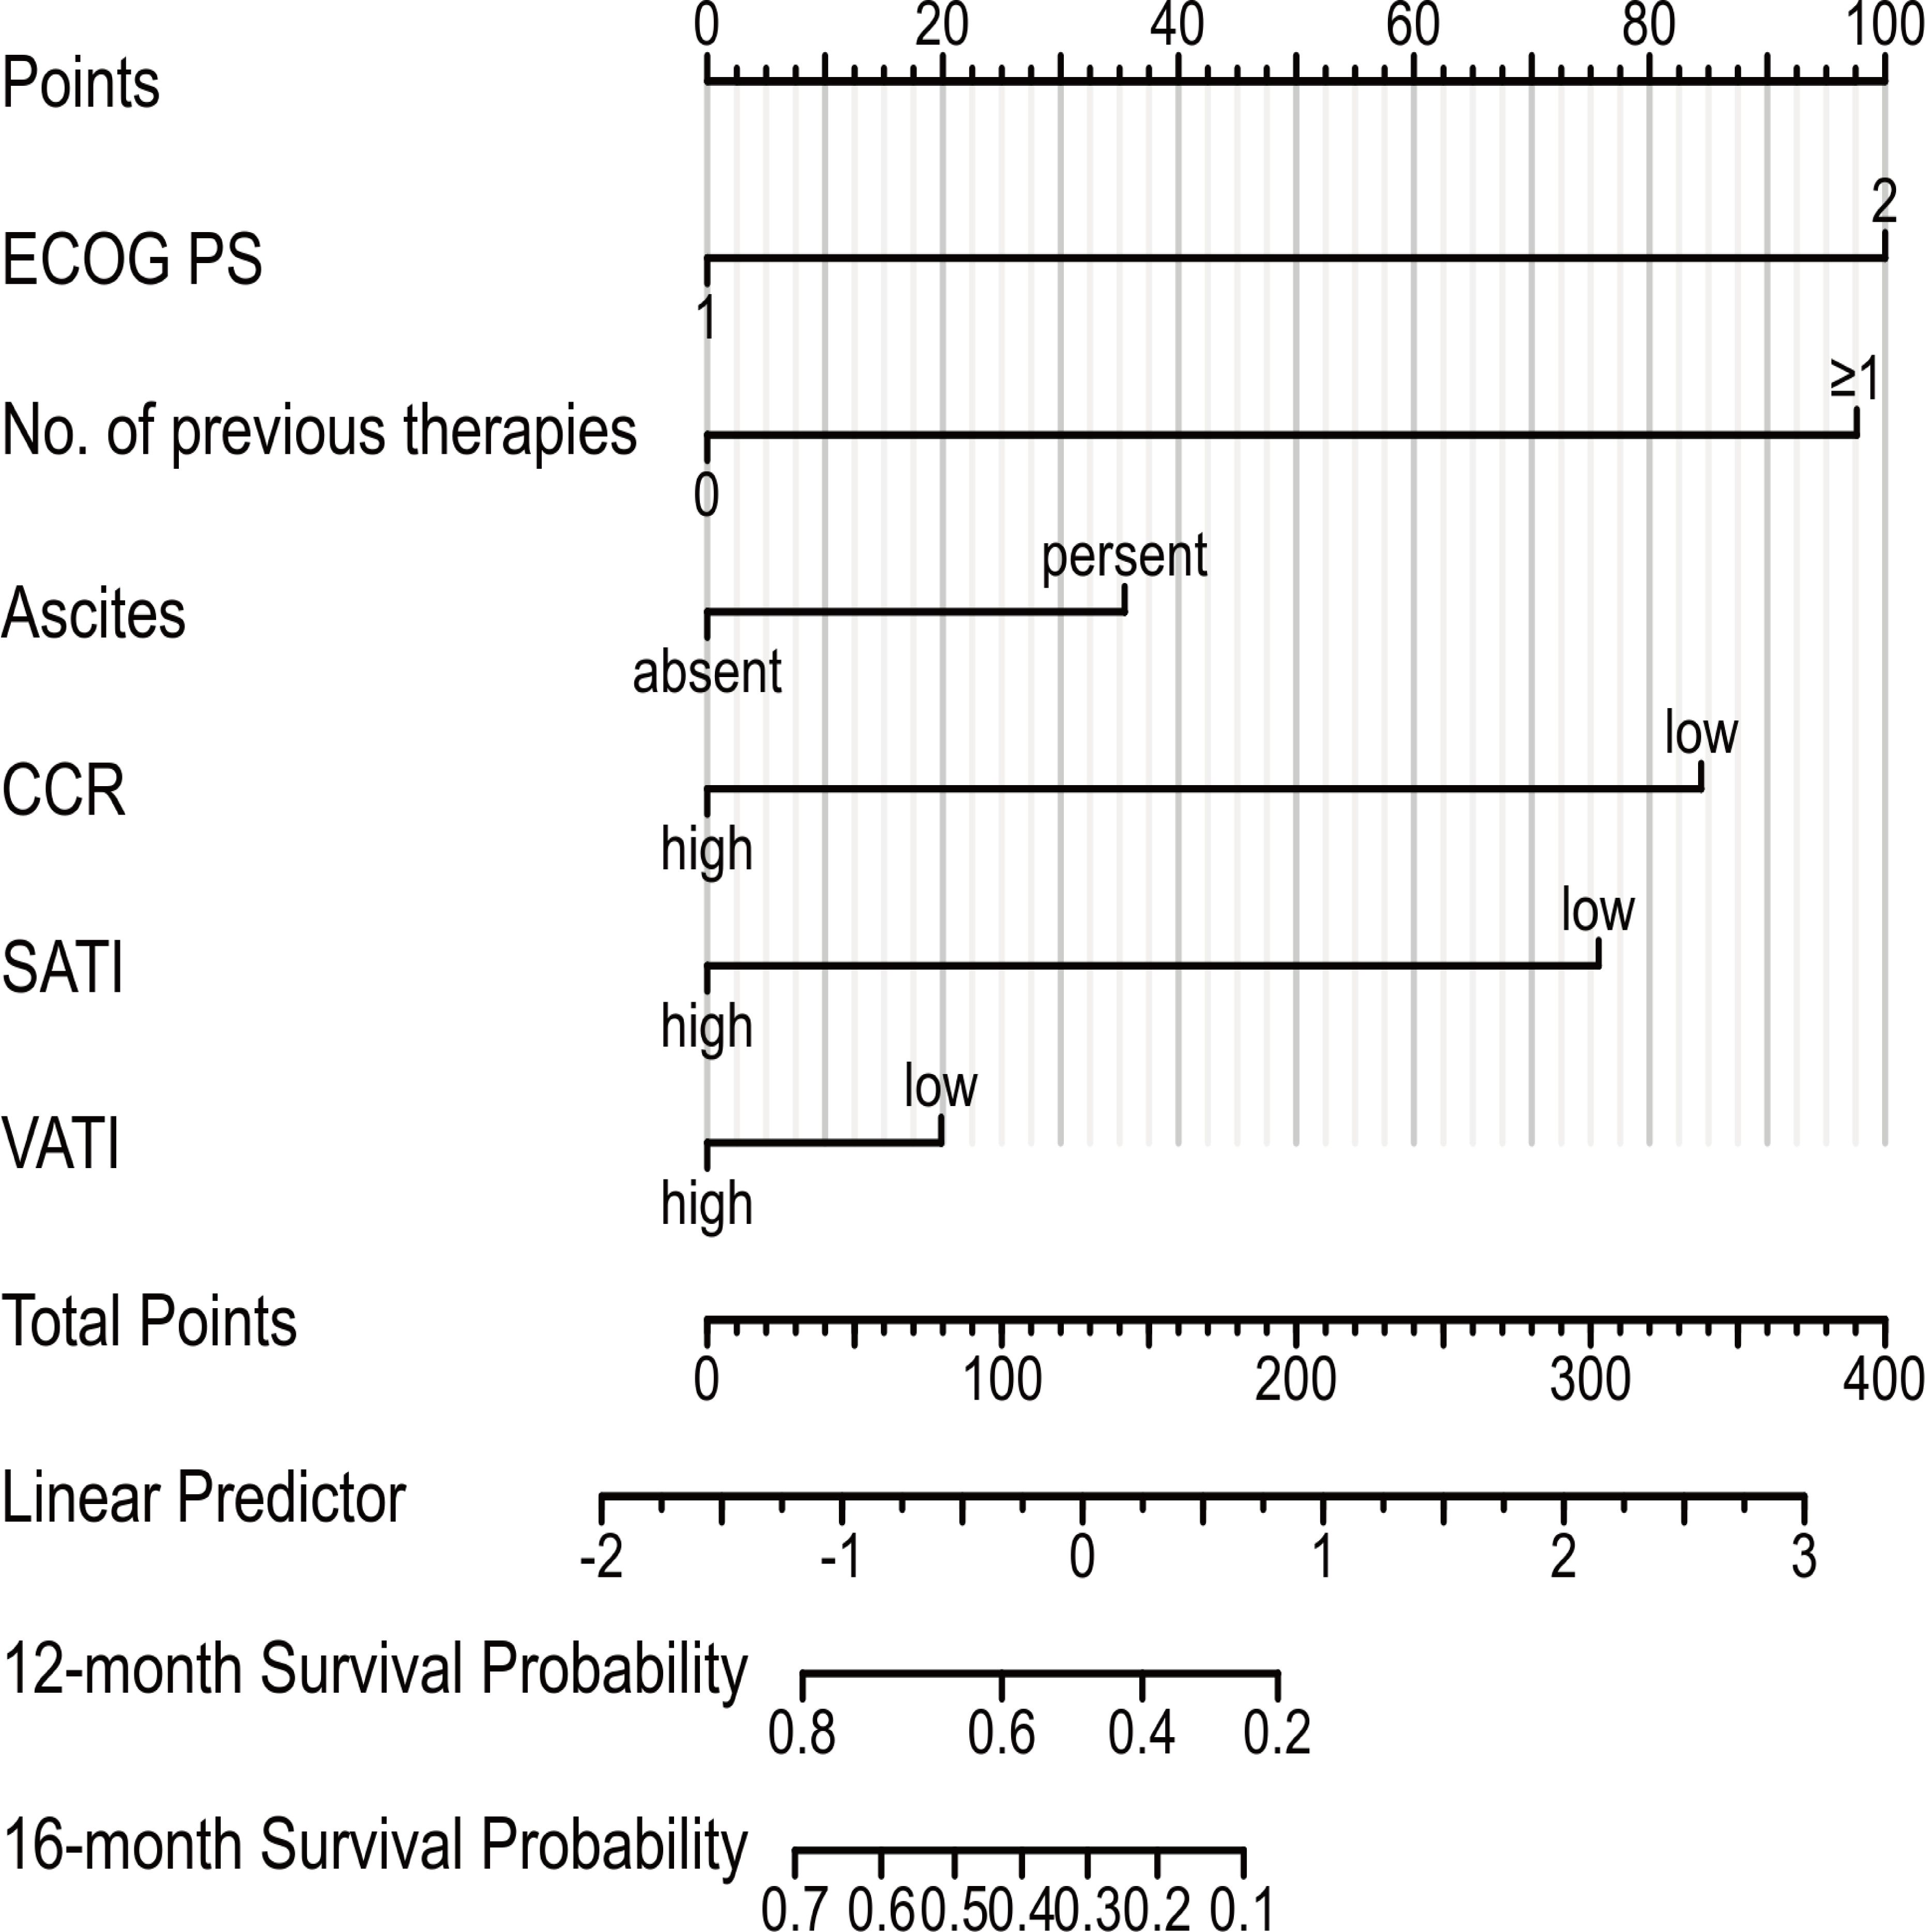
Figure 6 Prognostic nomogram to estimate their probability of survival at 12- and 16-month in patients with GC. ECOG PS, Eastern Cooperative Oncology Group performance status; CCR, creatinine-to-cystatin C ratio; SATI, subcutaneous adipose tissue index; VATI, visceral adipose tissue index.
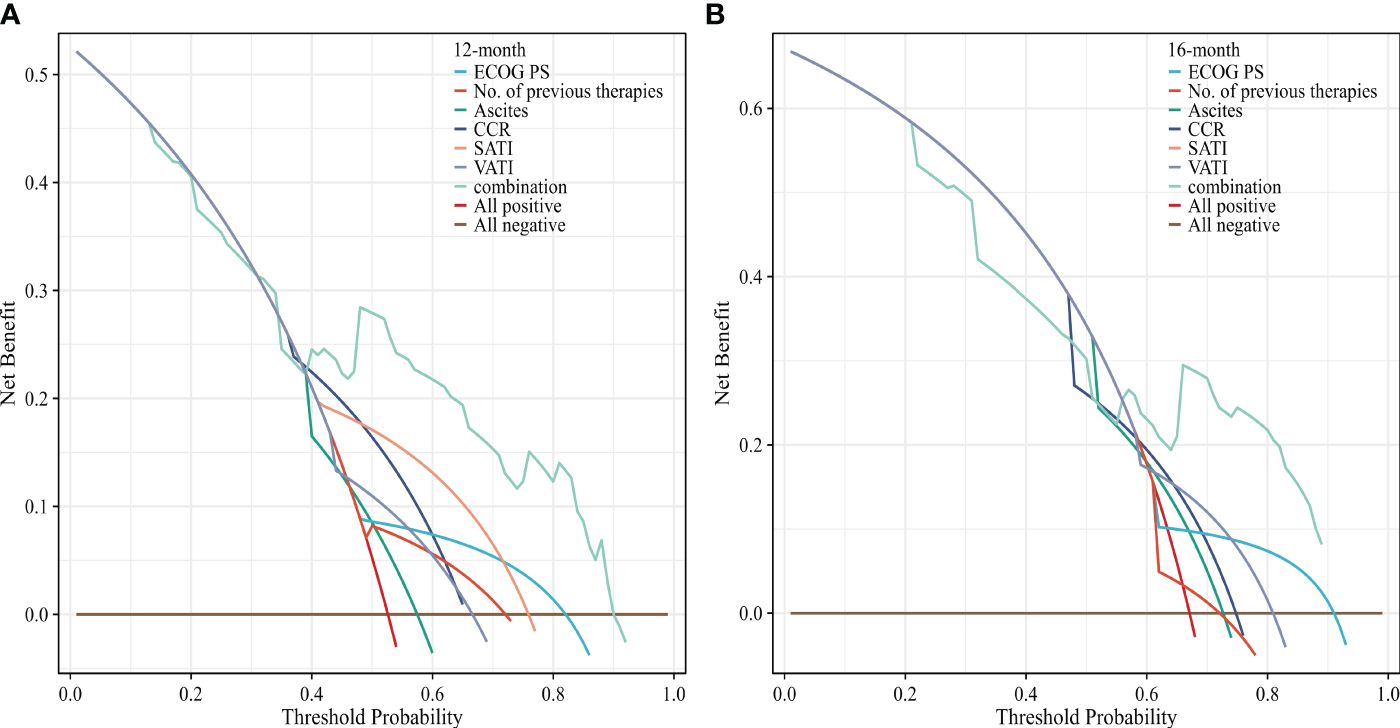
Figure 7 Decision curves analysis of the nomogram for (A) 12 and (B) 16 months OS. The x-axis represents the threshold probability, and the y-axis represents the net benefit. ECOG PS, Eastern Cooperative Oncology Group performance status; CCR, creatinine-to-cystatin C ratio; SATI, subcutaneous adipose tissue index; VATI, visceral adipose tissue index.
Our retrospective multi-institutional analysis revealed significant predictive and prognostic value in pre-treatment CCR and SATI for patients with GC undergoing PD-1-based combination therapy. In brief, patients with lower CCR and SATI exhibited inferior response rates and lower survival rates. Furthermore, we successfully developed and validated a nomogram based on CCR and BC-parameters to predict survival in GC patients.
Recent evidence suggests that CCR serves as a promising indicator for predicting the prognosis of various cancers (28, 29). Zheng et al. demonstrated the utility of CCR as a prognostic factor for post-esophagectomy complications and long-term survival in esophageal cancer patients (14). Ding and colleagues independently found that CCR predicts recurrence-free survival in gastrointestinal stromal tumor patients (15). A retrospective study involving 3,060 patients showed a strong association between CCR at diagnosis and both 6- and 12-month survival (30). Despite the growing interest in CCR analysis in cancer patients, limited research has been conducted in the burgeoning field of cancer immunotherapy. A recent study highlighted the significant prognostic value of pre-treatment CCR in NSCLC patients undergoing PD-1 inhibitor monotherapy (18). In line with the previous studies, our findings indicated that a lower CCR was independently associated with lower survival rates. The novelty of our findings was that we demonstrated a potential link between CCR and ORR/DCR in patients with GC receiving PD-1 based combination therapy.
There are several possible mechanisms, which remain to be proved, to explain the effect of CCR on the efficacy and prognosis in GC patients. Firstly, CCR partially reflects muscle mass or SMI, which is a well-known risk factor for the efficacy and prognosis of GC patients treated with immunotherapy (31, 32). In addition, CCR may also be a marker of systemic inflammation. Previous studies reported that serum creatinine levels were low in patients with high white blood cell counts (33), while the levels of cystatin C were elevated in chronic inflammatory conditions (34). Consequently, low CCR may be associated with increased inflammation burden, which was reported to be poor prognostic factor in cancer patients (35). Finally, some researchers reported that cystatin C might be involved in cancer progression by antagonizing the suppressive functions of transforming growth factor β (TGF-β) (36). Therefore, CCR may be a promising predictive and prognostic biomarker in GC patients treated with ICIs.
Several studies have explored the impact of sarcopenia on outcomes in various cancers (37). A recent meta-analysis of 2501 patients from 26 trials concluded that sarcopenia predicts response rates and survival outcomes in solid cancers treated with ICIs (38). Kim et al. indicated that sarcopenia to be a standalone prognostic marker for PFS but not for OS in microsatellite-stable GC patients receiving immune monotherapy (31). Our results suggested that sarcopenia was not a significant predictor for survival rates on multivariate analysis. These inconsistencies might stem from variations in cut-off values of sarcopenia or differences in treatment regimen across studies.
VAT and SAT reflect both the nutritional and inflammatory status of cancer patients. Subcutaneous and visceral adiposity have different structures and functions and play different roles in immune and metabolic regulation. VAT secretes pro-inflammatory factors that contribute to systemic inflammation and metabolic disturbances (39). On the contrary, the leptin secreted by SAT can increase insulin sensitivity and lipid metabolism and exert beneficial effects on metabolism and anti-inflammatory (40). Several studies focusing on cancer patients have suggested a relationship between VAT or SAT and survival, although sometimes results are conflicting (41–44). He et al. reported that SATI but not VATI was significantly associated with OS in GC patients undergoing dual PD-1 and HER2 blockade (45). Our results demonstrated that low SATI was associated with lower response rates and survival rates, which aligned partially with their findings. Martini et al. found that high VATI was highly linked to improved PFS and showed a trend toward longer OS in urothelial carcinoma patients treated with ICIs (42). In contrast, Ke and colleagues argued that low VATI was linked to preferable prognosis in invasive bladder cancer patients receiving immunotherapy (46). Moreover, several studies demonstrated that high VATI was linked to increased incidence rates of post-operative complications in GC patients (47–49). Our study suggested that low VATI acted as a risk factor in univariate analysis, while it failed to serve an independent negative prognostic factor for survival in multivariate analysis in GC patients receiving PD-1 inhibitors-based combination therapy. The inconsistent effects of VATI on cancer treatment efficacy and survival may be explained by the differences in disease context, treatment regimen and patient characteristics (BMI, sex, age, et al.) (50). Next, we will continue to collect enough samples and stratify patients by their BMI and sex to further investigate the protective effect of subcutaneous and visceral adiposity in patients of different baseline characteristics.
To the best of our knowledge, this is the first study to investigate the effects of the CCR, SII and BC-parameters on response rates and survival outcomes in GC patients receiving PD-1 based combination therapy. However, our investigation has certain limitations. Firstly, it is a retrospective study with a small sample size and different treatment regimens of PD-1. Secondly, missing PD-L1 status data might affect the power of the statistical analysis, although no PD-L1 variation was observed in high or low CCR and SATI patients. Lastly, our study did not analyze ICIs-linked adverse events (AEs) due to the predominance of low to moderate-grade AEs. Consequently, larger prospective cohort studies are necessary to validate the findings presented in this retrospective analysis.
In conclusion, our study demonstrates that CCR and SATI are independent predictive and prognostic factors in patients with metastatic GC receiving PD-1 inhibitors-based combination therapy. The nomogram based on CCR and BC-parameters may assist in identifying potential patients who would benefit from PD-1 inhibitors. Therefore, further large-sample and prospective studies are necessary to validate our conclusions.
The raw data supporting the conclusions of this article will be made available by the authors, without undue reservation.
The studies involving humans were approved by General Hospital of Northern Theater Command Ethics Review Center. The studies were conducted in accordance with the local legislation and institutional requirements. The human samples used in this study were acquired from a by- product of routine care or industry. Written informed consent for participation was not required from the participants or the participants’ legal guardians/next of kin in accordance with the national legislation and institutional requirements.
HJ: Data curation, Formal analysis, Writing – original draft, Conceptualization, Investigation, Methodology. BL: Methodology, Writing – original draft, Investigation, Project administration. PJ: Validation, Writing – original draft, Resources, Visualization. YL: Visualization, Writing – original draft, Software. LC: Data curation, Writing – original draft, Validation. SJ: Data curation, Writing – original draft, Visualization. JW: Data curation, Writing – original draft, Software. YS: Supervision, Writing – original draft, Funding acquisition, Project administration. ZZ: Project administration, Writing – original draft, Resources. JM: Conceptualization, Writing – review & editing, Funding acquisition, Investigation, Methodology. LZ: Software, Writing – review & editing, Funding acquisition, Supervision. CD: Conceptualization, Funding acquisition, Writing – review & editing, Investigation, Methodology, Supervision.
The author(s) declare financial support was received for the research, authorship, and/or publication of this article. This research was supported by Liaoning Province Nature Science Foundation (2023JH2/101700101), Shenyang Municipal Medical Engineering Cross Research Foundation of china (22-321-32-09), Shenyang Municipal Natural Science Foundation (22-321-33-32), and Pengcheng Talent-Medical Young Reserve Talent Training Program (XWRCHT20220002).
Despite the retrospective nature of this study, the authors still thank our patients for their commitment to treatment and our care.
The authors declare that the research was conducted in the absence of any commercial or financial relationships that could be construed as a potential conflict of interest.
All claims expressed in this article are solely those of the authors and do not necessarily represent those of their affiliated organizations, or those of the publisher, the editors and the reviewers. Any product that may be evaluated in this article, or claim that may be made by its manufacturer, is not guaranteed or endorsed by the publisher.
The Supplementary Material for this article can be found online at: https://www.frontiersin.org/articles/10.3389/fimmu.2024.1364728/full#supplementary-material
1. Smyth EC, Nilsson M, Grabsch HI, van Grieken NC, Lordick F. Gastric cancer. Lancet. (2020) 396:635–48. doi: 10.1016/S0140-6736(20)31288-5
2. Shitara K, Van Cutsem E, Bang YJ, Fuchs C, Wyrwicz L, Lee KW, et al. Efficacy and safety of pembrolizumab or pembrolizumab plus chemotherapy vs chemotherapy alone for patients with first-line, advanced gastric cancer: the KEYNOTE-062 phase 3 randomized clinical trial. JAMA Oncol. (2020) 6:1571–80. doi: 10.1001/jamaoncol.2020.3370
3. Janjigian YY, Shitara K, Moehler M, Garrido M, Salman P, Shen L, et al. First-line nivolumab plus chemotherapy versus chemotherapy alone for advanced gastric, gastro-oesophageal junction, and oesophageal adenocarcinoma (CheckMate 649): a randomised, open-label, phase 3 trial. Lancet. (2021) 398:27–40. doi: 10.1016/S0140-6736(21)00797-2
4. Baxmann AC, Ahmed MS, Marques NC, Menon VB, Pereira AB, Kirsztajn GM, et al. Influence of muscle mass and physical activity on serum and urinary creatinine and serum cystatin C. Clin J Am Soc Nephrol. (2008) 3:348–54. doi: 10.2215/CJN.02870707
5. Onopiuk A, Tokarzewicz A, Gorodkiewicz E. Cystatin C: a kidney function biomarker. Adv Clin Chem. (2015) 68:57–69. doi: 10.1016/bs.acc.2014.11.007
6. Kashani KB, Frazee EN, Kukralova L, Sarvottam K, Herasevich V, Young PM, et al. Evaluating muscle mass by using markers of kidney function: development of the sarcopenia index. Crit Care Med. (2017) 45:e23–9. doi: 10.1097/CCM.0000000000002013
7. Jung CY, Joo YS, Kim HW, Han SH, Yoo TH, Kang SW, et al. Creatinine-cystatin C ratio and mortality in patients receiving intensive care and continuous kidney replacement therapy: A retrospective cohort study. Am J Kidney Dis. (2021) 77:509–516.e1. doi: 10.1053/j.ajkd.2020.08.014
8. Barreto EF, Poyant JO, Coville HH, Dierkhising RA, Kennedy CC, Gajic O, et al. Validation of the sarcopenia index to assess muscle mass in the critically ill: A novel application of kidney function markers. Clin Nutr. (2019) 38:1362–7. doi: 10.1016/j.clnu.2018.05.031
9. Liao L, Shi S, Ding B, Zhang R, Tu J, Zhao Y, et al. The relationship between serum creatinine/cystatin C ratio and mortality in hypertensive patients. Nutr Metab Cardiovasc Dis. (2023) 34:369–76. doi: 10.1016/j.numecd.2023.09.004
10. Osaka T, Hamaguchi M, Hashimoto Y, Ushigome E, Tanaka M, Yamazaki M, et al. Decreased the creatinine to cystatin C ratio is a surrogate marker of sarcopenia in patients with type 2 diabetes. Diabetes Res Clin Pract. (2018) 139:52–8. doi: 10.1016/j.diabres.2018.02.025
11. Wei W, Li S, Liu J, Liu Y, Chen K, Chen S, et al. Prognostic value of creatinine-to-cystatin c ratio in patients with type 2 diabetes mellitus: a cohort study. Diabetol Metab Syndr. (2022) 14:176. doi: 10.1186/s13098-022-00958-y
12. Harimoto N, Araki K, Yamanaka T, Hagiwara K, Ishii N, Tsukagoshi M, et al. The ratio of creatinine and cystatin C estimated glomerular filtration rates as a surrogate marker in patients with hepatocellular carcinoma undergoing hepatic resection. J Hepatobiliary Pancreat Sci. (2022) 29:964–73. doi: 10.1002/jhbp.1164
13. Tang T, Xie L, Hu S, Tan L, Lei X, Luo X, et al. Serum creatinine and cystatin C-based diagnostic indices for sarcopenia in advanced non-small cell lung cancer. J Cachexia Sarcopenia Muscle. (2022) 13:1800–10. doi: 10.1002/jcsm.12977
14. Zheng C, Wang E, Li JS, Xie K, Luo C, Ge QY, et al. Serum creatinine/cystatin C ratio as a screening tool for sarcopenia and prognostic indicator for patients with esophageal cancer. BMC Geriatr. (2022) 22:207. doi: 10.1186/s12877-022-02925-8
15. Ding P, Guo H, Sun C, Chen S, Yang P, Tian Y, et al. Serum creatinine/cystatin C ratio is a systemic marker of sarcopenia in patients with gastrointestinal stromal tumours. Front Nutr. (2022) 9:963265. doi: 10.3389/fnut.2022.963265
16. Gao S, Xie H, Wei L, Liu M, Liang Y, Wang Q, et al. Serum creatinine/cystatin C ratio as a prognostic indicator for patients with colorectal cancer. Front Oncol. (2023) 13:1155520. doi: 10.3389/fonc.2023.1155520
17. Tsukagoshi M, Watanabe A, Araki K, Ishii N, Hagiwara K, Hoshino K, et al. Usefulness of serum creatinine and cystatin C ratio as a screening tool for predicting prognosis in patients with pancreatic cancer. Ann Gastroenterol Surg. (2023) 7:784–92. doi: 10.1002/ags3.12671
18. Ashton E, Arrondeau J, Jouinot A, Boudou-Rouquette P, Hirsch L, Huillard O, et al. Impact of sarcopenia indexes on survival and severe immune acute toxicity in metastatic non-small cell lung cancer patients treated with PD-1 immune checkpoint inhibitors. Clin Nutr. (2023) 42:944–53. doi: 10.1016/j.clnu.2023.03.023
19. Bundred J, Kamarajah SK, Roberts KJ. Body composition assessment and sarcopenia in patients with pancreatic cancer: a systematic review and meta-analysis. HPB (Oxford). (2019) 21:1603–12. doi: 10.1016/j.hpb.2019.05.018
20. Vrieling A, Kampman E, Knijnenburg NC, Mulders PF, Sedelaar JPM, Baracos VE, et al. Body composition in relation to clinical outcomes in renal cell cancer: A systematic review and meta-analysis. Eur Urol Focus. (2018) 4:420–34. doi: 10.1016/j.euf.2016.11.009
21. Kamarajah SK, Bundred J, Tan BHL. Body composition assessment and sarcopenia in patients with gastric cancer: a systematic review and meta-analysis. Gastric Cancer. (2019) 22:10–22. doi: 10.1007/s10120-018-0882-2
22. Martin L, Birdsell L, Macdonald N, Reiman T, Clandinin MT, McCargar LJ, et al. Cancer cachexia in the age of obesity: skeletal muscle depletion is a powerful prognostic factor, independent of body mass index. J Clin Oncol. (2013) 31:1539–47. doi: 10.1200/JCO.2012.45.2722
23. Cruz-Jentoft AJ, Bahat G, Bauer J, Boirie Y, Bruyere O, Cederholm T, et al. Sarcopenia: revised European consensus on definition and diagnosis. Age Ageing. (2019) 48:16–31. doi: 10.1093/ageing/afy169
24. Xiao J, Mazurak VC, Olobatuyi TA, Caan BJ, Prado CM. Visceral adiposity and cancer survival: a review of imaging studies. Eur J Cancer Care (Engl). (2018) 27:e12611. doi: 10.1111/ecc.12611
25. Zhuang CL, Huang DD, Pang WY, Zhou CJ, Wang SL, Lou N, et al. Sarcopenia is an independent predictor of severe postoperative complications and long-term survival after radical gastrectomy for gastric cancer: analysis from a large-scale cohort. Med (Baltimore). (2016) 95:e3164. doi: 10.1097/MD.0000000000003164
26. Crombe A, Kind M, Toulmonde M, Italiano A, Cousin S. Impact of CT-based body composition parameters at baseline, their early changes and response in metastatic cancer patients treated with immune checkpoint inhibitors. Eur J Radiol. (2020) 133:109340. doi: 10.1016/j.ejrad.2020.109340
27. Eisenhauer EA, Therasse P, Bogaerts J, Schwartz LH, Sargent D, Ford R, et al. New response evaluation criteria in solid tumours: revised RECIST guideline (version 1.1). Eur J Cancer. (2009) 45:228–47. doi: 10.1016/j.ejca.2008.10.026
28. Fu X, Tian Z, Wen S, Sun H, Thapa S, Xiong H, et al. A new index based on serum creatinine and cystatin C is useful for assessing sarcopenia in patients with advanced cancer. Nutrition. (2021) 82:111032. doi: 10.1016/j.nut.2020.111032
29. Sun J, Yang H, Cai W, Zheng J, Shen N, Yang X, et al. Serum creatinine/cystatin C ratio as a surrogate marker for sarcopenia in patients with gastric cancer. BMC Gastroenterol. (2022) 22:26. doi: 10.1186/s12876-022-02093-4
30. Jung CY, Kim HW, Han SH, Yoo TH, Kang SW, Park JT. Creatinine-cystatin C ratio and mortality in cancer patients: a retrospective cohort study. J Cachexia Sarcopenia Muscle. (2022) 13:2064–72. doi: 10.1002/jcsm.13006
31. Kim YY, Lee J, Jeong WK, Kim ST, Kim JH, Hong JY, et al. Prognostic significance of sarcopenia in microsatellite-stable gastric cancer patients treated with programmed death-1 inhibitors. Gastric Cancer. (2021) 24:457–66. doi: 10.1007/s10120-020-01124-x
32. Ulmann G, Kai J, Durand JP, Neveux N, Jouinot A, De Bandt JP, et al. Creatinine-to-cystatin C ratio and bioelectrical impedance analysis for the assessement of low lean body mass in cancer patients: Comparison to L3-computed tomography scan. Nutrition. (2021) 81:110895. doi: 10.1016/j.nut.2020.110895
33. Reddan DN, Klassen PS, Szczech LA, Coladonato JA, O'Shea S, Owen WF Jr., et al. White blood cells as a novel mortality predictor in haemodialysis patients. Nephrol Dial Transplant. (2003) 18:1167–73. doi: 10.1093/ndt/gfg066
34. Keller CR, Odden MC, Fried LF, Newman AB, Angleman S, Green CA, et al. Kidney function and markers of inflammation in elderly persons without chronic kidney disease: the health, aging, and body composition study. Kidney Int. (2007) 71:239–44. doi: 10.1038/sj.ki.5002042
35. Grivennikov SI, Greten FR, Karin M. Immunity, inflammation, and cancer. Cell. (2010) 140:883–99. doi: 10.1016/j.cell.2010.01.025
36. Zi M, Xu Y. Involvement of cystatin C in immunity and apoptosis. Immunol Lett. (2018) 196:80–90. doi: 10.1016/j.imlet.2018.01.006
37. Shachar SS, Williams GR, Muss HB, Nishijima TF. Prognostic value of sarcopenia in adults with solid tumours: A meta-analysis and systematic review. Eur J Cancer. (2016) 57:58–67. doi: 10.1016/j.ejca.2015.12.030
38. Takenaka Y, Oya R, Takemoto N, Inohara H. Predictive impact of sarcopenia in solid cancers treated with immune checkpoint inhibitors: a meta-analysis. J Cachexia Sarcopenia Muscle. (2021) 12:1122–35. doi: 10.1002/jcsm.12755
39. Deng T, Lyon CJ, Bergin S, Caligiuri MA, Hsueh WA. Obesity, inflammation, and cancer. Annu Rev Pathol. (2016) 11:421–49. doi: 10.1146/annurev-pathol-012615-044359
40. Ebadi M, Baracos VE, Bathe OF, Robinson LE, Mazurak VC. Loss of visceral adipose tissue precedes subcutaneous adipose tissue and associates with n-6 fatty acid content. Clin Nutr. (2016) 35:1347–53. doi: 10.1016/j.clnu.2016.02.014
41. Young AC, Quach HT, Song H, Davis EJ, Moslehi JJ, Ye F, et al. Impact of body composition on outcomes from anti-PD1 +/- anti-CTLA-4 treatment in melanoma. J Immunother Cancer. (2020) 8:e000821. doi: 10.1136/jitc-2020-000821
42. Martini DJ, Shabto JM, Goyal S, Liu Y, Olsen TA, Evans ST, et al. Body composition as an independent predictive and prognostic biomarker in advanced urothelial carcinoma patients treated with immune checkpoint inhibitors. Oncologist. (2021) 26:1017–25. doi: 10.1002/onco.13922
43. Khan A, Welman CJ, Abed A, O'Hanlon S, Redfern A, Azim S, et al. Association of computed tomography measures of muscle and adipose tissue and progressive changes throughout treatment with clinical endpoints in patients with advanced lung cancer treated with immune checkpoint inhibitors. Cancers (Basel). (2023) 15:1382. doi: 10.3390/cancers15051382
44. Esposito A, Marra A, Bagnardi V, Frassoni S, Morganti S, Viale G, et al. Body mass index, adiposity and tumour infiltrating lymphocytes as prognostic biomarkers in patients treated with immunotherapy: A multi-parametric analysis. Eur J Cancer. (2021) 145:197–209. doi: 10.1016/j.ejca.2020.12.028
45. He M, Chen ZF, Zhang L, Gao X, Chong X, Li HS, et al. Associations of subcutaneous fat area and Systemic Immune-inflammation Index with survival in patients with advanced gastric cancer receiving dual PD-1 and HER2 blockade. J Immunother Cancer. (2023) 11:e007054. doi: 10.1136/jitc-2023-007054
46. Ke ZB, Chen H, Chen JY, Cai H, Lin YZ, Sun XL, et al. Preoperative abdominal fat distribution and systemic immune inflammation were associated with response to intravesical Bacillus Calmette-Guerin immunotherapy in patients with non-muscle invasive bladder cancer. Clin Nutr. (2021) 40:5792–801. doi: 10.1016/j.clnu.2021.10.019
47. Taniguchi Y, Kurokawa Y, Takahashi T, Saito T, Yamashita K, Tanaka K, et al. Impacts of preoperative psoas muscle mass and visceral fat area on postoperative short- and long-term outcomes in patients with gastric cancer. World J Surg. (2021) 45:815–21. doi: 10.1007/s00268-020-05857-9
48. Yang SJ, Li HR, Zhang WH, Liu K, Zhang DY, Sun LF, et al. Visceral fat area (VFA) superior to BMI for predicting postoperative complications after radical gastrectomy: a prospective cohort study. J Gastrointest Surg. (2020) 24:1298–306. doi: 10.1007/s11605-019-04259-0
49. Matsui R, Inaki N, Tsuji T. Impact of visceral adipose tissue on compliance of adjuvant chemotherapy and relapse-free survival after gastrectomy for gastric cancer: A propensity score matching analysis. Clin Nutr. (2021) 40:2745–53. doi: 10.1016/j.clnu.2021.04.019
Keywords: creatinine-to-cystatin C ratio, body composition, subcutaneous adipose tissue index, sarcopenia, programmed cell death 1, gastric cancer
Citation: Ji H, Liu B, Jin P, Li Y, Cui L, Jin S, Wu J, Shan Y, Zhang Z, Ming J, Zhang L and Du C (2024) Creatinine-to-cystatin C ratio and body composition predict response to PD-1 inhibitors-based combination treatment in metastatic gastric cancer. Front. Immunol. 15:1364728. doi: 10.3389/fimmu.2024.1364728
Received: 02 January 2024; Accepted: 01 April 2024;
Published: 11 April 2024.
Edited by:
Paulo Rodrigues-Santos, University of Coimbra, PortugalReviewed by:
Dongdong Huang, The First Affiliated Hospital of Wenzhou Medical University, ChinaCopyright © 2024 Ji, Liu, Jin, Li, Cui, Jin, Wu, Shan, Zhang, Ming, Zhang and Du. This is an open-access article distributed under the terms of the Creative Commons Attribution License (CC BY). The use, distribution or reproduction in other forums is permitted, provided the original author(s) and the copyright owner(s) are credited and that the original publication in this journal is cited, in accordance with accepted academic practice. No use, distribution or reproduction is permitted which does not comply with these terms.
*Correspondence: Cheng Du, ZGMxMTE1MDEwQHNpbmEuY29t; Liang Zhang, anV3aW1pbmd6QDEyNi5jb20=; Jian Ming, bWpqZ2M3ODc4QDE2My5jb20=
†These authors have contributed equally to this work
Disclaimer: All claims expressed in this article are solely those of the authors and do not necessarily represent those of their affiliated organizations, or those of the publisher, the editors and the reviewers. Any product that may be evaluated in this article or claim that may be made by its manufacturer is not guaranteed or endorsed by the publisher.
Research integrity at Frontiers
Learn more about the work of our research integrity team to safeguard the quality of each article we publish.