 Yue Su
 Youqian Zhang
 Yanhua Chai
 Jinfu Xu
- 1Department of Respiratory and Critical Care Medicine, Shanghai Pulmonary Hospital, School of Medicine, Tongji University, Shanghai, China
- 2Health Science Center, Yangtze University, Jingzhou, Hubei, China
Background: Previous studies have demonstrated that autoimmune diseases are closely associated with bronchiectasis (BE). However, the causal effects between autoimmune diseases and BE remain elusive.
Methods: All summary-level data were obtained from large-scale Genome-Wide Association Studies (GWAS). The univariate Mendelian randomization (UVMR) was utilized to investigate the genetic causal correlation (rg) of 12 autoimmune diseases and bronchiectasis, The Multivariable Mendelian Randomization (MVMR) method was used to explore the effects of the confounding factors. Further investigation was conducted to identify potential intermediate factors using mediation analysis. Finally, the linkage disequilibrium score regression (LDSC) method was used to identify genetic correlations among complex traits. A series of sensitivity analyses was performed to validate the robustness of the results.
Results: The LDSC analysis revealed significant genetic correlations between BE and Crohn’s disease (CD) (rg = 0.220, P = 0.037), rheumatoid arthritis (RA) (rg = 0.210, P = 0.021), and ulcerative colitis (UC) (rg = 0.247, P = 0.023). However, no genetic correlation was found with other autoimmune diseases (P > 0.05). The results of the primary IVW analysis suggested that for every SD increase in RA, there was a 10.3% increase in the incidence of BE (odds ratio [OR] = 1.103, 95% confidence interval [CI] 1.055-1.154, P = 1.75×10⁻⁵, FDR = 5.25×10⁻⁵). Furthermore, for every standard deviation (SD) increase in celiac disease (CeD), the incidence of BE reduced by 5.1% (OR = 0.949, 95% CI 0.902-0.999, P = 0.044, FDR = 0.044). We also observed suggestive evidence corresponding to a 3% increase in BE incidence with T1DM (OR = 1.033, 95% CI 1.001-1.066, P = 0.042, FDR = 0.063). Furthermore, MVMR analysis showed that RA was an independent risk factor for BE, whereas mediator MR analysis did not identify any mediating factors. The sensitivity analyses corroborated the robustness of these findings.
Conclusion: LDSC analysis revealed significant genetic correlations between several autoimmune diseases and BE, and further MVMR analysis showed that RA is an independent risk factor for BE.
Introduction
Bronchiectasis (BE) is a chronic respiratory disease characterized by the clinical symptoms of cough, sputum production, and hemoptysis in the presence of abnormal, irreversible dilatation of the bronchi that can be diagnosed using high-resolution chest computed tomography (CT) (1, 2). There has been a marked increase in the overall prevalence of bronchiectasis worldwide. In China, the prevalence of bronchiectasis increased 2.31-fold between 2013 and 2017, from 75.48 to 174.45 per 100,000 (3). Moreover, the prevalence of BE in females is higher than in males and also increases with age (4, 5). Importantly, BE is a heterogeneous syndrome caused by several underlying factors, such as pulmonary infections, cystic fibrosis (CF), primary ciliary dyskinesia (PCD), immunodeficiency disorders, allergic bronchopulmonary aspergillosis (ABPA), and autoimmune diseases. Recently, the association between BE and autoimmune diseases has been well recognized, and available studies have suggested that the oral, lung, and gut microbiota may affect the autoimmunity and structural integrity of the airways that contribute to BE (6). Neel et al. suggested that BE is highly prevalent in anti-myeloperoxidase (MPO) antineutrophil cytoplasmic autoantibody (ANCA)-associated vasculitis, and anti-MPO patients with BE have a higher risk of peripheral neuropathy (7). A systematic review and meta-analysis by Martin et al. demonstrated that BE may be a common extra-articular manifestation of rheumatoid arthritis (RA) (8), and anti-cyclic citrullinated peptide (CCP) antibodies (ACPAs) are associated with more severe RA-BE. However, the causal effects between BE and autoimmune diseases remain unclear.
Mendelian Randomization (MR) represents a methodological approach employing genetic variants as instrumental variables (IVs) sourced from genome-wide association studies (GWAS) to evaluate the causal relationship between a risk factor (exposure) and a resultant outcome (9). Contrary to traditional observational analyses, MR offers a more accurate estimation of the causal effect by considerably reducing the impact of confounders (10). The linkage disequilibrium score (LDSC) regression serves as a tool for estimating trait heritability, reflecting the percentage of trait variance ascribed to genetic determinants. Furthermore, LDSC assesses the genetic correlation between various traits using GWAS-derived summary statistics (11, 12). The objective of this research was to explore the plausible causal linkage between BE and autoimmune disorders.
Materials and methods
Study design
The foundational data for this investigation was retrieved from publicly available summary-level datasets from GWAS. Univariate Mendelian Randomization (UVMR), Multivariable Mendelian Randomization (MVMR), genetic correlation, and colocalization analyses were used to elucidate the causal interplay between autoimmune disorders and outcome phenotypes.
The selection of Instrumental Variables (IVs) for exposure was grounded in a tripartite criterion: i) the nominated genetic determinant, earmarked as the instrumental variable, must display a robust affiliation with the exposure; ii) the genetic determinant must not be intertwined with any potential confounders; and iii) the influence of genetic determinants on the outcome is channeled exclusively through its interaction with the exposure, thus eliminating the prospect of secondary routes (13). The architectural blueprint of the MR is illustrated in Figure 1 and Table 1, along with Supplementary File 1, which provides a comprehensive exposition of the summary statistics data repositories.
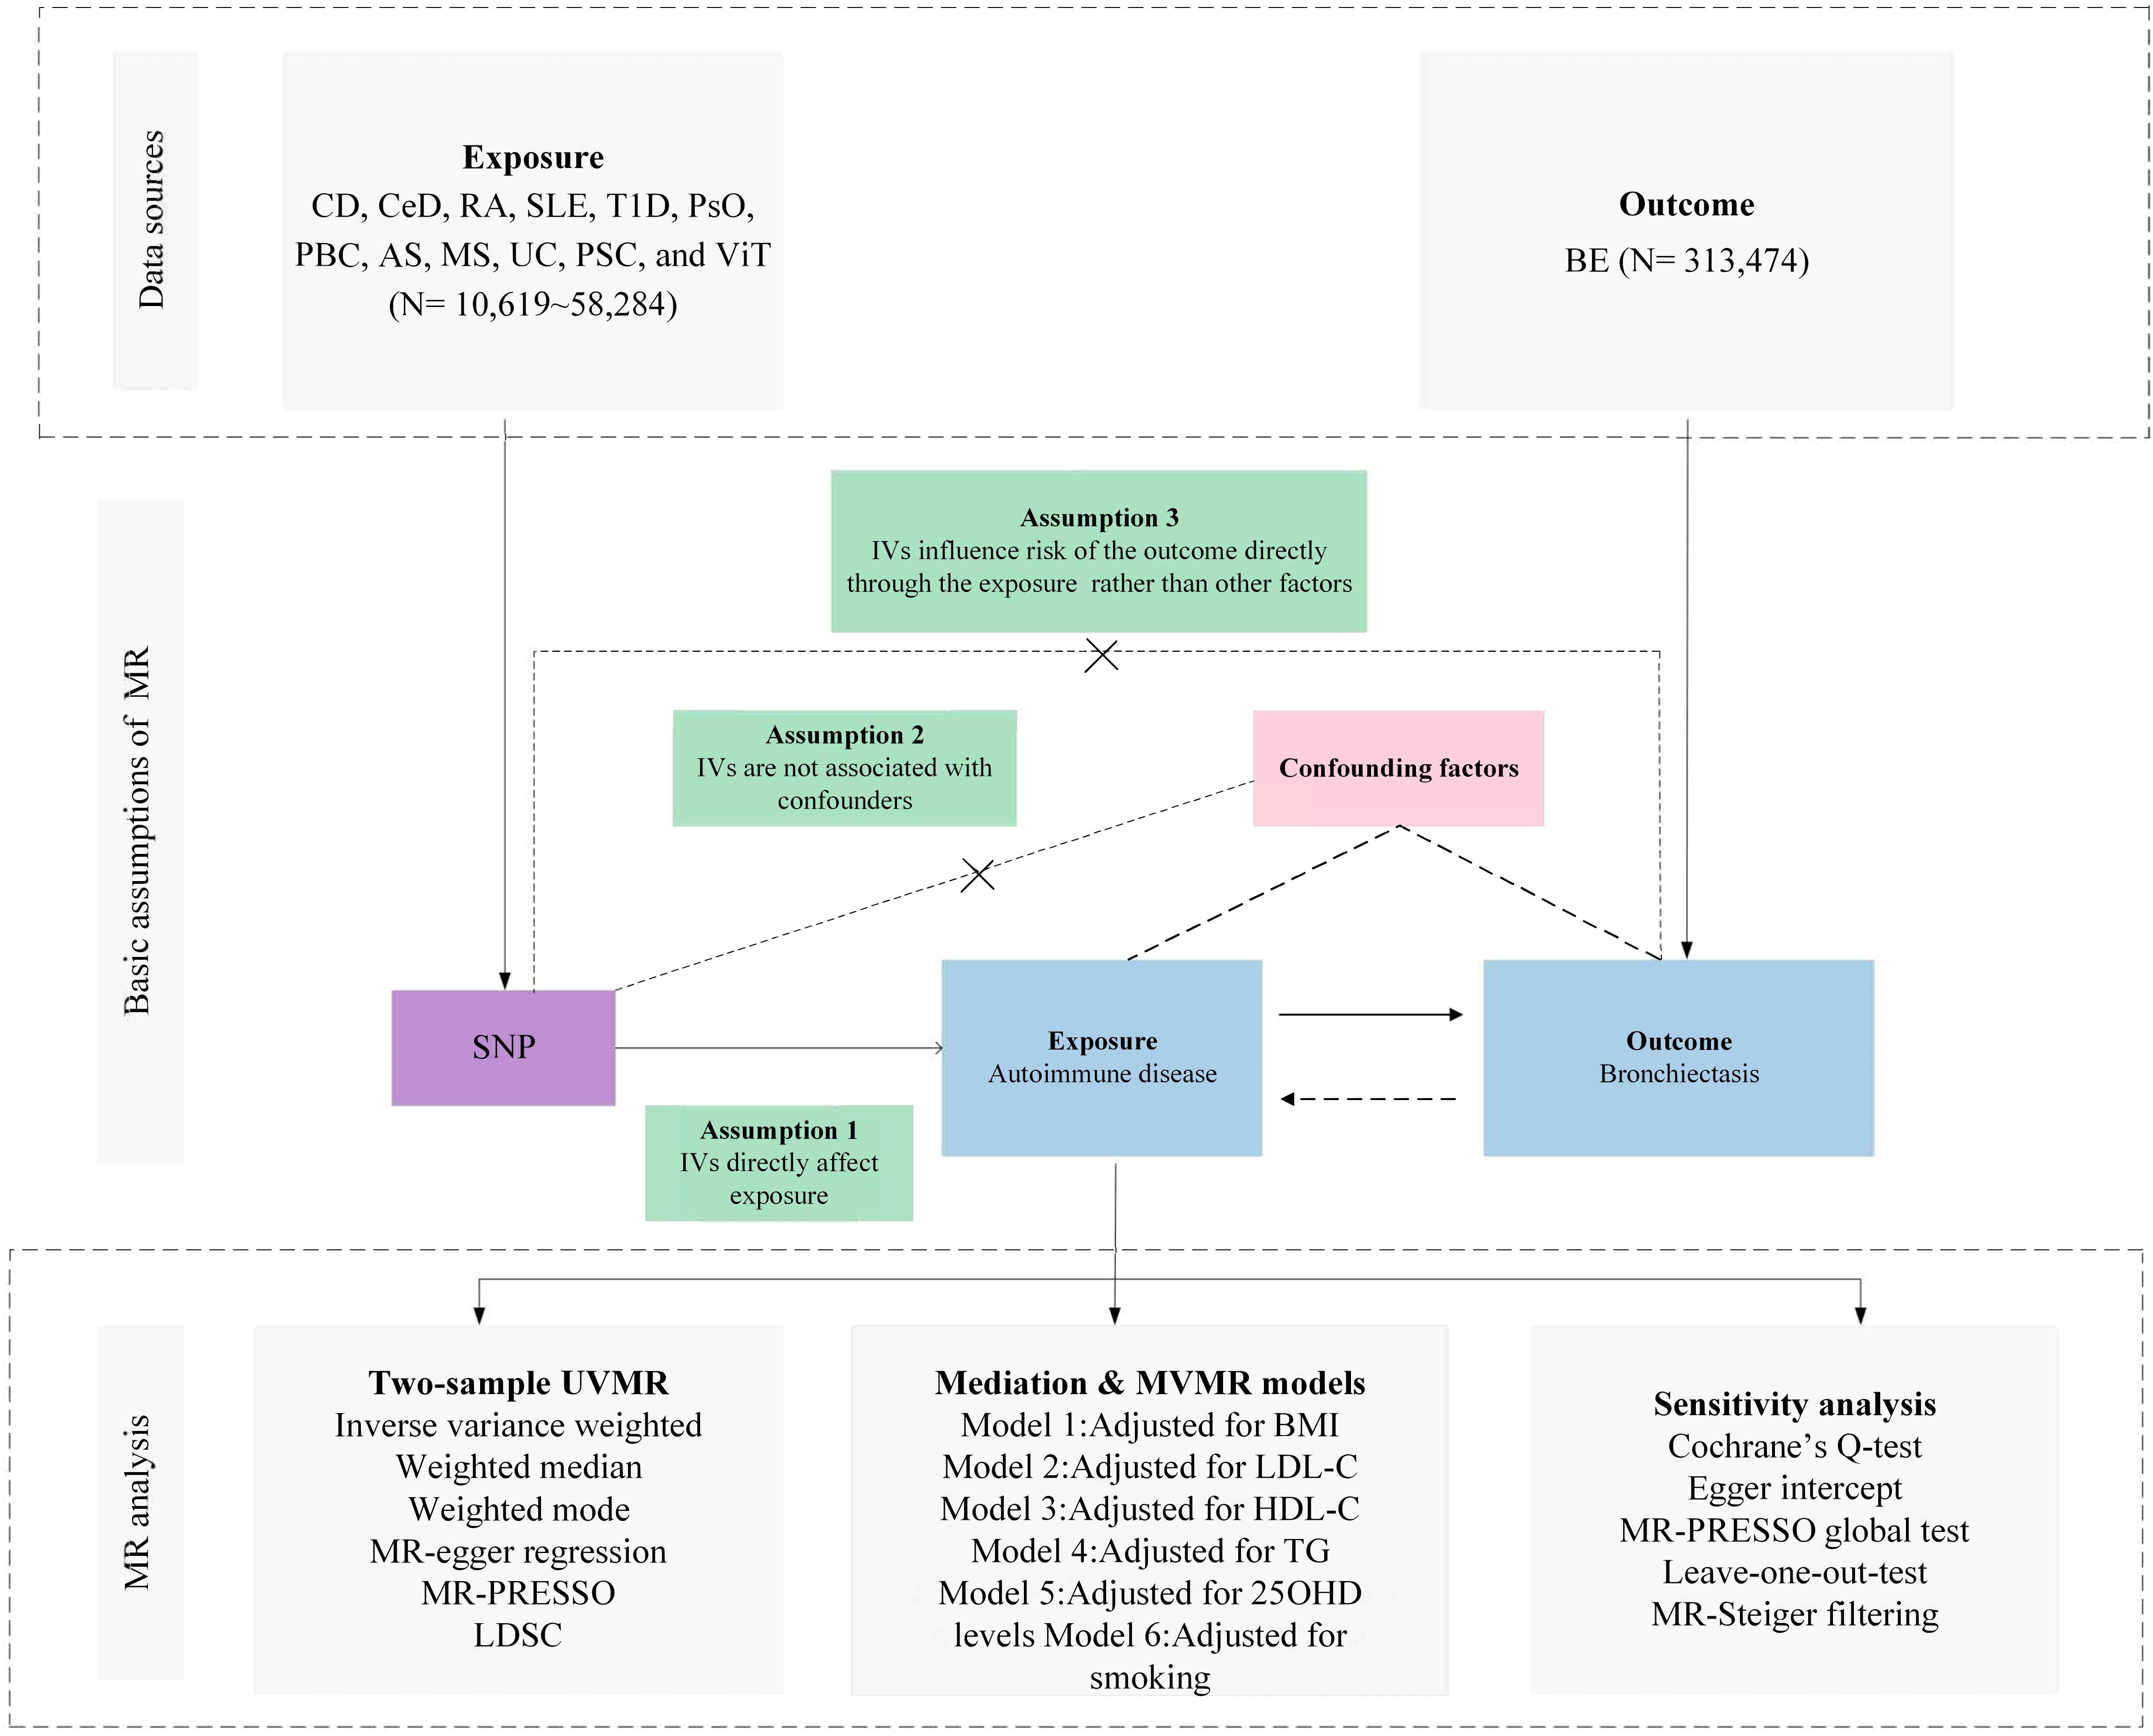
Figure 1 Overview of research design and analysis strategy. Overview of the research design. The MR framework is based on three fundamental MR assumptions, with MVMR analyses adjusting for six mediating factors for positive results. MR, Mendelian Randomization; MVMR: Multivariate Mendelian Randomization; UVMR, Univariate Mendelian Randomization; BMI, Body Mass Index; SNP, Single Nucleotide Polymorphism; MR- PRESSO, MR Pleiotropy Residual Sum and Outlier; LDL-C, Low Density Lipoprotein Cholesterol; HDL-C, High Density Lipoprotein Cholesterol; TG, Triglyceride; 25OHD, 25-hydroxyvitamin D; CD, Crohn's disease; CeD, Celiac disease; MS, Multiple sclerosis; RA, Rheumatoid arthritis; SLE, Systemic lupus erythematosus; UC, Ulcerative colitis; TID, Type 1 diabetes; PsO, Psoriasis; PSC, Primary sclerosing cholangitis; PBC, Primary biliary cirrhosis; AS, Ankylosing spondylitis; VIT, Vitiligo; BE, Bronchiectasis; LDSC, linkage disequilibrium score regression.
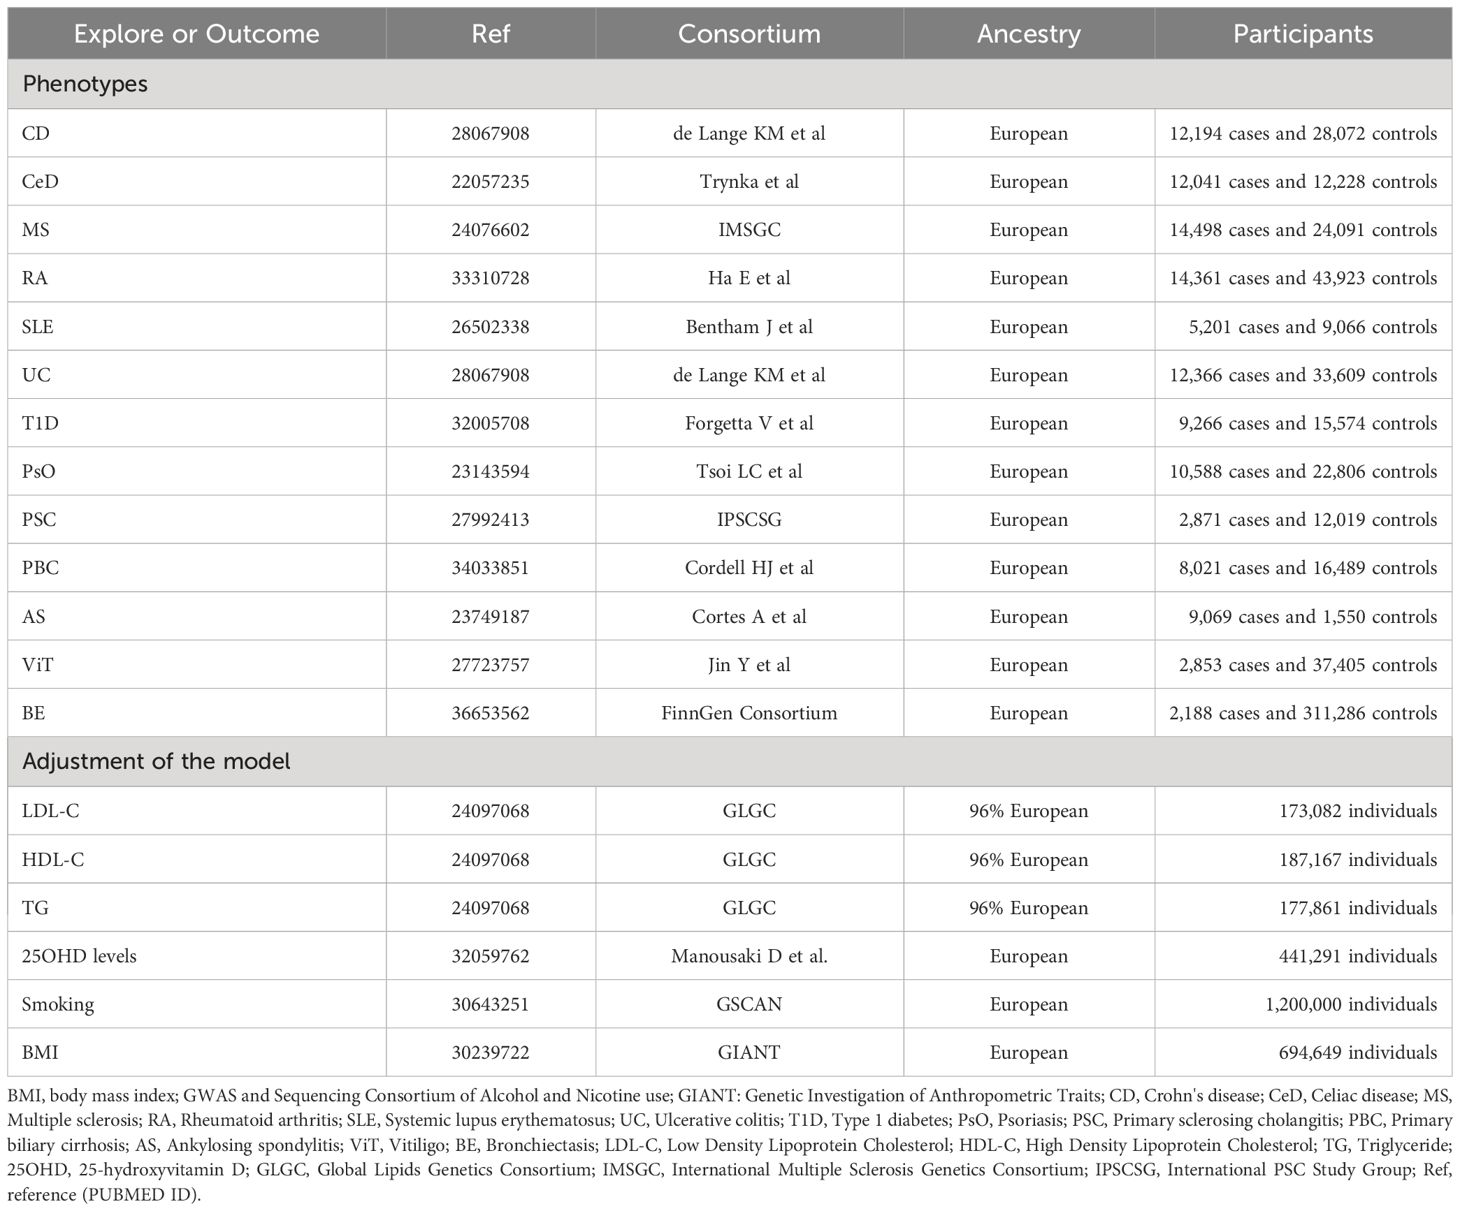
Table 1 Detailed information of data sources.
It is imperative to note that all encompassed GWAS investigation procured endorsements from the relevant academic oversight committees. Given that our study was based on a secondary analysis of publicly disclosed datasets, further ethical vetting was not required.
In order to preserve the integrity of our Mendelian Randomization approximations, the chosen Single Nucleotide Polymorphisms (SNPs) were obligated to align with the ensuing benchmarks:
Genetic instrument selection
(1) Each of the SNPs selected as IVs established a notable resonance with stipulated exposure at a genome-wide significance threshold (p< 5×10⁻⁸).
(2) Rigorous scrutiny ensured that the SNPs did not have associations with possible confounders nor shared interdependence, thereby mitigating biases originating from linkage disequilibrium (r2 < 0.001, clumping distance = 10,000 kb).
Genetic instrument validation
(3) We used F-statistics (where F = beta²/se², with beta symbolizing the SNP-exposure nexus and variance denoted by se) to assess the potency of the instrumental variables (14). An elevated F-statistic indicates pronounced instrumental vigor. Consequently, it was essential that all integrated SNPs exhibit an F-statistic transcending 10.
(4) We used the MR-Steiger filtration method to enhance the reliability of our conclusions, thereby ruling out variables that are more related to the outcomes than exposures (15).
(5) In the event of an SNP’s absence from the outcome database, we used the SNiPa digital repository (accessible at http://snipa.helmholtz-muenchen.de/snipa3/) to locate a particular SNP. This platform used genotype data from a European cohort obtained from the 1000 Genomes Project Phase 3. Therefore, a surrogate SNP, reflecting linkage disequilibrium (r2 > 0.8) with the primary SNP was identified.
(6) The SNP’s footprint on exposure juxtaposed with its impact on the outcome must mirror the identical allele. An SNP found to be discordant in this regard was invariably excised.
Source of exposure and outcome phenotypes
For autoimmune diseases, all from large abstract-level GWAS studies, ulcerative colitis (UC) and Crohn’s disease (CD) from de Lange KM et al. (16), celiac disease (CeD) from Trynka et al. (17), multiple sclerosis (MS) from International Multiple Sclerosis Genetics Consortium (IMSGC) (18), RA from Ha E et al. (19), systemic lupus erythematosus (SLE) from Bentham J et al. (20), type 1 diabetes (T1D) from Forgetta V et al. (21), psoriasis (PsO) from Tsoi LC et al. (22), primary sclerosing cholangitis (PSC) from International PSC Study Group (IPSCSG) (23), primary biliary cirrhosis (PBC) from Cordell HJ et al. (24), ankylosing spondylitis (AS) from Cortes A et al. (25), vitiligo (ViT) from Jin Y et al. (26), and for the outcome phenotype BE from FinnGen (R9) Consortium (27).
Data sources for possible mediators
We further obtained genetic associations for Body Mass Index (BMI) from the Genetic Investigation of Anthropometric Traits (GIANT) consortium (28), smoking from GWAS and Sequencing Consortium of Alcohol and Nicotine use (GSCAN) (29), triglycerides (TG), Low Density Lipoprotein Cholesterol (LDL-C) and High Density Lipoprotein Cholesterol (HDL-C) from Global Lipids Genetics Consortium (GLGC) (30), 25-hydroxyvitamin D (25OHD) levels from Manousaki D et al. (31).
Statistical analyses
Primary MR analysis
For the UVMR study, the Wald ratio test was used for exposure with only one instrument, and the multiplicative random-effects inverse-variance-weight (IVW) method was implemented for the causative assessment of multiple IVs (comprising two or more). This approach was further enhanced by incorporating both the MR-Egger and weight median techniques. The weightage in IVW is directly related to each SNP’s Wald ratio estimate and inversely correlated with the variance estimate of each SNP’s Wald ratio (32). When all genetic markers are judged valid, IVW provides estimates that are both consistent and efficient. Conversely, the weight median method stands out when over half of the genetic markers are deemed questionable, and the MR-Egger approach is adopted when all genetic markers are refutable (33). Stringent adjustment for multiple comparisons was performed using the False Discovery Rate (FDR). Following this adjustment, a P-value < 0.05 was considered indicative of a significant causal relationship. However, instances where the raw P-value was below 0.05, but the FDR-adjusted P-value exceeded this threshold were regarded as tentative.
Given the potential confounding effects of factors, such as BMI, smoking habits, lipid profiles (LDL-C, HDL-C, and TG), and 25OHD levels on the progression from exposure to outcome, subsequent MVMR analyses were performed. This study aimed to accurately quantify the direct causative effects of exposure on the results. When juxtaposed with the UVMR paradigm, the primary supposition of MVMR focus on genetic variability associated with one or more exposures, whereas the succeeding assumptions harmonize with the UVMR framework (34). A refined investigation was undertaken to ascertain the magnitude of mediation by certain factors. The initial step was to obtain the MR effect projections for exposure in relation to the outcome phenotypes using the IVW approach. Thereafter, multivariate MR analysis was performed to ascertain the impact of nine mediating factors on the outcome while concurrently considering exposure attributes. The indirect influence of the exposure was determined by multiplying the resulting estimates for each outcome. Finally, the division of the mediation effect by the overarching effect provided insight into the relative contribution of the mediators to the overall outcome.
Genetic correlation analysis
The LDSC regression, specifically tailored for GWAS summary data, serves as a robust approach for dissecting genetic correlations across complex diseases and traits. Notably, LDSC efficiently differentiates genuine polygenic signals from potential confounders such as cryptic relatedness and population stratification (35). A consequential genetic correlation, both statistically and quantitatively robust, signifies that an overarching phenotypic correlation is not merely attributable to environmental confounders (35). The LDSC tool, accessible at (https://github.com/bulik/ldsc), was used to scrutinize the genetic intersections between exposure and an array of outcome phenotypes.
Sensitivity analysis
Within the framework of UVMR analysis, several tests were conducted to validate its rigor and authenticity. The heterogeneity of the selected genetic variants was assessed using Cochran’s Q test, wherein a P-value of < 0.05 indicated pronounced discrepancies among the scrutinized SNPs (36). Employing the MR-Egger regression (37), this investigation discerned the potential for directional pleiotropy within the MR context. MR-Egger’s intercept, with a P-value < 0.05, signified the presence of consequential directional pleiotropy despite the inherent limitations of this methodology (38). The MR Pleiotropy Residual Sum and Outlier (MR-PRESSO) approach was used to identify probable outliers and delve into horizontal pleiotropy, which was inferred when the global p-value was less than 0.05 (39). By excluding such outliers, the data correction was refined. An ensuing leave-one-out analysis elucidated the impact of singular SNPs on collective outcomes (40).
R2 was calculated using the formula 2×MAF×(1-MAF) ×beta2, where MAF denotes the minor allele frequency for each designated SNP. The cumulative values provided a coefficient essential for power computation (41). The determination of statistical potency was anchored on the mRnd platform (42) and is accessible at https://shiny.cnsgenomics.com/mRnd/.
Results
Genetic instrument selection and genetic correlation between phenotypes
The SNPs of each autoimmune disease were screened according to the genetic instrument selection process described above. Power calculations for bidirectional univariable MR analyses between autoimmune diseases including CD, CeD, MS, RA, SLE, UC, T1D, PsO, PSC, PBC, AS, ViT and BE, were performed. The study reported F- statistics exceeding 60 for all instrumental variants, signifying a robust reduction in bias from weak instruments. The SNPs selected as IVs ranged from 15 to 83, accounting for an explained variance of 2.59% to 1535.64% (Supplementary Table 1).
LDSC genetic correlation analyses were conducted to estimate the genetic correlation between different autoimmune diseases and BE. LDSC analysis revealed significant genetic correlations between BE and CD (rg = 0.220, P = 0.037), RA (rg = 0.210, P = 0.021), and UC (rg = 0.247, P = 0.023) (Supplementary Table 2). However, no genetic correlation was found with other autoimmune diseases (P > 0.05). The SNP-based liability-scale heritability (h²) ranged from 0.1% to 232.99%. Additionally, the genetic correlation between each autoimmune disease and BE was analyzed (Figure 2; Supplementary Table 3).
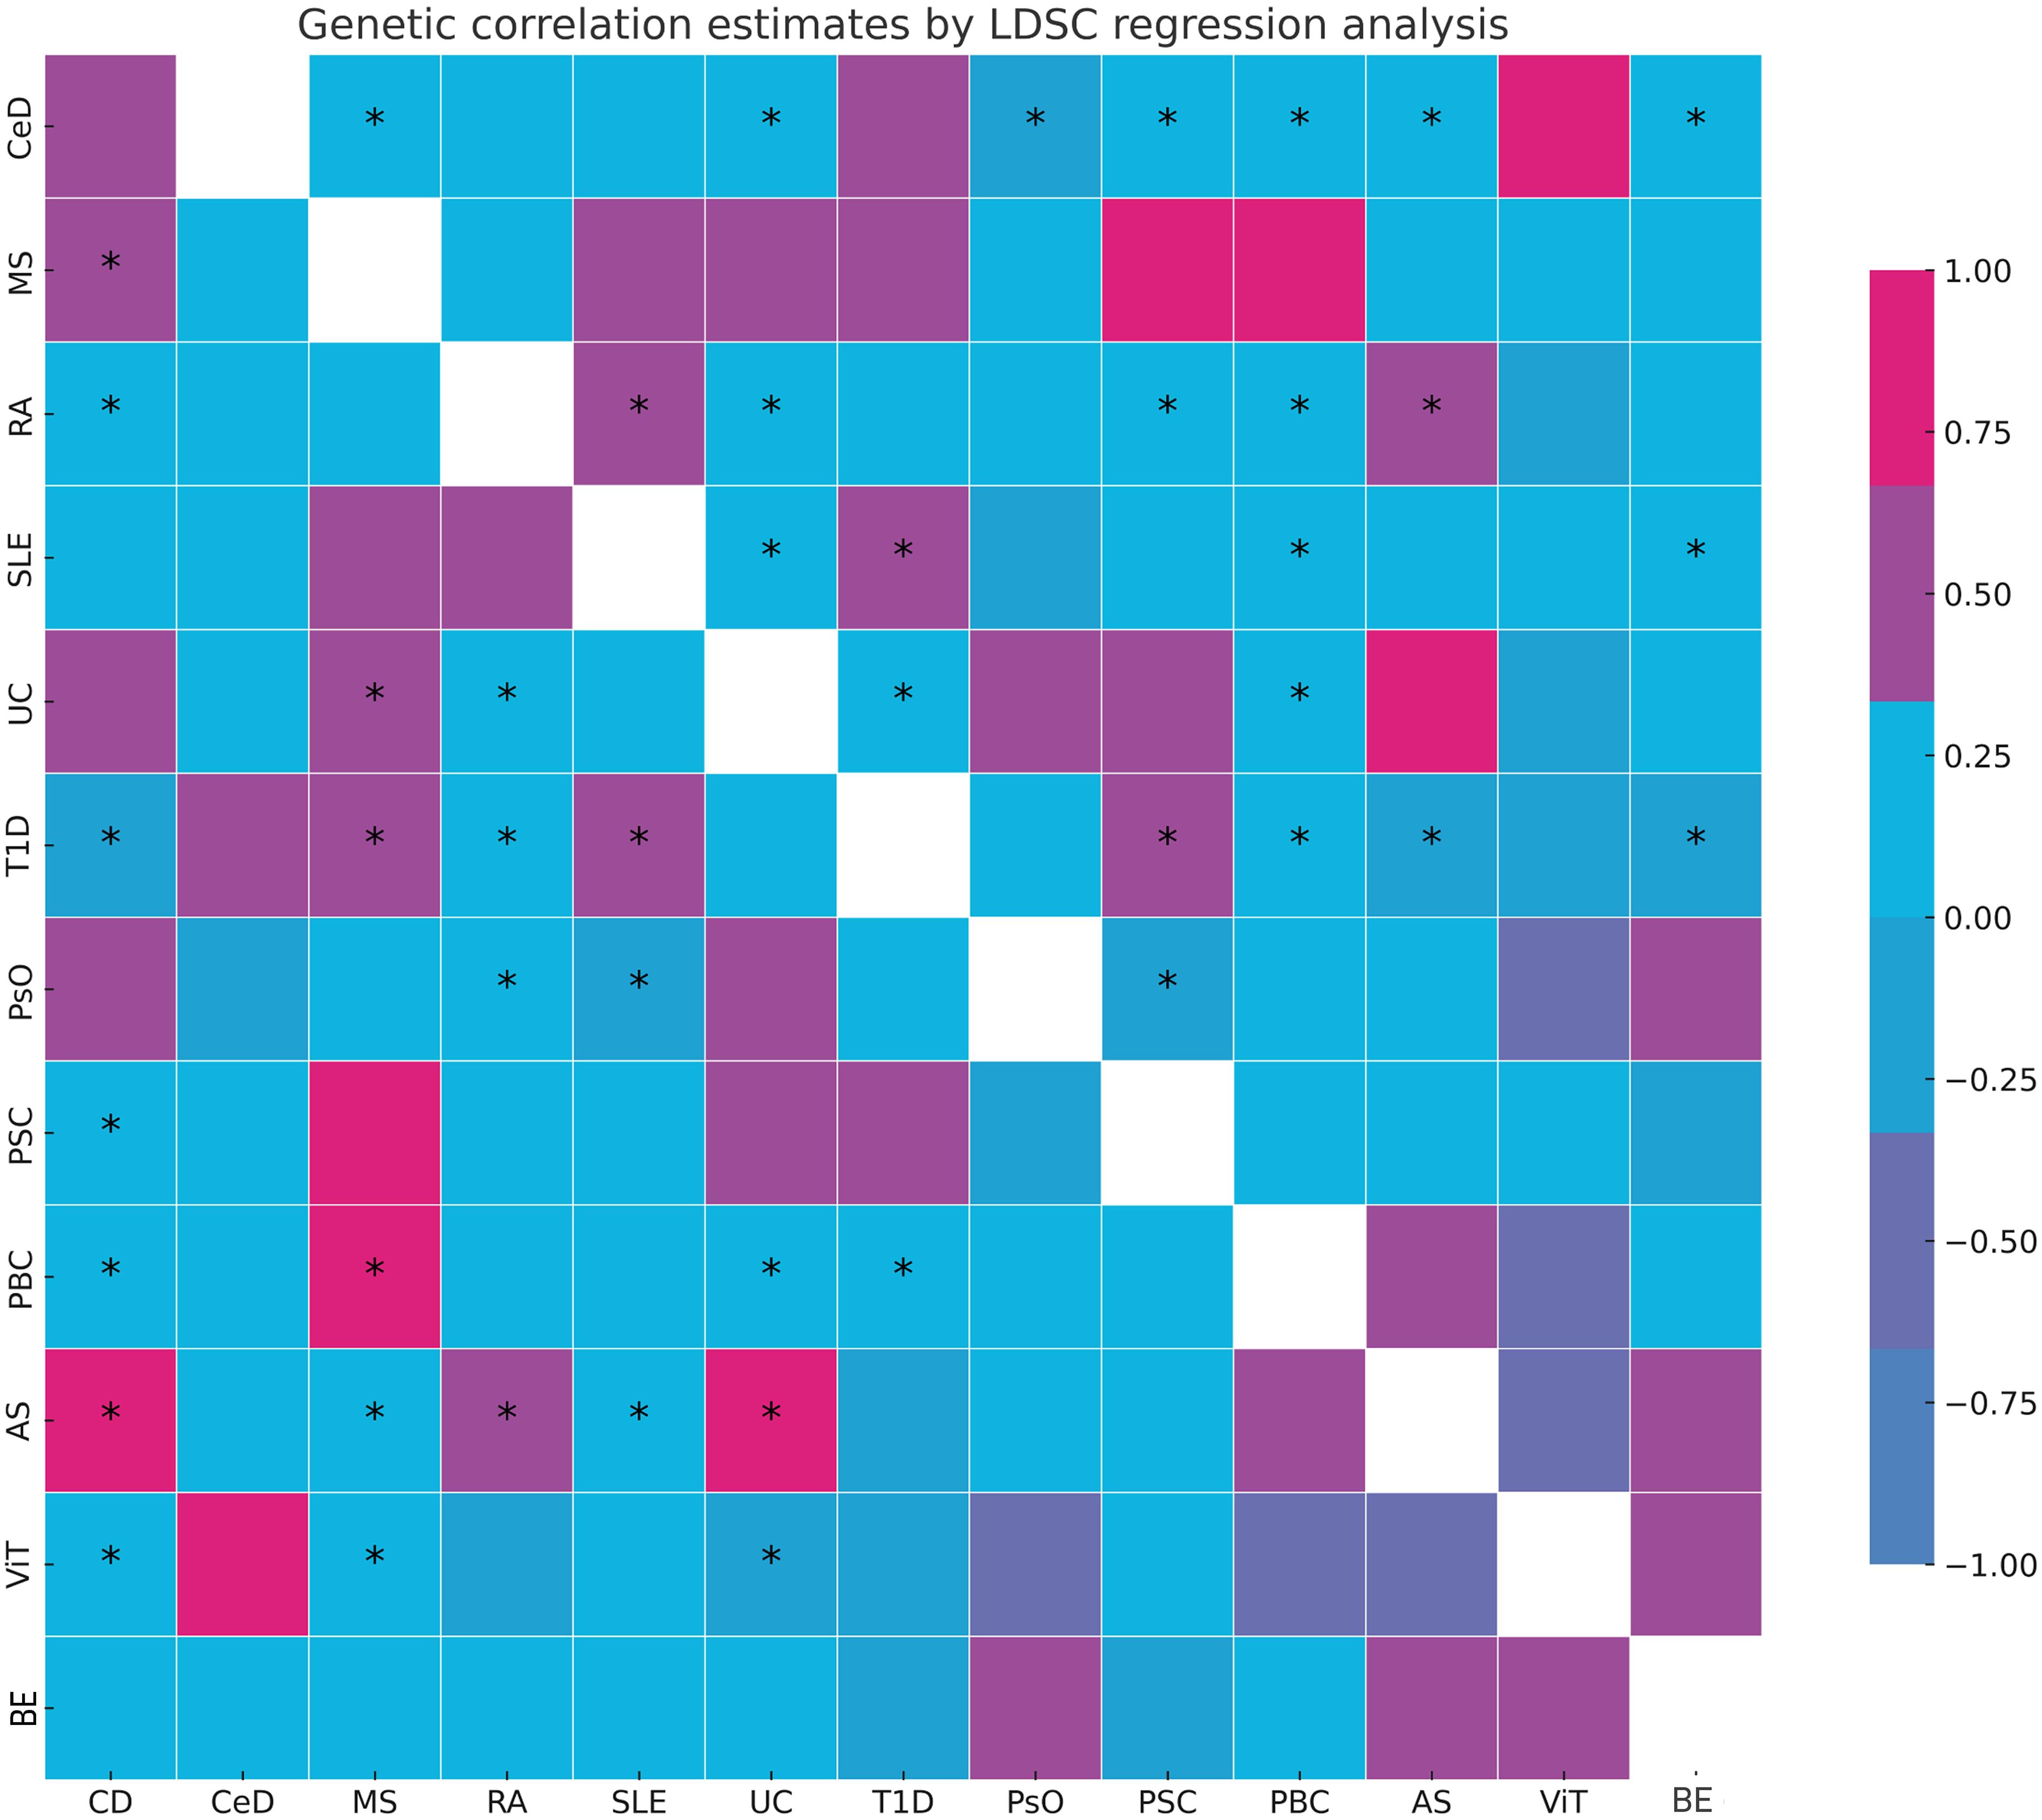
Figure 2 Summary of genetic correlation results. *: represents the presence of genetic correlation, P<0.05. LDSC, linkage disequilibrium score; CD, Crohn's disease; CeD, Celiac disease; MS, Multiple sclerosis; RA, Rheumatoid arthritis; SLE, Systemic lupus erythematosus; UC, Ulcerative colitis; TID, Type 1 diabetes; PsO, Psoriasis; PSC, Primary sclerosing cholangitis; PBC, Primary biliary cirrhosis; AS, Ankylosing spondylitis; ViT, Vitiligo; BE, Bronchiectasis.
Association of genetically predicted autoimmune diseases with BE
A scatter plot illustrates the causal relationship between each autoimmune disease and BE (Supplementary Figure 1). After adjusting for multiple comparisons, the primary IVW analysis provided strong evidence for two causal relationships (Figure 3). Specifically, for each standard deviation (SD) increase in genetically predicted RA, there was a 10.3% increase in the incidence of BE (odds ration [OR] = 1.103, 95% CI 1.055-1.154, P = 1.75×10⁻⁵, FDR = 5.25×10⁻⁵). Furthermore, for every SD increase in CeD, the incidence of BE was reduced by 5.1% (OR = 0.949, 95% CI 0.902-0.999, P = 0.044, FDR = 0.044). We also observed suggestive evidence corresponding to a 3% increase in BE incidence with T1DM (OR = 1.033, 95% CI 1.001-1.066, P = 0.042, FDR = 0.063). Additionally, we had 96%, 100%, and 92% statistical power to detect the associations of CeD, RA, and T1D with BE, with OR values of 1.103, 0.949, and 1.033, respectively (Supplementary Table 1). No other causal relationship evidence was found (P > 0.05, FDR > 0.05) (Table 2). Furthermore, MVMR analysis showed that RA was an independent risk factor for BE, whereas mediator MR analysis did not identify any mediating factors (Figure 4).
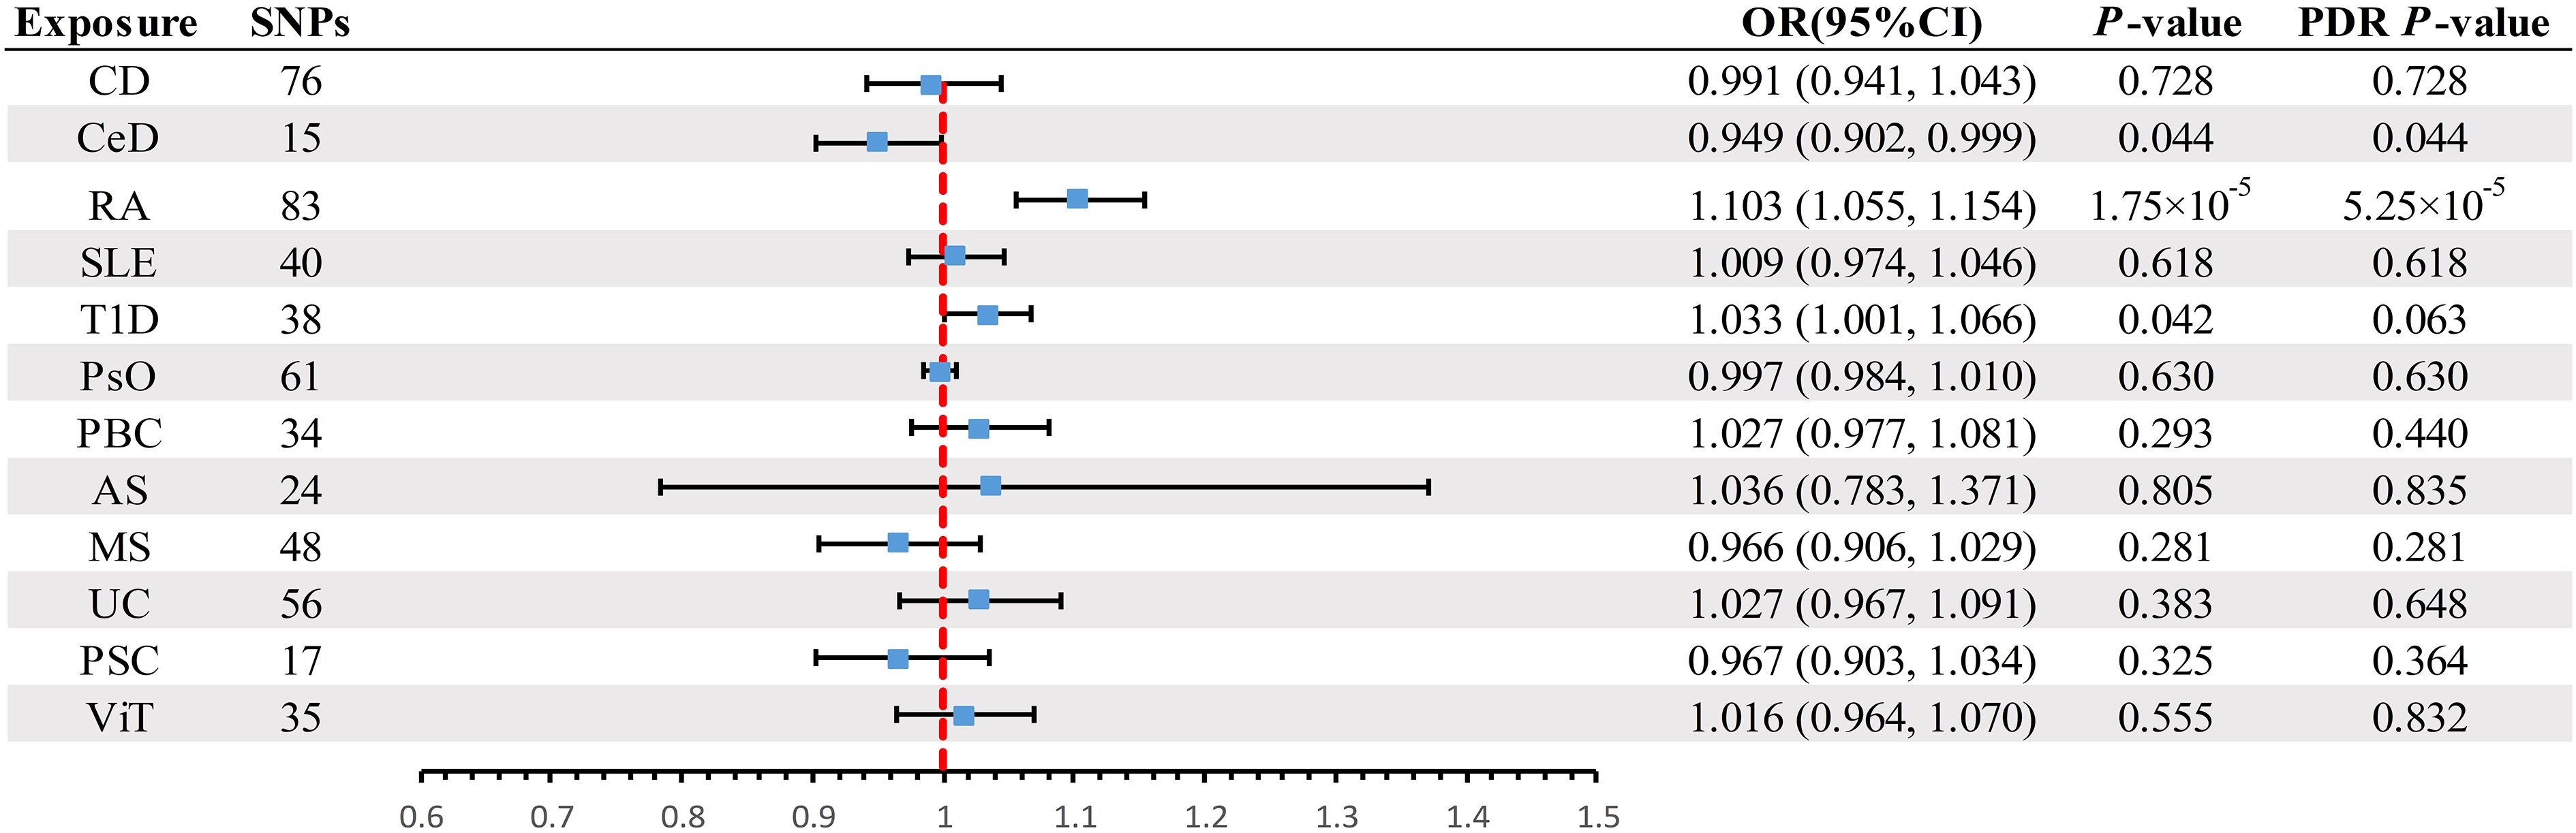
Figure 3 Summary of IVW results for the main UVMR analysis methods. IVW, Inverse variance weight; UVMR, Univariate Mendelian Randomization; SNP, Single Nucleotide Polymorphism; FDR, False Discovery Rate; OR, odds ratio; CI, confidence interval; CD, Crohn's disease; CeD, Celiac disease; MS, Multiple sclerosis; RA, Rheumatoid arthritis; SLE, Systemic lupus erythematosus; UC, Ulcerative colitis; T1D, Type 1 diabetes; PsO, Psoriasis; PSC, Primary sclerosing cholangitis; PBC, Primary biliary cirrhosis; AS, Ankylosing spondylitis; ViT, Vitiligo.
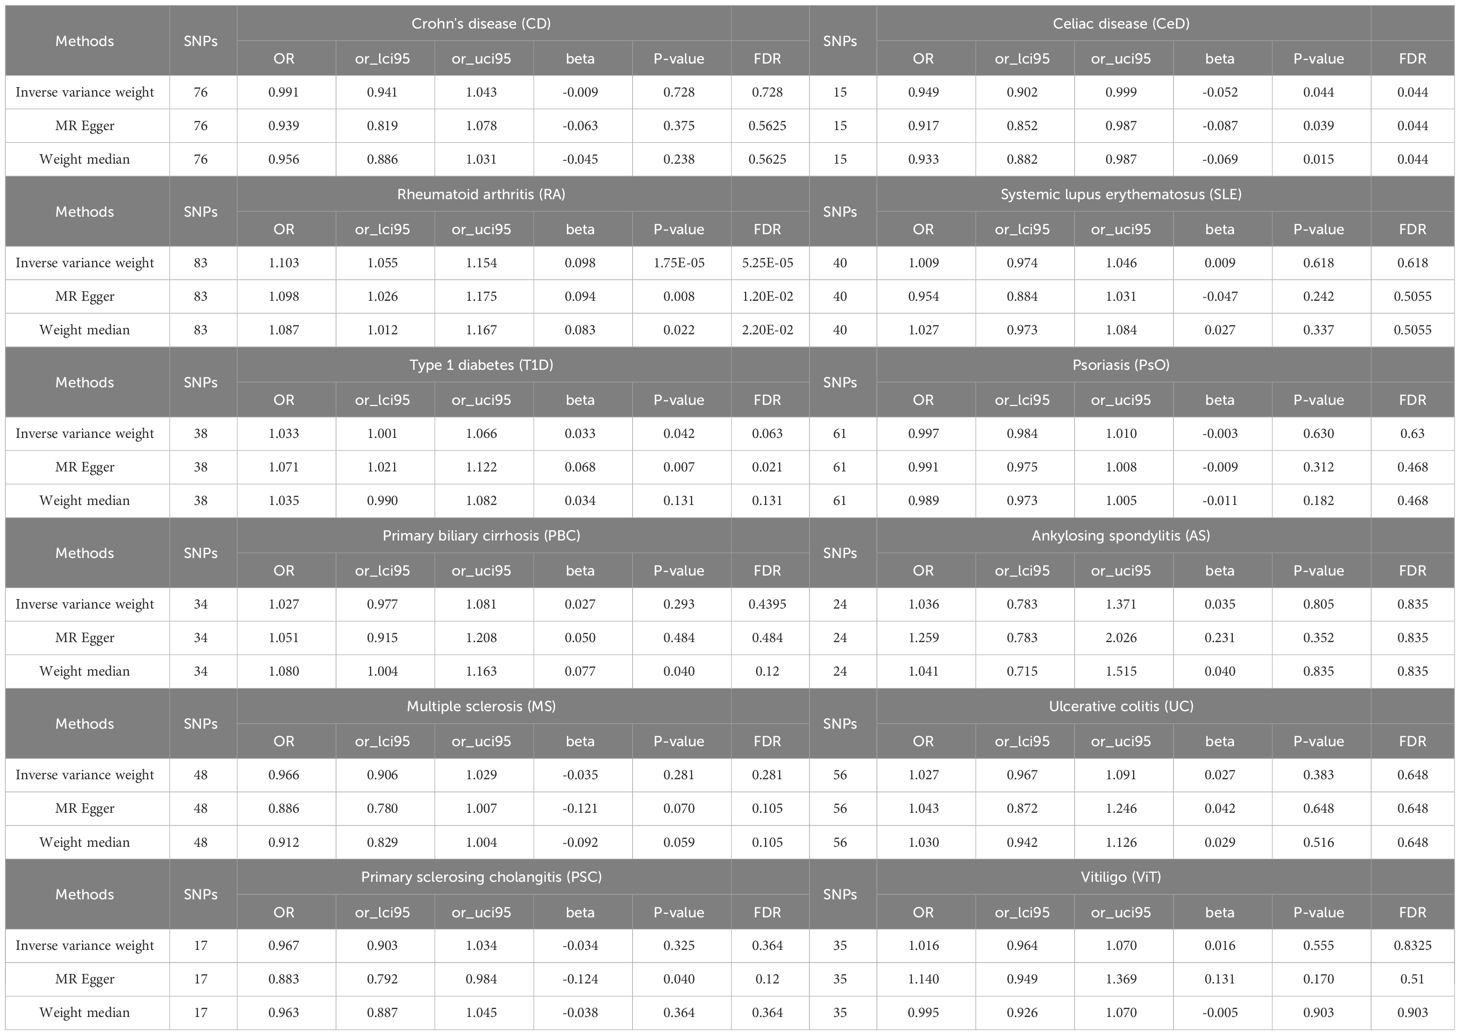
Table 2 Summary of UVMR analysis results.
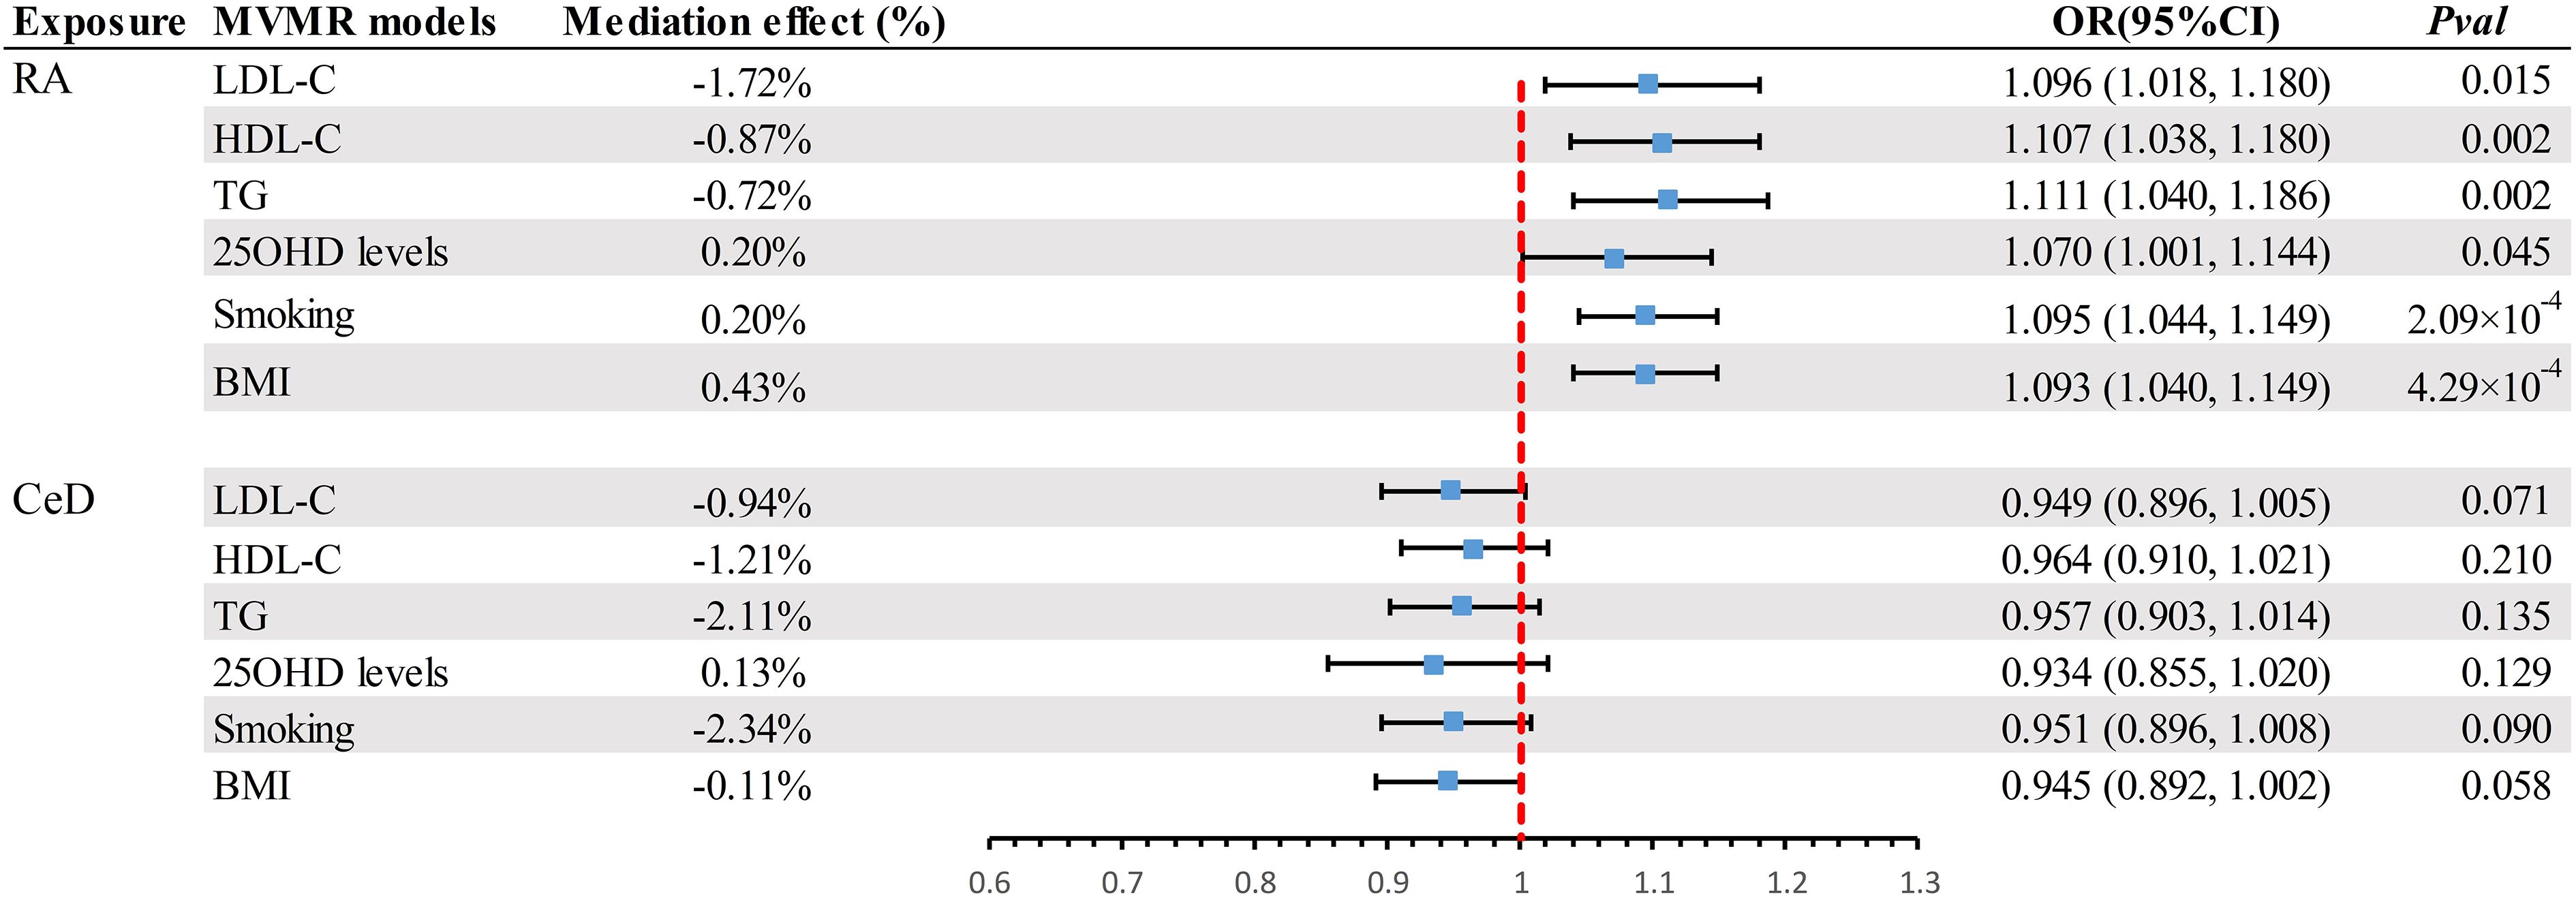
Figure 4 Summary of MVMR results. Estimating the impact of all positive exposure factors on the outcome through potential mediators. MVMR, Multivariate Mendelian Randomization; BMI, body mass index; OR, odds ratio; CI, confidence interval; LDL-C, Low Density Lipoprotein Cholesterol; HDL-C, High Density Lipoprotein Cholesterol; TG, Triglyceride; 250HD, 25-hydroxyvitamin D; CeD, Celiac disease; RA, Rheumatoid arthritis.
To avoid excessive bias effects, Cochran’s Q test was performed to analyze the sensitivity of the MR results, and no evidence of heterogeneity was observed (P>0.05). Moreover, no horizontal pleiotropy was identified using the MR-Egger intercept test (P>0.05) or the MR-PRESSO global test (P>0.05). These analyses confirmed the robustness of the findings (Table 3). Leave-one-out analysis did not reveal any horizontal pleiotropy and further confirmed that the causal relationship was not influenced by any individual SNP (Supplementary File 1).
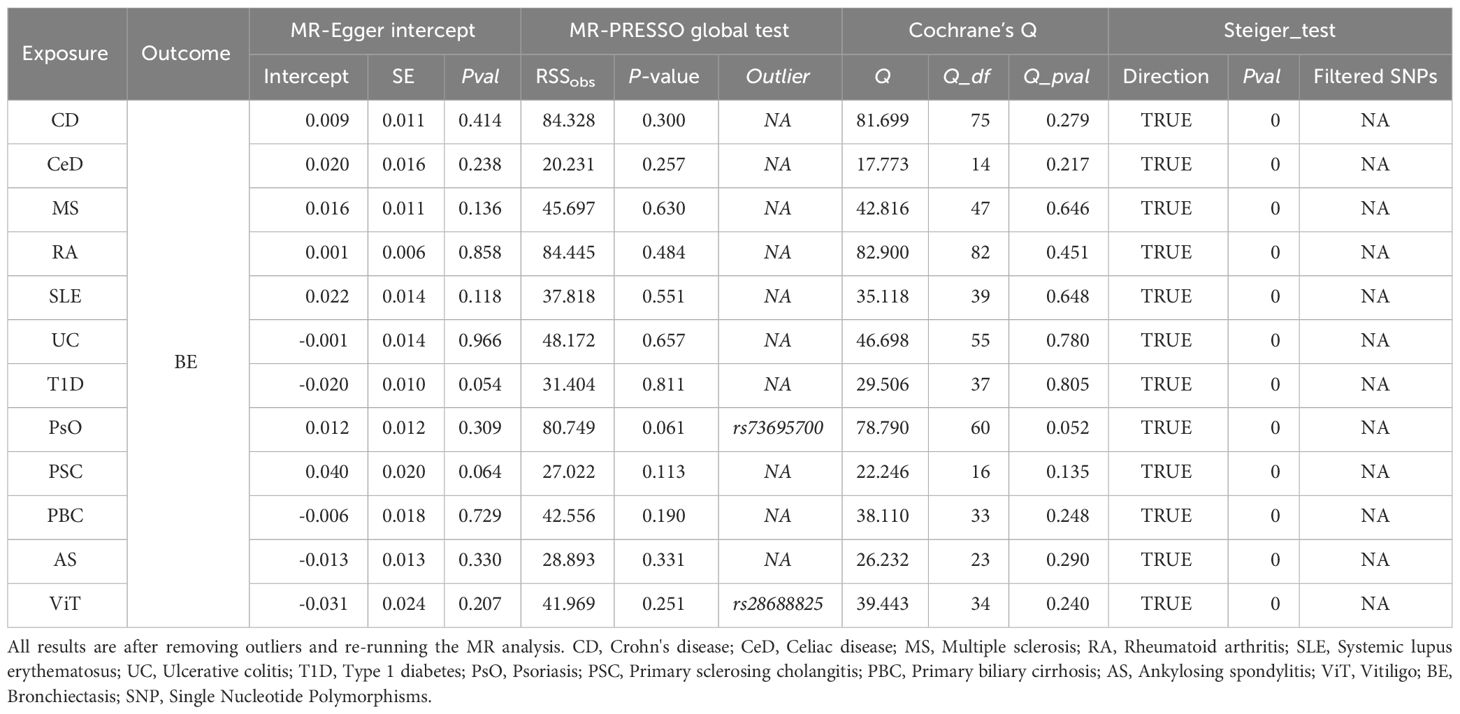
Table 3 Summary of sensitivity results.
Discussion
In this study, we performed a comprehensive MR analysis to investigate the relationship between autoimmune diseases and BE. The results of LDSC analysis revealed significant genetic correlations between BE and CD, RA, and UC. However, beyond the aforementioned genetic correlations, no other genetic correlations were observed. Moreover, our objective in utilizing the MR analysis was to mitigate bias and confounding factors and identify causal associations. Interestingly, we found suggestive evidence of an association between T1D and BE. The MVMR analysis substantiated RA as an independent risk factor for BE, whereas the mediation MR analysis did not reveal any mediating model. While observational studies have inherent limitations, such as potential confounders and ambiguous causality, our MR approach aimed to mitigate these biases, providing clarity to these associations.
BE is characterized by damaged and dilated bronchi and is one of the most common pulmonary manifestations in patients with RA (43). Persistent pulmonary inflammation can inflict irreversible damage to the bronchi, culminating in BE (44). This notion is further supported by Lake et al., who suggested that pulmonary nodules, pleurisy, and air trapping in patients with RA might elevate the risk of anomalous pulmonary dilation (45). Additionally, Jin et al. found that the systemic inflammatory milieu in patients with RA might increase their susceptibility to other inflammatory disorders (46). Such inflammation can impair the bronchial walls, leading to BE. Moreover, Quirke et al. demonstrated that BE is a potent model for the initiation of autoimmunity in RA via bacterial infection of the lungs (47). CeD pathophysiologically correlates with autoimmune damage to the small intestine (48). This autoimmune response can potentially affect the lungs, wherein damage to the intestine may precipitate the migration of inflammatory cells to the lungs, causing bronchitis. Dellaripa et al. also drew attention to dysregulated immune responses, suggesting that lungs are potential targets for autoimmune diseases (49). The primary hallmark of T1D is hyperglycemia, which stems from an immune attack on pancreatic β-cells. Barrett et al. suggested that microvascular damage correlated with T1DM might compromise the airway blood supply, contributing to BE (50). Lewis et al. have found that cystic fibrosis-associated diabetes (CFRD) often leads to poorer clinical outcomes in patients with CF including increased in pulmonary exacerbations, poorer lung function, and early mortality (51).
Emerging research has probed possible shared genetic pathways between autoimmune diseases and BE. Juge et al. have identified shared genetic susceptibilities between RA and respiratory ailments (52). Moreover, both CeD and T1D have been linked to gut microbiota dysbiosis (53, 54). An MR study by Huang et al. delineated a causal relationship between the gut microbiome and pulmonary diseases (55), hinting at the potential influence of the gut microbiota on pulmonary health and the predisposition to BE. Finally, as discussed by Litman et al., certain medications for autoimmune diseases may inadvertently exacerbate or induce pulmonary conditions (56).
The differences in the results between the MR and LDSC may be attributed to their distinct methodologies. MR relies on the use of genetic variants as instruments to infer causality, which assumes that these genetic variants affect the outcome solely through their impact on the exposure of interest and are not influenced by unmeasured confounding factors. Differently, LDSC focuses on quantifying genetic similarities between phenotypes and diseases. A significant genetic correlation detected by LDSC indicated shared genetic variations across multiple loci between the phenotypes. However, it is important to note that LDSC does not necessarily imply a causal relationship. In light of our findings, it is evident that there may be a causal relationship between BE and RA, and direct genetic correlations were detected using LDSC.
Our study has several strengths. First, our MR approach holistically analyzed the causative relationships between autoimmune diseases and BE. Second, the unique identification of SNPs as IVs in the European population minimized potential population stratification biases. Third, we employed rigorous methods with an F-statistic exceeding 10, reducing the biases from weak instruments. Fourth, we evaluated the confounding influence of the MVMR. Fifth, we relied on myriad sensitivity analyses based on statistical models and ‘leave-one-out’ techniques to enhance the reliability of the results. However, this study has several limitations. First, because of the lack of IVs achieving genome-wide significance for the outcomes, reverse causation inference was unfeasible. Second, summary-level GWAS data precluded subgroup analyses of autoimmune diseases and BE. Third, the sequencing and analysis methods for each autoimmune disease and BE may differ, contributing to the distinct results. Lastly, due to the summary-level GWAS data, the demographic data of the studies are absent, and further subgroup analysis of confounding factors, such as age and gender on autoimmune diseases and BE remains unknown.
Conclusion
LDSC analysis suggested significant genetic correlations between several autoimmune diseases and BE, and further MVMR analysis showed that RA was an independent risk factor for BE. These results provide genetic evidence for further mechanistic and clinical studies aimed at understanding the association between BE and autoimmune diseases.
Data availability statement
The original contributions presented in the study are included in the article/Supplementary Material. Further inquiries can be directed to the corresponding author.
Author contributions
YS: Conceptualization, Data curation, Formal analysis, Methodology, Writing – original draft. YZ: Conceptualization, Data curation, Formal analysis, Methodology, Software, Writing – original draft. YC: Writing – original draft. JX: Conceptualization, Resources, Supervision, Writing – review & editing.
Funding
The author(s) declare financial support was received for the research, authorship, and/or publication of this article. This work was sponsored by the National Natural Science Foundation of China (82330070, 81925001 to JX), the Innovation Program of Shanghai Municipal Education Commission (202101070007-E00097 to JX); the Program of Shanghai Municipal Science and Technology Commission (21DZ2201800 to JX). Shanghai Pujiang Program (22PJD065 to YS).
Acknowledgments
We thank all GWAS participants and investigators for making the summary statistics data publicly available.
Conflict of interest
The authors declare that the research was conducted in the absence of any commercial or financial relationships that could be construed as a potential conflict of interest.
The author(s) declared that they were an editorial board member of Frontiers, at the time of submission. This had no impact on the peer review process and the final decision.
Publisher’s note
All claims expressed in this article are solely those of the authors and do not necessarily represent those of their affiliated organizations, or those of the publisher, the editors and the reviewers. Any product that may be evaluated in this article, or claim that may be made by its manufacturer, is not guaranteed or endorsed by the publisher.
Supplementary material
The Supplementary Material for this article can be found online at: https://www.frontiersin.org/articles/10.3389/fimmu.2024.1343480/full#supplementary-material
References
1. Elborn JS, Blasi F, Haworth CS, Ballmann M, Tiddens HAWM, Murris-Espin M, et al. Bronchiectasis and inhaled tobramycin: A literature review. Respir Med. (2022) 192:106728. doi: 10.1016/j.rmed.2021.106728
2. O’Donnell AE. Bronchiectasis — A clinical review. New Engl J Med. (2022) 387:533–45. doi: 10.1056/NEJMra2202819
3. Feng J, Sun L, Sun X, Xu L, Liu L, Liu G, et al. Increasing prevalence and burden of bronchiectasis in urban Chinese adults, 2013–2017: a nationwide population-based cohort study. Respir Res. (2022) 23:111. doi: 10.1186/s12931-022-02023-8
4. Quint JK, Millett ERC, Joshi M, Navaratnam V, Thomas SL, Hurst JR, et al. Changes in the incidence, prevalence and mortality of bronchiectasis in the UK from 2004 to 2013: a population-based cohort study. Eur Respir J. (2016) 47:186–93. doi: 10.1183/13993003.01033-2015
5. Henkle E, Chan B, Curtis JR, Aksamit TR, Daley CL, Winthrop KL. Characteristics and health-care utilization history of patients with bronchiectasis in US medicare enrollees with prescription drug plans, 2006 to 2014. Chest. (2018) 154:1311–20. doi: 10.1016/j.chest.2018.07.014
6. Leung JM, Olivier KN. Bronchiectasis and connective tissue diseases. Curr Pulmonol Rep. (2016) 5:169–76. doi: 10.1007/s13665-016-0154-8
7. Néel A, Espitia-Thibault A, Arrigoni P-P, Volteau C, Rimbert M, Masseau A, et al. Bronchiectasis is highly prevalent in anti-MPO ANCA-associated vasculitis and is associated with a distinct disease presentation. Semin Arthritis Rheum. (2018) 48:70–6. doi: 10.1016/j.semarthrit.2017.12.002
8. Martin LW, Prisco LC, Huang W, McDermott G, Shadick NA, Doyle TJ, et al. Prevalence and risk factors of bronchiectasis in rheumatoid arthritis: A systematic review and meta-analysis. Semin Arthritis Rheum. (2021) 51:1067–80. doi: 10.1016/j.semarthrit.2021.08.005
9. Tin A, Kottgen A. Mendelian randomization analysis as a tool to gain insights into causes of diseases: A primer. J Am Soc Nephrol. (2021) 32:2400–7. doi: 10.1681/ASN.2020121760
10. Davies NM, Holmes MV. Reading Mendelian randomisation studies: a guide, glossary, and checklist for clinicians. BMJ. (2018) 362:k601. doi: 10.1136/bmj.k601
11. Bulik-Sullivan BK, Neale BM. LD score regression distinguishes confounding from polygenicity in GWAS. Nat Genet. (2015) 47:291–5. doi: 10.1038/ng.3211
12. Tashman KC, Cui R, O’Connor LJ, Neale BM, Finucane HK. Significance testing for small annotations in stratified LD-Score regression. medRxiv. (2021). doi: 10.1101/2021.03.13.21249938
13. Lawlor DA, Harbord RM, Sterne JAC, Timpson N, Davey Smith G. Mendelian randomization: Using genes as instruments for making causal inferences in epidemiology. Stat Med. (2008) 27:1133–63. doi: 10.1002/sim.3034
14. Bowden J, Del Greco MF, Minelli C, Davey Smith G, Sheehan NA, Thompson JR. Assessing the suitability of summary data for two-sample Mendelian randomization analyses using MR-Egger regression: the role of the I2 statistic. Int J Epidemiol. (2016) 45:1961–74. doi: 10.1093/ije/dyw220
15. Hemani G, Tilling K, Davey Smith G. Orienting the causal relationship between imprecisely measured traits using GWAS summary data. PloS Genet. (2017) 13:e1007081. doi: 10.1371/journal.pgen.1007081
16. de Lange KM, Moutsianas L, Lee JC, Lamb CA, Luo Y, Kennedy NA, et al. Genome-wide association study implicates immune activation of multiple integrin genes in inflammatory bowel disease. Nat Genet. (2017) 49:256–61. doi: 10.1038/ng.3760
17. Trynka G, Hunt KA, Bockett NA, Romanos J, Mistry V, Szperl A, et al. Dense genotyping identifies and localizes multiple common and rare variant association signals in celiac disease. Nat Genet. (2011) 43:1193–201. doi: 10.1038/ng.998
18. International Multiple Sclerosis Genetics Consortium (IMSGC), Beecham AH, Patsopoulos NA, Xifara DK, Davis MF, Kemppinen A, et al. Analysis of immune-related loci identifies 48 new susceptibility variants for multiple sclerosis. Nat Genet. (2013) 45:1353–60. doi: 10.1038/ng.2770
19. Ha E, Bae S-C, Kim K. Large-scale meta-analysis across East Asian and European populations updated genetic architecture and variant-driven biology of rheumatoid arthritis, identifying 11 novel susceptibility loci. Ann Rheum Dis. (2021) 80:558–65. doi: 10.1136/annrheumdis-2020-219065
20. Bentham J, Morris DL, Graham DSC, Pinder CL, Tombleson P, Behrens TW, et al. Genetic association analyses implicate aberrant regulation of innate and adaptive immunity genes in the pathogenesis of systemic lupus erythematosus. Nat Genet. (2015) 47:1457–64. doi: 10.1038/ng.3434
21. Forgetta V, Manousaki D, Istomine R, Ross S, Tessier MC, Marchand L, et al. Rare genetic variants of large effect influence risk of type 1 diabetes. Diabetes. (2020) 69:784–95. doi: 10.2337/db19-0831
22. Tsoi LC, Spain SL, Knight J, Ellinghaus E, Stuart PE, Capon F, et al. Identification of 15 new psoriasis susceptibility loci highlights the role of innate immunity. Nat Genet. (2012) 44:1341–8. doi: 10.1038/ng.2467
23. Ji S-G, Juran BD, Mucha S, Folseraas T, Jostins L, Melum E, et al. Genome-wide association study of primary sclerosing cholangitis identifies new risk loci and quantifies the genetic relationship with inflammatory bowel disease. Nat Genet. (2017) 49:269–73. doi: 10.1038/ng.3745
24. Cordell HJ, Fryett JJ, Ueno K, Darlay R, Aiba Y, Hitomi Y, et al. An international genome-wide meta-analysis of primary biliary cholangitis: Novel risk loci and candidate drugs. J Hepatol. (2021) 75:572–81. doi: 10.1016/j.jhep.2021.04.055
25. International Genetics of Ankylosing Spondylitis Consortium (IGAS), Cortes A, Hadler J, Pointon JP, Robinson PC, Karaderi T, et al. Identification of multiple risk variants for ankylosing spondylitis through high-density genotyping of immune-related loci. Nat Genet. (2013) 45:730–8. doi: 10.1038/ng.2667
26. Jin Y, Andersen G, Yorgov D, Ferrara TM, Ben S, Brownson KM, et al. Genome-wide association studies of autoimmune vitiligo identify 23 new risk loci and highlight key pathways and regulatory variants. Nat Genet. (2016) 48:1418–24. doi: 10.1038/ng.3680
27. Kurki MI, Karjalainen J, Palta P, Sipilä TP, Kristiansson K, Donner KM, et al. FinnGen provides genetic insights from a well-phenotyped isolated population. Nature. (2023) 613:508–18. doi: 10.1038/s41586-022-05473-8
28. Pulit SL, Stoneman C, Morris AP, Wood AR, Glastonbury CA, Tyrrell J, et al. Meta-analysis of genome-wide association studies for body fat distribution in 694 649 individuals of European ancestry. Hum Mol Genet. (2019) 28:166–74. doi: 10.1093/hmg/ddy327
29. Liu M, Jiang Y, Wedow R, Li Y, Brazel DM, Chen F, et al. Association studies of up to 1.2 million individuals yield new insights into the genetic etiology of tobacco and alcohol use. Nat Genet. (2019) 51:237–44. doi: 10.1038/s41588-018-0307-5
30. Willer CJ, Schmidt EM, Sengupta S, Peloso GM, Gustafsson S, Kanoni S, et al. Discovery and refinement of loci associated with lipid levels. Nat Genet. (2013) 45:1274–83. doi: 10.1038/ng.2797
31. Manousaki D, Mitchell R, Dudding T, Haworth S, Harroud A, Forgetta V, et al. Genome-wide association study for vitamin D levels reveals 69 independent loci. Am J Hum Genet. (2020) 106:327–37. doi: 10.1016/j.ajhg.2020.01.017
32. Hemani G, Zheng J, Elsworth B, Wade KH, Haberland V, Baird D, et al. The MR-Base platform supports systematic causal inference across the human phenome. Elife. (2018) 7:e34408. doi: 10.7554/eLife.34408
33. Bowden J, Davey Smith G, Haycock PC, Burgess S. Consistent estimation in mendelian randomization with some invalid instruments using a weighted median estimator. Genet Epidemiol. (2016) 40:304–14. doi: 10.1002/gepi.21965
34. Burgess S, Thompson SG. Multivariable Mendelian randomization: the use of pleiotropic genetic variants to estimate causal effects. Am J Epidemiol. (2015) 181:251–60. doi: 10.1093/aje/kwu283
35. Tobin MD, Minelli C, Burton PR, Thompson JR. Commentary: development of Mendelian randomization: from hypothesis test to “Mendelian deconfounding”. Int J Epidemiol. (2004) 33:26–9. doi: 10.1093/ije/dyh016
36. Kulinskaya E, Dollinger MB, Bjørkestøl K. On the moments of Cochran’s Q statistic under the null hypothesis, with application to the meta-analysis of risk difference. Res Synth Methods. (2020) 11:920. doi: 10.1002/jrsm.1446
37. Burgess S, Thompson SG. Interpreting findings from Mendelian randomization using the MR-Egger method. Eur J Epidemiol. (2017) 32:377–89. doi: 10.1007/s10654-017-0255-x
38. Wu F, Huang Y, Hu J, Shao Z. Mendelian randomization study of inflammatory bowel disease and bone mineral density. BMC Med. (2020) 18:312. doi: 10.1186/s12916-020-01778-5
39. Verbanck M, Chen C-Y, Neale B, Do R. Detection of widespread horizontal pleiotropy in causal relationships inferred from Mendelian randomization between complex traits and diseases. Nat Genet. (2018) 50:693–8. doi: 10.1038/s41588-018-0099-7
40. Cheng H, Garrick DJ, Fernando RL. Efficient strategies for leave-one-out cross validation for genomic best linear unbiased prediction. J Anim Sci Biotechnol. (2017) 8:38. doi: 10.1186/s40104-017-0164-6
41. Guan W, Steffen BT, Lemaitre RN, Wu JHY, Tanaka T, Manichaikul A, et al. Genome-wide association study of plasma N6 polyunsaturated fatty acids within the CHARGE consortium. Circ Cardiovasc Genet. (2014) 7:321–31. doi: 10.1161/CIRCGENETICS.113.000208
42. Brion M-JA, Shakhbazov K, Visscher PM. Calculating statistical power in Mendelian randomization studies. Int J Epidemiol. (2013) 42:1497–501. doi: 10.1093/ije/dyt179
43. Duarte AC, Porter J, Leandro MJ. Bronchiectasis in rheumatoid arthritis. A clinical appraisial. Joint Bone Spine. (2020) 87:419–24. doi: 10.1016/j.jbspin.2019.12.006
44. Wilczynska MM, Condliffe AM, McKeon DJ. Coexistence of bronchiectasis and rheumatoid arthritis: revisited. Respir Care. (2013) 58:694–701. doi: 10.4187/respcare.01857
45. Overview of pleuropulmonary diseases associated with rheumatoid arthritis - UpToDate. Available at: https://www.uptodate.com/contents/overview-of-pleuropulmonary-diseases-associated-with-rheumatoid-arthritis (Accessed 31 Aug 2023).
46. Jin Z, Hao D, Song Y, Zhuang L, Wang Q, Yu X. Systemic inflammatory response index as an independent risk factor for ischemic stroke in patients with rheumatoid arthritis: a retrospective study based on propensity score matching. Clin Rheumatol. (2021) 40:3919–27. doi: 10.1007/s10067-021-05762-z
47. Quirke A-M, Perry E, Cartwright A, Kelly C, De Soyza A, Eggleton P, et al. Bronchiectasis is a model for chronic bacterial infection inducing autoimmunity in rheumatoid arthritis. Arthritis Rheumatol. (2015) 67:2335–42. doi: 10.1002/art.39226
48. Catassi C, Verdu EF, Bai JC, Lionetti E. Coeliac disease. Lancet. (2022) 399:2413–26. doi: 10.1016/S0140-6736(22)00794-2
49. MD PFD. Autoimmune lung disease: Early recognition and treatment helps, in: Harvard Health. (2020). Available at: https://www.health.harvard.edu/blog/autoimmune-lung-disease-early-recognition-and-treatment-helps-2020062420339 (Accessed 31 Aug 2023).
50. Barrett EJ, Liu Z, Khamaisi M, King GL, Klein R, Klein BEK, et al. Diabetic microvascular disease: an endocrine society scientific statement. J Clin Endocrinol Metab. (2017) 102:4343–410. doi: 10.1210/jc.2017-01922
51. Lewis C, Blackman SM, Nelson A, Oberdorfer E, Wells D, Dunitz J, et al. Diabetes-related mortality in adults with cystic fibrosis. Role of genotype and sex. Am J Respir Crit Care Med. (2015) 191:194–200. doi: 10.1164/rccm.201403-0576OC
52. Juge P-A, Borie R, Kannengiesser C, Gazal S, Revy P, Wemeau-Stervinou L, et al. Shared genetic predisposition in rheumatoid arthritis-interstitial lung disease and familial pulmonary fibrosis. Eur Respir J. (2017) 49:1602314. doi: 10.1183/13993003.02314-2016
53. Thomas DA, Rosenthal GA, Gold DV, Dickey K. Growth inhibition of a rat colon tumor by L-canavanine. Cancer Res. (1986) 46:2898–903.
54. Zhou H, Sun L, Zhang S, Zhao X, Gang X, Wang G. Evaluating the causal role of gut microbiota in type 1 diabetes and its possible pathogenic mechanisms. Front Endocrinol (Lausanne). (2020) 11:125. doi: 10.3389/fendo.2020.00125
55. Huang S, Li J, Zhu Z, Liu X, Shen T, Wang Y, et al. Gut microbiota and respiratory infections: insights from Mendelian randomization. Microorganisms. (2023) 11:2108. doi: 10.3390/microorganisms11082108
Keywords: autoimmune diseases, bronchiectasis, rheumatoid arthritis, Mendelian randomization, Crohn’s disease
Citation: Su Y, Zhang Y, Chai Y and Xu J (2024) Autoimmune diseases and their genetic link to bronchiectasis: insights from a genetic correlation and Mendelian randomization study. Front. Immunol. 15:1343480. doi: 10.3389/fimmu.2024.1343480
Received: 23 November 2023; Accepted: 04 March 2024;
Published: 10 April 2024.
Edited by:
Xu-jie Zhou, Peking University, ChinaReviewed by:
Chachrit Khunsriraksakul, The Pennsylvania State University, United StatesKoshy Nithin Thomas, Christian Medical College and Hospital, India
Copyright © 2024 Su, Zhang, Chai and Xu. This is an open-access article distributed under the terms of the Creative Commons Attribution License (CC BY). The use, distribution or reproduction in other forums is permitted, provided the original author(s) and the copyright owner(s) are credited and that the original publication in this journal is cited, in accordance with accepted academic practice. No use, distribution or reproduction is permitted which does not comply with these terms.
*Correspondence: Jinfu Xu, amZ4dUB0b25namkuZWR1LmNu
†These authors have contributed equally to this work