 Fang Yang1†
 Yupeng Cun
- 1Department of the Second Medical Oncology, Third Affiliated Hospital of Kunming Medical University, Kunming, Yunnan, China
- 2Pediatric Research Institute, Ministry of Education Key Laboratory of Child Development and Disorders, Chongqing Key Laboratory of Translational Medical Research in Cognitive Development and Learning and Memory Disorders, Children’s Hospital of Chongqing Medical University, Chongqing, China
- 3National Clinical Research Center for Child Health and Disorders, China International Science and Technology Cooperation Base of Child Development and Critical Disorders, Children’s Hospital of Chongqing Medical University, Chongqing, China
Introduction: Chemoresistance constitutes a prevalent factor that significantly impacts thesurvival of patients undergoing treatment for smal-cell lung cancer (SCLC). Chemotherapy resistance in SCLC patients is generally classified as primary or acquired resistance, each governedby distinct mechanisms that remain inadequately researched.
Methods: In this study, we performed transcriptome screening of peripheral blood plasma obtainedfrom 17 patients before and after receiving combined etoposide and platinum treatment. We firs testimated pseudo-single-cell analysis using xCell and ESTIMATE and identified differentially expressed genes (DEGs), then performed network analysis to discover key hub genes involved in chemotherapy resistance.
Results: Our analysis showed a significant increase in class-switched memory B cell scores acrossboth chemotherapy resistance patterns, indicating their potential crucial role in mediatingresistance. Moreover, network analysis identifed PRICKLE3, TNFSFI0, ACSLl and EP300 as potential contributors to primary resistance, with SNWl, SENP2 and SMNDCl emerging assignificant factors in acquired resistance, providing valuable insights into chemotherapy resistancein SCLC.
Discussion: These findings offer valuable insights for understanding chemotherapy resistance and related gene signatures in SCLC, which could help further biological validation studies.
Introduction
Lung cancer ranks among the most prevalent malignancies worldwide, with the highest incidence and mortality rates among all tumor types. It is usually classified as non-small-cell lung cancer (NSCLC) and small-cell lung cancer (SCLC) (1). SCLC constitutes approximately 15% of lung cancer cases and is characterized by poor prognosis and high chemotherapy resistance (1). Approximately two-thirds of individuals with SCLC receive a diagnosis of extensive-stage SCLC (ES-SCLC), indicating that the disease has advanced beyond a field tolerable to radiation. As a result, treatment options for nearly 80% of patients are primarily limited to platinum-based chemotherapy (2). Based on genetic analysis, TP53 and RB1 have been identified as two frequently mutated genes in SCLC, exhibiting substantially lower subclonal diversity compared to NSCLC (3–5).
In recent decades, the combined etoposide-platinum (EP) regimen has become the standard first-line therapy for SCLC patients. Platinum-based doublet chemotherapy shows efficacy in 60% ~ 80% of ES-SCLC patients, but responses are typically short-lived (6). Many patients experience relapse within the first year of EP treatment, upon which a patient’s response to platinum-based chemotherapy is categorized. If relapse occurs during treatment, it is labeled as primary resistance (PR); within 90 days after treatment, it is referred to as acquired resistance (AR); and beyond 90 days, it is classified as platinum-sensitive (7). In SCLC, acquired resistance almost always leads to relapse, and there are no effective second-line treatments currently available. With the increase in the use of immune checkpoint inhibitors (ICIs) in cancer treatment, immune combination therapy has been approved as a first-line treatment for ES-SCLC. Nevertheless, this advancement has only resulted in a marginal extension of overall median survival time (12.3–13.0 months) (8, 9). Many studies have explored the molecular mechanisms underpinning chemotherapy resistance in SCLC, predominantly using cell lines and preclinical models. However, direct investigations of human SCLC trials remain rare, primarily due to limited datasets and insufficient patient follow-up regarding relapse time. RNA present in plasma harbors the potential to elucidate systemic responses to tumor progression and provide insights into the specific type of tissue from which tumors originate, particularly stratified by cancer type (10). This underscores the urgent need to accurately detect blood-based biomarkers of chemotherapy resistance in patients, thus providing a relatively non-invasive and real-time monitoring approach for assessing drug treatment responses. Gay et al. categorized SCLC patients into four subtypes based on expression profiles of transcriptional factors (ASCL1, NEUROD1, POU2F3, and YAP1), with each type exhibiting a distinct expression pattern and sensitivity to different therapeutic drugs (11). Based on these findings, we hypothesize that differences in transcriptome profiles between SCLC patients with primary and acquired resistance may be associated with chemotherapy resistance. Given the limited chemotherapy options available for SCLC patients, detecting chemotherapy resistance in SCLC remains an important challenge in clinical practice and management. As a result, a systematic investigation into how distinct genes and cell types contribute to chemotherapy resistance in SCLC is essential. Such research could yield valuable insights into potential targets for novel and effective treatment strategies.
In this study, we examined the potential mechanisms underlying primary and acquired resistance in SCLC patients. We collected 34 peripheral blood plasma samples from 17 SCLC patients before and after EP treatment, and performed gene expression screening and analysis to identify potential gene signatures and cell types associated with platinum-based chemotherapy resistance. Furthermore, weighted correlation network analysis (WGCNA) (12) was employed to construct a co-expression network of differentially expressed cancer-related genes, with minimum spanning tree (MST) analysis of the network then performed to identify key hub genes in chemotherapy resistance. We also performed pseudo-single-cell analysis of the samples using xCell and ESTIMATE to study the influence of immune cell composition on chemotherapy resistance.
Materials and methods
Patient sample collection
We collected 34 cryopreserved peripheral blood plasma samples from 17 SCLC patients before and after combined cisplatin and etoposide treatment at the Yunnan Cancer Hospital (China). All patient information is presented in Supplementary Tables S1 and S2. The patients were divided into four groups based on their response to EP treatment: pre-treatment primary resistance (PR_pre), post-treatment primary resistance (PR_post), pre-treatment acquired resistance (AR_pre), and post-treatment acquired resistance (AR_post). All patients provided informed consent in accordance with the Helsinki Declaration. All research protocols were approved by the Ethics Committee of the Yunnan Cancer Hospital (KYLX202123).
Gene expression screening, differential gene expression, and enrichment analysis
Total RNA from the plasma was extracted and purified using a Qiagen plasma kit (Cat. #217184, Qiagen) following the manufacturer’s standard instructions. RNA quantity and purity were then assessed using a NanoDrop ND-2000 spectrophotometer. Subsequently, the gene expression profiles of total RNA were screened using the Agilent Technologies platform. All experimental steps were conducted according to the standard instructions provided. Sequencing was conducted using the Agilent array, with samples from the same batch. The raw gene expression data were normalized using the quantile algorithm implemented in the limma package (v1.10.1) in R (4.1.3) (13).
Differentially expressed genes (DEGs) were estimated using the limma package based on a Benjamini-Hochberg-adjusted p-value ≤ 0.05 and |log2fold-change (FC)| > 0.3. Functional enrichment analysis of Kyoto Encyclopedia of Genes and Genomes (KEGG) pathways and Gene Ontology (GO) terms was conducted using KOBAS (http://kobas.cbi.pku.edu.cn/) (14). The gene interaction network associated with cancer-related KEGG pathways was visualized using Cytoscape (v3.8.0) (15).
Immune cell type deconvolution
Immune cell type deconvolution was analyzed via xCell (v1.1.0) (16) and ESTIMATE (v1.0.13) (17). The ESTIMATE dataset calculated the pseudo-immune score of each sample as a novel biomarker of immune cell infiltration in cancer. The xCell datasets provided immune cell indices derived from the gene expression profiles of the samples. Pearson correlation analysis was used to compute correlation coefficients between immune infiltration scores and expression levels of hub genes. All correlation results were visualized using ggplot2 (v3.4.4) package.
Construction of cancer-related gene co-expression network and identification of hub genes
WGCNA (v1.72.1) was used to construct a co-expression network and expression patterns of cancer pathway-related genes across the 34 samples. In the network, edge weights were filtered for edges with a threshold greater than 0.01, and only top the 30% of edges for each gene were included to generate the final network. Hub genes were identified through MST analysis of the final network, as applied in our former study (18). All networks were visualized with Cytoscape (v3.8.0).
Gene set variation analysis of chemotherapy resistance genes
GSVA (v1.42.0) (19) was used to identify signaling pathways associated with candidate genes. Specifically, samples were divided into high and low expression groups based on the median expression values of the candidate genes and analyzed accordingly. A reference gene set for GSVA was selected with “h.all.v7.4.symbols.gmt”.
Kaplan‐Meier survival analysis of candidate progression-associated genes
Samples were divided into high and low expression groups based on the median expression values of the candidate genes and analyzed. Survival curves, representing the time to tumor progression, were generated using the Kaplan-Meier method. To compare the survival curves between two groups, log-rank tests were applied in the survival package (v3.2.13) (20).
Results
Gene expression landscape and pseudo-single-cell profiles in SCLC patients before and after EP treatment
We collected 34 peripheral blood plasma samples from 17 SCLC patients before and after EP treatment for gene expression array screening (Supplementary Table S2). The SCLC patients before and after EP treatment were designated as the pre-group and post-group, respectively. All analysis workflows are depicted in Supplementary Figure S1. Paired DEG analysis of the pre- and post-treatment patients was performed using the limma package, with significance threshold set at |log2FC| > 0.3 and p ≤ 0.05. A total of 594 DEGs were identified, including 336 up-regulated genes and 258 down-regulated genes. Genes with |log2FC| ≥ 1 are annotated in Figure 1A and Supplementary Figure S2A, B. To assess tumor pseudo-single-cell changes between the pre- and post-groups, we employed xCell to compute cell scores for 64 distinct cell types (Figure 1B). The xCell results showed no significant differences in immune, stromal, and microenvironment scores between the pre- and post-groups, although there were observable declining trends in variation (Supplementary Figure S2C–E). ESTIMATE was also applied to compare changes in the blood microenvironment between the pre- and post-groups, showing results in line with the xCell findings (Supplementary Figure S2F–H). The immune cell scores estimated using xCell showed no significant differences among immune cells, including CD4+ T memory cells, natural killer (NK) T cells, and regulatory T cells, but exhibited a decreasing trend in variation (Supplementary Figure S2–I).
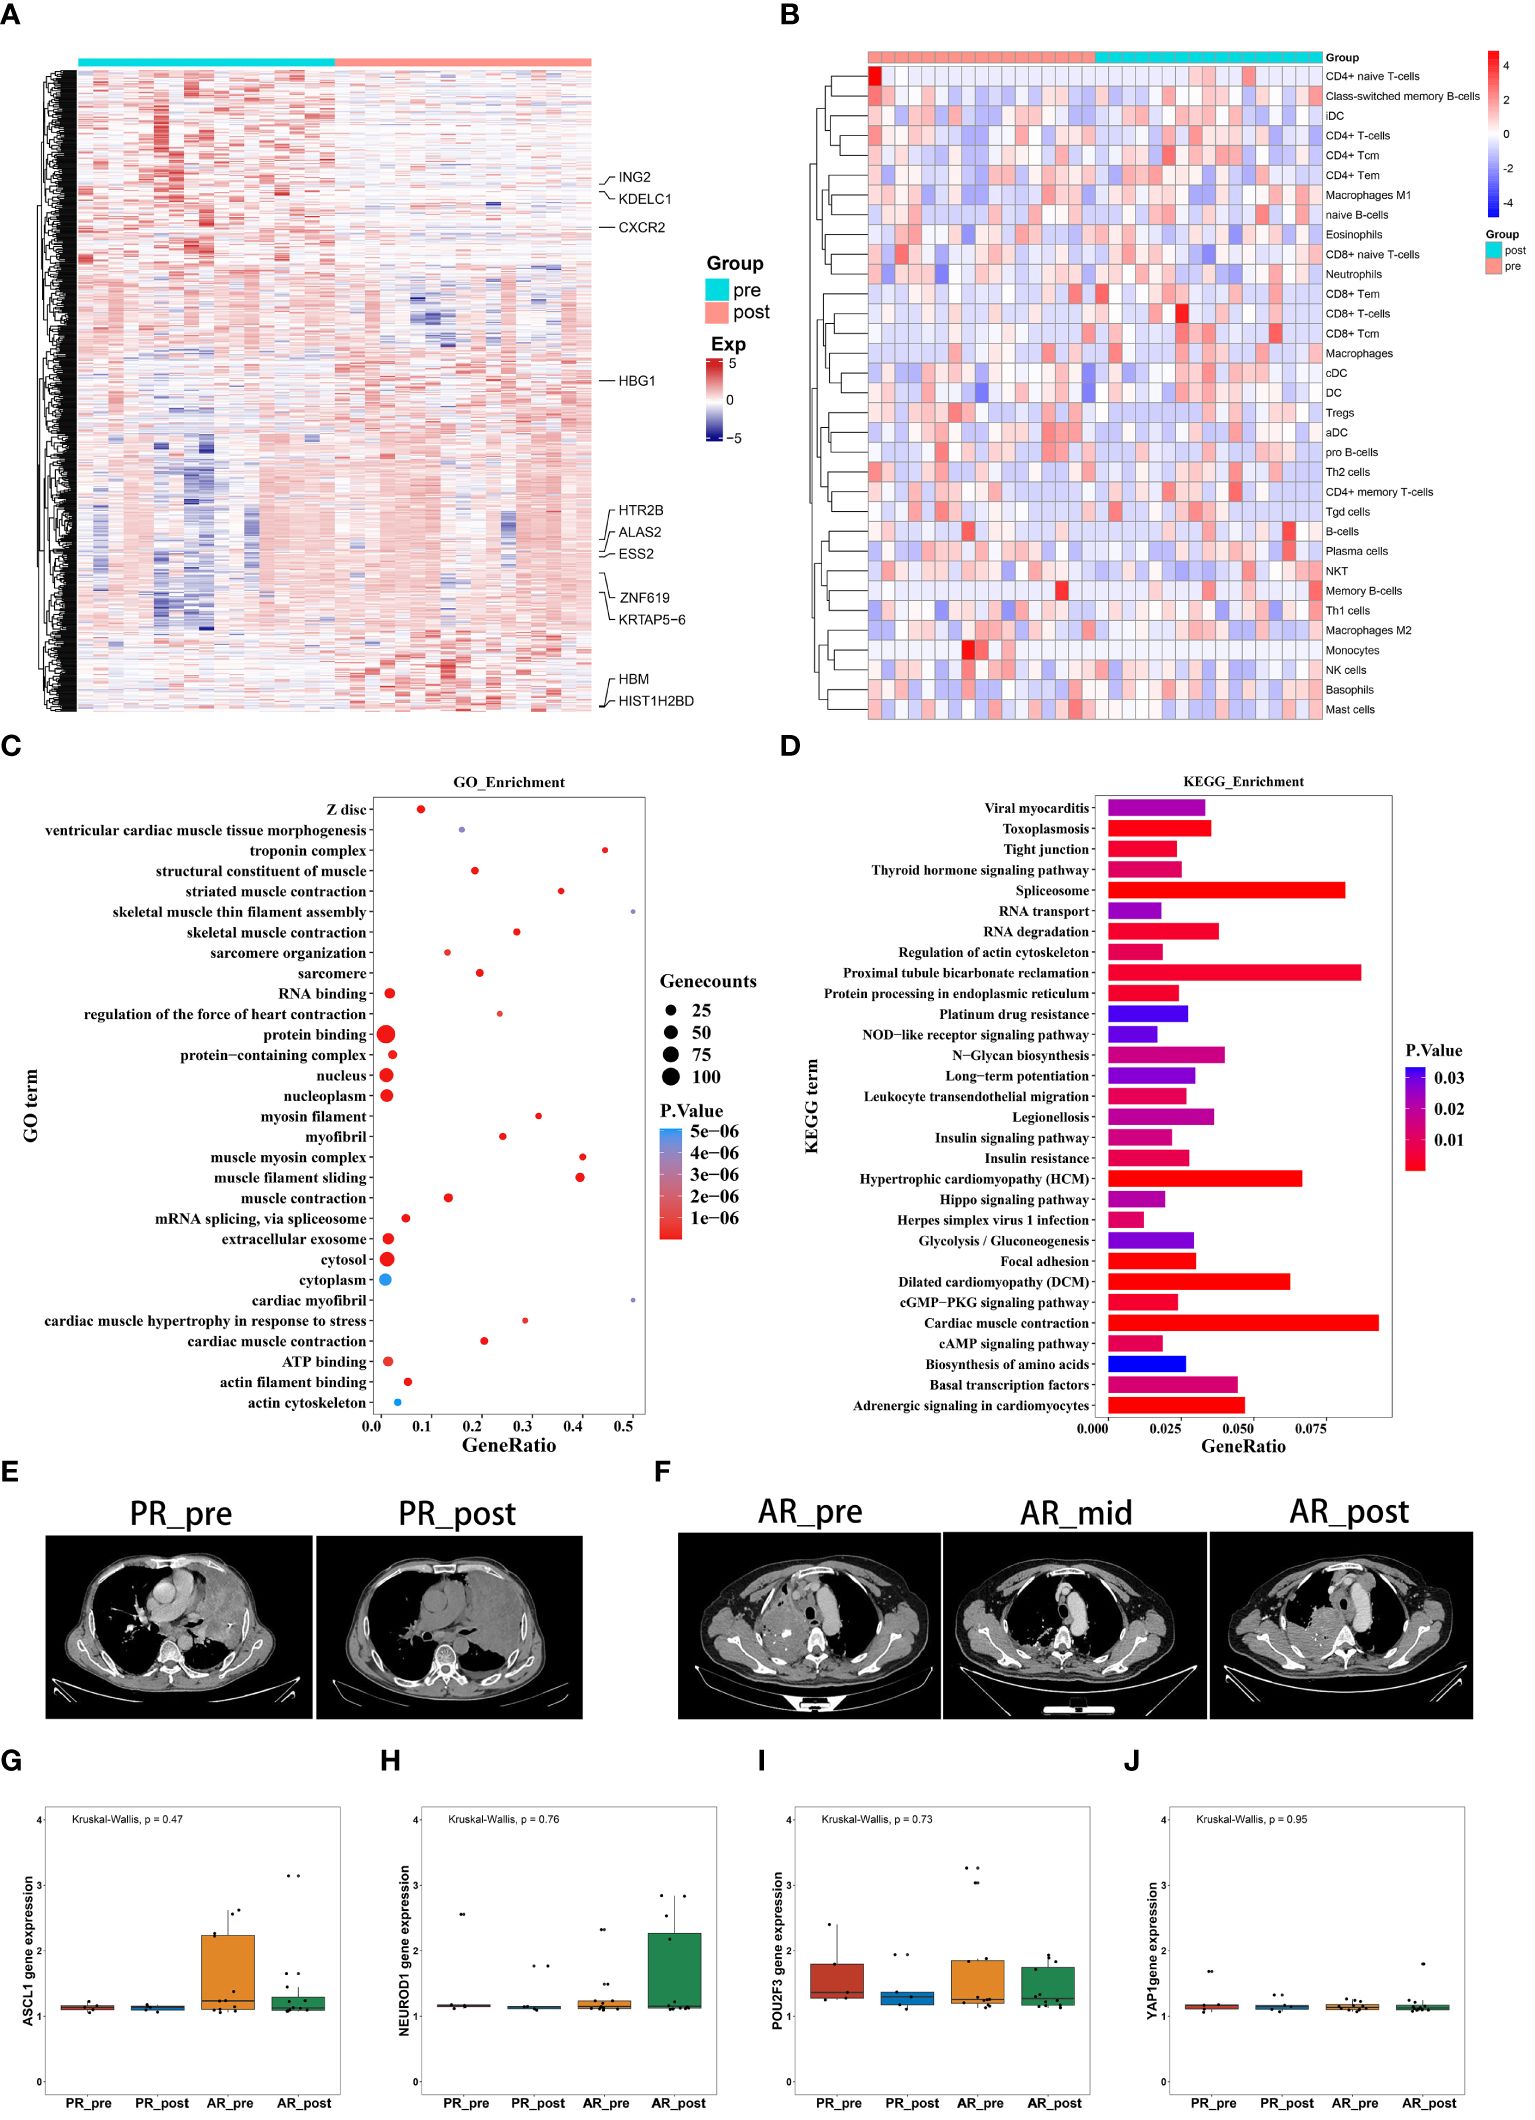
Figure 1 Gene expression profiles and pseudo-single-cell analysis of 17 patients with SCLC before and after combined cisplatin and etoposide treatment. (A) Heatmap analysis of DEGs between pre- and post-EP treatment groups. (B) Heatmap comparing expression levels of 64 cell components from xCell between pre- and post-EP treatment groups. (C) GO functional enrichment analysis, showing 30 most enriched GO terms. (D) KEGG enrichment analysis, showing 30 most enriched KEGG pathways. (E) Radiographic images of patients with acquired resistance before, during, and after EP treatment. (F) Radiographic images of patients with primary resistance before and after EP treatment. (G-J) Expression levels of ASCL1, NEUROD1, POU2F3, and YAP1 in PR_pre, PR_post, AR_pre, and AR_post groups.
GO term enrichment analysis demonstrated that genes influenced by EP treatment were predominantly associated with “protein binding”, “RNA binding”, and “nucleus” (Figure 1C). Among the genes influenced by EP treatment, EP300 is widely expressed and regulates several essential biological processes, including proliferation and differentiation, through its paralogous domains, with mutations in EP300 known to accelerate tumor development in SCLC mouse models (21). KEGG enrichment analysis revealed that genes influenced by EP treatment were highly associated with various pathways, including “RNA degradation”, “Platinum drug resistance”, and “IL-17 signaling pathway” (Figure 1D). Elevated levels of IL-17 in hepatocellular carcinoma, colorectal cancer, and NSCLC are indicative of poor prognosis (22, 23). Furthermore, IL-17 promotes angiogenesis by up-regulating various post-angiogenic factors in tumor cells and fibroblasts and contributes to tumor resistance against VEGF therapy (24, 25). Thus, the KEGG and GO enrichment analyses revealed that the DEGs were associated with drug resistance, immune response, and epigenetic regulation.
Patients underwent CT imaging assessment every two treatment cycles, strictly following RECIST1.1 criteria for efficacy evaluation. Patients who experienced partial remission followed by progression were defined as having acquired resistance, while disease progression occurring after stability or initial assessment was defined as primary resistance. Based on these criteria, we classified the 17 patients into two distinct groups. Notably, five patients exhibited minimal changes in tumor size before and after treatment, indicating primary resistance (Figure 1E), while 12 patients exhibited tumor relapse after EP treatment, with the emergence of new tumors within three months, indicating acquired resistance (Figure 1F). We compared the expression levels of transcription factors (ASCL1, NEUROD1, POU2F3, and YAP1) in the four pre-defined subtypes of SCLC among these patient groups (Figures 1G–J). Although group differences in the expression levels of transcription factors did not reach statistical significance, possibly due to the small sample size, the primary resistance patients exhibited low NEUROD1 and ASCL1 expression before treatment, while the acquired resistance patients exhibited low NEUROD1 expression and high ASCL1 expression before treatment, with contrasting expression patterns after treatment.
Overall, these findings highlight the distinct expression patterns of NEUROD1 and ASCL1 in primary and acquired resistance patients before and after EP treatment, suggesting a potential association with primary and acquired resistance.
Gene signature variation between primary and acquired resistance in pre-patients
To identify possible genes involved in primary resistance, we compared the transcriptome profiles of the pre-treatment primary resistance group (PR_pre, five cases) with the pre-treatment acquired resistance group (AR_pre, 12 cases). Genes with | log2FC | > 0.3 and p ≤ 0.05 were identified as DEGs. Volcano plots and heatmaps were generated to visualize the DEGs in the PR_pre group versus the AR_pre group. In total, 664 DEGs were identified, including 130 up-regulated genes and 534 down-regulated genes (Figure 2A, Supplementary Figure S3A). Among the down-regulated genes, ACSL1 encodes the long-chain fatty acid CoA synthetase and is associated with an increased risk of hepatocellular carcinoma (26). The DEGs displayed varying expression patterns between primary and acquired resistance (Supplementary Figure S3B). For instance, TRPC3 showed the opposite pattern in the PR_pre and AR_post groups but demonstrated a similar expression pattern in the AP_pre and AR_post groups. TRPC3 is a high-calcium permeable cation channel that regulates calcium-dependent signaling pathways involved in the proliferation and metastasis of ovarian cancer (27). KEGG and GO enrichment analysis revealed that the DEGs between the PR_pre and AR_post groups were predominantly associated with “protein binding”, “integral component of membrane”, and “plasma membrane” (Figure 2C), as well as the “NF-κB signaling pathway”, “Cell cycle”, and “Th17 cell differentiation” (Figure 2D). Activation and interaction between STAT3 and the NF-κB signaling pathway play a crucial communication role between cancer cells and inflammatory cells. This interaction regulates various aspects of tumor biology, including tumor initiation, resistance of malignant cells to apoptosis-based tumor surveillance, tumor angiogenesis, and invasive capabilities (28).
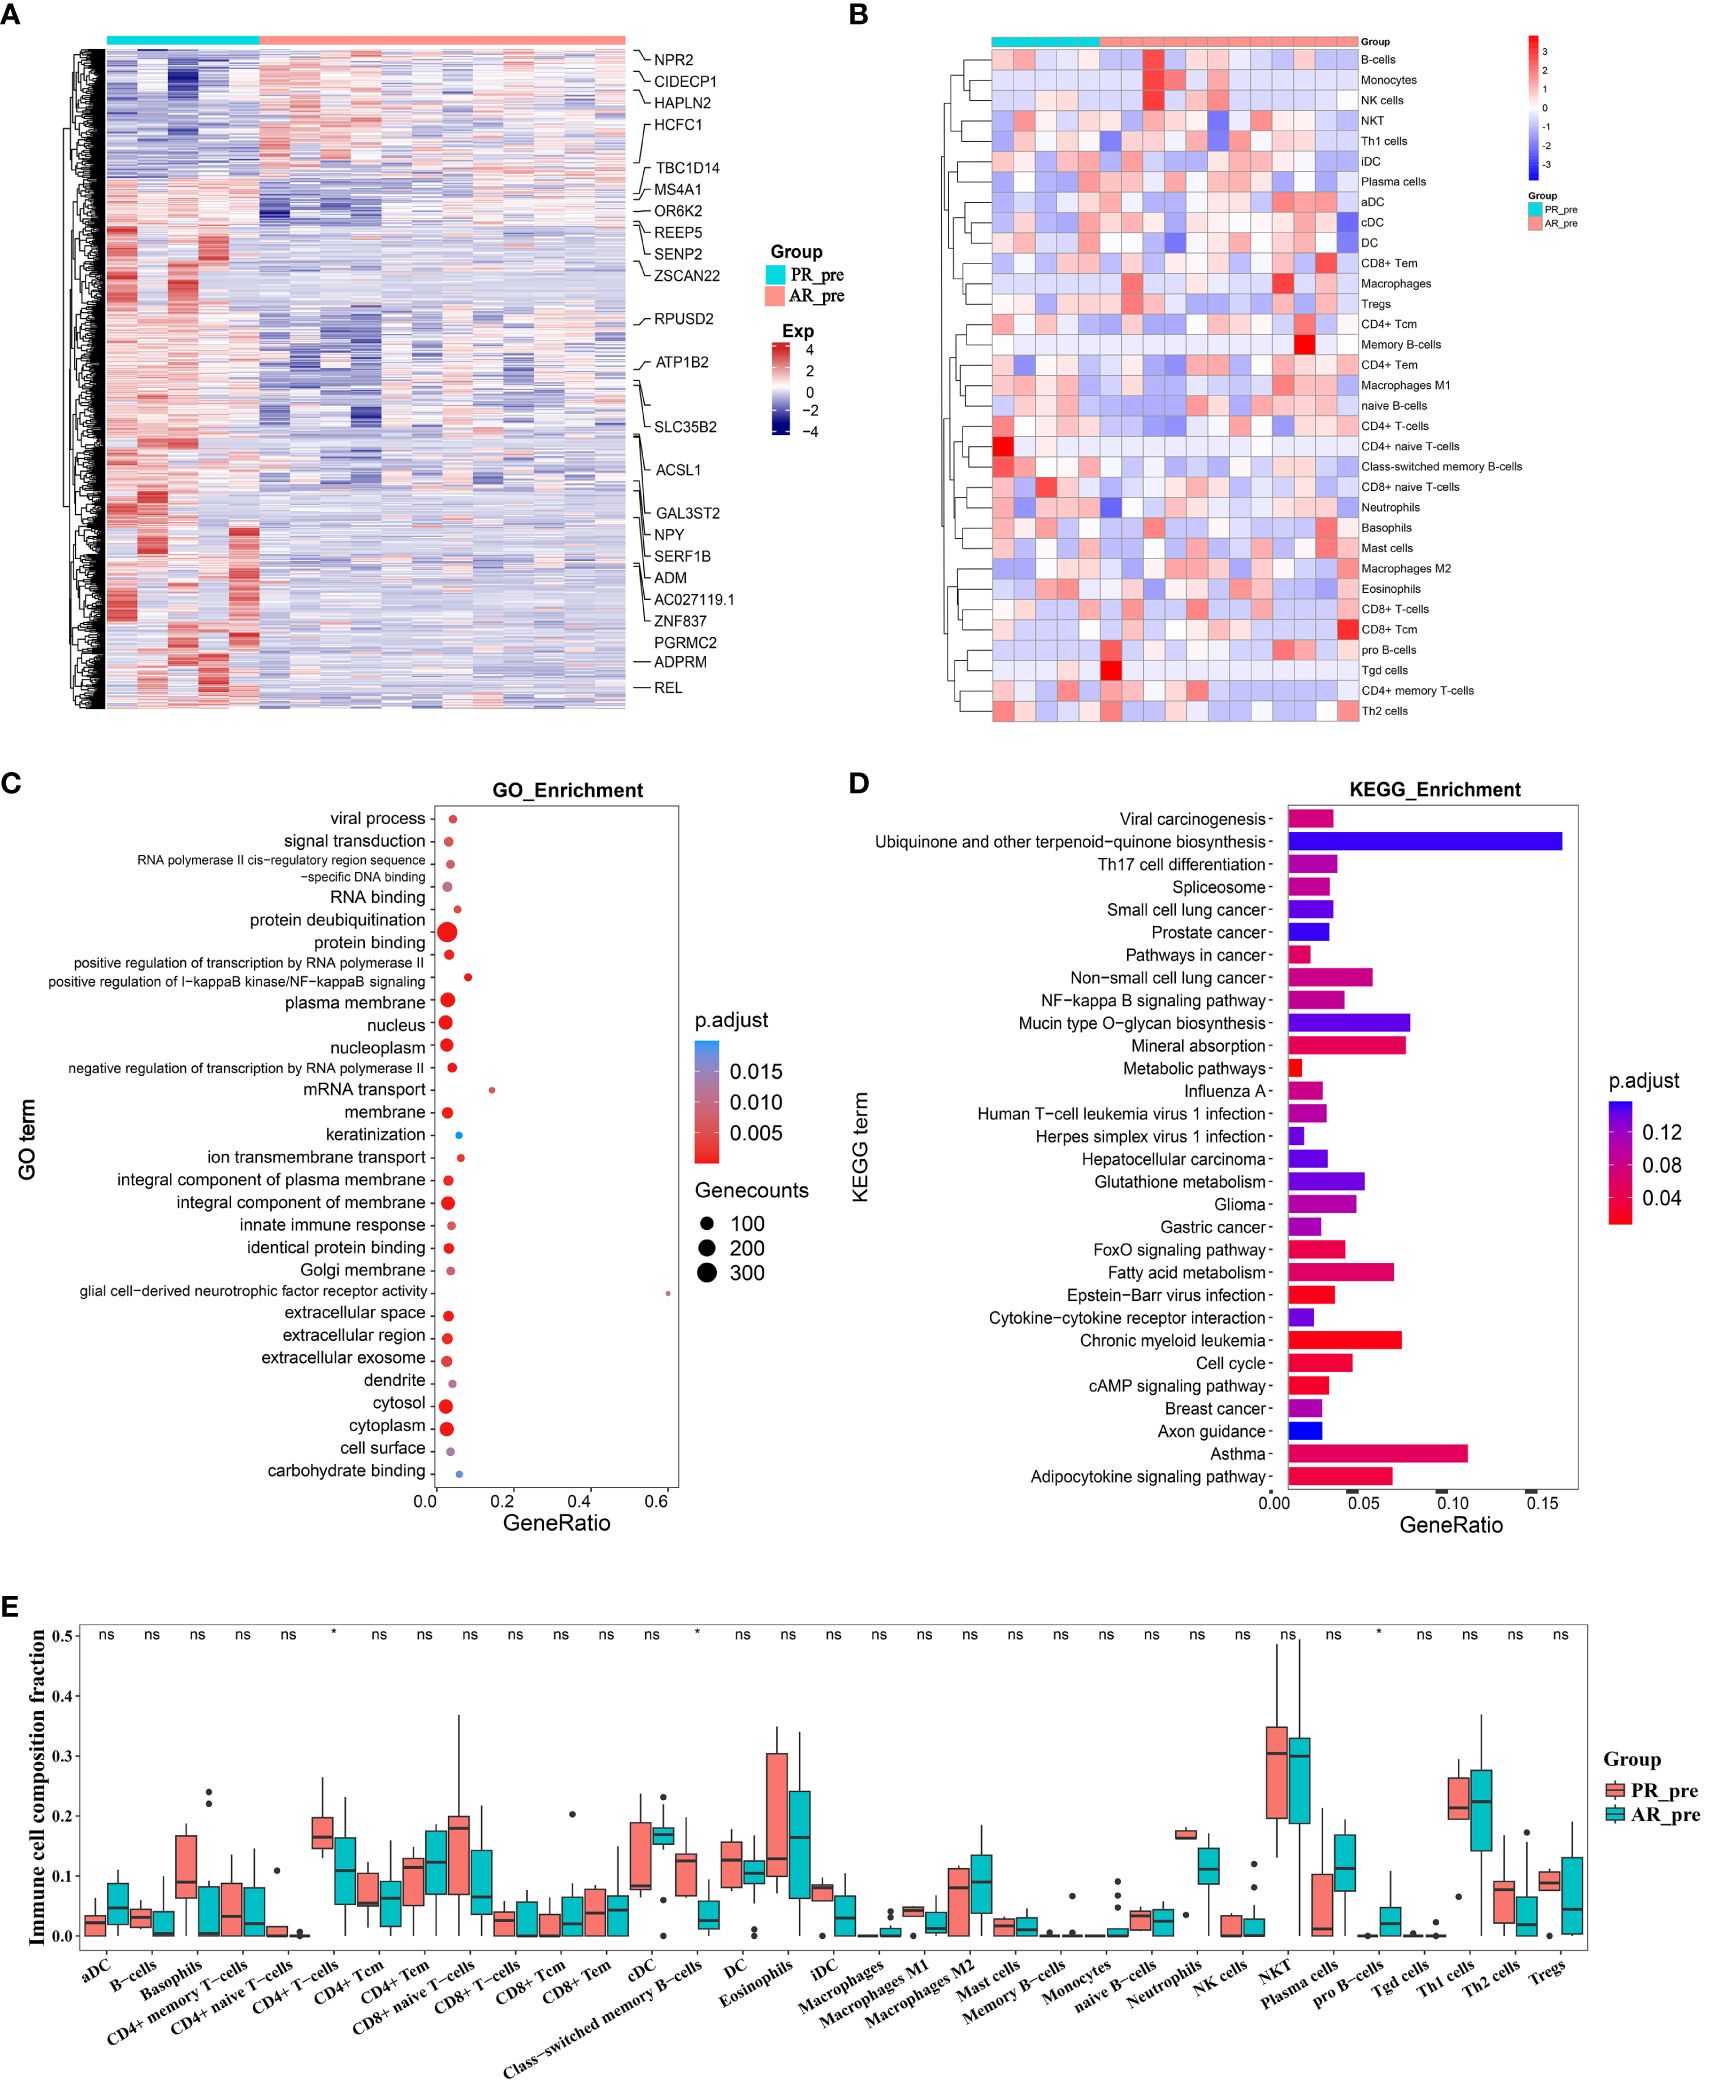
Figure 2 Changes in expression between primary and acquired resistance patients before cisplatin and etoposide treatment. (A) Heatmap analysis of DEGs between PR_pre and AR_pre groups. (B) Heatmap comparing expression levels of 64 cell components from xCell between PR_pre and AR_pre groups. (C) GO functional enrichment analysis, showing 30 most enriched GO terms. (D) KEGG enrichment analysis, showing 30 most enriched KEGG pathways. (E) Boxplot showing xCell enrichment scores of 33 immune cells between PR_pre and AR_pre groups, where * indicates p-value < 0.05 and ns indicates not significant.
We further compared immune and stromal scores between the two groups using xCell and ESTIMATE analysis, with no significant differences observed (Figure 2B, Supplementary Figures S3C–H). However, compared to the AR_pre group, the PR_pre group exhibited an increasing trend in class-switched memory B cells and CD4+ T cells among immune cell types, as well as a decreasing trend in pro B cells (Figure 2E). Class-switched memory B cells are a crucial component of reactive humoral immunity, ensuring the rapid production of high-affinity antigen-specific antibodies during antigen challenge. Smokers have a higher proportion of class-switched memory B cells compared to ex-smokers and never-smokers, regardless of whether they have chronic obstructive pulmonary disease (COPD) (29). CD4+ T cells can target tumor cells through various mechanisms, either by directly eliminating tumor cells through cytotoxicity or by indirectly eliminating tumor cells by regulating the tumor microenvironment (30). Furthermore, within secondary lymphoid organs, CD4+ T cells can enhance the intensity and quality of B cell and cytotoxic T lymphocyte responses (31). These findings suggest that patients with primary resistance exhibit a heightened immune response. These findings suggest that primary resistance is closely associated with cellular immunity and may be influenced by immune responses.
Network analysis discovered key hub genes in primary resistance
To further identify key genes associated with primary resistance in SCLC, we performed KEGG pathway enrichment analysis of DEGs between the PR_pre and AR_pre groups (Figure 3A). A co-expression network consisting of 95 cancer-related genes was constructed based on WGCNA. After filtering out the top 30% of edges, the final network contained 95 nodes with 1 499 edges (Supplementary Figure S4A). Furthermore, MST analysis of the network identified seven hub genes (node degree > 4), i.e., PI4KB, HLA-DMA, PRICKLE3, TNFSF10, ACSL1, EP300, and STAT3 (Figure 3B). Subsequently, correlation analysis was performed between the seven hub genes and cell scores derived from the xCell. These results showed a strong correlation between these genes and immune cell types, particularly CD4+ T cells, which exhibited an increasing trend in the PR_pre group (Figure 3C). Therefore, these genes may play a role in immune suppression among patients with primary resistance. Comparative analysis of the seven hub genes among the PR_pre, AR_pre, and AR_post groups showed that STAT3 was notably down-regulated in the PR_pre group, whereas PI4KB, HLA-DMA, PRICKLE3, TNFSF10, ACSL1, and EP300 were up-regulated in the PR_pre group compared to the AR_pre group. Interestingly, EP300 did not show a significant difference in expression between the AR_pre and AR_post groups but displayed a nearly 1.5-fold higher expression in the Pre_post group (Figure 3D). Compared to the AR_pre group, PI4KB, HLA-DMA, PRICKLE3, and TNFSF10 showed a similar increased trend in the AR_post and PR_pre groups (Figure 3D).
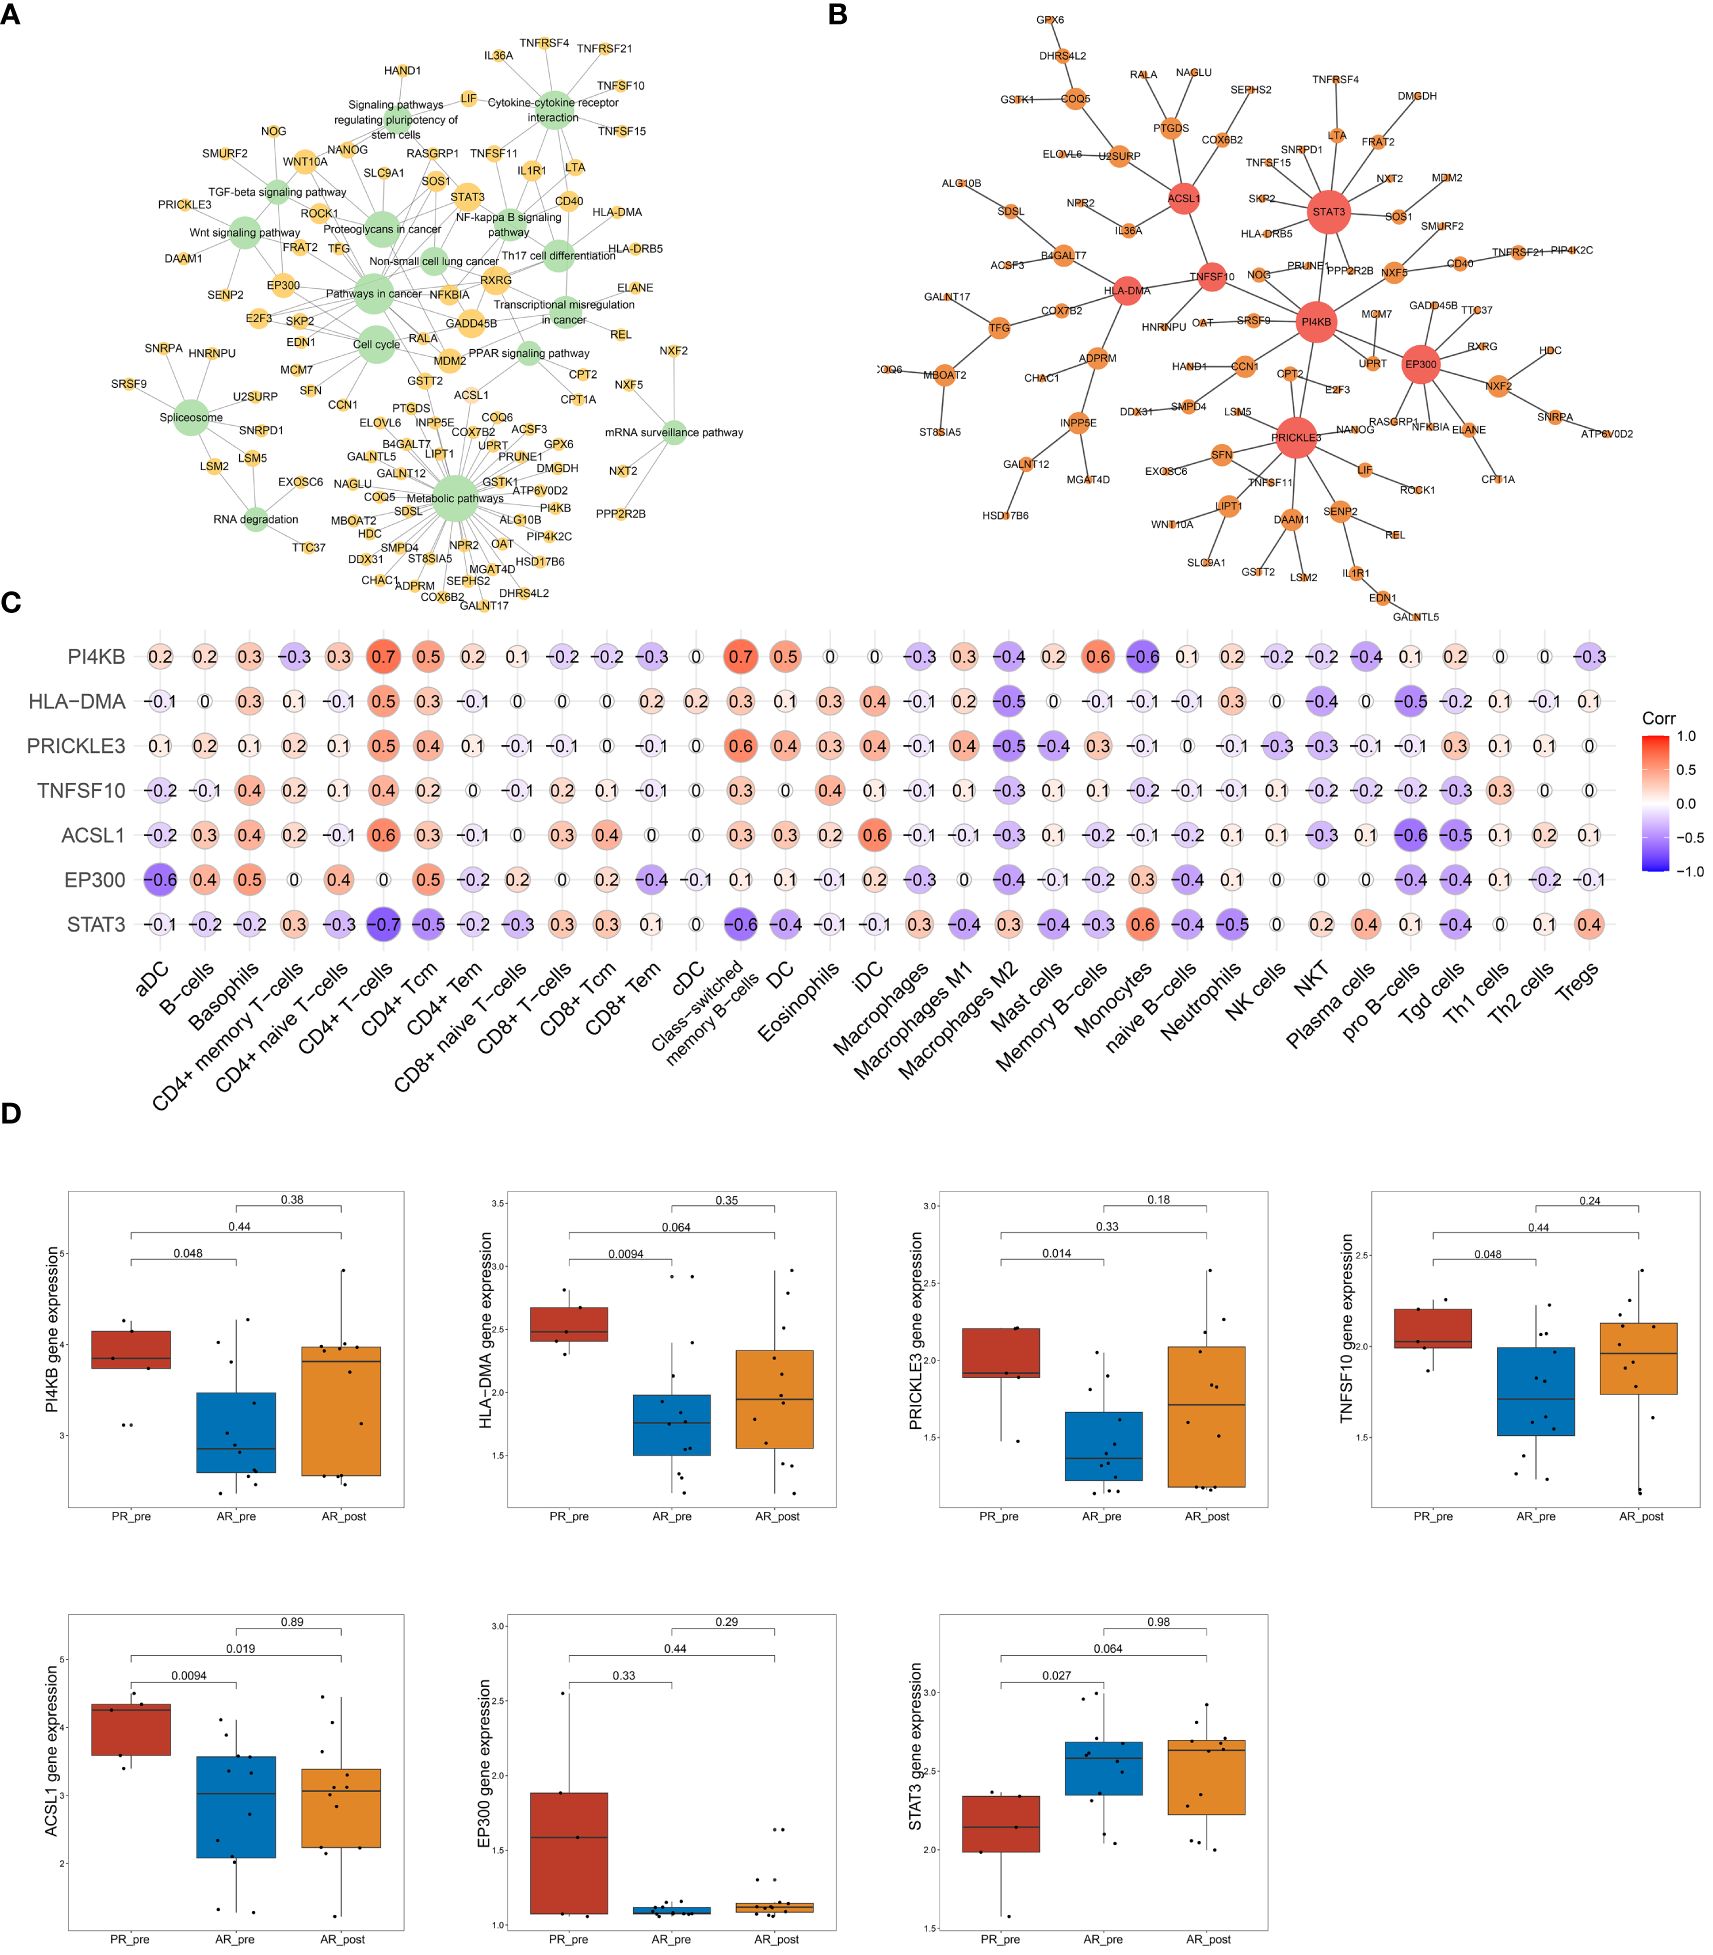
Figure 3 Network analysis of key hub genes in primary resistance. (A) Network plot showing DEGs between PR_pre and AR_pre groups associated with cancer-related KEGG pathways. (B) Network depicting co-expressed DEGs between PR_pre and AR_pre groups within cancer-associated KEGG pathways following WCGNA and MST analysis. (C) Correlation analysis between PI4KB, HLA-DMA, PRICKLE3, TNFSF10, ACSL1, EP300, and STAT3 expression and immune cells. (D) PI4KB, HLA-DMA, PRICKLE3, TNFSF10, ACSL1, EP300, and STAT3 expression between PR_pre, AR_pre and AR_post groups.
We tracked and analyzed the relationship between the seven hub genes and disease progression for each patient and revealed a significant correlation between PRICKLE3, TNFSF10, and ACSL1 and disease progression (Figures 4A–D, Supplementary Figure S4B–D). We collected gene expression and clinical information of tumor tissues obtained from 73 patients in George et al. (3), which revealed a significant correlation between the EP300 gene and survival prognosis (Figures 4E–H). To predict the functions of the seven genes, we conducted GSVA based on gene sets from the MSigDB database v7.1 (Figures 4I–L, Supplementary Figure S4E–G). Results showed a negative correlation between ACSL1 expression and the pathway score of “IL6 JAK STAT3 SIGNALING” (Figure 4I), a positive correlation between TNFSF10 expression and the pathway score of “TGF BETA SIGNALING” (Figure 4J), a positive correlation between PRICKLE3 expression and the pathway score of “APOPTOSIS” (Figure 4K), and a negative correlation between EP300 expression and the pathway scores of “GLYCOLYSIS”, “NOTCH SIGNALING”, and “P53 PATHWAY” (Figure 4L), suggesting these genes may play a role in immune regulation and cellular apoptosis. Previous research has demonstrated that the tumor necrosis factor (TNF) superfamily, comprised of 19 cytokines, triggers a wide range of cellular responses via homologous receptors and two principal signaling pathways. These pathways encompass the initiation of apoptosis through caspase activation, along with the stimulation of inflammation and cellular differentiation programs (32, 33). In conclusion, these results suggest that PRICKLE3, ACSL1, TNFSF10, and EP300 may induce primary resistance in SCLC patients by modulating immune function and cellular apoptosis.
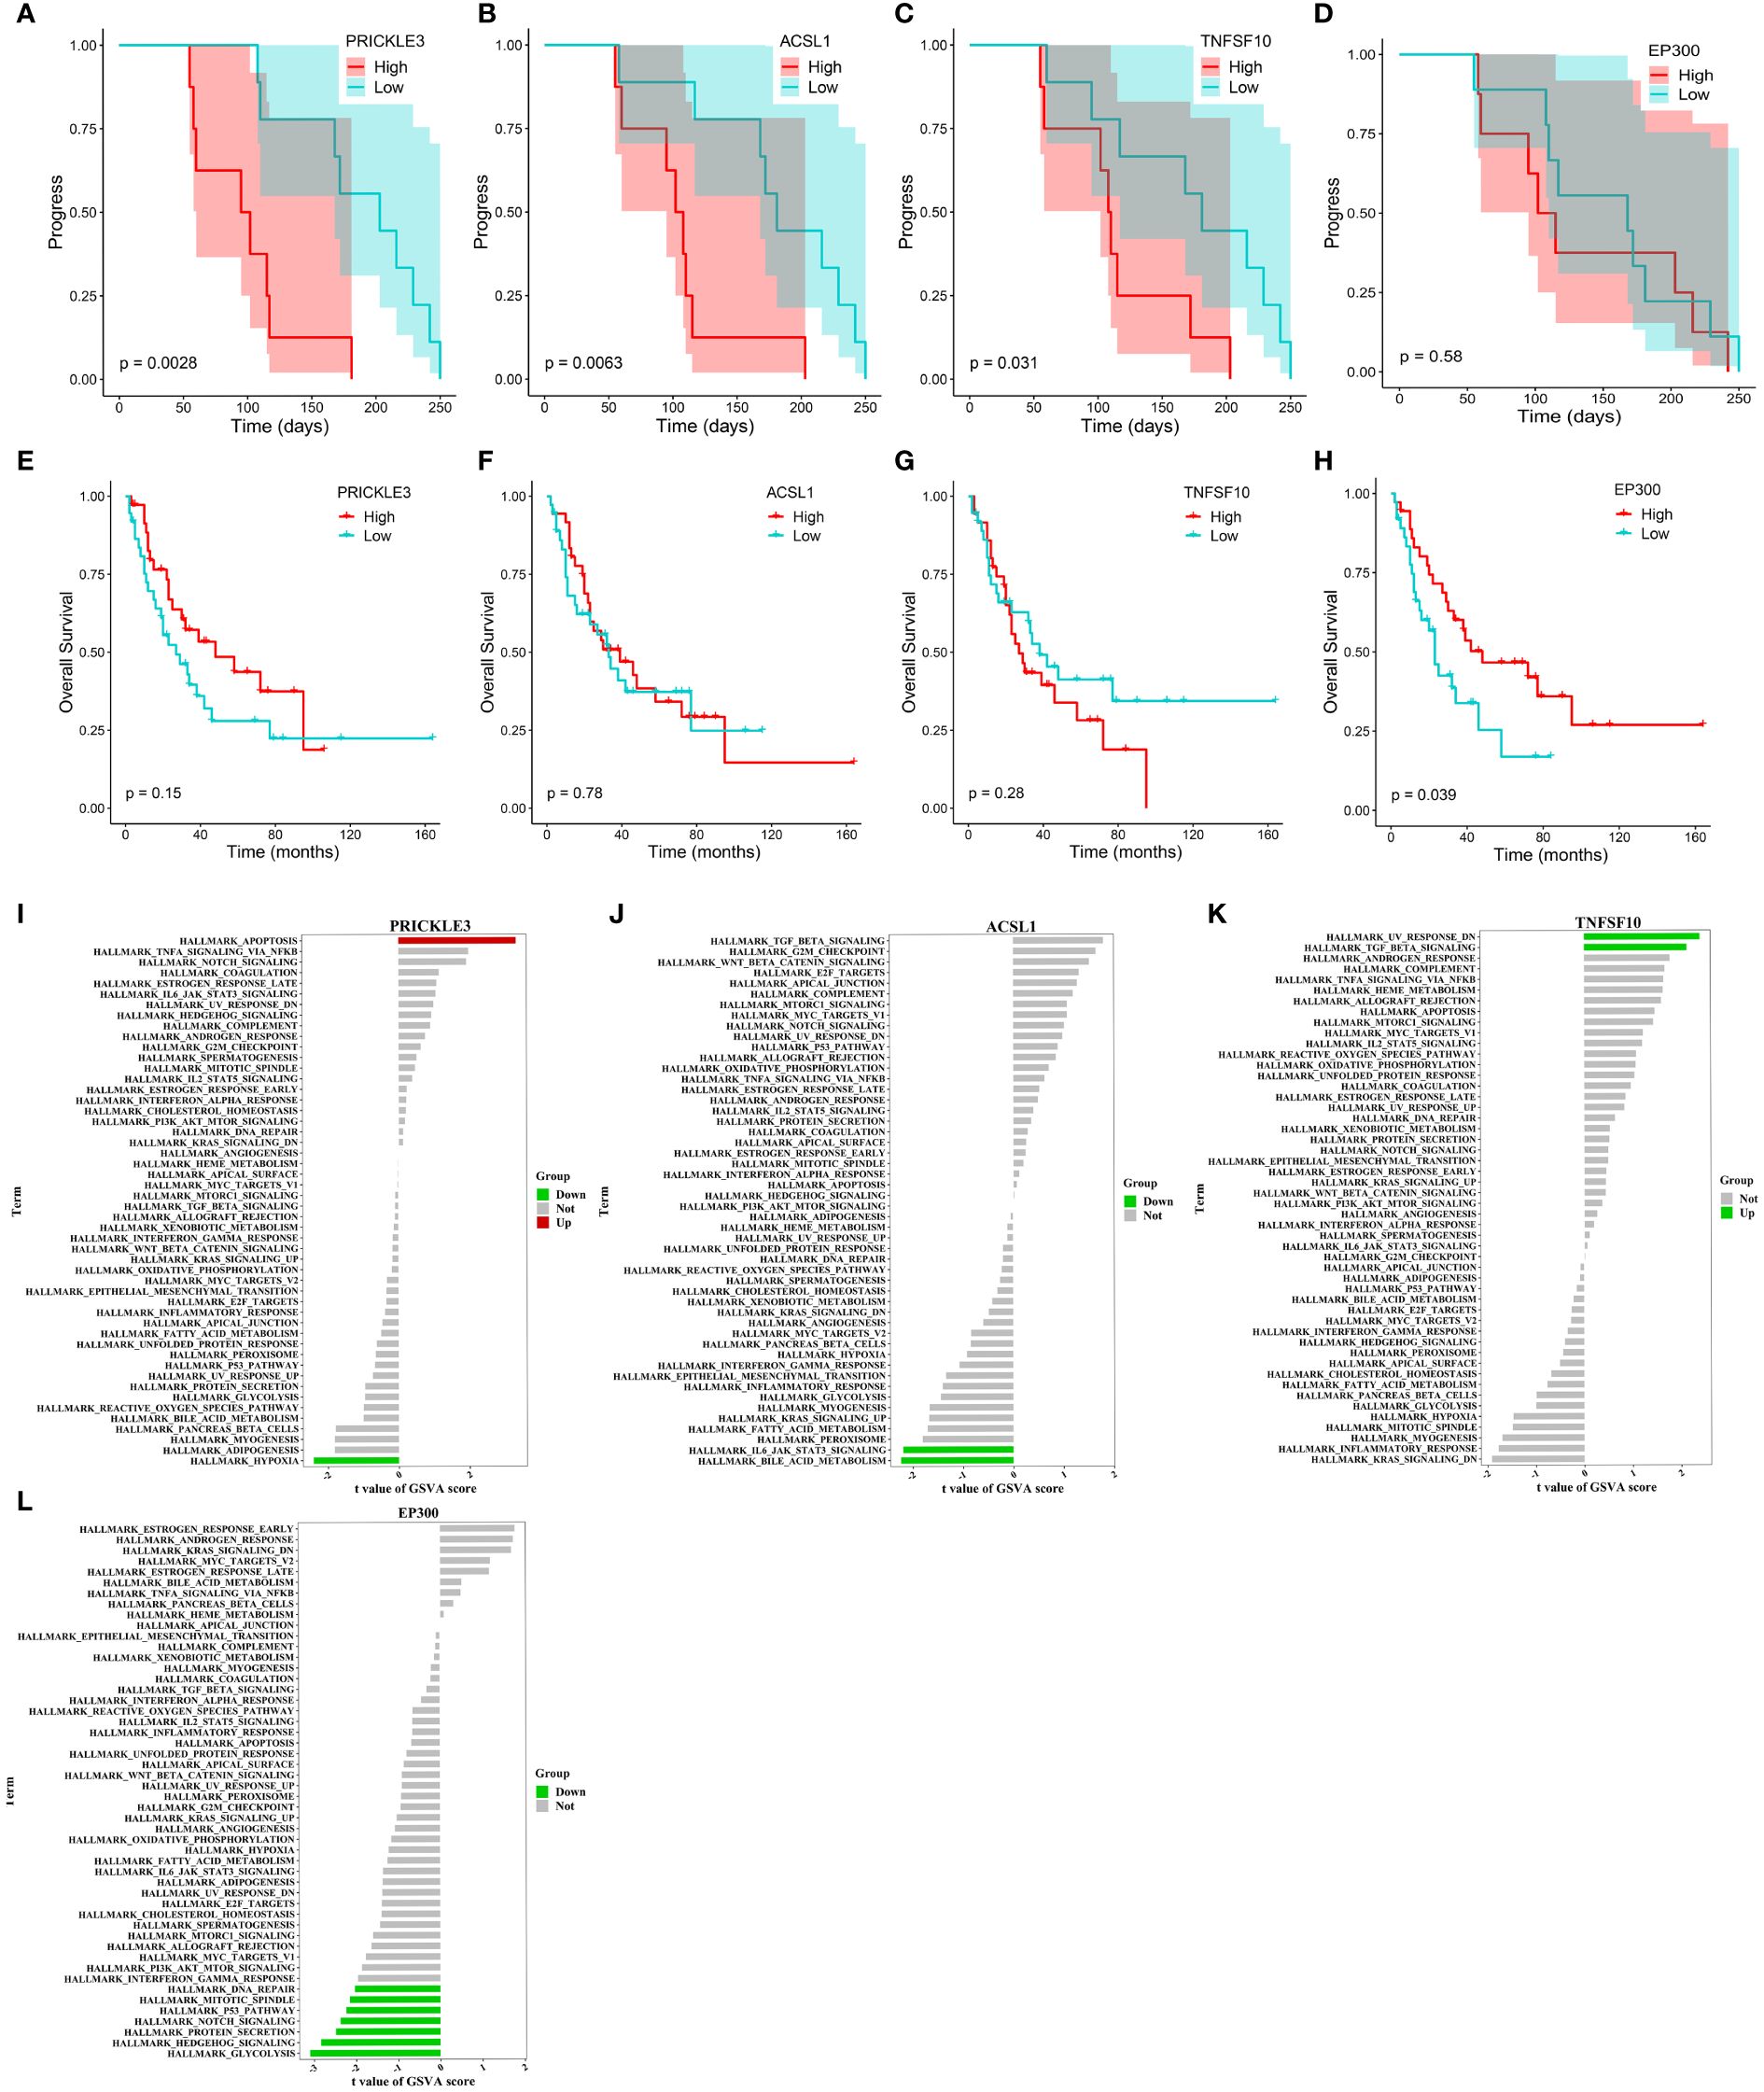
Figure 4 Progression, survival and GSVA analysis of hub genes in primary resistance. (A-D) Kaplan-Meier curve of PRICKLE3, ACSL1, TNFSF10 and EP300 with progression time. (E-H) Kaplan-Meier curve of PRICKLE3, ACSL1, TNFSF10 and EP300 with overall survival time. (I-L) GSVA of PRICKLE3, ACSL1, TNFSF10 and EP300.
Gene signature variation before and after EP treatment in acquired resistance patients
To elucidate the molecular mechanisms of acquired resistance to EP treatment, we compared the transcriptome profiles of acquired resistance patients before and after treatment. Paired differential transcriptional expression analysis was performed on the AR_pre and AR_post groups using limma, and gene signatures were selected based on genes with |log2FC| > 0.3 and p ≤ 0.05. In total, 745 DEGs were identified, including 486 up-regulated genes and 259 down-regulated genes, with genes showing |log2FC| ≥ 1 annotated and plotted (Figure 5A, Supplementary Figure S5A). We compared the expression patterns of the DEGs across the four groups. The gene expression profiles showed variation in the AR_post and PR_pre groups, further confirming that the mechanisms underlying primary and acquired resistance are not identical (Supplementary Figure S5B). For example, ESS2 exhibited opposite expression levels in the PR_pre and AR_post groups. ESS2, also known as DGCR14, is a transcriptional co-regulator in CD4+ T cells and plays a critical role in thymocyte survival through the MYC and IL-7 signaling pathways (34). GO enrichment analysis revealed that the genes influenced by EP treatment were predominantly associated with “protein binding”, “nucleus”, and “plasma membrane” (Figure 5C). KEGG enrichment analysis revealed that resistance-biased genes were highly associated with “Proteasome”, “Nitrogen metabolism”, and “TGF-beta signaling pathway” (Figure 5D). The transforming growth factor-beta (TGF-β) signaling pathway functions to suppress tumors in healthy cells and early-stage cancer cells by inducing cell cycle arrest and apoptosis, but can promote tumor progression, including metastasis and chemotherapy resistance, when activated in advanced-stage cancer (35).
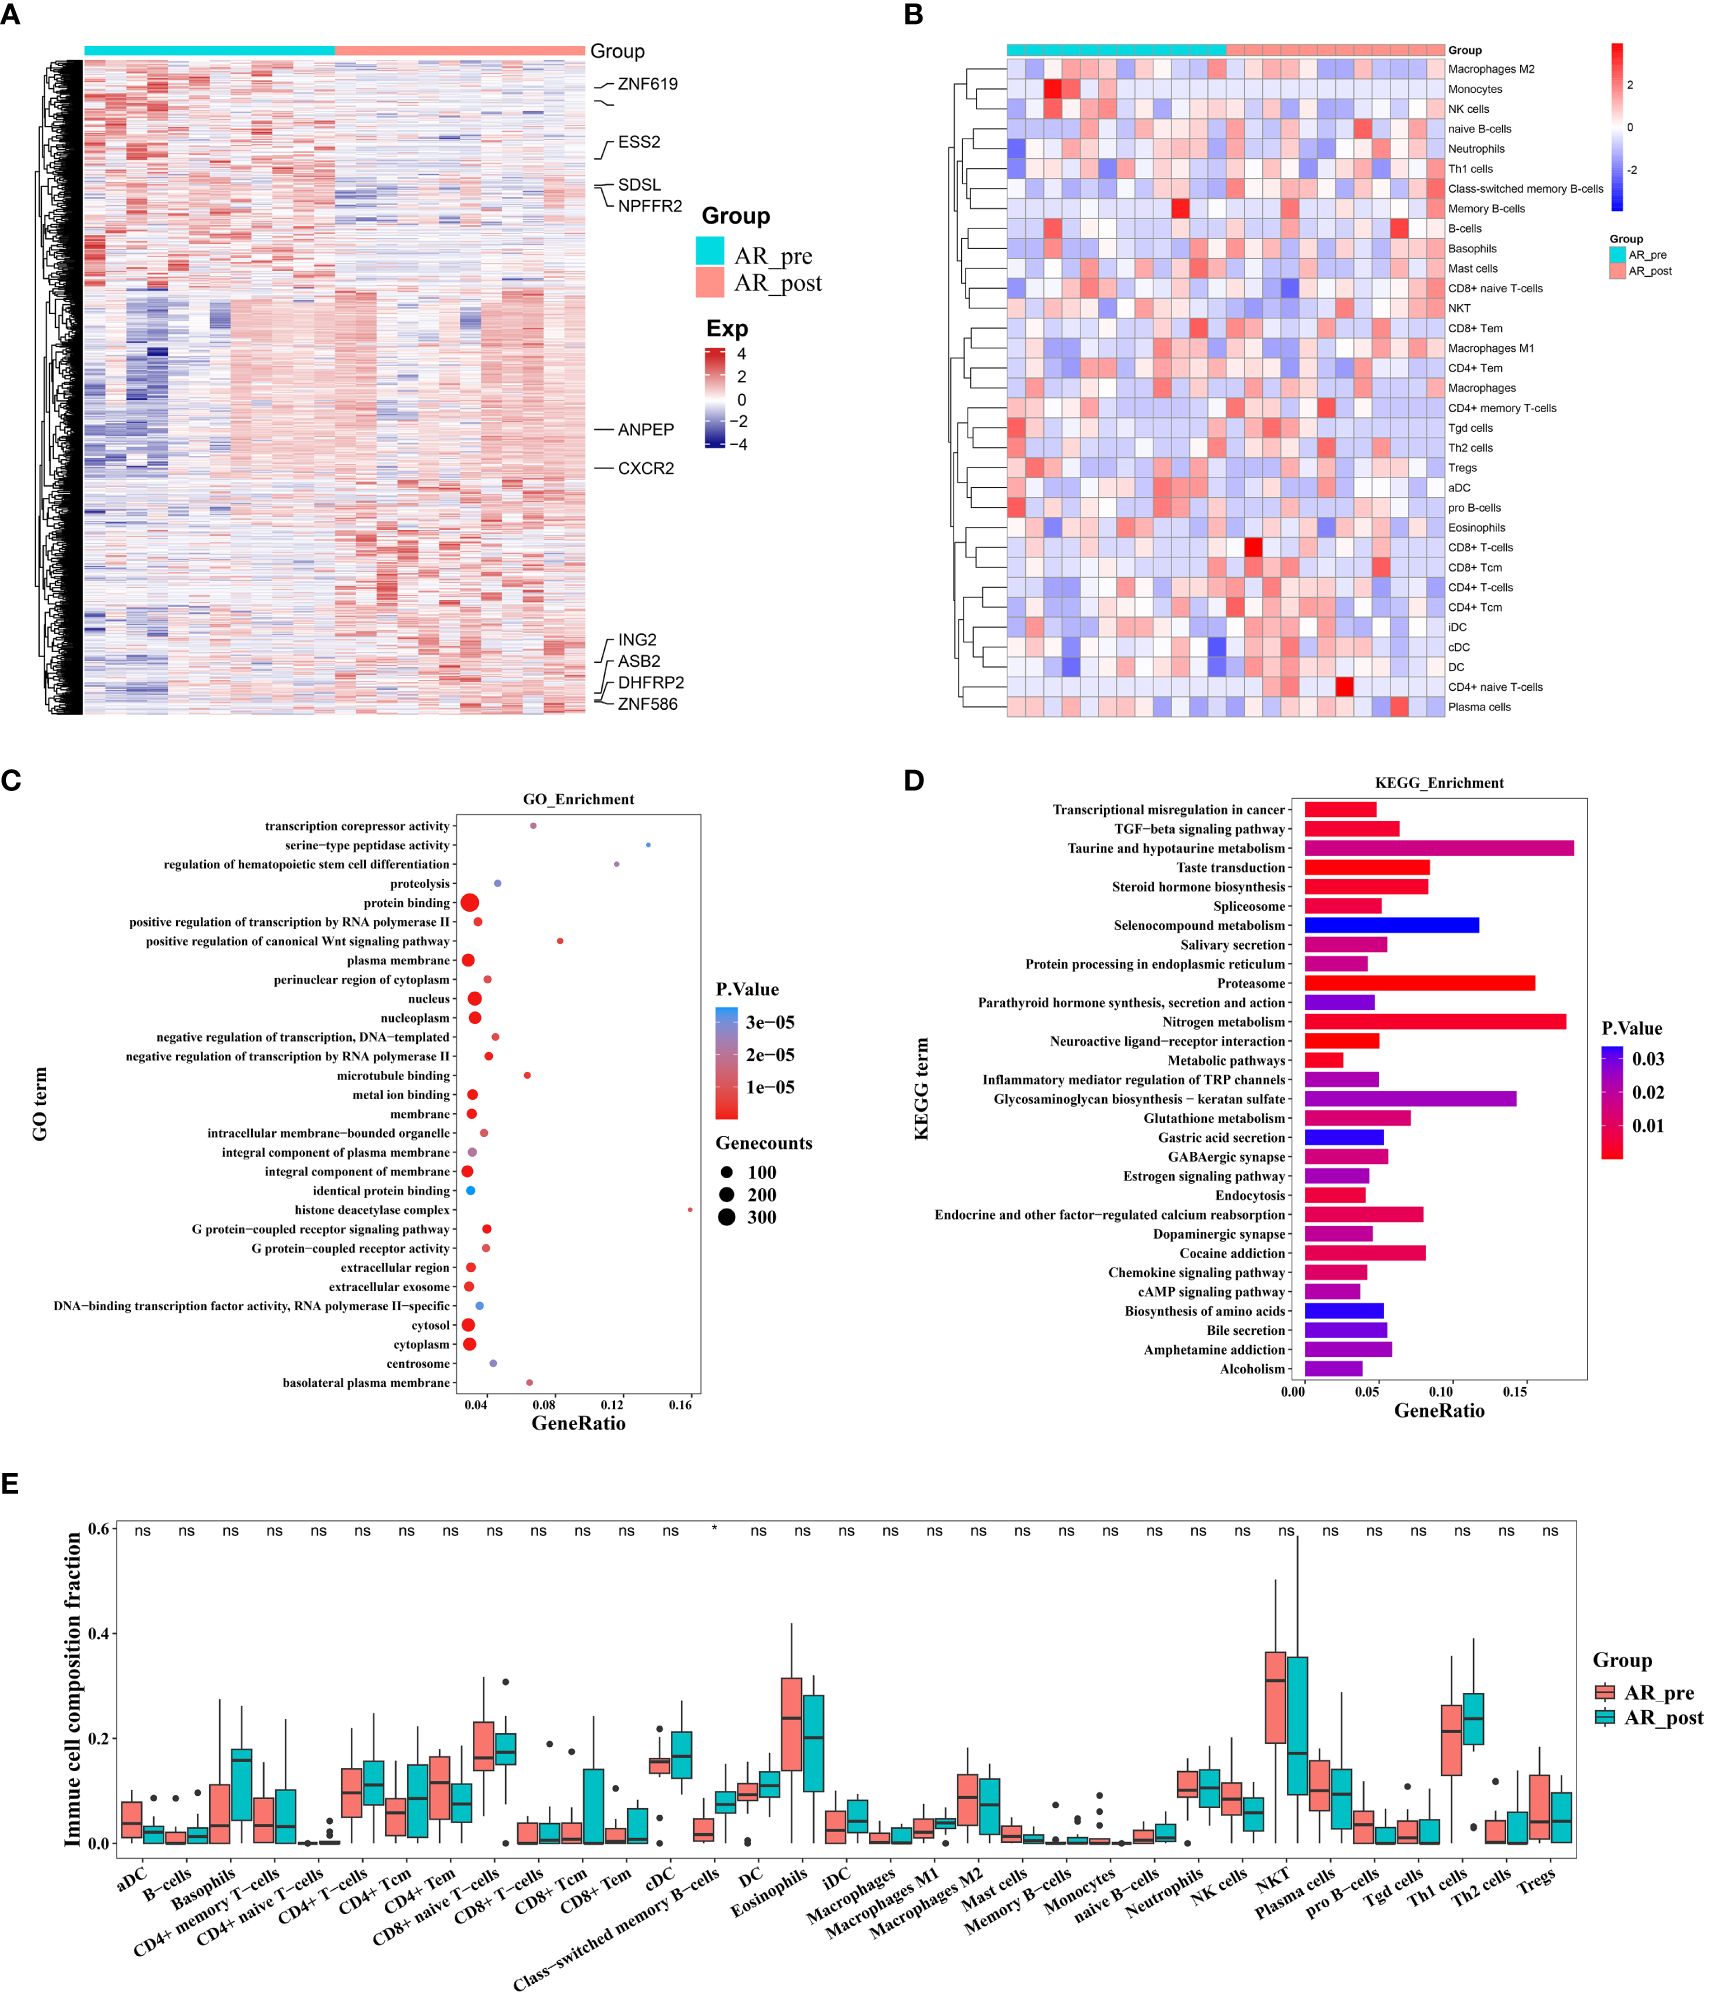
Figure 5 Changes in expression in acquired resistance patients before and after cisplatin and etoposide treatment. (A) Heatmap analysis of DEGs between AR_pre and AR_post groups. (B) Heatmap comparing expression levels of 64 cell components from xCell between AR_pre and AR_post groups. (C) GO functional enrichment analysis, showing 30 most enriched GO terms. (D) KEGG enrichment analysis, showing 30 most enriched KEGG pathways. (E) Boxplot showing xCELL enrichment scores of 33 immune cells between AR_pre and AR_post groups, where * indicates p-value < 0.05 and ns indicates not significant.
We next compared the immune and stromal scores between the AR_post and AR_pre groups based on xCell and ESTIMATE analysis (Figure 5B, Supplementary Figure S5C–H). Results revealed that the AR_post group exhibited a significant increase in class-switched memory B cells among immune cell types compared to the AR_pre group (Figure 5E). We mainly focused on the molecular profiles of acquired resistance, excluding SCLC patients with primary resistance, and discovered that acquired resistance may be exerted through pathways involving immune regulation, metabolism, and protein degradation.
Network analysis of key hub genes in acquired resistance
To further identify key genes associated with acquired resistance in SCLC, we identified DEGs between the AR_pre and AR_post groups and performed KEGG pathway enrichment analysis of cancer-related pathways (Figure 6A). The expression matrix of the 92 genes enriched in these pathways was used to construct a co-expression network via WGCNA. After filtering out the top 30% of edges of each node, the core constructed network contained 92 nodes and 2 582 edges (Supplementary Figure S6A). In total, 11 hub genes (node degree > 4) were identified via MST analysis including SENP2, TBL1X, DCPS, PBMXL1, SMNDC1, ECD, SNW1, CYP11A1, SDS, PSMD4 and PSMD1 (Figure 6B). Subsequently, correlation analysis was performed between the 11 hub genes and cell scores derived from the xCell, which showed a strong positive correlation between SDS and macrophage M1 cells, and SNW1 and megakaryocyte cells (Figure 6C). SNW1 is a nuclear matrix-associated coactivator that can interact with the vitamin D receptor to mediate transcription and RNA splicing (36) and is essential for TGF-β1-induced epithelial-mesenchymal transition and invasion (37). These findings suggest that both SNW1 and megakaryocyte cells play important roles in tumor invasion, consistent with the strong correlation observed between SNW1 and megakaryocyte cells in our study. We further conducted a comparative analysis of the expression patterns of the 11 genes among the AR_pre, AR_post, and PR_pre groups. Notably, SENP2, PBMXL1, TBL1X, SMNDC1, SDS, PSMD1, and CYP11A1 were up-regulated, while ECD, DCPS, and SNW1 showed down-regulated expression in the AR_post group compared to the AR_pre group. Although there was no significant difference in the expression levels of CYP11A1 and SENP2 between the two groups, an upward trend was observed in the AR_post group (Figure 6D). SDS, ECD, CYP11A1, DCPS, TBL1X, and SENP2 showed similar trends in the AR_post and PR_pre groups compared to the AR_pre group (Figure 6D).
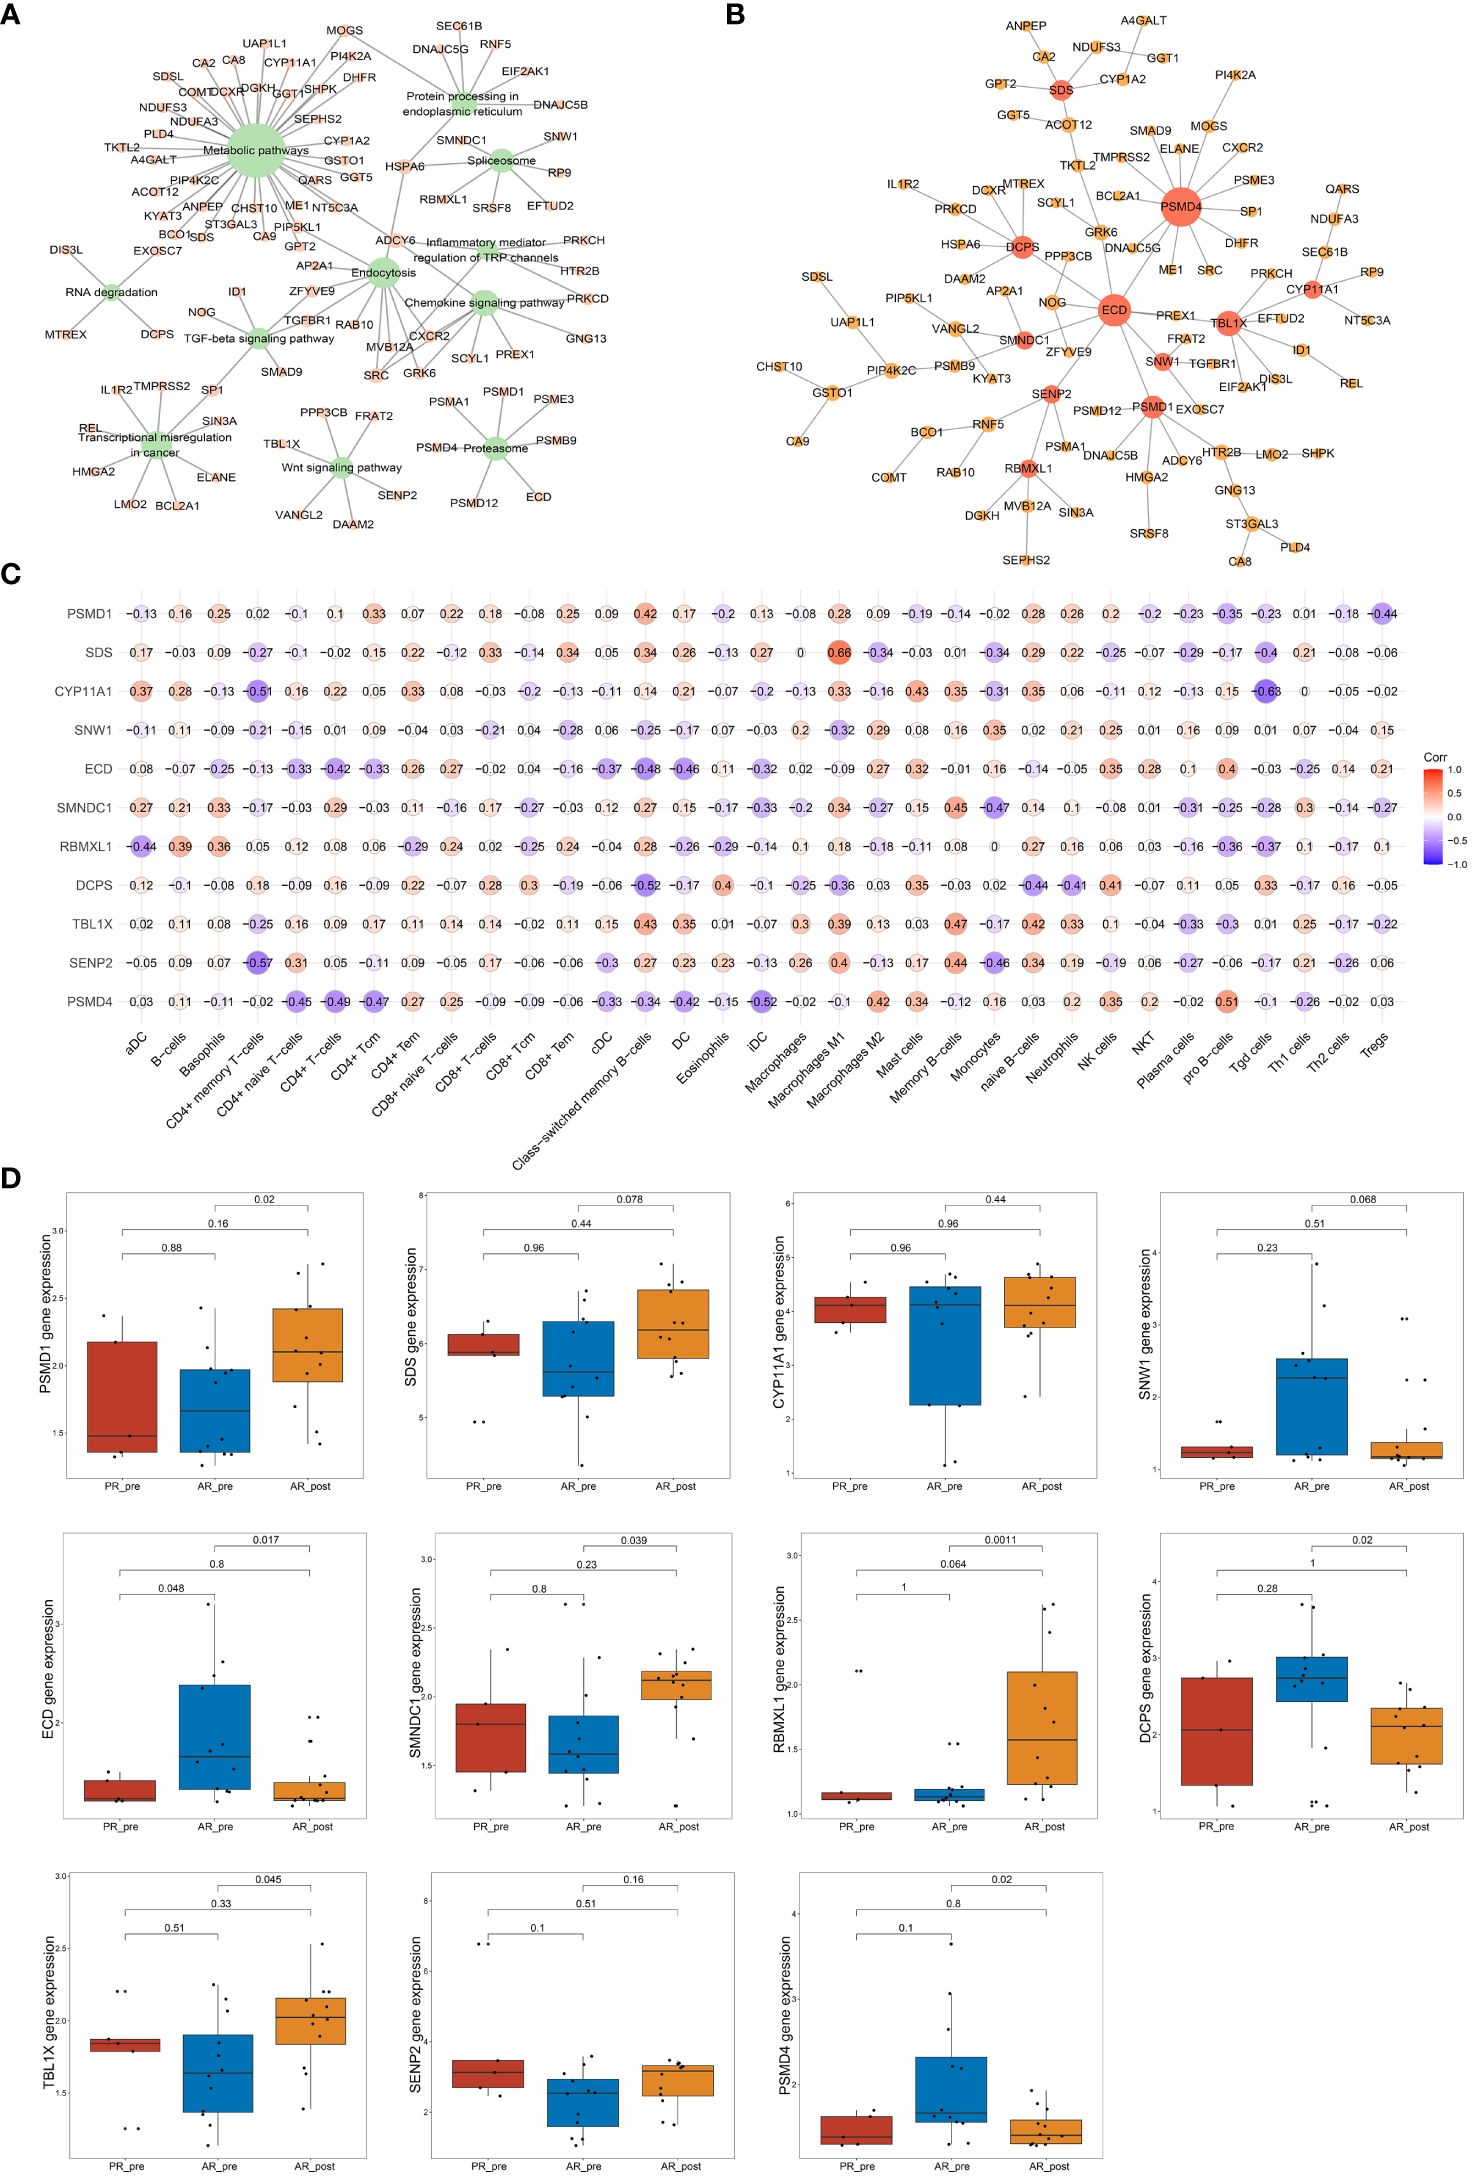
Figure 6 Network analysis of key hub genes in acquired resistance. (A) Network plot showing DEGs between AR_pre and AR_post groups associated with cancer-related KEGG pathways. (B) Network depicting co-expressed DEGs between AR_pre and AR_post groups within cancer-associated KEGG pathways following WCGNA and MST analysis. (C) Correlation analysis between PSMD4, SENP2, TBL1X, DCPS, PBMXL1, SMNDC1, ECD, SNW1, CYP11A1, SDS, and PSMD1 expression and immune cells. (D) PSMD4, SENP2, TBL1X, DCPS, PBMXL1, SMNDC1, ECD, SNW1, CYP11A1, SDS, and PSMD1 expression between PR_pre, AR_pre and AR_post groups.
We also tracked and analyzed the relationship between the 11 hub genes and disease progression for each patient and demonstrated a significant correlation between SNW1 and SENP2 and disease progression (Figures 7A–C, Supplementary Figure S6B–I). Furthermore, in the dataset obtained from George et al., a significant correlation was observed between the SMNDC1 gene and survival prognosis (Figures 7D–F). To predict the functions of the 11 genes, we conducted GSVA based on gene sets from the MSigDB database v7.1 (Figures 7G–I, Supplementary Figure S7A–H). Results showed a negative correlation between SNW1 expression and the pathway score of “UV_RESPONSE_DN” (Figure 7G) and positive correlations between SENP2 expression and the pathway scores of “OXIDATIVE_PHOSPHORYLATION”, “MYC_TARGETS_V1”, and “NOTCH_SIGNALING” (Figure 7H), a negative correlation between SMNDC1 expression and the pathway score of “UV_RESPONSE_DN” (Figure 7I). Studies have shown that SENP2, DCUN1D1, DVL3, and UBXN7 participate in a small protein-protein interaction network. Knockout of any of these four genes results in suppressed growth of lung squamous cell carcinoma with 3q26–29 amplification (36). Furthermore, knockdown of SENP2 results in significant inhibition of cell growth (38). The Notch signaling pathway and MYC targets play broad roles in the promotion or inhibition of proliferation and cell death (39, 40), related to the regulatory role of SENP2 in tumor growth.
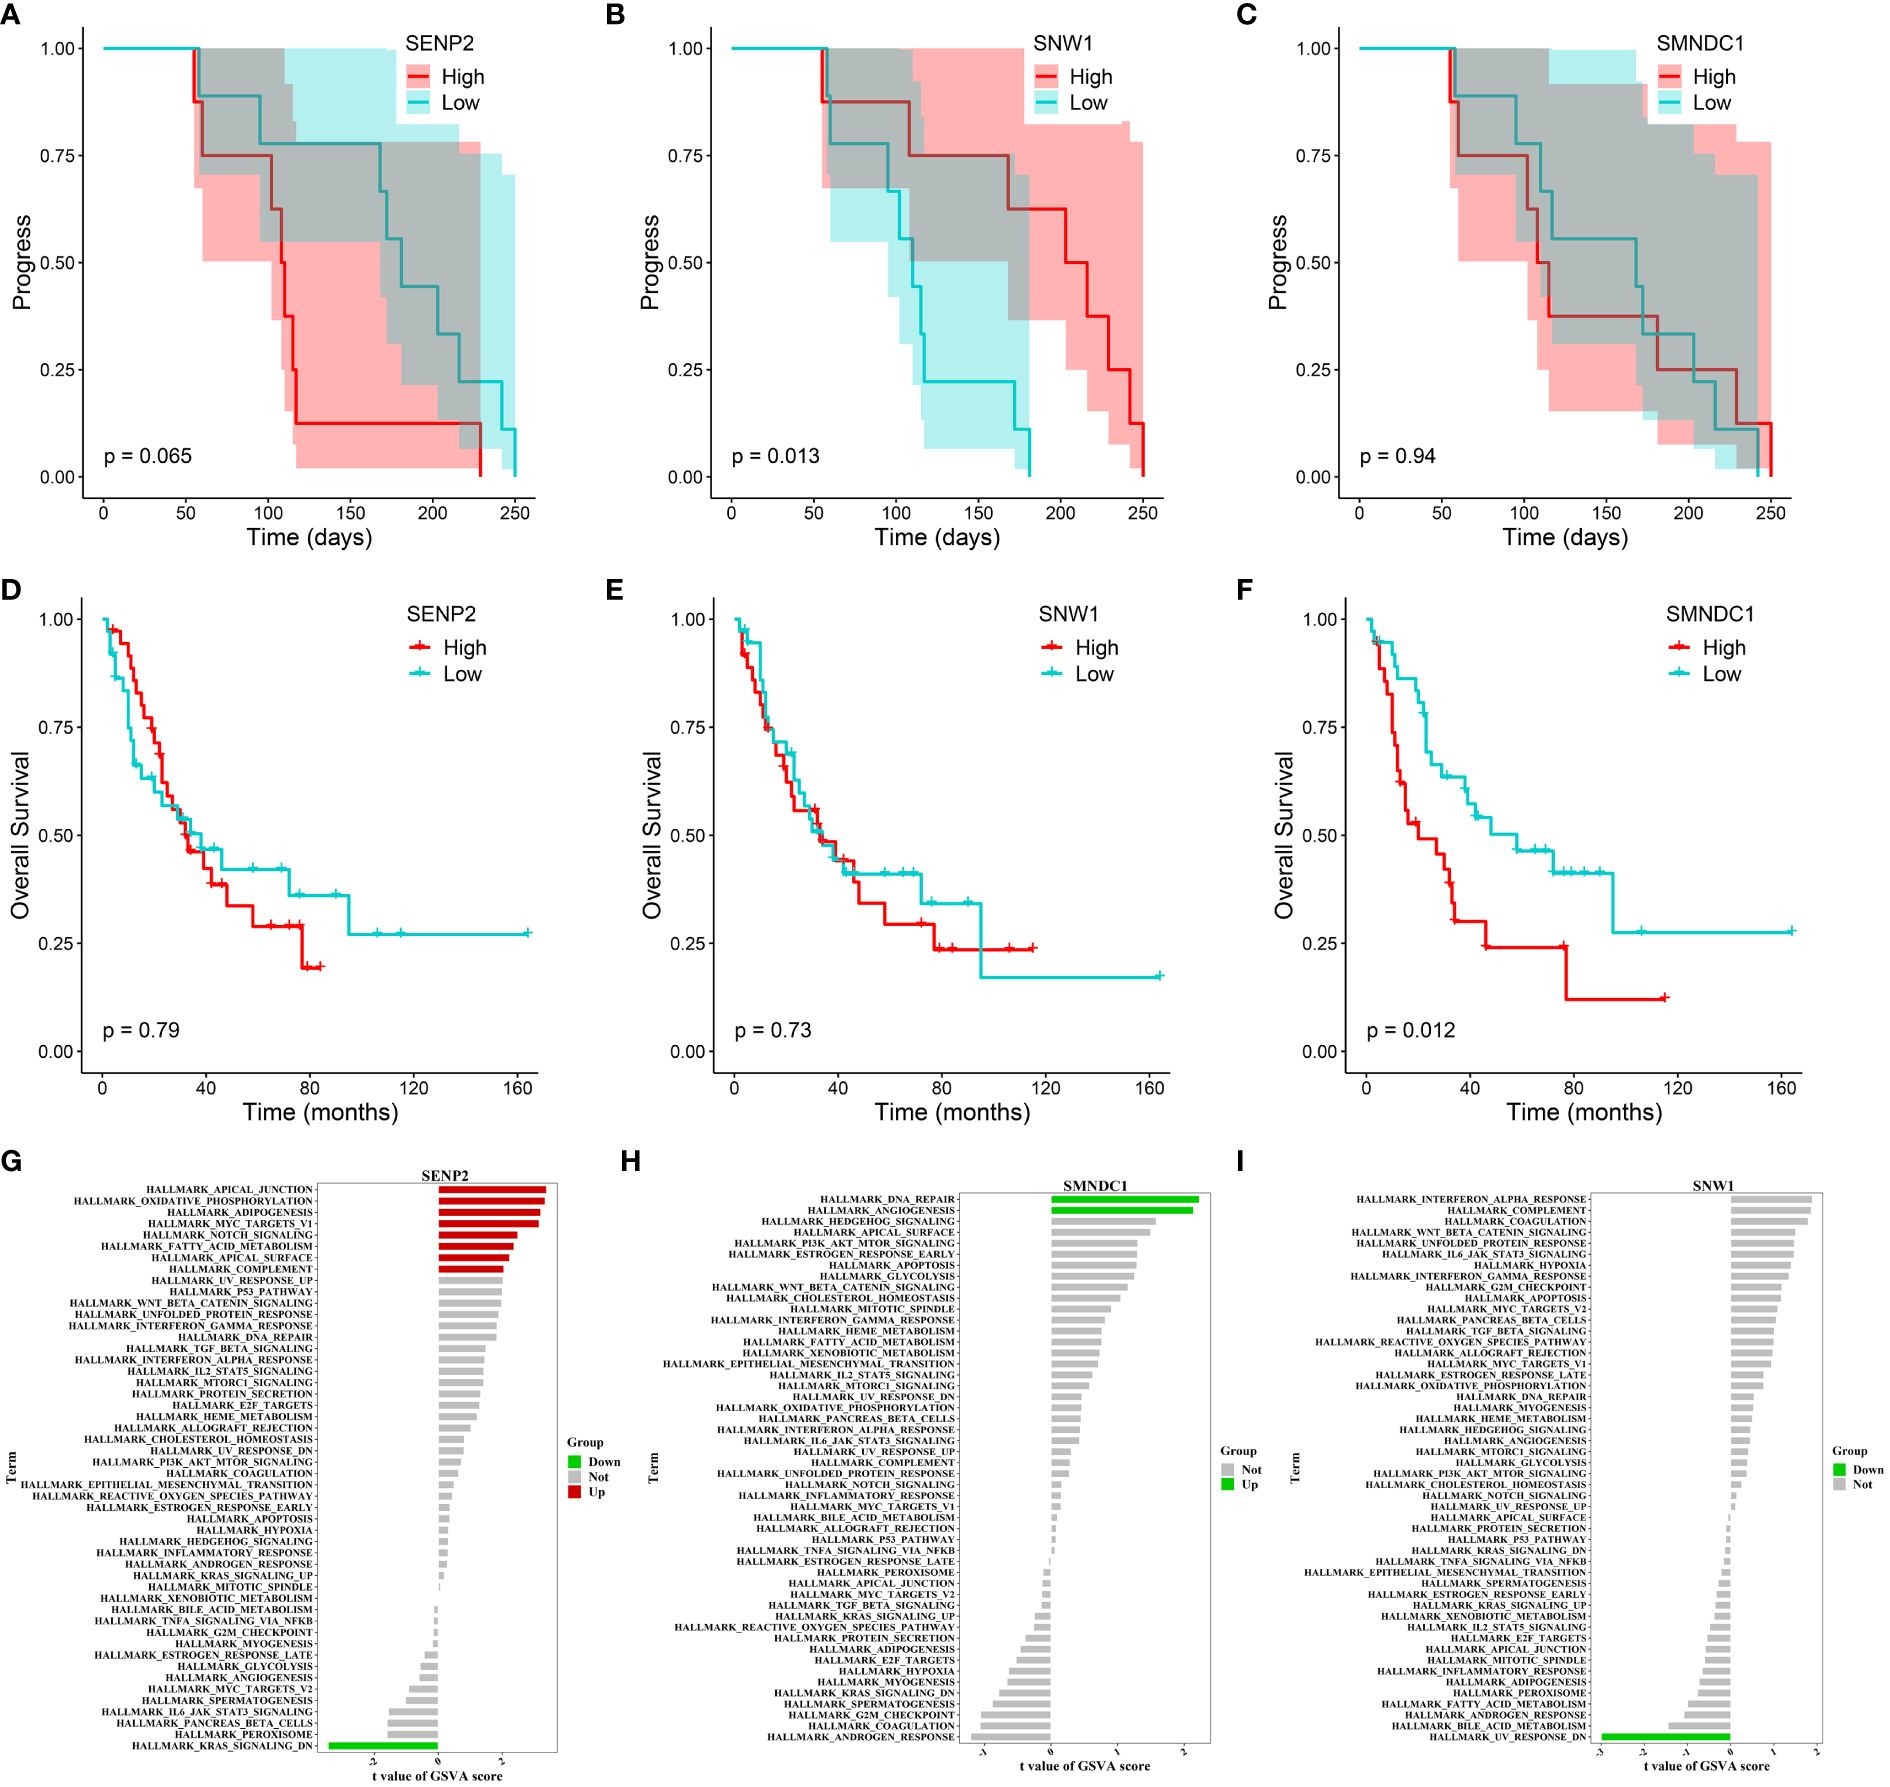
Figure 7 Progression, survival and GSVA analysis of hub genes in acquired resistance. (A-C) Kaplan-Meier curve of SENP2, SNW1, and SMNDC1 with progression time. (D-F) Kaplan-Meier curve of SENP2, SNW1, and SMNDC1 with overall survival time. (G-I) GSVA of SENP2, SNW1, and SMNDC1.
In summary, these findings suggest that SNW1, SENP2 and SMNDC1 may regulate acquired resistance in SCLC patients by modulating the Notch and MYC signaling pathways.
Discussion
SCLC is a highly invasive neuroendocrine tumor characterized by rapid cell division, a high proportion of actively proliferating cells, and early dissemination to distant sites in the body (41). Earlier studies have shown that the expression of ASCL1 declines in patients with SCLC and in SCLC cells following cisplatin treatment, particularly in cases with acquired chemoresistance, in comparison to untreated samples (42). In recent years, the consensus definition of SCLC subtypes has transitioned from classical/variant classification to neuroendocrine (NE)/non-neuroendocrine (non-NE) classification, with further subgroup categorization based on specific transcription factors, i.e., NE transcription factors ASCL1 and/or NEUROD1 (43, 44), non-NE variants associated with POU2F3, and a hypothetical fourth subtype driven by the transcription factor YAP1 (45). In the current study, we observed that primary resistance patients displayed decreased expression of ASCL1 and NEUROD1, while acquired resistance patients exhibited increased expression of NEUROD1 and decreased expression of ASCL1 following cisplatin and etoposide treatment. These findings suggest that primary and acquired resistance patients belong to distinct SCLC transcriptional subtypes, characterized by different mechanisms of drug resistance, which need further research to enhance our understanding of their unique features.
SCLC is closely associated with the tumor microenvironment, typified by a high mutational burden, and induces paraneoplastic autoimmune syndromes in up to a third of patients. In principle, these attributes suggest that SCLC could potentially exhibit a positive response to immune checkpoint blockade (46). However, the combined use of chemotherapy and ICIs targeting programmed cell death ligand 1 (PD-L1), such as durvalumab and atezolizumab, has yielded only modest improvement in survival outcomes for SCLC patients (9, 47). Similarly, the use of the programmed cell death protein 1 (PD-1) checkpoint blockade antibody nivolumab in SCLC patients has also yielded disappointing results (48). Thus, there is a critical need to establish a comprehensive understanding of the interactions between the immune system and SCLC. Previous studies have shown that genetically modified mouse models lacking NK cells display a heightened tumor burden under SCLC metastasis conditions (49). In other words, NK cells possess the ability to activate interleukin-15 (IL-15) to mitigate tumor mutational burden in SCLC models, indicating that targeting NK cells within the SCLC microenvironment may provoke a specific response. Here, we found a significant increase in class-switched memory B cells in both primary and acquired resistance patients after EP treatment. Prior studies have also reported that class-switched memory B cell abundance is higher in poor prognosis subtypes of hepatocellular carcinoma and contributes to the prevalence of immune-related adverse events (IRAs) associated with ICIs (50). Our findings suggest that class-switched memory B cells may play a role in platinum treatment resistance in SCLC patients, which warrants further research.
Certain genes have been identified as significant players of platinum resistance in SCLC patients based on their mutation status. Among these genes, COL11A1, which encodes the α1 chain of type XI collagen, ranks as the third most mutated gene, following TP53 and RB1 (42). As a critical component of the extracellular matrix, dysregulation of COL11A1 plays a key role in mediating platinum-based chemotherapy resistance (51, 52). Leslie et al. detected somatic copy number changes in ABCC1 in recurrent SCLC, a membrane protein of the ATP-binding cassette family capable of effluxing both physiological compounds and drugs from the cytoplasm, thus suggesting a possible role in driving chemotherapy resistance (53). Approximately 20% of SCLC cases exhibit amplification of the MYC family oncogenes MYCL1, MYCN, and MYC, which is associated with poorer survival outcomes (3, 54). Cell lines derived from patients under platinum treatment also show approximately three times higher amplification rates of MYC, MYCN, and MYCL compared to those without platinum treatment (55). Studies using genetically engineered mouse models with combined Rb1 and Trp53 loss, coupled with MYCL or MYCN overexpression, have also demonstrated the involvement of MYCL and MYCN in platinum resistance (56).
In this study, we identified several genes related to primary resistance, specifically PRICKLE3, TNFSF10, ACSL1 and EP300, which exhibited significant correlation with SCLC progression. PRICKLE3 encodes a highly conserved protein enriched in mitochondria, with its Drosophila and Xenopus homologs involved in planar cell polarity and visual function (57). PRICKLE3 is also associated with susceptibility alleles and mutations in Leber’s hereditary optic neuropathy (58, 59). The TNFSF10 pathway constitutes an important component of the innate host anti-tumor immune surveillance mechanism, engaging in the selective activation of extrinsic cell death pathways in cancer cells (33). Recent studies have demonstrated significant up-regulation of ACSL1 and ACSL3 protein levels in highly metastatic ovarian cancer cell lines, with gene expression associated with increased metastatic capacity and poor survival prognosis (60). However, despite extensive research on PRICKLE3, TNFSF10, ACSL1 and EP300 in relation to cancer, immunity, and metastasis, their precise involvement in primary resistance mechanisms in SCLC remains unclear and requires further study. Similarly, the key genes SNW1, SENP2 and SMNDC1 identified in this study in the context of acquired resistance, have previously been implicated in cancer cell proliferation, death, and metastasis, although their specific role in regulating platinum resistance remains unknown. Consequently, our future research will focus on investigating and validating the connections among PRICKLE3, TNFSF10, ACSL1, EP300, SNW1, SENP2 and SMNDC1 in relation to SCLC resistance.
In conclusion, we conducted integrative bioinformatics analysis of the gene expression profiles of 34 blood samples collected from 17 SCLC patients before and after EP treatment. Our results suggest the potential significance of class-switched memory B cells in both primary and acquired resistance mechanisms. Notably, we identified PRICKLE3, TNFSF10, ACSL1 and EP300 as potential key gene regulators associated with primary resistance, and SNW1, SENP2 and SMNDC1 as key gene regulators associated with acquired resistance. These findings offer valuable insights for understanding chemotherapy resistance and related gene signatures in SCLC, which could help further biological validation studies.
Data availability statement
The original contributions presented in the study are included in the article/Supplementary Material, further inquiries can be directed to the corresponding author/s.
Ethics statement
The studies involving humans were approved by Ethics Committee of the Yunnan Cancer Hospital (KYLX202123). The studies were conducted in accordance with the local legislation and institutional requirements. The participants provided their written informed consent to participate in this study. Written informed consent was obtained from the individual(s) for the publication of any potentially identifiable images or data included in this article.
Author contributions
FY: Writing – original draft, Data curation, Resources. JF: Methodology, Writing – original draft, Data curation, Formal analysis, Resources. RY: Writing – review & editing, Conceptualization, Funding acquisition, Methodology, Supervision. YC: Conceptualization, Writing – review & editing, Funding acquisition, Methodology, Supervision.
Funding
The author(s) declare financial support was received for the research, authorship, and/or publication of this article. This work was supported by the National Natural Science Function China fund (No. 32070683) awarded to YC.
Acknowledgments
We would like to thank the Yuxi Rongjian Information Technology Company for providing cloud computing resources.
Conflict of interest
The authors declare that the research was conducted in the absence of any commercial or financial relationships that could be construed as a potential conflict of interest.
Publisher’s note
All claims expressed in this article are solely those of the authors and do not necessarily represent those of their affiliated organizations, or those of the publisher, the editors and the reviewers. Any product that may be evaluated in this article, or claim that may be made by its manufacturer, is not guaranteed or endorsed by the publisher.
Supplementary material
The Supplementary Material for this article can be found online at: https://www.frontiersin.org/articles/10.3389/fimmu.2024.1338162/full#supplementary-material
References
1. Temraz S, Charafeddine M, Mukherji D, Shamseddine A. Trends in lung cancer incidence in lebanon by gender and histological type over the period 2005-2008. J Epidemiol Glob Health. (2017) 7(3):161–7. doi: 10.1016/j.jegh.2017.04.003
2. Wang S, Zimmermann S, Parikh K, Mansfield AS, Adjei AA. Current diagnosis and management of small-cell lung cancer. Mayo Clin Proc. (2019) 94(8):1599–622. doi: 10.1016/j.mayocp.2019.01.034
3. George J, Lim JS, Jang SJ, Cun Y, Ozretic L, Kong G, et al. Comprehensive genomic profiles of small cell lung cancer. Nature. (2015) 524(7563):47–53. doi: 10.1038/nature14664
4. Cun Y, Yang TP, Achter V, Lang U, Peifer M. Copy-number analysis and inference of subclonal populations in cancer genomes using sclust. Nat Protoc. (2018) 13(6):1488–501. doi: 10.1038/nprot.2018.033
5. Yuan XG, Zhao Y, Guo Y, Ge LM, Liu W, Wen SY, et al. COSINE: A web server for clonal and subclonal structure inference and evolution in cancer genomics. Zool Res. (2022) 43(1):75–7. doi: 10.24272/j.issn.2095-8137.2021.250
6. Demedts IK, Vermaelen KY, van Meerbeeck JP. Treatment of extensive-stage small cell lung carcinoma: current status and future prospects. Eur Respir J. (2010) 35(1):202–15. doi: 10.1183/09031936.00105009
7. van Meerbeeck JP, Fennell DA, De Ruysscher DK. Small-cell lung cancer. Lancet. (2011) 378(9804):1741–55. doi: 10.1016/S0140-6736(11)60165-7
8. Waqar SN, Morgensztern D. Treatment advances in small cell lung cancer (SCLC). Pharmacol Ther. (2017) 180:16–23. doi: 10.1016/j.pharmthera.2017.06.002
9. Horn L, Mansfield AS, Szczesna A, Havel L, Krzakowski M, Hochmair MJ, et al. First-line atezolizumab plus chemotherapy in extensive-stage small-cell lung cancer. N Engl J Med. (2018) 379(23):2220–9. doi: 10.1056/NEJMoa1809064
10. Roskams-Hieter B, Kim HJ, Anur P, Wagner JT, Callahan R, Spiliotopoulos E, et al. Plasma cell-free RNA profiling distinguishes cancers from pre-malignant conditions in solid and hematologic malignancies. NPJ Precis Oncol. (2022) 6(1):28. doi: 10.1038/s41698-022-00270-y
11. Gay CM, Stewart CA, Park EM, Diao L, Groves SM, Heeke S, et al. Patterns of transcription factor programs and immune pathway activation define four major subtypes of SCLC with distinct therapeutic vulnerabilities. Cancer Cell. (2021) 39(3):346–360 e7. doi: 10.1016/j.ccell.2020.12.014
12. Zhang B, Horvath S. A general framework for weighted gene co-expression network analysis. Stat Appl Genet Mol Biol. (2005) 4:17. doi: 10.2202/1544-6115.1128
13. Ritchie ME, Phipson B, Wu D, Hu Y, Law CW, Shi W, et al. Limma powers differential expression analyses for RNA-sequencing and microarray studies. Nucleic Acids Res. (2015) 43(7):e47. doi: 10.1093/nar/gkv007
14. Bu D, Luo H, Huo P, Wang Z, Zhang S, He Z, et al. KOBAS-i: intelligent prioritization and exploratory visualization of biological functions for gene enrichment analysis. Nucleic Acids Res. (2021) 49(W1):W317–25. doi: 10.1093/nar/gkab447
15. Shannon P, Markiel A, Ozier O, Baliga NS, Wang JT, Ramage D, et al. Cytoscape: a software environment for integrated models of biomolecular interaction networks. Genome Res. (2003) 13(11):2498–504. doi: 10.1101/gr.1239303
16. Aran D, Hu Z, Butte AJ. xCell: digitally portraying the tissue cellular heterogeneity landscape. Genome Biol. (2017) 18(1):220. doi: 10.1186/s13059-017-1349-1
17. Yoshihara K, Shahmoradgoli M, Martinez E, Vegesna R, Kim H, Torres-Garcia W, et al. Inferring tumour purity and stromal and immune cell admixture from expression data. Nat Commun. (2013) 4:2612. doi: 10.1038/ncomms3612
18. Liu Y, Ji X, Liu Y, Li D, Cun Y, Zhang Y, et al. A d-peptide-based HIV gelatinous combination vaccine improves therapy in ART-delayed macaques of chronic infection. Nano Today. (2022) 42:101353. doi: 10.1016/j.nantod.2021.101353
19. Hanzelmann S, Castelo R, J. Guinney. GSVA. Gene set variation analysis for microarray and RNA-seq data. BMC Bioinf. (2013) 14:7. doi: 10.1186/1471-2105-14-7
20. Therneau T, Therneau T, Grambsch P. Modeling survival data: Extending the cox model (statistics for biology and health). (2000).
21. Kim KB, Kabra A, Kim DW, Xue Y, Huang Y, Hou PC, et al. KIX domain determines a selective tumor-promoting role for EP300 and its vulnerability in small cell lung cancer. Sci Adv. (2022) 8(7):eabl4618. doi: 10.1126/sciadv.abl4618
22. Zhang JP, Yan J, Xu J, Pang XH, Chen MS, Li L, et al. Increased intratumoral IL-17-producing cells correlate with poor survival in hepatocellular carcinoma patients. J Hepatol. (2009) 50(5):980–9. doi: 10.1016/j.jhep.2008.12.033
23. Wilke CM, Kryczek I, Wei S, Zhao E, Wu K, Wang G, et al. Th17 cells in cancer: help or hindrance? Carcinogenesis. (2011) 32(5):643–9. doi: 10.1093/carcin/bgr019
24. Chung AS, Wu X, Zhuang G, Ngu H, Kasman I, Zhang J, et al. An interleukin-17-mediated paracrine network promotes tumor resistance to anti-angiogenic therapy. Nat Med. (2013) 19(9):1114–23. doi: 10.1038/nm.3291
25. Liu J, Duan Y, Cheng X, Chen X, Xie W, Long H, et al. IL-17 is associated with poor prognosis and promotes angiogenesis via stimulating VEGF production of cancer cells in colorectal carcinoma. Biochem Biophys Res Commun. (2011) 407(2):348–54. doi: 10.1016/j.bbrc.2011.03.021
26. Ellis JM, Li LO, Wu PC, Koves TR, Ilkayeva O, Stevens RD, et al. Adipose acyl-CoA synthetase-1 directs fatty acids toward beta-oxidation and is required for cold thermogenesis. Cell Metab. (2010) 12(1):53–64. doi: 10.1016/j.cmet.2010.05.012
27. Shen Z, Gu L, Liu Y, Wang L, Zhu J, Tang S, et al. PLAA suppresses ovarian cancer metastasis via METTL3-mediated m(6)A modification of TRPC3 mRNA. Oncogene. (2022) 41(35):4145–58. doi: 10.1038/s41388-022-02411-w
28. Fan Y, Mao R, Yang. NF-kappaB J. And STAT3 signaling pathways collaboratively link inflammation to cancer. Protein Cell. (2013) 4(3):176–85. doi: 10.1007/s13238-013-2084-3
29. Brandsma CA, Hylkema MN, Geerlings M, van Geffen WH, Postma DS, Timens W, et al. Increased levels of (class switched) memory b cells in peripheral blood of current smokers. Respir Res. (2009) 10(1):108. doi: 10.1186/1465-9921-10-108
30. Melssen M, Slingluff CL Jr. Vaccines targeting helper t cells for cancer immunotherapy. Curr Opin Immunol. (2017) 47:85–92. doi: 10.1016/j.coi.2017.07.004
31. Castellino F, Germain RN. Cooperation between CD4+ and CD8+ t cells: when, where, and how. Annu Rev Immunol. (2006) 24:519–40. doi: 10.1146/annurev.immunol.23.021704.115825
32. Croft M, Siegel RM. Beyond TNF: TNF superfamily cytokines as targets for the treatment of rheumatic diseases. Nat Rev Rheumatol. (2017) 13(4):217–33. doi: 10.1038/nrrheum.2017.22
33. Yi F, Frazzette N, Cruz AC, Klebanoff CA, Siegel RM. Beyond cell death: New functions for TNF family cytokines in autoimmunity and tumor immunotherapy. Trends Mol Med. (2018) 24(7):642–53. doi: 10.1016/j.molmed.2018.05.004
34. Takada I, Hidano S, Takahashi S, Yanaka K, Ogawa H, Tsuchiya M, et al. Transcriptional coregulator Ess2 controls survival of post-thymic CD4(+) t cells through the myc and IL-7 signaling pathways. J Biol Chem. (2022) 298(9):102342. doi: 10.1016/j.jbc.2022.102342
35. Colak S, Ten Dijke P. Targeting TGF-beta signaling in cancer. Trends Cancer. (2017) 3(1):56–71. doi: 10.1016/j.trecan.2016.11.008
36. Zhang C, Dowd DR, Staal A, Gu C, Lian JB, van Wijnen AJ, et al. Nuclear coactivator-62 kDa/Ski-interacting protein is a nuclear matrix-associated coactivator that may couple vitamin d receptor-mediated transcription and RNA splicing. J Biol Chem. (2003) 278(37):35325–36. doi: 10.1074/jbc.M305191200
37. Villar V, Kocic J, Bugarski D, Jovcic G, Santibanez JF. SKIP is required for TGF-beta1-induced epithelial mesenchymal transition and migration in transformed keratinocytes. FEBS Lett. (2010) 584(22):4586–92. doi: 10.1016/j.febslet.2010.10.020
38. Wang J, Qian J, Hoeksema MD, Zou Y, Espinosa AV, Rahman SM, et al. Integrative genomics analysis identifies candidate drivers at 3q26-29 amplicon in squamous cell carcinoma of the lung. Clin Cancer Res. (2013) 19(20):5580–90. doi: 10.1158/1078-0432.CCR-13-0594
39. Kopan R, Ilagan MX. The canonical notch signaling pathway: unfolding the activation mechanism. Cell. (2009) 137(2):216–33. doi: 10.1016/j.cell.2009.03.045
40. Baluapuri A, Wolf E, Eilers M. Target gene-independent functions of MYC oncoproteins. Nat Rev Mol Cell Biol. (2020) 21(5):255–67. doi: 10.1038/s41580-020-0215-2
41. Pietanza MC, Byers LA, Minna JD, Rudin CM. Small cell lung cancer: will recent progress lead to improved outcomes? Clin Cancer Res. (2015) 21(10):2244–55. doi: 10.1158/1078-0432.CCR-14-2958
42. Wagner AH, Devarakonda S, Skidmore ZL, Krysiak K, Ramu A, Trani L, et al. Recurrent WNT pathway alterations are frequent in relapsed small cell lung cancer. Nat Commun. (2018) 9(1):3787. doi: 10.1038/s41467-018-06162-9
43. Zhang W, Girard L, Zhang YA, Haruki T, Papari-Zareei M, Stastny V, et al. Small cell lung cancer tumors and preclinical models display heterogeneity of neuroendocrine phenotypes. Transl Lung Cancer Res. (2018) 7(1):32–49. doi: 10.21037/tlcr.2018.02.02
44. Borromeo MD, Savage TK, Kollipara RK, He M, Augustyn A, Osborne JK, et al. ASCL1 and NEUROD1 reveal heterogeneity in pulmonary neuroendocrine tumors and regulate distinct genetic programs. Cell Rep. (2016) 16(5):1259–72. doi: 10.1016/j.celrep.2016.06.081
45. Rudin CM, Poirier JT, Byers LA, Dive C, Dowlati A, George J, et al. Molecular subtypes of small cell lung cancer: a synthesis of human and mouse model data. Nat Rev Cancer. (2019) 19(5):289–97. doi: 10.1038/s41568-019-0133-9
46. Nagy-Mignotte H, Shestaeva O, Vignoud L, Guillem P, Ruckly S, Chabre O, et al. Prognostic impact of paraneoplastic cushing's syndrome in small-cell lung cancer. J Thorac Oncol. (2014) 9(4):497–505. doi: 10.1097/JTO.0000000000000116
47. Ni J, Si X, Wang H, Zhang X, Zhang L. Camrelizumab plus platinum-irinotecan followed by maintenance camrelizumab plus apatinib in untreated extensive-stage small-cell lung cancer: a nonrandomized clinical trial. Front Immunol. (2023) 14:1168879. doi: 10.3389/fimmu.2023.1168879
48. Rudin CM, Awad MM, Navarro A, Gottfried M, Peters S, Csoszi T, et al. Pembrolizumab or placebo plus etoposide and platinum as first-line therapy for extensive-stage small-cell lung cancer: Randomized, double-blind, phase III KEYNOTE-604 study. J Clin Oncol. (2020) 38(21):2369–79. doi: 10.1200/JCO.20.00793
49. Best SA, Hess JB, Souza-Fonseca-Guimaraes F, Cursons J, Kersbergen A, Dong X, et al. Harnessing natural killer immunity in metastatic SCLC. J Thorac Oncol. (2020) 15(9):1507–21. doi: 10.1016/j.jtho.2020.05.008
50. Lin X, Deng J, Deng H, Yang Y, Sun N, Zhou M, et al. Comprehensive analysis of the immune microenvironment in checkpoint inhibitor pneumonitis. Front Immunol. (2021) 12:818492. doi: 10.3389/fimmu.2021.818492
51. Wu YH, Huang YF, Chang TH, Chou CY. Activation of TWIST1 by COL11A1 promotes chemoresistance and inhibits apoptosis in ovarian cancer cells by modulating NF-kappaB-mediated IKKbeta expression. Int J Cancer. (2017) 141(11):2305–17. doi: 10.1002/ijc.30932
52. Shen L, Yang M, Lin Q, Zhang Z, Zhu B, Miao C. COL11A1 is overexpressed in recurrent non-small cell lung cancer and promotes cell proliferation, migration, invasion and drug resistance. Oncol Rep. (2016) 36(2):877–85. doi: 10.3892/or.2016.4869
53. Leslie EM, Deeley RG, Cole SP. Toxicological relevance of the multidrug resistance protein 1, MRP1 (ABCC1) and related transporters. Toxicology. (2001) 167(1):3–23. doi: 10.1016/s0300-483x(01)00454-1
54. Peifer M, Fernandez-Cuesta L, Sos ML, George J, Seidel D, Kasper LH, et al. Integrative genome analyses identify key somatic driver mutations of small-cell lung cancer. Nat Genet. (2012) 44(10):1104–10. doi: 10.1038/ng.2396
55. Johnson BE, Russell E, Simmons AM, Phelps R, Steinberg SM, Ihde DC, et al. MYC family DNA amplification in 126 tumor cell lines from patients with small cell lung cancer. J Cell Biochem Suppl. (1996) 24:210–7. doi: 10.1002/jcb.240630516
56. Chen J, Guanizo AC, Jakasekara WSN, Inampudi C, Luong Q, Garama DJ, et al. MYC drives platinum resistant SCLC that is overcome by the dual PI3K-HDAC inhibitor fimepinostat. J Exp Clin Cancer Res. (2023) 42(1):100. doi: 10.1186/s13046-023-02678-1
57. Ehaideb SN, Iyengar A, Ueda A, Iacobucci GJ, Cranston C, Bassuk AG, et al. Prickle modulates microtubule polarity and axonal transport to ameliorate seizures in flies. Proc Natl Acad Sci USA. (2014) 111(30):11187–92. doi: 10.1073/pnas.1403357111
58. Hudson G, Keers S, Yu-Wai-Man P, Griffiths P, Huoponen K, Savontaus ML, et al. Identification of an x-chromosomal locus and haplotype modulating the phenotype of a mitochondrial DNA disorder. Am J Hum Genet. (2005) 77(6):1086–91. doi: 10.1086/498176
59. Shankar SP, Fingert JH, Carelli V, Valentino ML, King TM, Daiger SP, et al. Evidence for a novel x-linked modifier locus for leber hereditary optic neuropathy. Ophthalmic Genet. (2008) 29(1):17–24. doi: 10.1080/13816810701867607
Keywords: SCLC, chemotherapy resistance, primary resistance, acquired resistance, gene expression, network analysis
Citation: Yang F, Fan J, Yang R and Cun Y (2024) Integrative analysis of blood transcriptome profiles in small-cell lung cancer patients for identification of novel chemotherapy resistance-related biomarkers. Front. Immunol. 15:1338162. doi: 10.3389/fimmu.2024.1338162
Received: 14 November 2023; Accepted: 03 June 2024;
Published: 18 June 2024.
Edited by:
Melanie Kucherlapati, Harvard University, United StatesReviewed by:
Ivan Pourmir, Assistance Publique Hopitaux De Paris, FranceXiaorong Zhou, Nantong University, China
Copyright © 2024 Yang, Fan, Yang and Cun. This is an open-access article distributed under the terms of the Creative Commons Attribution License (CC BY). The use, distribution or reproduction in other forums is permitted, provided the original author(s) and the copyright owner(s) are credited and that the original publication in this journal is cited, in accordance with accepted academic practice. No use, distribution or reproduction is permitted which does not comply with these terms.
*Correspondence: Yupeng Cun, Y3VueXBAY3FtdS5lZHUuY24=; Ruixiang Yang, MTM4ODg4NzY3MjFAMTYzLmNvbQ==
†These authors have contributed equally to this work