 Laura Cuesta-López1†
 Alejandro Escudero-Contreras1†
 Yas Hanaee1,2†
 Carlos Pérez-Sánchez1,2,3
 Miriam Ruiz-Ponce1
 Julio Manuel Martínez-Moreno2Eva Pérez-Pampin4
 Antonio González4
 Chamaida Plasencia-Rodriguez5Ana Martínez-Feito5
 Alejandro Balsa5
 Clementina López-Medina1Lourdes Ladehesa-Pineda1Marta Rojas-Giménez1
 Rafaela Ortega-Castro1Jerusalem Calvo-Gutiérrez1
 Chary López-Pedrera1
 Eduardo Collantes-Estévez1
 Iván Arias-de la Rosa1*†
 Nuria Barbarroja1,2*†
- 1Rheumatology Service, Department of Medical and Surgical Sciences, Maimonides Institute for Research in Biomedicine of Cordoba (IMIBIC), Reina Sofia University Hospital, University of Cordoba, Córdoba, Spain
- 2Scientific department, Cobiomic Bioscience S.L, Cordoba, Spain
- 3Department of Cell Biology, Immunology and Physiology, Agrifood Campus of International Excellence, University of Córdoba, Córdoba, Spain
- 4Experimental and Observational Rheumatology and Rheumatology Unit, Instituto de Investigación Sanitaria - Hospital Clínico Universitario de Santiago (IDIS), Santiago de Compostela, Galicia, Spain
- 5Rheumatology Department, Instituto de Investigación Hospital Universitario La Paz (IdiPAZ) Institute for Health Research, La Paz University Hospital, Madrid, Spain
Introduction: RA patients are at higher risk of cardiovascular disease, influenced by therapies. Studying their cardiovascular and cardiometabolic proteome can unveil biomarkers and insights into related biological pathways.
Methods: This study included two cohorts of RA patients: newly diagnosed individuals (n=25) and those with established RA (disease duration >25 years, n=25). Both cohorts were age and sex-matched with a control group (n=25). Additionally, a longitudinal investigation was conducted on a cohort of 25 RA patients treated with methotrexate and another cohort of 25 RA patients treated with tofacitinib for 6 months. Clinical and analytical variables were recorded, and serum profiling of 184 proteins was performed using the Olink technology platform.
Results: RA patients exhibited elevated levels of 75 proteins that might be associated with cardiovascular disease. In addition, 24 proteins were increased in RA patients with established disease. Twenty proteins were commonly altered in both cohorts of RA patients. Among these, elevated levels of CTSL1, SORT1, SAA4, TNFRSF10A, ST6GAL1 and CCL18 discriminated RA patients and HDs with high specificity and sensitivity. Methotrexate treatment significantly reduced the levels of 13 proteins, while tofacitinib therapy modulated the expression of 10 proteins. These reductions were associated with a decrease in DAS28. Baseline levels of SAA4 and high levels of BNP were associated to the non-response to methotrexate. Changes in IL6 levels were specifically linked to the response to methotrexate. Regarding tofacitinib, differences in baseline levels of LOX1 and CNDP1 were noted between non-responder and responder RA patients. In addition, response to tofacitinib correlated with changes in SAA4 and TIMD4 levels.
Conclusion: In summary, this study pinpoints molecular changes linked to cardiovascular disease in RA and proposes candidate protein biomarkers for distinguishing RA patients from healthy individuals. It also highlights how methotrexate and tofacitinib impact these proteins, with distinct alterations corresponding to each drug’s response, identifying potential candidates, as SAA4, for the response to these therapies.
1 Introduction
Cardiovascular disease (CVD) has been identified as the primary contributor to premature mortality and sudden death among patients with rheumatoid arthritis (RA). This population has an incidence of CVD at least two times greater than the general population, with cardiovascular mortality being a major cause of death, accounting for 40-50% of RA-related deaths (1). This may be partly attributed to the high prevalence of traditional CVD risk factors (e.g., hypertension, hypercholesterolemia, type II diabetes mellitus, obesity) in conjunction with chronic systemic inflammation (1, 2). In this sense, the prevalence of metabolic syndrome in RA patients is significantly higher (around 30%) compared to the general population. Metabolic Syndrome has been linked to a three-fold increase in the risk of atherosclerotic cardiovascular disease (CVD) (3, 4). Our recent research investigated whether RA-associated inflammatory activity could explain the observed defects in glucose and lipid metabolism in these patients. Our results illustrate that alterations in glucose and lipid homeostasis associated with RA depend on the degree of inflammation, with adipose tissue inflammation identified as the initial target leading to insulin resistance and molecular alterations. Therefore, therapeutic strategies targeting tighter control of inflammation and flare-ups could normalize and/or prevent RA-associated metabolic alterations (5). Circulating proteins have been used as biomarkers of various pathologies for many years. Currently, different technologies are used to measure and analyze proteins in serum or plasma, but accurately measuring and interpreting the complete protein content in a large number of samples is a major challenge. To address this, the Olink Proximity Extension Assay (PEA) has been developed—an advanced, high-throughput method that analyzes up to 92 protein biomarkers with exceptional sensitivity and precision using oligonucleotide-labeled antibodies (6, 7). Despite this, there are still few studies that analyze the serum proteome in RA patients. Early diagnosis of RA is essential for the optimal treatment. According to EULAR recommendations, synthetic DMARDs such as methotrexate should be used as first-line treatment. When the first treatment fails, EULAR recommends that patients with risk factors for severe disease and a high inflammatory burden should receive biologic DMARDs. The introduction of biological therapies has significantly improved the management of RA, allowing for the reduction of symptoms, the prevention of rapid radiological deterioration, and an improvement in the quality of life. On the other hand, Tofacitinib is a targeted synthetic DMARD, reversible, competitive inhibitor that works by blocking the adenosine triphosphate (ATP) binding site in the catalytic cleft of JAK1, JAK2, JAK3 and TYK2 and it has been approved for the treatment of RA in many countries. It has been shown to reduce HAQDI and promote ACR20 responses in patients that had an inadequate response to conventional synthetic DMARDs or TNFα inhibitors. However, its efficacy in improving CV risk and reducing cardiovascular risk factors, including mediators of metabolic syndrome, is yet to be determined. This study aims to evaluate the changes in the cardiometabolic and cardiovascular serum proteome in two cohorts of active RA patients: newly diagnosed (naïve- treated) and those with well-established disease and to analyze the association with the clinical characteristics. Furthermore, the study analyses the modulation of the levels of these proteins by methotrexate and tofacitinib.
2 Materials and methods
2.1 Patients
A cross-sectional study was conducted on 50 patients with RA the from the Rheumatology Department of the Hospital Universitario Reina Sofia in Cordoba, the Hospital Universitario La Paz in Madrid and the Hospital Clínico Universitario de Santiago de Compostela in Santiago de Compostela, Spain. The patients fulfilled the American College Rheumatology 2010 criteria for RA and were divided in 2 independent cohorts: a cohort of 25 newly diagnosed RA patients (disease duration = 0 years) and a second cohort of 25 patients with established RA (disease duration > 20 years). None of the patients had a history of previous CV events (ischemic heart disease, stroke, peripheral arterial disease or heart failure). Additionally, 25 age- and -sex matched healthy donors (HDs) were included as a control group, none of which had a history of other autoimmune diseases or cardiovascular diseases/events. All recruited subjects provided written informed consent, which was specifically approved by the hospital ethics committee (ethics committee of the Reina Sofia Hospital, the University Clinical Hospital of Santiago de Compostela, and La Paz University Hospital). Demographic and clinical data were collected, including disease duration and DAS-28 (disease activity score 28), inflammation (CRP, mg/L), and levels of autoantibodies (rheumatoid factor and ACPAs). To assess disease activity, we computed the modified Disease Activity Score including a 28-joint count (DAS28), incorporating information on tender and swollen joints, the patient’s global assessment of disease activity on a visual analogue scale (VAS), and acute phase response. As we utilized CRP values (8), it will be subsequently referred to as DAS28-CRP. On the other hand, a longitudinal study was carried out in the 25 newly-diagnosed RA patients which were treated with methotrexate and the 25 RA patients with established disease that were treated with tofacitinib (5mg twice daily) in combination with conventional DMARDs, both according to the daily clinical practice for 6 months. Treatment response was determined after 6 months of treatment by the change in DAS28 (CRP) based on European Alliance of Associations for Rheumatology (EULAR) criteria (9). It considers that a patient has a good response to treatment when, having a DAS28 ≤3.2, it is reduced by at least 1.2. Moderate responders include three scenarios: patients who have a DAS28 ≤3.2 and the decrease in activity is between 0.6 and 1.2; those having a DAS28 >3.2 ≤ 5.1, the diminution is higher than 0.6; and those with a DAS28 >5.1 and a reduction higher than 1.2. The occurrence of cardiovascular events was recorded. At baseline and follow-up visits, peripheral blood samples were collected.
2.1.1 Measurements
2.1.1.1 Blood sample collection and isolation of serum
Peripheral venous blood samples were collected from RA patients before and after treatment and from HDs. Samples were collected early in the morning and after an 8-hour fasting period. The samples were centrifuged for 10 minutes at 3500 rpm and at room temperature to obtain the serum, which was then aliquoted and stored at -80°C until use.
2.1.1.2 Proximity extension assay
Serum samples from the baseline and follow-up visits were subjected to high-throughput analysis of 184 proteins, 92 of which were cardiometabolic-associated and 92 cardiovascular disease-related. This analysis was conducted using proximity extension immunoassay (PEA) provided by Olink Proteomics, Uppsala, Sweden, and was performed in a 96-well plate format by Cobiomic Bioscience S.L, Cordoba, Spain. The PEA is a dual-recognition immunoassay, that uses matched antibodies each of them labeled with unique DNA oligonucleotides, to simultaneously bind to a target protein in solution. This allows the two antibodies to converge and their DNA oligonucleotides to hybridize, serving as a template for a DNA polymerase-dependent extension step. This creates a double-stranded DNA “barcode” which is unique for the specific protein. The hybridization and extension are followed by PCR amplification. The resulting concentration of the PCR product is directly proportional to the initial concentration of the target protein. The relative levels of proteins were reported on an arbitrary Log2-based NPX (normalized protein expression) scale. The samples were completely randomized and distributed across two plates, maintaining the representation of groups/treatments in proportion to the study. Within each 96-plex panel, there are 96 assays, including four internal controls for quality control, systematically monitoring various stages of the process in every sample. Additionally, interplate controls are incorporated to compute normalized expression (NPX) values, along with negative controls and a duplicated external control. In the intensity normalization process, data were adjusted so that the median NPX for a protein on each plate aligned with the overall median. This ensured that each plate was adjusted to have the same median for all assays across the two plates, thereby enhancing the reliability and consistency of the analysis.
2.1.1.3 Statistical analysis
All data analyses were performed using SPSS statistical software package (Iberica, Madrid, Spain), GraphPad Prism9 (version 9.0.1) and MetaboAnalyst 5.0. Graphical representation of the statistical analysis is carried out using Prism9 (version 9.0.1) and MetaboAnalyst 5.0 software. Data in the text, figures and tables were expressed as the mean ± standard deviation (SD). Normality of variables was assessed using the Kolmogorov-Smirnov test. Clinical characteristics were compared using Student’s unpaired t-test for parametric data and the Mann-Whitney sum test for non-parametric data. Paired samples within the same subjects were compared using the paired Student’s t test. Correlations were assessed using Pearson correlation between variables. Chi-square tests were performed to analyze qualitative data. A volcano plot, featuring Benjamini-Hochberg adjusted false discovery rates, provided a nuanced visualization of the differential expression of 184 proteins across distinct study groups. Complementing this, Venn diagram was employed to discern the intersection of commonly altered proteins among the groups, shedding light on shared molecular signatures. To delve deeper into the differences among HDs, early RA, and established RA, an analysis of variance (ANOVA) was executed, with subsequent Bonferroni adjustments ensuring robustness in multiple comparisons in the commonly altered proteins. Receiver operating characteristic (ROC) curves, representing the true positive rate (sensitivity) versus false positive rate (1-specificity) at various thresholds, and area under the curve (AUC) analysis were used to determine sensitivity, specificity and corresponding cut-off values. Statistical significance levels were designated as follows: (****) <0.0001 p-value; (***) <0.001 p-value; (**) <0.01 p-value; (*) <0.05 p-value. This convention was applied in instances where specific p-values were not explicitly provided in the graphs.
3 Results
3.1 RA patients show an altered cardiometabolic and CVD profile: candidate biomarkers in human serum
RA patients with less than two years of disease duration (newly diagnosed RA) showed similar age, sex and disease activity compared to RA patients with stablished disease. In addition, RA patients with stablished disease showed a mean disease duration of 37.48 ± 11.79 years and significantly elevated levels of C-reactive protein compared to patients with newly diagnosed RA (Table 1). CVD risk factors were elevated in RA compared HDs.
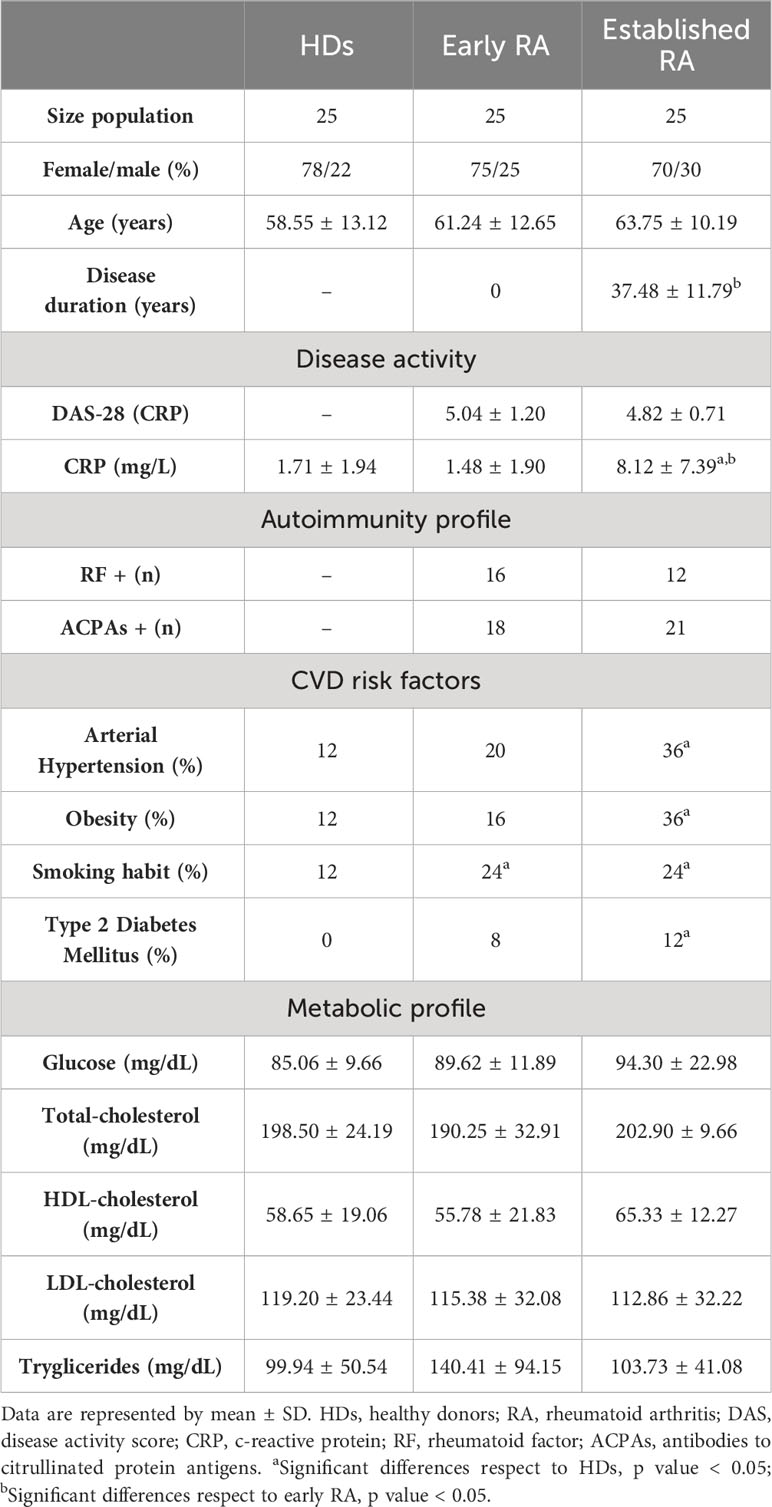
Table 1 Descriptive clinical data of Rheumatoid Arthritis patients and healthy donors.
To analyze the molecular profile that might be associated with CVD in RA patients, we evaluated the levels of 184 proteins related to cardiometabolism and CVD in the serum. Seventy-five proteins were significantly altered in early RA patients compared to HDs (Figure 1A) and 24 proteins were significantly increased in RA patients with established disease vs HDs (Figure 1B). In contrast, the comparison of the proteome profile between early and established disease revealed significant alterations in only 2 proteins (Figure 1C). The protein rankings based on FDR-adjusted p-values are depicted in Figure 1D. Additionally, a Venn diagram was utilized to identify commonly altered proteins in both early RA and established RA compared to HDs, revealing 20 proteins that were consistently affected in both conditions (Figure 1E). The altered levels of these proteins did not correlate with autoantibodies titers or positivity. We conducted an enrichment analysis to elucidate whether the identified proteins contribute to specific pathways beyond their recognized cardiovascular implications using STRING platform, particularly in the shared alteration pattern observed in both early and established RA disease (Figure 1F). The enrichment analysis revealed a significant protein-protein interaction enrichment (p-value: 2.93e-07), underscoring the biological relevance of the identified protein alterations. These proteins were found to play pivotal roles in diverse processes, including the regulation of tissue remodeling, complement and coagulation cascades, and the formation of protein-lipid complexes. Moreover, their implication in pathways directly associated with RA pathology was evident. Notably, these proteins exhibited interactions in viral protein networks and demonstrated associations with various cellular components, such as the endoplasmic reticulum lumen, extracellular exosome, extracellular region, and cell periphery.
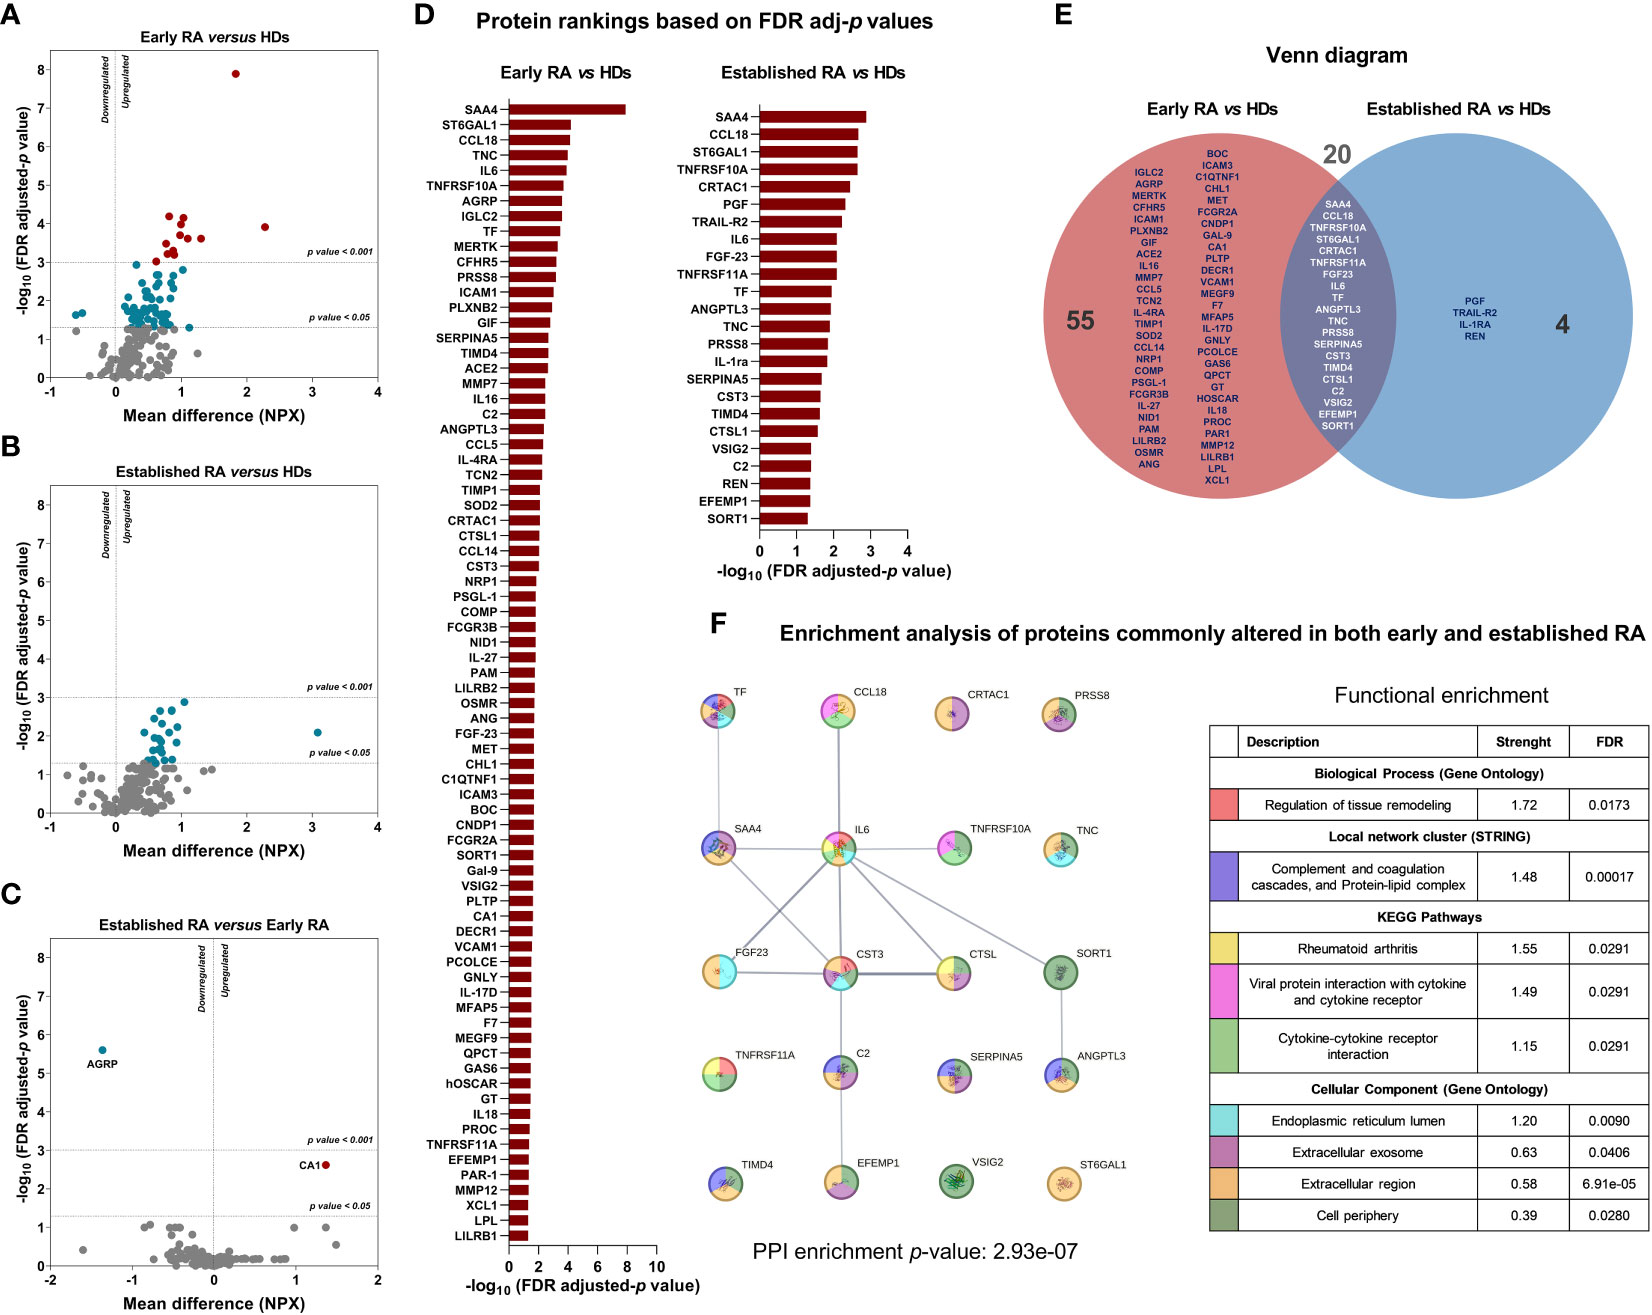
Figure 1 CVD and cardiometabolic serum proteome profile of RA patients in early and established disease. (A) Volcano plot of CVD and cardiometabolic proteome profile (184 proteins) in early RA (n=25) respect to HDs (n=25). (B) Volcano plot of CVD and cardiometabolic proteome profile (184 proteins) in established RA (n=25) respect to HDs (n=25). (C) Volcano plot of CVD and cardiometabolic proteome profile (184 proteins) in established RA (n=25) respect to early RA (n=25). (D) Significant protein rankings based on FDR adjusted p-values in early RA and established RA compared to HDs. (E) Venn diagram illustrating the proteins commonly altered in both early RA and established RA in comparison to HDs. (F) Enrichment analysis of proteins commonly altered in both early and established RA using STRING platform (version 12.0, STRING CONSORTIUM 2023). CVD, cardiovascular disease; RA, rheumatoid arthritis, HDs, healthy donors. Annotated names of abbreviated proteins are displayed in Supplementary Table 1.
Notable proteins in the shared alteration (early and established RA conditions) included SAA4, CCL18, TNFRSF10A, ST6GAL1, CRTAC1, TNFRSF11A, FGF23, IL6, TF, ANGPTL3, TNC, PRSS8, SERPINA5, CST3, TIMD4, CTSL1, C2, VSIG2, EFEMP1 and SORT1 (Supplementary Figure 1). Interestingly, elevated levels of CTSL-1 (AUC=0.907), SORT1 (AUC=0.899), SAA-4 (AUC = 0.898), TNFRSF10A (AUC=0.891), ST6GAL1 (AUC=0.855) and CCL18 (AUC=0.854) discriminate RA patients and HDs with high specificity and sensitivity, suggesting the potential role of these proteins to diagnose RA patients. Of note, the combination of all these six proteins could be used as candidate diagnostic biomarkers tool for RA with AUC of 0.970 (Figure 2A). In contrast, we compared the levels of autoantibodies and CRP with the combined proteome to assess these new molecular concepts against the standard criteria for the diagnosis of RA. Hence, ROC analysis demonstrated that elevated levels of RF (AUC=0.915) and ACPAs (AUC=0.845) can effectively discriminate RA patients from HDs. In contrast, levels of CRP (AUC=0.572) did not reach statistical significance (Figure 2B). Notably, the combined serum proteome profile of CTSL-1, SORT1, SAA4, TNFRSF10A, ST6GAL1, and CCL18 exhibited better ROC curve for distinguishing patients from HDs compared to the combination of ACPAS, RF and CRP (Figures 2B, C).
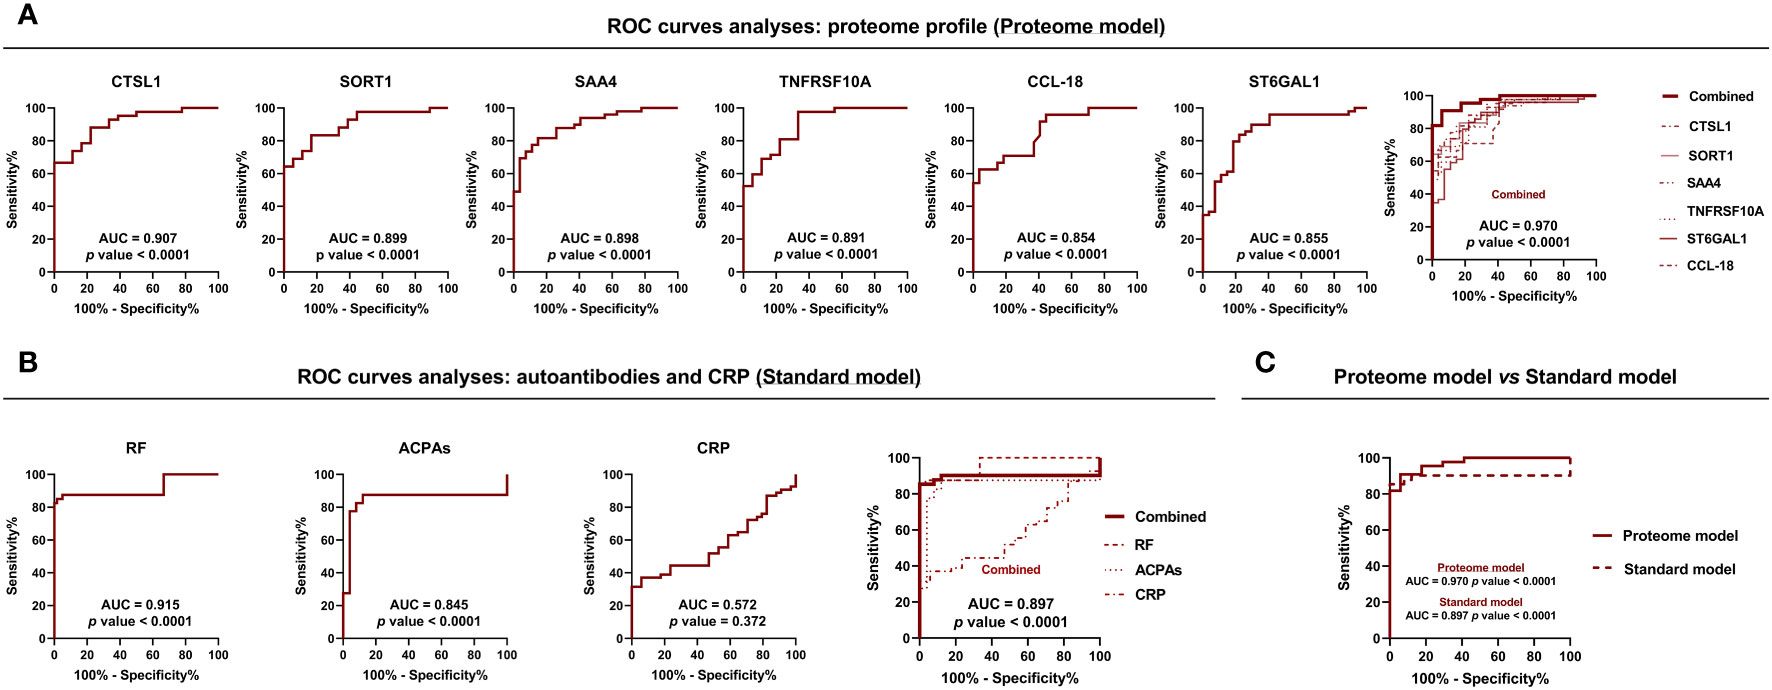
Figure 2 Prospective serum biomarkers with diagnostic potential in RA. (A) ROC curve analysis of proteins significantly altered in both early and established disease in the whole cohort of RA patients with the best capacity to identify RA (n=50) vs HDs (n=25) (Proteome model). (B) ROC curve analysis of commonly used diagnostic markers for RA, such as ACPAs, RF, and CRP (n=50) vs HDs (n=25) (Standard model). (C) Comparison of the ability to differentiate between RA patients and HDs using proteomic and standard models. RA, rheumatoid arthritis; HDs, healthy donors; ACPAs, antibodies to citrullinated protein antigens; RF, rheumatoid factor; CRP, C-reactive protein; ROC, receiver operating characteristic; AUC, area under the curve. Annotated names of abbreviated proteins (Supplementary Table 1).
3.2 Effects of methotrexate and tofacitinib on the cardiometabolic and CVD-proteome
We conducted a longitudinal study involving 50 RA patients treated with methotrexate or tofacitinib for six months to analyze the impact of these therapies on the proteome related to cardiometabolism and CVD. After six months of treatment, disease activity and CRP levels decreased with both therapies (Table 2). The group treated with methotrexate (early RA) had an 80% ratio of responders according to EULAR response criteria, while the group treated with tofacitinib (established RA) had a 72% responder ratio (Table 2). No CVD events were observed during the six-month treatment period with either methotrexate or tofacitinib.
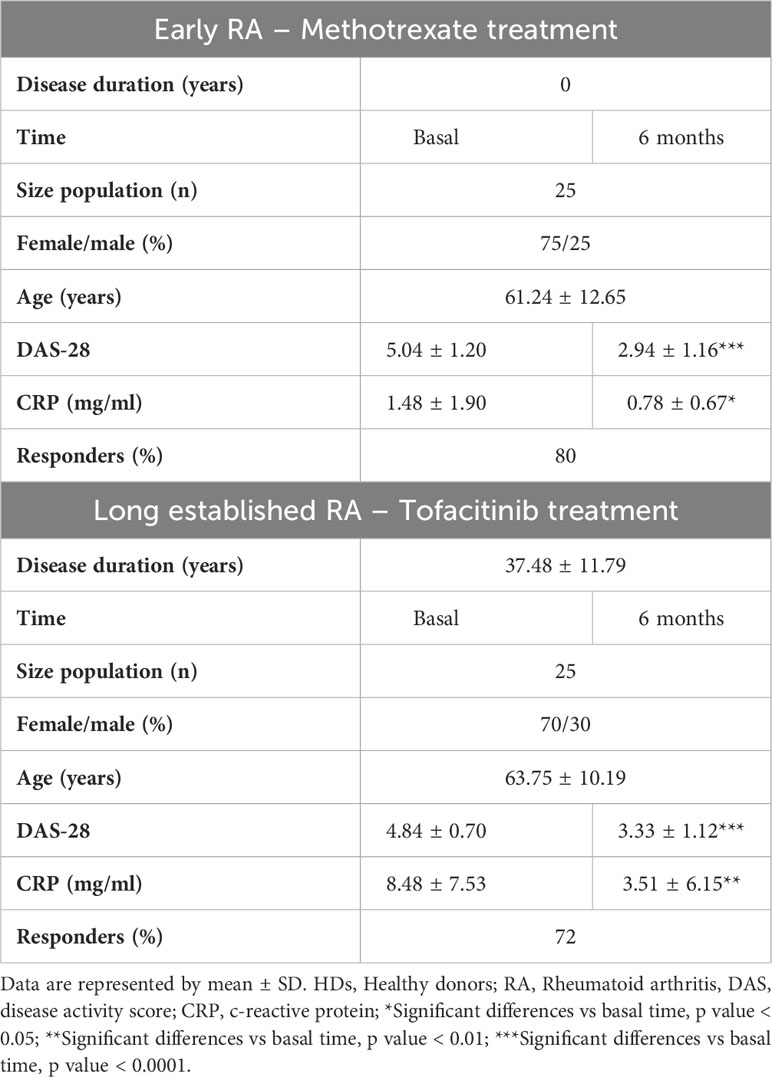
Table 2 Longitudinal study of early and established Rheumatoid Arthritis patients treated with methotrexate or tofacitinib: clinical details.
We then examined the impact of treatments on cardiometabolic and CVD-related proteins that were significantly elevated in the serum of RA patients (described in section 3.1). Methotrexate treatment resulted in a significant reduction of the levels of 13 proteins, including SAA4, ST6GAL1, TNC, NID1, SORT1, TNFRSF10A, IL6, CCL18, IGLC2, TIMD4, CFHR5, IL16 and PSGL-1 (Figure 3A). On the other hand, tofacitinib significantly reduced the levels of 8 proteins including CA1, TNC, SAA4, CCL18, TIMD4, IL16, IL6 and IL18, and increased levels of 2 proteins such as LPL and MMP12 (Figure 3B). Following this, we aimed to gauge the physiological significance of the alterations in protein levels resulting from distinct treatments (methotrexate and tofacitinib). We conducted a comparison of protein levels at the 6-month mark in RA patients to ascertain whether they significantly differed from or mirrored the protein levels in healthy individuals. Among the 13 proteins that were reduced by methotrexate, levels of TIMD4, CFHR5, PSGL-1, IL16 and NID1 were restored at levels seen in HDs (Figure 4A). When comparing the levels of proteins influenced by tofacitinib to those in healthy individuals, we detected significant differences in two proteins. In contrast, eight proteins reached levels resembling those observed in healthy individuals (Figure 4B), underscoring the potential of tofacitinib to revert the observed alterations in established RA patients.
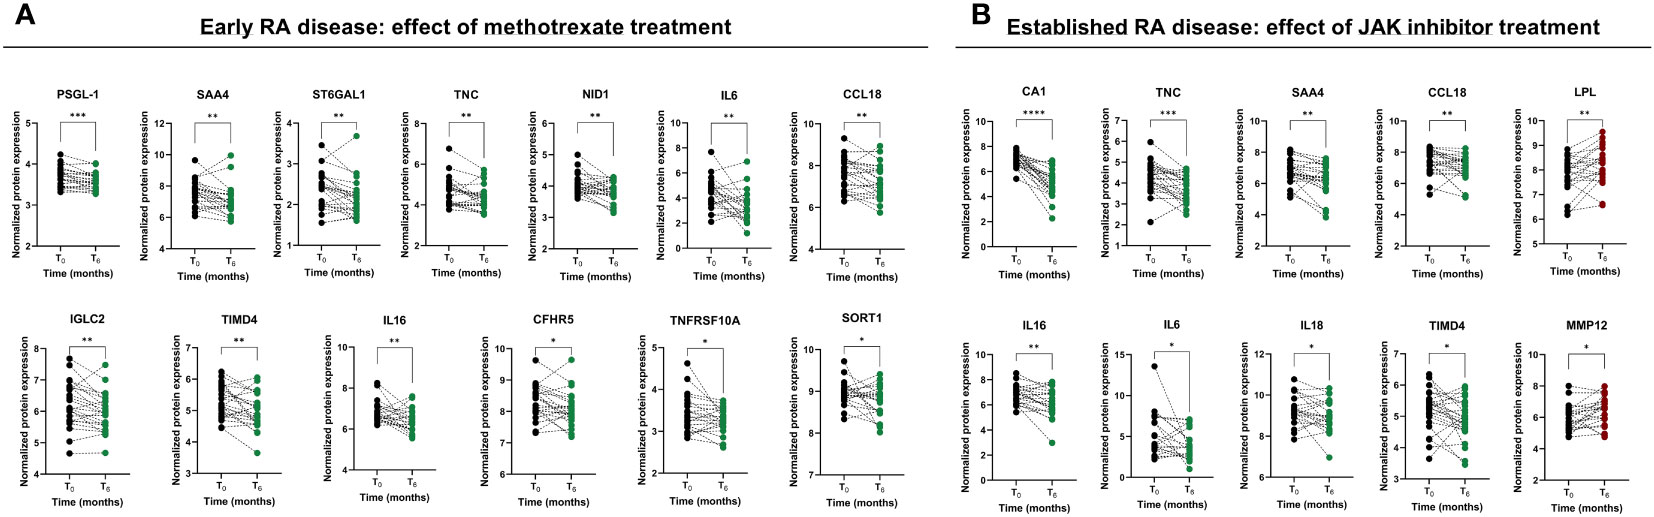
Figure 3 Effect of methotrexate and JAK inhibitor treatments on the serum proteome profile in early and established RA patients, respectively. (A) CVD and cardiometabolic-related proteins modulated by the treatment with methotrexate after six months in early RA. (B) CVD and cardiometabolic-related proteins modulated by the treatment with methotrexate after six months in established RA. RA, rheumatoid arthritis; CVD, cardiovascular disease; ROC, receiver operating characteristic. Annotated names of abbreviated proteins (Supplementary Table 1). Graphs of symbols and lines represent levels of analyzed proteins before and after the treatments. Statistical significance levels were designated as follows: (****) <0.0001 p-value; (***) <0.001 p-value; (**) <0.01 p-value; (*) <0.05 p-value.
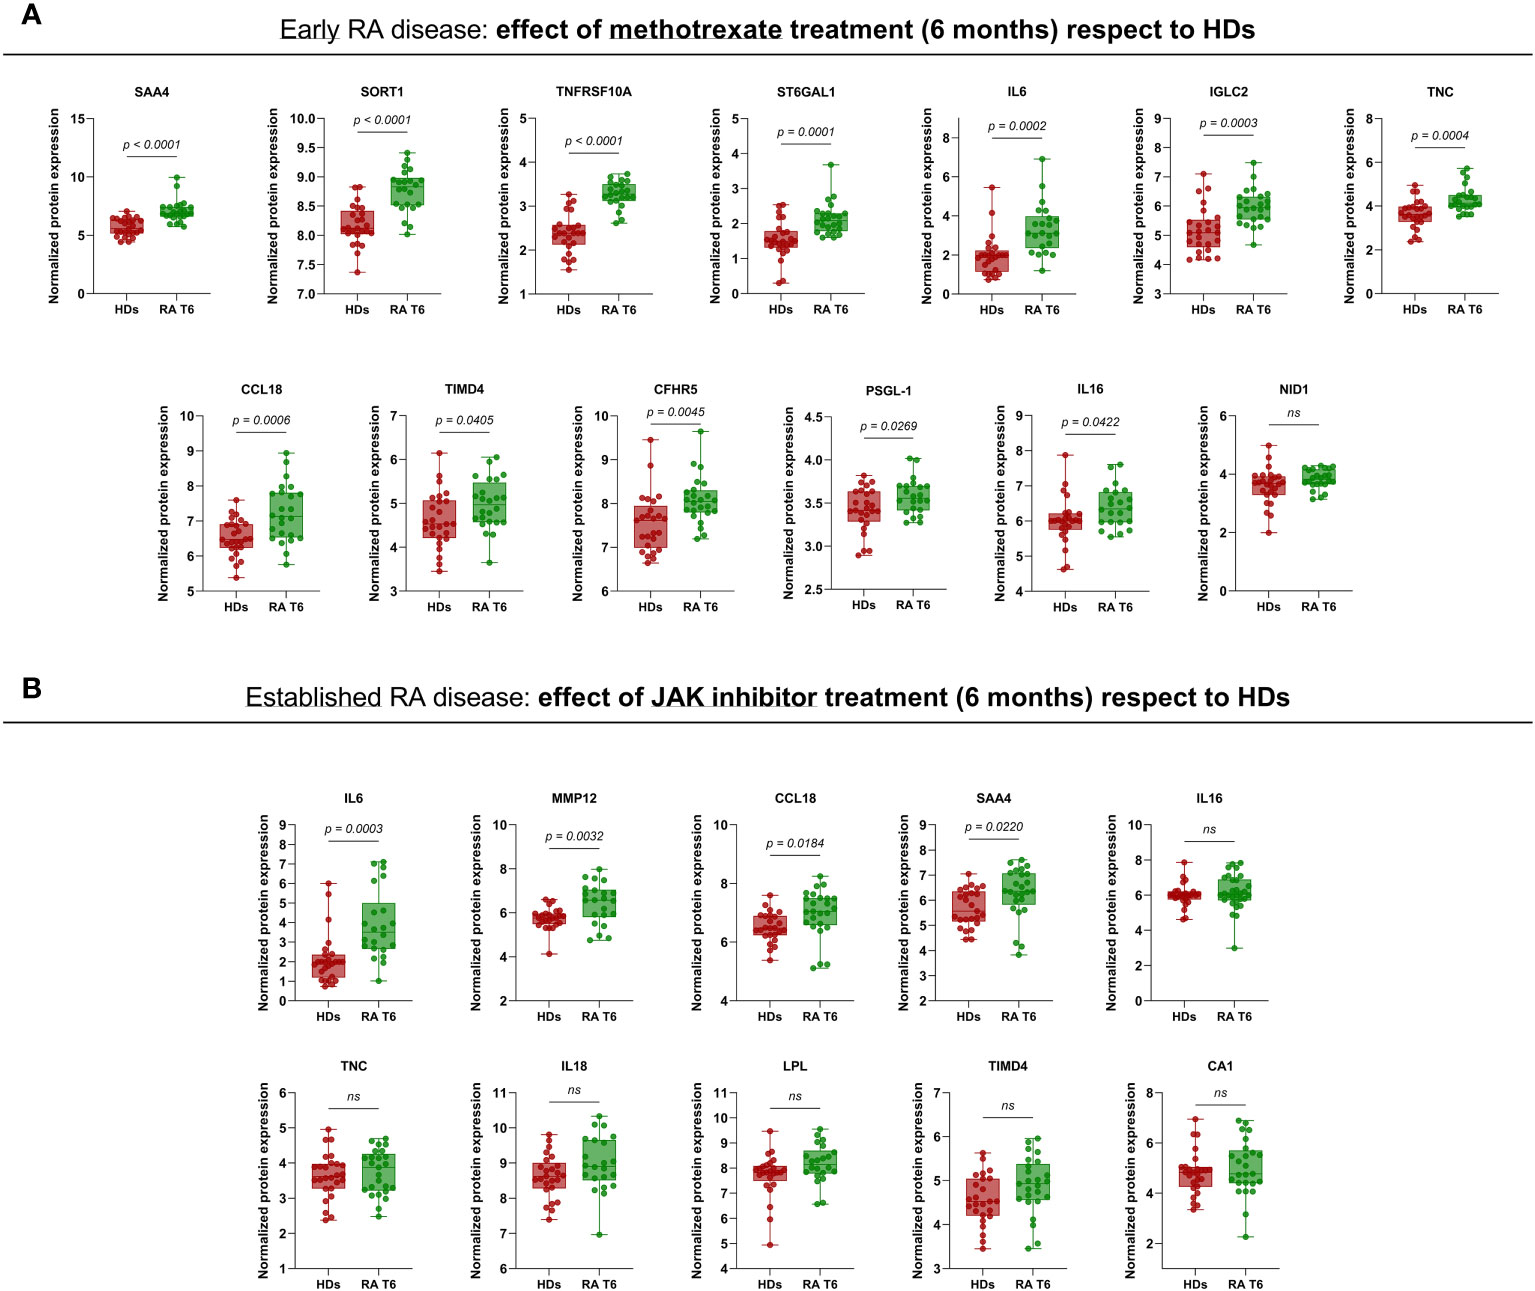
Figure 4 Comparison of serum protein levels at 6 months with levels in healthy individuals. (A) Levels of proteins influenced by methotrexate in early RA patients compared to serum levels in healthy individuals. (B) Levels of proteins influenced by tofacitinib in established RA patients compared to serum levels in healthy individuals. RA, rheumatoid arthritis; RA T6, rheumatoid arthritis time 6 months; HDs, healthy donors; JAK, janus kinase. Annotated names of abbreviated proteins (Supplementary Table 1). Box and whiskers plots represent median and minimum and maximum values of analyzed proteins. The adjusted p-values are presented using the Benjamini-Hochberg procedure.
Moreover, we investigated the potential association between baseline protein levels or alterations during methotrexate treatment and the response to therapy. Intriguingly, elevated levels of SAA4 and reduced levels of BNP at the treatment’s onset were associated with a positive treatment response (Figure 5A). Conversely, changes in the levels of IL6, TIMD4, CCL18, CFHR5, and TNC following methotrexate treatment were identified as linked to alterations in DAS28, indicating their association with disease activity (Figure 5B). Notably, changes in IL6 levels were specifically linked to the response to methotrexate, with RA responder patients displaying significantly decreased IL6 levels post-treatment compared to non-responder patients. The changes in IL6 levels demonstrated the potential to discriminate between responder and non-responder patients, achieving an AUC of 0.877 (Figure 5C). Upon transitioning to tofacitinib treatment, discernible differences in baseline levels of LOX1 and CNDP1 were noted between non-responder and responder RA patients (Figure 5D). Subsequent analyses revealed that changes in the levels of IL16, CCL18, TIMD4, SAA4, and TNC significantly correlated with alterations in DAS28 (Figure 5E), implying their association with disease activity. Thus, decreased levels of SAA4 or TIMD4 were found in RA responder patients compared to the non-responder group (Figure 5F). Annotated names of abbreviated proteins are stated in Supplementary Table 1.
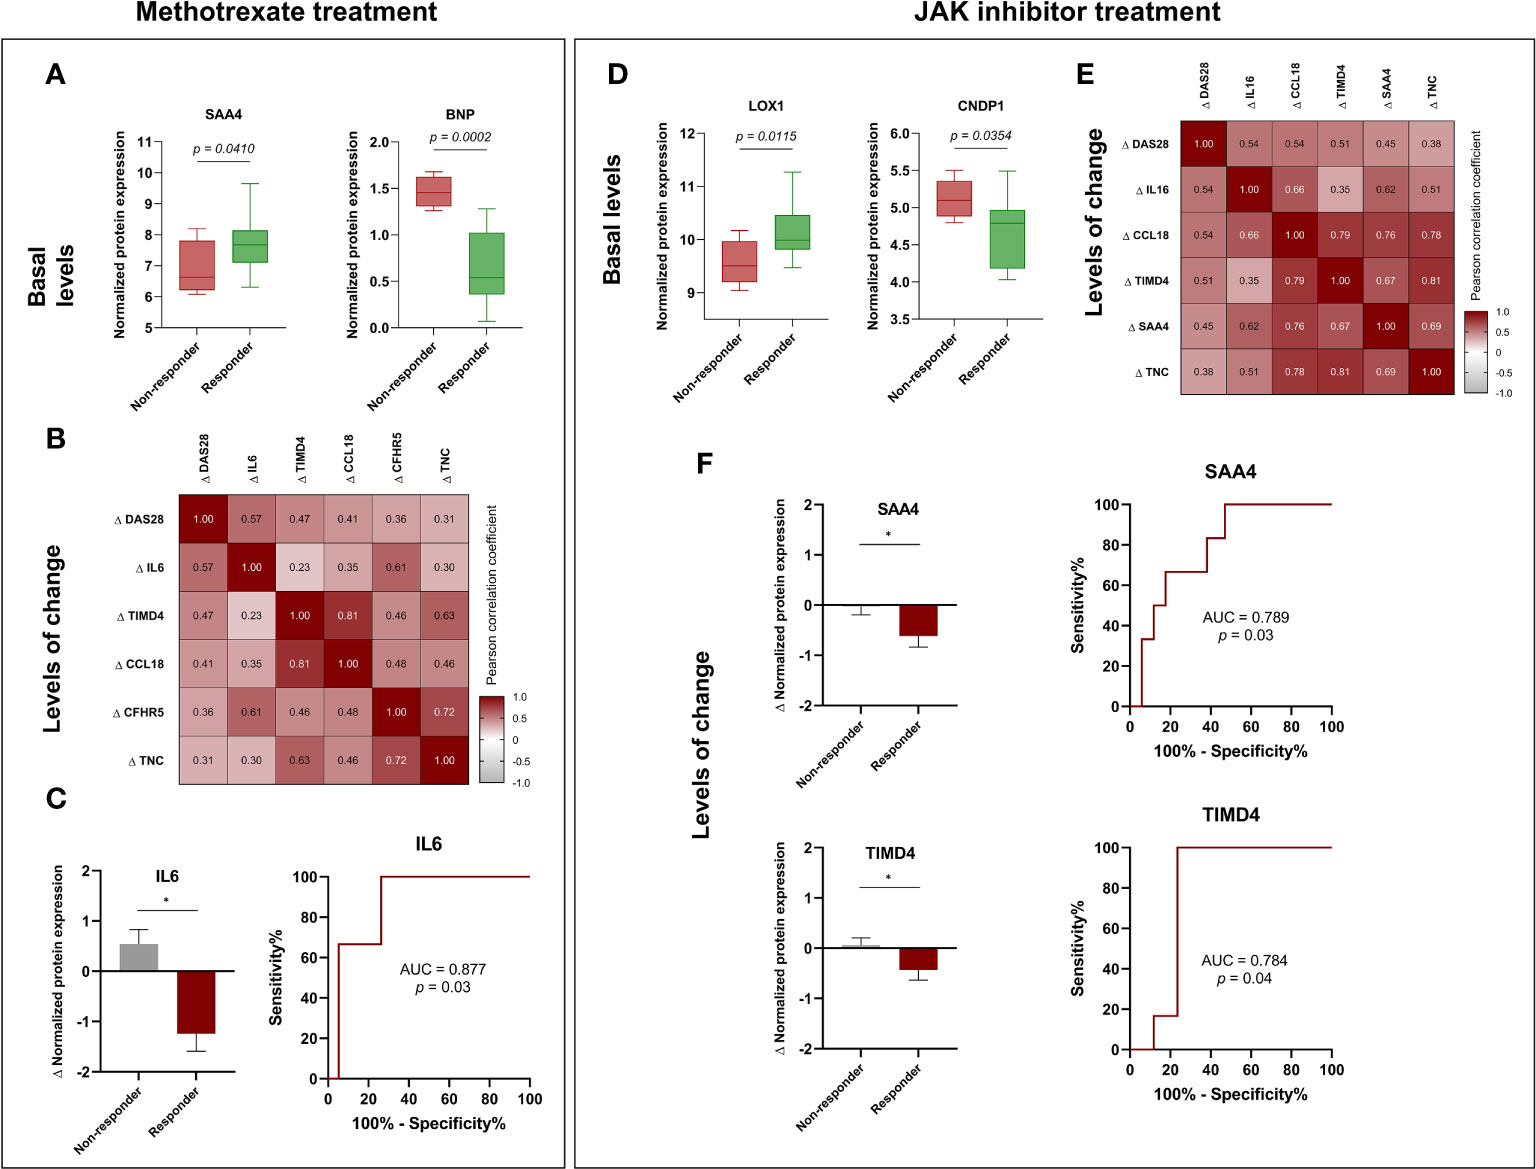
Figure 5 Potential biomarkers for predicting response to methotrexate in early RA and JAK inhibitor treatment in established RA. (A) Baseline levels of SAA4 and BNP in methotrexate-treated patients: a comparison between responders and non-responders. (B) Correlation heatmap of changes in DAS28 and proteins after six months of treatment with methotrexate. (C) Comparison of changes (Δ) in IL6 levels in responders and non-responders RA patients and ROC curve of changes in IL6 levels to discriminate responders or non-responders RA patients after six months of treatment with methotrexate. (D) Baseline levels of LOX1 and CNDP1 in JAK inhibitor-treated patients: a comparison between responders and non-responders. (E) Correlation heatmap of changes (Δ) in DAS28 and proteins after six months of treatment with JAK inhibitor. (F) Comparison of changes (Δ) in SAA4 and TIMD4 levels in responders and non-responders RA patients after the treatment with JAK inhibitor and ROC curve analyses. RA, rheumatoid arthritis; ROC, receiver operating characteristic. Annotated names of abbreviated proteins (Supplementary Table 1). Box and whiskers plots represent median and minimum and maximum values of basal proteins. Correlation heatmap represent significant correlations between disease activity and proteins. Numbers in correlation heatmaps include Pearson correlation coefficient (r). Bar graphs represent mean with standard deviation (error bars). *Significant differences: p<0.05. The adjusted p-values for the box plots did not demonstrate statistical significance, except in the case of the BNP protein, where the adjusted p-value was 0.037.
4 Discussion
This study describes molecular alterations that might be associated to cardiometabolic and cardiovascular disease in the serum of RA patients, using a high-throughput proteomic technology to analyze the serum levels of 184 proteins (Figure 6). Our work identifies novel potential candidate biomarkers of RA diagnosis and therapeutic targets including CTSL-1, SORT1, SAA-4, TNFRSF10A, ST6GAL1 and CCL18, in two different cohort of RA patients. Additionally, it is showed how methotrexate or JAK-inhibitor can modulate these protein alterations and detects biomarkers of response to each therapy. With the use of the PEA technology, we were able to directly analyze a substantial number of proteins that has been described to be involved in cardiovascular and cardiometabolic diseases in the serum of patients with RA. We found 75 proteins significantly altered in the serum of RA patients with early disease, 20 of them were also elevated in RA patients with established disease. These findings may suggest an association of RA with a modification of the molecular profile that might be related to CVD, which appears elevated in patients recently diagnosed and persisted over an extended period of evolution. In a previous study conducted by Ferreira and colleagues, a panel of 92 proteins related to cardiovascular disease (Olink proteomics) was assessed in RA patients who had been suffering from the disease for a long period of time and 6.8% of them had heart failure (HF) diagnosis. They identified some biomarkers that were associated with HF (10). Interestingly, some of those proteins increased in patients with HF were also increased in our cohort of RA patients, especially in the cohort of established disease, such as PGF, TNFRSF10A, SPON-2, TF and PRSS8. In our work, we discovered six proteins that exhibit promising potential as biomarkers for the differentiation of individuals with RA from HDs. Specifically, proteins exhibiting alterations in two distinct cohorts of RA patients with both early and established disease, including CTSL-1, SORT1, SAA4, TNFRSF10A, ST6GAL1 and CCL-18. It is noteworthy that the combined use of these six proteins resulted in an improved area under the curve (AUC) of 0.97. In addition, this combined proteome signature exhibited better AUC compared to the performance of stablished biomarkers of RA, such as ACPAs, RF and CRP alone and combined. The data presented herein corroborates recent findings indicating that SAA-4 may serve as a promising serum biomarker for the diagnosis of RA, including cases of seronegative presentation (11–13). ST6GAL1 is a pivotal sialyltransferase enzyme responsible for catalyzing the addition of α2,6-linked sialic acids to glycans’ termini. Glycosylation with sialic acid is a notable modification for IgGs. This glycosylation process has been acknowledged for its immunoregulatory impact on various immune cells, including stem cells, B cells, T cells, and macrophages (14). While ST6GAL1 is responsible for adding sialic acid to glycoproteins, the overall sialylation of IgG has been shown reduced in RA patients (15). The elevated levels of ST6GAL1 that we found in the serum of RA patients might be associated with increased inflammatory responses. The reduction in sialylated IgG could be due to several factors independent on the levels of ST6GAL1, such as increased turnover or degradation of sialylated IgG, altered glycosylation patterns driven by other enzymes, or changes in the microenvironment that affect the glycosylation process. In addition, we measured levels of protein, not enzyme activation. Thus, the elevation of ST6GAL1 levels in the serum of RA patients and the reduction in sialylated IgG may be part of the complex molecular and cellular changes associated with RA. Further research is needed to elucidate the precise mechanisms and functional consequences of these alterations.
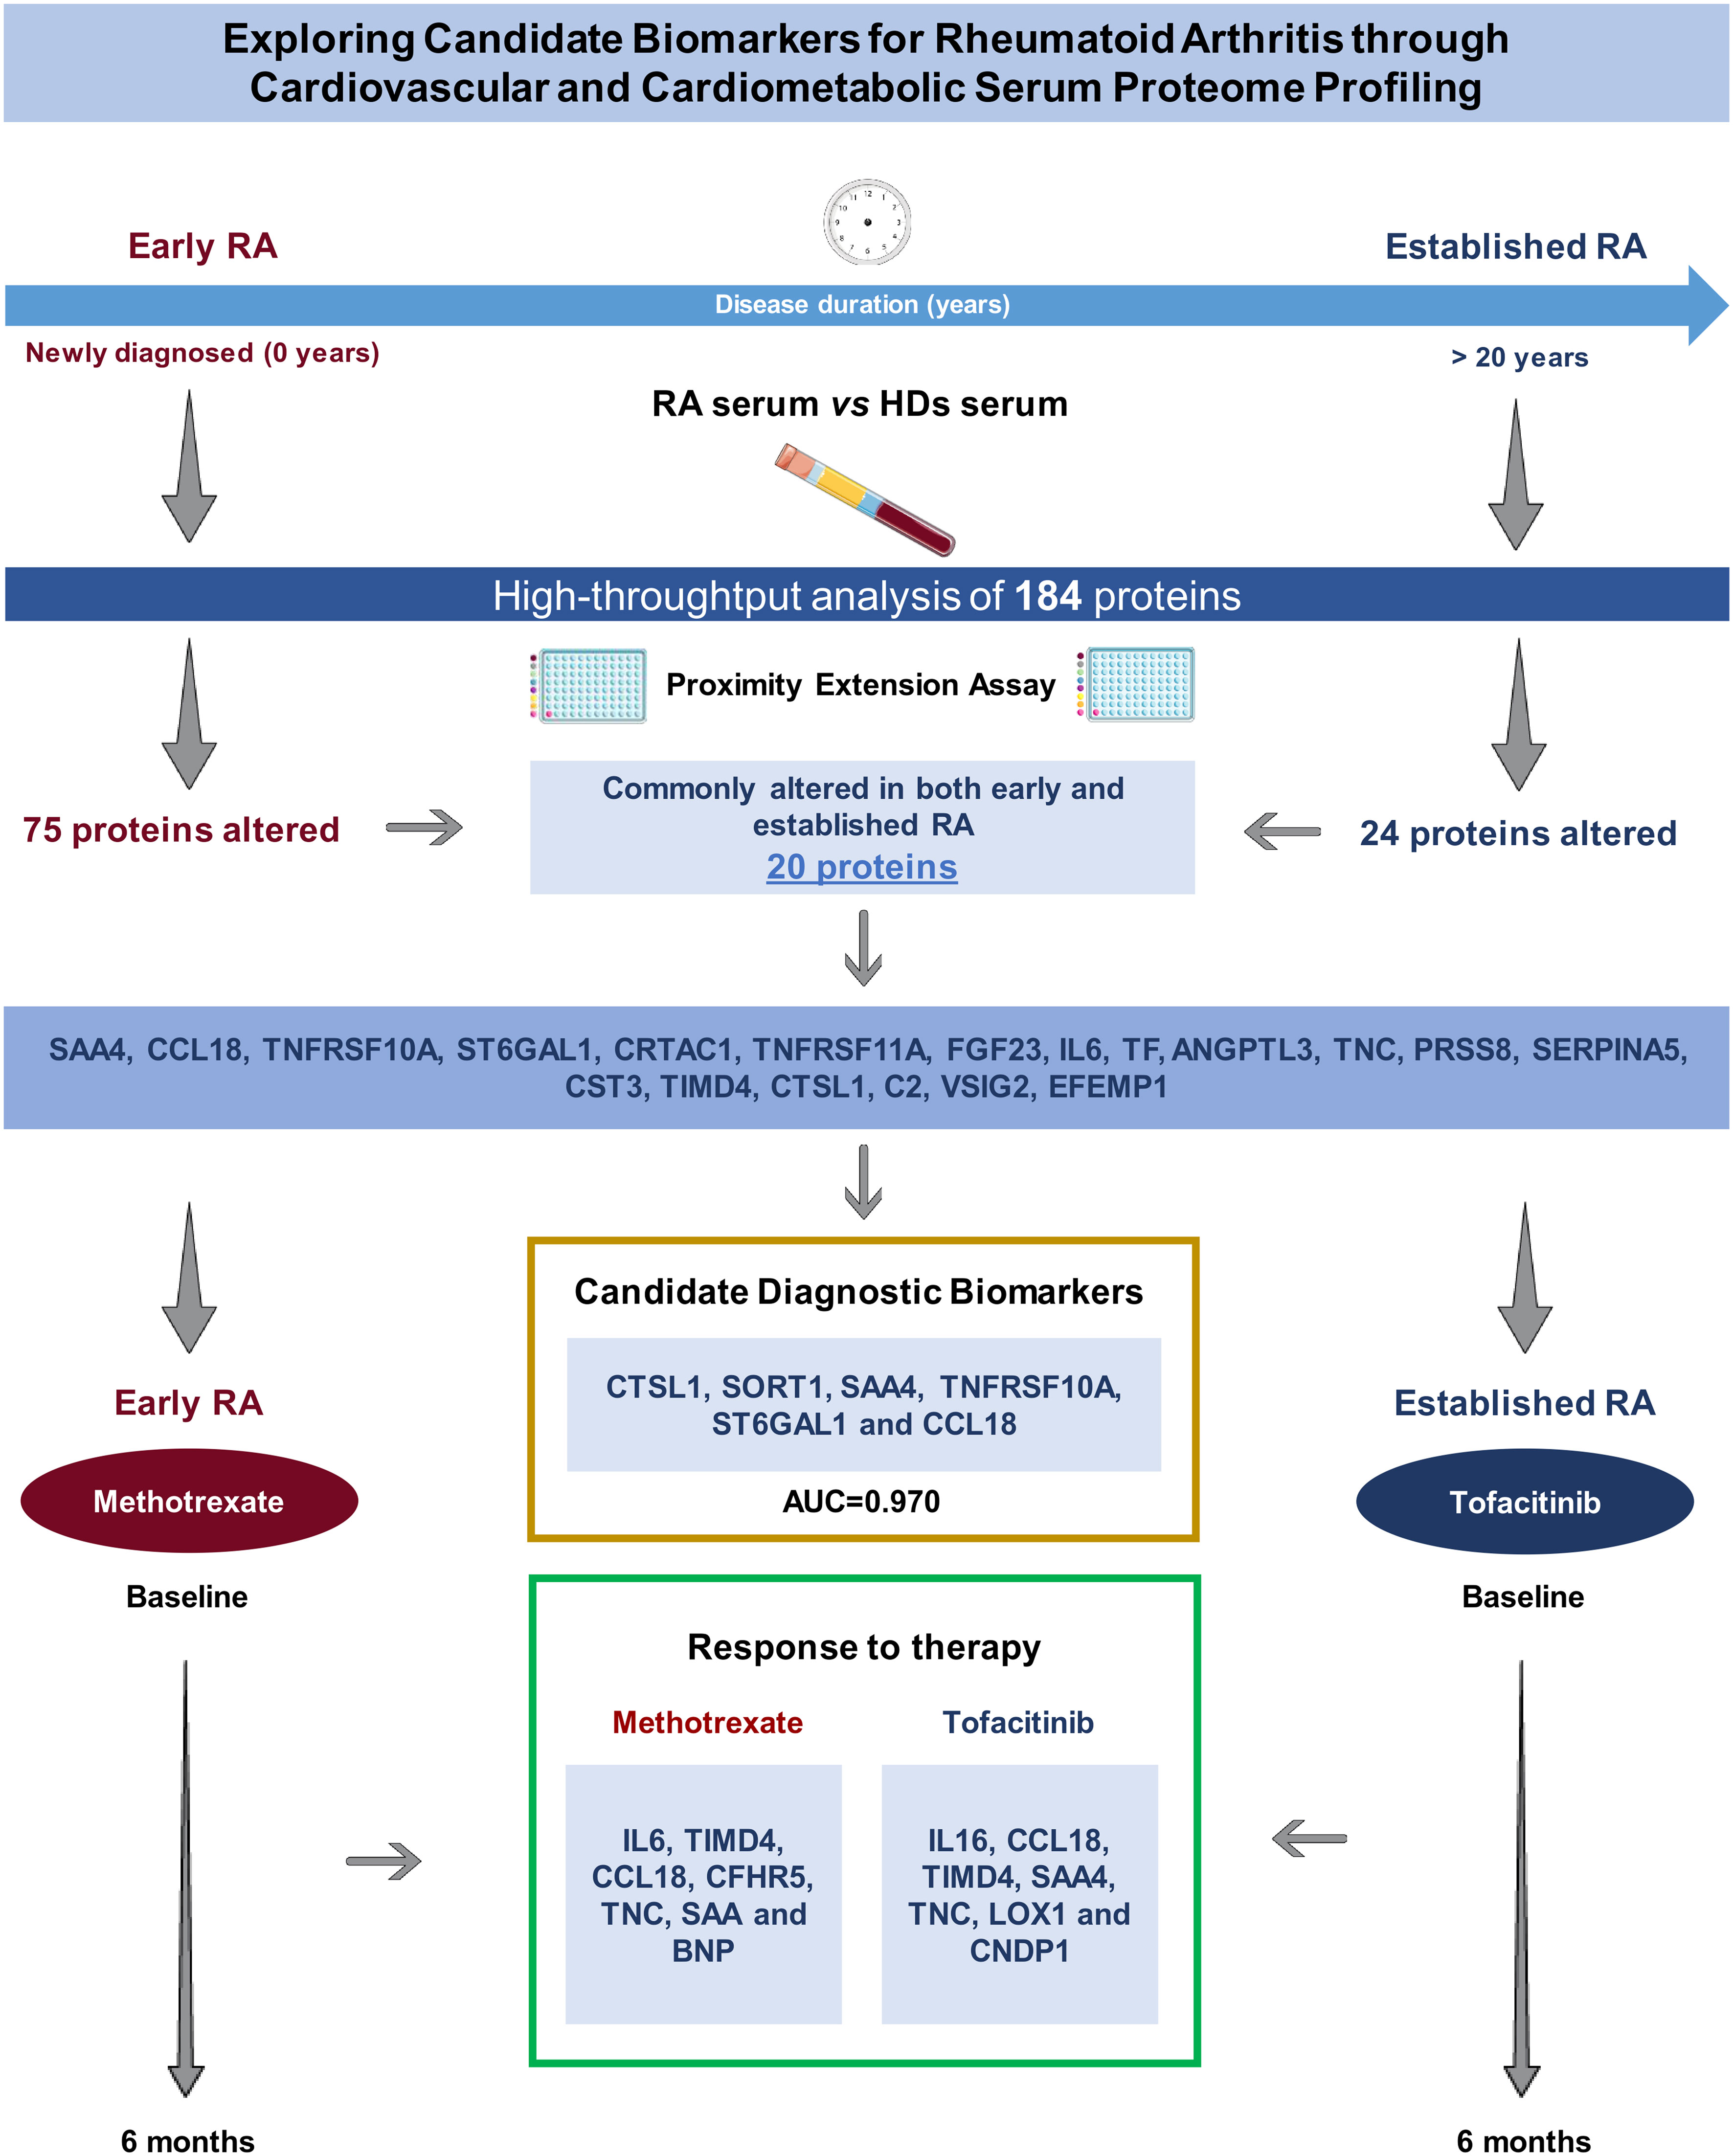
Figure 6 Study summary: A high-throughput analysis of 184 proteins across diverse stages of RA (early and established disease) uncovered a consistently altered pattern, indicating potential diagnostic biomarkers, including CTSL1, SORT1, SAA4, TNFRSF10A, ST6GAL1, and CCL18. Methotrexate was administered to early RA patients, while tofacitinib was employed for established RA cases. Post a 6-month treatment period, the levels of proteins exhibiting alterations in both early and established RA were modulated, pinpointing susceptible proteins that may serve as candidate biomarkers indicative of the response to therapy. Annotated names of abbreviated proteins (Supplementary Table 1). RA, rheumatoid arthritis; HDs, healthy donors; AUC, area under the curve.
The role of CCL18 in the pathogenesis of RA was investigated some time ago, with studies demonstrating a substantial elevation in the serum levels of this protein among RA patients in comparison with HDs. Moreover, these studies also revealed a positive correlation between the levels of CCL18 and the activity of the disease (16).
TNFRSF10A, also known as TRAIL-R1, presents a complex role in the context of RA synovial fibroblasts, exhibiting dual effects. While it is acknowledged for inducing apoptosis through caspase activation upon TRAIL ligand binding (17), its interaction with other receptors, including TNFRSF10A/TRAIL-R1, can activate NFκB, a transcription factor regulating cell proliferation (18). Morel et al. reported TRAIL’s ability to stimulate RA fibroblast proliferation in vitro via MAP kinase and PI3 kinase/Akt activation (19). Paradoxically, in RA patients, both serum TRAIL and IL-8 concentrations were elevated, while TRAIL receptor expression, including TNFRSF10A/TRAIL-R1, was reduced in monocytes. This led to decreased TRAIL-induced monocyte apoptosis in RA due to increased TRAIL-induced IL-8 secretion, activating antiapoptotic pathways (20). These findings underscore the potential pathogenic role of TNFRSF10A in RA. Moreover, SORT1, a pivotal regulator of lipid metabolism (21), has been previously noted to be elevated in the serum of RA patients compared to healthy donors. It plays a critical role in immune cell signaling, contributing to the pathogenesis of RA (22). On the other hand, CTSL1, an endosomal proteolytic enzyme involved in extracellular matrix degradation, angiogenesis, and antigen presentation, is elevated in the circulation of RA patients, particularly associated with autoantibodies (23, 24). Our study affirms that TNFRSF10A, SORT1 and CTSL1 are significantly elevated not only in early RA but also in established disease, suggesting their potential as candidate biomarkers for the disease.
The effects of methotrexate therapy on cardiometabolic and cardiovascular alterations in RA patients have yielded inconsistent results in prior studies (25, 26). In our study of patients with early RA disease, we observed that the administration of methotrexate over a six-month period resulted in a significant reduction of 13 molecules that have been related to CVD. Although this reduction did not reach the levels of these proteins in healthy subjects. These results suggest that methotrexate might have beneficial effects on the molecular profile related to CVD. Currently, one of the areas that have garnered considerable attention is the identification of biomarkers indicative of the response to therapy among patients diagnosed with RA. This pursuit is primarily aimed at early disease progression, improvement of patient outcome, reducing healthcare costs and promoting a better understanding of the disease. Numerous studies have been conducted to identify clinical or molecular factors or a combination of both, that could predict the effectiveness of methotrexate therapy. The most recent studies have explored the integration of genomics and clinical data through machine learning to predict the response to methotrexate. As such, machine learning methods, which incorporate demographic data, smoking habit, rheumatoid factor, DAS28 and 160 SNPs predicted methotrexate response at 3 months with an AUC of 0.84 (27). With regard to serum biomarkers, prior studies have indicated that four specific proteins may be predictive of methotrexate response in a cohort of RA patients. Notably, high levels of these biomarkers, namely CRP, leptin, TNF-RI and VCAM-1, were found to be associated with low disease activity at 3 months (28). Our research contributes to the biomarker field by identifying serum levels of IL6, SAA4 or BNP as potential predictors of response to methotrexate. It should be emphasized that further research is necessary to confirm these findings and to establish the predictive value of these biomarkers in this regard.
On the other hand, the impact of tofacitinib on CVD risk among RA patients has been a subject of inquiry (29–31). Nonetheless, a considerable cohort study indicated a minimal occurrence of CV events associated with tofacitinib therapy in RA patients (22). A recent study using PEA (Olink proteomics) on a small cohort of RA patients, presented evidence of the modulatory effects of tofacitinib on various inflammatory-related circulating proteins (32). Our study reveals that tofacitinib modulates the levels of 10 proteins potentially associated with CVD in RA patients with established disease. Notably, in six of these proteins, the reduction reached levels comparable to those observed in healthy donors. In this sense, CA1 belongs to the carbonic anhydrase (CA) family, catalyzing reversible hydration and dehydration reactions of CO2/H2CO3 and also can promote the formation of CaCO3. In our study, RA patients with established disease exhibited higher levels than those in the early stages of the disease. Notably, treatment with tofacitinib significantly reduced these elevated levels reaching the levels observed in HDs. Our findings align with a study conducted by Zheng and colleagues, demonstrating that overexpression of CA1 accelerated joint inflammation and tissue destruction in a collagen-induced arthritis (CIA) mice model (33). This supports our observation that RA patients with established disease may exhibit higher CA1 levels than those in the early stages of RA. Furthermore, recent research has positioned CA1 as a potential target for managing pain symptoms associated with RA and related inflammatory diseases (34, 35). Our study contributes to the growing body of evidence linking CA1 to RA pathogenesis and treatment response, emphasizing its potential as a therapeutic target in the management of RA. These results could also suggest CA1 as a molecular target for tofacitinib, with the potential to beneficially reduce pain.
Insufficient evidence exists concerning the predictors of clinical response in RA patients undergoing tofacitinib treatment. Recently, a study of 25 RA patients indicated that baseline power Doppler and multi-biomarker disease activity (MBDA) score can forecast the response to tofacitinib (36). Furthermore, early alterations in magnetic resonance may serve as a predictor of the response to therapy, either to methotrexate or tofacitinib (37). Nonetheless, there is an absence of data on molecular predictors of the response to tofacitinib treatment. Our preliminary study reveals novel findings regarding the serum levels of LOX1, CNDP1, TIMD4 and SAA4 as biomarkers of the response to this therapy.
4.1 Limitations of the study
A key limitation of this study was its small sample size and the lack of randomization in the longitudinal cohort. The non-randomized recruitment from routine clinical practice may have led to uneven distribution among treatment groups, potentially affecting therapy response. Consequently, our results only allow us to make predictive statements about the link between serum proteins and methotrexate or tofacitinib treatment responses. Therefore, larger validation cohorts using complementary techniques are essential to validate these findings.
5 Conclusions
This study aimed to assess the alterations in the serum proteome related to CVD in two cohorts of active rheumatoid arthritis (RA) patients: those who were newly diagnosed (naïve-treated) and those with well-established disease. Our findings revealed that RA is characterized by a distinct and modified CVD proteome, which was observed both at early stages of the disease and throughout its extended progression. This indicates that the alteration in the proteome is a persistent feature of RA. Moreover, we identified a six-biomarker serum panel consisting of CTSL-1, SORT1, SAA4, TNFRSF10A, ST6GAL1, and CCL-18 proteins that effectively distinguished the two cohorts of RA patients from healthy donors. These biomarkers hold potential as valuable candidate diagnostic indicators for RA. Additionally, we observed distinct impacts of methotrexate and tofacitinib on the levels of these proteins, with each treatment modifying a diverse set of proteins. Our results demonstrated that tofacitinib response was associated with baseline levels of LOX1, CNDP1 and changes in SAA4 and TIMD4 proteins. Conversely, methotrexate response showed an association with changes in IL-6 protein levels and the basal levels of SAA4 and BNP. In summary, our study provides insights into the altered proteomic profile associated with CVD in RA patients and identifies a promising six-biomarker panel for RA diagnosis. Furthermore, we elucidated the specific modulation of these proteins by methotrexate and tofacitinib, highlighting potential avenues for personalized treatment strategies in RA management.
Data availability statement
The original contributions presented in the study are included in the article/Supplementary Materials, further inquiries can be directed to the corresponding author/s.
Ethics statement
The studies involving humans were approved by ethics committee of the Reina Sofia Hospital, the University Clinical Hospital of Santiago de Compostela, and La Paz University Hospital. The studies were conducted in accordance with the local legislation and institutional requirements. The participants provided their written informed consent to participate in this study.
Author contributions
LC-L: Data curation, Formal Analysis, Investigation, Methodology, Writing – original draft. AE-C: Funding acquisition, Project administration, Resources, Supervision, Writing – review & editing. YH: Data curation, Formal Analysis, Software, Writing – original draft. CP-S: Investigation, Methodology, Writing – review & editing. MR-P: Investigation, Methodology, Writing – original draft. JMM-M: Investigation, Methodology, Writing – original draft. EP-P: Methodology, Writing – original draft. AG: Methodology, Writing – review & editing. CP-R: Methodology, Writing – review & editing. AM-F: Methodology, Writing – review & editing. AB: Methodology, Writing – review & editing. CL-M: Data curation, Formal Analysis, Writing – review & editing. LL-P: Methodology, Writing – review & editing. MR-G: Methodology, Writing – review & editing. RO-C: Methodology, Writing – review & editing. JC-G: Methodology, Writing – review & editing. CL-P: Writing – review & editing. EC-E: Data curation, Formal Analysis, Writing – review & editing. IA-R: Writing – original draft. NB: Funding acquisition, Investigation, Project administration, Resources, Supervision, Writing – original draft, Writing – review & editing.
Funding
The author(s) declare financial support was received for the research, authorship, and/or publication of this article. This work was supported by grants from the “Instituto de Salud Carlos III” (PI20/00079, PI21/00591, FI21/00039, and RICOR-RD21/0002/0033) co-financed by the European Union; the Andalusian government (1381035-F) co-financed by the European Regional Development Fund (ERDF); MINECO (RyC- 2017-23437, FPU/06329) and Consejerı́a de Conocimiento, Investigación y Universidad, Junta de Andalucı́a (P20_01367). The authors declare that this study also received funding from Pfizer (IRS-Aspire-2019 grant). The funder was not involved in the study design, collection, analysis, interpretation of data, the writing of this article, or the decision to submit it for publication. CL-P was supported by a contract from the Junta de Andalucia (Nicolas Monardes program). CP-S was supported by MCIN/AEI/10.13039/501100011033 (RYC2021-033828-I) and the European Union “NextGenerationEU”/PRTR.
Conflict of interest
CP-S, NB, YH, and J-MM-M were co-founders of Cobiomic Biosciences S.L.
The remaining authors declare that the research was conducted in the absence of any commercial or financial relationships that could be construed as a potential conflict of interest.
Publisher’s note
All claims expressed in this article are solely those of the authors and do not necessarily represent those of their affiliated organizations, or those of the publisher, the editors and the reviewers. Any product that may be evaluated in this article, or claim that may be made by its manufacturer, is not guaranteed or endorsed by the publisher.
Supplementary material
The Supplementary Material for this article can be found online at: https://www.frontiersin.org/articles/10.3389/fimmu.2024.1333995/full#supplementary-material
Supplementary Figure 1 | Comparison of the commonly altered serum proteome in early and established RA compared to HDs. Box and whiskers plots represent median and minimum and maximum values of analyzed proteins. One-way ANOVA and Bonferroni’s post hoc multiple comparisons tests were conducted for statistical analysis. (****) <0.0001 adj-p-value; (***) <0.001 adj-p-value; (**) <0.01 adj-p-value; (*) <0.05 adj-p-value. RA: rheumatoid arthritis; HDs: healthy donors. Annotated names of abbreviated proteins (Supplementary Table 1).
Abbreviations
CVD, cardiovascular disease; RA, rheumatoid arthritis; PEA, proximity extension assay; EULAR, European Alliance of Associations for Rheumatology; DMARDs, disease-modifying antirheumatic drugs; ATP, adenosine triphosphate; TNF-α, tumor necrosis factor-alpha; CV, cardiovascular; HDs,healthy donors; DAS-28, disease activity score 28; CRP, C-reactive protein; RF, rheumatoid factor; ACPAs,antibodies to citrullinated protein antigens antibodies; PCR, polymerase chain reaction; NPX, normalized protein expression; SD, standard deviation; AUC, area under the curve; HF, heart failure; HLA-B27, human leukocyte antigen B27; SNPs, single-nucleotide polymorphism; MBDA, multi-biomarker disease activity.
References
1. Han C, Robinson DW Jr, Hackett MV, Paramore LC, Fraeman KH, Bala MV. Cardiovascular disease and risk factors in patients with rheumatoid arthritis, psoriatic arthritis, and ankylosing spondylitis. J Rheumatol (2006) 33:2167–72.
2. Figus FA, Piga M, Azzolin I, McConnell R, Iagnocco A. Rheumatoid arthritis: Extra-articular manifestations and comorbidities. Autoimmun Rev (2021) 20:102776. doi: 10.1016/j.autrev.2021.102776
3. Karvounaris SA, Sidiropoulos PI, Papadakis JA, Spanakis EK, Bertsias GK, Kritikos HD, et al. Metabolic syndrome is common among middle-to-older aged Mediterranean patients with rheumatoid arthritis and correlates with disease activity: a retrospective, cross-sectional, controlled, study. Ann Rheum Dis (2007) 66:28–33. doi: 10.1136/ard.2006.053488
4. Chung CP, Oeser A, Solus JF, Avalos I, Gebretsadik T, Shintani A, et al. Prevalence of the metabolic syndrome is increased in rheumatoid arthritis and is associated with coronary atherosclerosis. Atherosclerosis (2008) 196:756–6. doi: 10.1016/j.atherosclerosis.2007.01.004
5. de la Rosa IA, Escudero-Contreras A, Rodríguez-Cuenca S, Ruiz-Ponce M, Jiménez-Gómez Y, Ruiz-Limón P, et al. Defective glucose and lipid metabolism in rheumatoid arthritis is determined by chronic inflammation in metabolic tissues. J Intern Med (2018) 248:61–77. doi: 10.1111/joim.12743
6. Deutsch EW, Omenn GS, Sun Z, Maes M, Pernemalm M, Palaniappan KK, et al. Advances and utility of the human plasma proteome. J Proteome Res (2021) 29:5241–63. doi: 10.1021/acs.jproteome.1c00657
7. Filbin MR, Mehta A, Schneider AM, Kays KR, Guess JR, Gentili M, et al. Longitudinal proteomic analysis of severe COVID-19 reveals survival-associated signatures, tissue-specific cell death, and cell-cell interactions. Cell Rep Med (2021) 2:100287. doi: 10.1016/j.xcrm.2021.100287
8. Wells G, Becker JC, Teng J, Dougados M, Schiff M, Smolen J, et al. Validation of the 28-joint Disease Activity Score (DAS28) and European League Against Rheumatism response criteria based on C-reactive protein against disease progression in patients with rheumatoid arthritis, and comparison with the DAS28 based on erythrocyte sedimentation rate. Ann rheumatic Dis (2009) 68(6):954–60. doi: 10.1136/ard.2007.084459
9. van Gestel AM, Prevoo ML, van 't Hof MA, van Rijswijk MH, van de Putte LB, van Riel PL. Development and validation of the European League Against Rheumatism response criteria for rheumatoid arthritis. Comparison with the preliminary American College of Rheumatology and the World Health Organization/International League Against Rheumatism Criteria. Arthritis Rheumatol (1996) 39(1):34–40. doi: 10.1002/art.1780390105
10. Ferreira MB, Fonseca T, Costa R, Marinhoc A, Carvalho HC, Oliveira JC, et al. Prevalence, risk factors and proteomic bioprofiles associated with heart failure in rheumatoid arthritis: The RA-HF study. Eur J Intern Med (2021) 85:41–49. doi: 10.1016/j.ejim.2020.11.002
11. Seok A, Lee HJ, Lee S, Lee J, Mun S, Park A, et al. Identification and validation of SAA4 as a rheumatoid arthritis prescreening marker by liquid chromatography tandem-mass spectrometry. Molecules (2017) 22:805. doi: 10.1007/s10067-005-0106-0
12. Mun S, Lee J, Lim MK, Lee YR, Ihm C, Lee SH, et al. Development of a novel diagnostic biomarker set for rheumatoid arthritis using a proteomics approach. BioMed Res Int (2018) 2018:7490723. doi: 10.1155/2018/7490723
13. Mun S, Lee J, Park M, Shin J, Lim MK, Kang HG. Serum biomarker panel for the diagnosis of rheumatoid arthritis. Arthritis Res Ther (2021) 23:31. doi: 10.1186/s13075-020-02405-7
14. Jones MB. IgG and leukocytes: Targets of immunomodulatory α2,6 sialic acids. Cell Immunol (2018) 333:58–64. doi: 10.1016/j.cellimm.2018.03.014
15. Scherer HU, van der Woude D, Ioan-Facsinay A, el Bannoudi H, Trouw LA, Wang J, et al. Glycan profiling of anti-citrullinated protein antibodies isolated from human serum and synovial fluid. Arthritis Rheumatol (2010) 62(6):1620–9. doi: 10.1002/art.27414
16. Van Lieshout AW, Fransen J, Flendrie M, Eijsbouts AM, van den Hoogen FH, Van Riel PL, et al. Circulating levels of the chemokine CCL18 but not CXCL16 are elevated and correlate with disease activity in rheumatoid arthritis. Ann Rheum Dis (2007) 66:1334–8. doi: 10.1136/ard.2006.066084
17. Wang S, El-Deiry WS. TRAIL and apoptosis induction by TNF-family death receptors. Oncogene (2003) 22(53):8628–33. doi: 10.1038/sj.onc.1207232
18. Schneider P, Thome M, Burns K, Bodmer JL, Hofmann K, Kataoka T, et al. TRAIL receptors 1 (DR4) and 2 (DR5) signal FADD-dependent apoptosis and activate NF-kappaB. Immunity (1997) 7(6):831–6. doi: 10.1016/s1074-7613(00)80401-x
19. Morel J, Audo R, Hahne M, Combe B. Tumor necrosis factor-related apoptosis-inducing ligand (TRAIL) induces rheumatoid arthritis synovial fibroblast proliferation through mitogen-activated protein kinases and phosphatidylinositol 3-kinase/Akt. J Biol Chem (2005) 280(16):15709–18. doi: 10.1074/jbc.M414469200
20. Meusch U, Klingner M, Mathar C, Malysheva O, Baerwald C, Rossol M, et al. Brief report: autocrine cytokine-mediated deficiency of TRAIL-induced monocyte apoptosis in rheumatoid arthritis. Arthritis Rheumatol (Hoboken N.J.) (2015) 67(7):1760–5. doi: 10.1002/art.39138
21. Patel KM, Strong A, Tohyama J, Jin X, Morales CR, Billheimer J, et al. Macrophage sortilin promotes LDL uptake, foam cell formation, and atherosclerosis. Circ Res (2015) 116(5):789–96. doi: 10.1161/CIRCRESAHA.116.305811
22. Yang CR, Ding HJ, Yu M, Zhou FH, Han CY, Liang R, et al. proBDNF/p75NTR promotes rheumatoid arthritis and inflammatory response by activating proinflammatory cytokines. FASEB J (2022) 36(3):e22180. doi: 10.1096/fj.202101558R
23. Weitoft T, Larsson A, Manivel VA, Lysholm J, Knight A, Rönnelid J. Cathepsin S and cathepsin L in serum and synovial fluid in rheumatoid arthritis with and without autoantibodies. Rheumatol (Oxford England) (2015) 54(10):1923–8. doi: 10.1093/rheumatology/keu486
24. Ruge T, Södergren A, Wållberg-Jonsson S, Larsson A, Arnlöv J. Circulating plasma levels of cathepsin S and L are not associated with disease severity in patients with rheumatoid arthritis. Scandinavian J Rheumatol (2014) 43(5):371–3. doi: 10.3109/03009742.2014.882979
25. Hloch K, Doseděl M, Duintjer Tebbens J, Žaloudková L, Medková H, Vlček J, et al. Higher risk of cardiovascular diseases in rheumatoid arthritis patients without methotrexate treatment. Front Pharmacol (2021) 12:703279. doi: 10.3389/fphar.2021.703279
26. Johnson TM, Sayles HR, Baker JF, George MD, Roul P, Zheng C, et al. Investigating changes in disease activity as a mediator of cardiovascular risk reduction with methotrexate use in rheumatoid arthritis. Ann Rheum Dis (2021) 80:1385–92. doi: 10.1136/annrheumdis-2021-220125
27. Myasoedova E, Athreya AP, Crowson CS, 3rd DJM, Warrington KJ, Walchak RC, et al. Toward individualized prediction of response to methotrexate in early rheumatoid arthritis: A pharmacogenomics-driven machine learning approach. Arthritis Care Res (Hoboken) (2022) 74:879–88. doi: 10.1002/acr.24834
28. Hambardzumyan K, Bolce RJ, Wallman JK, van Vollenhoven RF, Saevarsdottir S. Serum biomarkers for prediction of response to methotrexate monotherapy in early rheumatoid arthritis: results from the SWEFOT trial. J Rheumatol (2019) 46:555–63. doi: 10.3899/jrheum.180537
29. Charles-Schoeman C, Wicker P, Gonzalez-Gay MA, Boy M, Zuckerman A, Soma K, et al. Cardiovascular safety findings in patients with rheumatoid arthritis treated with tofacitinib, an oral Janus kinase inhibitor. Semin Arthritis Rheum (2016) 46:261–71. doi: 10.1016/j.semarthrit.2016.05.014
30. Totoson P, Peyronnel C, Quirié A, Pédard M, Cefis M, Bermont L, et al. Tofacitinib improved peripheral endothelial dysfunction and brain-derived neurotrophic factor levels in the rat adjuvant-induced arthritis model. Fundam Clin Pharmacol (2022) 36:363–74. doi: 10.1111/fcp.12731
31. Charles-Schoeman C, Buch MH, Dougados M, Bhatt DL, Giles JT, Ytterberg SR, et al. Risk of major adverse cardiovascular events with tofacitinib versus tumour necrosis factor inhibitors in patients with rheumatoid arthritis with or without a history of atherosclerotic cardiovascular disease: a post hoc analysis from ORAL Surveillance. Ann Rheum Dis (2023) 82:119–29. doi: 10.1136/ard-2022-222259
32. Valli A, Kuuliala K, Virtanen A, Kuuliala A, Palmroth M, Peltomaa R, et al. Tofacitinib treatment modulates the levels of several inflammation-related plasma proteins in rheumatoid arthritis and baseline levels of soluble biomarkers associate with the treatment response. Clin Exp Immunol (2022) 210:141–50. doi: 10.1093/cei/uxac085
33. Zheng Y, Wang L, Zhang W, Xu H, Chang X. Transgenic mice over-expressing carbonic anhydrase I showed aggravated joint inflammation and tissue destruction. BMC Musculoskelet Disord (2012) 13:256. doi: 10.1186/1471-2474-13-256
34. Akgul O, Di Cesare Mannelli L, Vullo D, Angeli A, Ghelardini C, Bartolucci G, et al. Discovery of novel nonsteroidal anti-inflammatory drugs and carbonic anhydrase inhibitors hybrids (NSAIDs-CAIs) for the management of rheumatoid arthritis. J Med Chem (2018) 61(11):4961–77. doi: 10.1021/acs.jmedchem.8b00420
35. Bua S, Lucarini L, Micheli L, Menicatti M, Bartolucci G, Selleri S, et al. Bioisosteric development of multitarget nonsteroidal anti-inflammatory drug-carbonic anhydrases inhibitor hybrids for the management of rheumatoid arthritis. J Med Chem (2020) 63(5):2325–42. doi: 10.1021/acs.jmedchem.9b01130
36. Razmjou AA, Brook J, Elashoff D, Kaeley G, Choi S, Kermani T, et al. Ultrasound and multi-biomarker disease activity score for assessing and predicting clinical response to tofacitinib treatment in patients with rheumatoid arthritis. BMC Rheumatol (2020) 4:55. doi: 10.1186/s41927-020-00153-4
Keywords: rheumatoid arthritis, methotrexate, tofacitinib, biomarkers, proximity extension assay (PEA), Olink
Citation: Cuesta-López L, Escudero-Contreras A, Hanaee Y, Pérez-Sánchez C, Ruiz-Ponce M, Martínez-Moreno JM, Pérez-Pampin E, González A, Plasencia-Rodriguez C, Martínez-Feito A, Balsa A, López-Medina C, Ladehesa-Pineda L, Rojas-Giménez M, Ortega-Castro R, Calvo-Gutiérrez J, López-Pedrera C, Collantes-Estévez E, Arias-de la Rosa I and Barbarroja N (2024) Exploring candidate biomarkers for rheumatoid arthritis through cardiovascular and cardiometabolic serum proteome profiling. Front. Immunol. 15:1333995. doi: 10.3389/fimmu.2024.1333995
Received: 06 November 2023; Accepted: 22 January 2024;
Published: 14 February 2024.
Edited by:
Katarzyna Bogunia-Kubik, Polish Academy of Sciences, PolandReviewed by:
Liam J. O'Neil, University of Manitoba, CanadaAlbert Bondt, Utrecht University, Netherlands
Ken Lo, Nimble Therapeutics Inc., United States
Copyright © 2024 Cuesta-López, Escudero-Contreras, Hanaee, Pérez-Sánchez, Ruiz-Ponce, Martínez-Moreno, Pérez-Pampin, González, Plasencia-Rodriguez, Martínez-Feito, Balsa, López-Medina, Ladehesa-Pineda, Rojas-Giménez, Ortega-Castro, Calvo-Gutiérrez, López-Pedrera, Collantes-Estévez, Arias-de la Rosa and Barbarroja. This is an open-access article distributed under the terms of the Creative Commons Attribution License (CC BY). The use, distribution or reproduction in other forums is permitted, provided the original author(s) and the copyright owner(s) are credited and that the original publication in this journal is cited, in accordance with accepted academic practice. No use, distribution or reproduction is permitted which does not comply with these terms.
*Correspondence: Nuria Barbarroja, YmFyYmFycm9qYW5AZ21haWwuY29t; Iván Arias-de la Rosa, aXZhbi5hcmlhcy5kZWxhcm9zYUBnbWFpbC5jb20=
†These authors have contributed equally to this work