 Di Sun
 Yuanying Wang
 Qiao Ye
- Department of Occupational Medicine and Toxicology, Clinical Center for Interstitial Lung Diseases, Beijing Institute of Respiratory Medicine, Beijing Chao-Yang Hospital, Capital Medical University, Beijing, China
Background: Sarcoidosis has been considered to be associated with many autoimmune diseases (ADs), but the cause-and-effect relationship between these two diseases has not been fully explored. Therefore, the objective of this study is to explore the possible genetic association between sarcoidosis and ADs.
Methods: We conducted a bidirectional Mendelian randomization (MR) study using genetic variants associated with ADs and sarcoidosis (4,041 cases and 371,255 controls) from the FinnGen study. The ADs dataset comprised 96,150 cases and 281,127 controls, encompassing 44 distinct types of autoimmune-related diseases. Subsequently, we identified seven diseases within the ADs dataset with a case size exceeding 3,500 and performed subgroup analyses on these specific diseases.
Results: The MR evidence supported the causal association of genetic predictors of ADs with an increased risk of sarcoidosis (OR = 1.79, 95% CI = 1.59 to 2.02, P IVW-FE = 1.01 × 10⁻²¹), and no reverse causation (OR = 1.05, 95% CI 0.99 to 1.12, PIVW-MRE = 9.88 × 10⁻²). Furthermore, subgroup analyses indicated that genetic predictors of type 1 diabetes mellitus (T1DM), celiac disease, and inflammatory bowel disease (IBD) were causally linked to an elevated risk of sarcoidosis (All P < 6.25 × 10⁻³). Conversely, genetic predictors of sarcoidosis showed causal associations with a higher risk of type 1 diabetes mellitus (P < 6.25 × 10⁻³).
Conclusion: The present study established a positive causal relationship between genetic predictors of ADs (e.g. T1DM, celiac disease, and IBD) and the risk of sarcoidosis, with no evidence of reverse causation.
Introduction
Sarcoidosis is a systemic granulomatous inflammatory disease characterized histologically by non-caseating granulomas in multiple organs, predominantly involving the lungs (1). The pathogenesis of sarcoidosis remains unclear and may involve genetic susceptibility, environmental factors, and immunopathogenic mechanisms (1). While the 5-year mortality rate in patients with sarcoidosis is only 7% (2), the disease is not benign for many patients due to its high burden and excess mortality (2–4). The incidence of sarcoidosis varies significantly by age, sex, and race (5), with the highest rates observed in Finland (28.2 per 100,000) (6), lower in North America and Australia (5–10) (7–9), and Asians have the lowest rates (0.5-1) (6, 10).
Autoimmune diseases (ADs) encompass a diverse range of diseases marked by the loss of self-tolerance and the production of autoantibodies. A robust association exists between these diseases and genetic susceptibility (11). Growing evidence has identified an association between sarcoidosis and ADs, particularly type 1 diabetes mellitus (T1DM), celiac disease, and inflammatory bowel disease (IBD) (12–18). However, all the associations between sarcoidosis and ADs mentioned above were derived from cross-sectional studies, leaving the causal nature of these connections elusive (19). Establishing causal relationships not only deepens the understanding of sarcoidosis and ADs pathogenesis but also has the potential to guide pathogenesis-oriented interventions against sarcoidosis and ADs in clinical settings. Therefore, there is an urgent need to elucidate the causal relationship between sarcoidosis and various types of ADs.
Mendelian randomization (MR) employs genetic markers of an exposure, specifically utilizing single nucleotide polymorphisms (SNPs) as instrumental variables (IVs), to establish causal relationships between an exposure and an outcome in the analysis (20–22). Consequently, genetic variants associated with sarcoidosis and autoimmune diseases (ADs) serve as proxies, enabling the derivation of unconfounded estimates for the associations between sarcoidosis and ADs. Numerous loci contributing to human complex traits, including sarcoidosis and ADs, have been identified through genome-wide association studies (GWAS) (23). These findings provide a significant opportunity to explore potential causal associations between them using an MR approach.
Therefore, in this study, we performed a systematic bidirectional MR analysis to investigate the causal relationship between sarcoidosis and ADs.
Materials and methods
Study design
The SNPs representing global human genetic variation were selected as IVs in this study. To satisfy the assumptions of MR, these IVs must satisfy three key criteria (24): (1) strong associations with the exposure of interest, (2) lack of association with confounding factors, and (3) absence of direct influence on the outcome apart from the exposure (Figure 1). Subsequently, a bidirectional MR analysis was conducted to evaluate the association between sarcoidosis and ADs. The study adheres to the reporting guidelines outlined in the Guidelines for Strengthening the Reporting of Mendelian Randomization Studies (STROBE-MR) checklist (25, 26).
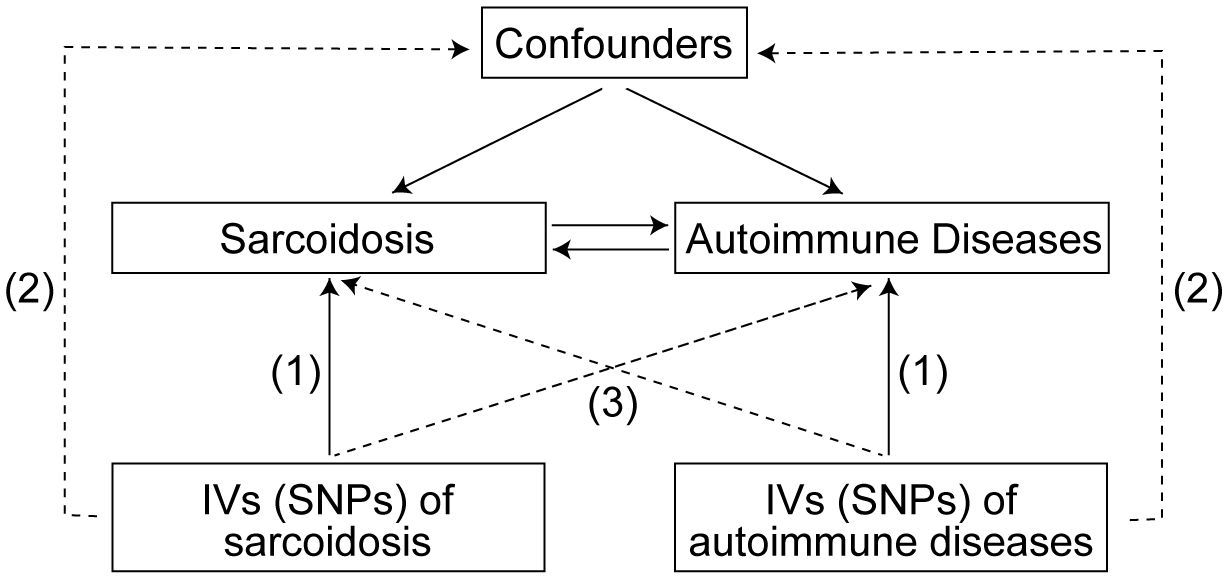
Figure 1 Three assumptions for IVs in MR study. IVs, Instrumental variables; SNPs, Single nucleotide polymorphisms; MR, Mendelian randomization.
Data source
Currently, there is no specialized GWAS data specifically dedicated to ADs available globally. Therefore, we selected a dataset consisting of 96,150 cases and 281,127 controls to encompass a wide range of ADs, including 44 different types of autoimmune-related diseases (Supplementary Table 1). We identified diseases within the dataset that had a case size exceeding 3,500 cases and conducted subgroup analyses specifically for these diseases. The diseases included in the subgroup analyses, along with their respective case and control sizes, are as follows (Supplementary Table 2): rheumatoid arthritis (12,555 cases and 240,862 controls), autoimmune hypothyroidism (40,926 cases and 274,069 controls), T1DM (4,196 cases and 308,252 controls), celiac disease (3,690 cases and 361,055 controls), IBD (7,625 cases and 369,652 controls), psoriasis (9,267 cases and 364,071 controls), and anterior iridocyclitis (6,536 cases and 370,741 controls). The GWAS data for sarcoidosis (4,041 cases and 371,255 controls) and ADs were obtained from the FinnGen biobank (DF9 - May 11 2023) and are available at https://www.finngen.fi/en. All the analyzed data were categorical (qualitative) variables. The FinnGen study is an ongoing nationwide collection of residents in Finland genetic samples that combines genome information with digital healthcare and registry data (23).
Instrument selection and data harmonization
SNPs with a significance level of P < 5 × 10⁻⁸ were identified and clumped based on linkage disequilibrium (r2 < 0.001) within a clumping distance of 10,000 kb. The 1000 Genomes European data was used as the reference panel for this process. In cases where instrumental SNPs for the exposure were not available in the outcome datasets, they were substituted with SNPs showing high linkage disequilibrium (r2 > 0.8) whenever possible. To ensure the alignment of beta values with the same alleles for the effects of SNPs on exposures and outcomes, harmonization was performed. The PhenoScanner (27, 28) database was utilized for manual screening and removal of SNPs associated with confounding factors and outcomes (P-value = 5 × 10⁻⁸, r2 = 0.8, Proxies = EUR, Build = 37). Additional information can be found in Supplementary Table 3. Outliers were identified using the MR-PRESSO method (29), and the data were reanalyzed after removing these outliers. The remaining SNPs were then used to conduct the MR study.
Testing instrument strength and statistical power
The F-statistic for each SNP was calculated using the formula (30): Beta2/SE2, where Beta represents the estimated genetic effect and SE represents the standard error. Additionally, the proportion of variance (R2) explained by each SNP was calculated using the formula (31): 2 × EAF × (1–EAF) × Beta2, where EAF represents the effect allele frequency on exposures. The F-statistic is a measure of instrument strength, and a value greater than 10 is typically considered indicative of a sufficiently strong instrument (32).
Statistical analyses
Our estimates are primarily based on the inverse variance weighted (IVW) analysis. The IVW method assumes the absence of horizontal pleiotropy for all SNPs and provides the most accurate assessment under this premise (33). In cases where heterogeneity exists, we employ the multiplicative random-effect IVW (IVW-MRE) model; otherwise, we use the fixed-effect IVW (IVW-FE) model. Additionally, we conducted sensitivity analyses using several other methods, including MR-Egger (34), Weighted median (35), Simple mode (36), and Weighted mode (36). To assess heterogeneity and evaluate the presence of horizontal pleiotropy, we performed various tests, such as the MR-Egger intercept test (37), Cochran’s Q test (38), and leave-one-out analyses (39). Finally, we performed the MR-Steiger directionality test to assess the correct direction of causality between the exposure and outcome variables (40).
All statistical analyses were performed using the “TwoSampleMR” (41) and “MRPRESSO” (29) packages in R (version 4.2.2). All reported P-values are bilateral, and a multiple-testing threshold of P < 6.25 × 10⁻³ (0.05/8) was applied to declare statistical significance using the Bonferroni method.
Results
Instrument statistics
For the bidirectional MR analysis of the relationships between sarcoidosis and ADs, the number of SNPs used as genetic instruments ranged from 3 (sarcoidosis) to 108 (autoimmune hypothyroidism), explaining 4.99 × 10⁻⁴ to 2.69 × 10⁻² of the phenotypic variances. F-statistics for all diseases are ≥ 30, suggesting the good strength of genetic instruments (Supplementary Tables 4, 5).
Causal effects of ADs on sarcoidosis risk
We first assessed the causal effect of ADs on sarcoidosis, and the results of the IVW-FE method showed that genetic predictors of ADs were significantly associated with a higher risk of sarcoidosis (odds ratio (OR) = 1.79, 95% confidence interval (CI) = 1.59 to 2.02, PIVW-FE = 1.01 × 10⁻²¹). Additionally, the MR-Egger, and Weighted median methods yielded similar results (all P < 6.25 × 10⁻³, Figure 2A, Supplementary Table 6). The scatter plot and forest plot of associations between ADs-associated SNPs and sarcoidosis are presented in Figure 3A and Supplementary Figure 1A.
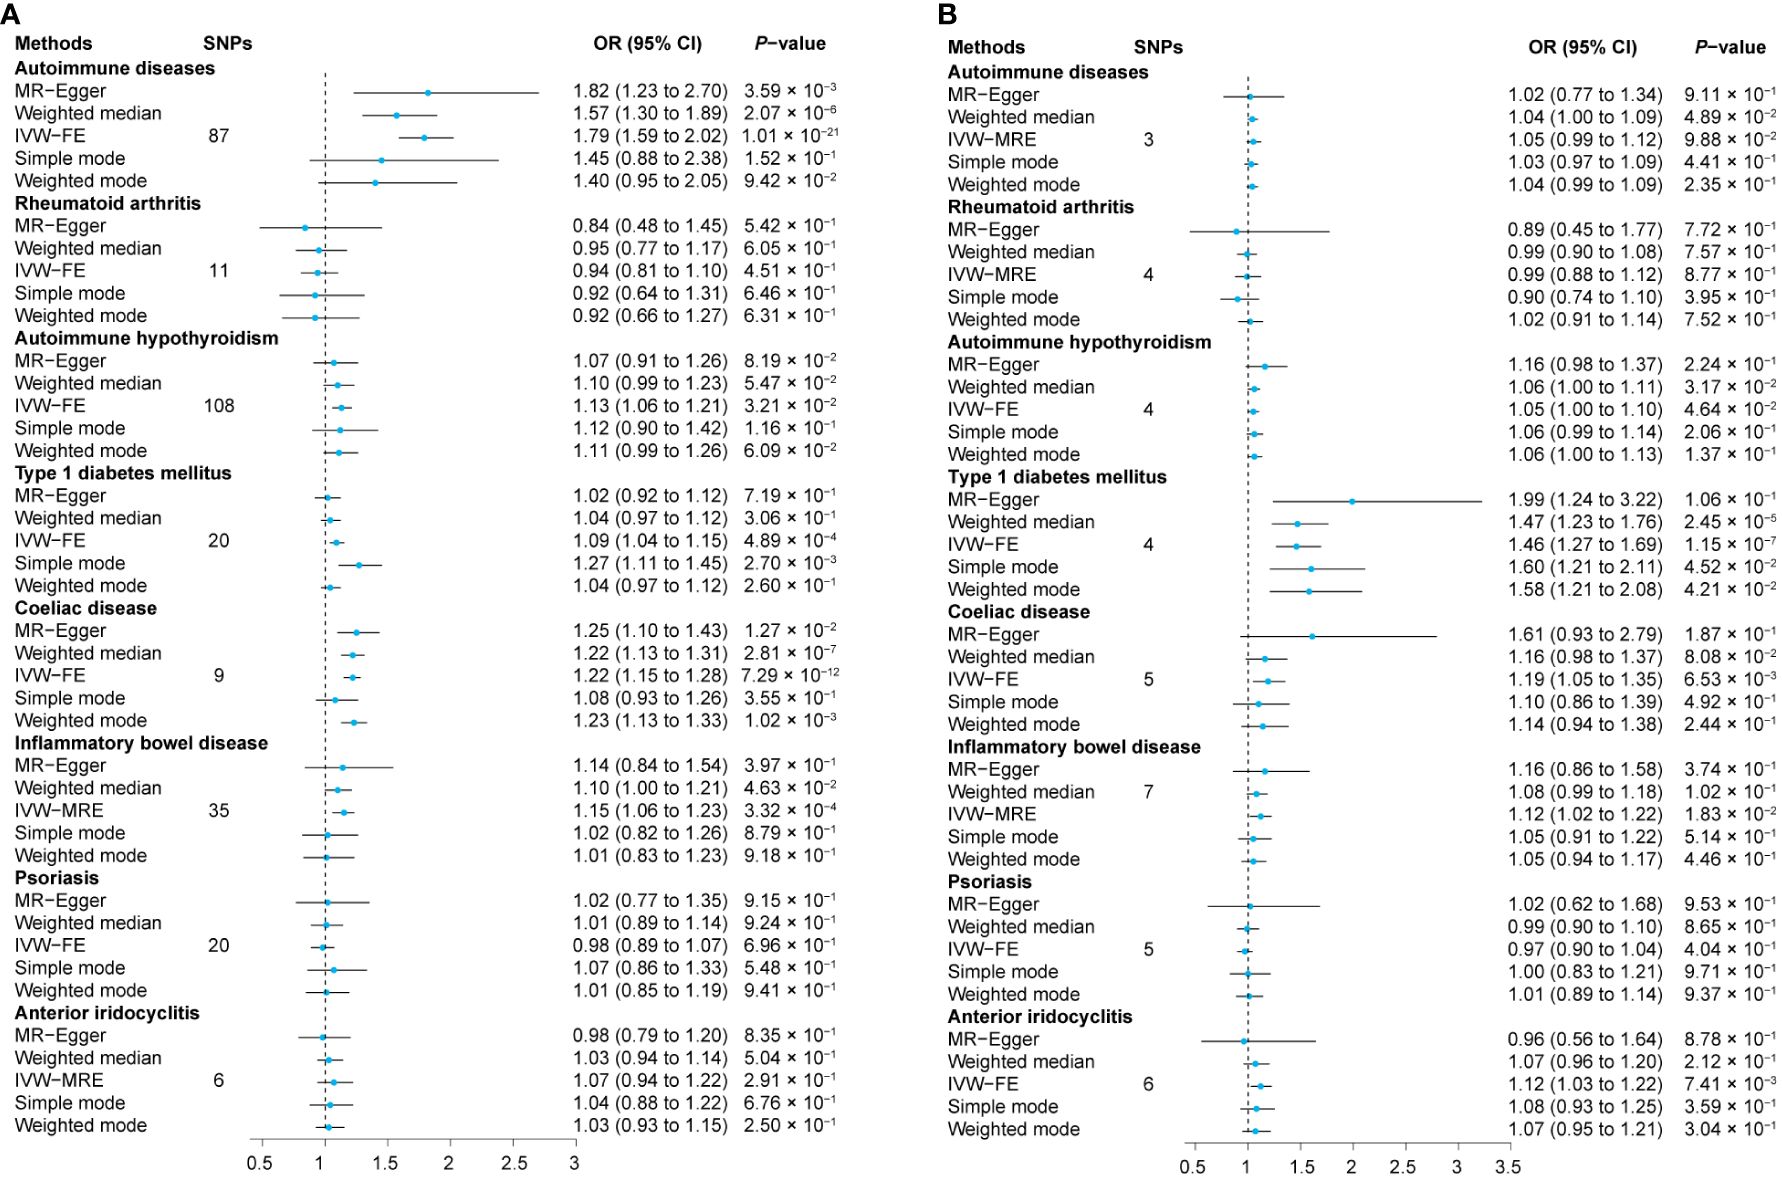
Figure 2 Relationship between exposures and outcomes. The MR analyses were conducted separately with sarcoidosis as both the outcome (A) and the exposure (B). The dataset of autoimmune diseases analyzed in this study comprised a total of 44 different types of autoimmune-related diseases. SNPs, Single nucleotide polymorphisms; OR, Odds ratio; CI, Confidence intervals; IVW-MRE, Multiplicative random-effect inverse variance weighted; IVW-FE, Fixed-effect inverse variance weighted; MR, Mendelian randomization.
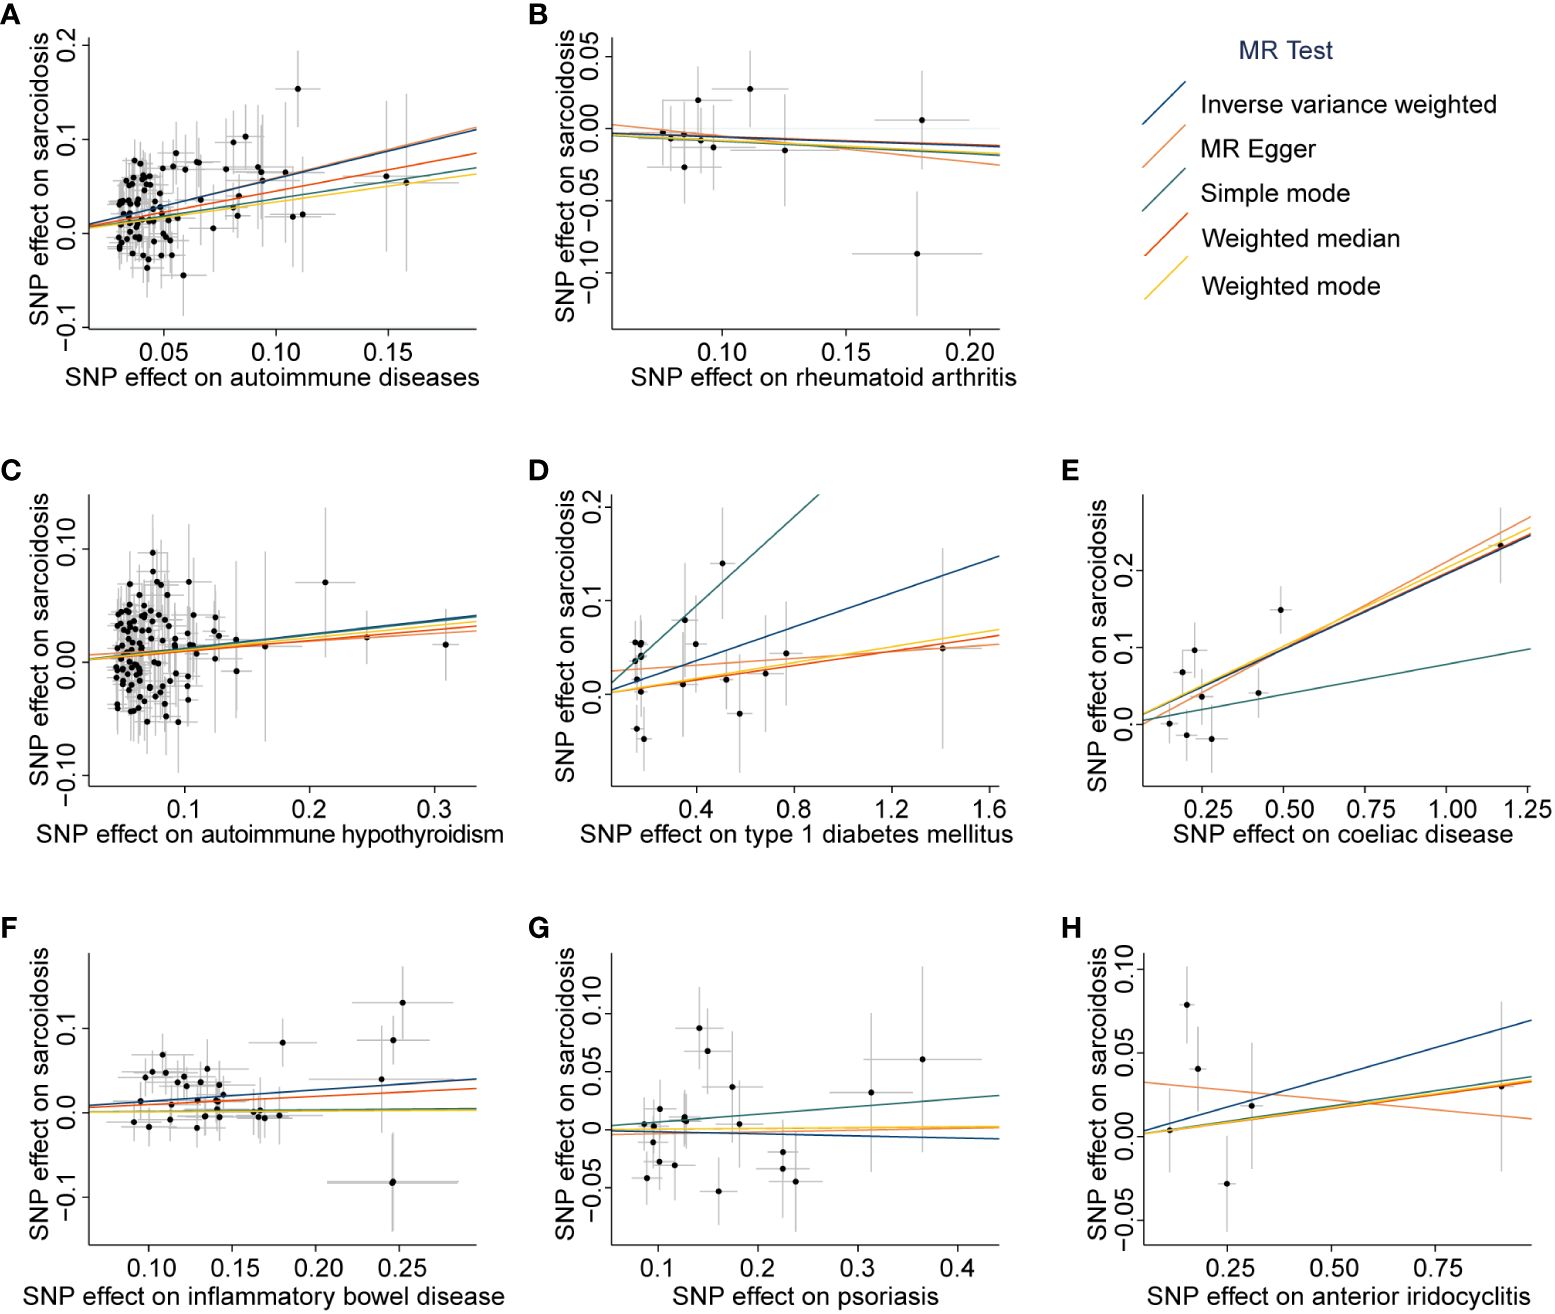
Figure 3 Scatter plots of associations between exposures-associated SNPs and sarcoidosis. The MR analyses were conducted with various exposures, including autoimmune diseases: autoimmune diseases (A), rheumatoid arthritis (B), autoimmune hypothyroidism (C), type 1 diabetes mellitus (D), coeliac disease (E), inflammatory bowel disease (F), psoriasis (G), and anterior iridocyclitis (H). The dataset of autoimmune diseases analyzed in this study comprised a total of 44 different types of autoimmune-related diseases. SNP, Single nucleotide polymorphism; MR, Mendelian randomization.
Subsequently, we assessed the causal effect of seven different types of autoimmune-related diseases on sarcoidosis. Among them, only genetic predictors of T1DM (OR = 1.09, 95% CI = 1.04 to 1.15, PIVW-FE = 4.89 × 10⁻⁴), celiac disease (OR = 1.22, 95% CI = 1.15 to 1.28, PIVW-FE = 7.29 × 10⁻¹²), and IBD (OR = 1.15, 95% CI = 1.06 to 1.23, P IVW-MRE = 3.32 × 10⁻⁴) were associated with a higher risk of sarcoidosis (Figure 2A, Supplementary Table 6). Scatter plots are presented in Figures 3B–H, and the forest plots are shown in Supplementary Figures 1B–H.
Then, we performed sensitivity analyses to assess our results. The results of the MR-Egger regression and MR-PRESSO global test indicated that there was no overall horizontal pleiotropy in all IVs (all P > 0.05, Table 1). However, there was evidence of heterogeneity among the SNPs of IBD (PMR-Egger = 0.049, PIVW = 0.062) and anterior iridocyclitis (PMR-Egger = 0.043, PIVW = 0.023), as shown in Table 1. The results of the leave-one-out analysis and funnel plots are shown in Supplementary Figures 2, 3. Finally, we found no evidence of reverse causality across the analyses in the MR Steiger test (all P < 0.001, Supplementary Table 7).
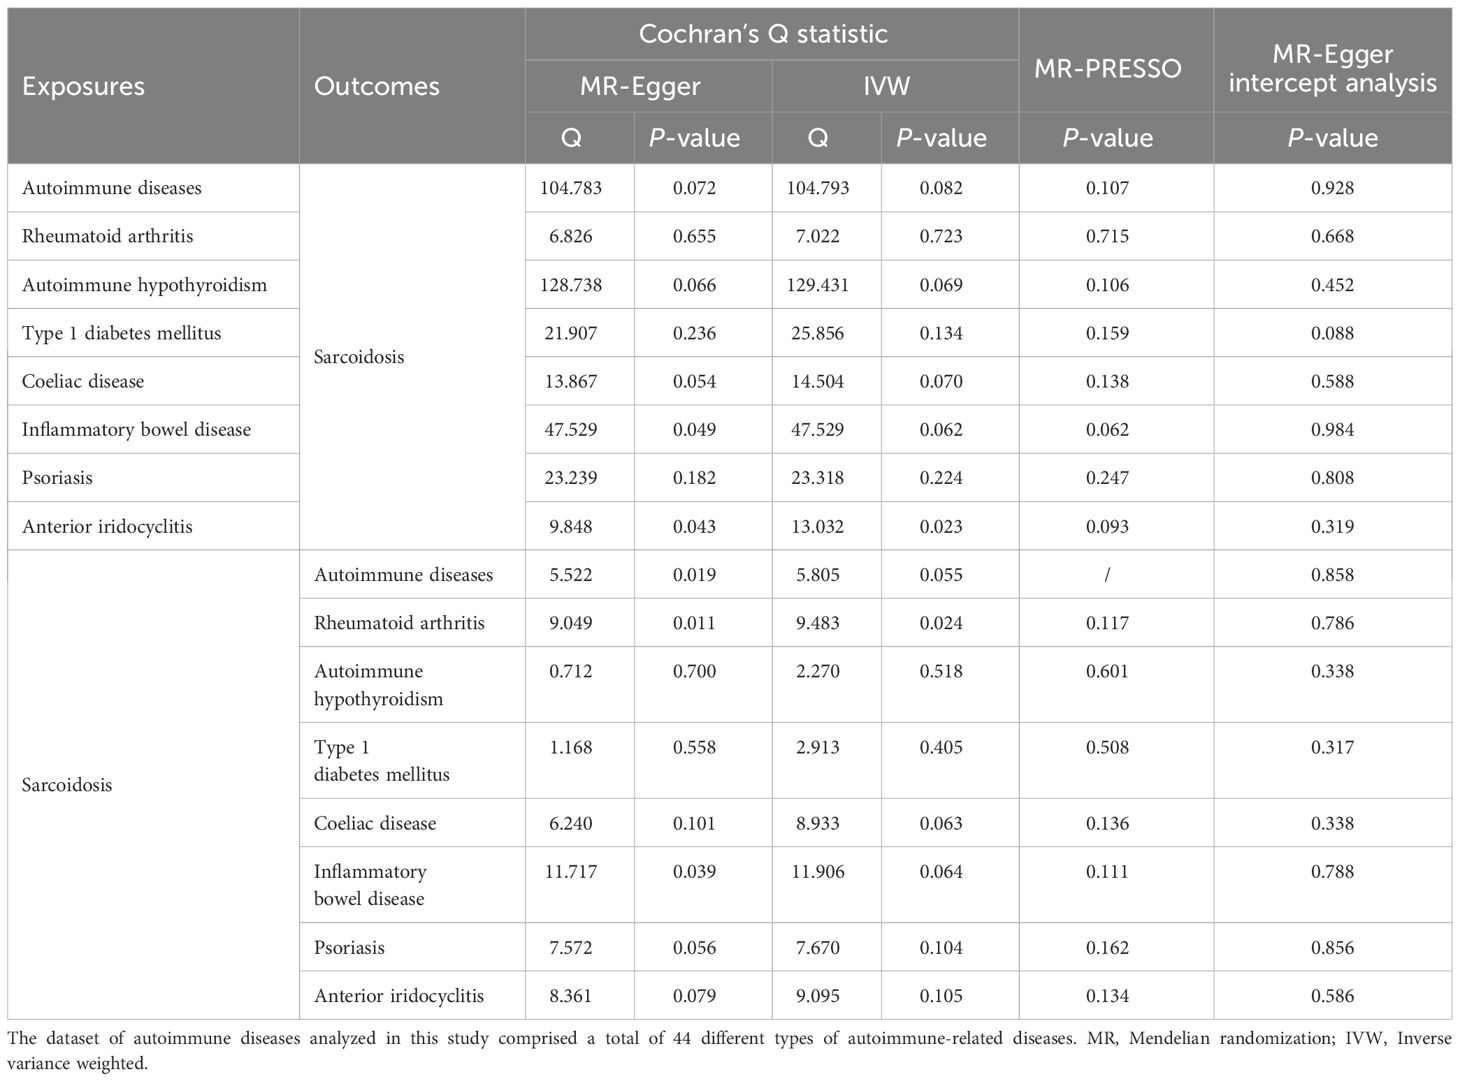
Table 1 Heterogeneity and pleiotropy analysis based on three different statistical methods.
Causal effects of sarcoidosis on ADs risk
The results of the IVW method showed that there is no causal effect of genetic predictors of sarcoidosis on the risk of ADs (OR = 1.05, 95% CI 0.99 to 1.12, PIVW-MRE = 9.88 × 10⁻²), and these results were validated by MR-Egger, weighted median, simple mode, and weighted mode (all P > 6.25 × 10⁻³, Figure 2B and Supplementary Table 6). The scatter plot and forest plot of associations between sarcoidosis-associated SNPs and ADs are presented in Figure 4A and Supplementary Figure 4A.
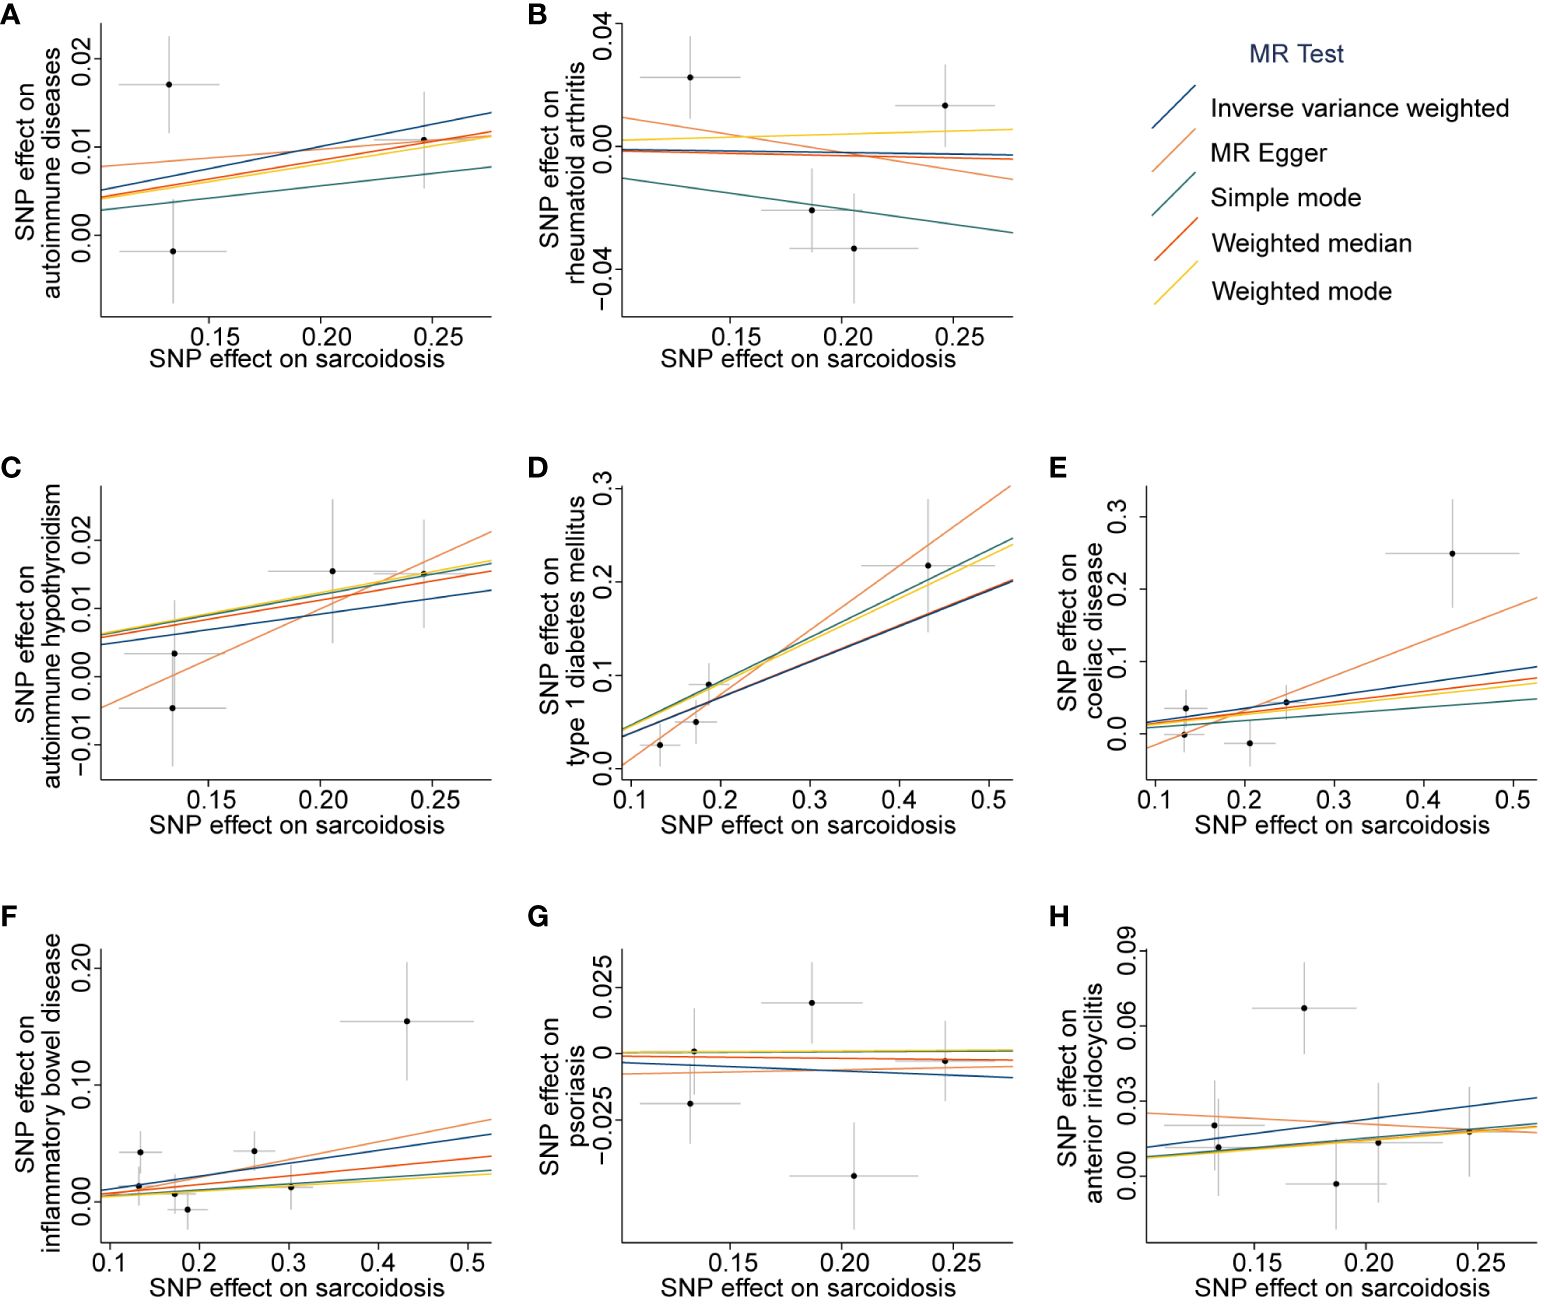
Figure 4 Scatter plots of associations between sarcoidosis-associated SNPs and outcomes. The MR analyses were conducted with the following outcomes: autoimmune diseases (A), rheumatoid arthritis (B), autoimmune hypothyroidism (C), type 1 diabetes mellitus (D), coeliac disease (E), inflammatory bowel disease (F), psoriasis (G), and anterior iridocyclitis (H). The dataset of autoimmune diseases analyzed in this study comprised a total of 44 different types of autoimmune-related diseases. SNP, Single nucleotide polymorphism; MR, Mendelian randomization.
Among the tested seven different types of autoimmune-related diseases, genetic predictors of sarcoidosis were only associated with a higher risk of T1DM (OR = 1.46, 95% CI 1.27 to 1.69, PIVW-FE = 1.15 × 10⁻⁷, Figure 2B and Supplementary Table 6). Scatter plots are presented in Figures 4B–H, and the forest plots are shown in Supplementary Figures 4B–H.
There was also no overall horizontal pleiotropy in all IVs according to the results of the MR-Egger regression and MR-PRESSO global test (all P > 0.05, Table 1). However, partial heterogeneity existed among the SNPs, as indicated by Cochran’s Q test (Table 1). The results of the leave-one-out analysis and funnel plots are shown in Supplementary Figures 5, 6. Lastly, there is no evidence of reverse causality across the analyses based on the MR Steiger test (all P < 0.001, Supplementary Table 7).
Discussion
In this study, we utilized genetic variants as unconfounded proxies for sarcoidosis and ADs to explore their causal relationship in a bidirectional MR study. The results demonstrated that genetic predictors of ADs were associated with an elevated risk of developing sarcoidosis. However, we did not find evidence supporting the notion that genetic predictors of sarcoidosis are linked to an increased risk of ADs. Moreover, the robustness of our findings was confirmed through various sensitivity analyses conducted throughout the study.
Previous studies have reported a significant association between ADs and sarcoidosis, with OR higher than 5 for specific ADs such as chronic active hepatitis, systemic lupus erythematosus, and sjögren syndrome (42–44). This close relationship suggests a potential shared immunopathogenic mechanism between sarcoidosis and ADs. Kaiser et al. (45) proposed the classification of sarcoidosis as an autoimmune spectrum disorder, although the supporting evidence remains predominantly indirect, and the cause-effect relationship between sarcoidosis and ADs is still not fully understood. In our study, we identified 87 common variants associated with ADs (including 44 different types of autoimmune-related diseases) through GWAS, and further confirmed the significant role of ADs in the development of sarcoidosis from a genetic perspective. It should be noted that previous studies have reported a relatively low percentage (11.5%-17.6%) of patients with sarcoidosis also having coexisting ADs (42–44). Therefore, the pathogenesis of sarcoidosis cannot be solely attributed to immune dysregulation, and other factors such as genetic or environmental exposures may also contribute (1). Additionally, ADs themselves may increase the risk of developing sarcoidosis after exposure to environmental triggers.
The etiology of sarcoidosis is considered multifactorial (5). Previous studies have proposed that sarcoidosis pathogenesis involves a dysregulated immune system influenced by both environmental and genetic factors, although the precise mechanisms remain incompletely understood (5). T lymphocytes, especially CD4+ T cells, have been implicated in the development of sarcoidosis (45) and other diseases such as gastrointestinal diseases (e.g., celiac disease, IBD), endocrine diseases (e.g., T1DM), liver diseases (e.g., primary biliary cholangitis), neurological diseases (e.g., multiple sclerosis), and cutaneous diseases (e.g., psoriasis) (46–48). This may explain the frequent co-occurrence of ADs with sarcoidosis. In fact, subgroup analyses in our study also revealed that genetic predictors of T1DM, celiac disease, and IBD were causally linked to an elevated risk of sarcoidosis. This indirectly further validates the frequent coexistence of autoimmune diseases and sarcoidosis, shedding light on the reasons behind the association between ADs and sarcoidosis. Recent studies have also highlighted the involvement of other cell types, including dendritic cells, CD8+ cytotoxic T cells, B cells, natural killer cells, and NKT cells, in the pathogenesis of sarcoidosis. However, further research is necessary to elucidate the precise mechanisms underlying their actions (45).
In the present study, we did not find an association between genetic predictors of sarcoidosis and an increased risk of ADs. This finding may be explained by the underlying pathogenesis of sarcoidosis. Sarcoidosis is often linked to environmental exposures and has the potential to resolve spontaneously after the cessation of these exposures (1). On the other hand, ADs are characterized by persistent immune responses against self-antigens, resulting in tissue damage (49). Therefore, the cause-effect relationship between sarcoidosis and ADs may be unidirectional, with sarcoidosis not directly contributing to the development of ADs. However, in our MR analysis, we did identify bi-directional positive causal relationships between sarcoidosis and T1DM. This finding suggests potential differences or nuances between various ADs, highlighting the need for further research to validate and comprehend the underlying reasons for these distinctions.
The primary strength of this study lies in the application of MR studies to establish causal relationships, particularly in the investigation of rare diseases such as sarcoidosis. Large prospective studies with multicenter cohorts are often challenging for rare diseases due to limited sample sizes. MR analysis, employing genetic variants as IVs, helps address potential biases encountered in traditional epidemiological studies, including confounding, selection biases, recall biases, and reverse causality (20–22). Furthermore, the use of data from the FinnGen study constitutes a crucial strength in our research. Leveraging data from a single large-scale study helps minimize bias associated with ethnic differences. This approach reduces potential confounding factors related to population diversity, thereby enhancing the reliability and generalizability of our findings.
There are several limitations in this study that should be acknowledged. First, the data used in the study were derived from the FinnGen study, which includes residents in Finland. This may limit the generalizability of the findings to other patient populations (e.g., North Americans, Australians, or Asians), as genetic and environmental factors can vary across different populations. Additionally, there is a potential bias in MR studies due to sample overlap (ranging from 0.51% to 2.71%), which could impact the accuracy of the results. Second, this study is primarily limited by the data source itself, as there was no opportunity to perform external validation using an independent cohort. Third, due to the small sample size of the FinnGen study, it was not possible to investigate the associations between each autoimmune disease and sarcoidosis individually. Instead, a pooled sample of different ADs was used to reduce bias and statistical errors associated with small sample sizes. However, this approach may not capture potential differences or nuances between different ADs. Fourth, we identified a limited number of significantly associated loci for sarcoidosis compared to ADs. The smaller sample size in sarcoidosis may account for the limited number of significant loci, which could explain the negative result in the MR analysis from sarcoidosis to ADs. Lastly, the GWAS used in this study did not account for the diversity of sarcoidosis, such as Löfgren syndrome.
Conclusion
In conclusion, this study employed a large GWAS to perform a MR investigation into the potential causal relationship between sarcoidosis and ADs. The results provided robust genetic evidence supporting a significant causal effect of genetic predictors of ADs, such as T1DM, celiac disease, and IBD, on the development of sarcoidosis. Conversely, genetic predictors of sarcoidosis were not found to be linked to ADs. These findings provide potential insights into the underlying autoimmune mechanisms of sarcoidosis.
Data availability statement
The original contributions presented in the study are included in the article/Supplementary Material. Further inquiries can be directed to the corresponding author.
Ethics statement
Ethical approval was not required for the study involving humans in accordance with the local legislation and institutional requirements. Written informed consent to participate in this study was not required from the participants or the participants’ legal guardians/next of kin in accordance with the national legislation and the institutional requirements.
Author contributions
DS: Data curation, Formal Analysis, Methodology, Writing – original draft. RM: Data curation, Formal Analysis, Writing – review & editing. JW: Data curation, Writing – review & editing. YW: Data curation, Writing – review & editing. QY: Funding acquisition, Methodology, Resources, Supervision, Validation, Writing – review & editing.
Funding
The author(s) declare that financial support was received for the research, authorship, and/or publication of this article. This study was supported by High Level Public Health Technology Talent Construction Project (DL-02-21) and Reform and Development Program of Beijing Institute of Respiratory Medicine (Ggyfz202410).
Acknowledgments
We want to acknowledge the participants and investigators of the FinnGen study.
Conflict of interest
The authors declare that the research was conducted in the absence of any commercial or financial relationships that could be construed as a potential conflict of interest.
Publisher’s note
All claims expressed in this article are solely those of the authors and do not necessarily represent those of their affiliated organizations, or those of the publisher, the editors and the reviewers. Any product that may be evaluated in this article, or claim that may be made by its manufacturer, is not guaranteed or endorsed by the publisher.
Supplementary material
The Supplementary Material for this article can be found online at: https://www.frontiersin.org/articles/10.3389/fimmu.2024.1325127/full#supplementary-material
Supplementary Figure 1 | Forest plot for the causal effect of each exposures-associated SNP on sarcoidosis risk. The MR analyses were conducted with various exposures, including autoimmune diseases (A), rheumatoid arthritis (B), autoimmune hypothyroidism (C), type 1 diabetes mellitus (D), coeliac disease (E), inflammatory bowel disease (F), psoriasis (G), and anterior iridocyclitis (H). The dataset of autoimmune diseases analyzed in this study comprised a total of 44 different types of autoimmune-related diseases. SNP, Single nucleotide polymorphism; MR, Mendelian randomization.
Supplementary Figure 2 | Leave-one-out analyses for SNPs associated with exposures on sarcoidosis. The MR analyses were conducted with various exposures, including: autoimmune diseases (A), rheumatoid arthritis (B), autoimmune hypothyroidism (C), type 1 diabetes mellitus (D), coeliac disease (E), inflammatory bowel disease (F), psoriasis (G), and anterior iridocyclitis (H). The dataset of autoimmune diseases analyzed in this study comprised a total of 44 different types of autoimmune-related diseases. MR, Mendelian randomization; SNPs, Single nucleotide polymorphisms.
Supplementary Figure 3 | Funnel plots for overall heterogeneity in the effect of exposures on sarcoidosis. The MR analyses were conducted with various exposures, including autoimmune diseases (A), rheumatoid arthritis (B), autoimmune hypothyroidism (C), type 1 diabetes mellitus (D), coeliac disease (E), inflammatory bowel disease (F), psoriasis (G), and anterior iridocyclitis (H). The dataset of autoimmune diseases analyzed in this study comprised a total of 44 different types of autoimmune-related diseases. MR, Mendelian randomization; SE, Standard error; IV, Instrumental variable.
Supplementary Figure 4 | Forest plots for the causal effect of each sarcoidosis-associated SNP on outcomes risk. The MR analyses were conducted with the following outcomes: autoimmune diseases (A), rheumatoid arthritis (B), autoimmune hypothyroidism (C), type 1 diabetes mellitus (D), coeliac disease (E), inflammatory bowel disease (F), psoriasis (G), and anterior iridocyclitis (H). The dataset of autoimmune diseases analyzed in this study comprised a total of 44 different types of autoimmune-related diseases. SNP, Single nucleotide polymorphism; MR, Mendelian randomization.
Supplementary Figure 5 | Leave-one-out analyses for SNPs associated with sarcoidosis on outcomes. The MR analyses were conducted with the following outcomes: autoimmune diseases (A), rheumatoid arthritis (B), autoimmune hypothyroidism (C), type 1 diabetes mellitus (D), coeliac disease (E), inflammatory bowel disease (F), psoriasis (G), and anterior iridocyclitis (H). The dataset of autoimmune diseases analyzed in this study comprised a total of 44 different types of autoimmune-related diseases. MR, Mendelian randomization; SNPs, Single nucleotide polymorphisms.
Supplementary Figure 6 | Funnel plots for overall heterogeneity in the effect of sarcoidosis on outcomes. The MR analyses were conducted with the following outcomes: autoimmune diseases (A), rheumatoid arthritis (B), autoimmune hypothyroidism (C), type 1 diabetes mellitus (D), coeliac disease (E), inflammatory bowel disease (F), psoriasis (G), and anterior iridocyclitis (H). The dataset of autoimmune diseases analyzed in this study comprised a total of 44 different types of autoimmune-related diseases. MR, Mendelian randomization; SE, Standard error; IV, Instrumental variable.
References
1. Grunewald J, Grutters JC, Arkema EV, Saketkoo LA, Moller DR, Muller-Quernheim J. Sarcoidosis. Nat Rev Dis Primers. (2019) 5:45. doi: 10.1038/s41572-019-0096-x
2. Rossides M, Kullberg S, Askling J, Eklund A, Grunewald J, Arkema EV. Sarcoidosis mortality in Sweden: a population-based cohort study. Eur Respir J. (2018) 51(2):1701815. doi: 10.1183/13993003.01815-2017
3. Gerke AK, Judson MA, Cozier YC, Culver DA, Koth LL. Disease burden and variability in sarcoidosis. Ann Am Thorac Soc. (2017) 14:S421–8. doi: 10.1513/AnnalsATS.201707-564OT
4. Park JE, Kim YS, Kang MJ, Kim CJ, Han CH, Lee SM, et al. Prevalence, incidence, and mortality of sarcoidosis in Korea, 2003-2015: A nationwide population-based study. Respir Med. (2018) 144S:S28–34. doi: 10.1016/j.rmed.2018.03.028
5. Rossides M, Darlington P, Kullberg S, Arkema EV. Sarcoidosis: Epidemiology and clinical insights. J Intern Med. (2023) 293(6):668–80. doi: 10.1111/joim.13629
6. Pietinalho A, Hiraga Y, Hosoda Y, Lofroos AB, Yamaguchi M, Selroos O. The frequency of sarcoidosis in Finland and Hokkaido, Japan. A comparative epidemiological study. Sarcoidosis. (1995) 12:61–7.
7. Baughman RP, Field S, Costabel U, Crystal RG, Culver DA, Drent M, et al. Sarcoidosis in america. Analysis based on health care use. Ann Am Thorac Soc. (2016) 13:1244–52. doi: 10.1513/AnnalsATS.201511-760OC
8. Fidler LM, Balter M, Fisher JH, To T, Stanbrook MB, Gershon A. Epidemiology and health outcomes of sarcoidosis in a universal healthcare population: a cohort study. Eur Respir J. (2019) 54(4):1900444. doi: 10.1183/13993003.00444-2019
9. Gillman A, Steinfort C. Sarcoidosis in Australia. Intern Med J. (2007) 37:356–9. doi: 10.1111/j.1445-5994.2007.01365.x
10. Yoon HY, Kim HM, Kim YJ, Song JW. Prevalence and incidence of sarcoidosis in Korea: a nationwide population-based study. Respir Res. (2018) 19:158. doi: 10.1186/s12931-018-0871-3
11. Lu Q. Unmet needs in autoimmunity and potential new tools. Clin Rev Allergy Immunol. (2014) 47:111–8. doi: 10.1007/s12016-014-8414-2
12. Hemminki K, Li X, Sundquist J, Sundquist K. Familial association between type 1 diabetes and other autoimmune and related diseases. Diabetologia. (2009) 52:1820–8. doi: 10.1007/s00125-009-1427-3
13. Yoshioka K, Nishimura S, Kitai S, Kondo M. Association of sarcoidosis, insulin-dependent diabetes mellitus, and ulcerative colitis. Arch Intern Med. (1997) 157:465,467. doi: 10.1001/archinte.157.4.465
14. Emilsson L, Wijmenga C, Murray JA, Ludvigsson JF. Autoimmune disease in first-degree relatives and spouses of individuals with celiac disease. Clin Gastroenterol Hepatol. (2015) 13:1271–1277.e1272. doi: 10.1016/j.cgh.2015.01.026
15. Wijarnpreecha K, Panjawatanan P, Corral JE, Lukens FJ, Ungprasert P. Celiac disease and risk of sarcoidosis: A systematic review and meta-analysis. J Evid Based Med. (2019) 12:194–9. doi: 10.1111/jebm.12355
16. Black H, Mendoza M, Murin S. Thoracic manifestations of inflammatory bowel disease. Chest. (2007) 131:524–32. doi: 10.1378/chest.06-1074
17. Cerri S, du Bois RM, Spagnolo P. Genetic commonality between inflammatory bowel disease and sarcoidosis: the beginning of the end or the end of the beginning? Eur Respir J. (2011) 37:489–91. doi: 10.1183/09031936.00160310
18. Halling ML, Kjeldsen J, Knudsen T, Nielsen J, Hansen LK. Patients with inflammatory bowel disease have increased risk of autoimmune and inflammatory diseases. World J Gastroenterol. (2017) 23:6137–46. doi: 10.3748/wjg.v23.i33.6137
19. Song M, Manansala M, Parmar PJ, Ascoli C, Rubinstein I, Sweiss NJ. Sarcoidosis and autoimmunity. Curr Opin Pulm Med. (2021) 27:448–54. doi: 10.1097/MCP.0000000000000809
20. Smith GD, Ebrahim S. ‘Mendelian randomization’: can genetic epidemiology contribute to understanding environmental determinants of disease? Int J Epidemiol. (2003) 32:1–22. doi: 10.1093/ije/dyg070
21. Burgess S, Butterworth AS, Thompson JR. Beyond Mendelian randomization: how to interpret evidence of shared genetic predictors. J Clin Epidemiol. (2016) 69:208–16. doi: 10.1016/j.jclinepi.2015.08.001
22. Davey Smith G, Hemani G. Mendelian randomization: genetic anchors for causal inference in epidemiological studies. Hum Mol Genet. (2014) 23:R89–98. doi: 10.1093/hmg/ddu328
23. Kurki MI, Karjalainen J, Palta P, Sipila TP, Kristiansson K, Donner KM, et al. FinnGen provides genetic insights from a well-phenotyped isolated population. Nature. (2023) 613:508–18. doi: 10.1038/s41586-022-05473-8
24. Didelez V, Sheehan N. Mendelian randomization as an instrumental variable approach to causal inference. Stat Methods Med Res. (2007) 16:309–30. doi: 10.1177/0962280206077743
25. Skrivankova VW, Richmond RC, Woolf BAR, Yarmolinsky J, Davies NM, Swanson SA, et al. Strengthening the reporting of observational studies in epidemiology using mendelian randomization: the STROBE-MR statement. JAMA. (2021) 326:1614–21. doi: 10.1001/jama.2021.18236
26. Skrivankova VW, Richmond RC, Woolf BAR, Davies NM, Swanson SA, VanderWeele TJ, et al. Strengthening the reporting of observational studies in epidemiology using mendelian randomisation (STROBE-MR): explanation and elaboration. BMJ. (2021) 375:n2233. doi: 10.1136/bmj.n2233
27. Staley JR, Blackshaw J, Kamat MA, Ellis S, Surendran P, Sun BB, et al. PhenoScanner: a database of human genotype-phenotype associations. Bioinformatics. (2016) 32:3207–9. doi: 10.1093/bioinformatics/btw373
28. Kamat MA, Blackshaw JA, Young R, Surendran P, Burgess S, Danesh J, et al. PhenoScanner V2: an expanded tool for searching human genotype-phenotype associations. Bioinformatics. (2019) 35:4851–3. doi: 10.1093/bioinformatics/btz469
29. Verbanck M, Chen CY, Neale B, Do R. Detection of widespread horizontal pleiotropy in causal relationships inferred from Mendelian randomization between complex traits and diseases. Nat Genet. (2018) 50:693–8. doi: 10.1038/s41588-018-0099-7
30. Xu H, Wu Z, Feng F, Li Y, Zhang S. Low vitamin D concentrations and BMI are causal factors for primary biliary cholangitis: A mendelian randomization study. Front Immunol. (2022) 13:1055953. doi: 10.3389/fimmu.2022.1055953
31. Yao S, Zhang M, Dong SS, Wang JH, Zhang K, Guo J, et al. Bidirectional two-sample Mendelian randomization analysis identifies causal associations between relative carbohydrate intake and depression. Nat Hum Behav. (2022) 6:1569–76. doi: 10.1038/s41562-022-01412-9
32. Palmer TM, Lawlor DA, Harbord RM, Sheehan NA, Tobias JH, Timpson NJ, et al. Using multiple genetic variants as instrumental variables for modifiable risk factors. Stat Methods Med Res. (2012) 21:223–42. doi: 10.1177/0962280210394459
33. Burgess S, Butterworth A, Thompson SG. Mendelian randomization analysis with multiple genetic variants using summarized data. Genet Epidemiol. (2013) 37:658–65. doi: 10.1002/gepi.21758
34. Bowden J, Davey Smith G, Burgess S. Mendelian randomization with invalid instruments: effect estimation and bias detection through Egger regression. Int J Epidemiol. (2015) 44:512–25. doi: 10.1093/ije/dyv080
35. Bowden J, Davey Smith G, Haycock PC, Burgess S. Consistent estimation in mendelian randomization with some invalid instruments using a weighted median estimator. Genet Epidemiol. (2016) 40:304–14. doi: 10.1002/gepi.21965
36. Hartwig FP, Davey Smith G, Bowden J. Robust inference in summary data Mendelian randomization via the zero modal pleiotropy assumption. Int J Epidemiol. (2017) 46:1985–98. doi: 10.1093/ije/dyx102
37. Bowden J, Del Greco MF, Minelli C, Davey Smith G, Sheehan N, Thompson J. A framework for the investigation of pleiotropy in two-sample summary data Mendelian randomization. Stat Med. (2017) 36:1783–802. doi: 10.1002/sim.7221
38. Bowden J, Del Greco MF, Minelli C, Zhao Q, Lawlor DA, Sheehan NA, et al. Improving the accuracy of two-sample summary-data Mendelian randomization: moving beyond the NOME assumption. Int J Epidemiol. (2019) 48:728–42. doi: 10.1093/ije/dyy258
39. Hemani G, Bowden J, Davey Smith G. Evaluating the potential role of pleiotropy in Mendelian randomization studies. Hum Mol Genet. (2018) 27:R195–208. doi: 10.1093/hmg/ddy163
40. Hemani G, Tilling K, Davey Smith G. Orienting the causal relationship between imprecisely measured traits using GWAS summary data. PloS Genet. (2017) 13:e1007081. doi: 10.1371/journal.pgen.1007081
41. Hemani G, Zheng J, Elsworth B, Wade KH, Haberland V, Baird D, et al. The MR-Base platform supports systematic causal inference across the human phenome. Elife. (2018) 7:e34408. doi: 10.7554/eLife.34408
42. Wu CH, Chung PI, Wu CY, Chen YT, Chiu YW, Chang YT, et al. Comorbid autoimmune diseases in patients with sarcoidosis: A nationwide case-control study in Taiwan. J Dermatol. (2017) 44:423–30. doi: 10.1111/1346-8138.13654
43. Yildiz F, Kobak S, SemIz H, Orman M. Concomitant autoimmune diseases in patients with sarcoidosis in Turkey. Arch Rheumatol. (2020) 35:259–63. doi: 10.46497/ArchRheumatol.2020.7649
44. Brito-Zeron P, Perez-Alvarez R, Feijoo-Masso C, Gracia-Tello B, Gonzalez-Garcia A, Gomez-de-la-Torre R, et al. Coexistence of immune-mediated diseases in sarcoidosis. Frequency and clinical significance in 1737 patients. Joint Bone Spine. (2021) 88:105236. doi: 10.1016/j.jbspin.2021.105236
45. Kaiser Y, Eklund A, Grunewald J. Moving target: shifting the focus to pulmonary sarcoidosis as an autoimmune spectrum disorder. Eur Respir J. (2019) 54(1):1802153. doi: 10.1183/13993003.021532018
46. Sakaguchi S, Toda M, Asano M, Itoh M, Morse SS, Sakaguchi N. T cell-mediated maintenance of natural self-tolerance: its breakdown as a possible cause of various autoimmune diseases. J Autoimmun. (1996) 9:211–20. doi: 10.1006/jaut.1996.0026
47. Koning F, Thomas R, Rossjohn J, Toes RE. Coeliac disease and rheumatoid arthritis: similar mechanisms, different antigens. Nat Rev Rheumatol. (2015) 11:450–61. doi: 10.1038/nrrheum.2015.59
48. Geremia A, Biancheri P, Allan P, Corazza GR, Di Sabatino A. Innate and adaptive immunity in inflammatory bowel disease. Autoimmun Rev. (2014) 13:3–10. doi: 10.1016/j.autrev.2013.06.004
Keywords: sarcoidosis, autoimmune diseases, Mendelian randomization, FinnGen, causality
Citation: Sun D, Ma R, Wang J, Wang Y and Ye Q (2024) The causal relationship between sarcoidosis and autoimmune diseases: a bidirectional Mendelian randomization study in FinnGen. Front. Immunol. 15:1325127. doi: 10.3389/fimmu.2024.1325127
Received: 20 October 2023; Accepted: 09 April 2024;
Published: 22 April 2024.
Edited by:
Dongyi He, Shanghai Guanghua Rheumatology Hospital, ChinaReviewed by:
Ran Wang, Anhui Medical University, ChinaElizabeth Frame, Cedars Sinai Medical Center, United States
Copyright © 2024 Sun, Ma, Wang, Wang and Ye. This is an open-access article distributed under the terms of the Creative Commons Attribution License (CC BY). The use, distribution or reproduction in other forums is permitted, provided the original author(s) and the copyright owner(s) are credited and that the original publication in this journal is cited, in accordance with accepted academic practice. No use, distribution or reproduction is permitted which does not comply with these terms.
*Correspondence: Qiao Ye, eWVxaWFvX2NoYW95YW5nQHNpbmEuY29t