
94% of researchers rate our articles as excellent or good
Learn more about the work of our research integrity team to safeguard the quality of each article we publish.
Find out more
ORIGINAL RESEARCH article
Front. Immunol., 30 May 2024
Sec. T Cell Biology
Volume 15 - 2024 | https://doi.org/10.3389/fimmu.2024.1306490
This article is part of the Research TopicMechanisms of T cell Dysfunction in Chronic Inflammatory DiseasesView all 4 articles
 Sara E. Sabbagh1†
 Dipica Haribhai1†
 Jill A. Gershan2
 James Verbsky1James Nocton1Maryam Yassai3
 Elena N. Naumova4Erin Hammelev1Mahua Dasgupta5Ke Yan5
 Jack Gorski3
 Calvin B. Williams1*
Recurrent exposures to a pathogenic antigen remodel the CD8+ T cell compartment and generate a functional memory repertoire that is polyclonal and complex. At the clonotype level, the response to the conserved influenza antigen, M158–66 has been well characterized in healthy individuals, but not in patients receiving immunosuppressive therapy or with aberrant immunity, such as those with juvenile idiopathic arthritis (JIA). Here we show that patients with JIA have a reduced number of M158–66 specific RS/RA clonotypes, indicating decreased clonal richness and, as a result, have lower repertoire diversity. By using a rank-frequency approach to analyze the distribution of the repertoire, we found several characteristics of the JIA T cell repertoire to be akin to repertoires seen in healthy adults, including an amplified RS/RA-specific antigen response, representing greater clonal unevenness. Unlike mature repertoires, however, there is more fluctuation in clonotype distribution, less clonotype stability, and more variable IFNy response of the M158–66 specific RS/RA clonotypes in JIA. This indicates that functional clonal expansion is altered in patients with JIA on immunosuppressive therapies. We propose that the response to the influenza M158–66 epitope described here is a general phenomenon for JIA patients receiving immunosuppressive therapy, and that the changes in clonal richness and unevenness indicate a retarded and uneven generation of a mature immune response.
Juvenile idiopathic arthritis (JIA) is the most common chronic inflammatory rheumatic disease in childhood. It is characterized by chronic joint inflammation due to immune dysregulation and is treated with immunosuppressive medication. Although aggressive treatment of JIA can improve long-term outcomes (1), it may increase the risk of infection (2). Due to iatrogenic and inherent immunocompromise, much emphasis has been placed on vaccination of patients with chronic inflammatory rheumatic diseases (3, 4). However, data is limited and mixed regarding vaccine efficacy in this patient population (5–12). This has come to the forefront given the outbreak of the SARS-CoV-2 pandemic and development of SARS-CoV-2 vaccines. There is accumulating evidence that immunocompromised patients may not mount an adequate antibody response to SARS-CoV-2 vaccines (13, 14) and some clinicians have anecdotally held therapeutic immunosuppression to optimize SARS-CoV-2 vaccine efficacy (15). Overall, the immunogenicity of vaccines given to children with iatrogenic and/or inherent immunosuppression is poorly described, making clinical recommendations challenging.
The development of an adequate antiviral immune response following antigen exposure depends on clonal expansion of pathogen-specific memory T cells (16). The clones that expand are defined by their unique T cell receptor (TCR) alpha and beta chain third complementarity-determining regions (CDR3) nucleotide sequences and are referred to as clonotypes. T cell clonotype diversity is generated during the recombination events which affect the final nucleotide sequences in the TCR alpha and beta chain CDR3. Following repeated encounters with a foreign antigen, the T cell memory compartment becomes remodeled, generating a functional memory repertoire that is polyclonal and complex. Although our understanding of the SARS-CoV-2-specific T-cell response remains in its infancy (16), T cell clonotype response following exposure to the conserved influenza antigen, M158–66 (GILGFVFTL) has been well characterized (17–29). Against the M158–66 influenza antigen there is a polyclonal memory T cell recall response with primary usage of the TCR beta chain Variable19 (βV19, formerly referred to as βV17) gene (17–19) in HLA-A2 individuals. This βV19 TCR gene region has a predominant group of clonotypes with a CDR3 length of 11 amino acids (CDR3(11)) and contains an Arginine/Serine (RS), and less frequently, an Arginine/Alanine (RA) motif in the TCR (RS/RA) (17, 19, 21).
We have previously shown that in HLA-A2 healthy controls, the recall repertoire response to the conserved influenza M158–66 epitope generates few RS/RA clonotypes present at high frequency, more RS/RA clonotypes at intermediate frequencies, and a large number (often over 50%) at very low frequencies (19, 27, 30). We have previously characterized T cell repertoires with clonal expansion using mathematically defined properties of richness, unevenness, and diversity (31). These properties within an individual TCR repertoire are broadly applicable to understanding the adaptive cell-mediated immune response in disease states.
To date, analysis of T cell clonal expansion following vaccination has not been described in patients receiving immunosuppressive therapy or with aberrant immunity, such as those with JIA. Therefore, the goal of this study was to better understand the adaptive cell-mediated immune response to vaccination in JIA patients on immunosuppressive therapies. Here we describe how the T cell recall response to the influenza M158–66 epitope in HLA-A2 JIA patients receiving immunosuppressive therapy displays reduced clonal diversity compared to HLA-A2 healthy pediatric controls.
Blood samples were obtained from neonates, pediatric healthy controls and pediatric JIA patients. Peripheral blood mononuclear cells (PBMCs) were separated by density gradient centrifugation using Ficoll Histopaque and stored at -80°C. Subjects included 5 HLA-A2 patients with polyarticular or extended oligoarticular JIA between the ages of 6 and 16, 6 healthy control children (4 females and 2 males) between the ages of 6 to 14 years and 6 HLA-A2 newborns (sex unknown) between the ages of 5 to 128 days that were undergoing corrective surgery for heart defects not associated with 22q11 deletion syndrome. Neonate samples were used as controls representative of antigen inexperienced (naïve) individuals. Healthy control children and patients with JIA were seen at the rheumatology clinic of Children’s Hospital of Wisconsin (CW) and enrolled under the protocol CW IRBnet: 116305 “Generation and decay of memory T cells in children with Juvenile Arthritis and healthy siblings following administration of trivalent inactivated influenza vaccine.” International Board Review approval was granted by CW and written informed consent was obtained. Inclusion criteria for subjects included JIA patients between the ages of 3 and 18 years old, HLA-A2 and/or HLA DR1*01 or DRB1*04, and immunosuppression longer than three weeks with any of the following medications or combinations thereof: prednisone ≥ 0.2 mg/kg daily or 10 mg daily, methotrexate ≥ 10 mg/m2/week or 10 mg/week, and/or biologic response modifier (BRM) used at standard-of-care doses for JIA. Inclusion criteria for healthy controls included any healthy child between the ages of 3 and 18 years old who are HLA-A2 and/or HLA DR1*01 or DRB1*04 positive and who do not have chronic use of systemic immunosuppressant medications. Study visits were at 0 (baseline), 1, 6, 12, 13, 18, 24, 25, 30, 36, 37, 42, 48, and 54 months with influenza vaccine administered at baseline, 12, 24, 36, and 48-month visits. Participants received the annual trivalent non-adjuvanted inactivated vaccine (Fluzone, Sanofi-Pasteur MSD, Madrid, Spain) for at least 4 consecutive years (Supplementary Table 1). Patients were able to enroll at any time point during the study with blood sample collection at 1 and 6-months post-vaccinations. The Physician Global Assessment (PGA) (a 10 cm visual analog scale (VAS) which rates overall disease activity with anchors of ‘0 = no activity’ and ‘10 = maximum activity’) and the Patient/Parent Global Assessment (a 0–10 VAS which ranks the child’s overall well-being) were obtained at each study visit. Medications and number of active joints (joint count) were recorded at each visit. The clinical Juvenile Arthritis Disease Activity Score (cJADAS) was computed by the sum of the PGA, the parent/child global assessment, and the active joint count in 71 joints, yielding a global score between 0 and 91.
HLA typing was performed by the Versiti Blood Center of Wisconsin Histocompatibility and Immunogenetics Laboratory.
Influenza-specific peptide, M158–66 (GILGFVFTL), was synthesized in the Versiti Blood Center of Wisconsin Peptide Core.
Expansion of influenza virus M158–66 -specific T cells were produced as previously described (27). Briefly, thawed peripheral blood mononuclear cells (PBMCs) were cultured in R10 media (human) at 1×10⁶ cells/ml for 24 hours. On day 2, non-adherent PBMCs were removed and cultured with recombinant IL2 (10U/ml) for 7 days. Adherent cells were cultured for 7 days with granulocyte-macrophage colony-stimulating factor (100ng/ml), IL4 (50ng/ml) and 1μM of influenza A matrix peptide M158–66 (32). On day 7 of culture, peptide loaded adherent cells were irradiated (3000R) and cultured with the non-adherent PBMCs in IL2 (10U/ml) and M158–66 peptide for an additional 7 days. The goal of this short 2-week culture period is to activate and expand or “recall” memory influenza matrix peptide M158–66-specific T cells. These cells were then used for spectratyping and clonotyping.
As previously described (28), CD8+ T cells were isolated from PBMCs that were expanded in the M158–66 recall culture using the Dynabeads™ Human CD8+ isolation kit (Invitrogen, Carlsbad, CA) according to the manufacturer’s direction. CD8+ T cell mRNA was isolated using the DynaBeads mRNA direct kit according to the manufacturer’s instruction (Invitrogen, Carlsbad, CA). cDNA was prepared using Poly T primer (5’ TTTTTTTTTTTTTTTTTT3’) and M-MLV reverse transcriptase (Invitrogen).
The CDR3 length analysis (spectratyping) was performed by PCR amplification of CD8+ T cell cDNA using the βV19 TCR primer (5’ CCAAAAGAACCCGACAGCTTTC3’) and a carboxyfluorescein (FAM)-labeled TCRβ constant (BC) region primer (5’CTGTGTTTGAGCCATCAGAAGC3’) (28, 33). All primers were synthesized by Integrated DNA Technologies (Coralville, Iowa). To obtain a representative message for βV19, different volumes of cDNA (0.25, 0.5, and 1 ul) were PCR amplified with the primer pair for 24–30 cycles. PCR products were purified using the AMPure PCR purification kit (Beckman Coulter, Brea, CA) per manufacturer’s direction. For spectratyping analysis, 1–2μl of amplified product was combined with 9μl of deionized Formamide/Liz 500 size standard (900μl Formamide + 50μl Liz standard). Samples were heat denatured at 90°C for 3 minutes and then loaded onto an ABI 3130XL Gene Analyzer (Applied Biosystems). GeneScan software (Applied Biosystems) was used for data collection. The files were analyzed using proprietary software (GeneGeek) which gives the Relative Frequency of each CDR3 length (28).
The βV19 PCR products (described above) were cloned into E. Coli using the TOPO Cloning kit (Invitrogen). Bacterial colonies were grown overnight were sent to Agencourt Bioscience (Beverly, MA) for sequencing. Each CD3 region was PCR amplified and the length 11 band was subcloned for sequencing. Clonotype sequences were analyzed using CDR3 Reader software, which counts identical sequences and assigns clonotype names according to the convention described (34).
PBMCs were cultured as described above in the recall culture assay. After 2 weeks in culture, PBMCs were stained with anti-CD8 allophycocyanin (APC) and sorted (FACSAria cell sorter (BD Biosciences, San Jose, CA)). The sorted CD8 cells were stained with anti-CD3 fluorescein (FITC) and anti-TCR Vβ19 phycoerythrin (PE), then fixed and permeabilized for intracellular staining with anti-IFNγ. Intracellular staining was performed using the Intracellular Fixation and Permeabilization Kit per manufacturer’s direction (Invitrogen). The percentage of CD3+CD8+Vβ19+IFNγ+ cells were reported. Healthy control C1 did not have adequate sample available for this analysis.
For each subject, the repertoires are described by clonal richness, or the total number of unique clonotypes observed (N), and clonal unevenness. The number of times each unique clonotype occurs is also referred to as its Rank, where clonotypes with a rank of 1 are observed once, as single copies, henceforth referred to as Singletons (Ns). To gauge extremes of clonotype distribution, the highest ranking clonotype (Rmax) is used to characterize repertoire unevenness. A repertoire is thought to be robust and resilient to distortions if it is rich in species (i.e., clonotypes) and their abundance is uneven (35).
In order to correct for individual sample size, Rank, Rmax, and Singletons are normalized for the total number of nucleotide sequences (M) or total number of unique clonotypes (N) observed in an individual, depending on which population they describe. Thus, rank is reported as Relative Rank (), Rmax is reported as Relative Rmax () and Singletons are reported as Relative Singletons ().
Repertoire distribution of the RS clonotypes can also be described using a Rank Frequency approach (19, 20, 36). In this model, the number of unique clonotypes in each Rank is reported as Rank Frequency. Rank Frequency for each group is also normalized for the total number of RS clonotypes (N) and referred to as Relative Rank Frequency (). The repertoire distribution can be visualized when the Relative Rank Frequency is plotted on the Y-axis and the Relative Rank is plotted on the X-axis. The data are compatible with a single component power law-like distribution and a log/log transformation of the data (log y = log a – b log x) yields a straight line, in which the parameter a is an intercept of a regression line and indicates the frequency of observing single-copy clonotypes, and parameter b is a slope of a regression line and describes the shape of the curve by indicating how rapidly the curve decays (19, 37). These measures are used to provide a general overview of the clonotype distribution between the two extremes of Singletons and Rmax.
We measure repertoire diversity drawing on definitions of species diversity in an ecosystem. Species diversity is a reflection of both species richness and species abundance, or the overall representation of a species in a system. Similarly, repertoire diversity is a reflection of clonotype richness and clonotype unevenness (Rmax), which is a reflection of clonotype abundance (31). Thus, repertoire diversity (Dc) is an indicator of both clonal richness (N) and clonal unevenness (Relative Rmax). Repertoire diversity can be calculated as the contribution of the most frequent clonotype in the repertoire (), as proportional to the number of clonotypes, and is estimated as .
We used a similar approach to characterize the RS/RA clonotype temporal stability within the repertoire. The stability of the clonotype is defined as the number of times it was observed across repeated measurements. Clonotypes observed at all times analyzed are considered stable and clonotypes observed only at one time unstable. Because the measurement of temporal stability is based on multiple time points, more time points should provide a better estimation of stability. To compensate for small differences in the number of time points, we introduce a Relative Stability characteristic of the repertoire in which observation at one time is equal to a stability of 0, observation at all times is equal to a Relative Stability of 1. Thus, the Relative Stability of a clonotype is calculated as: The average Relative Stability of all the clonotypes at a given rank is the average of all the individual Relative Stabilities of clonotypes at that rank. Thus, clonotypes with rank lower than six in the pooled repertoire that consists of six time points are not stable.
Pairwise comparisons of continuous variables were made with Student’s t-test or Mann Whitney U, as appropriate. Comparisons of combined cohort data was performed using Generalized Estimating Equation with repeated measures (subjects as clusters with uniform covariate structure). Quadratic models were fitted to check the relationship between Relative Rank and Relative Rank Frequency, and to compare the two groups. All statistical analyses were performed using SAS V9.4. As this was an exploratory study, a two-sided p value of<0.05 was considered statistically significant.
Three patients had extended oligoarticular JIA and two had polyarticular disease. All patients received non-steroidal anti-inflammatory drugs (NSAIDs) and immunosuppressive therapy with methotrexate. Patient J1 and J4 also received biologic therapy (Table 1). Patient J4 had persistently active arthritis with a max PGA of 10, max joint count of 54, and max cJADAS score of 70 prompting addition of IV abatacept. Similarly, patient J1 also had persistently active arthritis with max PGA of 8, max joint count of 5, and max cJADAS of 17, prompting biologic therapy with multiple medications including etanercept, infliximab, and adalimumab (Table 1).
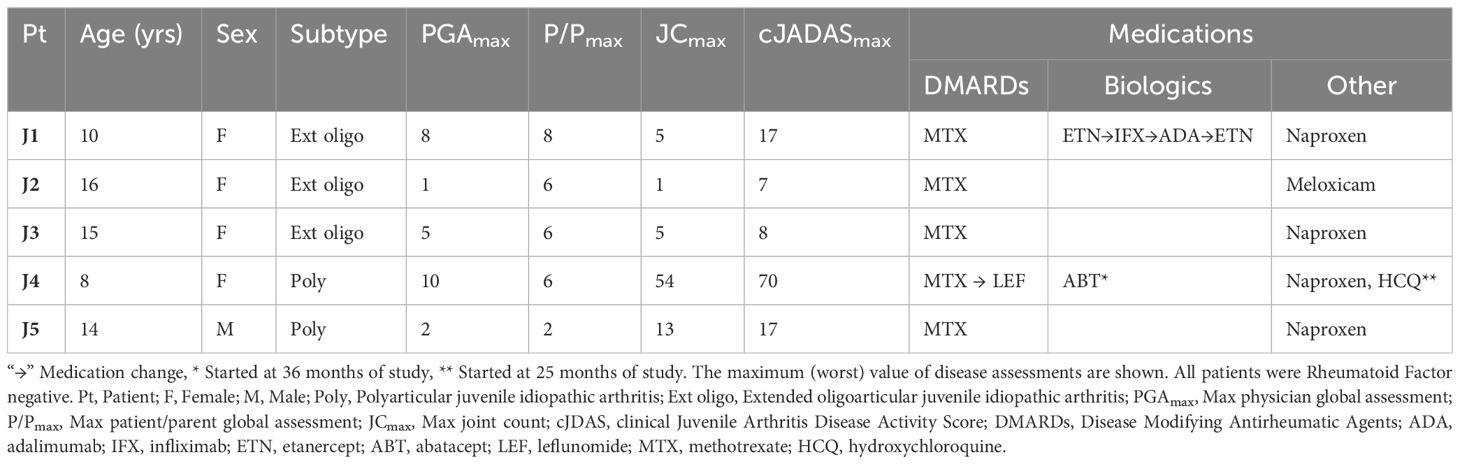
Table 1 JIA disease demographics, characteristics and medications.
There is a known adult polyclonal response of memory T cells to influenza M158–66 peptide. The repertoire is reported to be highly polyclonal and complex with a few clonotypes present at high frequency, some at intermediate frequency and most (often over 50%) at very low frequencies (19, 20, 27). In response to the M158–66 peptide, CD8+ T cells using the βV19 gene region with a CDR3(11) RS/RA motif in the NDN region are predominantly expanded (Figure 1A). Using this sequence as a reference, we examined the CD8+ T cell response to M158–66 peptide in HLA-A2+ JIA patients and HLA-A2+ healthy pediatric controls.
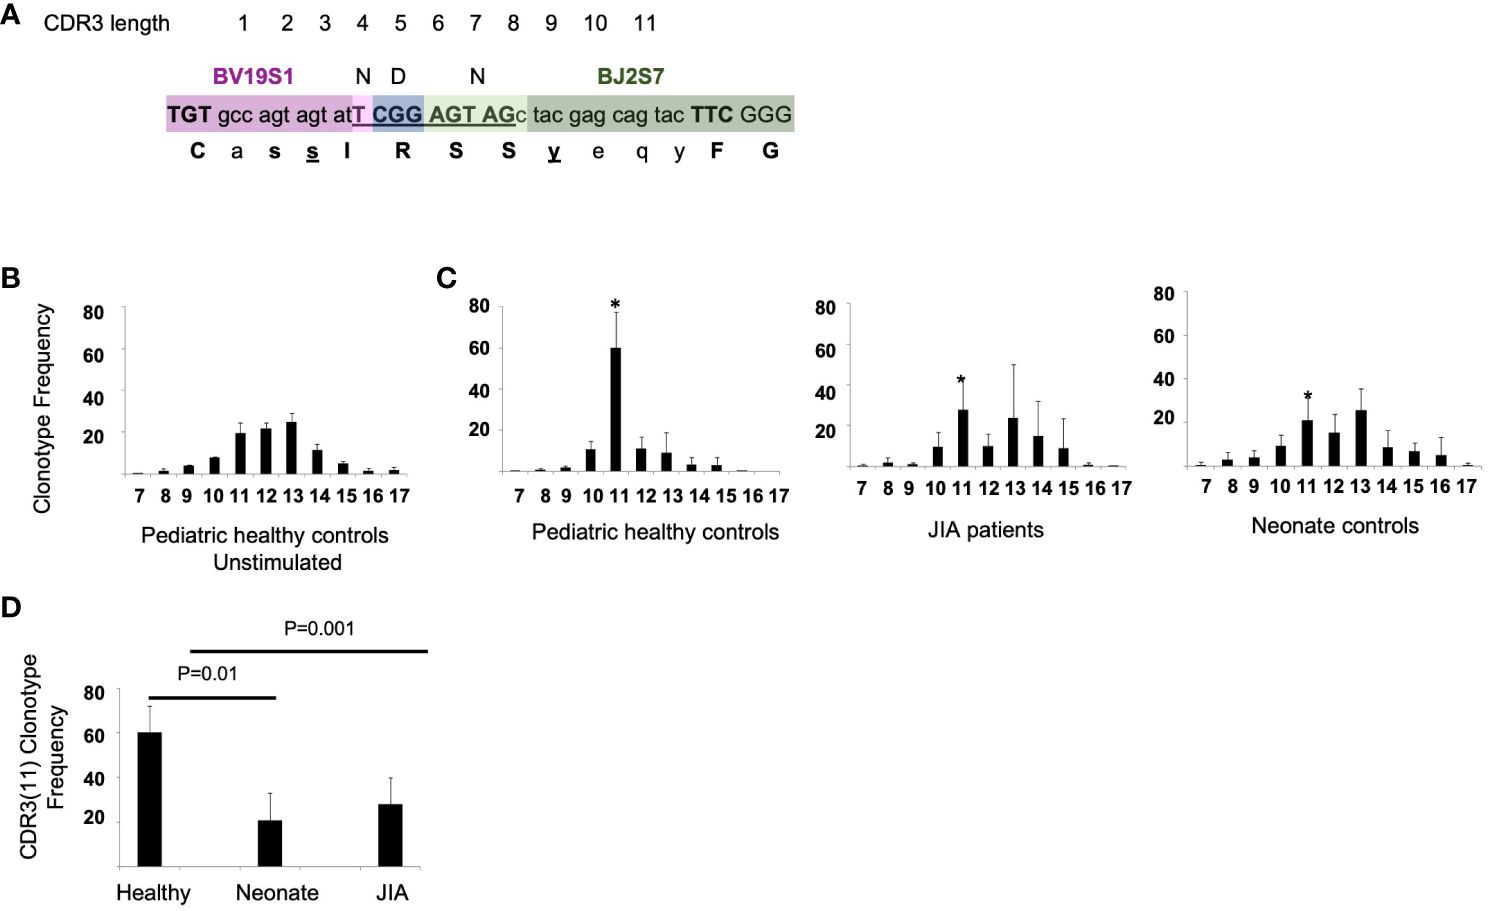
Figure 1 RS/RA motif and the CDR3 TCR βV19 length distribution and CDR3(11) TCR frequency in pediatric healthy controls, JIA patients, and neonates. (A) Drawing showing CDR3(11) and NDN amino acids “RS” in position 5 and 6 (underlined). (B) βV19 CDR3 length distribution from 3 healthy controls prior to stimulation with the M158–66 peptide. (C) CDR3 length distribution of CD8+T cells cultured with M158–66 peptide for 2 weeks from pediatric healthy controls, JIA patients and neonate controls. * Denotes the CDR3 length of 11 amino acids for each group. x-axis = CDR3 length. (D) Summary of the relative frequency of βV19+CDR3(11) RS/RA clonotypes for each cohort. Healthy controls n = 6, JIA n = 5, neonate controls n =6. Image in (A) redrawn from Handbook of Immunosenescence: September 2017. Naumova EN, Naumova YN and Gorski J.
To examine the overall βV19 clonal response independent of CDR3 length, we used spectratyping analysis, which is a quick method for determining if specific T cells are responding in a recall culture (17–19, 21, 23, 28).. For our analysis, spectratyping was done on the first sample following vaccination in pediatric healthy controls and JIA cohorts. Healthy control PBMCs that have not been stimulated in culture with M158–66 peptide have a Gaussian-like CDR3 length distribution (Figure 1B). After a 2-week recall cultured with M158–66 peptide, pediatric control patients show a focused CDR3(11) TCR βV19 repertoire. (Figure 1C, panel 1) The recall response of JIA patients (Figure 1C, panel 2) was similar to that of naïve neonate controls (Figure 1C, panel 3). The average CDR3 length distribution in JIA patients approximated that of unstimulated cells. We found a significant difference (p=0.01) in the clonotype frequency of CDR3(11) between healthy controls and the and JIA patients (Figure 1D), suggesting a reduced ability to focus the recall response in the JIA patient cohort.
To further characterize the CD8+ T cell recall response to the M158–66 peptide, we analyzed the conserved RS/RA motif in the NDN region of CDR3(11) in CD8+ T cells from the recalled cultures over all available time points (17–19, 21). In aggregate, we sequenced 1,566 CDR3(11) regions, of which, 866 had a conserved RS/RA motif in the NDN region. To assess the repertoire richness of each subject, we determined the frequency of CDR3(11) RS/RA clonotypes among the total number of CDR3(11) clonotypes at each visit. The response of 5 of the 6 pediatric controls was characterized by greater than 70% RS/RA clonotypes (Figure 2A, panel 1). Of note, one healthy control sample (C1) had only 2% RS/RA clonotypes. JIA samples had a varied percentage of RS/RA clonotypes. Three JIA patients, (J1, J2, and J3) had greater than 50% RS/RA clonotypes and two patients (J4 and J5) had less than 1.5% RS/RA clonotypes (Figure 2A, panel 2). The percentage of RS/RA clonotypes between all JIA patients and pediatric controls was lower (37.2 vs 80.9%, p< 0.001), (Figure 2B). Furthermore, when considering only the subset of subjects with discernable RS/RA responses (5 healthy control and 3 JIA patients), the percentage of RS/RA clonotypes in the JIA patients was lower than in the pediatric healthy controls (63.1% vs. 82.1%, p< 0.001). Notably, there is visible variation between study visits in the percentage of RS/RA clonotypes recalled in the JIA cohort, indicating that the richness of the repertoire recall response in JIA patients is not only reduced, but also unstable. Overall, our data show that in JIA patients the CDR3(11) recall response is reduced, and within the CDR3(11) recall response, the percentage of RS/RA clonotypes is lower. This diminution of repertoire richness suggests inability to consistently generate and focus the repertoire response in the JIA cohort.
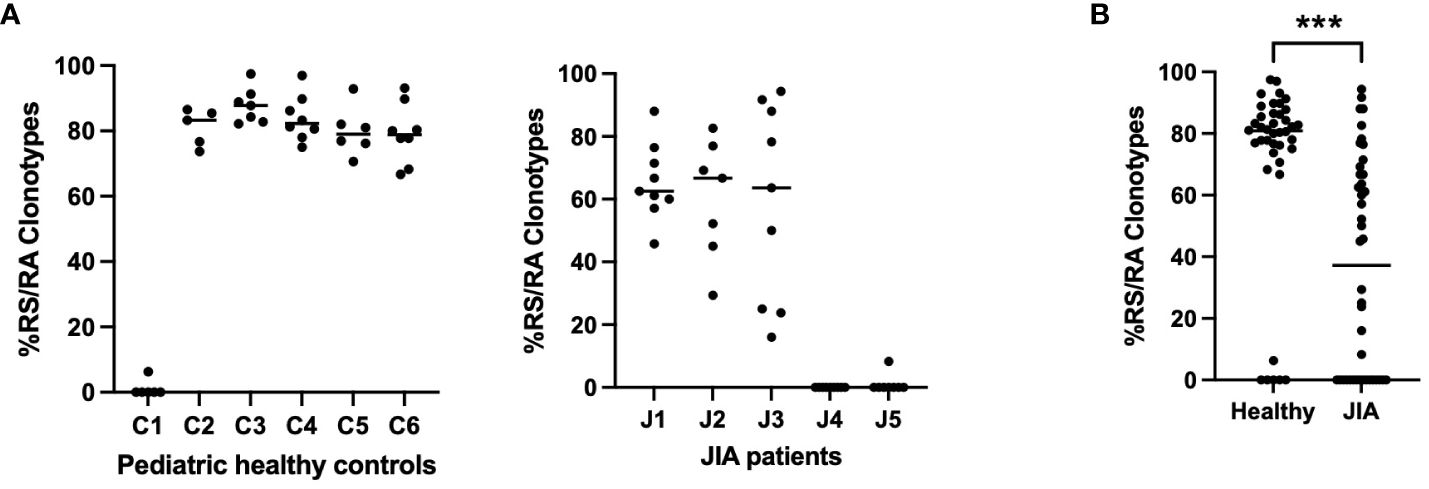
Figure 2 Percentage of RS/RA clonotypes within the CDR3(11) TCR repertoire in pediatric healthy controls and JIA patients. Percentage of RS/RA Clonotypes in the CDR3(11) TCR repertoire over all study time points. (A) Pediatric healthy controls (panel 1), JIA patients (panel 2). (B) Comparison of percent RS/RA clonotypes in pediatric healthy controls vs. JIA patients performed via Mann-Whitney U with two-tailed p value. *** = p< 0.001.
To visualize the two repertoire characteristics that frame clonotype distribution (Rmax and Singletons), we plotted the number of observations for each clonotype (Rank) on the Y-axis and the clonotype distribution along the Z-axis for each healthy control and JIA patient in the first sample following vaccination (Figure 3). Healthy controls show a pattern of a one clonotype observed at a high frequency (Rmax) with many clonotypes observed once, as Singletons (Ns). The three JIA subjects with RS/RA clonotypes (J1, J2, J3) had a clonotype distribution that was similar to that of healthy controls, albeit constrained by the lower total number of RS/RA clonotypes.
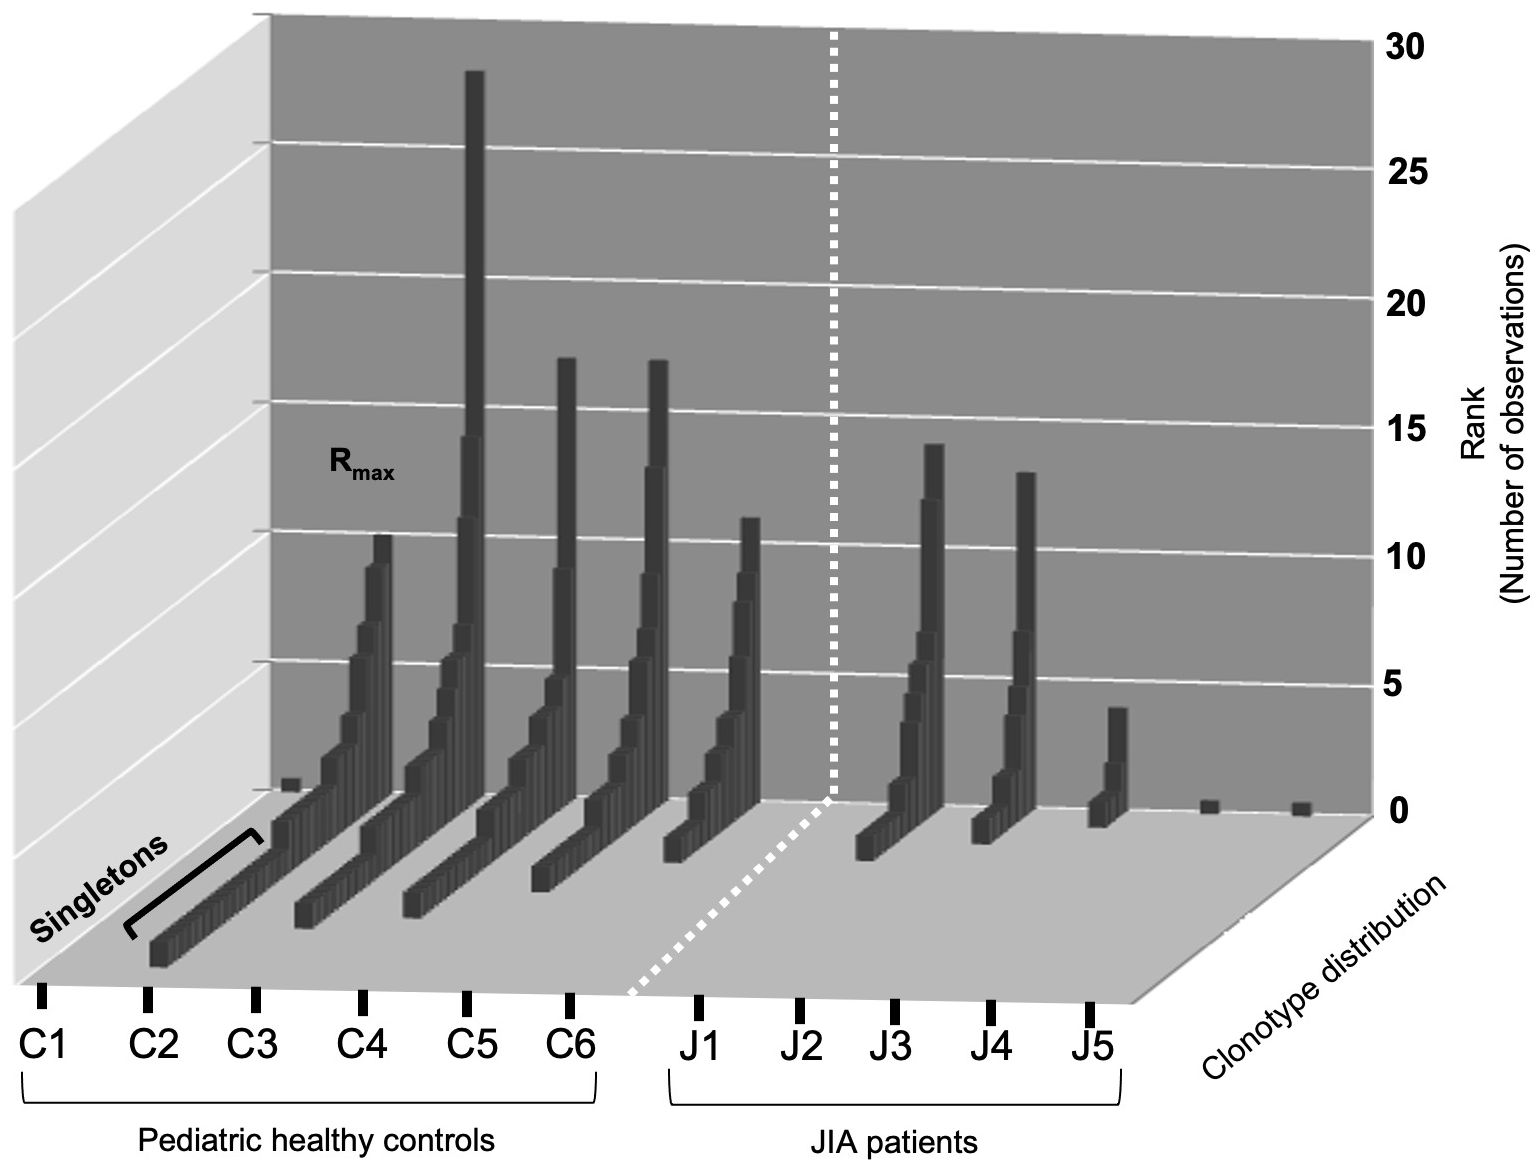
Figure 3 Rank distribution of RS/RA clonotypes from the TCRβV19 repertoire of CD8+ T cells in healthy controls and JIA patients. Distribution (Rmax and singletons) of RS/RA encoding clonotypes from TCR βV19 repertoire of CD8+T cells after two weeks of culture with the M158–66 peptide. The X-axis shows the subject ID of each cohort, the Y-axis shows the number of observations for each clonotype and the Z-axis shows clonotype distribution.
We next plotted the same repertoire characteristics for all subject at each time point (Figure 4). In order to correct for individual sample size, Rmax is reported as Relative Rmax, or Rmax divided by the total number of sequences (M); and Singletons are reported as Relative Singletons, or Ns divided by the total number of clonotypes (N); (27). The Relative Rmax of each sample from each subject in the pediatric healthy controls and JIA cohort is shown in Figure 4A. The comparison of the Relative Rmax between the two cohorts (Figure 4A, panel 3) shows that the JIA cohort has a higher Relative Rmax than the pediatric healthy controls (0.17 vs. 0.33, p< 0.001). The Relative Singletons for the healthy and JIA cohorts are shown in Figure 4B and the comparison (Figure 4B, panel 3) shows that there is no significant difference in the healthy control and JIA cohorts. In summary, when analyzed over time, the Relative Rmax was higher in the JIA RS/RA clonotype recall response than in the healthy controls, indicating that JIA patients had greater TCR repertoire unevenness.
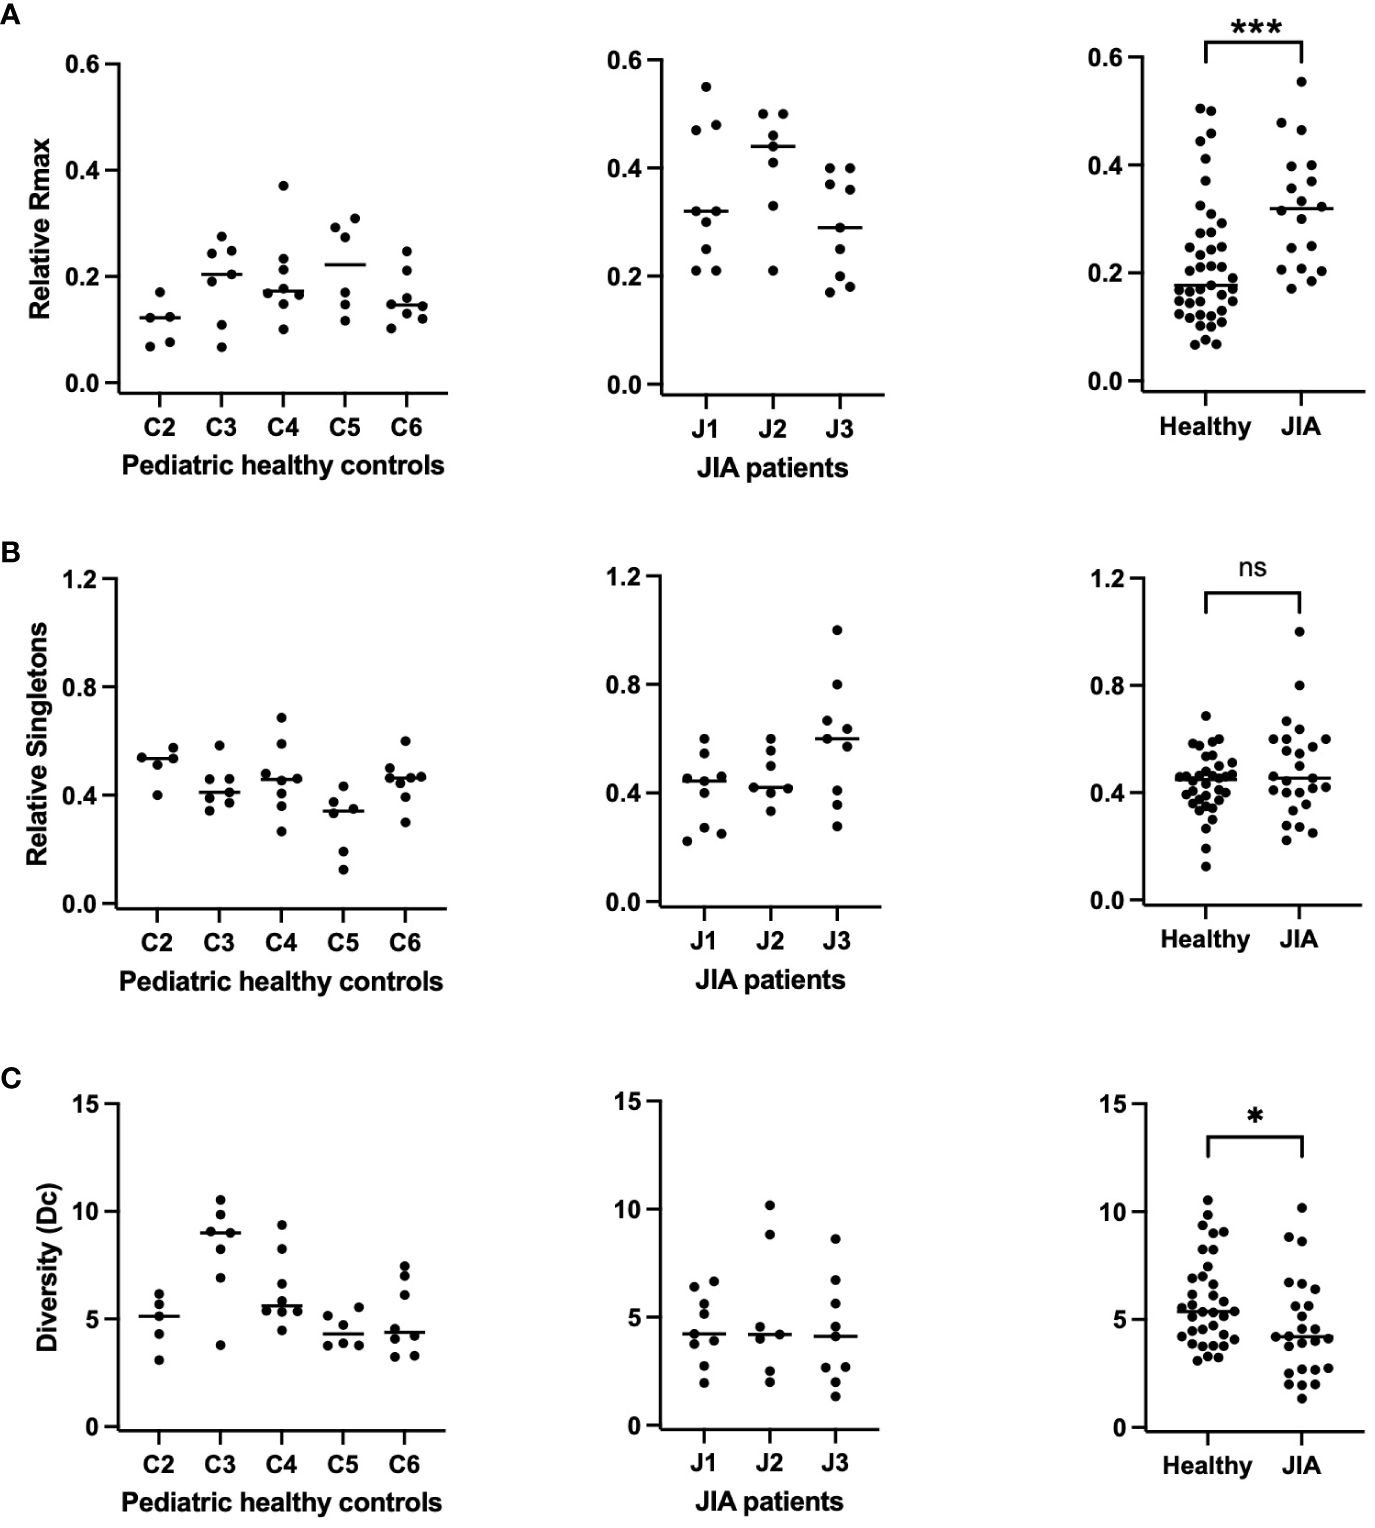
Figure 4 Relative Rmax, relative singletons, and diversity of the RS/RA TCR βV19 repertoire in JIA patients compared to pediatric healthy controls. RS clonotypes analyzed multiple times over a 3-year period for each subject. Each datapoint represents data collected at 1 timepoint. (A) Relative Rmax (Rmax/M) for pediatric healthy controls (panel 1), JIA patients (panel 2), and summary of data (panel 3). (B) Relative singletons (Ns/N) for pediatric healthy controls (panel 1), JIA patients (panel 2) and summary of data (panel 3). (C) Diversity for pediatric healthy controls (panel 1), JIA patients (panel 2) and summary of data (panel 3). Comparisons of pediatric healthy controls vs JIA patients was performed using Generalized Estimating Equation with repeated measures. * = p< 0.05; *** = p< 0.001; ns = not significant. Horizontal line indicates median of dataset.
Clonotype Diversity (Dc) is a characteristic that incorporates both richness (N) and unevenness (Rmax/M) and can be estimated by . With the assumption that a system is robust and resilient to distortions if it is rich in species (clonotypes) and their abundance is uneven, deviations in Rmax or N may be compensated by one another (31). Thus far we have shown that the JIA cohort displays decreased repertoire richness but greater repertoire unevenness when compared to pediatric healthy controls. In order to assess the extent of compensation, we calculated repertoire Diversity at all time points in controls and JIA patients (Figure 4C). We found that repertoire Diversity of JIA patients was lower than the pediatric healthy controls (p=0.03), (Figure 4C, panel 3). The lower Diversity found in the JIA patients is due to decreased antigen specific proliferative response of the M158–66 RS/RA repertoire, as measured with an in vitro recall assay.
Another way to visualize clonal unevenness is by plotting the distribution of all Ranks within the CDR3(11) RS/RA clonotype response. This is done using a modified Rank Frequency approach (30) in which Rank is plotted against Rank Frequency. To best depict differences in repertoires, these values are normalized by dividing by the number of sequences or clonotypes, respectively, present in the repertoire. Rank is normalized by dividing by the total number of sequences (M); , and reported as Relative Rank. Rank Frequency, or the number of times each rank occurs, is normalized by dividing by the total number of clonotypes (N); , and is reported as Relative Rank Frequency. The repertoire distribution can be visualized when Relative Rank Frequency is plotted on the Y-axis and the Relative Rank is plotted on the X-axis. Figure 5 shows the combined data of repertoire distribution of clones from the 5 control subjects (C2, C3, C4, C5, C6) and the 3 JIA patients (J1, J2, J3) with RS/RA clonotypes at all study time points (Figures 5A, B, respectively). For both populations, the graph shows the clones with the lowest Relative Rank have the highest frequency. Indeed, there is little difference in the number of Singleton clonotypes between the JIA and healthy control cohort. A similar result has been reported for healthy adult controls (19, 27, 30). However, the JIA cohort repertoire is characterized by higher Ranks, as indicated by the longer tail along the x-axis (Figure 5B) and consistent with the higher Relative Rmax in the JIA cohort.
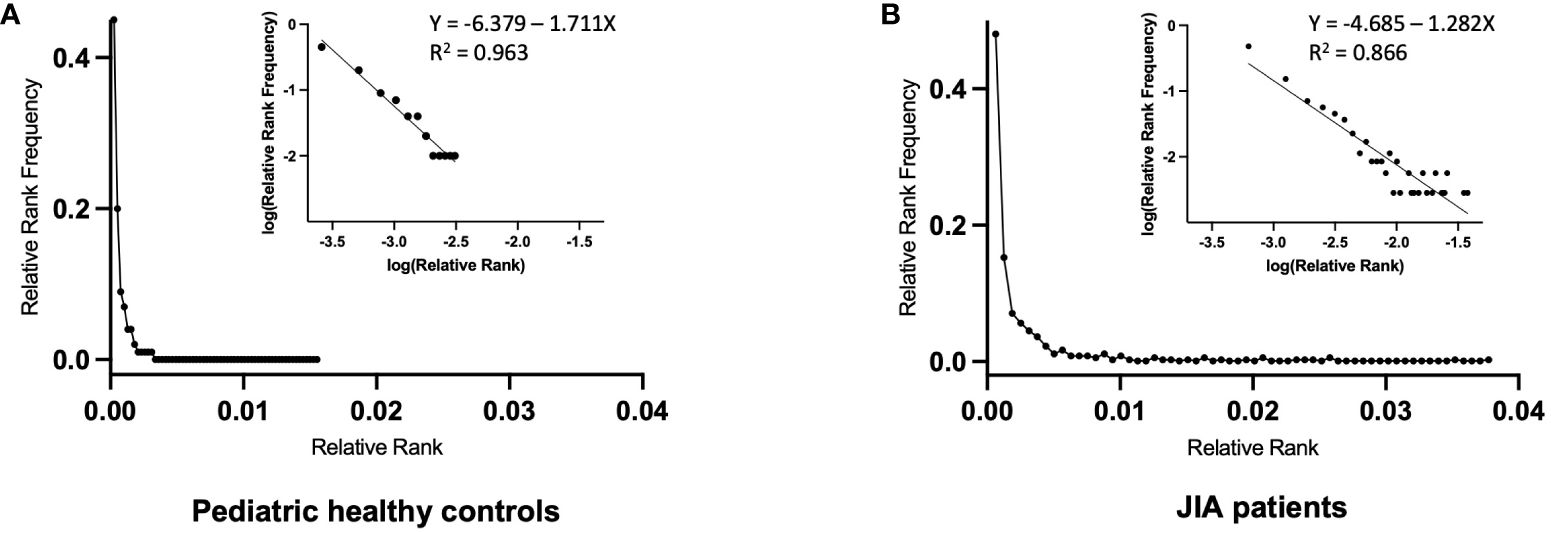
Figure 5 Relative Rank vs. Relative Rank Frequency of the RS/RA TCR βV19 repertoires of pediatric healthy controls and JIA patients. Repertoire distribution of RS/RA clones using the Rank Frequency approach. (A) Composite repertoire data from 5 pediatric healthy controls (C2, C3, C4, C5, C6) (B) Composite repertoire data from 3 JIA patients (J1, J2, J3). The inset graphs in A and B are the log/log transformation of the data with the superimposed trend line showing the best fit (R2 value).
The graphs of Relative Rank Frequency and Relative Rank are compatible with a single component power law-like distribution and plotting a log/log transformation of the data (log y = log a-b log x) yields a straight line (30). A normally unselected TCR repertoire has many neutral receptors and a small number of receptors with high affinity for a particular ligand. As the biological response to TCR engagement is cell division within the lymphocyte network, the resultant repertoire yields a power law-like distribution that is driven by affinity based selective cell division, with clonotype Rank describing the outcome. The superimposed trend line of the combined data shows a R2 value of 0.96 for the 5 control subjects (C2, C3, C4, C5, C6) (Figure 5A, inset) and a R2 value of 0.86 for the 3 JIA patients (J1, J2, J3) (Figure 5B, inset). The slopes of the log/log transformation for the 3 JIA patients and 5 healthy controls are significantly different (p<0.0001). The shallower slope in the JIA cohort is driven by a lower number of expanded clones at each Rank Frequency, with a few unevenly distributed clones achieving a high level of expansion. In other words, the clonal expansion following ex vivo restimulation in the JIA cohort uncovered a less diverse repertoire due to the decreased richness of the response.
In order to assess clonotype temporal stability within the repertoire, we calculated the temporal overlap of clonotypes within the healthy control and JIA repertoires. The stability of a clonotype is defined as the number of times it was observed across repeated measurements. Clonotypes observed at all times analyzed are considered stable and clonotypes observed only once (with no temporal overlap) are considered unstable. Thus, clonotype temporal overlap is defined as the number of time points at which a clonotype was observed minus one; (30), as a clonotype observed only once has no temporal stability. As the measurement of temporal stability is based on multiple time points, more time points should provide a better estimation of stability. To compensate for small differences in the number of time points, we report the Relative Stability of a clonotype, which is calculated stability; . Using Relative Stability, an observation at one time is equal to a stability of 0 and an observation at all times is equal to a Relative Stability of 1. The Relative Stability was divided into 5 categories: (0), (≥ 0.25), (≥ 0.50), (≥ 0.75), (1). Only about 1% of all clonotypes were found in half of all available measurements (Relative Stability of ≥ 0.5). Importantly, the stability of responding clonotypes was similar in both healthy pediatric controls and JIA patients (Figure 6).
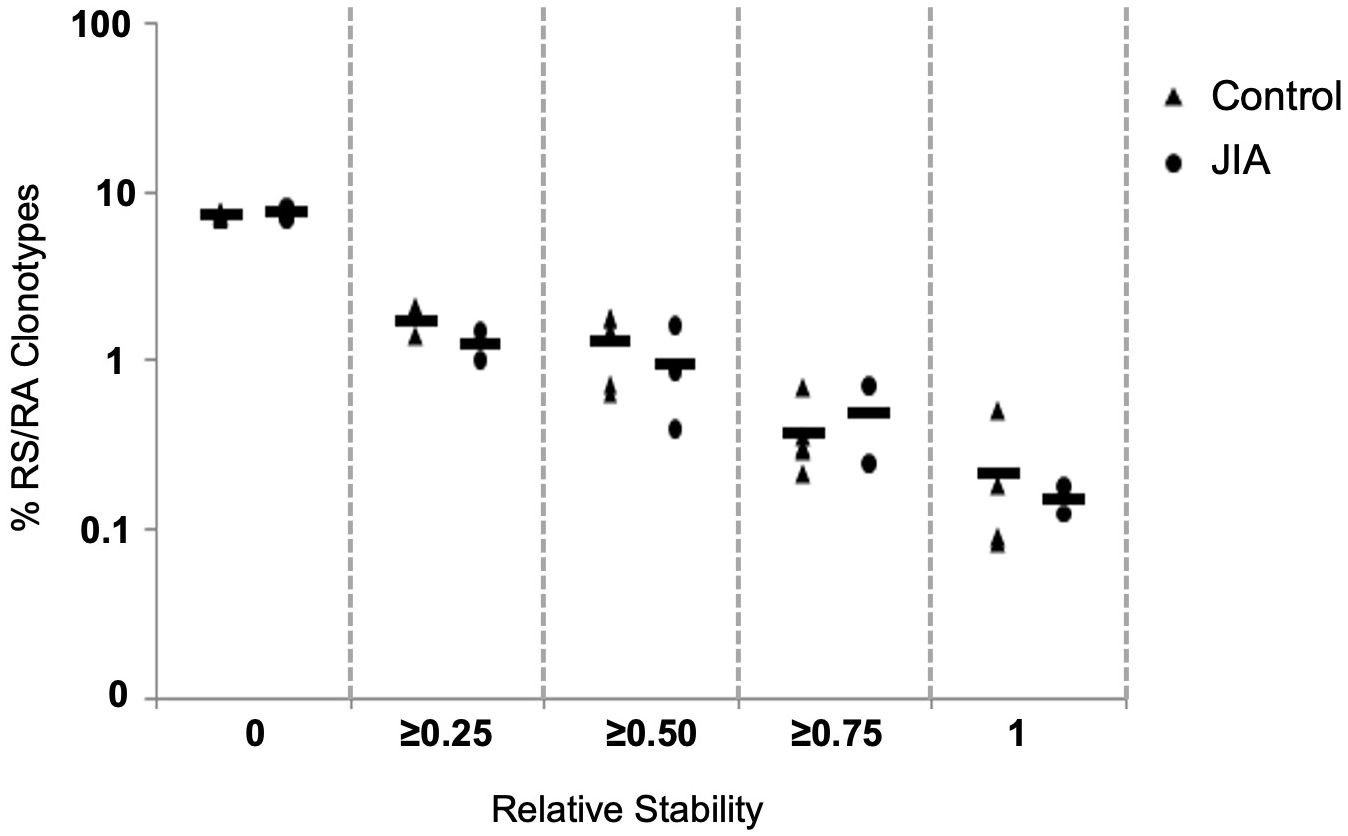
Figure 6 Clonotype stability in pediatric healthy controls and JIA patients. Clonotype temporal overlap. The percent of RS/RA encoding clonotype overlap between measurements taken at different time points. Since the number of time points varied between individuals, the percent of overlap was normalized based on number of each individual’s time points. The X-axis categorizes the percent of overlap, and the Y-axis shows the percent of clonotypes in each category. Control n = 6, JIA n = 5.
The data in Figure 6 measures the stability of the repertoire (recovery of unique clonotypes overtime). The stability of the immune response (reproducible distribution of clonal expansion when challenged) is another important measurement of repertoire dynamics. To measure the stability of a repertoire’s distribution of expanded clonotypes overtime, we plotted the slopes and R2 values of the log/log transformation of Relative Rank vs Relative Rank Frequency for each time point in each healthy control (Figure 7A) and each JIA patient (Figure 7B). For three of the five control subjects, time point data are well clustered and close to the cohort average, consistent with the idea that clonal expansion is reproducible with repeated antigenic exposure. In the other two healthy subjects (C2 and C5) there is some temporal variation in the repertoire shape. All three JIA subjects showed large changes in distribution of clonotypes in the repertoire over time. In aggregate, the slope vs R2 of the healthy control cohort is clustered around the mean (-0.95, 0.77) whereas there is less clustering around the mean (-0.62, 0.61) for the combined JIA cohort data (Figure 7C). The data illustrate greater fluctuations in the repertoire shape of the JIA cohort.
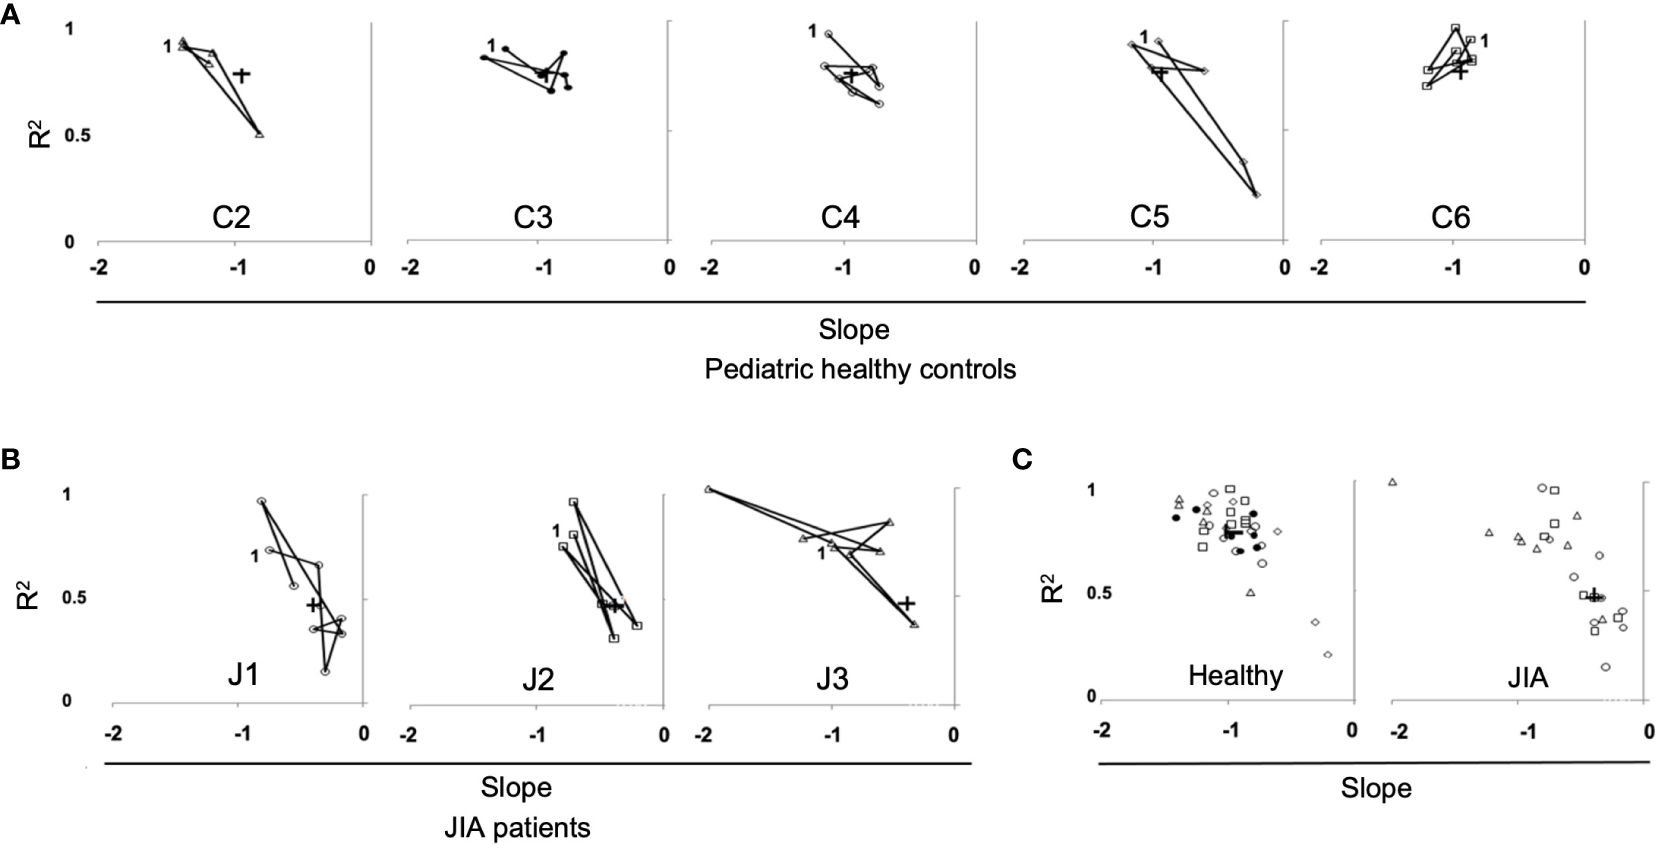
Figure 7 Repertoire distribution of RS/RA clones over time in pediatric healthy controls and JIA patients. Repertoire distribution of RS/RA clones over time showing a plot of slope versus R2 for all time points. (A) Pediatric healthy controls, (B) JIA patients, (C) Combined data from pediatric healthy control subjects (panel 1), (C2 = triangle, C3 = black circle C4 = white circle, C5 = diamond, C6 = square) and combined data from JIA patients (panel 2), (patient J1 = circle, J2 = square, J3 = triangle). + = the average value and “1” indicates the first time point.
The data thus far has shown different characteristics in CDR3 length and clonotype diversity in the CD8+ T cells expansion response to M158–66 between JIA patients and healthy pediatric controls. Whether CD8+ T cells clones from JIA patients are functional against M158–66 is a critical parameter to explore in order to understand adaptive cell-mediated immunity to this antigen. To address this question, IFNγ production was measured in response to ex-vivo stimulation of CD8+ T cell clones with the M158–66 influenza peptide. We plotted the percentage of IFNγ producing CD8+βV19+ interferon producing cells for healthy controls (C2, C3, C4, C6) and JIA patients (J1, J2, J3, J5), as these patients had adequate sample available, at each study time point (Figures 8A, B, respectively). The percent of RS/RA clonotypes (Figure 2) is also replotted for purposes of comparison. The control cohort data is characterized by tight clustering of both the IFNγ production and the percent of RS/RA-encoding clonotypes above 60%. Conversely, the JIA data show wide intra-subject variability with extensive spreading of both the percent of RS/RA clonotypes and the percent of CD8+Vβ19+ IFNγ producing cells. When plotting the aggregate data from Figure A and B, JIA patients had a lower percent of IFNγ producing clonotypes as compared to healthy controls (p<0.001) (Figure 8C, panel 1). Of note, JIA samples had no difference in the absolute number of circulating CD8+ T cells and the frequency of CD8+ T cells was stable over time (data not shown).
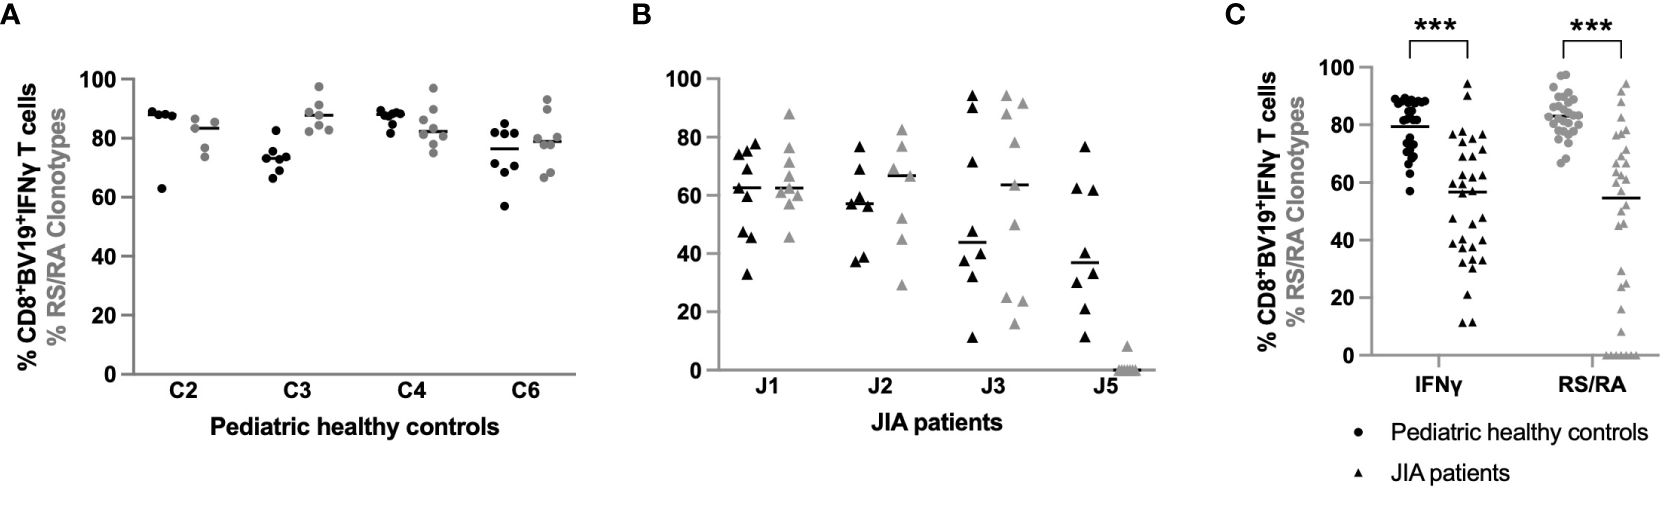
Figure 8 Percent of IFN-γ producing CD8+βV19+ T cells in pediatric healthy controls and JIA patients. Percent of CD8+βV19+IFNγ producing cells (CD8+βV19+IFNγ+/total CD8+βV19+ T cells) in response to M158–66 peptide obtained in (A) four pediatric healthy controls and (B) 4 JIA patients with sample available. (C) Combined data of percent IFNγ-producing CD8+βV19+cells and percent RS/RA clonotypes from healthy controls (circles) and JIA patients (triangles). Comparisons of pediatric healthy controls vs JIA patients was performed using Generalized Estimating Equation with repeated measures. *** = p< 0.001. Horizontal line indicates median of dataset.
The ability to mount an adequate immune response in patients with aberrant immunity or on immunosuppressive medications has been examined in multiple studies. These studies have largely been focused on the generation of antibody responses in adults and have driven recommendations for vaccination in these adult populations. In contrast, few studies have focused on antigen-specific memory T cell responses in children (38). Here we sought to assess the T cell recall response to the influenza antigen, M158–66, in JIA patients receiving immunosuppressive therapy compared to pediatric healthy controls. We found the T cell repertoires of JIA patients exhibit several significantly different characteristics from healthy pediatric controls, including greater clonal unevenness, wider variability in repertoire distribution over time, a reduction in IFNγ-producing RS/RA clonotypes, and an overall lower level of clonal diversity owing to reduced clonal richness. When considering the T cell repertoire attributes at the clonal level, our study suggests that an antigen specific T cell memory response can be compromised in children with JIA on immunosuppressive medications. These data support the necessity of a larger study, one that targets not only influenza, but other infectious agents which utilize vaccination for protection.
The recall response of children with JIA was characterized by reduced clonal richness. In the JIA patients, the frequency of CDR3(11) clones was significantly less than the pediatric control cohort, the distribution of CDR3 length in the JIA patients was more similar to that of naïve T cells, and JIA patients had lower M158–66 specific RS/RA clonotype production. Although the two JIA patients (J4 and J5) who produced almost no RS/RA clonotypes had high disease activity, uncontrolled inflammation and immune dysregulation cannot fully account for the lack of clonal richness. This is especially evident as patient J1 also had high disease activity but produced an RS/RA clonotype response similar to healthy controls. The intra-subject variability of RS/RA clonotype response over time is also visually evident when compared to the healthy controls. It is notable that all 5 JIA patients were receiving methotrexate, a dihydrofolate reductase inhibitor which increases T cell sensitivity to apoptosis. We speculate that iatrogenic immunosuppression may be the culprit of decreased clonal richness in JIA patients, while the wide variation in the percentage of RS/RA clonotypes within patients could be related to the periodic timing of immunosuppressive medication.
JIA patients also had a higher Relative Rmax indicating that the clonal unevenness and distribution of RS/RA clonotypes in JIA patients is greater than that seen in healthy individuals. It is plausible that the JIA patients have a more focused antigen response, with overall fewer clones that occur at higher frequencies. For instance, JIA patients may have a few high affinity clones that are more resilient, while clonotypes of intermediate affinity may not expand as robustly in an immunosuppressed state, and thus drop to lower Ranks. This hypothesis may in part explain the flattening of the slope in the log/log transformation of the Relative Rank and Relative Rank Frequency seen in the JIA cohort; clones with intermediate affinity do not expand past intermediate Ranks and those with high affinity are highly expanded. Indeed, the direct relationship between a clonotype’s frequency, its avidity for the MHC—peptide, and its ability to perform effector functions has been described in other studies (39–41). The high frequency clonotypes may constitute functional clonotypes whereas lower frequency clonotypes represent those that can survive in culture or replicate at low levels but have not achieved stable memory effector status. Taken together, our data in the JIA cohort demonstrate that despite a greater degree of clonal unevenness (Relative Rmax), there is decreased clonal richness (N), ultimately resulting in a repertoire characterized by decreased diversity; , when compared to healthy controls.
Interestingly, data from a longitudinal study of 3 HLA-A2 adults over a period of 7–10 years showed similar age-related changes in the M158–66 specific T cell repertoire (31). With aging, healthy adults had a decline in the number of RS/RA-clonotype singletons with a shift of existing RS/RA clonotypes into higher frequencies (31). We previously hypothesized that this small amount of high ranking clonotypes may represent a percentage of T cells found in the circulation at all times, which is compatible with a stable circulating depot of cells. In this scenario, Rank would not only be a function of previous expansion, but also of accessibility in a mature memory repertoire (29). This theory was supported by our prior observation that the high Ranking clonotypes in healthy middle-aged adults were consistently and strongly associated with maximum stability. In contrast, this level of stability was not observed in JIA patients. Although we found clonotype stability in JIA patients to be similar to pediatric healthy controls, both cohorts display lower levels of stability than the adult repertoire (29), with none of the highest ranking clonotypes present at all times. This would suggest that in JIA, a high Relative Rmax is not a function of accessibility nor a function of stability in the memory repertoire. Rather, this selective expansion is likely a proxy for the avidity of the TCR—peptide—MHC interaction influenced by chronic disease and/or immunosuppressive medication.
Analysis of the repertoire distribution of RS/RA clones over time also revealed greater temporal variation in the repertoire shape in JIA patients compared to the healthy control cohort. Both the slopes and R2 values lacked clustering around the average, often with lower R2 values in the JIA cohort. Thus, not only was the clonotype distribution more variable over time in the JIA patients, but also the repertoire shape at one time point was not as predictable as in the healthy controls. This indicates that clonal unevenness may not be maintained in JIA patients overtime, further emphasizing the decreased clonal diversity within this patient population. It is unclear if the variability in clonotype distribution represents a more directed (higher Rmax) RS/RA clonotype antigen response, a shift toward non-RS/RA clonotypes, or a combination of these factors in patients with JIA.
Functional analysis also showed that patients with JIA had significantly less interferon producing CD8+βV19+ cells following M158–66 stimulation. Unlike the control cohort, some patients with JIA had less correlation between the percentage of RS/RA clonotypes and the percentage of IFNγ producing CD8+βV19+ cells at each visit. In fact, patient J5 displayed high IFNγ production despite a low frequency of RS/RA clones, suggesting recruitment of functional non-RS/RA M158–66 specific clonotypes. This is particularly noteworthy as healthy adults have displayed recruitment of functional non-RS/RA clonotypes against M158–66 with aging (29), again highlighting repertoire similarities between JIA patients and older individuals. Overall, the data suggests that IFNγ producing Vβ19 CD8+ T cells are decreased in JIA patients as compared to pediatric healthy controls.
There are several limitations to the current study. All patients received influenza immunization at baseline, 12, 24, and 36-month visits with various seasonal trivalent vaccines administered. Furthermore, there is no indication of how many times subjects may have been exposed to influenza prior to the study. In addition, clonotype expansion was assessed in vitro, in response to M158–66 stimulation. This in vitro recall assay is unlikely to fully reflect the capacity for antigen-specific T cell responses to M158–66 in vivo, as the two environments are functionally distinct. In theory, a reduced capacity to respond in vitro should apply equally to both patients and controls. However, it is possible that there is selective reduction in the in vitro proliferative potential of T cells from JIA patients. Thus, assessing clonotype expansion in vitro, in response to M158–66 stimulation, may not fully reflect clonal diversity in response to vaccination in vivo. In other words, the lower diversity detected in our population may in part arise from differences between in vivo and in vitro expansion in JIA patients.
Another caveat is that our analysis assumes that all Vβ19+ CDR3(11) RS/RA clonotypes detected in our in vitro recall assay are derived from T cells that are specific to the M158–66 peptide. Although this approach is supported by several studies (17, 18), we cannot exclude the possibility that non-specific T cells with a Vβ19+ CDR3(11) RS/RA sequence survive the culture conditions and contribute to measurements of diversity. As such cells would not expand in culture, their contribution to measurements of diversity are likely to be limited.
Furthermore, arthritis treatment was not standardized between patients. Although all patients received methotrexate, other immunosuppressive medications differed. Lastly, our patient and control cohorts were small; two JIA patients were omitted from the analysis of repertoire characteristics as they did not generate RS/RA clonotypes and our small sample size did not allow sub-analysis of disease factors, such cJADAS scores. Lastly, one healthy control (C1) who was 6-years-old at study start had very few RS/RA clonotypes, possibly due to polymorphism in an immune response gene, but more likely due to lack of an influenza exposure.
In summary, our data show that the ability to generate and maintain CD8+ T cell memory in patients with JIA on immunosuppressive therapy is significantly altered. Importantly, patients with JIA have less repertoire diversity owing to a reduction in clonal richness. The reduction in repertoire diversity occurs in spite of increased clonal unevenness. This molecular phenotype mimics that seen with aging but displays less stability than expected of a mature repertoire in an aged individual. It can be postulated that disease activity, treatment with immunosuppression, or a combination of the two may be driving the differential clonal expansion. These repertoire changes may have a functional association, as effector cytokine production (IFNγ) in JIA patients is reduced related to controls. Furthermore, the extent to which recruitment of functional non-RS/RA clonotypes contributes to the IFNγ response in JIA patients is unclear. Indeed, TCR diversity is associated with effective control of viral infections, although data regarding an increased infection risk in JIA is mixed (42–44). Notably, our data support existing literature detailing decreased immunogenicity of influenza vaccination due to methotrexate (45, 46).
Our work is particularly relevant in understanding the immune response to vaccination in immunocompromised individuals. Specifically, variability in the CD8+ T cell response may be an important consideration when providing vaccine recommendations and anticipatory guidance to patients with JIA on immunosuppressive therapy.
The original contributions presented in the study are included in the article/Supplementary Material, further inquiries can be directed to the corresponding author/s.
The studies involving humans were approved by Children’s Wisconsin Institutional Board Review. The studies were conducted in accordance with the local legislation and institutional requirements. Written informed consent for participation in this study was provided by the participants’ legal guardians/next of kin.
SS: Conceptualization, Formal analysis, Writing – original draft, Writing – review & editing. DH: Data curation, Formal analysis, Methodology, Writing – original draft. JG: Conceptualization, Writing – review & editing. JV: Data curation, Writing – review & editing. JN: Data curation, Writing – review & editing. MY: Formal analysis, Methodology, Writing – review & editing. EN: Formal analysis, Investigation, Methodology, Writing – review & editing. EH: Writing – review & editing, Data curation. MD: Writing – review & editing, Formal analysis. KY: Writing – review & editing, Formal analysis. JG: Writing – review & editing, Conceptualization, Formal analysis, Project administration, Funding acquisition, Resources, Supervision. CW: Writing – review & editing, Conceptualization, Methodology, Data curation, Project administration, Funding acquisition, Resources, Supervision.
The author(s) declare that financial support was received for the research, authorship, and/or publication of this article. This study was supported by R01-AI26085 and NO1-AI50032 NIAID NIH HHS/United States. D.B. and Marjorie Reinhart Family Foundation. Children’s Wisconsin.
We thank Ryan Besserud, Melissa Unruh, Erica Reed, and Jie Cheng for their technical support and the Division of Qualitative Health Sciences, Department of Pediatrics, Medical College of Wisconsin for statistical support.
The authors declare that the research was conducted in the absence of any commercial or financial relationships that could be construed as a potential conflict of interest.
All claims expressed in this article are solely those of the authors and do not necessarily represent those of their affiliated organizations, or those of the publisher, the editors and the reviewers. Any product that may be evaluated in this article, or claim that may be made by its manufacturer, is not guaranteed or endorsed by the publisher.
The Supplementary Material for this article can be found online at: https://www.frontiersin.org/articles/10.3389/fimmu.2024.1306490/full#supplementary-material
1. Tynjala P, Vahasalo P, Tarkiainen M, Kröger L, Aalto K, Malin M, et al. Aggressive combination drug therapy in very early polyarticular juvenile idiopathic arthritis (ACUTE-JIA): a multicentre randomised open-label clinical trial. Ann Rheum Dis. (2011) 70:1605–12. doi: 10.1136/ard.2010.143347
2. Atzeni F, Bendtzen K, Bobbio-Pallavicini F, Conti F, Cutolo M, Montecucco C, et al. Infections and treatment of patients with rheumatic diseases. Clin Exp Rheumatol. (2008) 26:S67–73.
3. Heijstek MW, Ott de Bruin LM, Bijl M, Borrow R, van der Klis F, Koné-Paut I, et al. EULAR recommendations for vaccination in paediatric patients with rheumatic diseases. Ann Rheum Dis Oct. (2011) 70:1704–12. doi: 10.1136/ard.2011.150193
4. Silva CA, Terreri MT, Aikawa NE, Carvalho JF, Pileggi GC, Ferriani VP, et al. Vaccination practice in children with rheumatic disease. Rev Bras Reumatol. (2010) 50:351–61. doi: 10.1590/S0482-50042010000300008
5. Alten R, Bingham CO 3rd, Cohen SB, Curtis JR, Kelly S, Wong D, et al. Antibody response to pneumococcal and influenza vaccination in patients with rheumatoid arthritis receiving abatacept. BMC Musculoskelet Disord. (2016) 17:231. doi: 10.1186/s12891-016-1082-z
6. Fomin I, Caspi D, Levy V, Varsano N, Shalev Y, Paran D, et al. Vaccination against influenza in rheumatoid arthritis: the effect of disease modifying drugs, including TNF alpha blockers. Ann Rheum Dis. (2006) 65:191–4. doi: 10.1136/ard.2005.036434
7. Arad U, Tzadok S, Amir S, Mandelboim M, Mendelson E, Wigler I, et al. The cellular immune response to influenza vaccination is preserved in rheumatoid arthritis patients treated with rituximab. Vaccine. (2011) 29:1643–8. doi: 10.1016/j.vaccine.2010.12.072
8. Kapetanovic MC, Saxne T, Nilsson JA, Geborek P. Influenza vaccination as model for testing immune modulation induced by anti-TNF and methotrexate therapy in rheumatoid arthritis patients. Rheumatol (Oxford). (2007) 46:608–11. doi: 10.1093/rheumatology/kel366
9. Hua C, Barnetche T, Combe B, Morel J. Effect of methotrexate, anti-tumor necrosis factor alpha, and rituximab on the immune response to influenza and pneumococcal vaccines in patients with rheumatoid arthritis: a systematic review and meta-analysis. Arthritis Care Res (Hoboken). (2014) 66:1016–26. doi: 10.1002/acr.22246
10. Aikawa NE, Campos LM, Goldenstein-Schainberg C, Saad CGS, Ribeiro AC. Effective seroconversion and safety following the pandemic influenza vaccination (anti-H1N1) in patients with juvenile idiopathic arthritis. Scand J Rheumatol. (2013) 42:34–40. doi: 10.3109/03009742.2012.709272
11. Ribeiro AC, Guedes LK, Moraes JC, Saad CG, Aikawa NE, Calich AL, et al. Reduced seroprotection after pandemic H1N1 influenza adjuvant-free vaccination in patients with rheumatoid arthritis: implications for clinical practice. Ann Rheum Dis. (2011) 70:2144–7. doi: 10.1136/ard.2011.152983
12. Malleson PN, Tekano JL, Scheifele DW, Weber JM. Influenza immunization in children with chronic arthritis: a prospective study. J Rheumatol. (1993) 20:1769–73.
13. Boyarsky BJ, Ruddy JA, Connolly CM, Ou MT, Werbel WA, Garonzik-Wang JM, et al. Antibody response to a single dose of SARS-CoV-2 mRNA vaccine in patients with rheumatic and musculoskeletal diseases. Ann Rheum Dis. (2021) 80(8):1098–9. doi: 10.1136/annrheumdis-2021–220289
14. Werbel WA, Boyarsky BJ, Ou MT, Massie AB, Tobian AAR, Garonzik-Wang JM, et al. Safety and immunogenicity of a third dose of SARS-CoV-2 vaccine in solid organ transplant recipients: A case series. Ann Intern Med. (2021) 174(9):1330–2. doi: 10.7326/L21–0282
15. Mehta P, Sanchez E, Moraitis E, Longley N, Lendrem DW, Giles IP, et al. Influenza vaccination and interruption of methotrexate in adult patients in the COVID-19 era: an ongoing dilemma. Lancet Rheumatol Jan. (2021) 3:e9–e10. doi: 10.1016/S2665–9913(20)30392–1
16. Minervina AA, Komech EA, Titov A, Bensouda Koraichi M, Rosati E, Mamedov IZ, et al. Longitudinal high-throughput TCR repertoire profiling reveals the dynamics of T-cell memory formation after mild COVID-19 infection. Elife. (2021) 10:e63502. doi: 10.7554/eLife.63502
17. Moss PA, Moots RJ, Rosenberg WM, Rowland-Jones SJ, Bodmer HC, McMichael AJ, et al. Extensive conservation of alpha and beta chains of the human T-cell antigen receptor recognizing HLA-A2 and influenza A matrix peptide. Proc Natl Acad Sci U S A. (1991) 88:8987–90. doi: 10.1073/pnas.88.20.8987
18. Lehner PJ, Wang EC, Moss PA, Williams S, Platt K, Friedman SM, et al. Human HLA-A0201-restricted cytotoxic T lymphocyte recognition of influenza A is dominated by T cells bearing the V beta 17 gene segment. J Exp Med. (1995) 181:79–91. doi: 10.1084/jem.181.1.79
19. Naumov YN, Naumova EN, Yassai MB, Gorski J. Selective T cell expansion during aging of CD8 memory repertoires to influenza revealed by modeling. J Immunol. (2011) 186:6617–24. doi: 10.4049/jimmunol.1100091
20. Yassai M, Bosenko D, Unruh M, Zacharias G, Reed E, Demos W, et al. Naive T cell repertoire skewing in HLA-A2 individuals by a specialized rearrangement mechanism results in public memory clonotypes. J Immunol. (2011) 186:2970–7. doi: 10.4049/jimmunol.1002764
21. Stewart-Jones GB, McMichael AJ, Bell JI, Stuart DI, Jones EY. A structural basis for immunodominant human T cell receptor recognition. Nat Immunol. (2003) 4:657–63. doi: 10.1038/ni942
22. Naumov YN, Naumova EN, Clute SC, Watkin LB, Kota K, Gorski J, et al. Complex T cell memory repertoires participate in recall responses at extremes of antigenic load. J Immunol. (2006) 177:2006–14. doi: 10.4049/jimmunol.177.3.2006
23. Wang X, Jia S, Meyer L, Yassai MB, Naumov YN, Gorski J, et al. Quantitative measurement of pathogen-specific human memory T cell repertoire diversity using a CDR3 beta-specific microarray. BMC Genomics. (2007) 8:329. doi: 10.1186/1471–2164-8–329
24. Yassai MB, Demos W, Gorski J. CDR3 motif generation and selection in the BV19-utilizing subset of the human CD8 T cell repertoire. Mol Immunol. (2016) 72:57–64. doi: 10.1016/j.molimm.2016.02.014
25. Petrova GV, Naumova EN, Gorski J. The polyclonal CD8 T cell response to influenza M158–66 generates a fully connected network of cross-reactive clonotypes to structurally related peptides: a paradigm for memory repertoire coverage of novel epitopes or escape mutants. J Immunol. (2011) 186:6390–7. doi: 10.4049/jimmunol.1004031
26. Petrova GV, Gorski J. Cross-reactive responses to modified M1(5)(8)-(6)(6) peptides by CD8(+) T cells that use noncanonical BV genes can describe unknown repertoires. Eur J Immunol. (2012) 42:3001–8. doi: 10.1002/eji.201242596
27. Zhou V, Yassai MB, Regunathan J, Box J, Bosenko D, Vashishath Y, et al. The functional CD8 T cell memory recall repertoire responding to the influenza A M158–66 epitope is polyclonal and shows a complex clonotype distribution. Hum Immunol. (2013) 74:809–17. doi: 10.1016/j.humimm.2012.12.016
28. Yassai MB, Demos W, Janczak T, Naumova EN, Gorski J. CDR3 clonotype and amino acid motif diversity of BV19 expressing circulating human CD8 T cells. Hum Immunol. (2016) 77:137–45. doi: 10.1016/j.humimm.2015.11.007
29. Naumova EN, Yassai MB, Demos W, Reed E, Unruh M, Haribhai D, et al. Age-based dynamics of a stable circulating Cd8 T cell repertoire component. Front Immunol. (2019) 10:1717. doi: 10.3389/fimmu.2019.01717
30. Naumov YN, Naumova EN, Hogan KT, Selin LK, Gorski J. A fractal clonotype distribution in the CD8+ memory T cell repertoire could optimize potential for immune responses. J Immunol. (2003) 170:3994–4001. doi: 10.4049/jimmunol.170.8.3994
31. Naumova EN, Gorski J, Naumov YN. Two compensatory pathways maintain long-term stability and diversity in CD8 T cell memory repertoires. J Immunol. (2009) 183:2851–8. doi: 10.4049/jimmunol.0900162
32. Wolfl M, Greenberg PD. Antigen-specific activation and cytokine-facilitated expansion of naive, human CD8+ T cells. Nat Protoc Apr. (2014) 9:950–66. doi: 10.1038/nprot.2014.064
33. Maslanka K, Piatek T, Gorski J, Yassai M, Gorski J. Molecular analysis of T cell repertoires. Spectratypes generated by multiplex polymerase chain reaction and evaluated by radioactivity or fluorescence. Hum Immunol. (1995) 44:28–34. doi: 10.1016/0198-8859(95)00056-A
34. Yassai MB, Naumov YN, Naumova EN, Gorski J. A clonotype nomenclature for T cell receptors. Immunogenetics. (2009) 61:493–502. doi: 10.1007/s00251-009-0383-x
35. Magurran AE. Ecological diversity and its measurement. Princeton, NJ: Princeton University Press (1988). doi: 10.1007/978-94-015-7358-0
36. Fülöp T, Franceschi C, Hirokawa K, Pawelec G, SpringerLink. Handbook of immunosenescence: basic understanding and clinical implications. New York, NY: Springer reference. Springer (2019). doi: 10.1007/978-3-319-99375-1
37. Naumova EN. Visual analytics for immunologists: Data compression and fractal distributions. Self Nonself. (2010) 1:241–9. doi: 10.4161/self.1.3.12876
38. Godthelp BC, van Tol MJ, Vossen JM, van Den Elsen PJ. T-Cell immune reconstitution in pediatric leukemia patients after allogeneic bone marrow transplantation with T-cell-depleted or unmanipulated grafts: evaluation of overall and antigen-specific T-cell repertoires. Blood. (1999) 94:4358–69. doi: 10.1182/blood.V94.12.4358
39. Appay V, Douek DC, Price DA. CD8+ T cell efficacy in vaccination and disease. Nat Med. (2008) 14:623–8. doi: 10.1038/nm.f.1774
40. Alexander-Miller MA. High-avidity CD8+ T cells: optimal soldiers in the war against viruses and tumors. Immunol Res. (2005) 31:13–24. doi: 10.1385/IR:31:1:13
41. Vigano S, Utzschneider DT, Perreau M, Pantaleo G, Zehn D, Harari A. Functional avidity: a measure to predict the efficacy of effector T cells? Clin Dev Immunol. (2012) 2012:153863. doi: 10.1155/2012/153863
42. Beukelman T, Xie F, Chen L, Baddley JW, Delzell E, Grijalva CG, et al. Rates of hospitalized bacterial infection associated with juvenile idiopathic arthritis and its treatment. Arthritis Rheumatol. (2012) 64:2773–80. doi: 10.1002/art.34458
43. Udaondo C, Nunez Cuadros E, Murias S, Remesal A, Alcobendas R, Guerrero C, et al. Are infections in children with juvenile idiopathic arthritis more frequent than in healthy children? A prospective multicenter observational study. Front Pediatr. (2022) 10:917731. doi: 10.3389/fped.2022.917731
44. Toussi SS, Pan N, Walters HM, Walsh TJ. Infections in children and adolescents with juvenile idiopathic arthritis and inflammatory bowel disease treated with tumor necrosis factor-alpha inhibitors: systematic review of the literature. Clin Infect Dis. (2013) 57:1318–30. doi: 10.1093/cid/cit489
45. Park JK, Lee MA, Lee EY, Song YW, Choi Y, Winthrop KL, et al. Effect of methotrexate discontinuation on efficacy of seasonal influenza vaccination in patients with rheumatoid arthritis: a randomised clinical trial. Ann Rheum Dis. (2017) 76:1559–65. doi: 10.1136/annrheumdis-2017–211128
46. Park JK, Lee YJ, Shin K, Ha YJ, Lee EY, Song YW, et al. Impact of temporary methotrexate discontinuation for 2 weeks on immunogenicity of seasonal influenza vaccination in patients with rheumatoid arthritis: a randomised clinical trial. Ann Rheum Dis. (2018) 77:898–904. doi: 10.1136/annrheumdis-2018–213222
Keywords: CD8 + T cells, T cell repertoire, influenza vaccination, clonotypes, juvenile idiopathic arthritis, clonotype diversity
Citation: Sabbagh SE, Haribhai D, Gershan JA, Verbsky J, Nocton J, Yassai M, Naumova EN, Hammelev E, Dasgupta M, Yan K, Gorski J and Williams CB (2024) Patients with juvenile idiopathic arthritis have decreased clonal diversity in the CD8+ T cell repertoire response to influenza vaccination. Front. Immunol. 15:1306490. doi: 10.3389/fimmu.2024.1306490
Received: 03 October 2023; Accepted: 02 May 2024;
Published: 30 May 2024.
Edited by:
Guang Sheng Ling, The University of Hong Kong, Hong Kong SAR, ChinaReviewed by:
Teun Guichelaar, National Institute for Public Health and the Environment, NetherlandsCopyright © 2024 Sabbagh, Haribhai, Gershan, Verbsky, Nocton, Yassai, Naumova, Hammelev, Dasgupta, Yan, Gorski and Williams. This is an open-access article distributed under the terms of the Creative Commons Attribution License (CC BY). The use, distribution or reproduction in other forums is permitted, provided the original author(s) and the copyright owner(s) are credited and that the original publication in this journal is cited, in accordance with accepted academic practice. No use, distribution or reproduction is permitted which does not comply with these terms.
*Correspondence: Calvin B. Williams, Y2J3aWxsaWFAbWN3LmVkdQ==
†These authors have contributed equally to this work and share first authorship
Disclaimer: All claims expressed in this article are solely those of the authors and do not necessarily represent those of their affiliated organizations, or those of the publisher, the editors and the reviewers. Any product that may be evaluated in this article or claim that may be made by its manufacturer is not guaranteed or endorsed by the publisher.
Research integrity at Frontiers
Learn more about the work of our research integrity team to safeguard the quality of each article we publish.