
94% of researchers rate our articles as excellent or good
Learn more about the work of our research integrity team to safeguard the quality of each article we publish.
Find out more
ORIGINAL RESEARCH article
Front. Immunol., 29 January 2024
Sec. Systems Immunology
Volume 15 - 2024 | https://doi.org/10.3389/fimmu.2024.1303776
This article is part of the Research TopicNew Approach Methods in ImmunologyView all 20 articles
 H. Ibrahim Korkmaz1,2,3,4*†
 Vivek M. Sheraton5,6,7†
 Roland V. Bumbuc1,2,5,6,7
 Meifang Li5
 Anouk Pijpe1,3
 Patrick P. G. Mulder4,8
 Bouke K. H. L. Boekema1,4
 Evelien de Jong9Stephan G. F. Papendorp9Ruud Brands10,11
 Esther Middelkoop1,3,4
 Peter M. A. Sloot5
 Paul P. M. van Zuijlen1,3,4,12
Introduction: Burns are characterized by a massive and prolonged acute inflammation, which persists for up to months after the initial trauma. Due to the complexity of the inflammatory process, Predicting the dynamics of wound healing process can be challenging for burn injuries. The aim of this study was to develop simulation models for the post-burn immune response based on (pre)clinical data.
Methods: The simulation domain was separated into blood and tissue compartments. Each of these compartments contained solutes and cell agents. Solutes comprise pro-inflammatory cytokines, anti-inflammatory cytokines and inflammation triggering factors. The solutes diffuse around the domain based on their concentration profiles. The cells include mast cells, neutrophils, and macrophages, and were modeled as independent agents. The cells are motile and exhibit chemotaxis based on concentrations gradients of the solutes. In addition, the cells secrete various solutes that in turn alter the dynamics and responses of the burn wound system.
Results: We developed an Glazier-Graner-Hogeweg method-based model (GGH) to capture the complexities associated with the dynamics of inflammation after burn injuries, including changes in cell counts and cytokine levels. Through simulations from day 0 – 4 post-burn, we successfully identified key factors influencing the acute inflammatory response, i.e., the initial number of endothelial cells, the chemotaxis threshold, and the level of chemoattractants.
Conclusion: Our findings highlight the pivotal role of the initial endothelial cell count as a key parameter for intensity of inflammation and progression of acute inflammation, 0 – 4 days post-burn.
Burns are a significant problem worldwide, having a high mortality and morbidity rate. Especially severe burns generally induce a massive long-term inflammatory response both systemically and locally (1–5).
Even though the inflammatory response is initially indispensable during wound healing, a massive persistent inflammatory response not only negatively affects the wound healing but may also result in multiple organ dysfunction (5). Despite significant progress in unravelling cellular and molecular processes involved in burn wound healing and the post-burn inflammatory response, the pathophysiology of burns and how, in this regard, burns differ from other non-burn wounds is far from fully understood.
The immune system is a key factor in wound healing and tissue regeneration. In the case of severe burns, the post-burn immune response is complex and involves intricate interactions between various cellular and molecular components (6, 7). It is essential to understand the dynamics of the immune response in burn wounds for the development of effective therapeutic interventions to improve patient outcomes (8–10). At the macroscopic level (i.e. patient level), the long-term inflammation that follows burn wounds often leads to deformities that affect the quality of life from burn patients. In severe cases, delayed wound closure (11), abnormal scarring (12), increased fibrosis (13), increased vascular proliferation (14) and excessive extracellular matrix deposition (12) can be caused by intense local and systemic inflammatory reactions.
From a cell biology point of view, the number of inflammatory cells such as neutrophils, monocytes, macrophages, and level of pro-inflammatory cytokines are important at the acute inflammation stage of post-burn wound healing (4–6, 15, 16). During the acute inflammatory phase, between 24 and 72 hours, damage-associated molecular patterns (DAMP) and pathogen-associated molecular patterns (PAMP) trigger the immune response. This is accompanied by the release of interleukin (IL)-8, IL-6, tumor necrosis factor (TNF)α, IL-1β and IL-10, this process is summarized in Figure 1C. After 72 hours, macrophages are attracted to the wound site and differentiate into pro-inflammatory (M1) or “pro-healing” (M2) phenotypes. Fibroblasts migrate to the wound site, where angiogenesis takes place, with the help of endothelial cells. The processes that follow over the next days include reepithelization, revascularization, peripheral nerve repair, collagen fiber organization, reducing the number of macrophages and fibroblasts. Both decreased inflammation (i.e. normalization of the acute inflammatory mediators such as IL-6 and IL-8) and decreased angiogenesis will lead to limited scar formation (17). Endothelial cells play a crucial role in balancing the level of angiogenesis (18), helping to facilitate the inflammatory response and wound healing (19). After a burn injury, endothelial cells are among the first responders at the site of tissue damage. Among their main functions, they initiate the inflammatory response during the inflammation phase by expressing adhesion molecules and chemokines (20), facilitating the recruitment of immune cells such as neutrophils and monocytes to the wound area (21). Since endothelial cells are crucial during the acute inflammatory phase post-burn, we hypothesized that the endothelial cell count is one of the crucial parameters in burn wound healing and the acute immune response as shown in Figure 1C. Another key parameter is the time frame in wound healing.
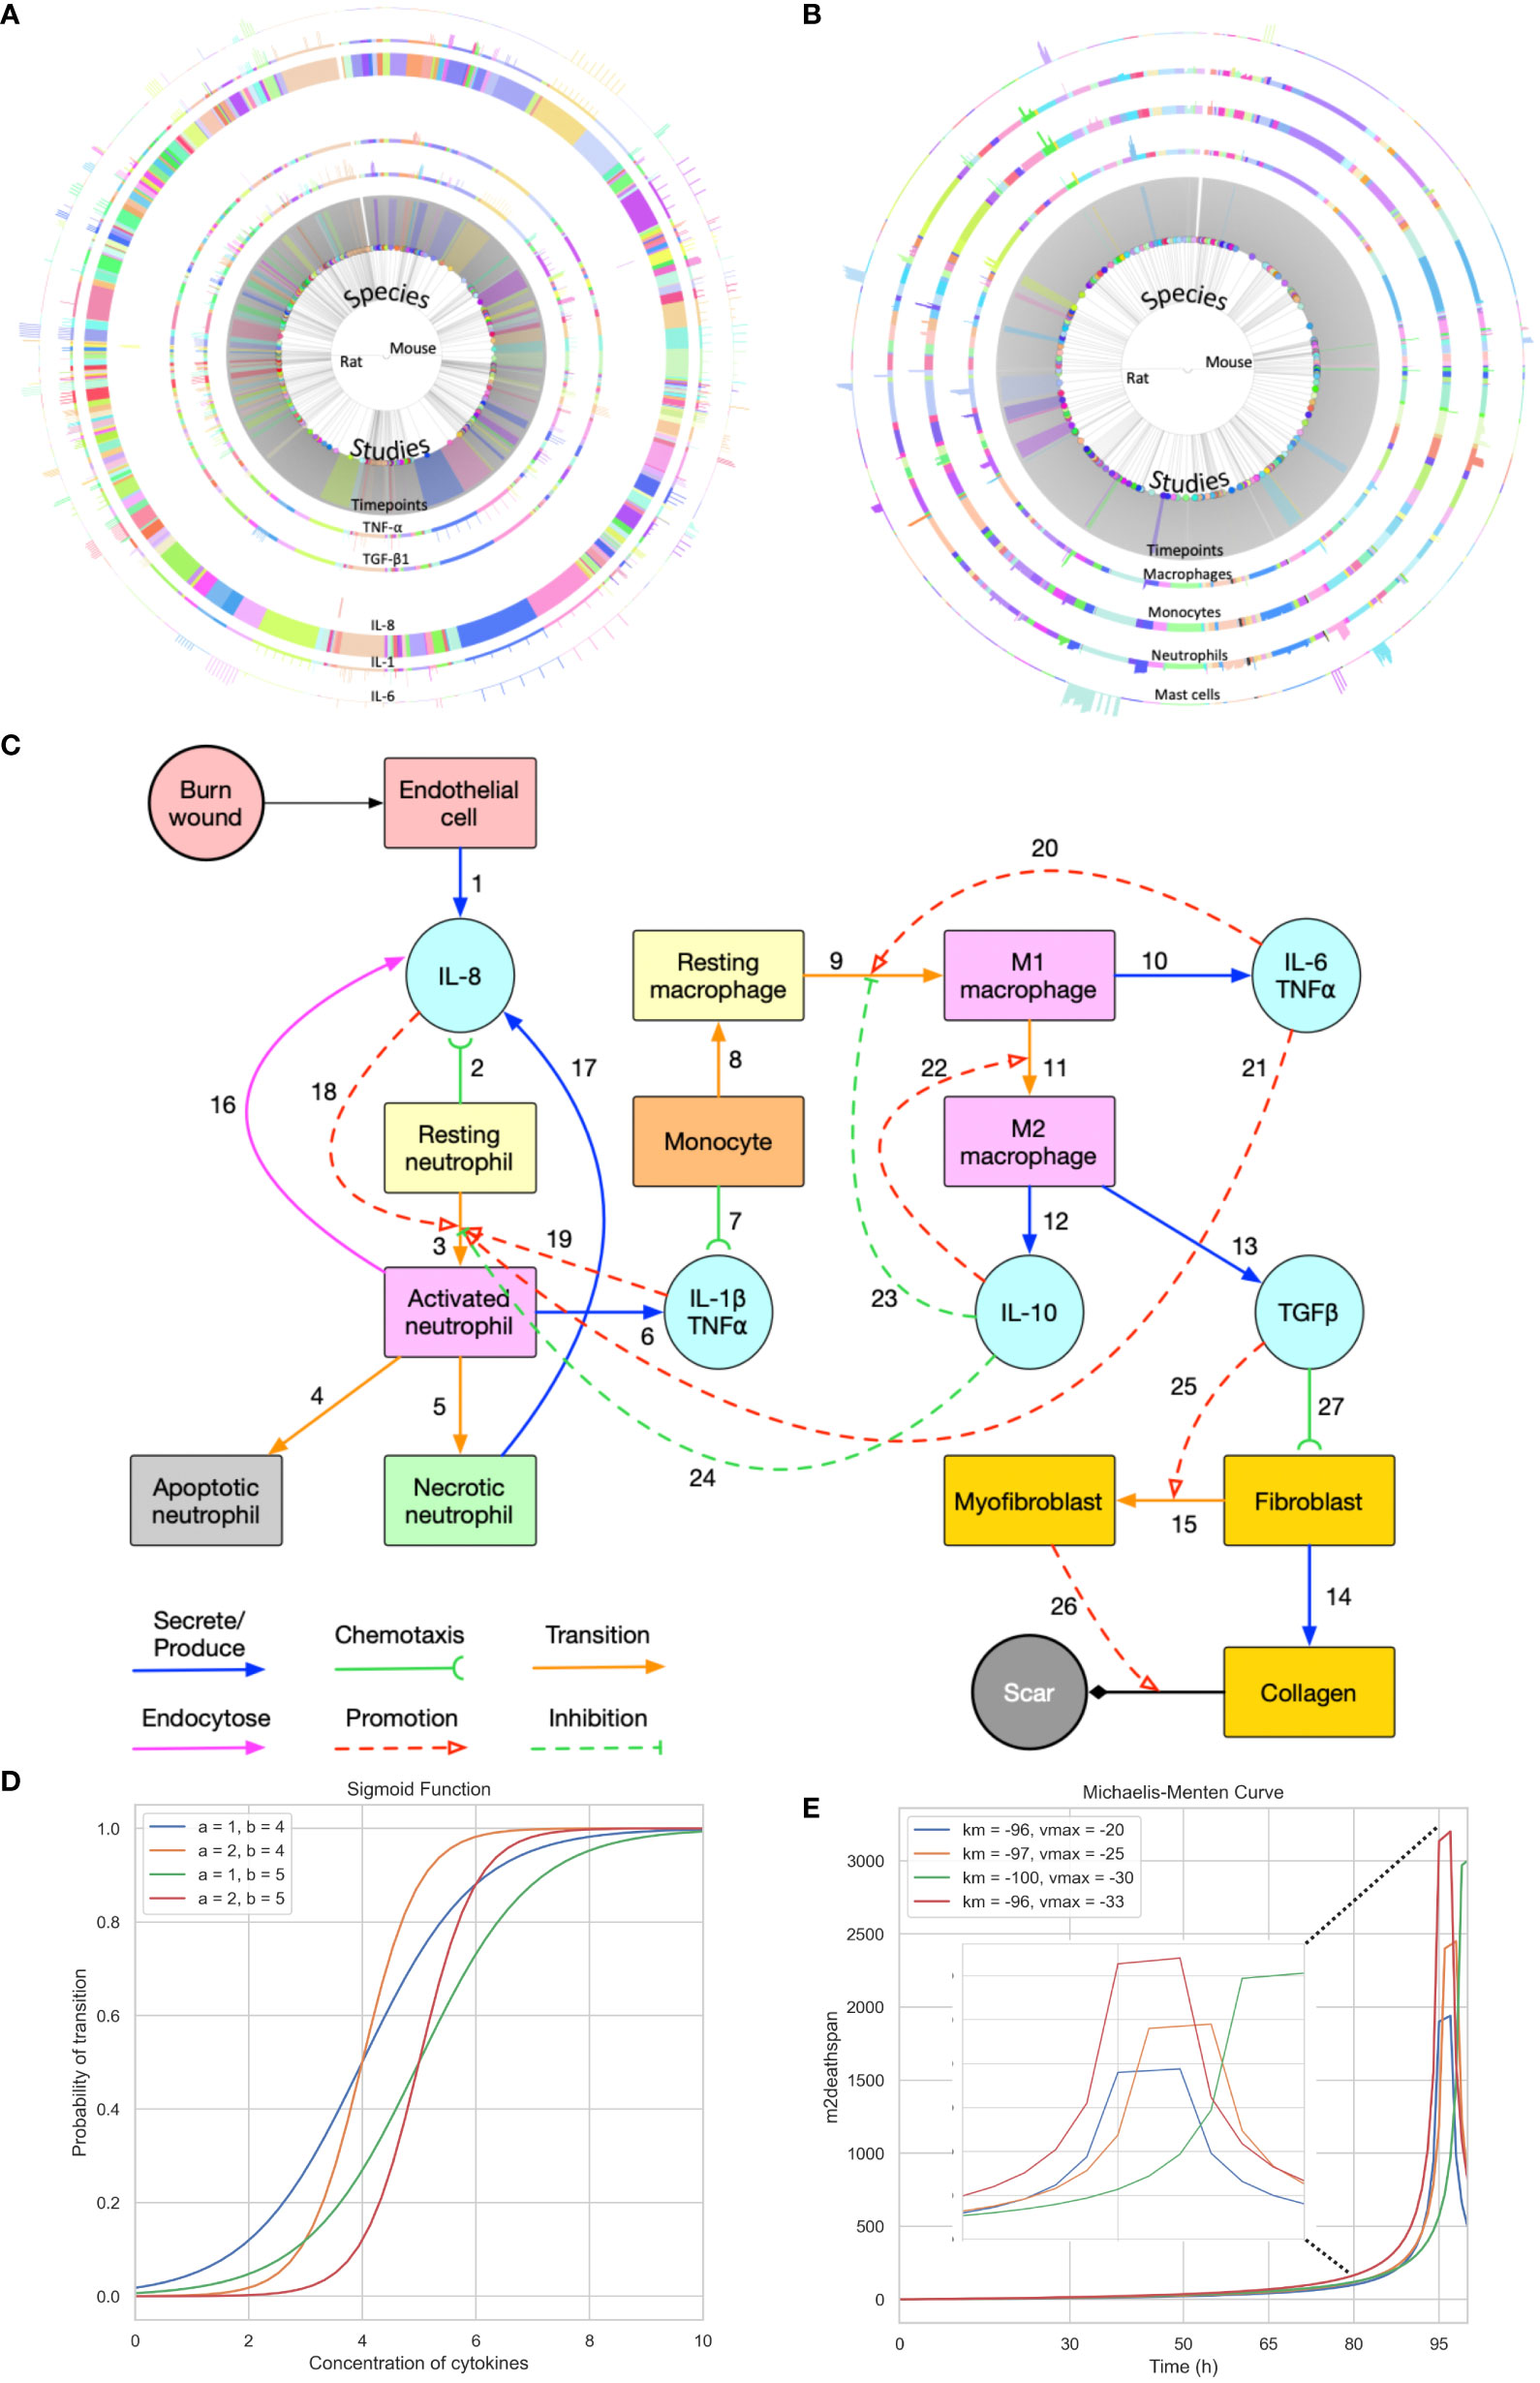
Figure 1 Summary of the data used for validation, conceptual model of the modelling approach, and sigmoid function and Michaelis-Menten function with different parameters. (A) Cell data relating different species to their respective cell characteristics pre-burn and after burn essay over time series by different studies. (B) Cytokine data relating different species to their respective cell characteristics pre-burn and after burn essay over time series by different studies. (A, B) Each arc represents different histogram data related to the main characteristic in study, note that this data has been obtained experimentally in vivo. (C) Conceptual model of the modelling approach. Each stock contains the variable in question and each link represents its relationship between variables (Created with BioRender.com). (D, E) Sigmoid function and Michaelis-Menten function with different parameters, respectively. Each value was randomized to show how different inflection points output different curves.
Until now, both experimental and clinical approaches have been used to gain insight into the post-burn wound healing and specifically the immune response. However, due to the complexity of the involved processes, cellular and molecular pathways, these approaches have limitations such as the ability to sufficiently understand the underlying mechanisms to predict the system’s behavior. In some cases, it may not be possible to extract details on a finer-scale, such as spatial concentrations of cytokines at microscale level through animal experiments. Moreover, there are discrepancies in translating knowledge on cellular/molecular level for development of effective therapies for burn patients. To bridge this knowledge gap, computational modeling approaches have been developed as powerful tools to better understand complex biological processes (22–24). Recently, black box approaches such as machine learning and neural networks have been developed in context of burn wound healing process (25). Most of black box models in literature focus on wound healing prediction via image analysis and often overlook the underlying mechanisms driving the healing process. Burn wound healing, in general, wound healing, could benefit vastly from mechanistic computational models focusing on different aspects of the healing process. Turley et al. provide a comprehensive overview of how mathematical model techniques could play a role in exploring various aspects of wound healing including inflammation, closure and angiogenesis (26). Nagaraja et al. developed mechanistic models to understand the prolonged effects of inflammation (chronic inflammation) on the healing process and to test possible intervention strategies computationally (27, 28). These models were further expanded to identify biomarkers of pathological scarring in skin tissues (29). Though the above models are not specific to burn injuries, they showcase the usefulness of mathematical models in exploration and mechanism driven predictions of wound healing. In this study, we introduce an in silico mechanistic modeling approach to investigate the dynamics of the post-burn immune response. Agent-based modeling (ABM) techniques, specifically the Glazier-Graner-Hogeweg (GGH) model (30), is used to simulate the behavior of inflammatory agents and the dynamics of entities involved in burn wound inflammation (31, 32). By combining relevant experimental knowledge, data from existing experimental animal burn models, and mathematical principles (33, 34), our approach provides a comprehensive framework for studying the intricate dynamics of the (acute) immune response in burn wounds. Further, in this study, we hypothesize that endothelial cells act as one of the key players in determining the extent and duration of post-burn inflammation response. To verify this hypothesis, we use the developed spatio-temporal model to numerically simulate, analyze and qualitatively validate post-born immune responses during the acute inflammation phase.
The dataset provided by Mulder et al. (2), encompasses a collection of cytokine levels and immune cell counts of 14 different cell types from 247 studies involving rats and mice (Figures 1A, B). These measurements were taken across various animal characteristics (age, sex, species), burn wound characteristics (% total burn surface area, thickness and depth), sample source (in the skin), repeated samples, baseline comparison used, relative burn wound area, wound status (contraction, re-epithelialization, or overall burn area), anesthetic type used, and animal outcomes (healthy or not). Additionally, cytokine data specifically includes details on the analysis methods and the different cytokines measured, while cell count data specifies the method of inference and measurement. Both types of data are longitudinal follow-ups for some of the animals, which means that cell counts, and concentration of cytokines are accompanied by timeseries.
Notably, the dataset exhibits significant gaps, missing cytokine concentration or cell count reports for a notable amount of time frames, challenging the preprocess of data from a mechanistic standpoint. To address this issue, certain assumptions had to be made to enable specific validation points within the analysis. Table 1 is the result of the raw data analysis on cell count change over time without any assumptions. These assumptions were made while considering the overall integrity and scientific validity of the data. Going forward, the model parameters were adjusted accordingly to fit the values provided by the data.
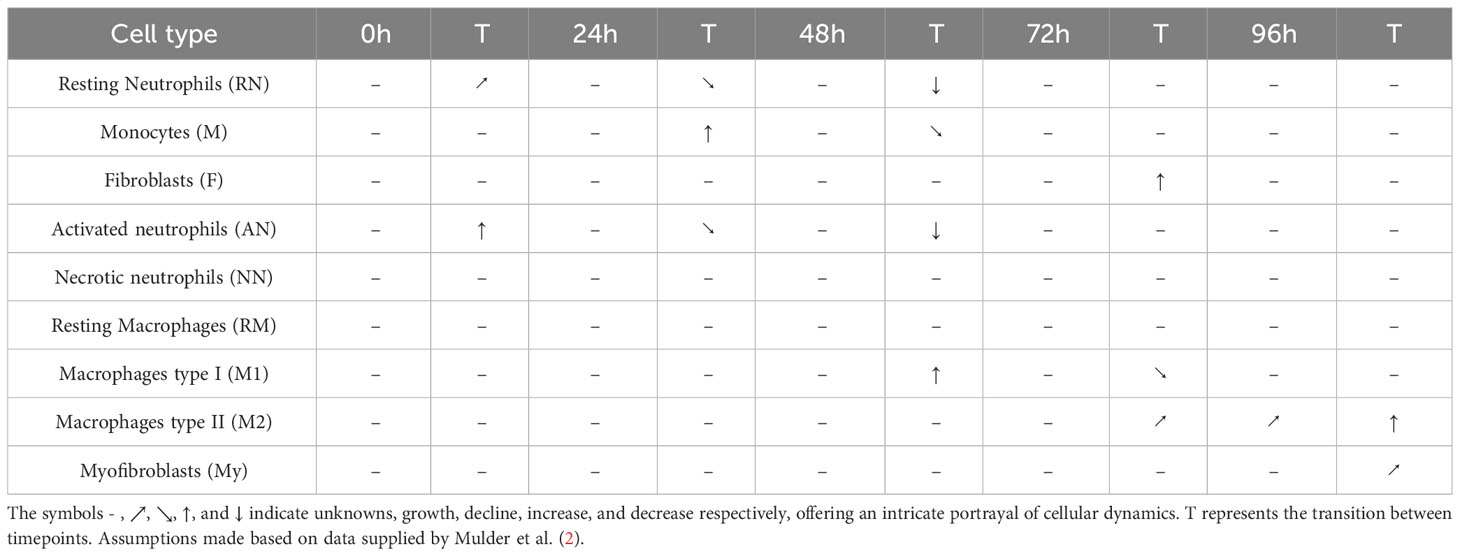
Table 1 Cell count transitions 0 – 4 days post-burn.
ABM is a computational modeling technique that enables the simulation of complex systems by representing individual agents and their interactions within a defined environment. ABM has gained increasing popularity in immunology (35, 36) because of its ability to capture the spatial heterogeneity and emergent behaviors observed in biological systems.
The GGH model, also known as the Cellular Potts Model (CPM), is a versatile computational method that enables the representation of non-uniform cell shapes as agents in multi-cell systems. It is a widely adopted ABM framework that has been successfully applied to simulate various biological phenomena, including cell migration (37), chemotaxis (38), and cell-cell interactions (39). This model is particularly suitable for studying the complex dynamics of the immune response, as it allows the representation of multiple cell types, the diffusion of soluble factors and the integration of experimental data extracted from existing in vivo animal burn models (rats and mice) (2) into the simulation framework (Figures 1A, B). With this integration, we expect to be able to find a good estimate for the parameters used to simulate the post-burn effects on cytokines, cells, and two-dimensional development of the wound. Our condensed two-dimensional simulation of the wound development implements the free energy mechanisms previously proposed using CompuCell3D (40, 41), an open-source GGH implementation.
The burn wound site is created in a 2D 5*5 cm square domain that includes two main components: the central 4*4 cm square represents the tissue component whereas the surrounding area of the central square is treated as the blood component (concept shown in Figure 1C). Because inflammation after burns intensifies during the first three to four days, the whole simulation will perform 1,000,001 Monte Carlo steps (MCS) with each 10,000 MCS representing one hour so that one simulation is treated as 100 hours in real time. The cells used in the simulation environment follow the rules of the conceptual model of Figure 1C, explained by following the links. Resting neutrophils and monocytes circulate commonly in the blood when there is no injury. If a burn occurs, the endothelial cells of the tissue component will secrete IL-8 [Link 1] to trigger the inflammatory response. Resting neutrophils are recruited from blood to tissue by chemotaxis to IL-8 [Link 2] and are activated by IL-8 [Links 3 and 18] when entering the tissue layer. Subsequently, activated neutrophils secrete pro-inflammatory cytokines IL-1β and TNF-α [Link 6] and these pro-inflammatory cytokines contribute to neutrophil activation [Link 19] and enhance the inflammatory response. Activated neutrophils can also endocytose IL-8 [Link 16] to neutralize inflammation to some extent. Meanwhile, activated neutrophils are short-lived, so they will enter apoptosis [Link 4] during inflammation. If inflammation persists, some activated neutrophils will turn into necrotic neutrophils [Link 5], triggering the release of additional IL-8 in the tissue [Link 17].
Attracted from blood to tissue, monocytes migrate toward IL−1β and TNF-α, secreted by activated neutrophils [Link 7], and then turn into resting macrophages, also called resting monocytes, in the tissue compartment in the presence of IL-6 [Link 8]. The resting macrophages are then transformed into activated macrophages [Link 9], commonly known as M1 macrophages, promoted by IL-6 and TNF-α. The macrophages of the M1 phenotype can secrete pro-inflammatory cytokines IL-6 and TNF-α [Link 10], which promote the activation of neutrophils and macrophages [Links 20 and 21]. M1 macrophages transition to M2 macrophages [Link 11] is promoted by the anti-inflammatory cytokine IL-10. M2 macrophages secrete IL-10 [Link 12] and TGF-β1 [Link 13]. In the current conceptual model, we only consider activated TGF-β1 (no latent), and IL-10 inhibits neutrophil and macrophage activation [Links 23 and 24]. Fibroblasts migrate towards TGF-β1 [Link 27] and can differentiate into myofibroblasts in the presence of (activated) TGF-β1 [Links 15 and 25]. Fibroblasts are responsible for collagen production [Link 14] and myofibroblasts cooperate with fibroblasts to form a collagen matrix [Link 26].
In our modeling system, each cell is depicted as a point arranged on a lattice. To introduce randomness and fairness to the position of the cells, we allowed the exchange of lattice sites between adjacent cells at their boundaries. To ensure that each lattice site has an equal chance of undergoing potential exchange during the simulation, we evaluated each potential exchange in random order. This constitutes a Monte Carlo step (MCS) which serves as the unit of time in our simulation. We selected a square grid for the simulations for two main reasons, 1. easier coupling between the cell field and the cytokine field concentrations, solved using finite volume solver (FiPy) and 2. to reduce computational complexity and resource usage if a hexagonal grid were to be considered for the simulation.
All cell types involved in the simulation will move due to chemotaxis and their initial number on the lattice is fixed, except for endothelial cells (as shown in Supplementary Table 1 estimated from experimental data (2)). The Chemotaxis plugin in CC3D calculates the change of energy associated with the movement of the pixels, with the parameter λ controlling the strength of chemotaxis. Λ is specified for each type of cell, representing the response speed to a certain chemical. The energy formula is modified with a saturation coefficient, a, to include saturation terms (Equation 1, where c (xdestination) and c (xsource) denote the chemical concentration in the source pixel and the destination pixel, respectively). The minimum chemical concentration for the initialization condition is defined by a, which is used as an indicator of potential resistance to chemotaxis. Resting neutrophils are attracted by IL-8, monocytes by IL-1β and TNF-α and fibroblasts by TGF-β1. We assume that a burn injury occurs on a non-delicate area of the human body and the skin surface is uniform. The starting point of the implemented model are the remaining endothelial cells after the burn injury. Therefore, we assume that these do not move, and their number is limited and does not change during the simulation. We also assume that no cell can move across the boundaries so they will disappear if they reach the boundaries. However, in order to keep the number of cells constant in the simulation, we implement periodic boundary conditions, where every time a cell reaches a boundary, the cell reappears on the other end of the boundary, hence keeping the count of the cells in the simulation constant.
When it comes to cell transitions, all the details and effects of the cytokines involved can be found in Table 2. As outlined in the conceptual model, each cell is treated as an agent in the simulation, so there is a chance that this cell will transform into another cell type. To address this probability, we used the sigmoid function (42) (Table 3, also known as the logistic function; Figure 1D). This function can take any real value as input and output value in the range (0, 1), which is necessary to randomly assign a transition probability. The first point of inflection(a) and the second point of inflection(b) can be adjusted to the specific needs of the cell transition. Since the sigmoid function is used to simulate the probability of a single factor, all the cytokines of promotion and inhibition should be incorporated to calculate the final transition probability. Based on Equation 2, the final probability that the resting neutrophils become activated consisted of five sigmoid functions, each of which will give a result between 0 and 1 depending on the concentration of each kind of cytokine.
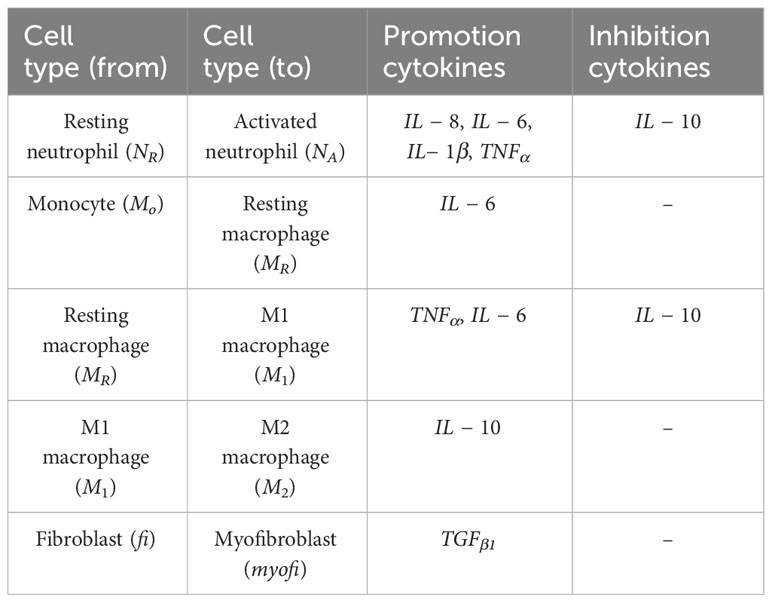
Table 2 Cell type transition and the influence of cytokines used in simulations.
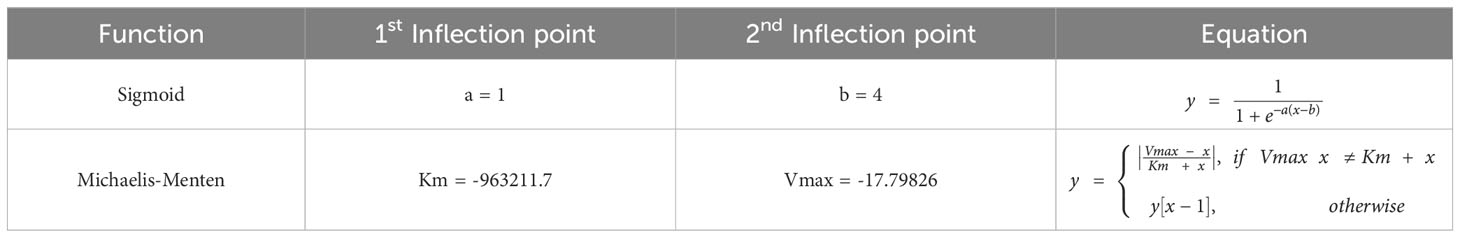
Table 3 Function types and values used in the simulations. y[x-1] means the previously calculated value is used. Inflection points obtained experimentally.
The coefficients w1, w2, w3, w4 must sum to 1 for the final probability to remain between 0 and 1, and w5 must not exceed 1. Similarly, w7, w8 and w9 must not exceed 1 in Equation 4. Additionally, w6, w10, w11 must not exceed 1 since there is only one term in Equations 3, 6 respectively. A base probability of 0.1 is given in Equations 3, 5, 6 in the event that there is no IL-6 and IL-10 present, as macrophages M1 and M2 do not exist in that situation. The only remaining cell transition is for activated neutrophils to become necrotic. Since there is no simple method in the literature that can detect neutrophils undergoing necrosis (43), activated neutrophils are assumed to be necrotic with a random probability (e.g., 0.1) in simulation.
The concentration of cytokines in each grid will be determined by solving the solute diffusion equations, and the cell transition will be based on probability equations. The parameters for the sigmoid function can be found in Table 3. Additionally, the order of magnitude of the cytokine concentration is essential to guarantee the accuracy of the calculations. Multiple pre-simulations were performed to determine the order of magnitude of the cytokine concentrations, which can be seen in Supplementary Table 2.
Some cells, such as resting neutrophils and monocytes, have a predetermined lifespan that is determined by biology (see Supplementary Table 1 in the Supplementary Material). On the contrary, the lifespan of other cells, such as fibroblasts and macrophages, is more difficult to measure due to the variability between individuals. However, certain assumptions had to me made to calculate changes in cell count during the healing process. For example, if in timepoint A the solute concentration or cell number is increased, and in timepoint B, the solute concentration or cell number is decreased(assuming A<B), then between these two points, the solute concentration or cell count is decreasing. By examining the data presented in Figures 1A, B, we can establish these assumptions (Table 1) and fit a Michaelis-Menten curve (44) specifically for macrophages type 2, which are of great importance in the immune response (45). Type 2 macrophages live beyond day 4 of simulation, however these cells have a significant impact on the downstream of burn wound healing. Assuming these are immortal, does not replicate the behavior in Table 1.Therefore, we assume that their immortality is not constant and tested different parameters and functions that can make sure the dynamics are replicated. The parameters and functions used are shown in Table 3.
In this model we simulate the burn wound microenvironment after it has occurred, therefore at the initial point(t=0), we assume the start of the process of healing after burn injury. Owing to the two dimensional nature of the model, it does not include the depth or proliferation within the wound. To model accurately this wound patch of burn injury, we assume that the burn wound is located on a non-delicate area of the human skin, therefore the injury has not occurred on the face, genitals, or fingertips, for example. We consider a limited supply of cells in circulation and in the wound patch simulated (16cm2). This assumption could be replaced with experimentally or clinically observed vessel density metrics from the wound area in future studies. The exchange of cells and solute between the wound area and the blood supply is possible, and this is driven by the interactions described in Figure 1C. The blood supply is limited only by the amount of circulating solute concentration or cells around the wound patch, therefore it implies that more cells can still be recruited. We allow cells to die by either transitioning into necrotic or apoptotic(only in neutrophils) or disappearing from the wound when reaching certain volume. A comprehensive data availability on cell count from the burn wound tissue and blood sample would help side step the above assumption in future models. In the current model, whenever a cell disappears, a new one takes its place, keeping the cell count homogenous across simulations. The severity of the wound is dictated by the concentration of pro-inflammatory cytokines vs anti-inflammatory cytokines given a certain timespan. Finally, we take into consideration only the presence of Fibroblasts and Myofibroblasts, and not collagen or scar formation (Figure 1C), since we limit the model to the effects on the wound path post-burn injury.
There are six main solute molecules described in the conceptual model. The diffusion of IL-8 (Equation 7), IL-1β (Equation 8), IL-6 (Equation 9), IL-10 (Equation 10), (Equation 11) and TGF-β1 (Equation 12) with respect to time. All equations contain one diffusion term (Dcytokine), one or two secretion terms (Kcytokine), and one decay term (μcytokine). The values of diffusion coefficient, decay rate, secretion rate, and endocytosis rate (θcytokine) are found in the literature and adapted to suit the same order of magnitude in the model. All these diffusion equations are solved within each MCS during the simulation. Fixed gradient boundary conditions (Neumann) are specified in the top, right, bottom and left corners of the whole lattice, meaning that the derivative at a boundary is zero or a constant. The cell number parameters in the equations, such as the number of endothelial cells (EC), necrotic neutrophils (NN), and activated neutrophils (NA), macrophages type 1 (M1), macrophages type 2 (M2) at time t, depend on the presence of the cells in the location where the cytokine is being expressed and the initial values for each can be found in Supplementary Table 3.
We employed the Z-score from the SciPy package due to its key benefits (46). This approach offers scale independence, making data unit-independent and allowing comparison between variables with different units. The Z-score also provides interpretability, with each score indicating how many standard deviations (SD) a data point is from the mean. Moreover, the original distribution of the data is preserved. By using this method, we can guarantee that the data are on a common scale, which facilitates meaningful comparisons and statistical analyses. Mathematically, Z-scores (Z) are calculated by subtracting the mean (μ) from the data (X) and dividing by the standard deviation (σ), resulting in Equation 13.
The suitability of this method with wide-ranged data made it an ideal choice for our research context.
Firstly, a parameter scan (i.e. evaluation of possible parameters for the validation assumptions/data) was run thoroughly to verify the sensibility of the Saturation Coefficient and λ parameters. Followed by the experimental design, described in Table 4, for the variable in question, the endothelial cell count.
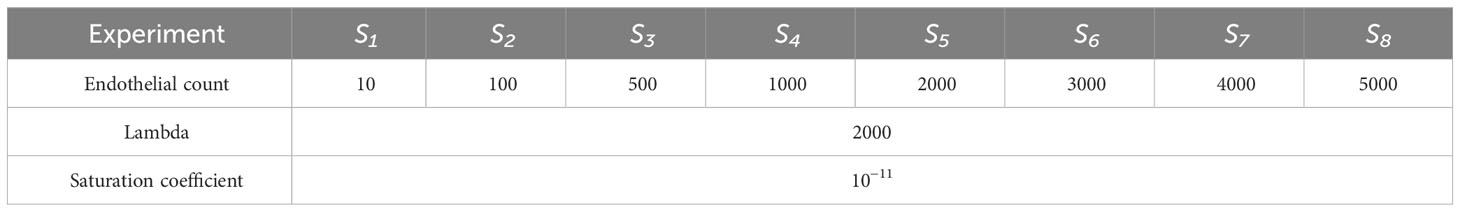
Table 4 Experimental design: Endothelial cell count in 8 groups.
The simulation code, configuration files, and additional results used in our study can be found in this respository .Programming was done in Python 3.10. All simulations were performed using Compucell3D software (version 4.4.1) on Macbook Pro 2019 with a 2,3 GHz 8-Core Intel Core i9 processor.
The chemical field used to simulate chemotaxis is incorporated with Fipy and the partial differential equations were solved by using the LinearGMRESSolver() function.
Additional modules in the CompuCell3D environments used in our simulations and their function are described in Supplementary Table 1B.
Table 1 presents cell count transitions based on available data from the rat and mouse burn studies (2) in a time frame from 0 – 4 days post-burn. According to this, a lot of data points were unknown. Based on available data, resting neutrophils growth increased immediately (0h) after burn (increased Z-score), and resting neutrophil growth declined 24h post-burn (decreased Z-score). Monocytes number increased after 24h, and monocyte growth declined after 48h post-burn. Fibroblasts number increased after 72h post-burn. Activated neutrophils number increased immediately (0h) post-burn, activated neutrophils growth declined after 24h, and activated neutrophil number decreased after 48h post-burn. Macrophages type I (M1) number increased after 48h, M1 growth decreased after 72h post-burn. Macrophages type II (M2) growth increased after 72h up to 96h, and M2 number increased after 96h post-burn. Myofibroblasts growth increased after 96h post-burn.
After running the experimental design outlined in Section 2, we compared the cell percentages between simulations (Figure 2A). The percentage of necrotic neutrophils was very small compared to other cell types and almost indistinguishable. With increasing number of endothelial cell count, all cell types except necrotic neutrophils were decreased (due to the immortality of endothelial cells) in percentage (Figure 2A). We took snapshots at different time intervals for all cytokines, for different simulations (Figures 2B, C), with only the snapshots from the 100th hour (± 4 days post-burn) shown. With higher endothelial cell count, the diffusion of IL-8 towards the center, the site that corresponds with the burn wound, increased and the diffusion of TGF-β1 towards the centeE r decreased. This caused the relationship between IL-8 and TGF-β1 to become opposite in all simulations (Figure 2D). Specifically, the concentration of IL-8 increased from simulation 1 to 8 and TGF-β1 concentration decreased from simulation 1 to 8, compared in the same order of magnitude (taking highest concentration as comparison), over time.
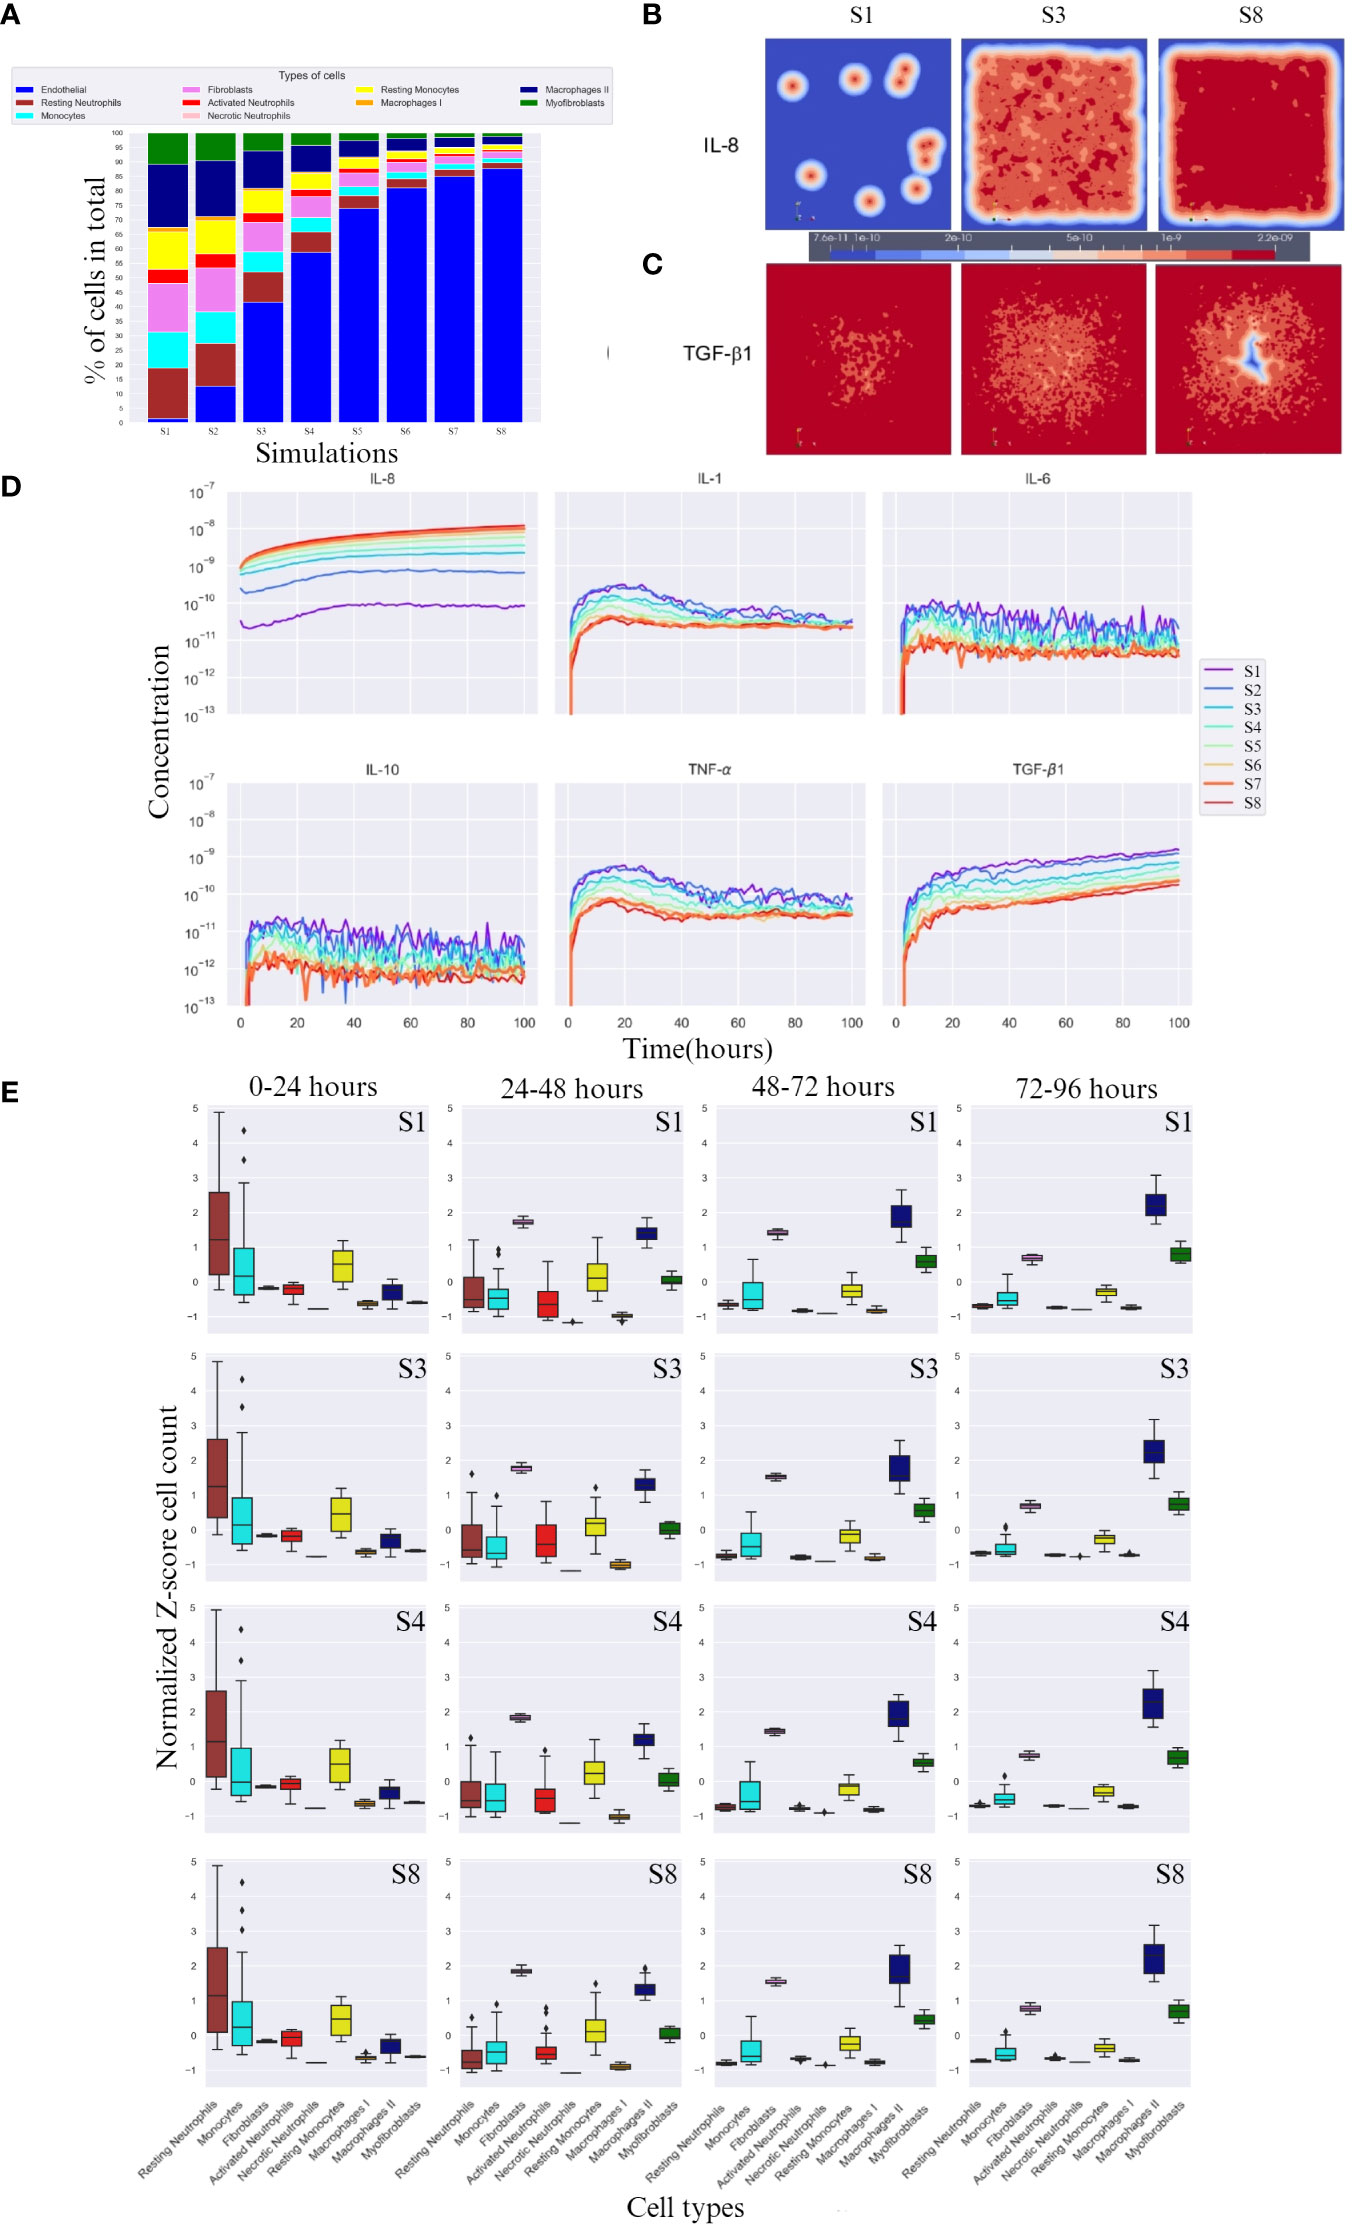
Figure 2 Overall cell type percentage per simulation, diffusion of IL-8 and TGF-β, and cytokine concentration and cell count over time. (A) Overall cell type percentage per S (simulation), note that endothelial cell count increases every S. (B, C) Graphic visualization of the diffusion of IL-8 and TGF-β1 in the 100th hour of simulation, respectively (scale for reference, values range within the same order of magnitude). (D) Cytokine concentration over time (in hours) per (S) simulation on a logarithmic scale (order of magnitude). (E) Breakdown of Z-score normalized cell count over four time frames between hours 0 and 96 for S1, S3, S4 and S8. Only most significant simulations are shown, i.e. where the change in cell count is more evident. For each box plot, the mean is plotted as a black line inside the box and the standard deviation located in each side of the box (at 95% CI), outliers shown as rhombus points. Note that the calculations for Z-score were done with respect to mean of each cell count/cytokine concentration. The score here indicates how many standard deviations an observation is from the mean.
IL-8, unlike TGF-β1, doubles in concentration with increasing endothelial cell count, reaching double the order of magnitude (Figure 2D). Evidently, for IL-8, a higher endothelial cell count leads to a faster equilibrium convergence around the 10−8 order of magnitude of concentration, since S6 and S7 slowly converge to the concentration value achieved by S8.
In the first 24 hours, a lower concentration of IL-8 led to delayed activated neutrophil recruitment, whereas a higher concentration led to a more rapid growth. TGF-β1 had the opposite reaction at higher concentrations. All simulations showed a similar average number of cells across simulations, suggesting an incoming decrease if the availability of cells is high, and an increase if the cells are needed in early stage (supplied by the blood compartment), evidenced by the high SD (Figure 2E 0-24 hours column).
After 24h, a higher endothelial cell count leads to increased cytokine response and cell activation for tissue repair. The diffusion of TGF-β1 increased, which was aided by the higher number of M1, and an increase in fibroblast number (Figure 2E 24-48 hours column). Consequently, activated neutrophils also decreased in cell count. Higher endothelial cell count also resulted in decreased cell count of monocytes.
Between 48 and 72 hours (Figure 2E 48-72 hours column), cytokine levels generally decreased as they reached equilibrium and began to influence cell responses. However, myofibroblast counts increased due to the increased presence of TGF-β1, transitioning from fibroblasts. M2 cell counts also increased.
In the last hours of the simulation, 72 – 96h (Figure 2E 72 – 96 hours column), endothelial cell count resulted in increased M2 cell count.
We chose a control simulation that showed similar dynamics to the indicated in Table 1. We then used the difference in cell count and cytokine concentration for analysis. Figures 3A, B show the Z-scored difference in cell counts and cytokine levels(respectively) between S8 and S4 (control) for different time frames. This provides a more detailed view of the effect of endothelial cell count.
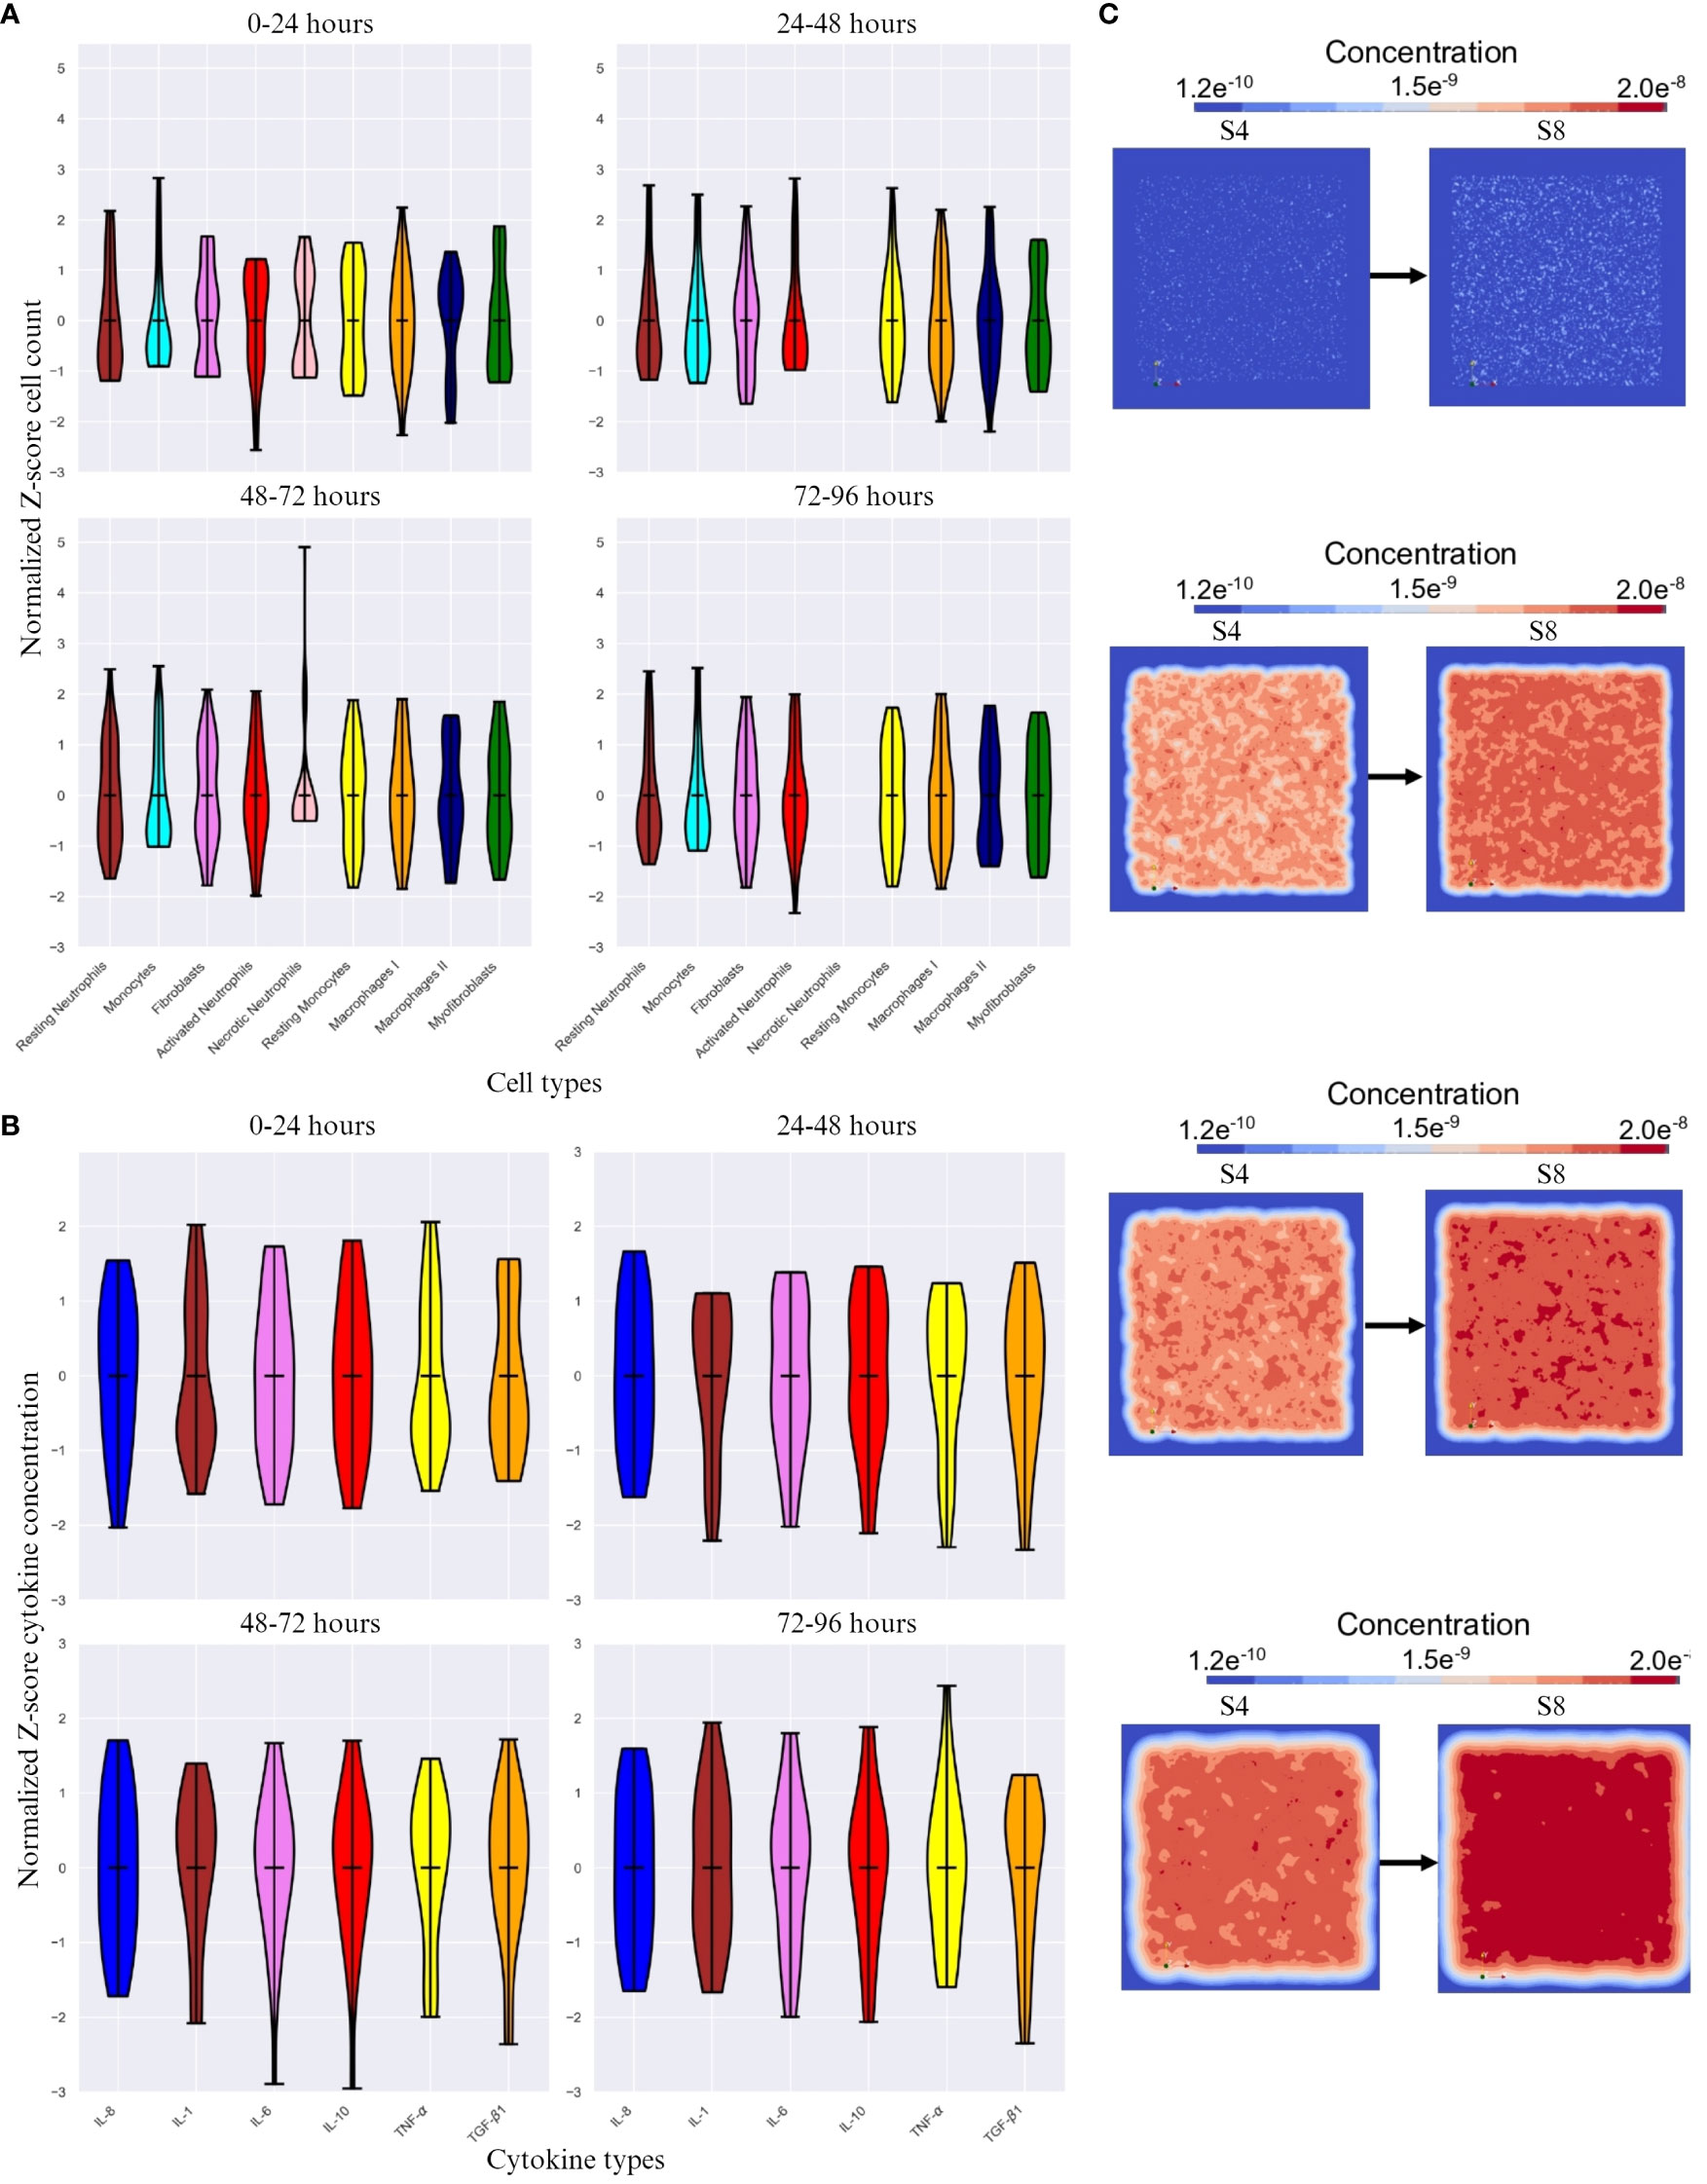
Figure 3 The difference in cell count and cytokine concentration over different time intervals. (A) Z-score normalized difference in cell count(y-axis) over different time intervals between simulation 8 (S8) and simulation 4 (S4 - control) for different cell types(x-axis). (B) Z-score normalized difference in cytokine concentration(y-axis) over different time frames. (C) Initial, 48 hour, 72 hour and 96 hour change in positional diffusion for TGF- β1 (from top to bottom) by comparing S4 (control, on the left) and S8 (on the right). Note that the calculations for Z-score were done with respect to mean of each cell count/cytokine concentration. The score here indicates how many standard deviations an observation is from the mean.
The cell count is expected to be highly variable, which is reflected in the high SD change for all cell types across time frames except necrotic neutrophils and myofibroblasts (Figure 3A), which either are not shown (24 – 48 and 72 – 96 timespans for necrotic neutrophils) or vary in Z-score very actively. With increasing endothelial cells, the cell types with the highest SD change are resting neutrophils, monocytes, resting monocytes, M1 and M2. The most significant difference was seen in the first 24 hours and the last 48 hours of the simulation, with M2 standing out as the most variable cell type across time intervals.
A higher endothelial cell count led to faster resolution of inflammation, restricting the duration of the inflammatory phase (Figures 3B, C). Pro-inflammatory cytokines were the most active cytokines, whereas the other cytokines remained relatively stable, with minimal difference in TGF-β1 concentration. Despite this encounter, TGF-β1 as an anti-inflammatory cytokine, had most changes in SD during the last 48 hours (Figure 3B) showing inflammatory resolution spatially (Figure 3C).
In previous studies, we and others have demonstrated that the (acute) immune response is disrupted, i.e., “over-active” and prolonged, in burn patients, which negatively affects the wound healing and can cause further significant complications systemically (1–5).
In this article, we proposed a comprehensive framework to study the intricate cellular and molecular dynamics of the immune response in burn wounds by using relevant biological knowledge, experimental data from existing animal burn models, and mathematical principles.
After burn, endothelial cells play a crucial role in the inflammation phase of the wound healing. Specifically, during the acute phase, endothelial cells facilitate the movement of circulating inflammatory cells into the tissue at the site of burn injury (47). Therefore, we hypothesized that the endothelial cell count is one of the crucial parameters in burn wound healing and the acute immune response. The conceptual model initiates post-burn at t = 0; meaning that this is the moment that the simulation starts after burn. Within the model, the cells can move (except endothelial cells), are randomly located (mimicking the real burn wound injury circumstances), secrete cytokines, and differentiate. The burn surface area is limited to 5 by 5 cm area.
With these assumptions we demonstrated that our model can simulate the temporal evolution of the cell counts of the various cell types involved in the wound healing process (e.g., endothelial cells, neutrophils, monocytes/macrophages), and the diffusion of cytokines was simulated over a period of 0 – 4 days post-burn. The resulting simulations were tested and validated by experimental data.
Based on available data from rat and mouse burn studies (2), we identified the cell count transitions 0 – 4 days post-burn. Although, data points at different time frames were missing (unknown); we had to make assumptions for the time points in between, based on known data points we were able to simulate the cell count transitions over time. This is a limitation of the model, but in reality, it is not experimentally feasible to get complete timeseries for cell count (and growth) for each cell type.
Our findings revealed a key role for endothelial cells count in the acute immune response, higher endothelial count led to increased cytokine response and cell activation. Since endothelial cells play a crucial role in the regulation of inflammation during the early stages of wound healing by facilitating the movement of inflammatory cells into the tissue, it can be expected that higher counts results in higher inflammatory reaction (e.g. increased cytokines and inflammatory cell activation) (48).
In the first 24h of simulation, we found already a high number activated neutrophils, where lower concentration of IL-8 led to delayed activated neutrophil recruitment, and TGF-β1 had the opposite reaction (Figures 2D, E). These findings correlates well with findings in in vivo studies. Namely, in the first 24h post-burn, there is an enhanced neutrophil migration activity (49), IL-8 plays a causative role in the recruitment and activation of neutrophils (50), and TGF-β1 desensitize neutrophils to chemotaxic stimulation (48).
24 – 48h of simulation we found that both resting and activated neutrophil numbers decreased, and monocytes number increased. After 48h, monocyte numbers decreased, activated neutrophil number decreased further, and macrophage type I number increased (Figures 2D, E). The increase of monocyte numbers after 24h are in line with what was found in studies with burn patients (3, 51, 52). From 48 – 72h after burn monocytes are expected to decrease since they differentiate into macrophages (53). However, neutrophils in vivo normally increase in count for a longer period after burn (50); especially burn wounds are characterized by a prolonged local acute inflammatory response of innate immune cells (3, 52). This can be explained by the fact that the supply of cells in vivo is higher than in the in silico setting, since the supply in the model indicates an exchange from the blood compartment to the tissue compartment, where we assume a limited number of cells in both compartments. This means that there is no “unlimited” supply of cells when e.g. neutrophils die by necrosis (apoptosis in not implemented yet into the model either).
72 – 96h of simulation, macrophage type I number decreased, while macrophage type II number increased, and both fibroblasts and myofibroblasts numbers increased. Moreover, these phenomena were positively affected by TGF-β1 concentrations (Figures 2D, E). With higher endothelial cell count, the diffusion of IL-8 towards the center, the site that corresponds with the burn wound, increased and the diffusion of TGF-β1 towards the center decreased (Figure 3). These findings are in line with the proliferation/remodeling phase during wound repair and scar formation in vivo. The macrophage phenotype changes as the wound heals, progressing from the macrophage type I (pro-inflammatory) to the macrophage type II (anti-inflammatory) (54). Fibroblasts first proliferate, and thereafter differentiate into myofibroblasts, which contract and participate in healing by reducing the size of wound and secreting ECM proteins (55). Regarding this phase of wound repair, processes such as collagen production, wound closure, scar formation, contraction, are not implemented in the conceptual model yet. The current model simulates the cells that are mainly intervening in the (acute) inflammatory phase. And also for these cell types the supply of cells in vivo is higher than in the in silico setting.
The time frame in (burn) wound healing is another important parameter. In the current simulation this is limited by the 0 – 4 day time frame used to initially simulate the acute inflammatory phase of the post-burn immune response. Furthermore, in our model, we focused on the role of endothelial cells count. In addition to endothelial cells, e.g., thrombocytes play an important role in the inflammation phase of wound healing too (56). Thrombocytes provide high levels of platelet-derived growth factor (PDGF), which stimulates chemotaxis of monocytes/macrophages and proliferation of fibroblasts, both crucial during wound healing (56). However, thrombocytes are not included in the conceptual model yet, to simplify the modelling approach.
With regards to the limitations associated with the current model, most appear to arise from the biological proxies used in the model. For instance, some cell types are assumed to be immortal, this is practical considering the smaller duration of the total simulation period (4 days). However, in reality, some of these cells may die and release ITMs (Inflammation Triggering Moieties). These ITMs could further prolong the local inflammation duration at the wound sites. The extent of inflammation from such events could only be calculated from accurate experimental data of cell counts at different time periods. We assume that wound is in a non-sensitive area. In extensive burns, this may not be the case, thus new players not considered in the model could play a crucial role in the healing and wound closure processes. Finally, to lower computational complexity we have considered only innate immune system (cytokines and cells), the effect of adaptive system is not included, which may reduce the personalization aspect of the current model.
In this work, we provided a different perspective of the post-burn transition between cell types and the dynamics of the life span of cells that are difficult to measure experimentally. Although the availability of certain biological factors (data) was at some point limited, our model can simulate events that take place during the post-burn wound healing process can correlate with biological data with appreciable accuracy. The model simulation results are qualitatively verified against relevant studies in the literature. In a way, this is also one of the major limitation of the current model. A complete quantitative verification against experimental or clinical data is currently not possible either due to lack of complete longitudinal data or practical limitations in acquiring some datapoints (such as spatial cytokine concentrations) experimentally. The next step of model development is to investigate the relation with wound healing parameters, i.e., wound closure, re-epithelialization, and scar formation, and patient specific characteristics; and identify processes on long-term (after 4 days post-burn). This approach would provide a comprehensive quantitative validation against clinical data. Since the current model is developed as a conceptual dynamic model, which will be continuously fed by new (generated) data from micro- to macroscale, we expect it will be a continuous learning model for the cellular and molecular processes during the immune response after burn. We have focused on developing a spatio-temporal model to simulate the inflammatory phase of burn wound in this study. In future studies, we plan to computationally model and validate other aspects and timelines of burn wound healing including acute inflammation, collagen production and scar formation. Such individual yet standardized models would provide a platform to combine them later to simulate the whole process of wound healing. In addition, the open-source nature of the developed GGH models and simulation techniques, other research including omics studies and machine learning techniques could be integrated to the mechanistic approach with little computational effort. Eventually, this will enable to prediction of systems behaviors and clinical outcomes in the burn wound healing process.
The original contributions presented in the study are included in the article/Supplementary Material, requests to access these datasets should be directed to BB,YmJvZWtlbWFAYnVybnMubmw=.
Ethical approval was not required for the study involving animals in accordance with the local legislation and institutional requirements because we made use of published data from animal studies to validate our simulation models.
HK: Conceptualization, Data curation, Formal analysis, Investigation, Methodology, Resources, Supervision, Writing – original draft, Writing – review & editing. VS: Conceptualization, Data curation, Formal analysis, Investigation, Methodology, Resources, Software, Supervision, Writing – original draft, Writing – review & editing. RVB: Data curation, Investigation, Methodology, Writing – original draft. ML: Data curation, Investigation, Methodology, Writing – review & editing. AP: Conceptualization, Writing – review & editing. PM: Conceptualization, Writing – review & editing. BB: Conceptualization, Writing – review & editing. EJ: Conceptualization, Writing – review & editing. SP: Conceptualization, Writing – review & editing. RB: Conceptualization, Writing – review & editing. EM: Conceptualization, Writing – review & editing. PS: Conceptualization, Supervision, Writing – review & editing. PZ: Conceptualization, Supervision, Writing – review & editing.
The author(s) declare financial support was received for the research, authorship, and/or publication of this article. This research was funded by the Dutch Burns Foundation (DBF), Beverwijk, project 22.113; Health Holland, Den Haag, project LSHM18069; DBF, Beverwijk, project PPS 18.01.
RB was employed by company Alloksys Life Sciences BV.
The remaining authors declare that the research was conducted in the absence of any commercial or financial relationships that could be construed as a potential conflict of interest.
All claims expressed in this article are solely those of the authors and do not necessarily represent those of their affiliated organizations, or those of the publisher, the editors and the reviewers. Any product that may be evaluated in this article, or claim that may be made by its manufacturer, is not guaranteed or endorsed by the publisher.
The Supplementary Material for this article can be found online at: https://www.frontiersin.org/articles/10.3389/fimmu.2024.1303776/full#supplementary-material
1. Korkmaz HI, Ulrich MMW, van Wieringen WN, Vlig M, Emmens RW, Meyer KW, et al. The local and systemic inflammatory response in a pig burn wound model with a pivotal role for complement. J Burn Care Res (2017) 38(5):e796–806. doi: 10.1097/BCR.0000000000000486
2. Mulder PPG, Koenen H, Vlig M, Joosten I, de Vries RBM, Boekema B. Burn-induced local and systemic immune response: systematic review and meta-analysis of animal studies. J Invest Dermatol (2022) 142(11):3093–109.e15. doi: 10.1016/j.jid.2022.05.004
3. Mulder PPG, Vlig M, Fasse E, Stoop MM, Pijpe A, van Zuijlen PPM, et al. Burn-injured skin is marked by a prolonged local acute inflammatory response of innate immune cells and pro-inflammatory cytokines. Front Immunol (2022) 13:1034420. doi: 10.3389/fimmu.2022.1034420
4. Bergquist M, Hästbacka J, Glaumann C, Freden F, Huss F, Lipcsey M. The time-course of the inflammatory response to major burn injury and its relation to organ failure and outcome. Burns (2019) 45(2):354–63. doi: 10.1016/j.burns.2018.09.001
5. Jeschke MG, van Baar ME, Choudhry MA, Chung KK, Gibran NS, Logsetty S. Burn injury. Nat Rev Dis Primers (2020) 6(1):11. doi: 10.1038/s41572-020-0145-5
6. Martin P, Nunan R. Cellular and molecular mechanisms of repair in acute and chronic wound healing. Br J Dermatol (2015) 173(2):370–8. doi: 10.1111/bjd.13954
7. Wilkinson HN, Hardman MJ. Wound healing: cellular mechanisms and pathological outcomes. Open Biol (2020) 10(9):200223. doi: 10.1098/rsob.200223
8. Korkmaz HI, Flokstra G, Waasdorp M, Pijpe A, Papendorp SG, de Jong E, et al. The complexity of the post-burn immune response: an overview of the associated local and systemic complications. Cells (2023) 12(3):345–65. doi: 10.3390/cells12030345
9. Presbitero A, Mancini E, Brands R, Krzhizhanovskaya VV, Sloot PMA. Supplemented alkaline phosphatase supports the immune response in patients undergoing cardiac surgery: clinical and computational evidence. Front Immunol (2018) 9:2342. doi: 10.3389/fimmu.2018.02342
10. van Zuijlen PPM, Korkmaz HI, Sheraton VM, Haanstra TM, Pijpe A, de Vries A, et al. The future of burn care from a complexity science perspective. J Burn Care Res (2022) 43(6):1312–21. doi: 10.1093/jbcr/irac029
11. Wu JC, Rose LF, Christy RJ, Leung KP, Chan RK. Full-thickness thermal injury delays wound closure in a murine model. Adv Wound Care (New Rochelle) (2015) 4(2):83–91. doi: 10.1089/wound.2014.0570
12. Maquart FX, Monboisse JC. Extracellular matrix and wound healing. Pathol Biol (Paris). (2014) 62(2):91–5. doi: 10.1016/j.patbio.2014.02.007
13. Gabbiani G, Ryan GB, Majne G. Presence of modified fibroblasts in granulation tissue and their possible role in wound contraction. Experientia (1971) 27(5):549–50. doi: 10.1007/BF02147594
14. Wang N, Liang H, Zen K. Molecular mechanisms that influence the macrophage m1-m2 polarization balance. Front Immunol (2014) 5:614. doi: 10.3389/fimmu.2014.00614
15. Jeschke MG, Gauglitz GG, Kulp GA, Finnerty CC, Williams FN, Kraft R, et al. Long-term persistence of the pathophysiologic response to severe burn injury. PloS One (2011) 6(7):e21245. doi: 10.1371/journal.pone.0021245
16. van de Goot F, Krijnen PA, Begieneman MP, Ulrich MM, Middelkoop E, Niessen HW. Acute inflammation is persistent locally in burn wounds: a pivotal role for complement and C-reactive protein. J Burn Care Res (2009) 30(2):274–80. doi: 10.1097/BCR.0b013e318198a252
17. DiPietro LA. Angiogenesis and wound repair: when enough is enough. J Leukoc Biol (2016) 100(5):979–84. doi: 10.1189/jlb.4MR0316-102R
18. Sorrell JM, Caplan AI. Topical delivery of mesenchymal stem cells and their function in wounds. Stem Cell Res Ther (2010) 1(4):30. doi: 10.1186/scrt30
19. Velnar T, Gradisnik L. Tissue augmentation in wound healing: the role of endothelial and epithelial cells. Med Arch (2018) 72(6):444–8. doi: 10.5455/medarh.2018.72.444-448
20. Ley K. The microcirculation in inflammation. In: Tuma RFD, W. N, Ley K, editors. Handbook of physiology: microcirculation. San Diego: Academic Press (2011). p. 387–448.
21. Mai J, Virtue A, Shen J, Wang H, Yang XF. An evolving new paradigm: endothelial cells–conditional innate immune cells. J Hematol Oncol (2013) 6:61. doi: 10.1186/1756-8722-6-61
22. Bumbuc RV, Yildirim V, Sheraton MV. Modelling the interplay between chronic stress and type 2 diabetes on-set. Int Conf Comput Sci 2023 (2023) 14074:330–338. doi: 10.1007/978-3-031-36021-3_34
23. Sheraton MV, Chiew GGY, Melnikov V, Tan EY, Luo KQ, Verma N, et al. Emergence of spatio-temporal variations in chemotherapeutic drug efficacy: in-vitro and in-Silico 3D tumour spheroid studies. BMC Cancer (2020) 20(1):1201. doi: 10.1186/s12885-020-07677-5
24. Sheraton MVS. P. M. Parallel performance analysis of bacterial biofilm simulation models. Computational Science-ICCS 2018: 18th International Conference; Wuxi, China. Comput Science--ICCS 2018: 18th Int Conf (2018) 10860:496–505. doi: 10.1007/978-3-319-93698-7_38
25. Huang S, Dang J, Sheckter CC, Yenikomshian HA, Gillenwater J. A systematic review of machine learning and automation in burn wound evaluation: A promising but developing frontier. Burns (2021) 47(8):1691–704. doi: 10.1016/j.burns.2021.07.007
26. Turley J, Chenchiah IV, Liverpool TB, Weavers H, Martin P. What good is maths in studies of wound healing? iScience (2022) 25(8):104778. doi: 10.1016/j.isci.2022.104778
27. Nagaraja S, Reifman J, Mitrophanov AY. Computational identification of mechanistic factors that determine the timing and intensity of the inflammatory response. PloS Comput Biol (2015) 11(12):e1004460. doi: 10.1371/journal.pcbi.1004460
28. Nagaraja S, Chen L, Zhou J, Zhao Y, Fine D, DiPietro LA, et al. Predictive analysis of mechanistic triggers and mitigation strategies for pathological scarring in skin wounds. J Immunol (2017) 198(2):832–41. doi: 10.4049/jimmunol.1601273
29. Nagaraja S, Chen L, DiPietro LA, Reifman J, Mitrophanov AY. Computational analysis identifies putative prognostic biomarkers of pathological scarring in skin wounds. J Transl Med (2018) 16(1):32. doi: 10.1186/s12967-018-1406-x
30. Glazier JA, Graner F. Simulation of the differential adhesion driven rearrangement of biological cells. Phys Rev E Stat Phys Plasmas Fluids Relat Interdiscip Topics (1993) 47(3):2128–54. doi: 10.1103/PhysRevE.47.2128
31. Andasari V, Lü D, Swat M, Feng S, Spill F, Chen L, et al. Computational model of wound healing: EGF secreted by fibroblasts promotes delayed re-epithelialization of epithelial keratinocytes. Integr Biol (Camb) (2018) 10(10):605–34. doi: 10.1039/C8IB00048D
32. Tepole AB. Constitutive modelling of wound healing. In: Limbert G, editor. Skin biophysics: from experimental characterisation to advanced modelling. Cham: Springer (2019). p. 101–33.
33. Korkmaz HI, Niessen FB, Pijpe A, Sheraton VM, Vermolen FJ, Krijnen PA, et al. Scar formation from the perspective of complexity science: a new look at the biological system as a whole. J Wound Care (2022) 31(2):178–84. doi: 10.12968/jowc.2022.31.2.178
34. van der Wal MB, Tuinebreijer WE, Bloemen MC, Verhaegen PD, Middelkoop E, van Zuijlen PP. Rasch analysis of the Patient and Observer Scar Assessment Scale (POSAS) in burn scars. Qual Life Res (2012) 21(1):13–23. doi: 10.1007/s11136-011-9924-5
35. Figueredo G, Aickelin U, Siebers P-O. Systems dynamics or agent-based modelling for immune simulation? SSRN Electronic J (2011) 6825:81–94. doi: 10.2139/ssrn.2829280
36. Norton KA, Gong C, Jamalian S, Popel AS. Multiscale agent-based and hybrid modeling of the tumor immune microenvironment. Processes (Basel) (2019) 7(1):37–63. doi: 10.3390/pr7010037
37. Balter A, Merks R, Popławski NJ, Swat M, Glazier J, Rejniak KA, et al. The Glazier–Graner–Hogeweg Model: Extensions, future directions, and opportunities for further study. Single-Cell-Based Models Biol Med (2007) 151–67. doi: 10.1007/978-3-7643-8123-3_7
38. Merks RM, Perryn ED, Shirinifard A, Glazier JA. Contact-inhibited chemotaxis in de novo and sprouting blood-vessel growth. PloS Comput Biol (2008) 4(9):e1000163. doi: 10.1371/journal.pcbi.1000163
39. Andasari V, Roper RT, Swat MH, Chaplain MA. Integrating intracellular dynamics using CompuCell3D and Bionetsolver: applications to multiscale modelling of cancer cell growth and invasion. PloS One (2012) 7(3):e33726. doi: 10.1371/journal.pone.0033726
40. Izaguirre JA, Chaturvedi R, Huang C, Cickovski T, Coffland J, Thomas G, et al. CompuCell, a multi-model framework for simulation of morphogenesis. Bioinformatics (2004) 20(7):1129–37. doi: 10.1093/bioinformatics/bth050
41. Swat MH, Hester SD, Balter AI, Heiland RW, Zaitlen BL, Glazier JA. Multicell simulations of development and disease using the CompuCell3D simulation environment. Methods Mol Biol (2009) 500:361–428. doi: 10.1007/978-1-59745-525-1_13
42. Yuen B, Hoang MT, Dong X, Lu T. Universal activation function for machine learning. Sci Rep (2021) 11(1):18757. doi: 10.1038/s41598-021-96723-8
43. Iba T, Hashiguchi N, Nagaoka I, Tabe Y, Murai M. Neutrophil cell death in response to infection and its relation to coagulation. J Intensive Care (2013) 1(1):13. doi: 10.1186/2052-0492-1-13
44. Islam MA, Getz M, Macklin P, Versypt ANF. An agent-based modeling approach for lung fibrosis in response to COVID-19. bioRxiv (2023). doi: 10.1101/2022.10.03.510677
45. Strudwick XL, Adams DH, Pyne NT, Samuel MS, Murray RZ, Cowin AJ. Systemic delivery of anti-integrin αL antibodies reduces early macrophage recruitment, inflammation, and scar formation in murine burn wounds. Adv Wound Care (New Rochelle) (2020) 9(12):637–48. doi: 10.1089/wound.2019.1035
46. Cheadle C, Vawter MP, Freed WJ, Becker KG. Analysis of microarray data using Z score transformation. J Mol Diagn (2003) 5(2):73–81. doi: 10.1016/S1525-1578(10)60455-2
47. Johnson KE, Wilgus TA. Vascular endothelial growth factor and angiogenesis in the regulation of cutaneous wound repair. Adv Wound Care (New Rochelle) (2014) 3(10):647–61. doi: 10.1089/wound.2013.0517
48. Ottonello L, Ghio M, Contini P, Bertolotto M, Bianchi G, Montecucco F, et al. Nonleukoreduced red blood cell transfusion induces a sustained inhibition of neutrophil chemotaxis by stimulating in vivo production of transforming growth factor-beta1 by neutrophils: role of the immunoglobulinlike transcript 1, sFasL, and sHLA-I. Transfusion (2007) 47(8):1395–404. doi: 10.1111/j.1537-2995.2007.01268.x
49. de Oliveira S, Rosowski EE, Huttenlocher A. Neutrophil migration in infection and wound repair: going forward in reverse. Nat Rev Immunol (2016) 16(6):378–91. doi: 10.1038/nri.2016.49
50. Harada A, Sekido N, Akahoshi T, Wada T, Mukaida N, Matsushima K. Essential involvement of interleukin-8 (IL-8) in acute inflammation. J Leukoc Biol (1994) 56(5):559–64. doi: 10.1002/jlb.56.5.559
51. Moins-Teisserenc H, Cordeiro DJ, Audigier V, Ressaire Q, Benyamina M, Lambert J, et al. Severe altered immune status after burn injury is associated with bacterial infection and septic shock. Front Immunol (2021) 12:586195. doi: 10.3389/fimmu.2021.586195
52. Mulder PPG, Vlig M, Boekema B, Stoop MM, Pijpe A, van Zuijlen PPM, et al. Persistent systemic inflammation in patients with severe burn injury is accompanied by influx of immature neutrophils and shifts in T cell subsets and cytokine profiles. Front Immunol (2020) 11:621222. doi: 10.3389/fimmu.2020.621222
53. Wang G, Xia Z. Monocyte subsets and their differentiation tendency after burn injury. Front Med (2013) 7(4):397–400. doi: 10.1007/s11684-013-0298-7
54. Kotwal GJ, Chien S. Macrophage differentiation in normal and accelerated wound healing. Results Probl Cell Differ (2017) 62:353–64. doi: 10.1007/978-3-319-54090-0_14
55. Darby IA, Laverdet B, Bonté F, Desmoulière A. Fibroblasts and myofibroblasts in wound healing. Clin Cosmet Investig Dermatol (2014) 7:301–11. doi: 10.2147/CCID.S50046
Keywords: burns, wound healing, inflammation, immune response, computational modeling
Citation: Korkmaz HI, Sheraton VM, Bumbuc RV, Li M, Pijpe A, Mulder PPG, Boekema BKHL, de Jong E, Papendorp SGF, Brands R, Middelkoop E, Sloot PMA and van Zuijlen PPM (2024) An in silico modeling approach to understanding the dynamics of the post-burn immune response. Front. Immunol. 15:1303776. doi: 10.3389/fimmu.2024.1303776
Received: 28 September 2023; Accepted: 03 January 2024;
Published: 29 January 2024.
Edited by:
Jeffrey John Bajramovic, Utrecht University, NetherlandsReviewed by:
Stefano Casarin, Houston Methodist Research Institute, United StatesCopyright © 2024 Korkmaz, Sheraton, Bumbuc, Li, Pijpe, Mulder, Boekema, de Jong, Papendorp, Brands, Middelkoop, Sloot and van Zuijlen. This is an open-access article distributed under the terms of the Creative Commons Attribution License (CC BY). The use, distribution or reproduction in other forums is permitted, provided the original author(s) and the copyright owner(s) are credited and that the original publication in this journal is cited, in accordance with accepted academic practice. No use, distribution or reproduction is permitted which does not comply with these terms.
*Correspondence: H. Ibrahim Korkmaz, aC5rb3JrbWF6QGFtc3RlcmRhbXVtYy5ubA==
†These authors have contributed equally to this work and share first authorship
Disclaimer: All claims expressed in this article are solely those of the authors and do not necessarily represent those of their affiliated organizations, or those of the publisher, the editors and the reviewers. Any product that may be evaluated in this article or claim that may be made by its manufacturer is not guaranteed or endorsed by the publisher.
Research integrity at Frontiers
Learn more about the work of our research integrity team to safeguard the quality of each article we publish.