 Nynke Raven1
 Marcel Klaassen1Thomas Madsen1
 Menna Jones2
 David G. Hamilton2
 Manuel Ruiz-Aravena3
 Frederic Thomas4Rodrigo K. Hamede2†
 Beata Ujvari1*†
- 1Deakin University, School of Life and Environmental Sciences, Centre for Integrative Ecology, Geelong, VIC, Australia
- 2School of Natural Sciences, University of Tasmania, Hobart, TAS, Australia
- 3Mississippi State University, Forest & Wildlife Research Center (FWRC)-Wildlife, Fisheries & Aquaculture, Starkville, MS, United States
- 4CREEC/CANECEV, CREES-MIVEGEC, Univ. Montpellier, CNRS, IRD, Montpellier, France
The world’s largest extant carnivorous marsupial, the Tasmanian devil, is challenged by Devil Facial Tumor Disease (DFTD), a fatal, clonally transmitted cancer. In two decades, DFTD has spread across 95% of the species distributional range. A previous study has shown that factors such as season, geographic location, and infection with DFTD can impact the expression of immune genes in Tasmanian devils. To date, no study has investigated within-individual immune gene expression changes prior to and throughout the course of DFTD infection. To explore possible changes in immune response, we investigated four locations across Tasmania that differed in DFTD exposure history, ranging between 2 and >30 years. Our study demonstrated considerable complexity in the immune responses to DFTD. The same factors (sex, age, season, location and DFTD infection) affected immune gene expression both across and within devils, although seasonal and location specific variations were diminished in DFTD affected devils. We also found that expression of both adaptive and innate immune genes starts to alter early in DFTD infection and continues to change as DFTD progresses. A novel finding was that the lower expression of immune genes MHC-II, NKG2D and CD8 may predict susceptibility to earlier DFTD infection. A case study of a single devil with regressed tumor showed opposite/contrasting immune gene expression patterns compared to the general trends observed across devils with DFTD infection. Our study highlights the complexity of DFTD’s interactions with the host immune system and the need for long-term studies to fully understand how DFTD alters the evolutionary trajectory of devil immunity.
1 Introduction
Transmissible cancers are a rare type of pathogen, where the cancer cells themselves are contagious. So far, eleven transmissible cancers have been identified, in bivalves, dogs and Tasmanian devils (1). The Tasmanian devil is the largest marsupial carnivore endemic to the island state of Tasmania. Over the past 30 years, their total population has decreased by 68% and locally by 82% due to a transmissible cancer, Devil Facial Tumor Disease (DFTD) (2). The cancer was first documented in 1996, in the northeast of the state, but most likely originated ~10 years earlier (3). This disease predominantly spreads through devils biting each other, e.g. during mating and feeding interactions (4) and has since spread through Tasmania (2). While DFTD is still fatal in most cases, devils are showing signs of adaptation to the disease. Some studies detected changes in allele frequency in cancer and immune system associated genes within 4-6 generations after disease emergence (5, 6), while others (7) detected no significant difference in genome-wide SNPs across the devil’s range. Moreover, reduction in reproductive age (8), changes in how long animals survive with DFTD (9) and even complete tumor regressions have been documented (10–12).
Increasing incidences of tumor regressions (Hamede, pers comm) indicate that the devils are able to mount immune and tumor suppressor responses to DFTD. Indeed, some devils with complete regressed tumors had detectable serum antibodies, while in one animal tumor infiltrating T lymphocytes were observed (10). Differences in genomic regions between individuals where tumors regressed and did not regress have been observed (12). In cases where tumors regressed, allele frequency changes were detected in genes possibly associated with angiogenesis in the tumor microenvironment [PAX3 and TLL1 (11)]. Closer examination of the tumors showed stimulation of the RAS pathway in regressed tumors, whereas the RASL11A gene was silenced in non-regressed tumors (13). Despite the positive outcomes observed in some devils with regressed tumors, disease outcomes are more complex as some regressed animals became reinfected after suppressing and eliminating the initial tumors (10). The presence of tumor regressions in populations suggests that some devils are able to mount immune responses to DFTD, indicating the existence of a resistance phenotype. However, there is also evidence that devils are tolerating, rather than actively resisting DFTD (9, 14). When tolerating a pathogen, immunopathology is downregulated and there is no direct immune response, with the negative impact of the infection instead being buffered and controlled (15, 16). Resistance to a pathogen as a defense mechanism involves immunopathology, which can include activating adaptive immune genes like T and B cells (17), which the host uses to directly attack the pathogen (18). It is possible that both resistance and tolerance are involved in the Tasmanian devils’ response to DFTD (19).
Tasmanian devil responses to DFTD infection are complex, with no differences between the transcriptomes of healthy and DFTD infected animals detected in lip tissue (20). However, more targeted analysis from blood has shown shifts in immune gene expression with DFTD infection (21). Innate immune gene expression (particularly CD16) increased, and some genes associated with adaptive immune function were downregulated with DFTD infection (21). Targeted sequencing also showed a decline in T-cell receptor diversity and restricted T-cell clonal expansion (22). Blood cell counts identified an increase in white blood cell numbers, neutrophils, and platelets, and concentration of fibrinogen (blood protein assisting with clotting) with DFTD infection, as well as decreases in lymphocytes erythrocyte, and hemoglobin concentrations (23). Shorter telomere length (24, 25) and lower IgM : IgG antibody ratio (26) have been associated with DFTD susceptibility. DFTD infection can also alter gene expression within populations, as the DFTD arrival to individual populations was associated with a decrease of single nucleotide polymorphism (SNPs) in genomic regions connected with environment and abiotic factors (27). These studies show the complexity of immune responses to DFTD and demonstrate the need for a variety of approaches to understand the impact of DFTD infection on Tasmanian devil immune function.
Much of the previous work has been based on cross-sectional data (sampling across individuals), and not necessarily reflects how expression of immune genes changes over time within individuals (28). For example, (14) used repeat measures and identified that the cost of DFTD infection on body condition of individual devils was dependent on both the sex of the devil and the relative size of the tumor. Here, we use a combination of cross-sectional and longitudinal data, including samples from devils both before and after evidence of DFTD infection. We targeted ten previously published immune genes, which are expressed only in specific immune cell types and that increases or decreases in expression likely reflect shifts in the frequency of those specific immune cells as well as key functions of the cell types/genes measured (see detailed description in (21) and Supplementary Table S1 in the Supplementary Material). With targeting these genes we aimed to understand how host immune gene expression changes with DFTD progression. First, we predicted sex, age, season, location and DFTD infection would have a similar impact on gene expression both within and between individuals. Second, we investigated how gene expression changes with DFTD progression. Thirdly, we predicted that animals with lower expression of immune genes as juveniles may have a predisposition to DFTD. Finally, as we had managed to recapture a female devil multiple times, and to follow her through tumor progression from tumor emergence to complete regression, we used this animal as a case study, to determine if there is any immune gene expression difference in the regressed animal, compared to the general population of Tasmanian devils.
2 Methods
Fieldwork was undertaken at four sites in Tasmania, wukalina, West Pencil Pine (WPP), Takone and Black River (BRI) (Figure 1), between November 2016 and May 2022. Blood samples used in this study were collected up until February 2020, and follow-up metadata about disease outcomes was available until May 2022. Sampling occurred every three months to coincide with the life history stages of the Tasmanian devils: including just prior to the breeding season (February), pregnancy or small pouch young (May), large young either in the pouch or dens (August) and young devils becoming independent (November). Devils were microchipped during first capture and therefore could be identified at future recaptures. The devils are aged based on their dental wear as described in (4).
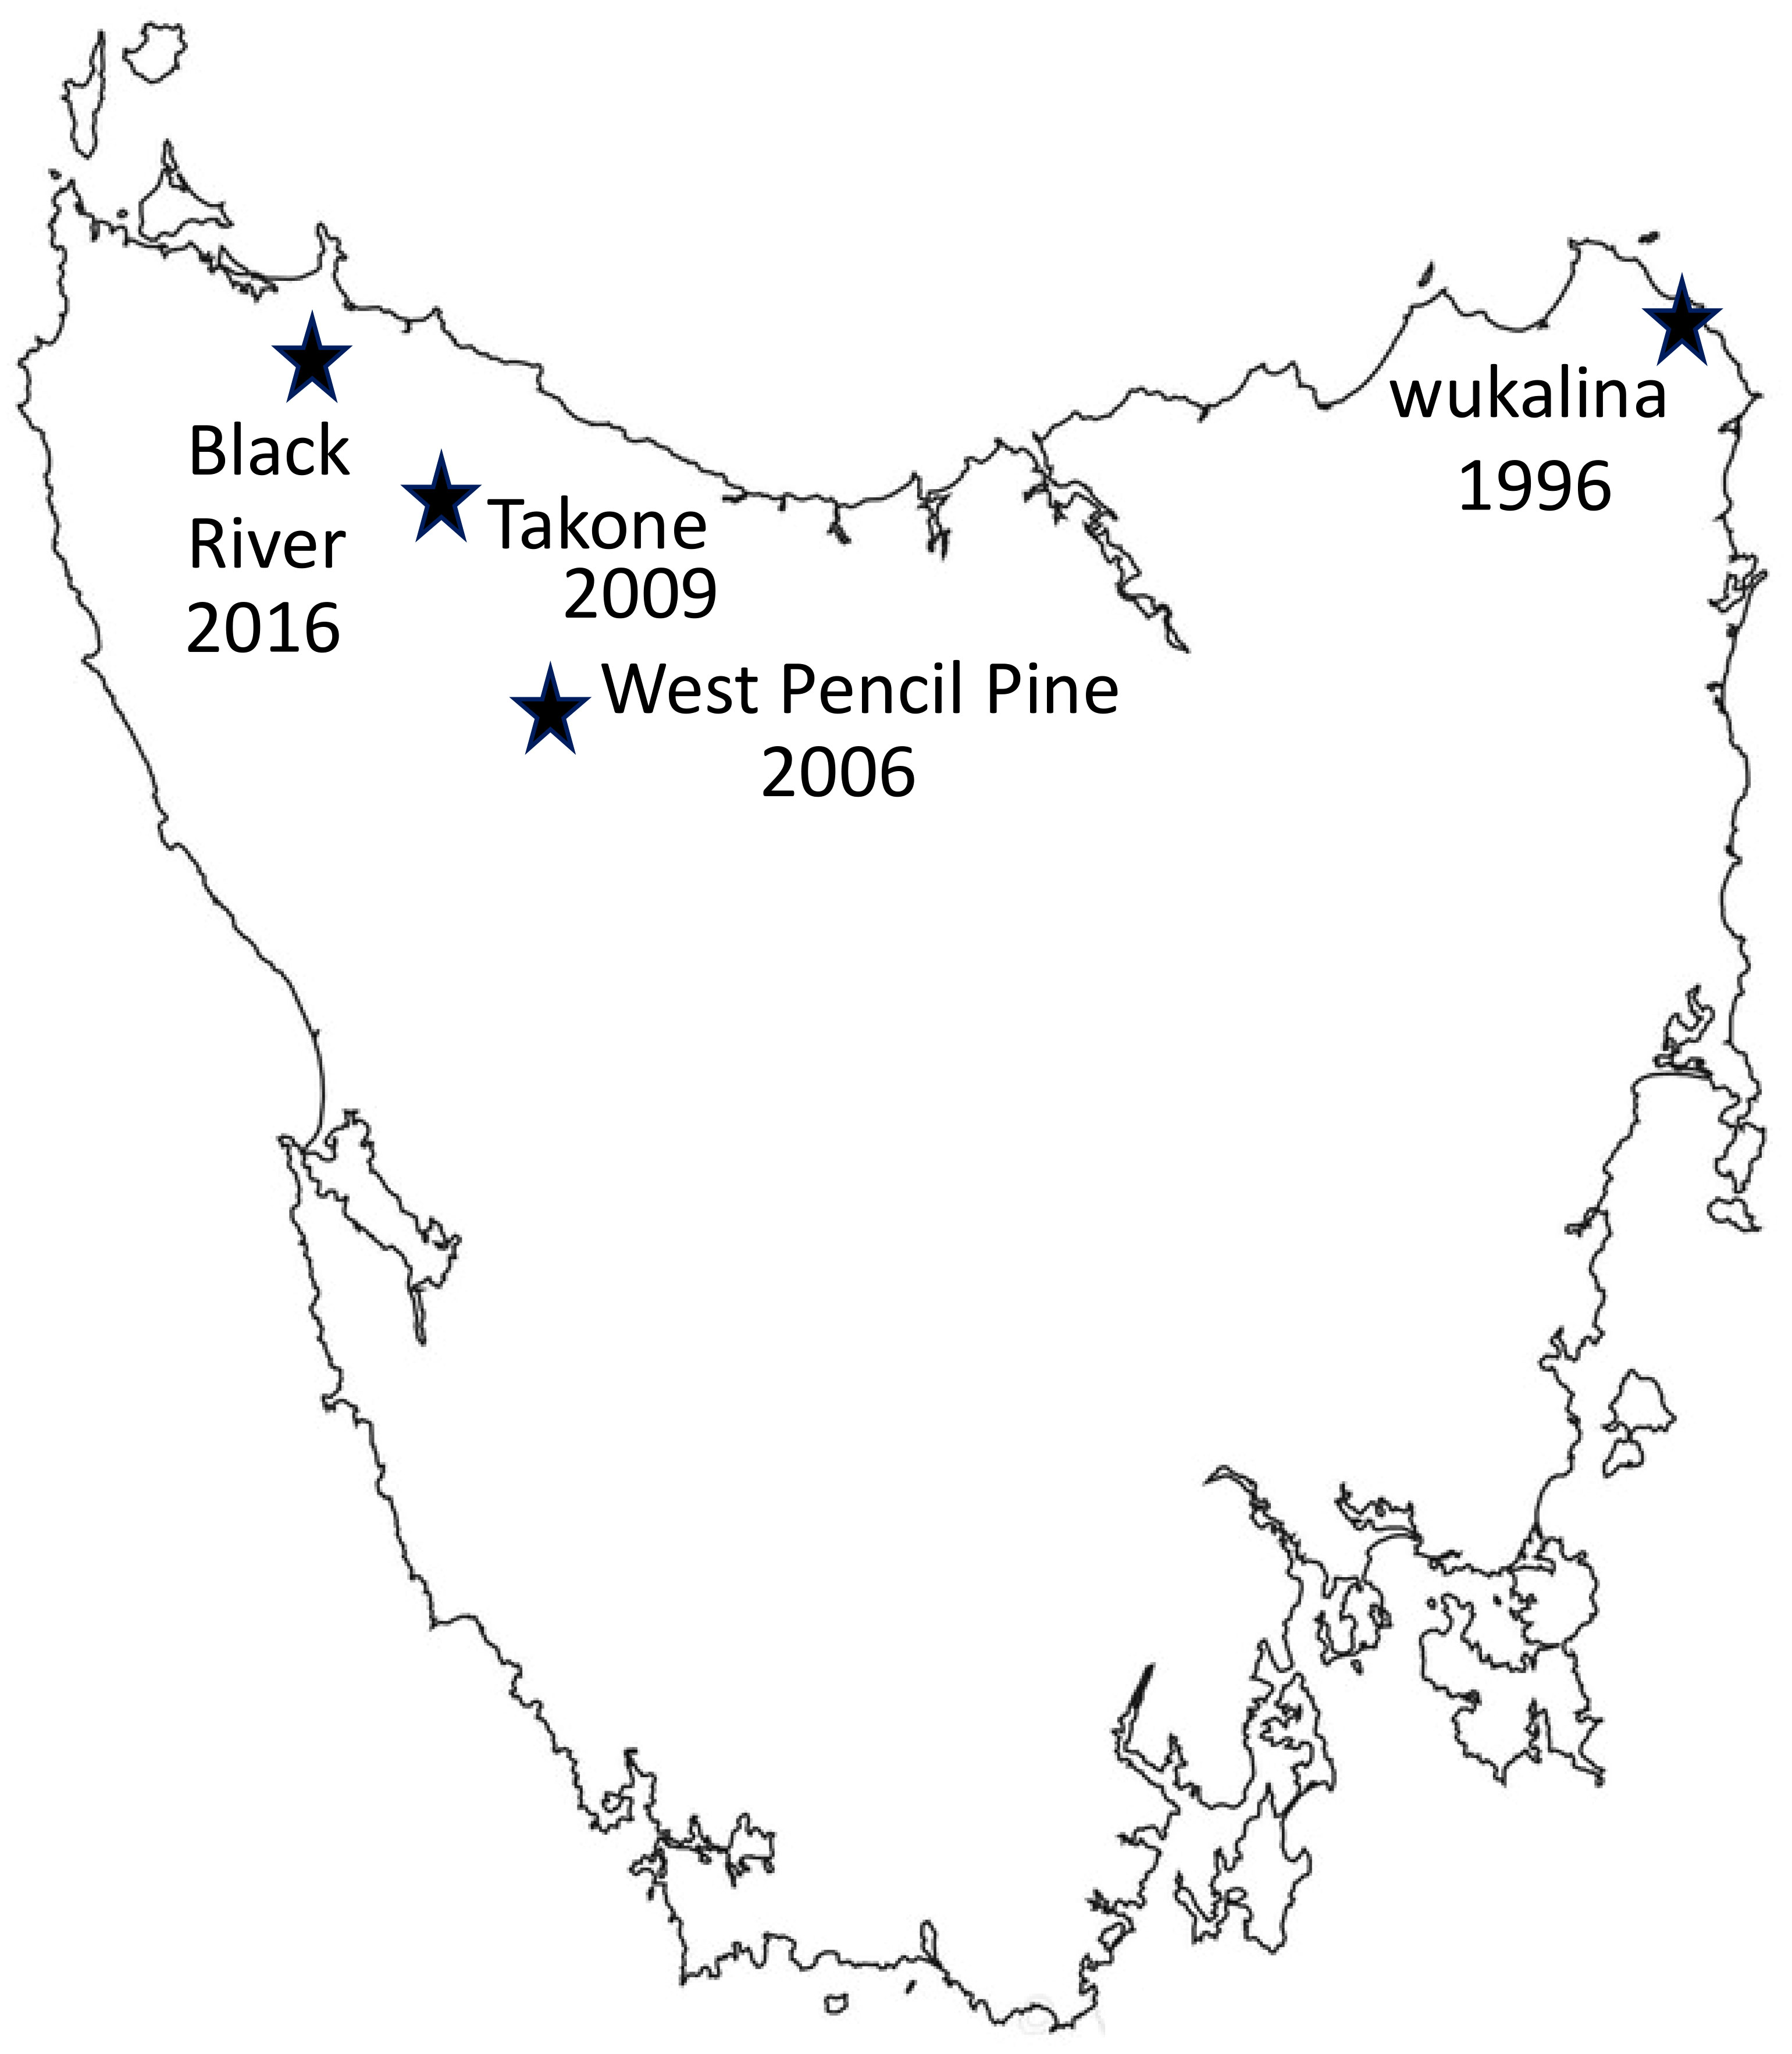
Figure 1 Map showing four sampling locations in Tasmania, along with the year when Devil Facial Tumor Disease (DFTD) was first detected in each location. Number of years DFTD has been present in each location: wukalina 27 years, West Pencil Pine 17 years, Takone 14 years, Black river 7 years.
Across the four locations a total of 605 samples were collected from 375 individuals. 140 individuals were captured more than once, making up 370 of the total samples, while the remaining 235 individuals were only captured a single time. Of these recaptures, 62 individuals had samples taken both when they appeared healthy and when they had visible DFTD tumors (Table 1). A different subset of the data was used for each analysis, which are described with the relevant analysis method below.
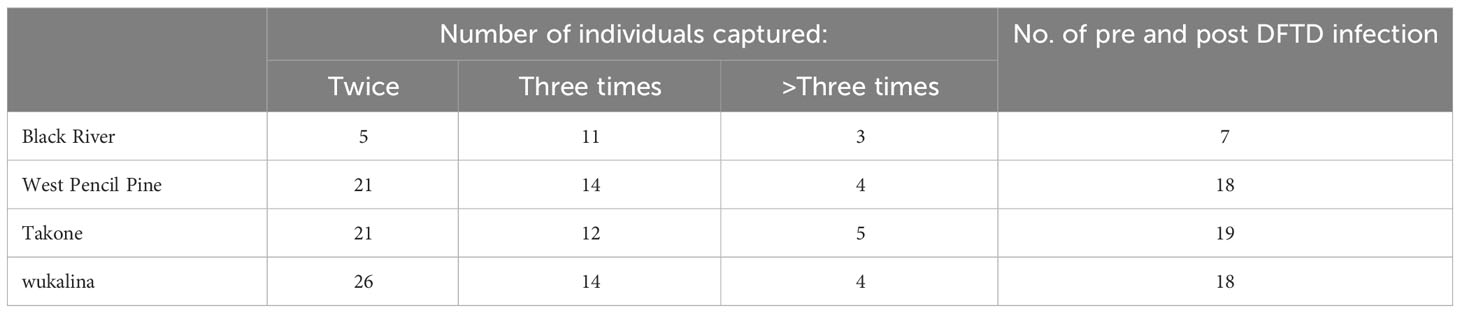
Table 1 Number of individual devils recaptured by location.
Blood samples were collected via peripheral ear vein puncture, with ~0.5mL of blood collected into RNA protect blood tubes (Qiagen, Germantown, MD, USA). Samples were stored immediately in liquid nitrogen until they could be moved to a -80°C freezer.
Sample collection was carried out according to guidelines and regulations approved by University of Tasmania’s Animal Ethics Committee (approval permit A0013326; A0016789) and Deakin University’s Animal Ethics Committee (approval number AEX03-2017). Sampling permit was issued by the Department of Primary Industries, Parks Water and the Environment.
The RNeasy Protect Animal Blood Kit (Qiagen, Germantown, USA) was used for RNA extraction, following manufacturer’s protocol with a slight change in step 17, which was repeated twice. The eluate was directly pipetted back onto the spin column in the repeated step to increase final RNA concentration. The quality and concentration of RNA was determined with the Agilent Bioanalyzer 2100 (Agilent Technologies, Santa Clara, CA) following manufacturer’s protocols and only samples with a RIN of ≥7 were included in the downstream analyses. RNA reverse transcription to cDNA was completed with the Bio-Rad iScript™ Advanced cDNA Synthesis Kit for RT-qPCR (BioRad, California, USA) at 42°C for 30 minutes, and the reaction was inactivated at 85°C for 5 minutes. Previously published primers were used from Raven et al. (21). RT-qPCR reactions were conducted in a BioRad CFX Connect Real-Time System (BioRad, California, USA) machine. Changes in mRNA levels between samples and across plates were quantitated with standard curves, that were generated using 1:5 dilution series. No individual sample Cq values fell outside the standard curves. All standard curves had an R2 > 0.99 and RT-qPCR efficiencies ranged between 92.4% and 108%, as per standard procedure (29). RT-qPCR reactions contained 7.5µl of BioRad SsoAdvanced™ Universal SYBR® Green Super Mix (BioRad, California, USA), 0.5µM forward and reverse primers and 1µL of cDNA. RT-qPCR reactions were run at 95°C for 30sec denaturing and 45 cycles of 95°C for 10 sec and 60°C for 30sec (annealing temperature). Fluorescence signal was acquired at the annealing temperature and a final melting curve analysis (from 65°C up to 99°C) was added under continuous fluorescence measurements.
2.1 Statistical analysis
All statistical analyses were conducted in R v3.6.1 (30).
2.1.1 Comparing cross-sectional and longitudinal immune gene expression
A previous cross-sectional study on a different dataset, limited to WPP and with each individual measured only once, showed that immune gene expression in Tasmanian devils is influenced by multiple factors with some patterns being general across all devils, whilst others are season specific (21). To determine if the same factors emerging from the cross-sectional dataset also influence immune gene expression within individual devils in the current longitudinal dataset, we used the explanatory variables in the ‘final gene models’ run using the method from Raven et al. (21) with location as an additional explanatory variable to predict gene expressions for our current dataset using the ‘predict’ function in the Car package v3.1-0 (31). Next, for each gene in the longitudinal dataset we compared the predicted gene expressions with the actual gene expression values using four different models. An ordinary linear model with no random effects (0) and three different models including random effects using linear mixed models in the lme4 package 1.1-26 (32). One of these was with a random intercept (1), the other with a random slope (2) and finally one with both a random intercept and a random slope (3). Of these four, the model with the lowest Akaike Information criterion (AICc) was retained and the slope of the resulting relationship was tested against 0 (no relationship) and 1 (identical outcomes of both models). If the cross-sectional models adequately predict gene expression in the longitudinal dataset, the slope should differ from 0 and not significantly differ from 1.
2.1.2 Factors affecting immune gene expression in DFTD affected devils
To determine the factors influencing immune gene expression when animals are infected with DFTD, a subset of the data including only animals with confirmed DFTD tumors was used. Only a single capture from each animal was included. If animals had more than one DFTD infected capture, a single sample was chosen from these animals. When selecting the single sample, we aimed to optimize the even distribution of tumor volume data, resulting in a total of 115 samples from a total of 139 samples. For each gene, we investigated variation in gene expression using a linear model with season, sex, location, age and tumor volume as explanatory variables. There are no techniques to detect latency or metastases, so tumor volume was used as a proxy for disease progression, consistent with previous devil literature (9, 33–36). Tumor volume was calculated using an ellipsoid volume formula (as in 14) from the length, width, and depth measurements of each tumor in mm, summed in the case of multiple tumors. The tumor volume measurements were normalized using the natural log. Since the expression of immune genes can be correlated, the analysis was run individually on each gene. To determine which variables were important for each gene in DFTD-affected animals, all explanatory variables of interest (listed previously) and logical interactions (season x age and tumor volume x age excluded) were included in the full model, to be analyzed using model selection. The ‘dredge’ function within the MuMIn 1.46.0 package (37) was used to evaluate all possible models, respecting marginality constraints, each model was ranked and weighted according to AICc adjusted for sample size. Models within 2 AICc units were retained for further analyses and the model weights adjusted accordingly. An ‘importance’ value was calculated for each explanatory value in each gene model by summing the adjusted model weights. ‘Importance’ values range between 0 (not in any models) and 1 (in every model). A final average model for each gene was created including all explanatory variables with ‘importance’ values of >0.3.
To determine similarities in the relationships with explanatory variables across genes, the importance values were clustered and visualized in a heatmap created using the gplots v 3.1.3 (38) and plotrix v 3.8-2 (39) packages. Similar heatmaps were used to visualize the slopes of each final gene model, which shows the effects of each variable on gene expression (output for final gene models in Supplementary Table S2). Marginal-effects means were calculated to display the effect of a specific explanatory variable, accounting for all other variables in the model, using the ggeffects v 1.1.2 package (40). To test for significant differences between the categories, post-hoc tests with Sidak adjusted p-values were calculated using emmeans v 1.7.5 (41) and multcomp 1.4-19 (42) packages. Marginal means data with post-hoc test outputs in the form of letters were plotted using the ggplots2 v 3.3.6 (43) and patchwork v 1.1.1 packages (44).
2.1.3 Immune gene expression patterns prior to and after DFTD infection
To investigate how immune gene expression changes within an individual devil when they first acquire DFTD, samples from devils captured both when healthy and then recaptured with DFTD were used (62 in total, 33 females and 28 males). To minimize other influences on immune gene expression, only two samples per animal were used: one from the last capture when the devil was healthy and one from the first recapture with detectable DFTD. The difference in the expression of specific genes between the two measurements was determined using a paired T-test, using the rstatix v 0.7.0 (45) and ggpubr v 0.4.0 (46) packages.
2.1.4 Can immune gene expression patterns in juvenile devils predict DFTD susceptibility?
To investigate whether animals that develop DFTD at an early age have a different immune gene expression profile compared with those who develop DFTD later or not at all during their life, the immune gene expression pattern of juvenile devils (11-20 months) with no signs of DFTD were investigated. Animals in this age bracket were categorized based on whether they were DFTD positive (Pos26) or negative (Neg26) by 26 months of age. The Pos26 category contained 23 females and 22 males, while the Neg26 category contained 21 females and 17 males. Animals that were never captured as healthy juvenile and could not be classified into either category were excluded from the analysis. The cut off age was chosen as by this point devils have gone through at least one mating season and should have been exposed to DFTD (47, 48). Devils from each location were included in the analysis; wukalina n=21, BRI n=12, WPP n=22 and Takone n=28. Linear models were created for each gene used to understand the relationship between immune gene expression and DFTD susceptibility. As both location and season have been shown to be important in the expression of the studied genes, these were accounted for in the model (based off analysis number 2). The marginal means for significant results for the variable of interest were plotted.
2.1.5 Immune gene expression variation throughout tumor growth and regression in a single devil
Finally, we had access to a unique dataset of a female devil recaptured seven times with samples from before DFTD infection, during DFTD infection and regression and post DFTD infection. Therefore, we investigated how immune gene expressions change in this female devil over the course of DFTD infection and tumor regression. Immune gene expression patterns from the seven captures were graphed and the trends observed in this single animal were compared to those obtained in the previous analyses (analyses 1-4). Packages used for graphing; ggplots2 v 3.3.6 (43), Tidyverse v 1.3.1 (49), lubridate v 1.8.0 (50). No statistical analysis was used as we only had samples from multiple recaptures available for this single animal.
3 Results
3.1 Comparing cross-sectional and longitudinal immune gene expression
When cross-sectional models yield similar predictions to the longitudinal models based on the dataset used here, we would predict a slope of 1 between the predicted values of both models. Indeed, for most immune genes, the relationship between the predicted variables obtained from the cross-sectional models and the longitudinal models were not significantly different (i.e. the slope between both was not significantly different from 1 while it was significantly different from 0; Table 2). The lack of significant difference between the cross-sectional and longitudinal models indicates that the same factors influence most immune gene expressions in a similar fashion within individual devils as between animals. The two exceptions that did not confirm to this general trend were MHC-II and the IgM : IgG ratio. For both MHC-II and the IgM : IgG ratio the slopes were still positive but not significantly different from 0. Moreover, the slope for the IgM : IgG ratio was also significantly different from 1.
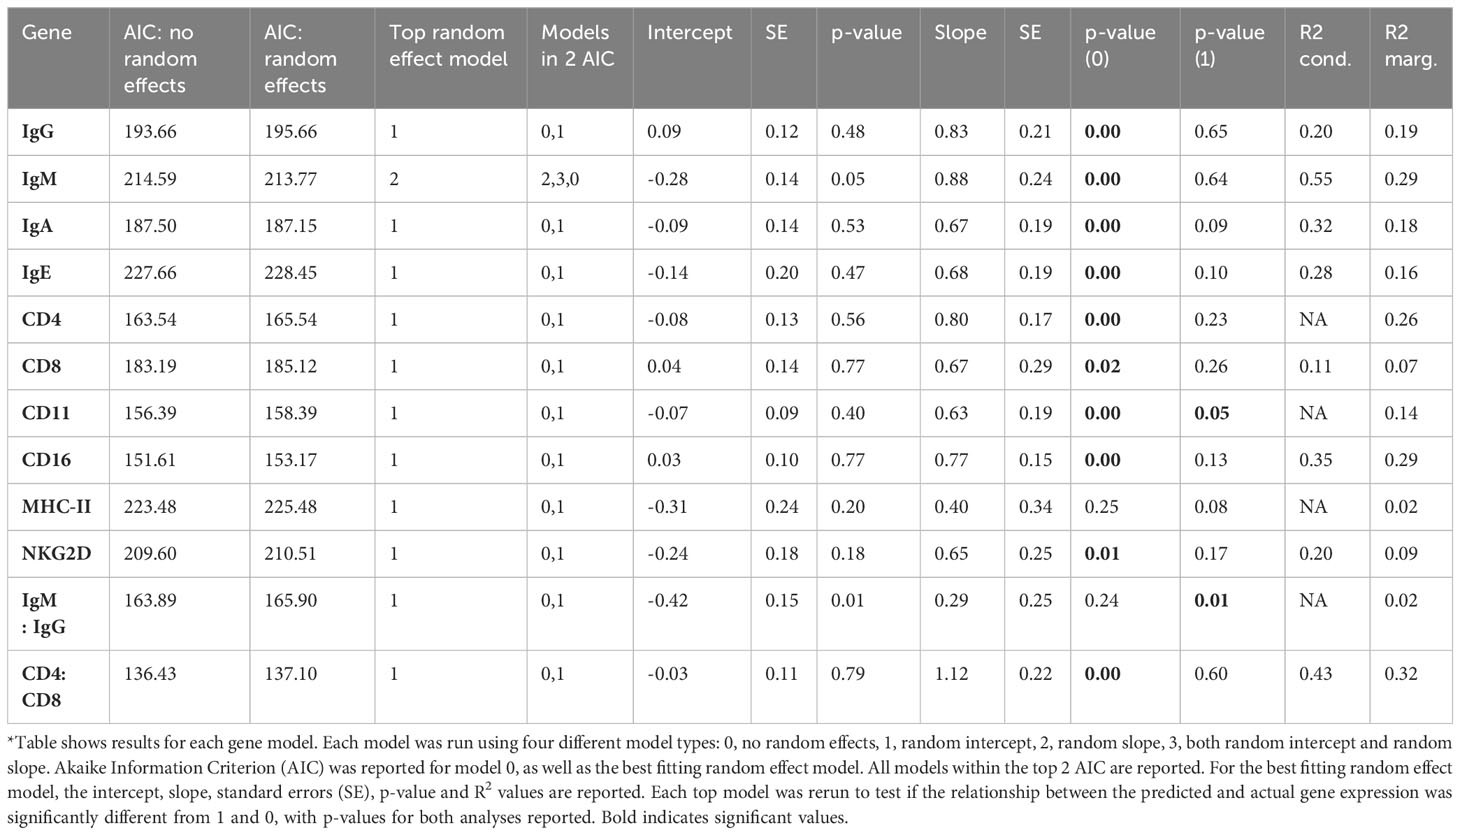
Table 2 Predicted vs actual gene expression*.
3.2 Factors affecting immune gene expression in DFTD positive devils
To select variables for the individual gene models, we first investigated the importance of each explanatory variable (season, location, sex, age, and tumor volume and logical interactions) in influencing the expression level of a given gene (Figure 2A). Tumor volume was important in 11/12 models, season in 10/12 and location in half of the models. Sex and age were important to some degree in 8/12 and 6/12 models respectively. Overall, the interactions had lower importance in the gene models compared to main effects. All final model outputs are presented in Supplementary Table S2.
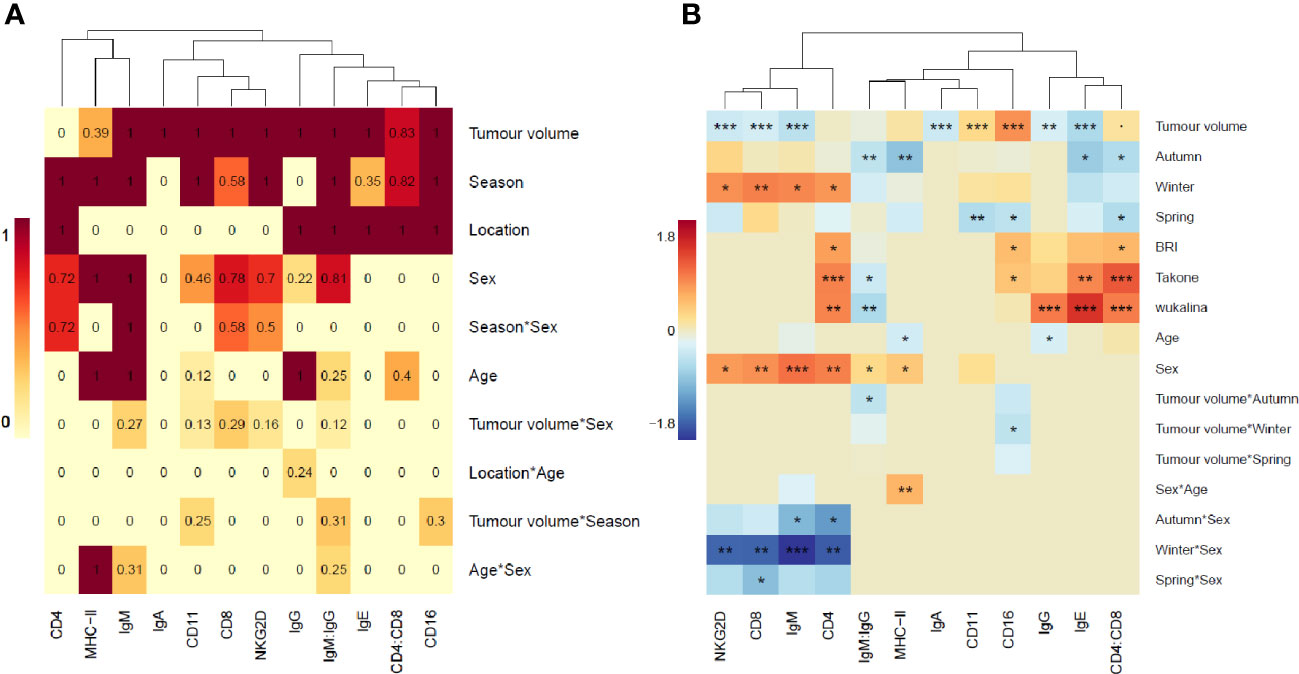
Figure 2 Heatmaps of importance values and model slopes. (A) Heatmap as a visual representation of the importance values, calculated from model selection analysis, for each explanatory variable in each gene model. Importance values are the sum of model weights containing each explanatory variable in the top 2 Akaike Information Criterion (AICc) of model selection analysis. Intensity of color increases with increasing importance value. (B) Heatmap of the model estimate (slope) for each explanatory variable in each final gene expression model. Orange=positive, blue=negative, intensity of color represents strength of the effect. P-values: ‘***’ <0.001, ‘**’ <0.01, ‘*’<0.05, ‘.’<0.1.
When running the final linear models on each gene (Figure 2B) we found that tumor volume was significant in 9/12 models (p-value >0.001 in 7/12 models). Season as a main effect or as an interaction was significant in 10/12 models, location was significant in all 6 models where it was included. All the genes expressed on T-cells (CD4, CD8 and NKG2D) formed a cluster with IgM, showing similar influences on gene expression and these were the only genes to show a significant interaction with season and sex. Two other immunoglobulins grouped with the CD4:CD8 ratio, showing similar influences of gene expression, and the remaining immunoglobulin grouped with the innate immune genes, MHC-II and the IgM : IgG ratio.
The marginal means plots for the effects of tumor volume showed that all B-cell receptors (immunoglobulins), CD8 and NKG2D decreased in expression with an increase in tumor volume (Figure 3), while both CD11 and CD16 increased with tumor volume. CD16 showed a stronger increase in expression in summer, especially compared with winter. The IgM: IgG ratio decreased with increasing tumor volume, showing a stronger decrease in colder months, autumn and winter. Marginal means plots for season as a main effect are shown in Supplementary Figure S2 and the marginal means plots for three gene models and both ratio models showed significant effects of location on gene expression (Figure 4).
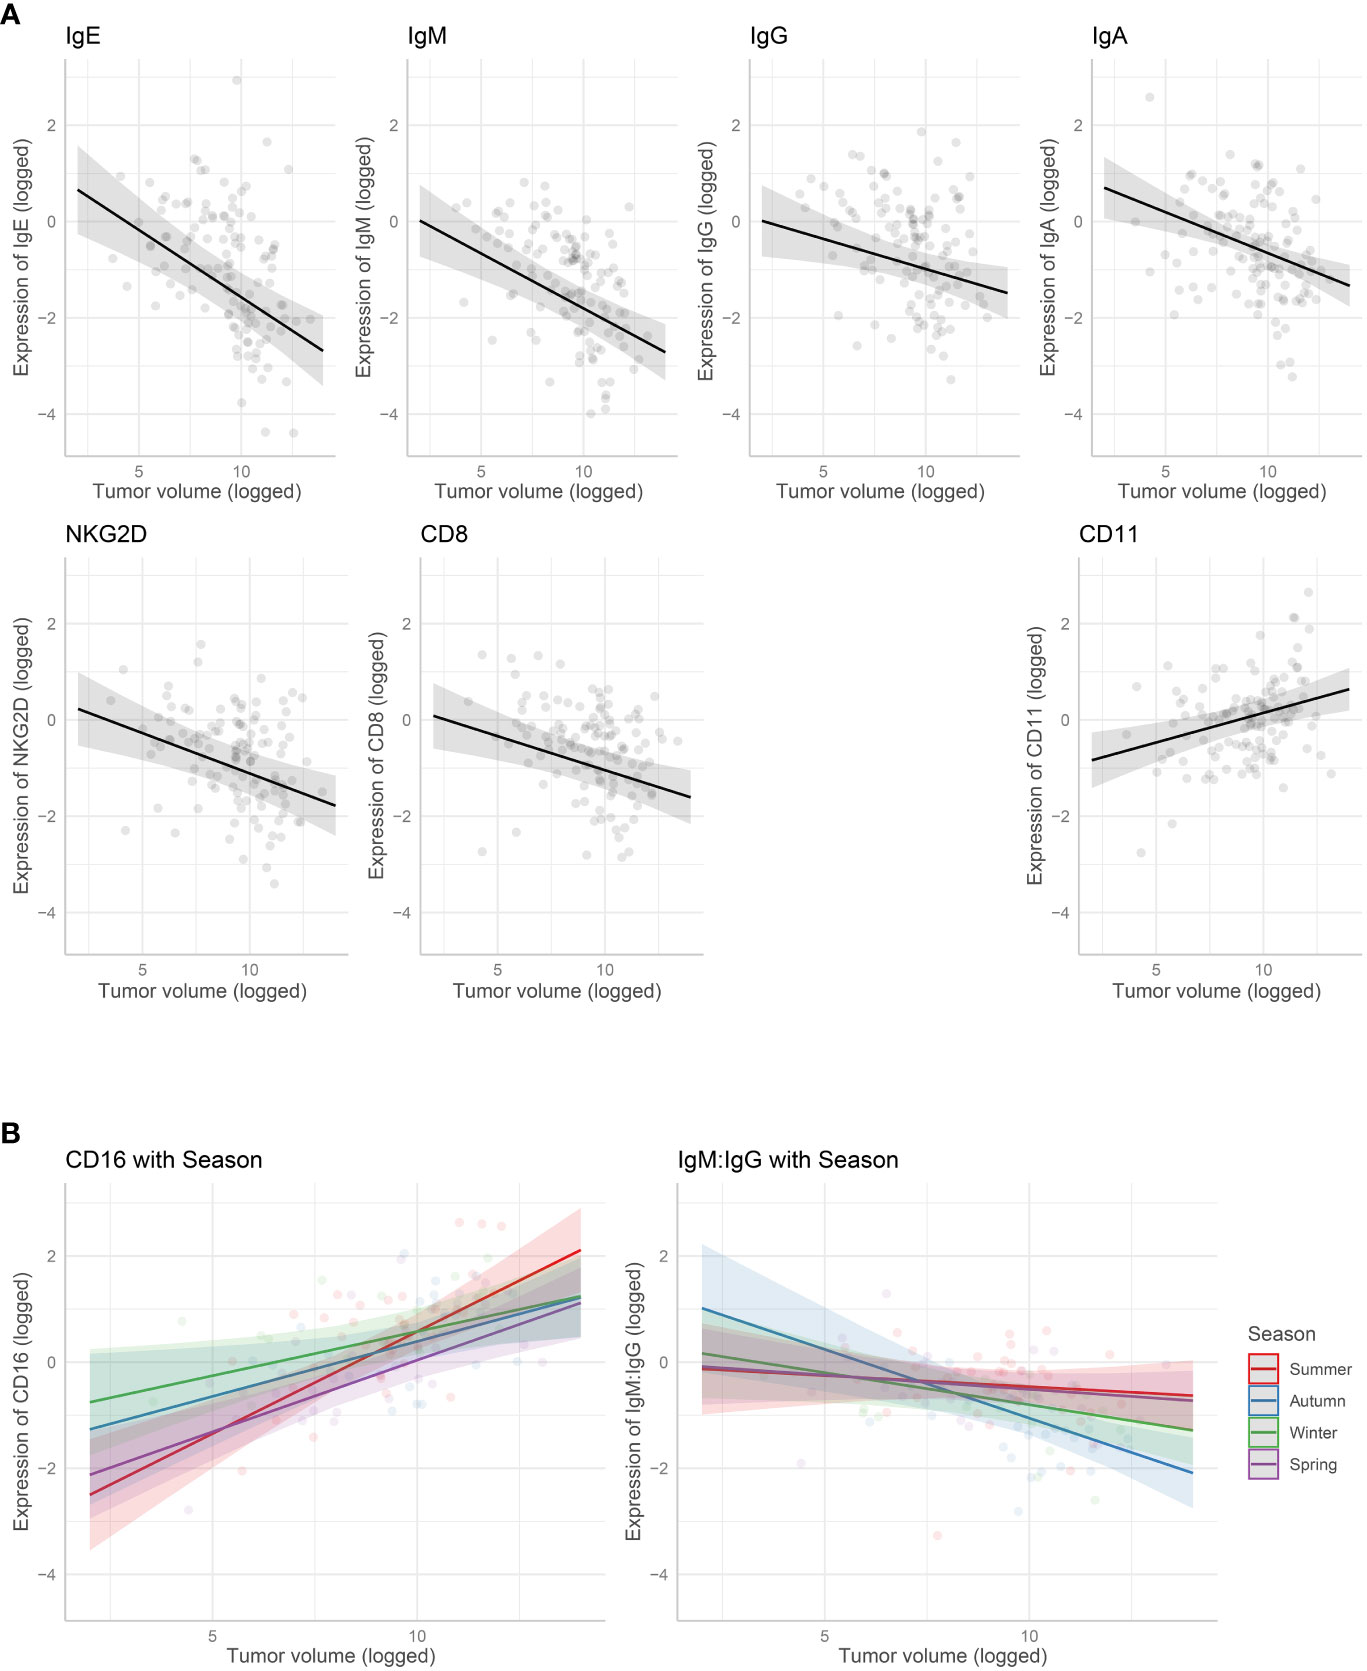
Figure 3 Marginal means plots showing the effect of gene expression with tumor volume. (A) Tumour volume as a main effect. (B) Interaction with tumor volume and season. All statistically significant effects plotted. Transparent dots are raw data, shaded area is confidence intervals.
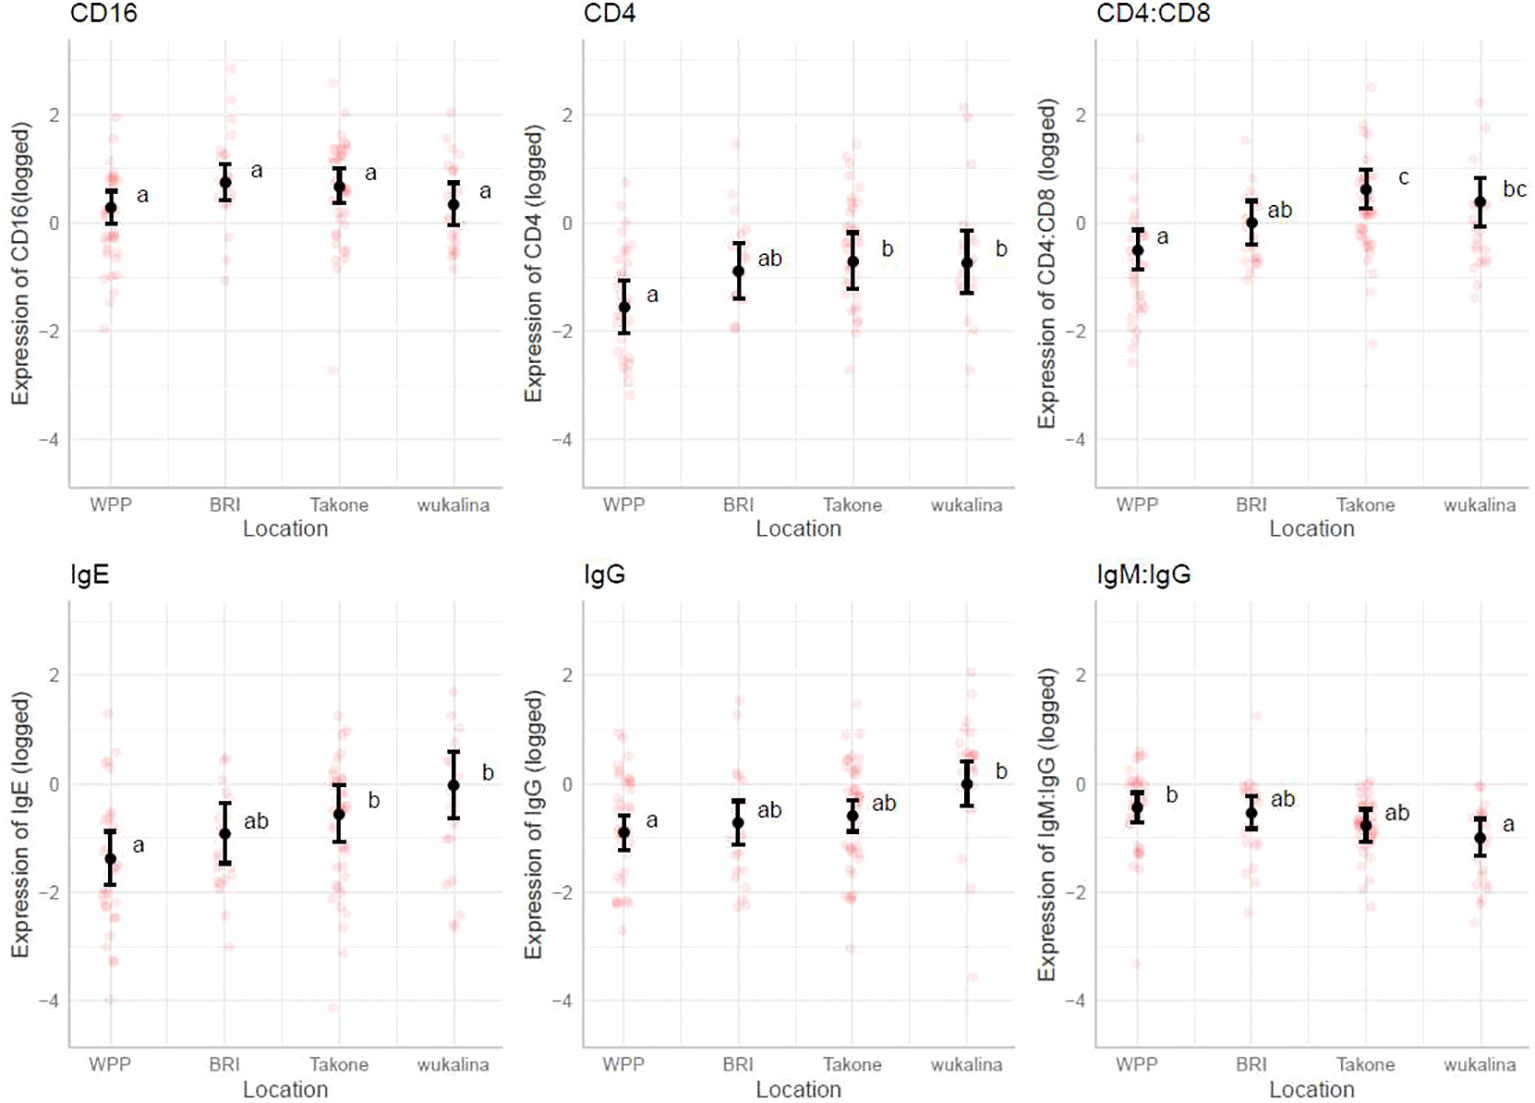
Figure 4 Marginal means plots, immune gene expression with location. All statistically significant results plotted, transparent dots represent raw data, confidence intervals displayed. Letters represent statistically significant differences between groups, measured using Sidak post-hot test.
3.3 Immune gene expression patterns prior to and after DFTD infection
The paired T-tests revealed that the expression of three immunoglobulin genes (IgE, IgG, IgM but not IgA) were significantly different within individuals, before and after DFTD infection (Supplementary Figure S3). The expression of IgE, IgG, IgM, NKG2D and the IgM : IgG ratio decreased once the devils had become infected, while it increased for CD16.
3.4 Can immune gene expression patterns in juvenile devils predict DFTD susceptibility?
When exploring immune gene expression in juvenile animals that later displayed DFTD symptoms (by 26 months of age or later), the linear models and marginal means plots revealed no associations between the expression of most genes and early DFTD appearance (Figure 5). However, CD8, NKG2D and MHC-II, were significantly lower expressed (p-value <0.05) on average in young devils which later became infected with DFTD by the age of 26 months. All model outputs are presented in Supplementary Table S2.
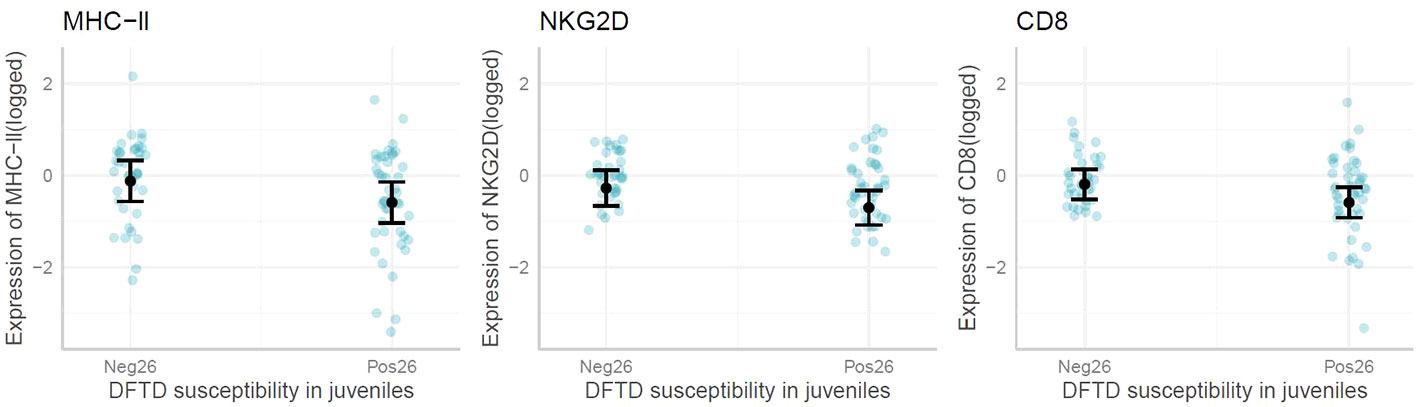
Figure 5 Marginal means plots showing the difference in immune gene expression between juvenile devils that present with Devil Facial Tumor Disease (DFTD) tumors by 26 months (Pos26) vs after 26 months (Neg26). Blue dots are raw data, confidence intervals displayed. Only significant results reported.
3.5 Immune gene expression variation throughout tumor growth and regression in a single devil
We followed the expression of immune genes in a female devil that was recaptured seven times. At the first capture, the animal showed no signs of DFTD but by the second recapture the devil had a tumor with a volume of 548.38 mm3, that decreased by the third capture to 292.15 mm3. By the fourth capture the tumor was too small to be measured, but the animal was still classified as DFTD positive. After that it was listed as healthy at all remaining captures (Figure 6). While the expression of individual genes showed various fluctuations over time, generally it was lower at first capture when the devil did not show signs of DFTD (except CD16, IgE and MHC-II). The expression of most genes was higher at the second capture when the devil had the highest tumor volume. The expression of CD11, CD16, CD4, IgA, IgE, IgG, IgM, NKG2D decreased, while the expression of CD8 and MHC-II remained stable as the tumor volume decreased by the third capture. All genes except IgM : IgG ratio then increased expression between the third capture and when the devil cleared the tumor at the fourth capture. These results show changing patterns throughout the regression, although surprisingly most genes show the same trend, with overall increases in gene expression when the animal is infected. This pattern is different to those observed across the devils in the previous analyses, where both the cross-sectional and longitudinal data showed that most immune genes were lower expressed in animals that had DFTD, and gene expression decreased as the tumor volume increased. To demonstrate the complex individual variations in tumor progression and immune responses over time, in the Supplementary Material (Supplementary Figure S4) we present data on immune gene expression shifts and changes in tumor volume over time in Tasmanian devils captured four or more times.
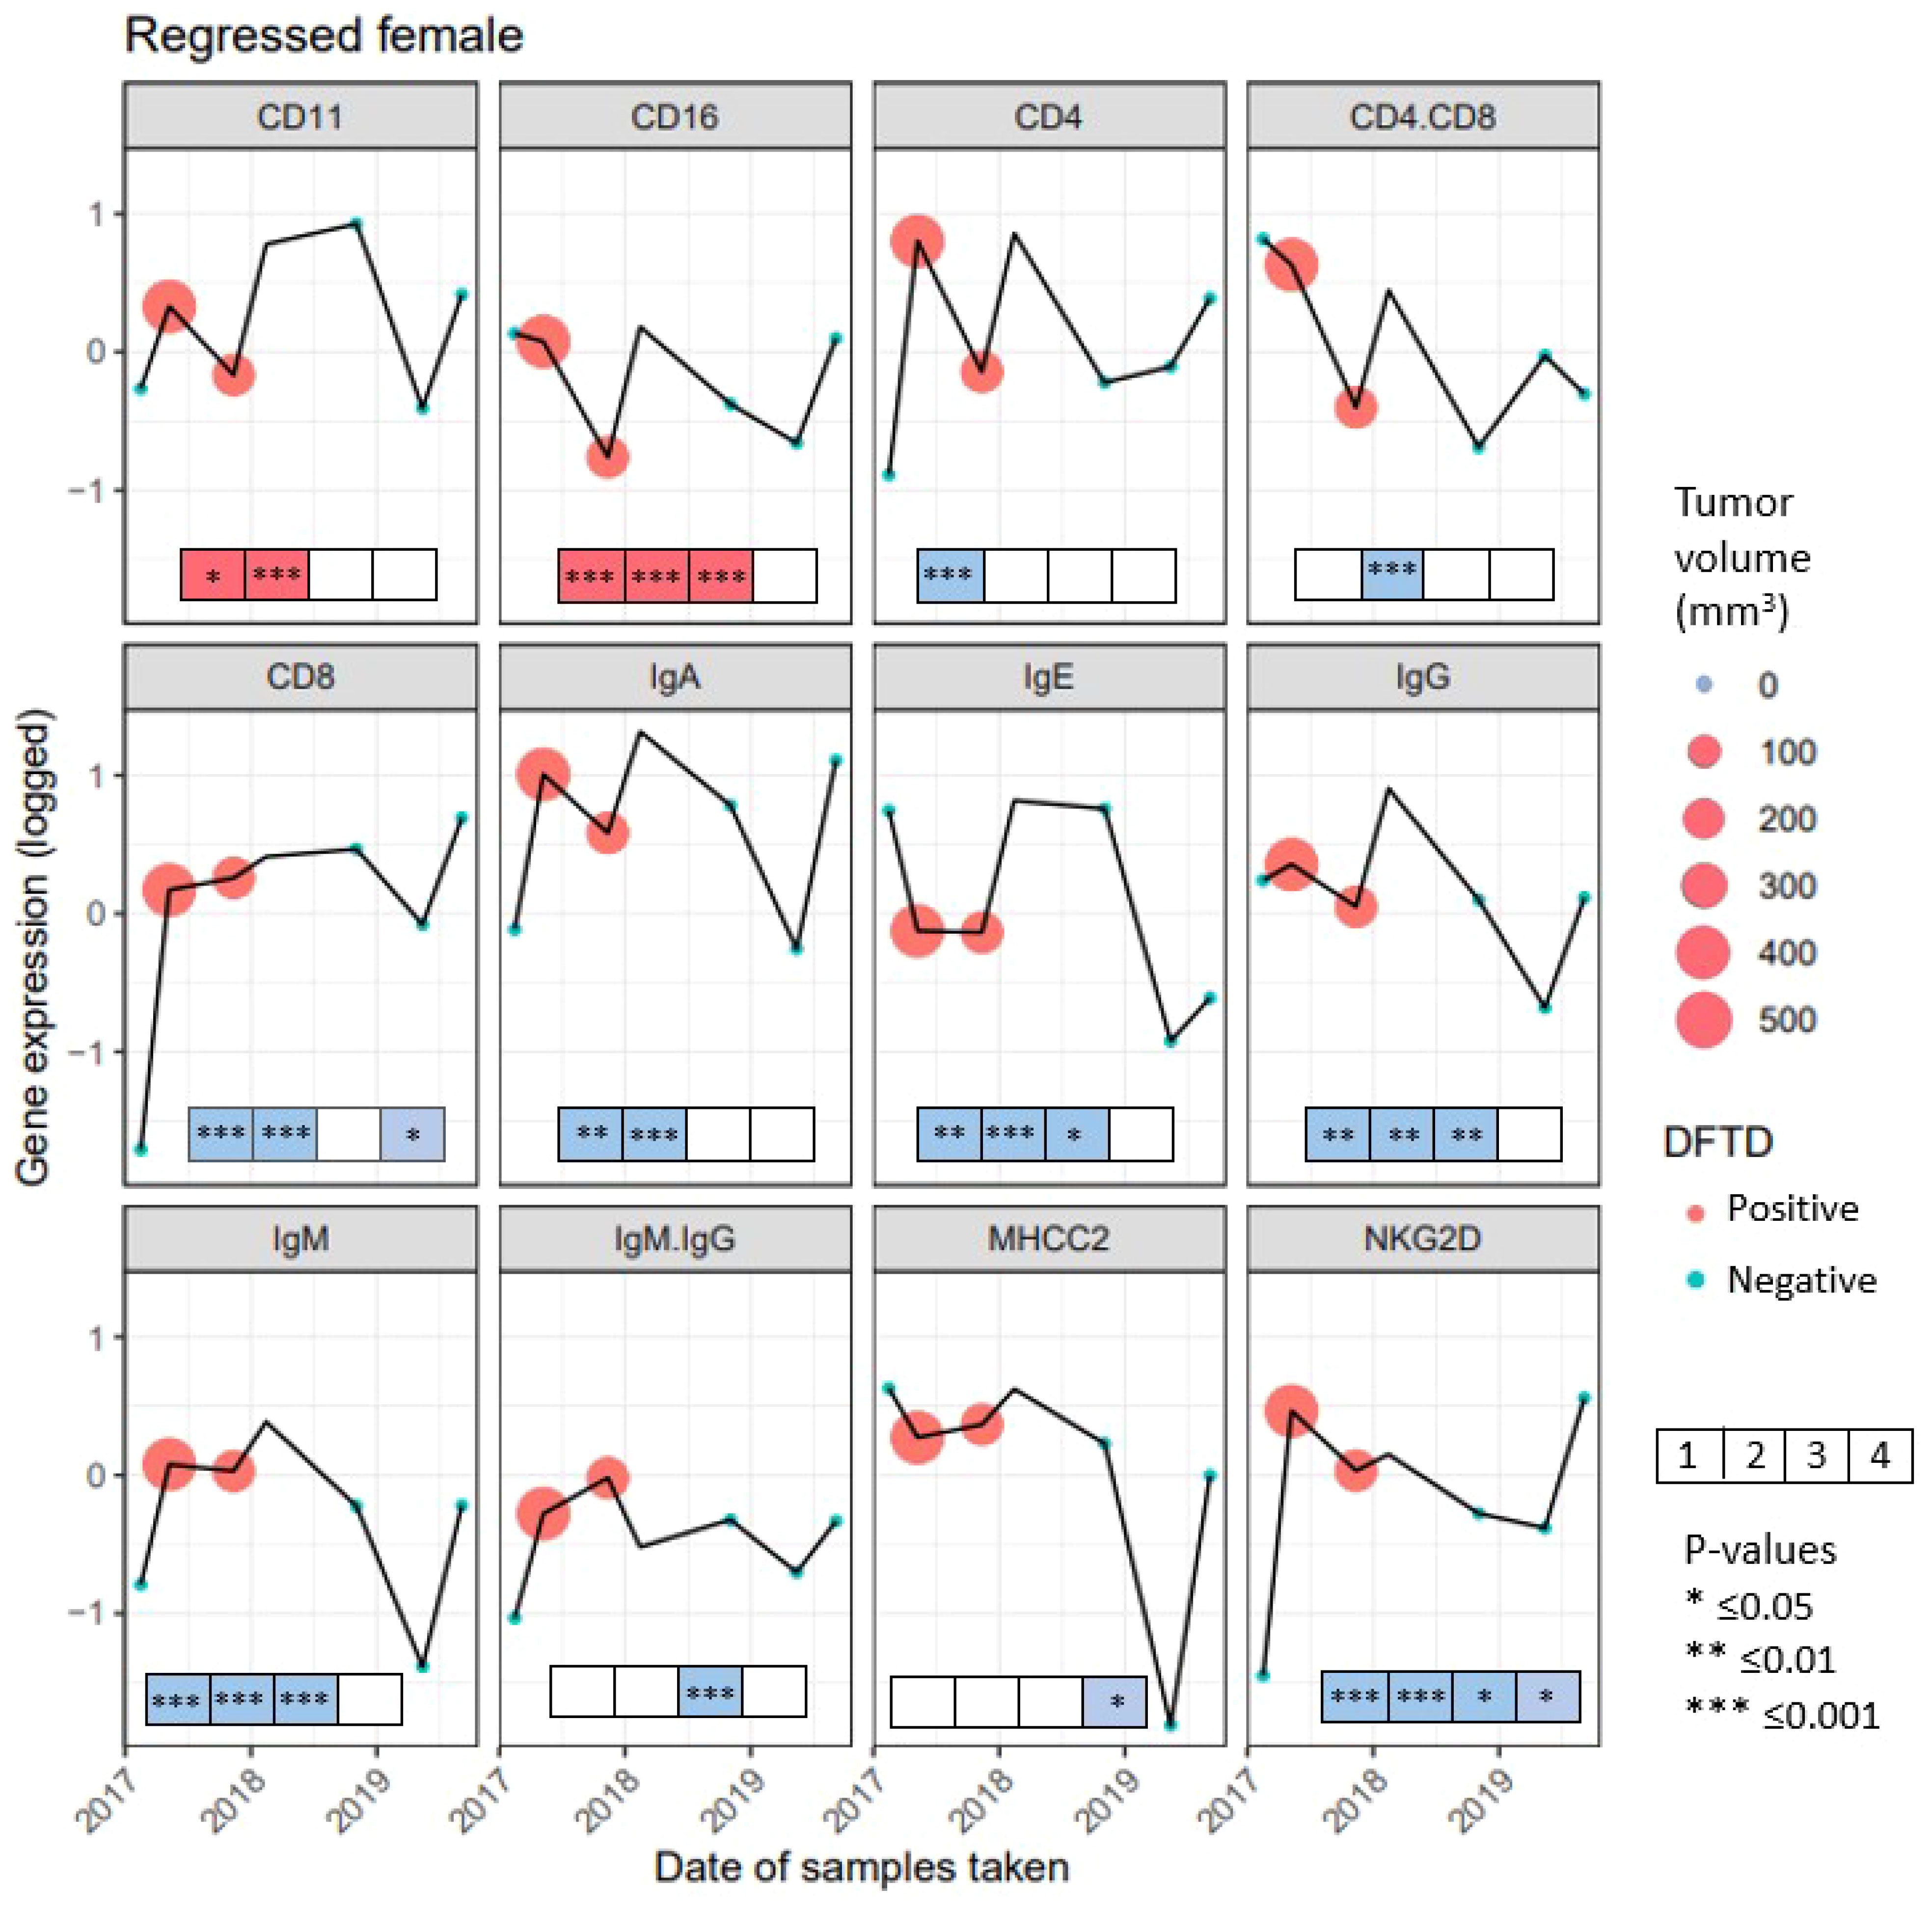
Figure 6 Gene expression from 10 genes and 2 gene ratios for 7 recaptures of a female devil with naturally regressed tumors. Gene names are listed above each panel, recaptures when the female had Devil Facial Tumor Disease (DFTD) are represented in red, recaptures with no visible DFTD are presented in blue. The size of the circle for captures 2 and 3 represent the tumor volume in mm3, the fourth capture has no color as there was no visible tumor, but the female devil was still classified as DFTD positive. To illustrate the immune gene expression patterns observed in the devil with a regressed tumor compared to the significant findings observed across the species, boxes were included at the bottom of each panel. The boxes summarize the results from the previous analyses in this study from the four analyses: First box shows the condensed results when comparing cross-sectional and longitudinal immune gene expression (see Table 2). Second box shows the condensed outcome when analyzing factors affecting immune gene expression in DFTD affected devils (see Figures 2, 3). Third box summarizes the analysis of immune gene expression patterns prior to and after DFTD infection (see Supplementary Figure S3). The fourth box summarizes results of whether immune genes expression patterns in juvenile devils can predict DFTD susceptibility (see Figure 5) Significant results from these four previous analyses are indicated with an asterisk. Red color of the boxes indicates increase, while blue color indicates decrease in gene expression when infected with DFTD in these four previous analyses. White boxes indicate non-significant results.
4 Discussion
Targeted gene approaches and analyses of cross-sectional data have previously shown distinct changes in gene expression with DFTD infection. Expression of key adaptive immune genes decreased, and expression of some innate immune genes increased (21), whilst the T-cell repertoire constricted markedly (22). In contrast, a study using full transcriptomics showed little gene expression difference between infected and healthy animals (20). Our approach used both cross-sectional and longitudinal datasets, with a focus on DFTD infection, to allow insight into how individuals change their immune gene expression over the course of their life, particularly when confronted with DFTD infection. Our analyses also showed that immune gene expression patterns observed across devils were similar to those within an individual.
In previous analyses, season was significant in 75% of the gene models (21) and location was significant in >80% of gene models (Raven et al. submitted). The analyses with only DFTD-infected animals indicated reduced importance of season and location, but also reduced importance of other factors such as sex and age. These findings show that DFTD infection changes general immune patterns across both location and season, which could indicate a direct or indirect reaction to DFTD in Tasmanian devils. Our findings support a previous study that found genetic-environmental associations to abiotic factors in devils prior to DFTD, patterns that were reduced after DFTD arrived in a population (27). The authors assumed that selection for DFTD survival swamped the influence of other selective forces. Interestingly, in our study we still observed seasonal effects on the expression of both CD16 and IgM : IgG ratio with tumor volume. Seasonal influences on these genes have been found previously (21) and could indicate that the ability of devils to combat DFTD infection varies throughout the year.
Using a combination of longitudinal and cross-sectional datasets allowed us to demonstrate that immune gene expression begins to shift early in DFTD infection, and these changes in gene expression continue to become more pronounced as the tumors grow. Previous studies have shown that devils, particularly females, appear to tolerate DFTD until the tumors reach 3% of the devil’s body weight, when the disease begins to significantly impact on body condition (14). While the results of this study do not contradict the findings of the previous study, it does suggest that DFTD has gene-level effects on devils much earlier during the disease, even if it is not evidenced through changes in body condition. With disease progression, the expression pattern of more genes starts to vary, potentially indicating a direct or indirect response to DFTD. In addition to the size of the tumors, the changes in immune gene expression may be impacted by DFTD metastases. Although DFTD is a metastatic cancer, spreading from devil to devil, the conditions required within the primary tumor to spread from the site of infection to various parts of the body remains an unknown. Impact on host immune profiles from the development between primary and metastatic DFTD is also undocumented. Regardless, the increase in total tumor volume caused by the addition of internal DFTD metastases would likely impact immune profiles and therefore immune gene expression.
Here we show downregulation of immunoglobulins and upregulation of CD16 during early disease progression, indicating DFTD can impact devils earlier in infection than previously reported, and that this impact magnifies with tumor growth. Downregulation of the immunoglobulin expression could be evidence of limited immunopathology, an additional indication could be the constriction of T-cell receptors with DFTD infection, observed by Cheng et al. (22). The upregulation of CD16 and CD11 may be indicative of inflammation (51, 52), also a component of wound healing (53, 54) and a tolerance mechanism in humans (55). Wound healing is believed to be upregulated in Tasmanian devils, (56) and other studies have suggested Tasmanian devils could use tolerance as defense strategy to cope with DFTD (14). However, active immune responses (10), and tumor regression in devils (11), indicate multiple divergent defense strategies between individuals, a phenomenon observed in populations of other species (17). For example, simultaneous resistance and tolerance strategies have been detected in frogs (57), and in field voles where resistance shifted to tolerance with maturity (58). While tolerance and resistance strategies were not tested in this study, the co-existence of both could explain the study results. Additionally, Tasmanian devils show clear signs of aging-associated immune gene expression changes (21, 22, 26, 59). If these changes indicate shifts in immune strategies, it could explain why a small number of devils demonstrate DFTD reinfection when older, following tumor regression (10). The flexible strategies of Tasmanian devils to manage DFTD infection could also be facilitated, in part, by the reduction in devil population density allowing access to additional resources (60); as host immune responses have been shown to be resource dependent in other species (61, 62).
The decreasing expression of B-cell receptor genes (immunoglobulins) as well as T-cell receptor CD8 and natural killer cell receptor NKG2D with increasing tumor volume, may indicate an increasing tumor burden on devils and/or the weakening capacity to respond to the advancing disease. Patterns of higher immune gene expression in honeybees and stronger immune responses to pathogens were associated with increased wintering survival (63). However (64) showed that, on average, across several wildlife species (both invertebrates and vertebrates), less susceptible individuals had lower and more stable immune gene expression and sometimes better pathogen tolerance. It is possible that the decrease in immune gene expression with increasing tumor size in Tasmanian devils may also impair their ability to combat additional pathogens and parasites or additional immune stressors [but see (65)]. It is important to note that the observed changes in immune gene expression with increases in tumor volume are associations, not necessarily causalities. Consequently, the present study could not determine if DFTD is causing the lower immune gene expression, or if devils, rather than resisting the cancer, are suppressing their immune function to tolerate DFTD.
Individual differences in susceptibility to DFTD infection could be linked to genetic and immune gene expression variations. (24) found an association between shorter telomeres and increased DFTD infection [but see (25)], and (26) proposed that lower IgM : IgG antibody ratios increased the odds of devils becoming infected. However, the results of this study are the first to suggest that devils with lower immune gene expression as juveniles may be more prone to infection earlier in life. Out of all the genes tested, only CD8, NKG2D and MHC-II were, on average, expressed at lower levels in susceptible individuals, despite other immune genes showing changes with DFTD infection. CD8+ T-cells are cytotoxic and directly involved in detecting and destroying tumor cells (66), while NKG2D promotes tumor surveillance (67) through expression on both NK cells and CD8+ T-cells (68). As both CD8 and NKG2D are expressed on CD8+ T-cells, this may be the cell underlying the change in gene expression that was detected. MHC-II interacts with CD4+ T-cells, which drive anti-tumor responses, mostly (although not always) through regulation, making them more likely to be involved in early tumor detection (69). Reduced MHC-II expression has also been correlated with reduced tumor surveillance in humans (70). Other factors such as behavior (4), social standing (9, 35) and age (22) can also influence when a devil becomes infected with DFTD. Nevertheless, this is the first study to demonstrate that low expression of genes involved in antigen presentation when young could predispose devils to earlier DFTD manifestation.
Although we only had the opportunity to follow immune gene expression in the blood of a single devil exhibiting tumor regression, some interesting patterns emerged. The increase in gene expression with the first detection of DFTD across most of the genes was an opposing trend to those observed across devils where the expression of the studied genes generally decreases with DFTD infection (21, 22). In addition, the expression of CD16 was downregulated in this animal during the two samplings when it had visible DFTD tumors, also an opposing trend than previously observed by (21). At the fourth time point, where the animal was still classified as DFTD positive but without visible signs of tumors, every gene was upregulated, again displaying not only a different pattern to (21), but the same consistent trend across 10 genes. Although any conclusion from a single animal must be taken with caution, the coordination across the genes and the upregulation of adaptive immune genes that have been generally downregulated in DFTD affected devils, could also indicate an immune response to some (possibly independent) unmeasured variables. Human studies on natural tumor regressions show association with microbe activity within tumors (71), and the immune response evoked by specific microbes has been proposed to unveil hiding tumor cells, due to the evidence showing the subsequent clearing and recovery of even malignant tumors (72). Cancer models have shown that bacteria can colonize and potentially lyse tumors, stimulating the immune system (reviewed in 73). Specific bacterial immunotherapy can result in enhanced tumor-specific CD4 and CD8 T cell response, leading to T cell-dependent tumor immunity and sometimes even long-term tumor specific immunity (74). While secondary infections in DFTD tumors have been reported (75), no data is available on the different infecting microbes, and thus, investigating differences or similarities between microbes infecting DFTD tumors, particularly tumors that regress, warrant further studies.
A notable caveat of our study is that with any analysis involving DFTD, it is possible that some of the healthy animals in the analysis were infected with DFTD, but not symptomatic. The DFTD latency period is estimated to average between ~3 and 9 months (76), but without a biomarker, it’s not possible to determine if an animal has been infected prior to the appearance of tumors. This means by the time external symptoms are apparent the disease might have already been affecting the devils for months. It also means that some devils classified as healthy at the time point of sampling, might already be diseased, reducing the difference in immune gene expression between sampling times or groups. For example, if the samples used in the T-test were further apart in time, it could have reduced the possibility of DFTD latency in some devils, but would have introduced other confounding variables, including larger age and tumor burden effects. In addition, without autopsy, it is currently not possible to detect internal metastasis in wild Tasmanian devils, therefore tumor burdens may be underestimated in some animals.
5 Conclusions
This study shows that DFTD can affect immune gene expression early in infection with downregulation of immunoglobulins and upregulation of CD16. These immune gene expression changes continue with the progression of DFTD, indicating the tumors’ continued impact on devil immune function as the disease unfolds. The effect of environment is muted, and the effect of tumors is enhanced on the expression of immune genes in animals with DFTD. No significant difference was detected in how environmental factors influenced immune gene expression within individuals, as between individuals. Juveniles with lower expression of MHC-II, NKG2D and CD8 may be more susceptible to earlier infection of DFTD, possibly due to reduced immune and tumor surveillance. A single regressed animal showed possible signs of an overall immune response that correlates with the reduction in tumor size. While this study discovered many novel aspects of how DFTD affects immune gene expression in Tasmanian devil blood, there is still much we don’t understand about this unique disease, suggesting further studies are needed to elucidate how DFTD underpins devil immune responses.
Data availability statement
The original contributions presented in the study are included in the article/Supplementary Materials, further inquiries can be directed to the corresponding author/s.
Ethics statement
The animal study was approved by Deakin University’s Animal Ethics Committee. The study was conducted in accordance with the local legislation and institutional requirements.
Author contributions
NR: Conceptualization, Data curation, Formal analysis, Funding acquisition, Investigation, Methodology, Project administration, Visualization, Writing – original draft, Writing – review & editing. MK: Conceptualization, Data curation, Formal analysis, Methodology, Supervision, Visualization, Writing – review & editing. TM: Conceptualization, Data curation, Formal analysis, Methodology, Writing – review & editing. MJ: Data curation, Funding acquisition, Resources, Writing – review & editing. DH: Data curation, Methodology, Resources, Writing – review & editing. MR-A: Data curation, Resources, Writing – review & editing. FT: Conceptualization, Funding acquisition, Resources, Supervision, Writing – review & editing. RH: Conceptualization, Data curation, Formal analysis, Funding acquisition, Methodology, Project administration, Resources, Supervision, Writing – review & editing. BU: Conceptualization, Data curation, Formal analysis, Funding acquisition, Investigation, Methodology, Project administration, Resources, Supervision, Visualization, Writing – original draft, Writing – review & editing.
Funding
The author(s) declare financial support was received for the research, authorship, and/or publication of this article. This work was supported by an ARC Linkage (LP170101105), ARC Decra (DE170101116), Deakin SEBE_RGS_2019, Deakin CIE HDR Leading Research Award, an ANR TRANSCAN (ANR‐18‐CE35‐0009), the MAVA foundation and the Hoffmann family, The University of Tasmania Foundation (Save the Tasmanian Devil Appeal), a Holsworth Wildlife Research Endowment and a CNRS ‘International Associated Laboratory Grant’. The funders were not involved in the study design, collection, analysis, interpretation of data, the writing of this article or the decision to submit if for publication. Forico Pty Ltd. and Sustainable Timber Tasmania provided land access and logistic support during our study.
Acknowledgments
We thank Mark and Claire Walsh from Discovery Holiday Parks—Cradle Mountain for the accommodation and logistic support provided during fieldwork. We are grateful to all the volunteers who helped to collect data.
Conflict of interest
The authors declare that the research was conducted in the absence of any commercial or financial relationships that could be construed as a potential conflict of interest.
The author(s) declared that they were an editorial board member of Frontiers, at the time of submission. This had no impact on the peer review process and the final decision.
Publisher’s note
All claims expressed in this article are solely those of the authors and do not necessarily represent those of their affiliated organizations, or those of the publisher, the editors and the reviewers. Any product that may be evaluated in this article, or claim that may be made by its manufacturer, is not guaranteed or endorsed by the publisher.
Supplementary material
The Supplementary Material for this article can be found online at: https://www.frontiersin.org/articles/10.3389/fimmu.2024.1286352/full#supplementary-material
References
1. Dujon AM, Bramwell G, Roche B, Thomas F, Ujvari B. Transmissible cancers in mammals and bivalves: How many examples are there? Predictions indicate widespread occurrence. BioEssays (2021) 43:2000222. doi: 10.1002/bies.202000222
2. Cunningham C, Comte S, Mccallum H, Hamilton DG, Hamede R, Storfer A, et al. Quantifying 25 years of disease-caused declines in Tasmanian devil populations: host density drives spatial pathogen spread. Ecol Lett (2021) 24:958–69. doi: 10.1111/ele.13703
3. Stammnitz MR, Gori K, Kwon YM, Harry E, Martin FJ, Billis K, et al. The evolution of two transmissible cancers in Tasmanian devils. Science (2023) 380(6642):283–93. doi: 10.1126/science.abq6453
4. Hamede RK, Mccallum H, Jones M. Biting injuries and transmission of Tasmanian devil facial tumour disease. J Anim Ecol (2013) 82:182–90. doi: 10.1111/j.1365-2656.2012.02025.x
5. Epstein B, Jones M, Hamede R, Hendricks S, Mccallum H, Murchison EP, et al. Rapid evolutionary response to a transmissible cancer in Tasmanian devils. Nat Commun (2016) 7:12684. doi: 10.1038/ncomms12684
6. Margres MJ, Jones ME, Epstein B, Kerlin DH, Comte S, Fox S, et al. Large-effect loci affect survival in Tasmanian devils (Sarcophilus harrisii) infected with a transmissible cancer. Mol Ecol (2018) 27:4189–99. doi: 10.1111/mec.14853
7. Farquharson KA, Mclennan EA, Cheng Y, Alexander L, Fox S, Lee AV, et al. Restoring faith in conservation action: Maintaining wild genetic diversity through the Tasmanian devil insurance program. iScience (2022) 25:104474. doi: 10.1016/j.isci.2022.104474
8. Jones ME, Cockburn A, Hamede R, Hawkins C, Hesterman H, Lachish S, et al. Life-history change in disease-ravaged Tasmanian devil populations. Proc Natl Acad Sci United States America (2008) 105:10023–7. doi: 10.1073/pnas.0711236105
9. Wells K, Hamede RK, Kerlin DH, Storfer A, Hohenlohe PA, Jones ME, et al. Infection of the fittest: devil facial tumour disease has greatest effect on individuals with highest reproductive output. Ecol Lett (2017) 20:770–8. doi: 10.1111/ele.12776
10. Pye R, Hamede R, Siddle HV, Caldwell A, Knowles GW, Swift K, et al. Demonstration of immune responses against devil facial tumour disease in wild Tasmanian devils. Biol Lett (2016) 12:20160553. doi: 10.1098/rsbl.2016.0553
11. Wright B, Willet CE, Hamede R, Jones M, Belov K, Wade CM. Variants in the host genome may inhibit tumour growth in devil facial tumours: evidence from genome-wide association. Sci Rep (2017) 7:423. doi: 10.1038/s41598-017-00439-7
12. Margres MJ, Ruiz-Aravena M, Hamede R, Jones ME, Lawrance MF, Hendricks SA, et al. The genomic basis of tumor regression in Tasmanian devils (Sarcophilus harrisii). Genome Biol Evol (2018) 10:3012–25. doi: 10.1093/gbe/evy229
13. Margres MJ, Ruiz-Aravena M, Hamede R, Chawla K, Patton AH, Lawrance MF, et al. Spontaneous tumor regression in tasmanian devils associated with RASL11A activation. Genetics (2020) 215:1143–52. doi: 10.1534/genetics.120.303428
14. Ruiz-Aravena M, Jones ME, Carver S, Estay S, Espejo C, Storfer A, et al. Sex bias in ability to cope with cancer: Tasmanian devils and facial tumour disease. Proc R Soc B (2018) 285(1891):20182239. doi: 10.1098/rspb.2018.2239
15. Simms EL, Triplett J. Costs and benefits of plant responses to disease: resistance and tolerance. Evolution (1994) 48:1973–85. doi: 10.2307/2410521
16. Råberg L, Graham AL, Read AF. Decomposing health: tolerance and resistance to parasites in animals. Philos Trans R Soc B: Biol Sci (2009) 364:37–49. doi: 10.1098/rstb.2008.0184
17. Medzhitov R, Schneider DS, Soares MP. Disease tolerance as a defense strategy. Science (2012) 335:936–41. doi: 10.1126/science.1214935
18. Chaplin DD. Overview of the immune response. J Allergy Clin Immunol (2010) 125:S3–23. doi: 10.1016/j.jaci.2009.12.980
19. Thomas F, Giraudeau M, Gouzerh F, Boutry J, Renaud F, Pujol P, et al. The evolution of resistance and tolerance as cancer defences. Parasitology (2020) 147:255–62. doi: 10.1017/S0031182019001501
20. Kozakiewicz CP, Fraik AK, Patton AH, Ruiz-Aravena M, Hamilton DG, Hamede R, et al. Spatial variation in gene expression of Tasmanian devil facial tumors despite minimal host transcriptomic response to infection. BMC Genomics (2021) 22(1):698. doi: 10.1186/s12864-021-07994-4
21. Raven N, Klaassen M, Madsen T, Thomas F, Hamede RK, Ujvari B. Transmissible cancer influences immune gene expression in an endangered marsupial, the Tasmanian devil (Sarcophilus harrisii). Mol Ecol (2022) 31:2293–311. doi: 10.1111/mec.16408
22. Cheng Y, Makara M, Peel E, Fox S, Papenfuss AT, Belov K. Tasmanian devils with contagious cancer exhibit a constricted T-cell repertoire diversity. Commun Biol (2019) 2:99. doi: 10.1038/s42003-019-0342-5
23. Peck S, Corkrey R, Hamede R, Jones M, Canfield P. Hematologic and serum biochemical changes associated with Devil Facial Tumor Disease in Tasmanian Devils. Vet Clin Pathol (2016) 45:417–29. doi: 10.1111/vcp.12391
24. Smith LE, Jones ME, Hamede R, Risques R, Patton AH, Carter PA, et al. Telomere length is a susceptibility marker for tasmanian devil facial tumor disease. EcoHealth (2020) 17:280–91. doi: 10.1007/s10393-020-01491-y
25. Madsen T, Klaassen M, Raven N, Dujon AM, Jennings G, Thomas F, et al. Transmissible cancer and longitudinal telomere dynamics in Tasmanian devils (Sarcophilus harrisii). Mol Ecol (2022)(24):6531–40. doi: 10.1111/mec.16721
26. Ujvari B, Hamede R, Peck S, Pemberton D, Jones M, Belov K, et al. Immunoglubolin dynamics and cancer prevalence in Tasmanian devils (Sarcophilus harrisii). Sci Rep (2016) 6:25093. doi: 10.1038/srep25093
27. Fraik AK, Margres MJ, Epstein B, Barbosa S, Jones M, Hendricks S, et al. Disease swamps molecular signatures of genetic-environmental associations to abiotic factors in Tasmanian devil (Sarcophilus harrisii) populations. Evolution (2020) 74:1392–408. doi: 10.1111/evo.14023
28. Balbontín J, Møller AP, Hermosell IG, Marzal A, Reviriego M, De Lope F. Individual responses in spring arrival date to ecological conditions during winter and migration in a migratory bird. J Anim Ecol (2009) 78:981–9. doi: 10.1111/j.1365-2656.2009.01573.x
29. Bustin SA, Benes V, Garson JA, Hellemans J, Huggett J, Kubista M, et al. The MIQE guidelines: minimum information for publication of quantitative real-time PCR experiments. Clin Chem (2009) 55:611–22. doi: 10.1373/clinchem.2008.112797
30. Team, R. C. R: A language and environment for statistical computing. In: R foundation for statistical computing. v 3.5.2 ed. Vienna, Austria (2018). Available at: http://www.R-project.org/
32. Bates D, Mächler M, Bolker B, Walker S. Fitting linear mixed-effects models using lme4. J Stat Software (2015) 67:1–48. doi: 10.18637/jss.v067.i01
33. Hamede RK, Beeton NJ, Carver S, Jones ME. Untangling the model muddle: Empirical tumour growth in Tasmanian devil facial tumour disease. Sci Rep (2017) 7:6217. doi: 10.1038/s41598-017-06166-3
34. Tovar C, Pye RJ, Kreiss A, Cheng Y, Brown GK, Darby J, et al. Regression of devil facial tumour disease following immunotherapy in immunised Tasmanian devils. Sci Rep (2017) 7:43827. doi: 10.1038/srep43827
35. Hamilton DG, Jones ME, Cameron EZ, Kerlin DH, Mccallum H, Storfer A, et al. Infectious disease and sickness behaviour: tumour progression affects interaction patterns and social network structure in wild Tasmanian devils. Proc R Soc B: Biol Sci (2020) 287:20202454. doi: 10.1098/rspb.2020.2454
36. Bell O, Jones ME, Cunningham CX, Ruiz-Aravena M, Hamilton DG, Comte S, et al. Isotopic niche variation in Tasmanian devils Sarcophilus harrisii with progression of devil facial tumor disease. Ecol Evol (2021) 11:8038–53. doi: 10.1002/ece3.7636
37. Barton K. MuMIn: Multi-Model Inference. R package version 1.43.17(2020). Available at: https://CRAN.R-project.org/package=MuMIn.
38. Warnes GR, Bolker B, Bonebakker L, Gentleman R, Huber W, Liaw A, et al. gplots: Various R Programming Tools for Plotting Data. v 3.0.1.1. ed.: R package. (2019). Available at: http://cran.r-project.org/package=gplots.
40. Lüdecke D. ggeffects: tidy data frames of marginal effects from regression models. J Open Source Software (2018) 3:772. doi: 10.21105/joss.00772
41. Lenth R. emmeans: estimated marginal means, aka least-squares means. (2020). Available at: https://github.com/rvlenth/emmeans.
42. Hothorn T, Bretz F, Westfall P. Simultaneous inference in general parametric models. Biometrical Journal: J Math Methods Biosci (2008) 50:346–63. doi: 10.1002/bimj.200810425
44. Pedersen TL. patchwork: the composer of plots(2020). Available at: https://patchwork.data-imaginist.comhttps://github.com/thomasp85/patchwork.
45. Kassambara A. rstatix: pipe-friendly framework for basic statistical tests. 0.7.0 ed. (2021). Available at: https://github.com/kassambara/rstatix.
46. Kassambara A. ggpubr: ‘ggplot2’ Based publication ready plots. 0.4.0 ed. (2020). Available at: https://github.com/kassambara/ggpubr.
47. Hamede RK, Bashford J, Mccallum H, Jones M. Contact networks in a wild Tasmanian devil (Sarcophilus harrisii) population: using social network analysis to reveal seasonal variability in social behaviour and its implications for transmission of devil facial tumour disease. Ecol Lett (2009) 12:1147–57. doi: 10.1111/j.1461-0248.2009.01370.x
48. Hamilton DG, Jones ME, Cameron EZ, Mccallum H, Storfer A, Hohenlohe PA, et al. Rate of intersexual interactions affects injury likelihood in Tasmanian devil contact networks. Behav Ecol (2019) 30:1087–95. doi: 10.1093/beheco/arz054
49. Wickham H, Averick M, Bryan J, Chang W, Mcgowan LDA, François R, et al. Welcome to the tidyverse. J Open Source software (2019) 4:1686. doi: 10.21105/joss.01686
50. Grolemund G, Wickham H. Dates and times made easy with lubridate. J Stat software (2011) 40:1–25. doi: 10.18637/jss.v040.i03
51. Zhang C, Zhu Y, Wang S, Zachory Wei Z, Jiang MQ, Zhang Y, et al. Temporal gene expression profiles after focal cerebral ischemia in mice. Aging Dis (2018) 9:249–61. doi: 10.14336/AD.2017.0424
52. Kiefer J, Zeller J, Bogner B, Hörbrand IA, Lang F, Deiss E, et al. An unbiased flow cytometry-based approach to assess subset-specific circulating monocyte activation and cytokine profile in whole blood. Front Immunol (2021) 12:641224–4. doi: 10.3389/fimmu.2021.641224
53. Swirski FK, Nahrendorf M, Etzrodt M, Wildgruber M, Cortez-Retamozo V, Panizzi P, et al. Identification of splenic reservoir monocytes and their deployment to inflammatory sites. Science (2009) 325:612–6. doi: 10.1126/science.1175202
54. Jackaman C, Tomay F, Duong L, Abdol Razak NB, Pixley FJ, Metharom P, et al. Aging and cancer: The role of macrophages and neutrophils. Ageing Res Rev (2017) 36:105–16. doi: 10.1016/j.arr.2017.03.008
55. Gause WC, Wynn TA, Allen JE. Type 2 immunity and wound healing: evolutionary refinement of adaptive immunity by helminths. Nat Rev Immunol (2013) 13:607–14. doi: 10.1038/nri3476
56. Patchett AL, Flies AS, Lyons AB, Woods GM. Curse of the devil: molecular insights into the emergence of transmissible cancers in the Tasmanian devil (Sarcophilus harrisii). Cell Mol Life Sci (2020) 77:2507–25. doi: 10.1007/s00018-019-03435-4
57. Savage AE, Gratwicke B, Hope K, Bronikowski E, Fleischer RC. Sustained immune activation is associated with susceptibility to the amphibian chytrid fungus. Mol Ecol (2020) 29:2889–903. doi: 10.1111/mec.15533
58. Jackson JA, Hall AJ, Friberg IM, Ralli C, Lowe A, Zawadzka M, et al. An immunological marker of tolerance to infection in wild rodents. PloS Biol (2014) 12:e1001901. doi: 10.1371/journal.pbio.1001901
59. Cheng Y, Heasman K, Peck S, Peel E, Gooley RM, Papenfuss AT, et al. Significant decline in anticancer immune capacity during puberty in the Tasmanian devil. Sci Rep (2017) 7:44716. doi: 10.1038/srep44716
60. Lazenby BT, Tobler MW, Brown WE, Hawkins CE, Hocking GJ, Hume F, et al. Density trends and demographic signals uncover the long-term impact of transmissible cancer in Tasmanian devils. J Appl Ecol (2018) 55:1368–79. doi: 10.1111/1365-2664.13088
61. Forbes KM, Mappes T, Sironen T, Strandin T, Stuart P, Meri S, et al. Food limitation constrains host immune responses to nematode infections. Biol Lett (2016) 12:20160471. doi: 10.1098/rsbl.2016.0471
62. Knutie SA, Wilkinson CL, Wu QC, Ortega CN, Rohr JR. Host resistance and tolerance of parasitic gut worms depend on resource availability. Oecologia (2017) 183:1031–40. doi: 10.1007/s00442-017-3822-7
63. Hinshaw C, Evans KC, Rosa C, López-Uribe MM. The role of pathogen dynamics and immune gene expression in the survival of feral honey bees. Front Ecol Evol (2021) 8. doi: 10.3389/fevo.2020.594263
64. Eskew EA, Fraser D, Vonhof MJ, Pinsky ML, Maslo B. Host gene expression in wildlife disease: making sense of species-level responses. Mol Ecol (2021) 30:6517–30. doi: 10.1111/mec.16172
65. Belkhir S, Hamede R, Thomas F, Ujvari B, Dujon AM. Season, weight, and age, but not transmissible cancer, affect tick loads in the endangered Tasmanian devil. Infect Genet Evol (2022) 98:105221. doi: 10.1016/j.meegid.2022.105221
66. Farhood B, Najafi M, Mortezaee K. CD8+ cytotoxic T lymphocytes in cancer immunotherapy: A review. J Cell Physiol (2019) 234:8509–21. doi: 10.1002/jcp.27782
67. Oppenheim DE, Roberts SJ, Clarke SL, Filler R, Lewis JM, Tigelaar RE, et al. Sustained localized expression of ligand for the activating NKG2D receptor impairs natural cytotoxicity in vivo and reduces tumor immunosurveillance. Nat Immunol (2005) 6:928–37. doi: 10.1038/ni1239
68. Champsaur M, Lanier LL. Effect of NKG2D ligand expression on host immune responses. Immunol Rev (2010) 235:267–85. doi: 10.1111/j.0105-2896.2010.00893.x
69. Marty P R, Thompson WK, Salem RM, Font-Burgada J, Zanetti M, Carter H. Evolutionary pressure against MHC class II binding cancer mutations. Cell (2018) 175:416–428.e13. doi: 10.1016/j.cell.2018.08.048
70. Rimsza LM, Roberts RA, Miller TP, Unger JM, Leblanc M, Braziel RM, et al. Loss of MHC class II gene and protein expression in diffuse large B-cell lymphoma is related to decreased tumor immunosurveillance and poor patient survival regardless of other prognostic factors: a follow-up study from the Leukemia and Lymphoma Molecular Profiling Project. Blood (2004) 103:4251–8. doi: 10.1182/blood-2003-07-2365
71. Jessy T. Immunity over inability: The spontaneous regression of cancer. J Nat Sci Biol Med (2011) 2:43–9. doi: 10.4103/0976-9668.82318
72. Kucerova P, Cervinkova M. Spontaneous regression of tumour and the role of microbial infection–possibilities for cancer treatment. Anticancer Drugs (2016) 27:269–77. doi: 10.1097/CAD.0000000000000337
73. Zhou M, Tang Y, Xu W, Hao X, Li Y, Huang S, et al. Bacteria-based immunotherapy for cancer: a systematic review of preclinical studies. Front Immunol (2023) 14. doi: 10.3389/fimmu.2023.1140463
74. Antonelli A, Binyamin B, Hohl T, Glickman M, Redelman-Sidic G. Bacterial immunotherapy for cancer induces CD4-dependent tumor-specific immunity through tumor-intrinsic interferon-γ signaling. Proc Natl Acad Sci United States America. (2020) 117:18627–37. doi: 10.1073/pnas.2004421117
75. Pyecroft SB, Pearse A-M, Loh R, Swift K, Belov K, Fox N, et al. Towards a case definition for devil facial tumour disease: What is it? Ecohealth (2007) 4:346–51. doi: 10.1007/s10393-007-0126-0
Keywords: tumor progression, immune system, marsupial, infectious disease, life-history traits, regression, resistance, tolerance
Citation: Raven N, Klaassen M, Madsen T, Jones M, Hamilton DG, Ruiz-Aravena M, Thomas F, Hamede RK and Ujvari B (2024) Complex associations between cancer progression and immune gene expression reveals early influence of transmissible cancer on Tasmanian devils. Front. Immunol. 15:1286352. doi: 10.3389/fimmu.2024.1286352
Received: 31 August 2023; Accepted: 29 January 2024;
Published: 07 March 2024.
Edited by:
Ana Teles, Max Planck Institute for Evolutionary Biology, GermanyReviewed by:
Sherri L. Christian, Memorial University of Newfoundland, CanadaKamir Hiam-Gálvez, Stanford University, United States
Copyright © 2024 Raven, Klaassen, Madsen, Jones, Hamilton, Ruiz-Aravena, Thomas, Hamede and Ujvari. This is an open-access article distributed under the terms of the Creative Commons Attribution License (CC BY). The use, distribution or reproduction in other forums is permitted, provided the original author(s) and the copyright owner(s) are credited and that the original publication in this journal is cited, in accordance with accepted academic practice. No use, distribution or reproduction is permitted which does not comply with these terms.
*Correspondence: Beata Ujvari, YmVhdGEudWp2YXJpQGRlYWtpbi5lZHUuYXU=
†These authors have contributed equally to this work