 André J. Esgalhado1
 Débora Reste-Ferreira1
 Sandra Weinhold2
 Markus Uhrberg2
 Elsa M. Cardoso1,3
 Fernando A. Arosa1,4*
- 1Health Sciences Research Centre, University of Beira Interior (CICS-UBI), Covilhã, Portugal
- 2Institute for Transplantation Diagnostics and Cell Therapeutics, Medical Faculty, University Hospital Düsseldorf, Heinrich-Heine-University, Düsseldorf, Germany
- 3School of Health Sciences, Polytechnic of Guarda (ESS-IPG), Guarda, Portugal
- 4Faculty of Health Sciences, University of Beira Interior (FCS-UBI), Covilhã, Portugal
Antigen-driven human effector-memory CD8+ T cells expressing low levels of the CD8β chain have been previously described. However, little is known on a possible antigen-independent trigger. We have examined the impact that IL-15 has on the expression of CD8β on purified human naïve CD8+ T cells after CFSE labeling and culture with IL-15. As expected, IL-15 induced naïve CD8+ T cells to proliferate and differentiate. Remarkably, the process was associated with a cell-cycle dependent down-modulation of CD8β from the cell surface, leading to the generation of CD8αβlow and CD8αβ− (i.e., CD8αα) T cells. In contrast, expression of the CD8α chain remained steady or even increased. Neither IL-2 nor IL-7 reproduced the effect of IL-15. Determination of mRNA levels for CD8α and CD8β isoforms by qPCR revealed that IL-15 promoted a significant decrease in mRNA levels of the CD8β M-4 isoform, while levels of the M-1/M-2 isoforms and of CD8α increased. Noteworthy, CD8+ T cell blasts obtained after culture of CD8+ T cells with IL-15 showed a cell-cycle dependent increase in the level of the tyrosine kinase Lck, when compared to CD8+ T cells at day 0. This study has shown for the first time that IL-15 generates CD8αα+αβlow and CD8αα+αβ− T cells containing high levels of Lck, suggesting that they may be endowed with unique functional features.
Introduction
Human effector-memory CD8+ T cells (CD8+ Tem) have been thoroughly studied regarding their origin, phenotype and function. They are usually CD28−CCR7−CD45RA− but under certain conditions can re-express CD45RA, being designated as effector memory CD8+CD45RA+ T cells (CD8+ Temra) (1–3). An interesting study by Werwitzke et al., showed that about 80% of human peripheral blood CD8+ Tem cells re-express CD45RA and display low levels of the CD8αβ receptor, hence being CD28−CD45RA+CD8αβlow (4). Interestingly, the phenotypic similarities between CD8+ Temra and effector-memory CD8αβlow T cells also include expression of a diverse array of activation and inhibitory receptors, and secretion of IFN-γ, perforin and granzymes upon activation (4–6), suggesting that they are similar CD8+ T cell populations. Noteworthy, these studies identified a population of CD8αα+αβ− T cells (i.e., CD8αα) in the peripheral blood of healthy and HIV-infected humans and endowed with functional effector-memory features (4–7). Konno et al. suggested that the CD8αα T cells were descendants of clonally expanded CD8αβhigh T cells in vivo, while Walker et al. suggested that the CD8αα T cells may represent circulating mucosal associated invariant T cells. By performing a TCRVβ CDR3-spectratyping analysis, the study of Konno et al. showed that CD8αβhigh T cells were polyclonal, while CD8αβlow and CD8αα T cells were oligoclonal, suggesting that a fraction of CD8αβhigh T cells clonally expanded, differentiated, and downregulated the CD8β chain (5).
Besides identifying functional populations of human CD8+ T cells, the β chain of the CD8αβ receptor plays an important role in assisting CD8αβ-mediated signaling and activation mediated by the TCR. Thus, the CD8β chain is thought to increase the efficiency of the trans-interaction between the TCR and MHC class I molecules, allow CD8αβ heterodimers to move into lipids rafts, and enhance the activation of the fraction of Lck molecules associated with the CD8α chain (8–12). The identification that the human CD8β gene encodes four alternatively spliced membrane-bound forms (M-1, M-2, M-3 and M-4) and two secreted forms (S-1 and S-2) (13, 14) introduced more complexity into this area. Indeed, the CD8β isoforms were shown to be differentially expressed by CD8+ T cell populations, with the M-1 isoform being mainly expressed in naïve CD8+ T cells (Tn) and the M-4 isoform being predominantly expressed in CD8+ Tem (15). Moreover, mutational and functional studies with co-transduced human CD4+ T cells showed that expression of the M-4 isoform enhanced TCR-mediated recognition of antigen (16), reinforcing the importance of the CD8β chain in CD8+ T cell activation.
Despite the body of knowledge supporting the importance of the CD8β chain and the tyrosine kinase Lck in CD8+ T cell signaling and responses, studies examining the influence of factors other than peptide antigens on the expression of the CD8β chain and the tyrosine kinase Lck in human CD8+ T cells are lacking. Thus, while human CD8+ Tem cells that have reexpressed CD45RA (i.e., CD8+ Temra) have been shown to be generated by TCR-dependent and independent (i.e. cytokines) signals, such as IL-15 both in vitro (17–20) and in vivo (21, 22), human CD8αα T cells are only known to be generated by TCR-dependent signals (23). Whether IL-15 plays a role in the formation of human CD8αα T cells is not known. Prompted by our interest in characterizing molecular cues leading to the generation of CD8+ Temra cells and CD3+CD8αβlow T cells, due to their association with chronic inflammatory disorders, including neurodegenerative disorders (3, 24), we used ex vivo human CD8+ T cells from the peripheral blood of regular healthy blood donors and cultured them in vitro in the presence of IL-15, and other members of the gamma common (γc) chain-dependent cytokines such as IL-2 and IL-7. The results demonstrated that IL-15, but not IL-2 or IL-7, induces a cell-cycle dependent downregulation of the CD8β chain, generating pools of CD8αβlow and CD8αα T cells, and a marked increase in the amount of total Lck.
Material and methods
Ethics statement
Human peripheral blood mononuclear cells (PBMC) were obtained from buffy coats of anonymous healthy regular blood donors kindly provided by the Centro do Sangue e da Transplantação de Coimbra (CST-C, Portugal) under a protocol approved by the Portuguese Institute of Blood and Transplantation (IPST, IP, Lisbon), the University of Beira Interior (UBI), and the Faculty of Health Sciences (FCS-UBI). The study protocol (INSIGHTHEM) was approved by the Ethics Committee of the University in accordance with the Declaration of Helsinki (Ref. Number CE-UBI-Pj-2017–012). PBMC were also obtained from the Blutspendezentrale at the University Hospital Düsseldorf under protocol accepted by the institutional review board at the University of Düsseldorf (study number 2019–383).
Isolation of cells
PBMC were isolated from buffy coats after centrifugation over Lymphoprep (STEMCELL Technologies, France). Contaminating red blood cells were lysed in lysis solution (10 mM Tris, 155 mM NH4Cl, pH 7.4) for 10 minutes at 37°C. Total and naïve CD8+ T cells were obtained from PBMC preparations by negative selection using MojoSort kits (BioLegend, USA). Purity was checked by flow cytometry using antibodies against CD3, CD4, CD8α, CD8β, CD45RA, CCR7, and was always higher than 96–97%.
CFSE labeling and cell culture conditions
Freshly collected PBMC or isolated CD8+ T cells were immediately used for all studies. Cells were first labeled with CellTrace™ CFSE Cell Proliferation kit (Thermo-Fisher Scientific, USA) at a final concentration of 5μM for 5 minutes at room temperature (RT) in phosphate-buffered saline (PBS) with occasional mixing, followed by three washes with RPMI-1640 medium (Thermo-Fisher Scientific) containing 10% heat-inactivated fetal bovine serum (FBS). Then, CFSE-labeled PBMC (1.0x10⁶/mL), total CD8+ T cells (1.0x10⁶/mL) and naïve CD8+ T cells (1.5x10⁶/mL) were cultured in 24-well plates (Greiner Bio-One, Austria) in RPMI-1640 GlutaMAX medium (Thermo-Fisher Scientific) supplemented with 5% human serum (Sigma-Aldrich, USA) and 1% antibiotic-antimycotic solution (Sigma-Aldrich) at 37°C, 5% CO2, and 95% humidity for 12 days. PBMC and total CD8+ T cells were cultured in the presence of IL-15 (R&D Systems, USA), whereas naïve CD8+ T cells were cultured in the presence IL-15, IL-2 (Clinigen, Germany), IL-7 (R&D Systems), and combinations of IL-15+IL-2 and IL-15+IL-7. All cytokines were added at the beginning and at the sixth day of culture at a final concentration of 10ng/mL.
Flow cytometry studies
For cell surface staining, approximately 0.5x10⁶ cells were incubated in 96-well round-bottom plates or 5mL round-bottom tubes at 4°C in the dark for 30 minutes with combinations of different fluorochrome-conjugated antibodies in staining solution (PBS, 0.2% BSA, 0.1% NaN3). Supplementary Table 1 summarizes the antibodies used in this study. After staining, cells were washed, and a minimum of 20,000 events were acquired in a BD Accuri C6 (BD Biosciences, USA) or in a CytoFLEX flow cytometer (Beckman Coulter, USA). For intracellular staining, cells were first incubated with antibodies against cell surface receptors, as described. Then, cells were fixed for 30 minutes and permeabilized using the eBioscience™ Intracellular Fixation & Permeabilization Buffer Set (Thermo Fisher Scientific). After washing, cell aliquots were stained separately with irrelevant or anti-Lck antibody (see Supplementary Table 1) for 30 minutes at room temperature. After the washing steps, cells were resuspended in PBS and a minimum of 20,000 events were acquired in a BD Accuri C6 (BD Biosciences). For all acquisitions, doublets were excluded by FSC-A vs FSC-H. Results for extracellular and intracellular stainings were analyzed using BD Accuri C6 software (BD Biosciences), FlowJo software (FlowJo, LLC) or Kaluza Analysis Software (Beckman Coulter).
Quantification of cell divisions
Cell divisions were determined by sequential halving of CFSE fluorescence intensity after the period of culture. In all the experiments performed, CFSE halving allowed to distinguish the different cell division cycles undergone by the CD8+ T cells. To quantitate changes in the expression of selected cell surface receptors (i.e., CD8α, CD8β, CCR7 and CD45RA) during the proliferation process electronic regions were created around positive cells in each cycle of cell division and mean fluorescence intensity (MFI) values were obtained. (see Supplementary Figure 1). MFI values of cells that did not divide were used to normalize the MFI values of the dividing cells as follows: (MFI dividing cells/MFI non-dividing cells) x 100. For each receptor, MFI was measured on positive cells, gated within each cell division (from 0 to 5, or more).
RNA isolation, cDNA synthesis and qPCR
Total RNA was isolated from CD8+ T naïve cells prior and after culture with IL-15 using the RNeasy Mini Kit (Qiagen, Germany), according to the manufacturer’s instructions. All samples were treated with DNase I stock solution (Qiagen) as recommended by the manufacture. RNA quantification was performed using UV/Vis Nanophotometer spectrophotometer (Implen GmbH, Germany) and the purity was assessed using A260/280 ratio. The integrity of total RNA was based on visualization of 28S and 18S ribosomal RNA subunits under 1% agarose. Band intensity was assessed using gel documentation system 2000 (Bio-Rad, Germany). cDNA was synthesized from 0.5 or 1 μg total RNA, in a total reaction volume of 20 μl, using the Xpert cDNA Synthesis Kit (Ref. GK80.0100, GRiSP Research Solutions, Portugal) with Oligo(dT)20 primer according to the manufacturer’s instructions. cDNA was either immediately used as template in qPCR or stored at -20°C prior to qPCR. Regarding qPCR, for each assay, 100 ng of cDNA (2 μl or 1 µl, depending on if cDNA was prepared with 0.5 or 1 μg, respectively) was mixed in 20 µl final reaction mixed of a solution containing 10 µl of NZYSupreme qPCR Green Master Mix (2x), ROX plus (Ref. MB44002 NZYTech, Portugal), 0.4 µM of each primer (Supplementary Table 2) and sterile water. All primers were evaluated and/or designed with NCBI Primer Blast and synthesized by STAB VIDA (Portugal). Real-time PCR reactions were settled with an initial denaturation and polymerase activation at 95°C for 5 minutes, followed by 40 cycles of 95°C for 15 seconds denaturation and 60°C for 1 minute annealing/extension. All reactions were run in duplicates in 0.2 ml non-skirted 96-well PCR plates (Ref. AB0600, Thermo Fisher Scientific) with adhesive PCR plate seals (Ref. AB0558, Thermo Fisher Scientific). Negative controls without any template were processed in parallel and did not result in any qPCR signal. Specificity of primer pairs was verified by electrophoresis on a 2% (w/v) agarose gel in the presence of 0.05% Xpert Green DNA Stain (Ref. GS01.0001, GRiSP Research Solutions). The expected product size was confirmed by using the GRS Low Range Ladder Ref. GL011.0050, GRiSP Research Solutions). Standard curves were generated based on a five-fold dilution replicates series (without dilution, 1:5, 1:25 and 1:125) of a pool of different cDNAs (control and activated) analyzed in this work. Amplification efficiencies and correlation coefficients for each primer pair were calculated from the slopes of the standard curves using Excel. The relative mRNA expression of CD8α and CD8β were normalized using the measured expression level of two reference genes (GAPDH and RPS18), that were not regulated in the biological system, using the ΔCq method: relative quantity reference/target = 2(Cq(geometric mean of reference genes)-Cq(gene of interest)). The reference stability values for the reference genes were calculated using the CFX Maestro Software version 2.2 (Bio-Rad), according to the geNorm algorithm (25).
Statistical analysis
For flow cytometry data, statistical analysis was performed using SPSS 28 software (IBM, USA). Continuous variables were expressed as the Mean ± Standard Error of the Mean (SEM). Differences between the means of two continuous variables were analyzed using the paired samples T-test, whereas differences among the means of three or more continuous variables were analyzed using the one-way analysis of variance (ANOVA) followed by Tukey’s or Dunnett’s post hoc tests. All data were checked for normality. Statistical significance was defined as p<0.05. For the qPCR data, comparison of relative quantity between control and activated cells was performed using Mann-Whitney U test, and the differences were regarded as significant when p<0.05. Statistical analysis was performed using GraphPad Prism 8.0 (GraphPad software Inc., USA).
Results
IL-15 induces CD8β chain down-modulation
In agreement with our previous results, long-term culture of human PBMC with IL-15 induced several cycles of CD8+ T cell division, as determined by CFSE halving. Noteworthy, analysis of the expression of CD8β after gating on the pool of CD3+CD8α+ T cell blasts (Figure 1A, upper right quadrant), showed an evident down-modulation of the CD8β chain after several cycles of cell division, which led to the generation of a population of CD3+CD8αβ− (i.e., CD8αα) T cells in the most dividing CD8+ T cells (Figure 1B). Analysis of the percentage of dividing CD8αβ− versus dividing CD8αβ+ T cells revealed that approximately 20% of the CD3+CD8αβ+ T cells that expanded lost expression of CD8β, becoming CD8αα T cells (Figure 1C). However, as expected, it was the pool of CD3−CD8+ blast cells (Figure 1A, lower right quadrant) that took most advantage of the presence of IL-15 in culture. Thus, as shown in Figure 1D, the proliferating lymphocytes were almost completely negative for CD8β expression and were largely comprised on NK cells, as demonstrated by CD56 expression (Figure 1E). Next, we wanted to analyze the expression of CD8α vs CD8β in CD8+ Tn, Tcm, Tem or Temra at baseline levels in order to understand the relative expression of the CD8α and CD8β chains after culture with IL-15. To that, we labeled fresh collected PBMC with antibodies against CCR7, CD45RA, CD8α and CD8β. As shown in Figure 1F, while CD8+ Tn cells are mainly constituted by CD8αβhigh T cells, CD8+ Tcm cells already showed an inversion of the proportions of CD8αβhigh vs. CD8αβlow T cells. In contrast, in the CD8+ Tem and Temra pools, the percentage of CD8αβlow T cells was predominant.
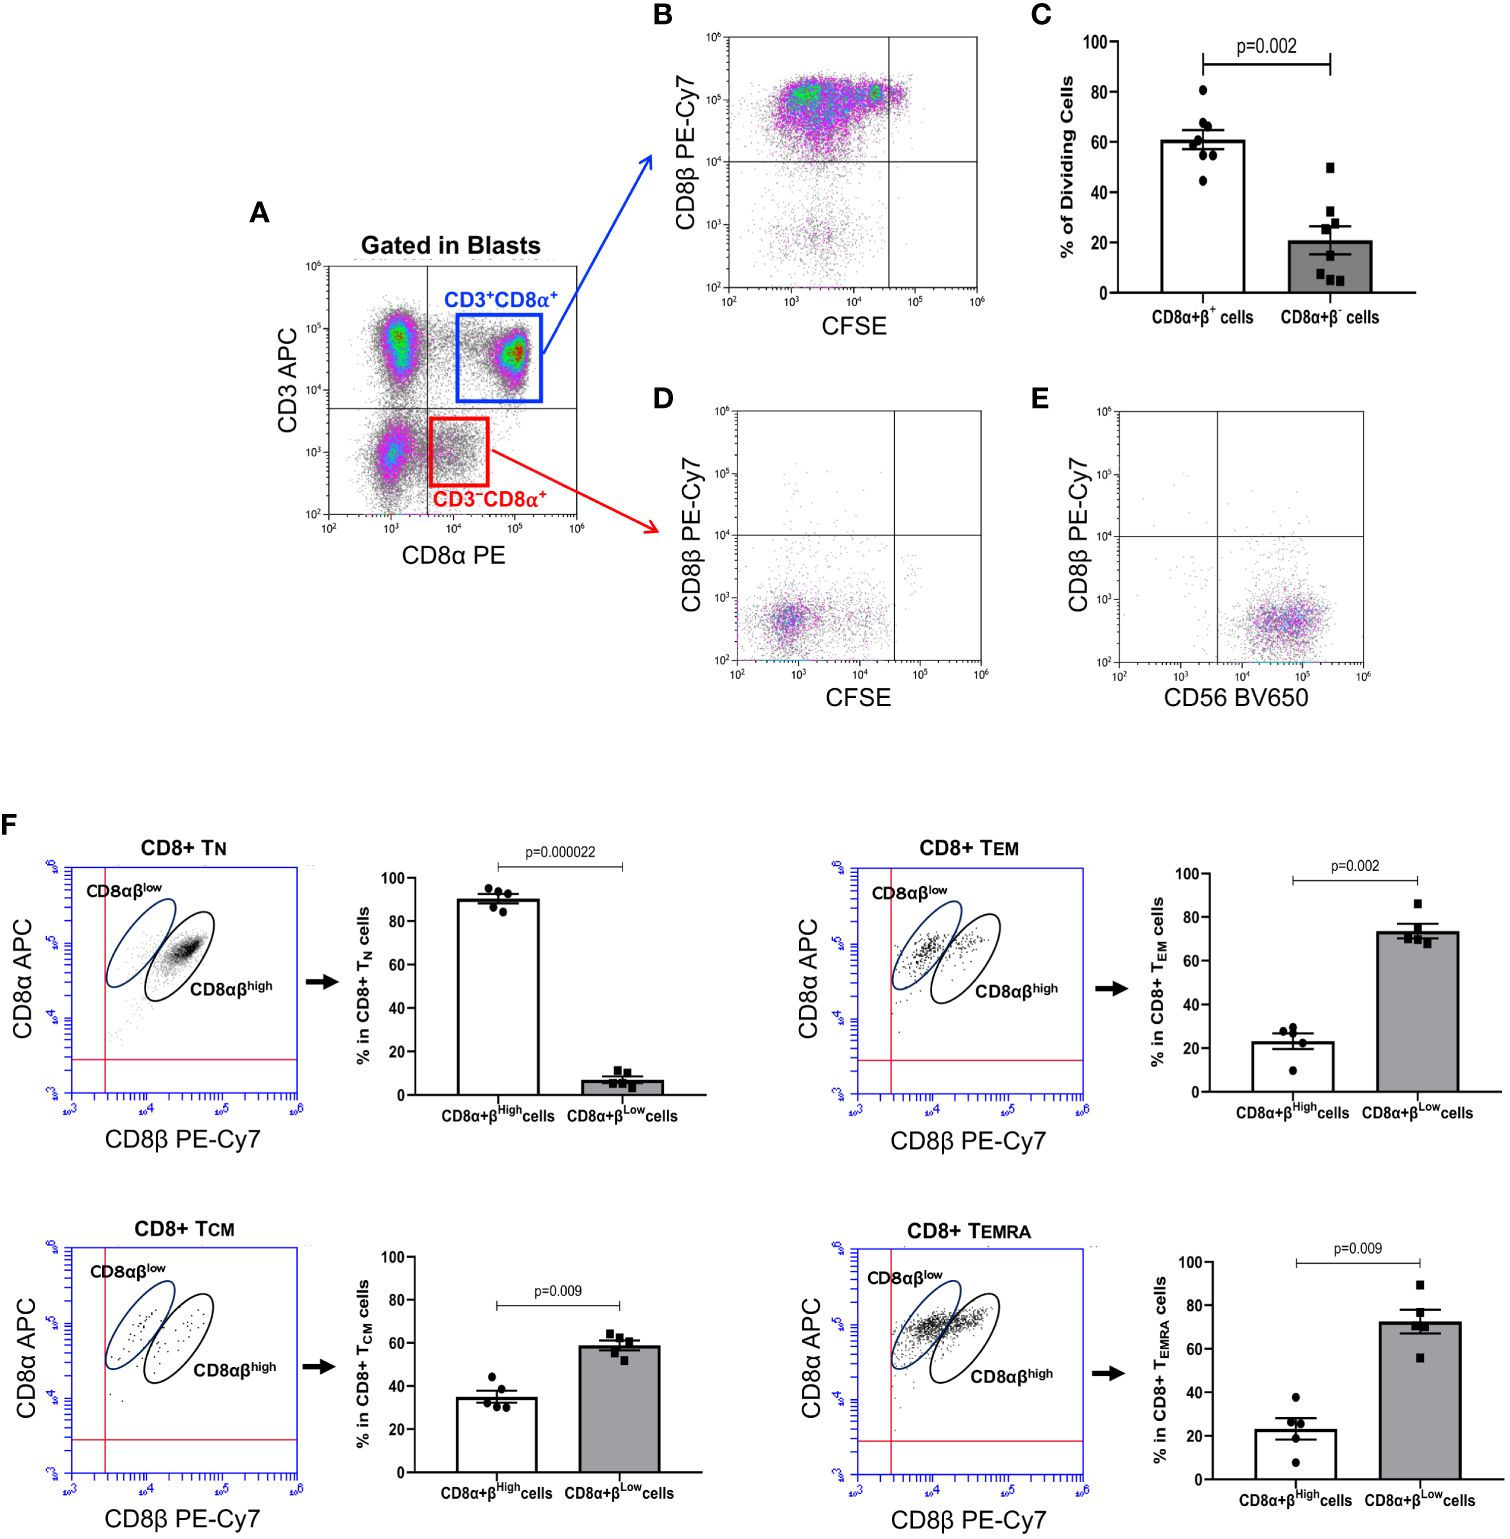
Figure 1 IL-15 induces down-modulation of CD8β in CD8+ T cells present in PBMC samples. PBMC were isolated from buffy coats from regular healthy donors by centrifugation over Lymphoprep, labeled with CFSE and cultured with IL-15 (10 ng/mL) for 12 days. At the end of the culture, cells were harvested, washed, and approximately 0.5×10⁶ cells stained with fluorochrome-conjugated antibodies against CD3, CD8α, and CD8β (Accuri C6) or CD3, CD8β, and CD8α, CCR7, CD45RA and CD56 (CytoFLEX) and acquired. An electronic region was created around blast cells based on FSC and SSC, which were subsequently analyzed for CFSE fluorescence halving and cell surface expression of CD3, CD8α, CD8β, CD45RA, CCR7 and CD56. (A) Representative dot-plot showing CD3 vs. CD8α expression on blast cells after the 12-day culture period with IL-15. Electronic gates were created around CD3+CD8α+ and CD3−CD8α+ cell blasts. (B) Dot-plot shows CFSE halving vs. CD8β expression after gating in CD3+CD8α+ T cell blasts (upper right quadrant in Panel (A). This gives us an unambiguous fluorescence emission of CD8β along the cycles of cell division. (C) Graph showing the percentage of dividing CD8αβ+ and CD8αβ− T cells after 12-day culture with IL-15 (mean ± SEM, n=8). (D) Dot-plot shows CFSE halving vs. CD8β expression after gating in CD3−CD8α+ T cell blasts (lower right quadrant in Panel (A). (E) Dot-plot shows CD8β vs. CD56 expression after gating in CD3−CD8α+ T cell blasts (lower right quadrant in Panel (A). (F) Figure shows dot-plots of CD8β vs. CD8α expression in CD8+ Tn, Tcm, Tem and Temra in gated CD45RA+CCR7+, CD45RA−CCR7+, CD45RA−CCR7− and CD45RA+CCR7−, respectively, after labeling of fresh PBMC preparations. CD8βhigh and CD8βlow populations in each subset are circled. Next to each do-plot is a graph displaying the percentage of CD8βhigh and CD8βlow T cells in CD8+ Tn, Tcm, Tem or Temra cells (mean ± SEM, n=5). P values are indicated.
To avoid the possible confounding effect of the presence of NK cells on the PBMC preparations and to ascertain whether the CD8β chain downmodulation could also be seen in CD8+ Tn cells, these were purified from PBMC preparations using negative isolation kits. The isolated CD8+ Tn cells were CD45RA+CCR7+ and purity was usually higher than 97% (Figure 2A). These experiments showed that IL-15 also induced a cell-cycle dependent down-modulation of the CD8β chain in CD8+ Tn cells, leading to the generation of a pool of CD8αβlow T cells and a pool of CD8β− T cells, namely in cells that divided ≥5 times (Figure 2B, left dot-plot). In marked contrast, expression of the CD8α chain remained constant or increased slightly with each cycle of cell division (Figure 2B, right dot-plot). Similar results were obtained with total bulk CD8+ T cells (see Supplementary Figure 2). The percentage of the four CD8+ T cell subsets framed on Figure 2B are illustrated in Figure 2C. Simultaneous analysis of CCR7 and CD45RA expression demonstrated that the CD8β down-modulation seen in the most dividing IL-15-activated CD8+ T cells was paralleled by a similar down-modulation of the naïve chemokine receptor CCR7 and the generation of CD8+CCR7− T cells. In contrast, although the CD45RA receptor was also downmodulated by IL-15, no CD8+CD45RA− were observed (Figure 2D), which is in accord with the fact that IL-15 stimulation drives CD8+ Tn cells toward the acquisition of a highly differentiated phenotype (19, 20). Figure 2E summarizes the results of the expression of CD8α, CD8β, CCR7 and CD45RA in CD8+ Tn samples after culture with IL-15. The normalized MFI values (see Material & Methods) for the expression of CD8β and CCR7 paralleled each other and started to decrease significantly after the 4th cycle of cell division (p<0.001). Regarding the normalized MFI values for CD45RA expression, an initial increase in the 1st to 3rd division cycles was followed by a slight downmodulation after 5th cycle of cell division (p<0.01). In contrast, the normalized MFI values for the expression of CD8α increased, being statistically significantly higher at cell division cycles 2, 3, 4 and ≥5 (p<0.05).
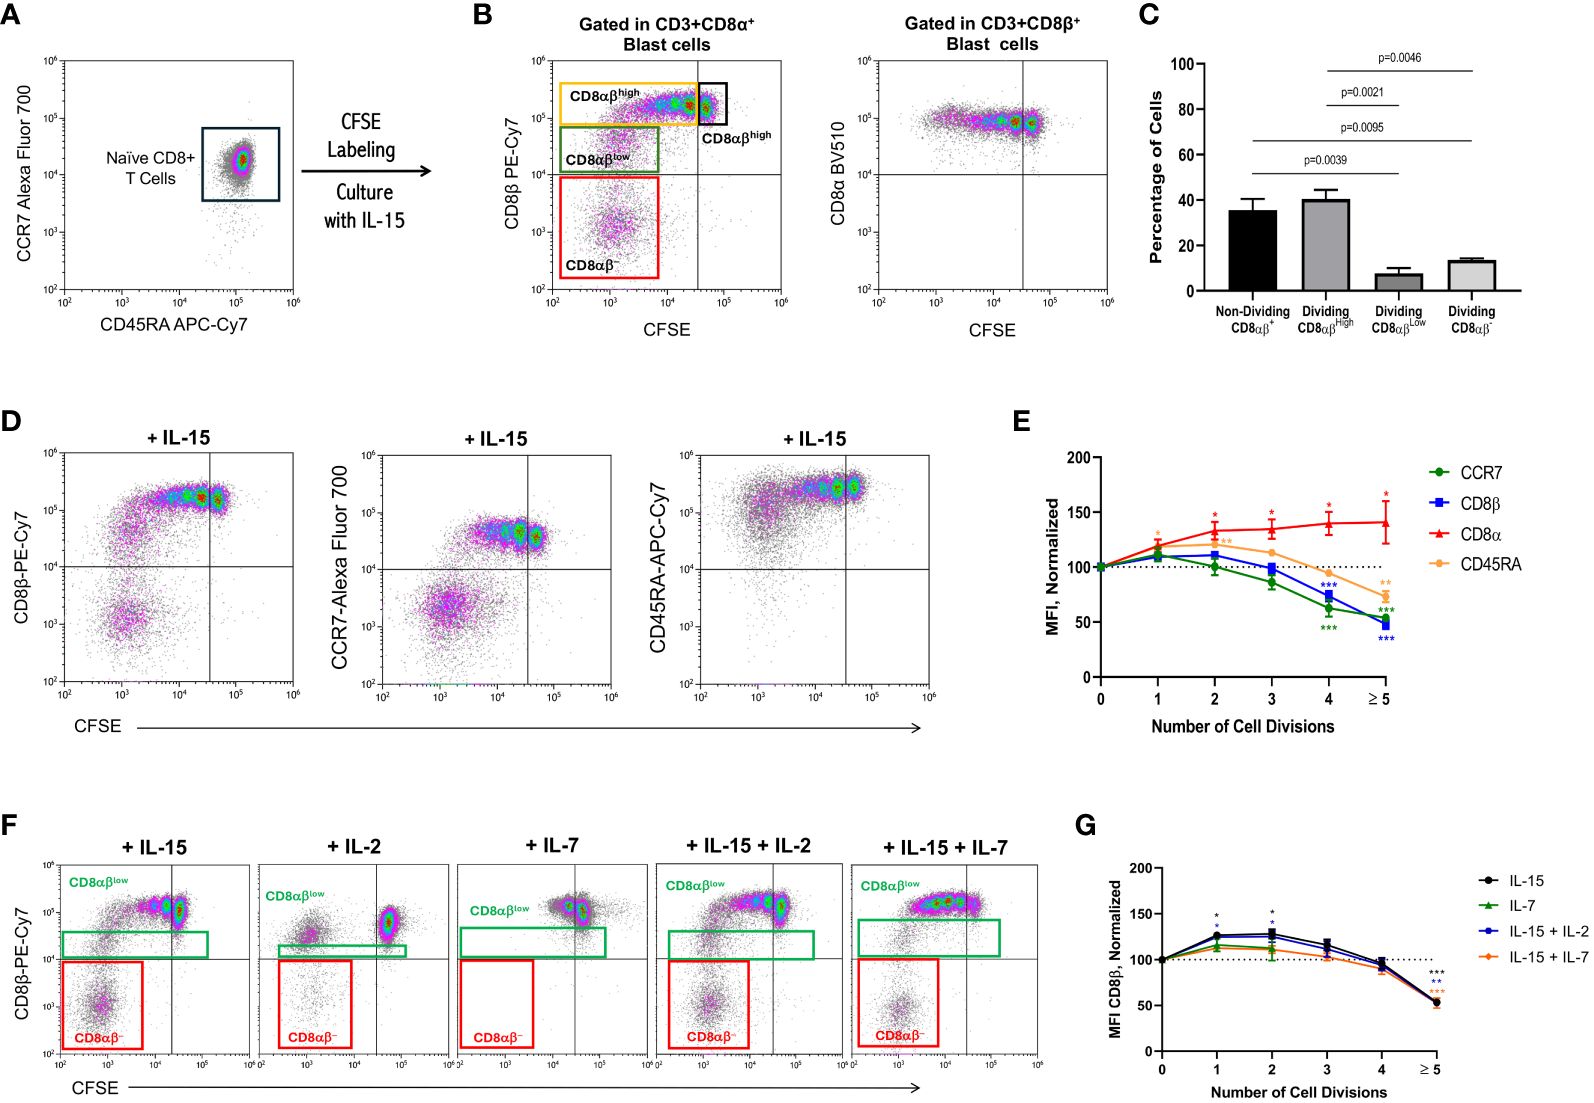
Figure 2 IL-15 induces down-modulation of CD8β in naïve CD8+ T cells. PBMC were isolated as described in the legend of Figure 1. Naïve CD8+ T cells were purified by using negative selection kits, labeled with CFSE and cultured with IL-15, IL-2, IL-7 or combinations of them (10 ng/mL) for 12 days. At the end of the culture, cells were harvested, washed, and approximately 0.5×10⁶ cells stained using fluorochrome-conjugated antibodies against CD3, CD8α, CD8β, CD45RA, CCR7 and CD56, and acquired in an Accuri C6 or a CytoFLEX flow cytometers. (A) Representative flow graph showing CD45RA vs. CCR7 expression on the negatively selected naïve CD8+ T cells (purity was usually higher than 97%) before CFSE-labeling and culture with IL-15. ((B) left dot-plot) Flow graph shows CFSE vs. CD8β expression after the 12-day culture period after gating on CD3+CD8α+ T cell blasts in order not to interfere with the analysis of the CD8β chain. Four CD8+ T cell populations can be distinguished: non-dividing CD8αβhigh (black rectangle), dividing CD8αβhigh (orange rectangle), dividing CD8αβlow (green rectangle), and dividing CD8αβ− (red rectangle). ((B), right dot-plot). Flow graph shows CFSE vs. CD8α expression after the 12-day culture period after gating on CD3+CD8β+ T cell blasts in order not to interfere with the analysis of the CD8α chain. (C) Graph shows the percentage of the four different subsets framed in Figure 2B (left dot-plot, mean ± SEM, n=7). P values are indicated. (D) Dot-plots show CFSE halving vs. CD8β (left dot-plot), CCR7 (middle dot-plot) and CD45RA (right dot-plot) in CD8+ Tn cells after 12-day culture with IL-15. (E) Graph shows the normalized mean fluorescence intensity (MFI) values for the CD8α, CD8β, CCR7 and CD45RA receptors, calculated as indicated in the Material & Methods, from purified naïve CD8+ T cells that undergone none, one to 4, or >5 divisions, after culture with IL-15 for 12 days. Data are presented as the mean±SEM; n=6 for zero to 4 divisions, and n=3 for ≥ 5 divisions (for CD8α CD8β and CCR7) and n=2 for CD45RA. *p<0.05; ***p<0.001, as determined by one-way analysis of variance (ANOVA) with Dunnett’s post hoc test, comparing each cell division with cells that did not divide (0 divisions). (F) Dot-plots show CFSE halving vs. CD8β expression in CD8+ Tn cells after 12-day cultures with the indicated cytokines. Dividing CD8αβlow (green rectangle) and dividing CD8αβ− (red rectangle) are indicated. (G) Graph shows the normalized mean fluorescence intensity (MFI) values for CD8β, calculated as indicated in the Material & Methods, from purified naïve CD8+ T cells that undergone none, one to 4, or >5 divisions, after culture with IL-15, IL-7, IL15+IL-2 and IL-15+IL-7 for 12 days. Data are presented as the mean±SEM; n=2, *p<0.05; **p<0.01, ***p<0.001, as determined by one-way analysis of variance (ANOVA) with Dunnett’s post hoc test, comparing each cell division with cells that did not divide (0 divisions).
Next, we wanted to ascertain whether the effect of IL-15 can also be seen with other γc cytokines, such as IL-2 and IL-7, which have been used for expanding CD8+ T cells for experimental and clinical therapeutic purposes. As shown in Figure 2F, IL-2 neither induced CD8αβlow T cells nor a significant pool of CD8αα T cells when compared to IL-15 (3.8 ± 0.5 vs. 14.6 ± 0.7, mean ± SEM, p=0.0027). Indeed, the number of CD8+ T cells entering successive cell divisions was minimal when compared to IL-15 or the combination of IL-15+IL-2 and IL-15+IL-7 (see Supplementary Table 3). Of note, IL-7 was only capable to drive naïve CD8+ T cells into two cycles of cell division and, consequently, no CD8β down-modulation was observed (see Supplementary Table 3). Finally, the combined use of these cytokines showed that IL-15+IL-2 did not significantly affect the percentage of CD8αα T cells when compared to IL-15 alone (16.1 ± 2.2 vs. 14.6 ± 0.7, p=0.7578). Although the use of IL-15+IL-7 slightly inhibited the formation of CD8αα T cells when compared to IL-15 alone, the difference was not statistically significant (9.7 ± 0.4 vs. 14.6 ± 0.7, p=0.0704). Figure 2G summarizes the results of the expression of CD8β in CD8+ Tn samples after culture with IL-15.
IL-15 preferentially down-modulates the CD8β M-4 isoform
Next, we wanted to ascertain whether the results of CD8β down-modulation were related, or not, with the expression levels of any of the CD8β mRNA isoforms described. For that, we performed qPCR using specific primers designed to amplify the six described CD8β mRNAs isoforms (Figure 3; Supplementary Table 2): four membrane-anchored (M-1, M-2, M-3 and M-4) and two secreted (S-1 and S-2) in CD8+ Tn cells before and after activation with IL-15 (see Figure 3A for exons’ nomenclature and for visualization of primers location). As summarized in Figure 3B, the mRNA levels of the isoforms M-1 and M-2 were significantly increased in IL-15-activated CD8+ T cells (p<0.05). In marked contrast, the mRNA level for the M-4 isoform was significantly decreased (p<0.001). Although the mRNA for the M-3 isoform was also decreased, it did not reach statistical significance. Interestingly, we detected the two soluble isoforms described earlier (S-1 and S-2), with the mRNA of the former being significantly decreased (p<0.05). Also illustrated in Figure 3 are the mRNA levels for all CD8β isoforms, which remained constant, and the mRNA levels for the CD8α chain, which was significantly increased in IL-15 activated CD8+ Tn cells (p<0.05), in accordance with the results of cell surface CD8α expression (see Supplementary Figure 3 for a representative gel).
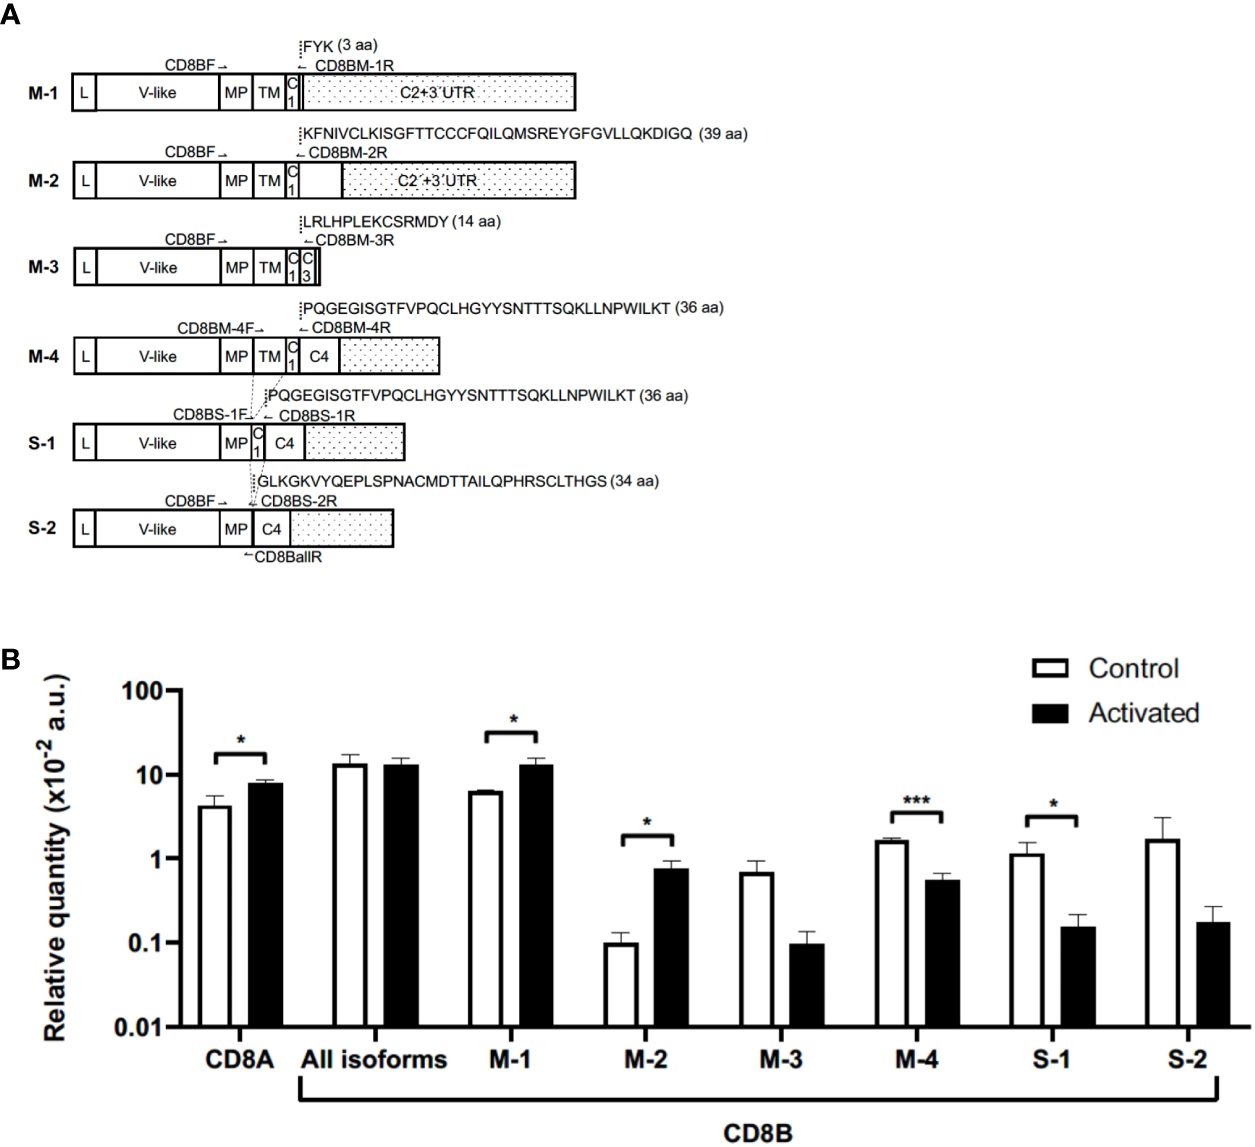
Figure 3 Expression of CD8A and CD8B genes in naïve CD8+ T cells before and after culture with IL-15. (A) Schematic representation of CD8B studied isoforms, the location of primers used for qPCR, and respective unique C-terminal amino acid sequences. White squares and doted squares represent exons and 3’UTR, respectively. For more information about CD8B isoforms see Supplementary Table 2; Figure 3. (B) Relative mRNA expression levels normalized to the geometric mean of two reference genes (GAPDH and RPS18S) multiplied by 100. Graphed qPCR data represents the mean relative quantity of four experiments ± SEM in naïve CD8+ T cells before (Control) and after (Activated) culture with IL-15 for 12 days. *p<0.05; ***p<0.001, Mann-Whitney U test. aa, amino acids; a.u., arbitrary units; C, Cytoplasmic; IgV-like, Immunoglobulin V-like; L, Leader peptide; MP, membrane proximal; TM, transmembrane; UTR, untranslated region;.
IL-15 increases the amount of Lck in IL-15-activated CD8+ T cells
Considering the importance of the tyrosine kinase Lck in the transmission of intracellular activation signals in human CD8+ T cells, we wanted to ascertain if the levels of total Lck changed between freshly isolated CD8+ T cells and differentiated CD8+ T cells after 12 days in culture with IL-15. By using total CD8+ T cells, an increase in the amount of Lck, as determined by the mean fluorescence intensity (MFI), was consistently observed between resting CD8+ T cells at day 0 and CD8+ T cell blasts at day 12 in all the experiments performed (compare Figures 4A, B). As shown in Figure 4C, on average, the MFI values of Lck observed between CD8+ T cells at day 0 and CD8+ T cell blasts at day 12 increased by 4.5-fold (10728 ± 996 vs. 45739 ± 3778, mean ± SEM, p=0.001). Kinetic studies at day 0, 6 and 12, showed a time-dependent increase in Lck expression, as determined by MFI values, from day 0, to day 6, to day 12 (13078 vs.16846 vs. 47133, respectively). Next, we performed an analysis of Lck expression in CD8+ T cells according to their dividing status, that is CD8+ T cells at day 0 (resting cells, RC), CD8+ T cells that survived the 12-day culture with IL-15 but did not divide (non-dividing cells, NDC), and CD8+ T cells that entered successive cycles of cell division (dividing cells, DC). As shown in Figure 4D, the analysis showed that there was a gradual increase in the amount of Lck, as determined by the MFI values, from RC to NDC (10708 vs 33299, p=0.013, n=5) and from NDC to DC (33299 vs. 45739, p=0.002, n=5).
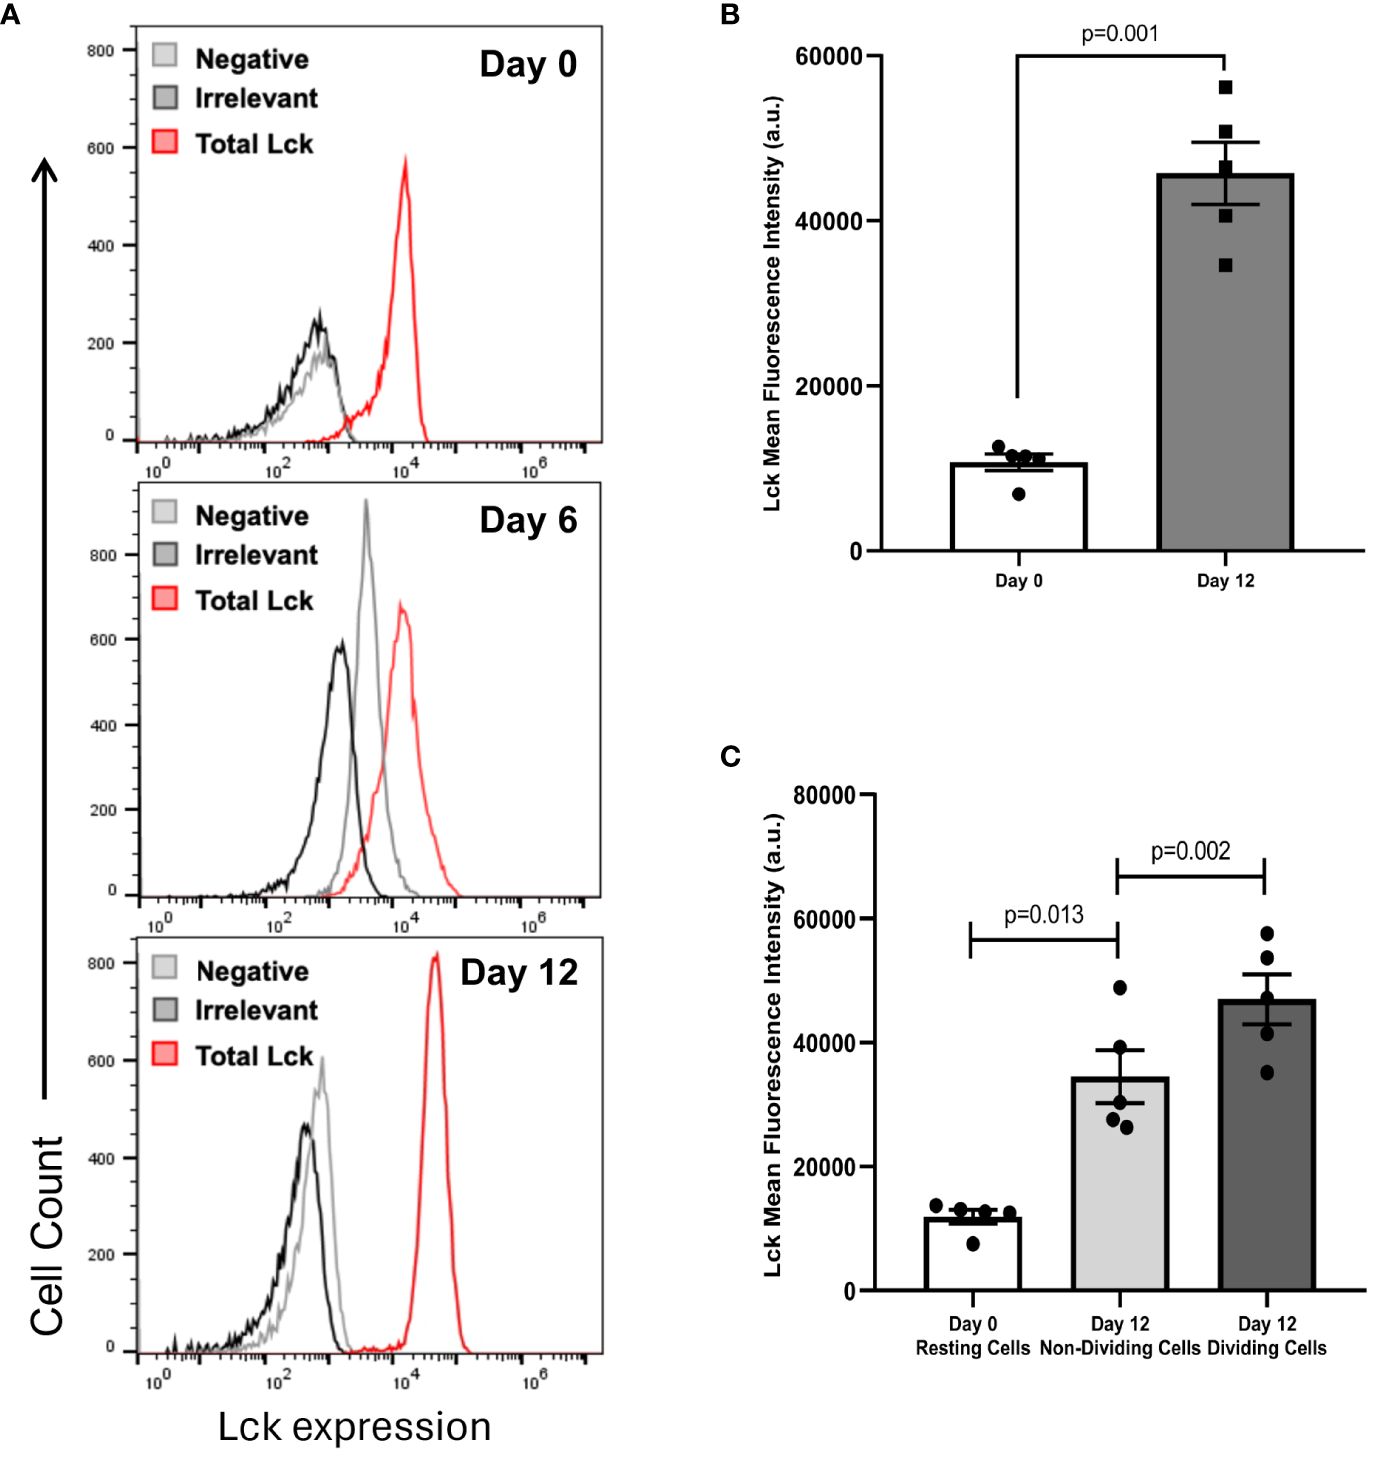
Figure 4 IL-15 increases the amount of total Lck in CD8+ T cells. PBMC were isolated as described in the legend of Figure 1. Total CD8+ T cells were purified using negative selection kits, labeled with CFSE and cultured with IL-15 (10 ng/mL) for 12 days. Approximately 0.5×10⁶ CD8+ T cells at day 0 and at day 12 were stained using fluorochrome-conjugated antibodies against CD3 and CD8α, or CD3 and CD8β. Then, labeled CD8+ T cells were fixed, permeabilized and incubated with fluorochrome-conjugated antibodies against total Lck and irrelevant IgG, as indicated in Materials and Methods, and acquired in a BD Accuri C6 flow cytometer. (A) Representative histograms showing the fluorescence emission in freshly isolated CD8+ T cells after incubation with anti-Lck, irrelevant IgG, or none at day 0, 6 and 12. (B) Graph showing the amount of total Lck, as determined by the MFI values obtained after subtracting background fluorescence obtained with the irrelevant IgG, at day 0, 6 and 12. Data are presented as the mean±SEM; n=5. Paired samples T-test was used to assess the significance of the differences in MFI values between days 0 and 12. (C) Graph showing the amount of total Lck, as determined by the MFI values obtained after subtracting background fluorescence obtained with the irrelevant IgG, at days 0 (Resting Cells), 12 (Non-Dividing Cells) and 12 (Dividing Cells). Data are presented as the mean±SEM; n=5. Paired samples T-test was used to assess the significance of the differences in MFI values between days 0 and 12.
Discussion
Apart from initial reports describing the expression of CD8β in human T cells (13, 14, 26–30), studies examining factors and molecular mechanisms regulating the expression of the CD8αβ receptor in humans are scarce. Thus, with the exception of one study using retrovirally transduced peripheral blood cells and cell lines that showed a Nef-mediated down-modulation of the CD8β chain (31), most other studies in humans have been performed with ex vivo blood lymphocytes from healthy blood donors (4, 5, 32), diseased patients (33–35), and virus-infected patients (6, 7). More recently, we have shown that the frequency of CD3+CD8βlow T cells in peripheral blood of elderly people with cognitive impairment is decreased when compared to age-matched people without cognitive impairment, suggesting a possible protective role for CD3+CD8βlow T cells against cognitive decline and neurodegeneration (34). Importantly, some of these studies showed that down-modulation or absence of the CD8β chain was associated with the generation of CD8+ T cells with an effector-memory phenotype, and defined by lack of CD28, and expression of CD8αα homodimers, perforin, granzymes, and IFN-γ (4–6, 32).
Our work has extended these studies allowing us to conclude that in vitro, IL-15 is a novel factor that contributes to the formation of a pool of conventional CD8αα T cells. Intriguingly, the decrease in the expression of total CD8β protein on the surface and that results in the generation of a pool of CD8αα T cells was not paralleled by a decrease in total mRNA (all isoforms). Therefore, in principle, the cell surface CD8β decrease cannot be explained solely by the IL-15-induced decrease of the M-4 isoform, unless there is some sort of mechanism where one of the mRNA forms is less stable or is less efficiently translated into protein. In that regard, the M-2 protein isoform has been shown to be ubiquitinylated, which directs the CD8β protein to the lysosomal compartment where it can be degraded (15). Thus, it is a likely possibility that the marked increase in mRNA for the M-2 isoform does not result in a net increase in CD8β protein at the plasma membrane. Nevertheless, these results show for the first time that IL-15 is a key cytokine that, in vitro, prompts the generation of conventional human CD8αβlow and CD8αα T cells previously reported, like CD8+ Temra cells, to exist in vivo (5, 6, 21). These results also reinforce the notion that IL-15 is a key cytokine that is capable of pushing naïve CD8+ T cells toward a more differentiated functional phenotype, characterized by loss of naïve cell surface receptors and de novo expression of NK-like receptors, as demonstrated by several groups, including ours (19, 36, 37). Interestingly, in the latter work, a significant decrease in the expression of the CD8β gene in CD8+ TEMRA cells when compared to CD8+ TN (-2,45-fold, p=0.000024, ANOVA) was found, which may be an indication that a pool of CD8+ TEMRA cells found in peripheral blood may actually contain CD8αα+αβlow and/or CD8αα+αβ– (37).
Importantly, our results have shown that even the CFSE halving between CD8αβlow and CD8αα is comparable, their CD8β expression are different, i.e., the latter population has completely lost CD8β expression. In our view, in vitro IL-15-activated naïve CD8+ T cells enter successive cycles of cell division and, at some point around the 5th to 6th cycle the dividing CD8+ T cells start to diminish CD8β chain, with a sizeable fraction of these CD8+ T cells losing completely expression. One possibility explaining this novel result is that a subset of the most dividing CD8+ T cells is more susceptible to the epigenetic modifications induced by IL-15 signaling and result in the silencing the gene(s) coding for the CD8β chain(s). This view is not unlikely since a recent study has shown that IL- 15, via STAT3 and STAT5 signaling, mediated silencing of Epstein-Barr Nuclear Antigens (EBNA) via epigenetic effects (38).
The novel findings reported in this study are important because recent studies have identified innate-like CD8αα T cells endowed with Treg functions and capable of controlling effector T cell responses in human peripheral blood (39), suggesting that expression of CD8αα homodimers, besides being a feature of expanded effector-memory CD8+ Temra cells, endows these CD8+ T cells with regulatory functions. Thus, in mice models, CD8αα receptors induce the expression of pro-survival molecules such as IL-7Rα and Bcl-2 (40). CD8αα receptors have also been proposed as repressors that negatively regulate CD8+ T cell activation (41), which is compatible with their pro-survival function. Moreover, a predominant expression of CD8αα homodimers by IL-15-induced CD8αβ− T cells may favor preferential cis-interactions with other receptors expressed by effector-memory CD8+ T cells, including KIR3DL1 (42), MHC class I molecules (43) and β2m-free heavy MHC class I chains, also known as open MHC-I conformers (44–46). In either case, the cis-interactions would regulate the CD8+ T cell responses.
Importantly, we have also shown that IL-15-activated CD8+ T cells markedly augmented the amount of the total amount of the tyrosine kinase Lck. In view of recent data by the Gascoigne group showing that free Lck is more active than the fraction of CD8α-bound Lck (47), these results may have implications at the signaling and responsive levels of the differentiated CD8αα T cells. Based on our results and the existing experimental data, it can be proposed a scenario where the CD8αα+αβlow and CD8αα+αβ− T cells would be, like CD8+ Temra cells, less responsive to TCR-mediated signals, an issue that warrants further investigations. In any case, this work highlights the fact that the capacity of IL-15 to induce CD8+CD28- Temra cells in vitro and in vivo cannot be dissociated from the loss of the CD8β chain. In summary, these are novel findings that may have physiological relevance in settings where the plasma and tissue levels of IL-15 are increased. These settings include hematologic and solid tumors, autoimmune diseases, HIV infection, neurodegenerative disorders, and also exercise training in healthy subjects (48–53). In the latter situation, an inverse relationship between IL-15 and adipose tissue mass indexes was observed, suggesting that IL-15 has beneficial metabolic activities in obesity and type 2 diabetes. Whether these beneficial effects are mediated by CD8+ Temra and/or CD8αα T cells are issues that warrant further investigations.
Data availability statement
The original contributions presented in the study are included in the article/Supplementary Material. Further inquiries can be directed to the corresponding author.
Ethics statement
The studies involving humans were approved by Ethics Committee of the University of Beira Interior (Ref. Number CE-UBI-Pj-2017-012). The studies were conducted in accordance with the local legislation and institutional requirements. The participants provided their written informed consent to participate in this study.
Author contributions
FA conceived the study, analyzed data, and wrote the manuscript; AE performed experiments, analyzed data and wrote the manuscript; DR-F performed experiments, analyzed data and reviewed the manuscript; EC analyzed data, performed statistical analysis, and reviewed the manuscript. MU and SW supervised experiments performed in Düsseldorf and reviewed the manuscript. All authors contributed to the article and approved the submitted version.
Funding
This work was supported by funds from the CICS-UBI base grant with DOI 10.54499/UIDB/00709/2020 (https://doi.org/10.54499/UIDB/00709/2020) and the CICS-UBI programmatic grant with DOI 10.54499/UIDP/00709/2020 (https://doi.org/10.54499/UIDP/00709/2020) with national funds registered in the budget of the Foundation for Science and Technology (FA and EC), and by the Deutsche Forschungsgemeinschaft (DFG, German Research Foundation) a project number 514891263 (MU) and the Deutsche Krebshilfe (German Cancer Aid) - project number 70114812 (MU). AE is supported by a PhD scholarship (UI/BD/151022/2021) with DOI 10.54499/UI/BD/151022/2021 (https://doi.org/10.54499/UI/BD/151022/2021) financed by FCT through FSE (Fundo Social Europeu).
Acknowledgments
The authors like to thank the personnel of Centro de Sangue e da Transplantação de Coimbra (CST-C, Portugal) and the Blutspendezentrale at the University Hospital Düsseldorf University Hospital (Germany) for kindly providing buffy coats from regular healthy blood donors used in this study. We also thank Dr. Alexandre Carmo (i3S/IBMC, Porto) for critical reading of the manuscript. The authors would also like to thank Katharina Raba (Flow Cytometry Core Facility, Institute for Transplantation Diagnostics and Cell Therapeutics, Düsseldorf) for instrument maintenance, antibody panel design and technical support, and Dr. Wiebke Moskorz (Institute of Virology, Düsseldorf) for providing the CD197 (CCR7) Alexa Fluor® 700 antibody used in this work. The participation of Dr. Diogo Ferreira in an initial phase of the project is also acknowledged.
Conflict of interest
The authors declare that the research was conducted in the absence of any commercial or financial relationships that could be construed as a potential conflict of interest.
Publisher’s note
All claims expressed in this article are solely those of the authors and do not necessarily represent those of their affiliated organizations, or those of the publisher, the editors and the reviewers. Any product that may be evaluated in this article, or claim that may be made by its manufacturer, is not guaranteed or endorsed by the publisher.
Supplementary material
The Supplementary Material for this article can be found online at: https://www.frontiersin.org/articles/10.3389/fimmu.2024.1252439/full#supplementary-material
Supplementary Figure 1 | Quantification of cell divisions. Representative dot-plot of CFSE fluorescence halving (X axis) vs. CD8β expression (Y axis) relative to one representative experiment and illustrating how the regions were created electronically to determine the mean fluorescence intensity (MFI) values in each cycle of cell division, as indicated in the Material and Methods.
Supplementary Figure 2 | Effect of IL-15 on CD8β expression in bulk CD8+ T cells. Total CD8+ T cells were isolated by using negative isolation kits and cell cultured for 12 days in the presence of IL-15 as indicated in the legend of Figure 2. At the end of the culture, cells were harvested, washed, and approximately 0.5×10⁶ cells were stained with fluorochrome-conjugated antibodies against CD3, CD8α, and CD8β and acquired in an Accuri C6 flow cytometer. An electronic region was created around CD3+CD8α+ blast cells, which were subsequently analyzed for CFSE fluorescence halving and vs. CD8β expression. Results from two experiments (A, B) are shown.
Supplementary Figure 3 | PCR products of selected gene transcripts. Photograph from a 2% (w/v) agarose gel from a representative sample of non-activated (CTR) and activated (ACT) naïve CD8+ T cells, showing the PCR bands of selected membrane CD8β isoforms (M-1, M-2, M-4), all CD8β, CD8α and the two reference genes (GAPDH and RPS18) used. On the left it is shown the molecular wight markers (MWM).
References
1. Sallusto F, Geginat J, Lanzavecchia A. Central memory and effector memory T cell subsets: function, generation, and maintenance. Annu Rev Immunol. (2004) 22:745–63. doi: 10.1146/annurev.immunol.22.012703.104702
2. Henson SM, Riddell NE, Akbar AN. Properties of end-stage human T cells defined by CD45RA re-expression. Curr Opin Immunol. (2012) 24:476–81. doi: 10.1016/j.coi.2012.04.001
3. Arosa FA, Esgalhado AJ, Padrão CA, Cardoso EM. Divide, conquer, and sense: CD8+CD28- T cells in perspective. Front Immunol. (2017) 7:665. doi: 10.3389/fimmu.2016.00665
4. Werwitzke S, Tiede A, Drescher BE, Schmidt RE, Witte T. CD8beta/CD28 expression defines functionally distinct populations of peripheral blood T lymphocytes. Clin Exp Immunol. (2003) 133:334–43. doi: 10.1046/j.1365-2249.2003.02226.x
5. Konno A, Okada K, Mizuno K, Nishida M, Nagaoki S, Toma T, et al. CD8αα memory effector T cells descend directly from clonally expanded CD8α+βhigh TCRαβ T cells in vivo. Blood. (2002) 100:4090–97. doi: 10.1182/blood-2002-04-1136
6. Walker LJ, Marrinan E, Muenchhoff M, Ferguson J, Kloverpris H, Cheroutre H, et al. CD8αα+ Expression marks terminally differentiated human CD8+ T cells expanded in chronic viral infection. Front Immunol. (2013) 4:223. doi: 10.3389/fimmu.2013.00223
7. Schmitz JE, Forman MA, Lifton MA, Concepción O, Reimann KA Jr, Crumpacker CS, et al. Expression of the CD8alpha beta-heterodimer on CD8(+) T lymphocytes in peripheral blood lymphocytes of human immunodeficiency virus- and human immunodeficiency virus+ individuals. Blood. (1998) 92:198–206. doi: 10.1182/blood.V92.1.198.413k13_198_206
8. Wheeler CJ, Chen JY, Potter TA, Parnes JR. Mechanisms of CD8beta-mediated T cell response enhancement: interaction with MHC class I/beta2-microglobulin and functional coupling to TCR/CD3. J Immunol. (1998) 160:4199–207. doi: 10.4049/jimmunol.160.9.4199
9. Irie HY, Mong MS, Itano A, Crooks MEC, Littman DR, Burakoff SJ, et al. The cytoplasmic domain of CD8β Regulates lck kinase activation and CD8 T cell development. J Immunol. (1998) 161:183–91. doi: 10.4049/jimmunol.161.1.183
10. Witte T, Spoerl R, Chang HC. The CD8beta ectodomain contributes to the augmented coreceptor function of CD8alphabeta heterodimers relative to CD8alphaalpha homodimers. Cell Immunol. (1999) 191:90–6. doi: 10.1006/cimm.1998.1412
11. Arcaro A, Grégoire C, Bakker TR, Baldi L, Jordan M, Goffin L, et al. CD8β endows CD8 with efficient coreceptor function by coupling T cell receptor/CD3 to raft-associated CD8/p56lck complexes. J Exp Med. (2001) 194:1485–95. doi: 10.1084/jem.194.10.1485
12. Pang DJ, Hayday AC, Bijlmakers MJ. CD8 Raft localization is induced by its assembly into CD8alpha beta heterodimers, Not CD8alpha alpha homodimers. J Biol Chem. (2007) 282:13884–94. doi: 10.1074/jbc.M701027200
13. Nakayama K, Kawachi Y, Tokito S, Minami N, Yamamoto R, Imai T, et al. Recent duplication of the two human CD8 beta-chain genes. J Immunol. (1992) 148:1919–27. doi: 10.4049/jimmunol.148.6.1919
14. DiSanto JP, Smith D, De Bruin D, Lacy E, Flomenberg N. Transcriptional diversity at the duplicated human CD8 beta loci. Eur J Immunol. (1993) 23:320–6. doi: 10.1002/eji.1830230203
15. Thakral D, Dobbins J, Devine L, Kavathas PB. Differential expression of the human CD8beta splice variants and regulation of the M-2 isoform by ubiquitination. J Immunol. (2008) 180:7431–42. doi: 10.4049/jimmunol.180.11.7431
16. Thakral D, Coman MM, Bandyopadhyay A, Martin S, Riley JL, Kavathas PB. The human CD8β M-4 isoform dominant in effector memory T cells has distinct cytoplasmic motifs that confer unique properties. PloS One. (2013) 8:e59374. doi: 10.1371/journal.pone.0059374
17. Alves NL, Hooibrink B, Arosa FA, van Lier RA. IL-15 induces antigen-independent expansion and differentiation of human naïve CD8+ T cells. vitro Blood. (2003) 102:2541–6. doi: 10.1182/blood-2003-01-0183
18. Geginat J, Lanzavecchia A, Sallusto F. Proliferation and differentiation potential of human CD8+ memory T-cell subsets in response to antigen or homeostatic cytokines. Blood. (2003) 101:4260–6. doi: 10.1182/blood-2002-11-3577
19. Correia MP, Cardoso EM, Pereira CF, Neves R, Uhrberg M, Arosa FA. Hepatocytes and IL-15: a favorable microenvironment for T cell survival and CD8+ T cell differentiation. J Immunol. (2009) 182:6149–59. doi: 10.4049/jimmunol.0802470
20. Correia MP, Costa AV, Uhrberg M, Cardoso EM, Arosa FA. IL-15 induces CD8+ T cells to acquire functional NK receptors capable of modulating cytotoxicity and cytokine secretion. Immunobiology. (2011) 216:604–12. doi: 10.1016/j.imbio.2010.09.012
21. Younes SA, Freeman ML, Mudd JC, Shive CL, Reynaldi A, Panigrahi S, et al. IL-15 promotes activation and expansion of CD8+ T cells in HIV-1 infection. J Clin Invest. (2016) 126:2745–56. doi: 10.1172/JCI85996
22. Morris SR, Chen B, Mudd JC, Panigrahi S, Shive CL, Sieg SF, et al. Inflammescent CX3CR1+CD57+CD8+ T cells are generated and expanded by IL-15. JCI Insight. (2020) 5:e132963. doi: 10.1172/jci.insight.132963
23. Tang X, Kumar V. Advances in the study of CD8+ Regulatory T cells. Crit Rev Immunol. (2019) 39:409–21. doi: 10.1615/CritRevImmunol.2020033260
24. Esgalhado AJ, Reste-Ferreira D, Albino SE, Sousa A, Amaral AP, Martinho A, et al. CD45RA, CD8β, and IFN-γ Are potential immune biomarkers of human cognitive function. Front Immunol. (2020) 11:592656. doi: 10.3389/fimmu.2020.592656
25. Hellemans J, Mortier G, De Paepe A, Speleman F, Vandesompele J. qBase relative quantification framework and software for management and automated analysis of real-time quantitative PCR data. Genome Biol. (2007) 8:R19. doi: 10.1186/gb-2007-8-2-r19
26. Norment AM, Littman DR. A second subunit of CD8 is expressed in human T cells. EMBO J. (1988) 7:3433–9. doi: 10.1002/embj.1988.7.issue-11
27. Shiue L, Gorman SD, Parnes JR. A second chain of human CD8 is expressed on peripheral blood lymphocytes. J Exp Med. (1988) 168:1993–2005. doi: 10.1084/jem.168.6.1993
28. DiSanto JP, Knowles RW, Flomenberg N. The human Lyt-3 molecule requires CD8 for cell surface expression. EMBO J. (1988) 7:3465–70. doi: 10.1002/embj.1988.7.issue-11
29. Terry LA, DiSanto JP, Small TN, Flomenberg N. Differential expression and regulation of the human CD8 alpha and CD8 beta chains. Tissue Antigens. (1990) 35:82–91. doi: 10.1111/j.1399-0039.1990.tb01761.x
30. Moebius U, Kober G, Griscelli AL, Hercend T, Meuer SC. Expression of different CD8 isoforms on distinct human lymphocyte subpopulations. Eur J Immunol. (1991) 21:1793–800. doi: 10.1002/eji.1830210803
31. Stove V, Van de Walle I, Naessens E, Coene E, Stove C, Plum J, et al. Human immunodeficiency virus Nef induces rapid internalization of the T-cell coreceptor CD8alphabeta. J Virol. (2005) 79:11422–33. doi: 10.1128/JVI.79.17.11422-11433.2005
32. Azuma M, Phillips JH, Lanier LL. CD28- T lymphocytes. Antigenic and functional properties. J Immunol. (1993) 150:1147–59. doi: 10.4049/jimmunol.150.4.1147
33. Kawabata K, Nagasawa M, Morio T, Okawa H, Yata J. Decreased alpha/beta heterodimer among CD8 molecules of peripheral blood T cells in Wiskott-Aldrich syndrome. Clin Immunol Immunopathol. (1996) 81:129–35. doi: 10.1006/clin.1996.0168
34. Werwitzke S, Drescher B, Schmidt RE, Witte T. CD8+ T cell populations in common variable immunodeficiency. Immunobiology. (2000) 202:168–71. doi: 10.1016/S0171-2985(00)80062-5
35. Werwitzke S, Tiede A, Jacobs R, Zielinska-Skowronek M, Buyny S, Schmidt RE, et al. CD8alpha+beta(low) effector T cells in systemic lupus erythematosus. Scand J Immunol. (2008) 67:501–8. doi: 10.1111/j.1365-3083.2008.02093.x
36. Meresse B, Chen Z, Ciszewski C, Tretiakova M, Bhagat G, Krausz TN, et al. Coordinated induction by IL15 of a TCR-independent NKG2D signaling pathway converts CTL into lymphokine-activated killer cells in celiac disease. Immunity. (2004) 21:357–66. doi: 10.1016/j.immuni.2004.06.020
37. Pereira BI, De Maeyer RPH, Covre LP, Nehar-Belaid D, Lanna A, Ward S, et al. Sestrins induce natural killer function in senescent-like CD8+ T cells. Nat Immunol. (2020) 21:684–94. doi: 10.1038/s41590-020-0643-3
38. Liao Y, Yan J, Beri NR, Roth LG, Cesarman E, Gewurz BE. Germinal center cytokines driven epigenetic control of Epstein-Barr virus latency gene expression. PloS Pathog. (2024) 20:e1011939. doi: 10.1371/journal.ppat.1011939
39. Sheng H, Marrero I, Maricic I, Fanchiang SS, Zhang S, Sant'Angelo DB, et al. Distinct PLZF+CD8αα+ Unconventional T cells enriched in liver use a cytotoxic mechanism to limit autoimmunity. J Immunol. (2019) 203:2150–62. doi: 10.4049/jimmunol.1900832
40. Romero P, Cerottini JC, Luescher I. On the significance of CD8 alpha expression for T cell memory. Eur J Immunol. (2005) 35:3092–4. doi: 10.1002/eji.200535516
41. Cheroutre H, Lambolez F. Doubting the TCR coreceptor function of CD8alphaalpha. Immunity. (2008) 28:149–59. doi: 10.1016/j.immuni.2008.01.005
42. Geng J, Raghavan M. CD8αα homodimers function as a coreceptor for KIR3DL1. Proc Natl Acad Sci USA. (2019) 116:17951–6. doi: 10.1073/pnas.1905943116
43. Liu Y, Cuendet MA, Goffin L, Šachl R, Cebecauer M, Cariolato L, et al. CD8 Binding of MHC-Peptide Complexes in cis or trans Regulates CD8+ T-cell Responses. J Mol Biol. (2019) 431:4941–58. doi: 10.1016/j.jmb.2019.10.019
44. Jelonek MT, Classon BJ, Hudson PJ, Margulies DH. Direct binding of the MHC class I molecule H-2Ld to CD8: interaction with the amino terminus of a mature cell surface protein. J Immunol. (1998) 160:2809–14. doi: 10.4049/jimmunol.160.6.2809
45. Santos SG, Powis SJ, Arosa FA. Misfolding of major histocompatibility complex class I molecules in activated T cells allows cis-interactions with receptors and signaling molecules and is associated with tyrosine phosphorylation. J Biol Chem. (2004) 279:53062–70. doi: 10.1074/jbc.M408794200
46. Arosa FA, Esgalhado AJ, Reste-Ferreira D, Cardoso EM. Open MHC class I conformers: A look through the looking glass. Int J Mol Sci. (2021) 22:9738. doi: 10.3390/ijms22189738
47. Wei Q, Brzostek J, Sankaran S, Casas J, Hew LS, Yap J, et al. Lck bound to coreceptor is less active than free Lck. Proc Natl Acad Sci USA. (2020) 117:15809–17. doi: 10.1073/pnas.1913334117
48. Sindaco P, Pandey H, Isabelle C, Chakravarti N, Brammer JE, Porcu P, et al. The role of interleukin-15 in the development and treatment of hematological Malignancies. Front Immunol. (2023) 14:1141208. doi: 10.3389/fimmu.2023.1141208
49. Waldmann TA. The biology of IL-15: implications for cancer therapy and the treatment of autoimmune disorders. J Investig Dermatol Symp Proc. (2013) 16:S28–30. doi: 10.1038/jidsymp.2013.8
50. Nasi A, Chiodi F. Mechanisms regulating expansion of CD8+ T cells during HIV-1 infection. J Intern Med. (2018) 283:257–67. doi: 10.1111/joim.12722
51. Janelidze S, Mattsson N, Stomrud E, Lindberg O, Palmqvist S, Zetterberg H, et al. CSF biomarkers of neuroinflammation and cerebrovascular dysfunction in early Alzheimer disease. Neurology. (2018) 91:e867–77. doi: 10.1212/WNL.0000000000006082
52. Ye J. Beneficial metabolic activities of inflammatory cytokine interleukin 15 in obesity and type 2 diabetes. Front Med. (2015) 9:139–45. doi: 10.1007/s11684-015-0377-z
Keywords: IL-15, naïve CD8+ T cells, effector-memory CD8+ T cells, CD8β chain, downregulation, CD8α chain
Citation: Esgalhado AJ, Reste-Ferreira D, Weinhold S, Uhrberg M, Cardoso EM and Arosa FA (2024) In vitro IL-15-activated human naïve CD8+ T cells down-modulate the CD8β chain and become CD8αα T cells. Front. Immunol. 15:1252439. doi: 10.3389/fimmu.2024.1252439
Received: 03 July 2023; Accepted: 21 May 2024;
Published: 05 June 2024.
Edited by:
Loretta Tuosto, Sapienza University of Rome, ItalyReviewed by:
Kamalakannan Rajasekaran, Genentech Inc., United StatesLaura Patrussi, University of Siena, Italy
Copyright © 2024 Esgalhado, Reste-Ferreira, Weinhold, Uhrberg, Cardoso and Arosa. This is an open-access article distributed under the terms of the Creative Commons Attribution License (CC BY). The use, distribution or reproduction in other forums is permitted, provided the original author(s) and the copyright owner(s) are credited and that the original publication in this journal is cited, in accordance with accepted academic practice. No use, distribution or reproduction is permitted which does not comply with these terms.
*Correspondence: Fernando A. Arosa, YXJvc2FAZmNzYXVkZS51YmkucHQ=