 Jung W. Choi1†
 Erin A. Dean2,3†Hong Lu4,5Zachary Thompson6Jin Qi4Gabe Krivenko2
 Michael D. Jain2Frederick L. Locke2*
 Yoganand Balagurunathan7*
- 1Department of Diagnostic Imaging and Interventional Radiology, H Lee Moffitt Cancer Center, Tampa, FL, United States
- 2Blood and Marrow Transplant and Cellular Immunotherapy, H. Lee. Moffitt Cancer Center, Tampa, FL, United States
- 3Division of Hematology and Oncology, University of Florida, Gainesville, FL, , United States
- 4Cancer Physiology, H. Lee. Moffitt Cancer Center, Tampa, FL, United States
- 5Tianjin Medical University Cancer Institute and Hospital, Tianjin, China
- 6Biostatistics & Bioinformatics, H. Lee. Moffitt Cancer Center, Tampa, FL, United States
- 7Machine Learning, H. Lee. Moffitt Cancer Center, Tampa, FL, United States
The Metabolic Tumor Volume (MTV) and Tumor Lesion Glycolysis (TLG) has been shown to be independent prognostic predictors for clinical outcome in Diffuse Large B-cell Lymphoma (DLBCL). However, definitions of these measurements have not been standardized, leading to many sources of variation, operator evaluation continues to be one major source. In this study, we propose a reader reproducibility study to evaluate computation of TMV (& TLG) metrics based on differences in lesion delineation. In the first approach, reader manually corrected regional boundaries after automated detection performed across the lesions in a body scan (Reader M using a manual process, or manual). The other reader used a semi-automated method of lesion identification, without any boundary modification (Reader A using a semi- automated process, or auto). Parameters for active lesion were kept the same, derived from standard uptake values (SUVs) over a 41% threshold. We systematically contrasted MTV & TLG differences between expert readers (Reader M & A). We find that MTVs computed by Readers M and A were both concordant between them (concordant correlation coefficient of 0.96) and independently prognostic with a P-value of 0.0001 and 0.0002 respectively for overall survival after treatment. Additionally, we find TLG for these reader approaches showed concordance (CCC of 0.96) and was prognostic for over -all survival (p ≤ 0.0001 for both). In conclusion, the semi-automated approach (Reader A) provides acceptable quantification & prognosis of tumor burden (MTV) and TLG in comparison to expert reader assisted measurement (Reader M) on PET/CT scans.
1 Introduction
Diffuse large B-cell Lymphoma (DLBCL) is the most frequently observed lymphoma subtype and accounts for about 40% of new cases of lymphoma. This aggressive form of lymphoma spreads systemically involving organs other than lymph nodes with a 5-year survival of about 64% for all patients that drops to 57% with distant metastases and further with risk factors such as age, lactate dehydrogenase (LDH) levels, disease stage, and patients’ performance status (1–3). Disease management of DLBCL can be a challenge due to heterogeneous disease characteristics and a poor prognosis when first line treatment fails. Advancements in Positive Emission Tomography (PET) imaging using 18F fluorodeoxyglucose (FDG) in lymphoma have allowed better disease staging, characterization (4, 5) and response assessment (6). Recent evolutions in the field have allowed adoption of PET combined with computed tomography (PET/CT) to become a standard for disease assessment (7, 8). There have been several studies that have shown utility in using PET/CT for response assessment in lymphoma (9–12). A clinical assessment of response includes a five-point scale (5-PS) to assess degree of response at mid to end treatment stages, based on qualitative experts evaluation of imaging scans (13). This was first recommended as a reporting criteria in the first PET workshop on Lymphoma in Deauville, France in 2009, and has been adopted in many clinical trials (14, 15). The continually improving resolution of imaging data has allowed development of alternative response measurement criteria (16). It has been well documented that interobserver biases in most widely used radiological lesion measurement, Response Evaluation Criteria in Solid Tumors (RECIST) criteria are influenced by several factors, such as scan quality, image resolution, training, and other minor factors (17, 18). In FDG/PET imaging, the standardized uptake value (SUV) has been successfully used as a measure of metabolic activity for disease diagnosis and therapy assessment, but suffers from inter-patient variability, intra-tumoral variability, and procedural related factors, which has led to a debate on the extent of its clinical usage (19). Recent developments of high-resolution imaging have allowed for the development of Metabolic Tumor Volume (MTV) and Total Lesion Glycolysis (TLG) as potential exploratory parameters for characterization that provides information about the 3D structure of the tumoral, tumor viability and its spatial variations (20–22). These metrics have been independently shown to be prognostic for treatment response in lymphoma after chemotherapy (23, 24). Recently, we demonstrated that MTV (on baseline patients) is prognostic for DLBCL treatment response to axicabtagene ciloleucel (axi-cel), a CD19 targeted Chimeric Antigen Receptor T cell (CAR-T) therapy when used as a third or later line of therapy (25). The MTV allows ensemble estimates of active tumor volume regions and its microenvironment. While the TLG provides an assessment of metabolic activity of the tumor, a valuable metric to assess gross level of active lesions, which is defined as a product of MTV and an average of standard uptake value (SUVmax), a fixed value threshold to identify metabolic tumor regions is still considered reliable (26). These metrics have not been standardized and the computation is influenced by several factors that include methods for delineation, assessing metabolic levels that has been well shown by many studies to evaluate reader agreements and variability, essential for clinical adoption (26–29).
In this study we propose to study the reader repeatability of MTV and TLG assessment with variations in approaches (Reader- A & M), in which one reader manually corrects tumor boundaries (Reader M), while the other reader would use semi-automated methods (Reader A). We contrast both approaches at various size ranges and assess the prognosis of patients after treatment of CAR-T immunotherapy. In this study we show use of semi-automated methods would allow faster evaluation of these metrics, essential for clinical adoption.
2 Material and methods
2.1 Patient cohort
The retrospective review of patient records was approved by the University of South Florida’s Institutional Review Board (IRB) for the research study. We accessed ninety-six Large B Cell Lymphoma (LBCL) patients with relapsed or refractory disease who received axi-cel treatment from May 2015 to June 2019, treated with the CAR T cell therapy, axicabtagene ciloleucel (axi-cel). Clinical outcomes based upon PET/CT scan derived MTV for the same cohort of patients was previously reported (25). The clinical records and imaging data (18F-FDG PET/CT scans) for the patients were obtained for the study. We assessed the baseline scans of these patients prior to the start of treatment. We abstracted patient records to obtain survival and vitals data. We evaluated the outcome variables as overall survival and progression free survival after treatment at 1 year. Some patients received bridging therapy during the manufacture of their CAR-T cells (process takes approximately 3 weeks), which we defined as any lymphoma specific therapy given after apheresis but prior to the start of fludarabine cyclophosphamide chemotherapy for lymphodepletion before CAR T-cell infusion. In our study about half our patients received bridge therapy (n=46). Details on our patient cohort used for the study is described in Table 1.
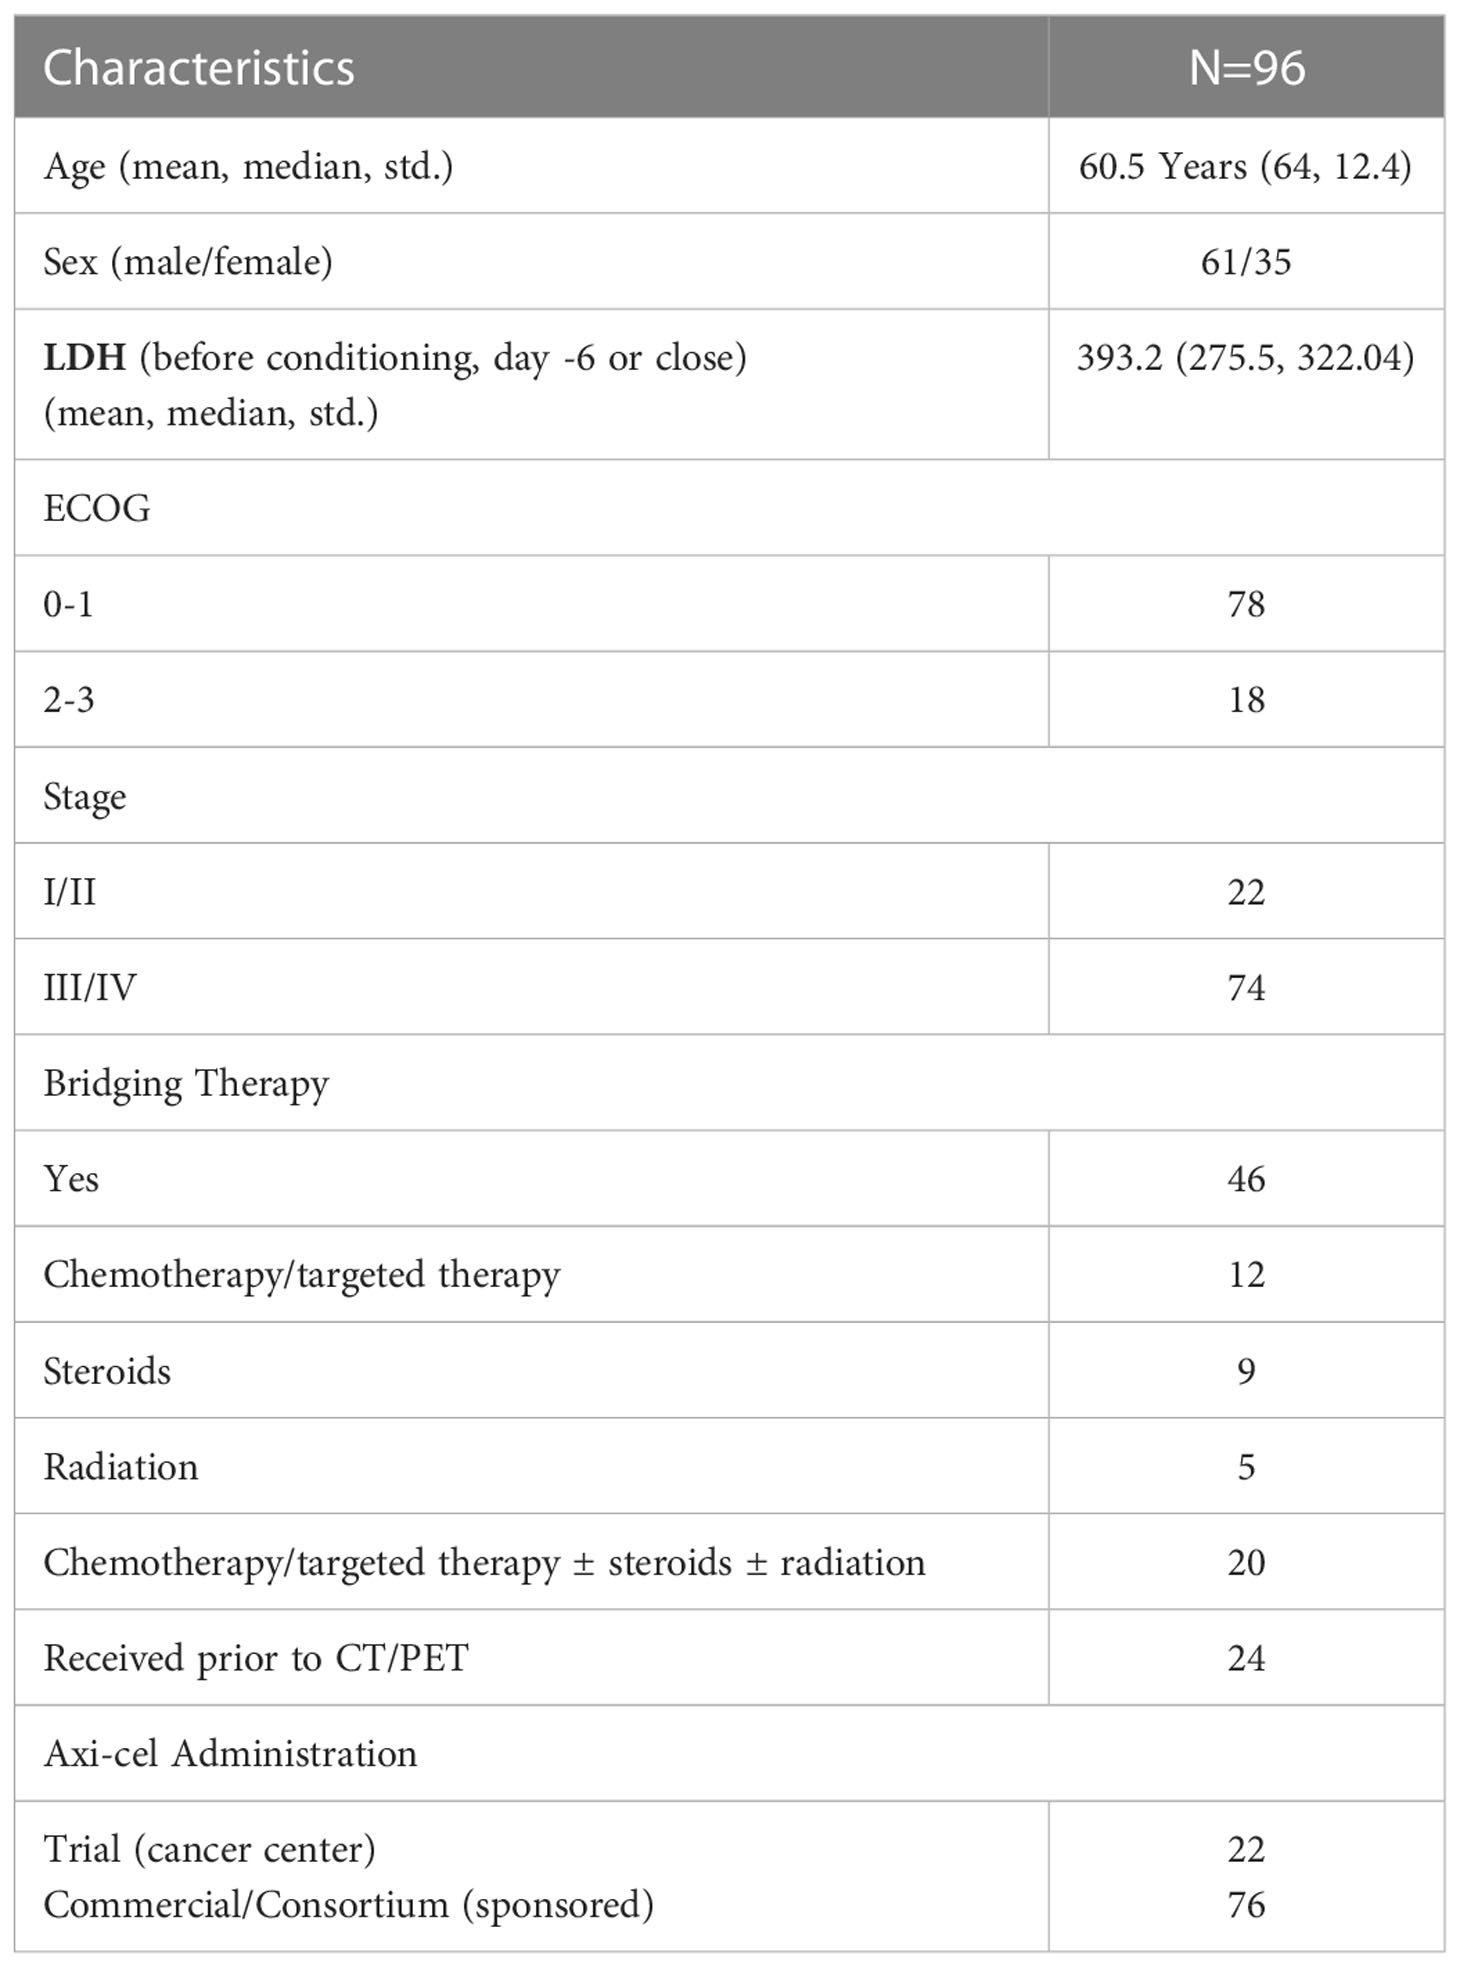
Table 1 Patient cohorts clinical characteristics at baseline.
2.2 Metabolic tumor burden and total lesion glycolysis
Patients baseline PET/CT whole body scans performed prior to axi-cel treatment were obtained to compute Metabolic Tumor Burden (MTV) and Total Lesions Glycolysis (TLG). We used custom tools implemented on MIM PACS (version 6.8.4, MIM Software, Cleveland, OH) to identify and compute the metrics. The custom workflow was used to identify abnormal regions in the scan with FDG metabolic activity over a predetermined level within an user identified volume in normal liver (mean volume around 13.9 ml). In our workflow, a reference region in the normal liver was located by a human expert using a single click. A fixed radius (3cm sphere) was placed at the selected liver region (single click) was used to estimate the baseline mean, with a detection threshold cutoff of 2 standard deviations over the mean liver as recommended by 18FDG-PET detection criteria (30–33) was used to identify abnormal regions.
The lesions were verified by the expert readers in the following ways; A) Reader -M, a medical oncology fellow (6 years of clinical experience), alter the regional boundaries based on uptake revealed on PET image. In some cases, Reader - M had the option to add new lesions that were not identified by threshold- based detection. Metrics measured using this regional boundary will be referred to as Reader M (or manual). The lesion boundary edits, any additional marking were overread by a research radiologist (HL or JQ) to be consistent with the clinical workflow. B) radiologists (JC & HL, JQ over 16 years, 10 years and 7 years of clinical experience, respectively), chose to accept or remove false detected lesions after automated detection, but did not alter the lesion boundaries, or add even if the detection method does not find the lesion boundary. Metrics measured using this regional boundary will be referred to as Reader – A (or auto).
In both approaches, physiologic uptake (false detections) were removed that could be in metabolically active, non-malignant organ sites (bladder, brain etc.) or other nonmalignant processes (e.g. degenerative disk disease or muscle activity). The readers assessed these lesions independently. The readers had access to clinical reports at the time of assessment but not to the lesions or its boundaries marked by the other reader. Figure 1 shows an example case with the readers’ assessment.
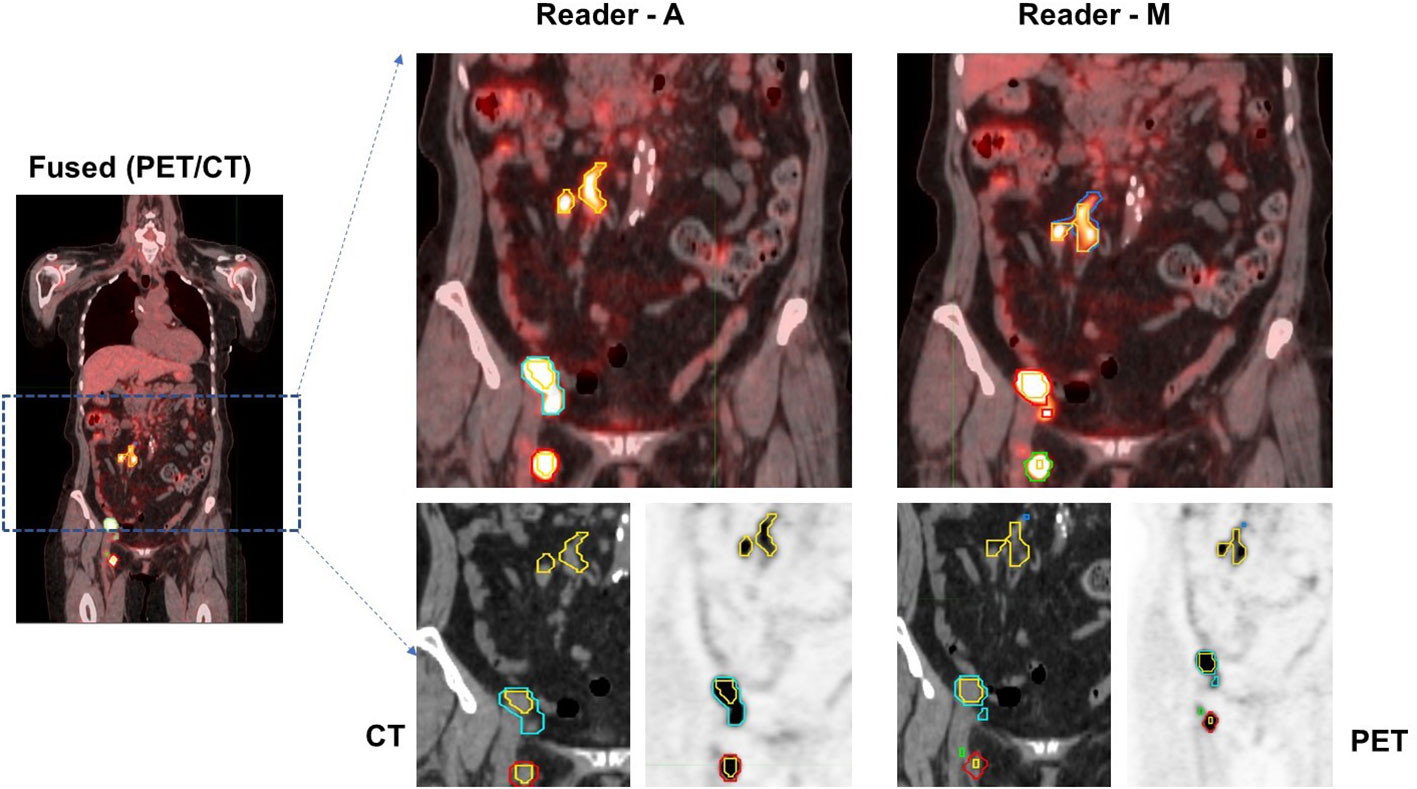
Figure 1 Patients image scan (PET/CT) with lesion delineation shown on a representative slice. Multiple boundaries for a lesion indicate original lesion segmentation (reader M and reader A) and corresponding 41% cut-point (inner boundary for a lesion). Lesions with overlapping regions (original and 41% cut-point) will show one boundary. In the example case, using Reader M’s approach, MTV was estimated to be 28.07 ml (TLG: 328.93 SUV*ml) while Reader A’s approach estimated MTV was 23.25 ml (TLG: 315.25 SUV*ml), with a difference of 17.2% in their MTV estimates.
The final lesion boundary was converged by combining voxels that are over the 41% of SUVmax at the individual lesion level. The cumulative sum of voxels across the lesions (over 41% SUV max) in the body scan are reported as Metabolic Tumor Volume. Total Lesion Glycolysis is defined as a product of MTV and an average SUVmax, which provides a measure of gross extent of tumor metabolic activity. We used workflows implemented in MIM (version 6.7, MIM software Inc) for MTV ad TLG computations. The expert evaluation would follow prior to TMV computation. The workflow tools are specific to MIM PACS and will be shared through the vendor.
2.3 Discordance in lesion identification
Identifying lesions using CT and PET scans have been shown to improve lesion detection in many clinical studies including lymphoma (34–36). The functional aspect of FDG-PET based imaging provides metabolic information of tumor regions used by the oncologist (37). There are many instances where lesions can be missed or wrongly assessed as an active lesion. We list below potential major reasons for discrepancy between clinical reader-based approaches (i.e., Reader M & A).
a. Metabolically active regions from normal physiology: It has been well documented that 18F-FDG is well absorbed by metabolically active organs that show up as tracer avid regions on PET images, such as the brain, heart, and bowel (37). The MIMS automated region selection algorithm does not discriminate between metabolically active organs and tumor, therefore in its current state it cannot be completely automated.
b. Inflammation related regions. For regions that have metabolic activity on imaging, one must exclude the possibility that the activity is secondary to a benign inflammatory process, as issues with accurate discrimination have been well acknowledged (38). A clinical radiologist may look for patterns of FDG uptake on the PET or fused PET/CT images, with comparison to tissue density and anatomy on the CT images.
2.4 Statistical analysis
The MTV and TLG metrics on the patient scan were computed following selections made by the two readers, with manual edits used by Reader M previously described (25) and semi-automated methods followed by Reader A. We compared the concordance between the approaches using concordance correlation coefficient which measures the deviation from the ideal mid-point (45-degrees line) between the value of the estimates, across the population (39). We used Altman-Bland’s plots to investigate the difference across the population (40). This approach elegantly compares two variables for agreements to understand the bias between the measurements by comparing the measurement means to the difference. The method provides analytical estimates to create confidence limits on the agreement or disagreements and allows identification of individual samples with these bounds. The analysis was repeated for various categories to identify confounders such as number of lesions in a patient scan between two readers.
Clinical outcomes for these patients after axi-cel CAR-T treatment was collected that include follow up scans and patients’ survival (vital status), performance status. The overall survival (OS) and progression free survival (PFS) were computed based on the time between axi-cel infusion until death or disease progression, or the last date the patient was contacted or known to be alive. Kaplan-Meier (KM) survival plots were drawn by dividing the population using MTV (or TLG) into two groups based on median value split for these individual estimates (high or low values of MTV or TLG). The significance of these cohort populations was assessed based on a log-rank statistical test. Hazard ratios (HRs) and 95% confidence intervals (CI) were reported. Cox regression analysis was performed for these variable estimates independently for manual and auto estimates of MTV & TLG to assess the risk factors of these assessments to survival time (OS) or progression (PFS). The KM plots and Cox regression models were repeated for these variable estimates using auto and manual approaches. The overall response rates including partial response (PR) and complete response (CR) to therapy were reported. The incidence of maximum cytokine release syndrome (CRS) was abstracted from the patients clinical records that use the standard assessment criteria (41). All the statistical analysis was performed using R studio packages (42).
3 Results
The clinical characteristics of the cohort used in the study are described in Table 1. About 47% of the study patients received bridging therapy after apheresis to collect cells for manufacture of axi-cel, but prior to start of lymphodepletion given prior to axi-cel. We obtained the baseline PET/CT scans and MTV and TLG were computed using two approaches (manual and auto). The MTV estimates showed a concordance correlation coefficient (CCC) of 0.963 between the estimates. Bland-Altman’s plot shows outliers (see Figure 2). We further divided the MTV metric into tertiles based on lesion volume (in ml), grouped into [1.7, < 41.3), [41.3 <259.8), [259.8, <1276.1) and the concordance between the Readers (M and A) for the groups were estimated to be 0.649, 0.927 and 0.882 for the respective groups. The cohort was further divided into tertiles based on the number of lesions (in each group, manual & auto). The group range was [≥1, < 4), [≥4, <11), [≥11, 91], and the concordance correlation between the Readers (1 & 2 or M & A) for the groups were 0.997, 0.974 and 0.92 (see Table 2a). The scatter plots show a visual comparison of the estimates between the readers (1 & 2 or M & A) and concordance lines (in black) with regression fit (in red) for these sub cohorts (Figure 3). The TLG metric showed a concordance of 0.965 between the readers (1 & 2 or A and M), see Figure 4. The tertile on TLG metrics had a range of [≥4.35, < 319), [≥319, < 2383), [≥2383, <21263), and these groups showed a concordance of 0.96, 0.45 and 0.97 respectively. When the cohort was divided into tertiles based on number of lesions, the ranges were [≥1, <4), [≥4, <11], [≥11, <91), the concordance between the readers (M & A) for these range were 0.96, 0.97 and 0.91 respectively, (see Table 2b). We compare the TLG estimates between concordance line (in black) with regression fit (in red) for these sub cohorts (Figure 5). A cox regression model was developed using MTV (univariate) & multivariable MTV, LDH and ECOG status in immunotherapy patients to assess risk to over-all survival after CART treatment. We find MTV shows increased hazard risk to over-all survival at 0.14% using Reader M’s estimate and 0.10% using Reader A’s estimate (for Univariate model). While the TLG -Reader M showed a risk of 0.008% and TLG-manual had a risk of 0.007% for over-all survival (see Table 3 and Supplementary Tables 1, 2). In this study, we used the median value of MTV estimates to divide the cohort and assessed their survival prognosis, the significance estimated using a log-rank test. Using MTV –(reader M) the p value was 0.0001 and using MTV –(reader A) the p-value was 0.0002 (see Figure 6). The KM plot cut point for reader 1 using MTV (reader M) was 86.75 mL, while reader using MTV (reader A) methods was 63.55 mL. The MTV metric showed significant prognostic difference for progression free survival, 1 year after CAR-T, as p-values were 0.0021 and 0.0088 for Reader M and A, respectively. The TLG estimate was used to divide the cohort based on median estimate and assess the significance using log-rank test. We estimated a p- value of 0.0001 for both TLG-Auto and TLG-manual (see Figure 7). MTV and TLG's significant prognosis for progression free survival (PFS) are shown in Figures 8, 9 respectively. The TLG metric showed significant prognosis for progression free survival (1 year after CAR T) with an estimated p-value using log rank test of 0.0016 and 0.00058 for readers M and A respectively. There were seven patients that showed difference in prognosis comparing inference between MTV (M & A) and TLG (M&A) in our cohort (see Table 4), with corresponding real patient PET/CT scan shown as an example (see Figure 10). Comparing the MTV (M &A) there were four patients switched between prognosis groups (see Table 4a). While comparing TLG (M & A), one patient switched prognosis groups (see Table 4b). While comparing MTV & TLG (both manual) there were five patients that switched prognosis grouping (see Table 4c). In MTV & TLG (both auto) there were four patients that switched prognosis (see Table 4d).
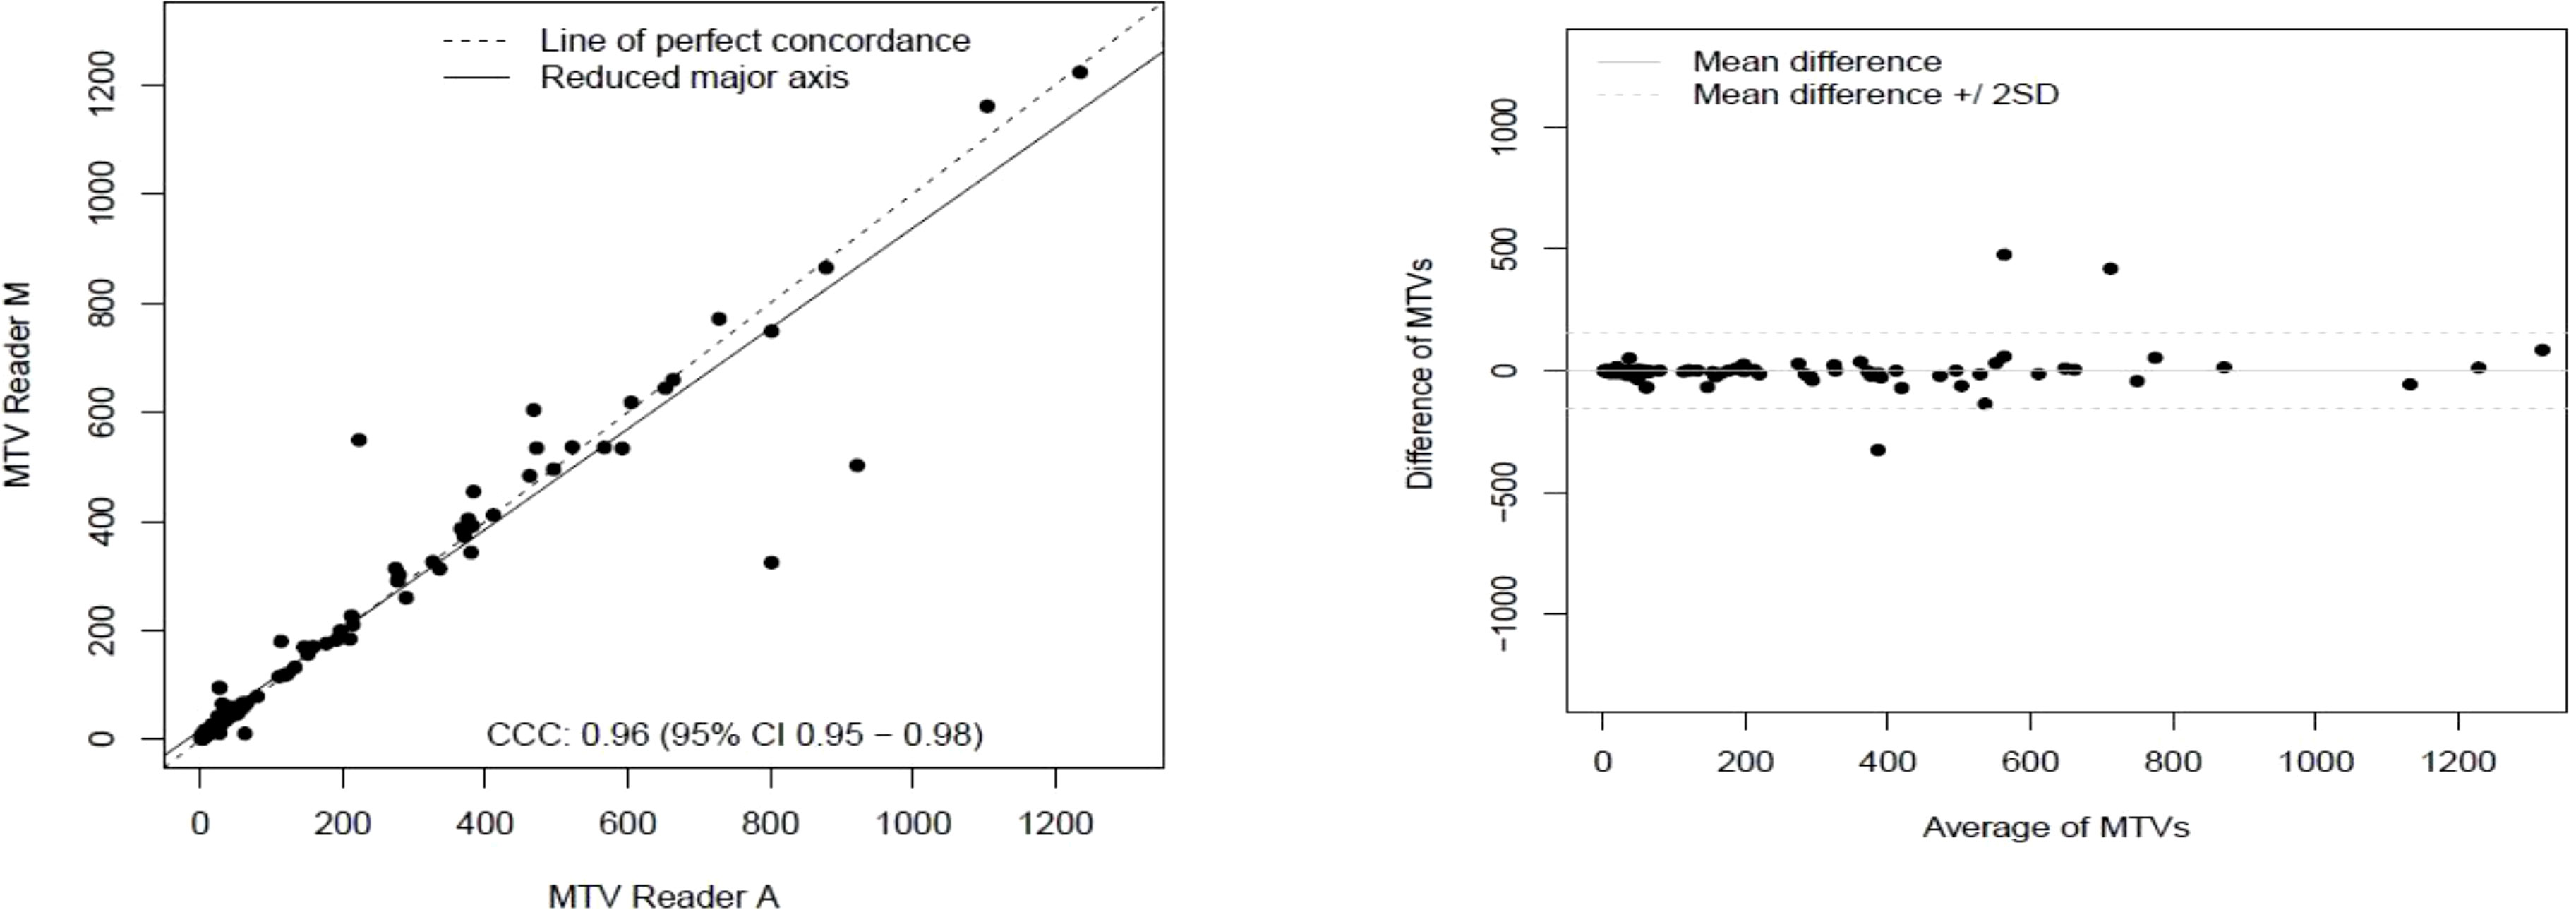
Figure 2 Comparison of estimates of metabolic tumor volume (MTV) between two readers (Reader A, Reader M) shown using a) scatter plots b) difference plots.
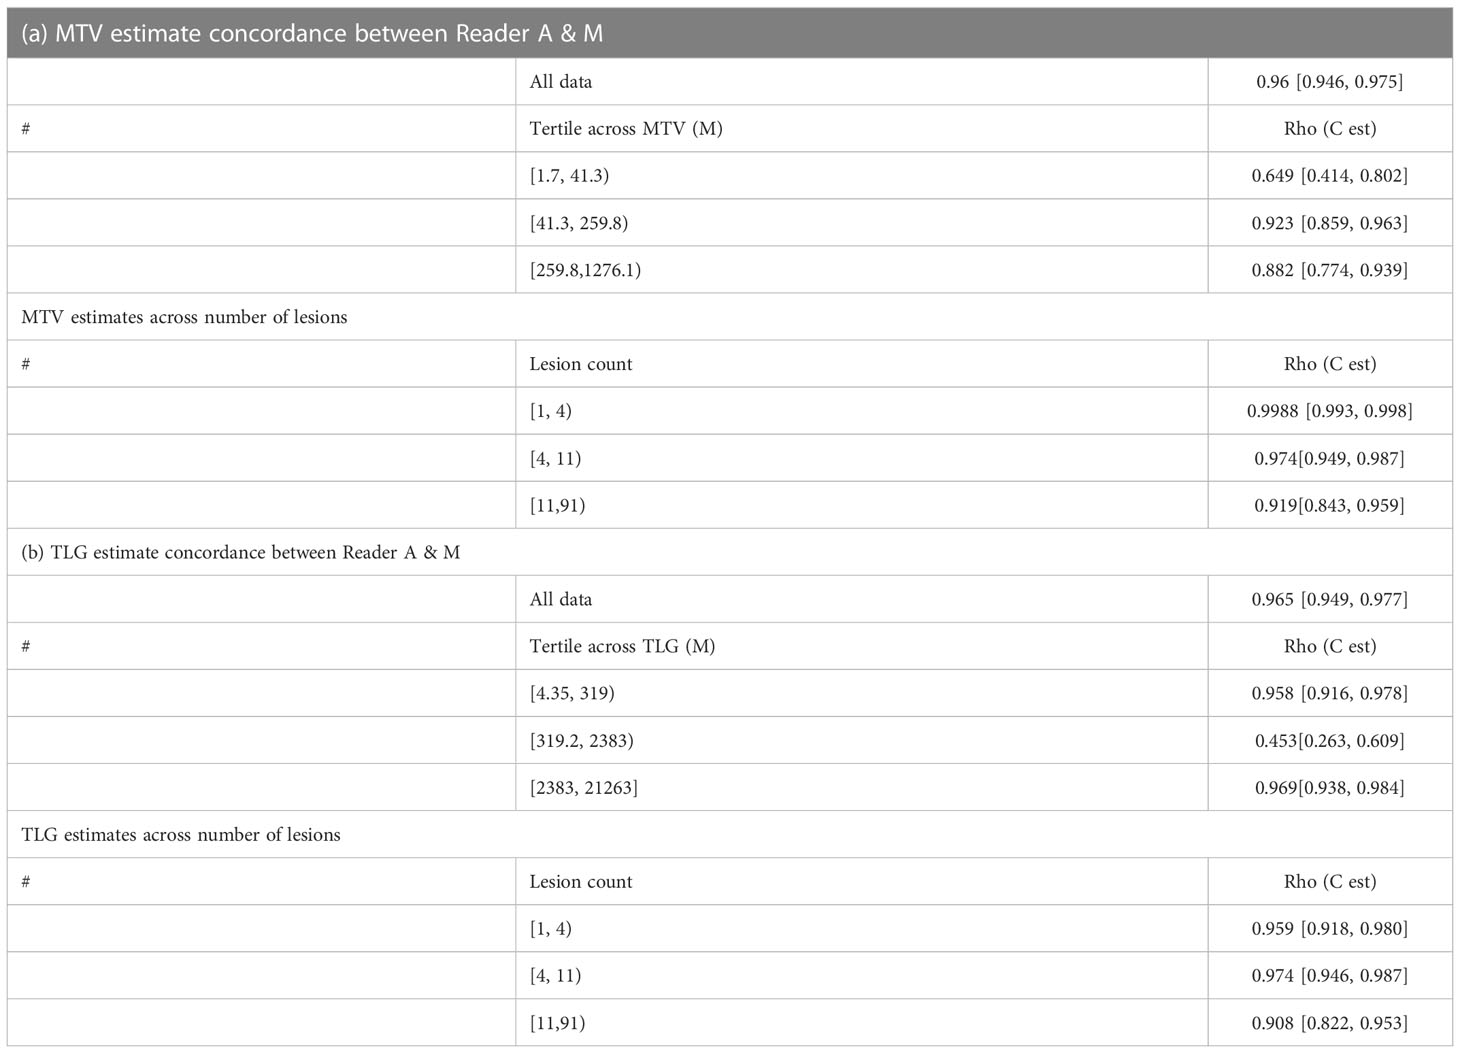
Table 2 Concordance between two approaches (manual and auto) for a) tumor metabolic burden (MTV) and b) total lesion glycolysis (TLG).
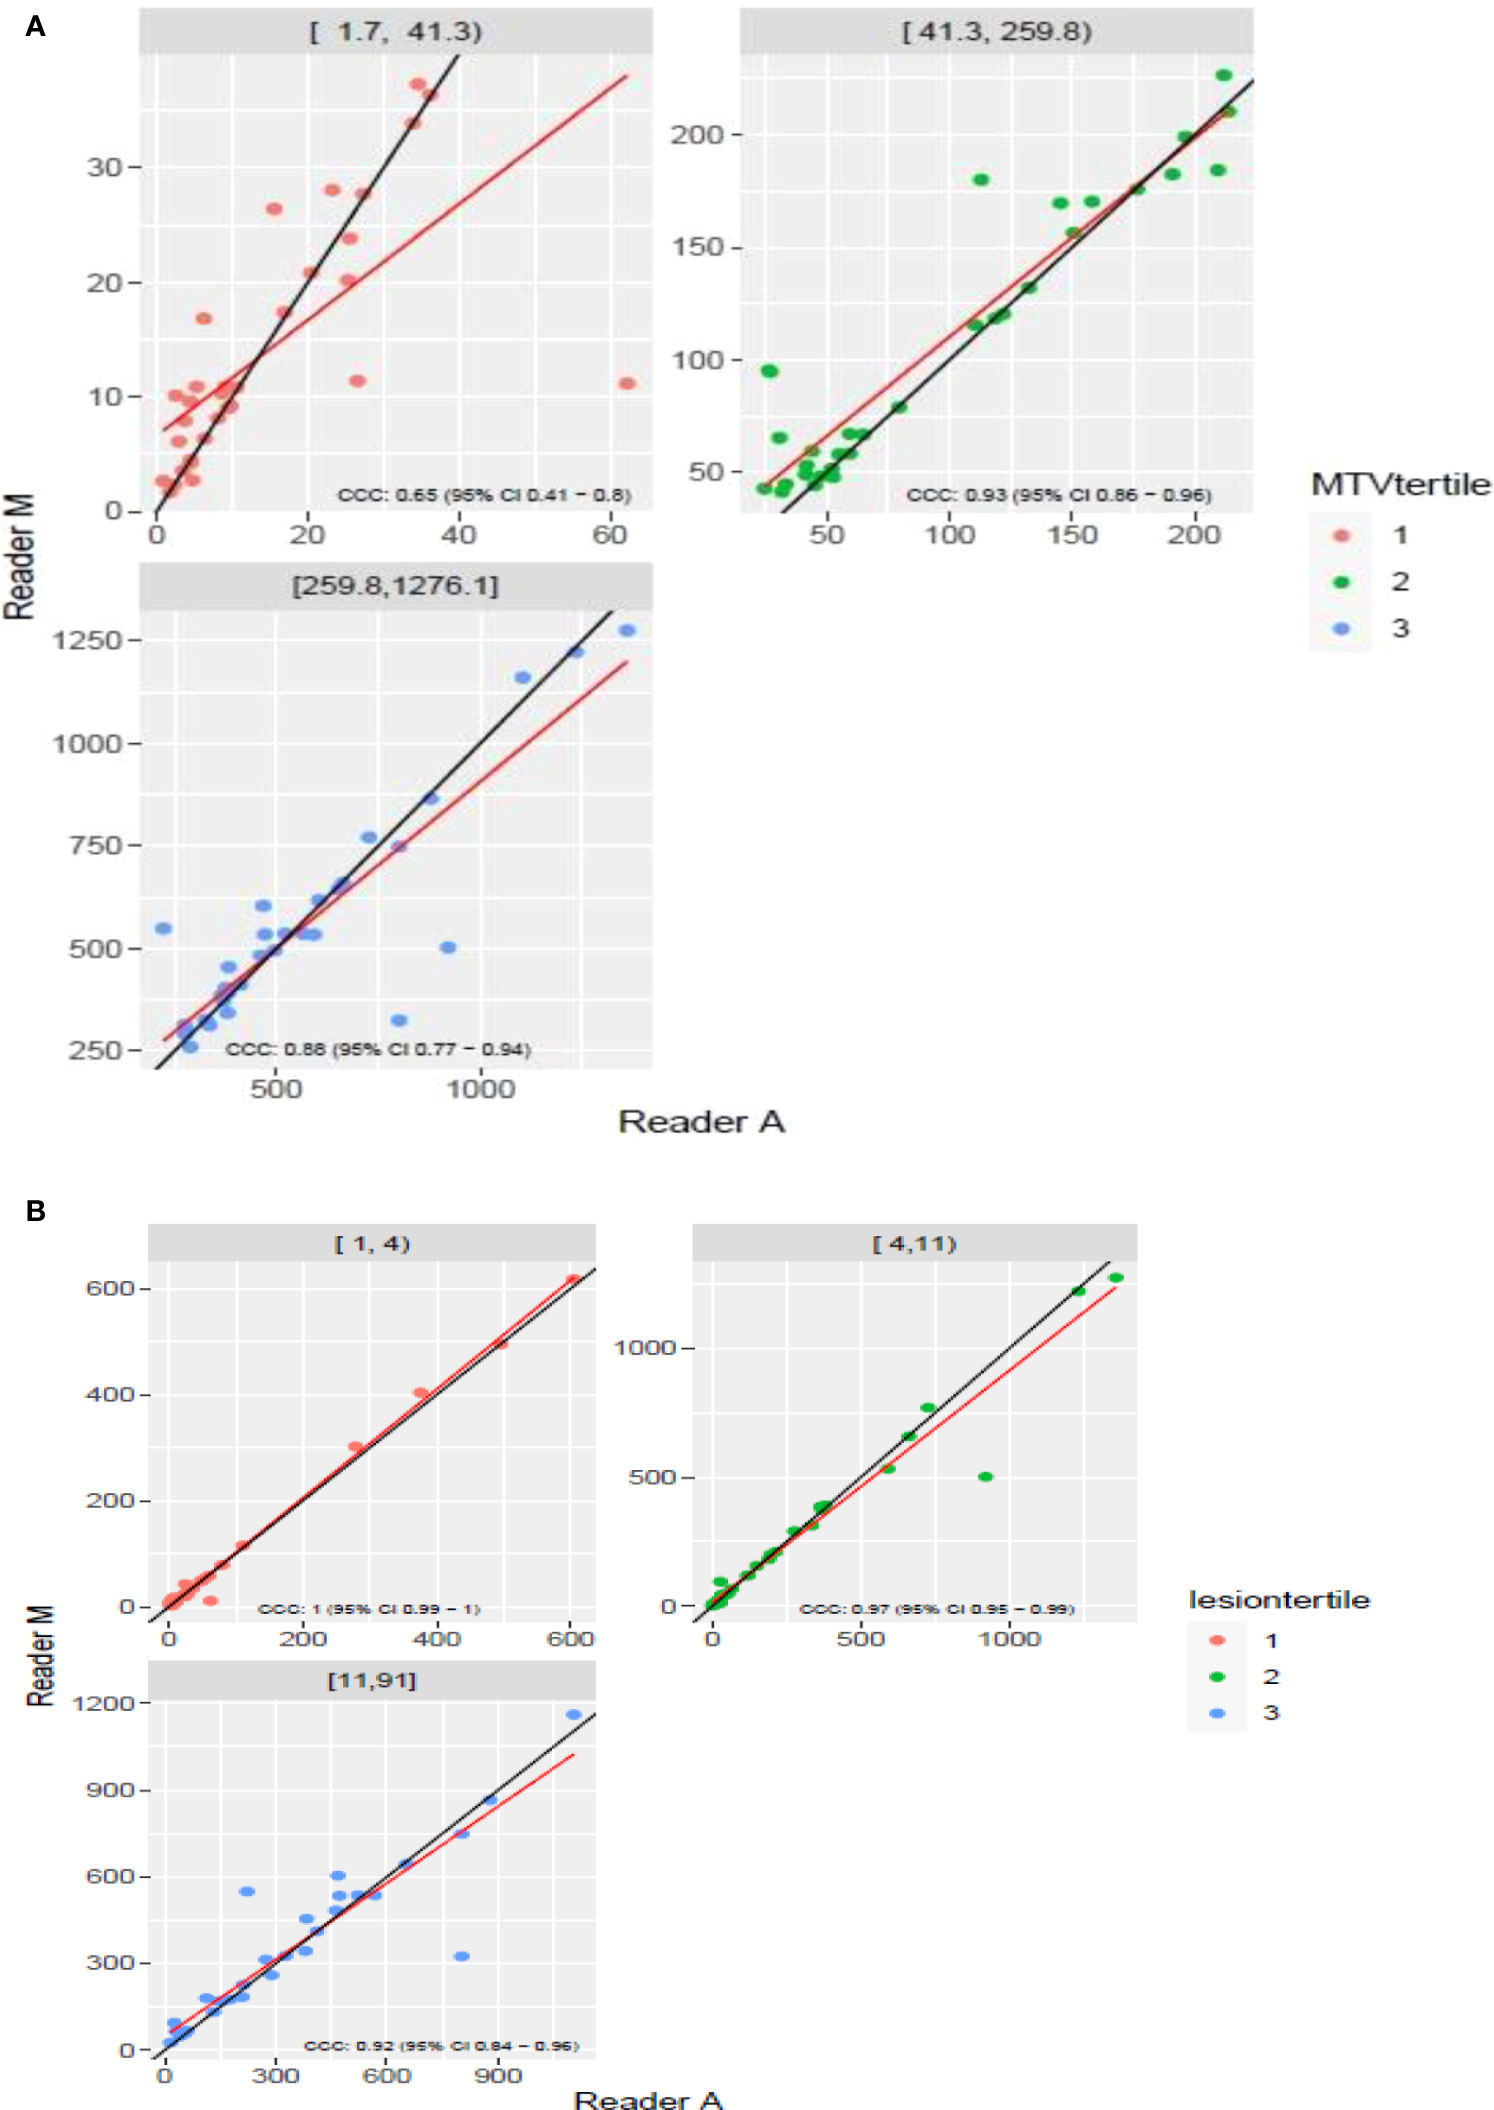
Figure 3 Comparison of estimates of metabolic tumor volume (MTV) between two readers (Reader A, Reader M) using scatter plots for three sub ranges obtained using(a) [(A) diving Reader M’s estimates (B)] number of lesions.
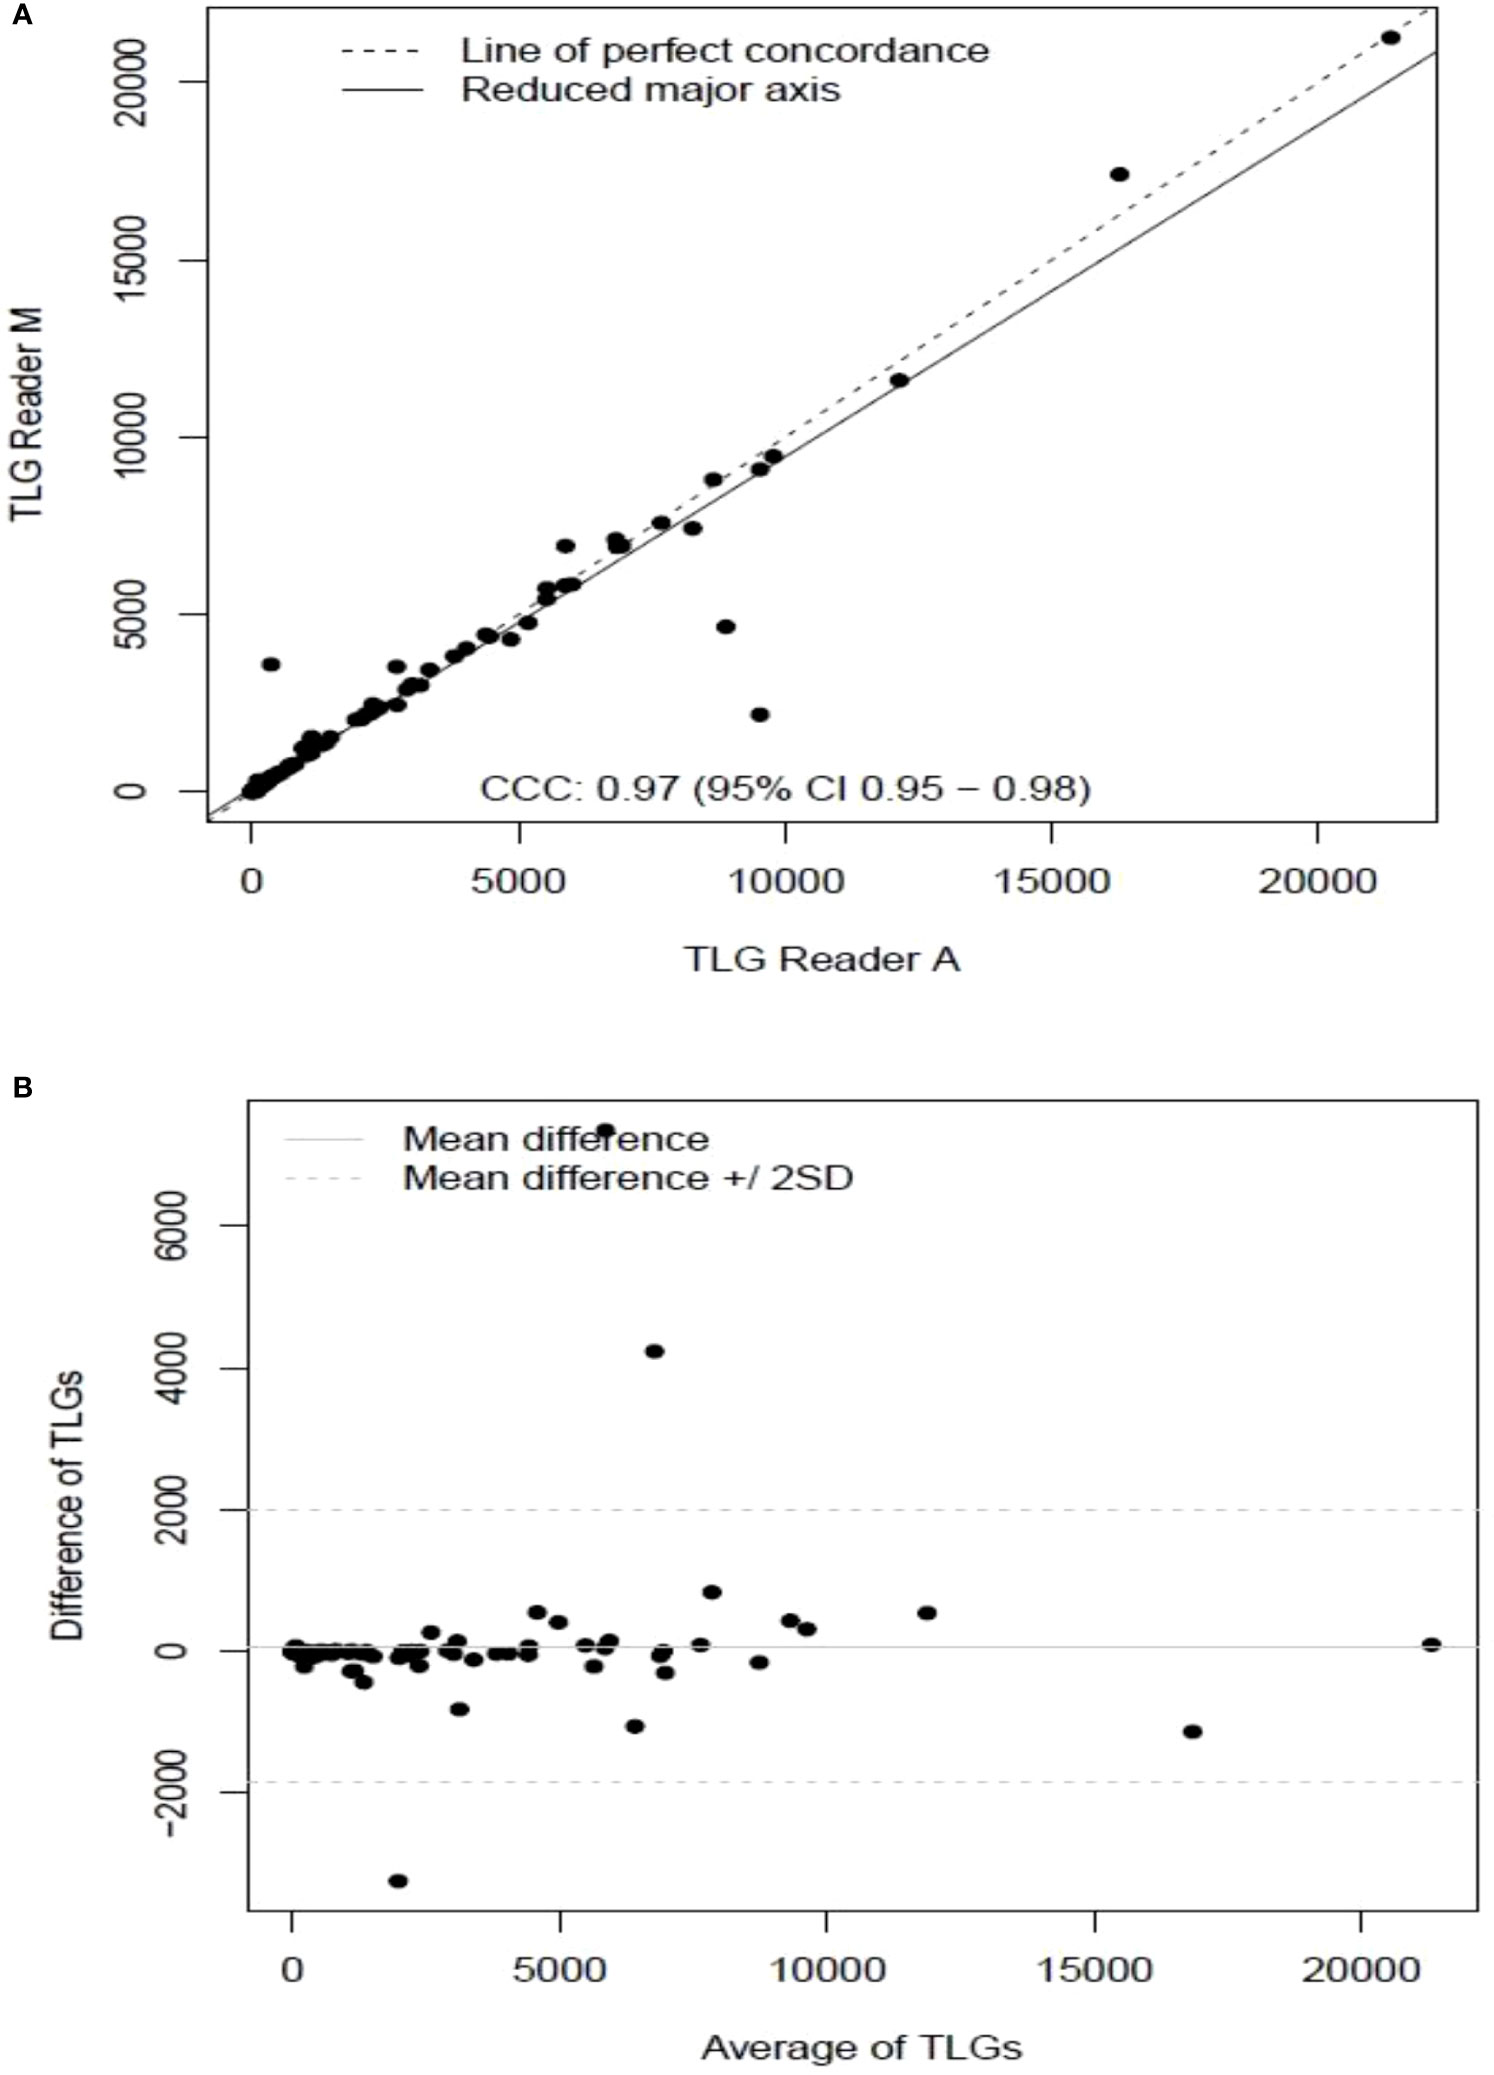
Figure 4 Comparison of estimates of tumor lesion glycolysis (TLG) between two readers (Reader A, Reader M) shown using (A) scatter plots (B) difference plots.
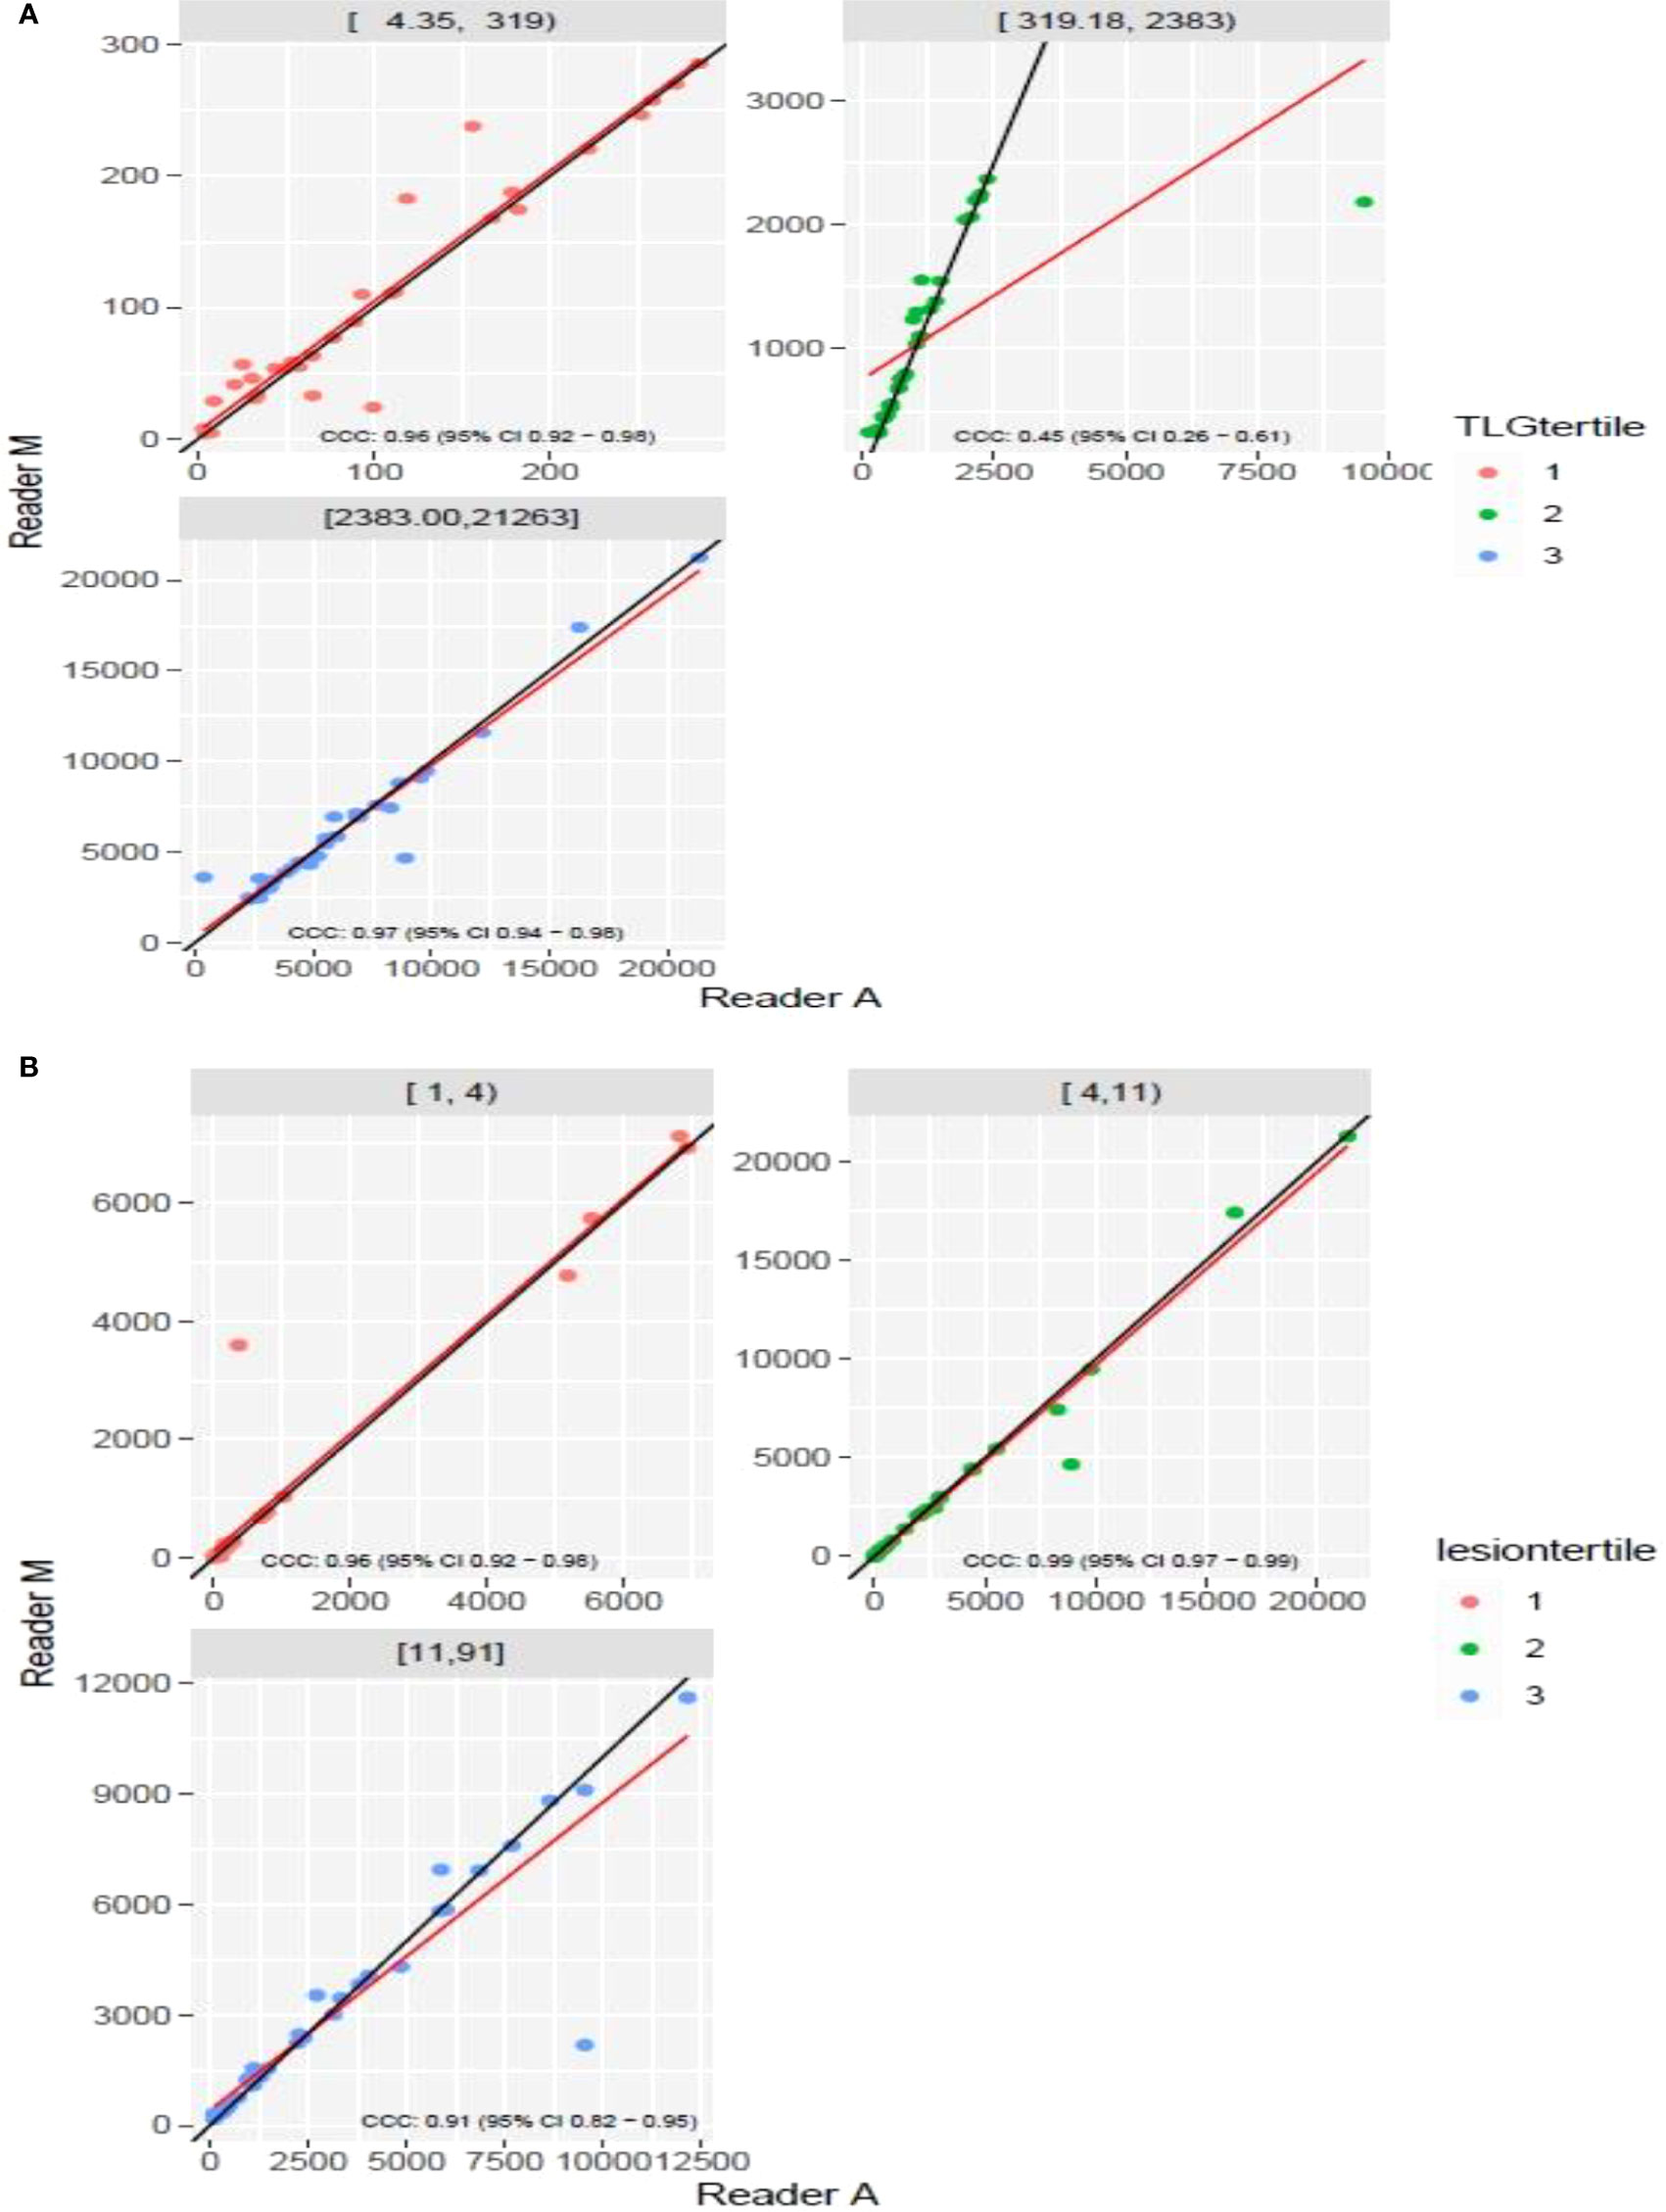
Figure 5 Comparison of estimates of tumor lesion glycolysis (TLG) between two readers (Reader M, Reader A) using scatter plots for three sub ranges obtained using(a) (A) dividing Reader M’s estimates (B) number of lesions.
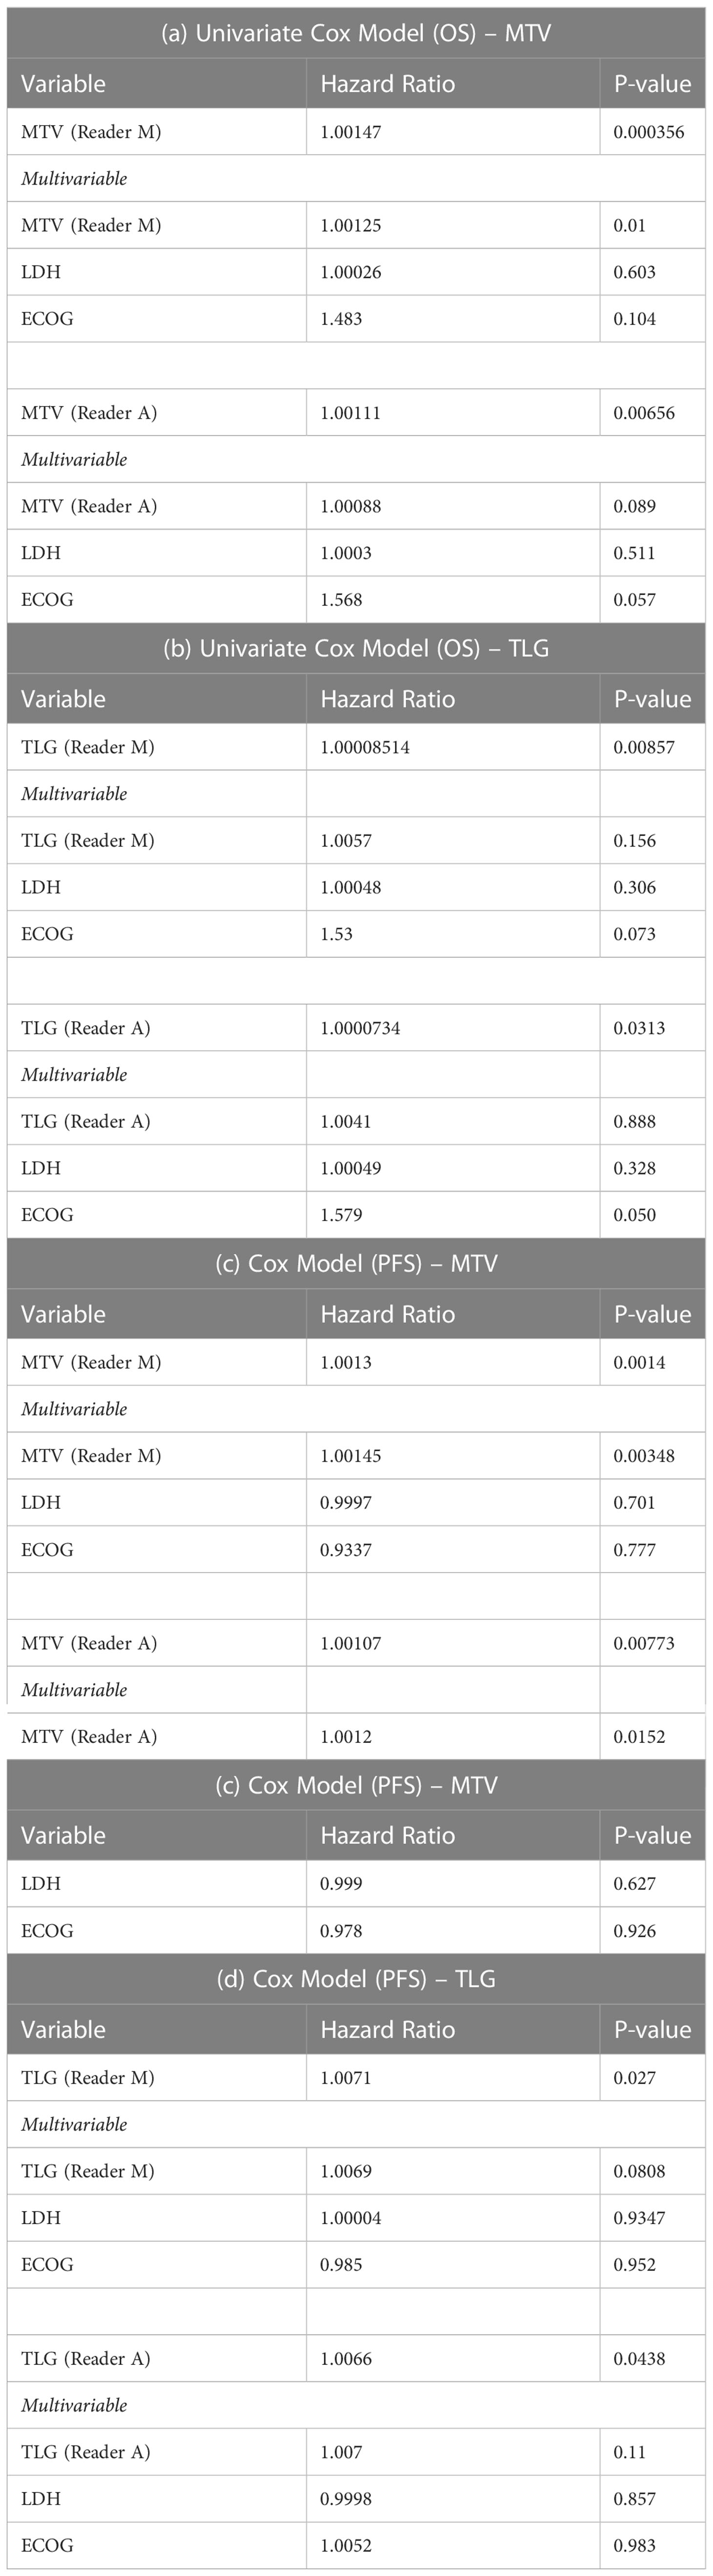
Table 3 Cox regression model to assess hazard risk of MTV and TLG metrics to patient’s overall survival (OS) (see a & b) and progression free survival (PFS) (see c & d).
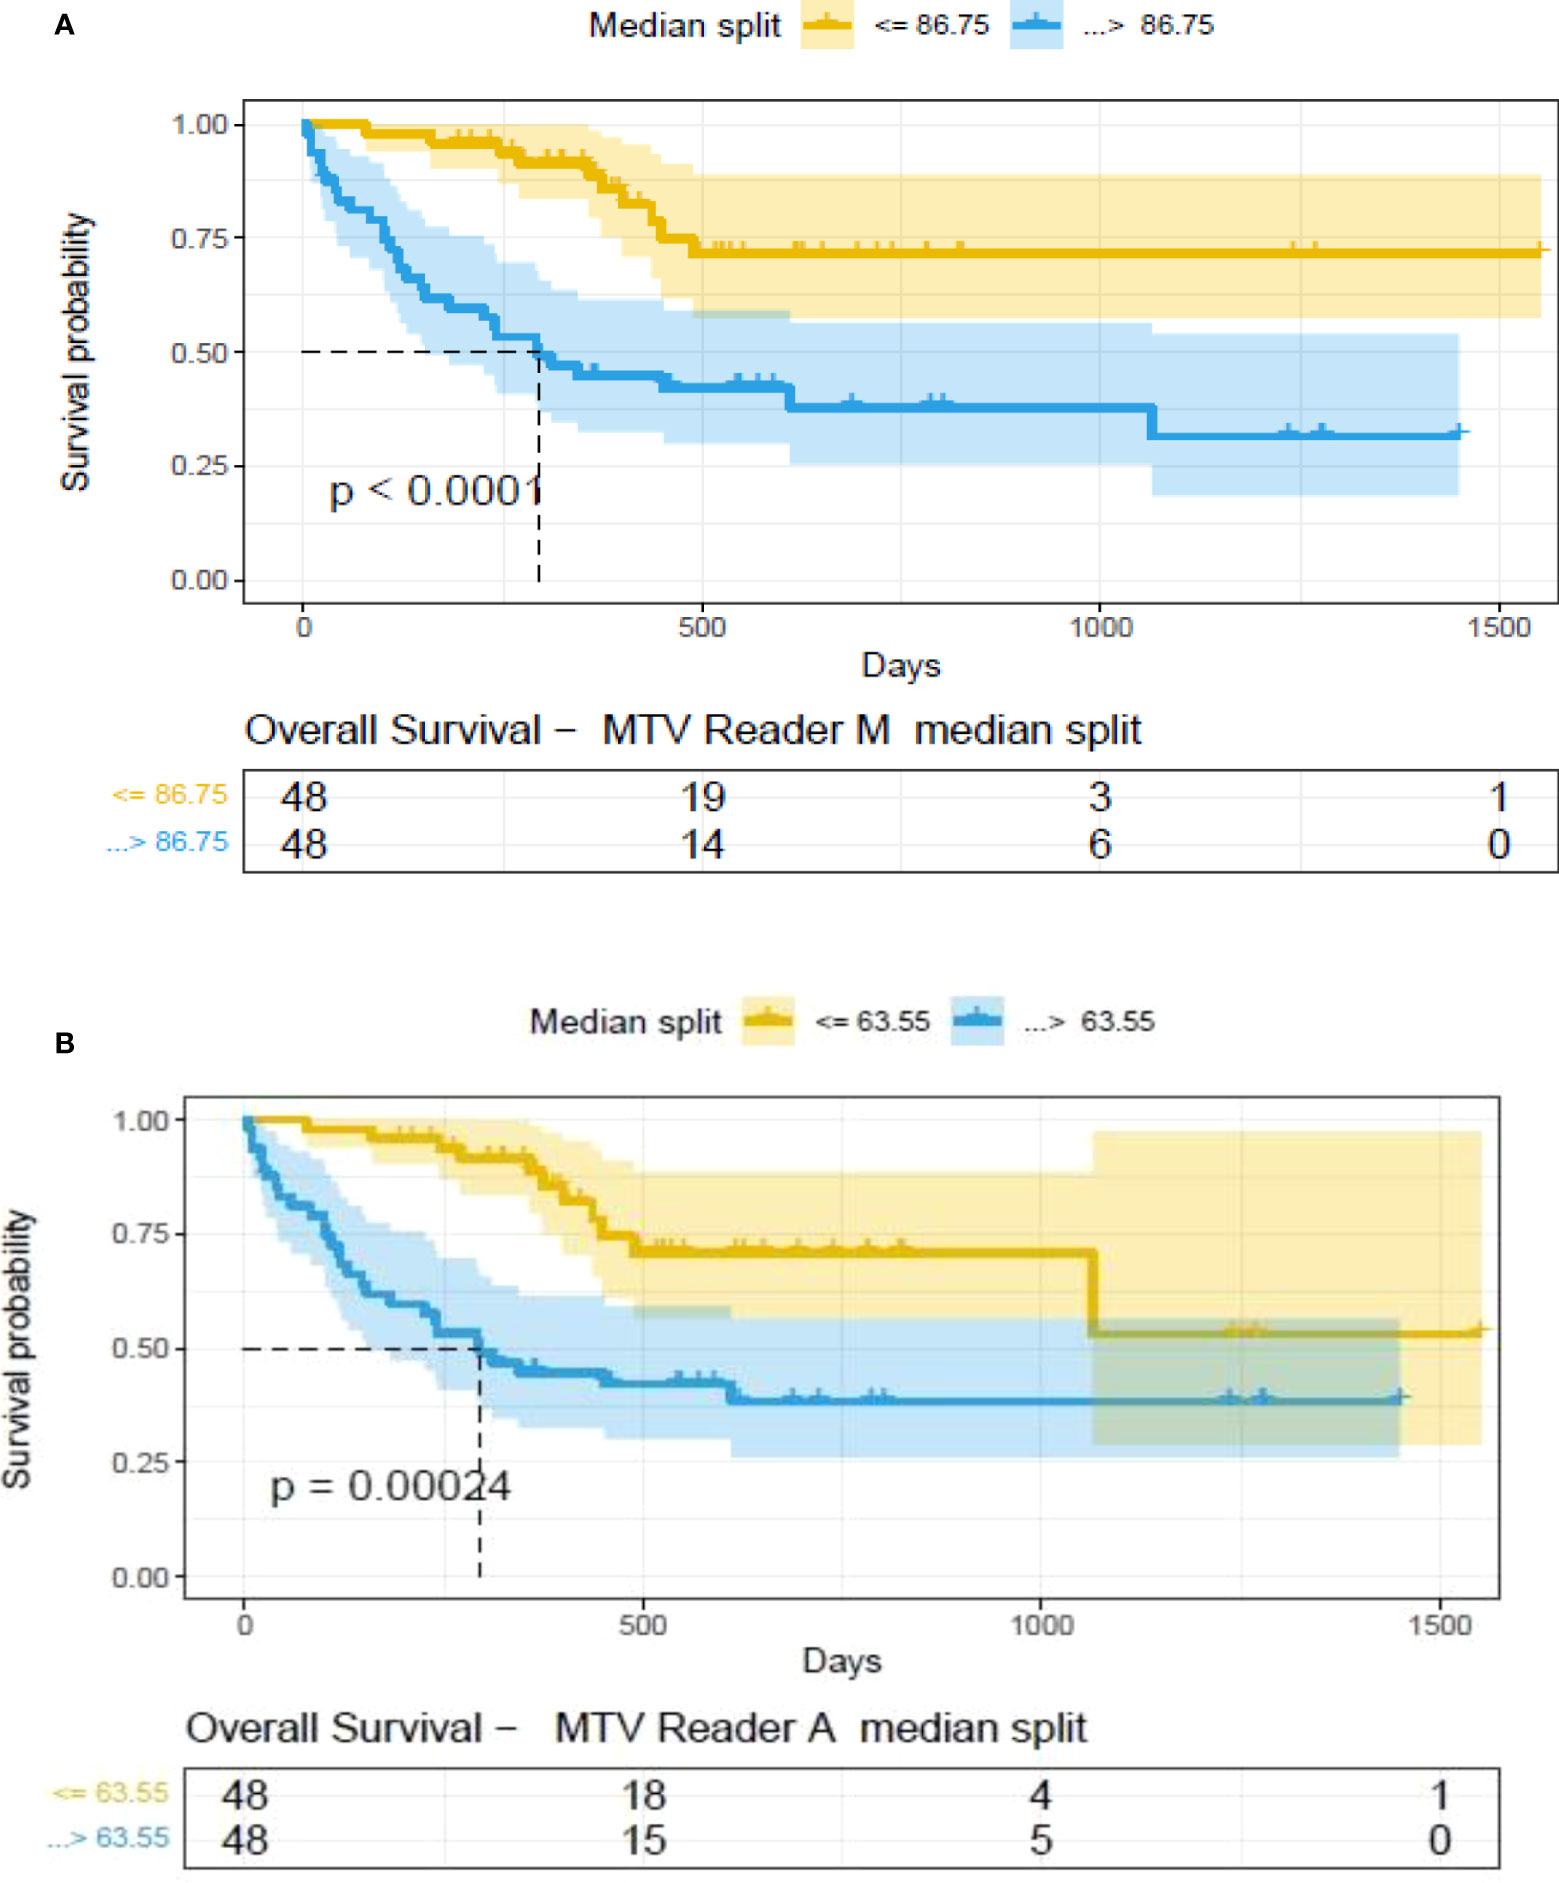
Figure 6 Survival difference between patient groups obtained using median split of Metabolic Tumor Volume (MTV) estimates obtained by (A) Reader -M (manual) and (B) Reader -A (auto), shown using Kaplan Meier plots. Significance between the patient groups computed using log-rank testing.
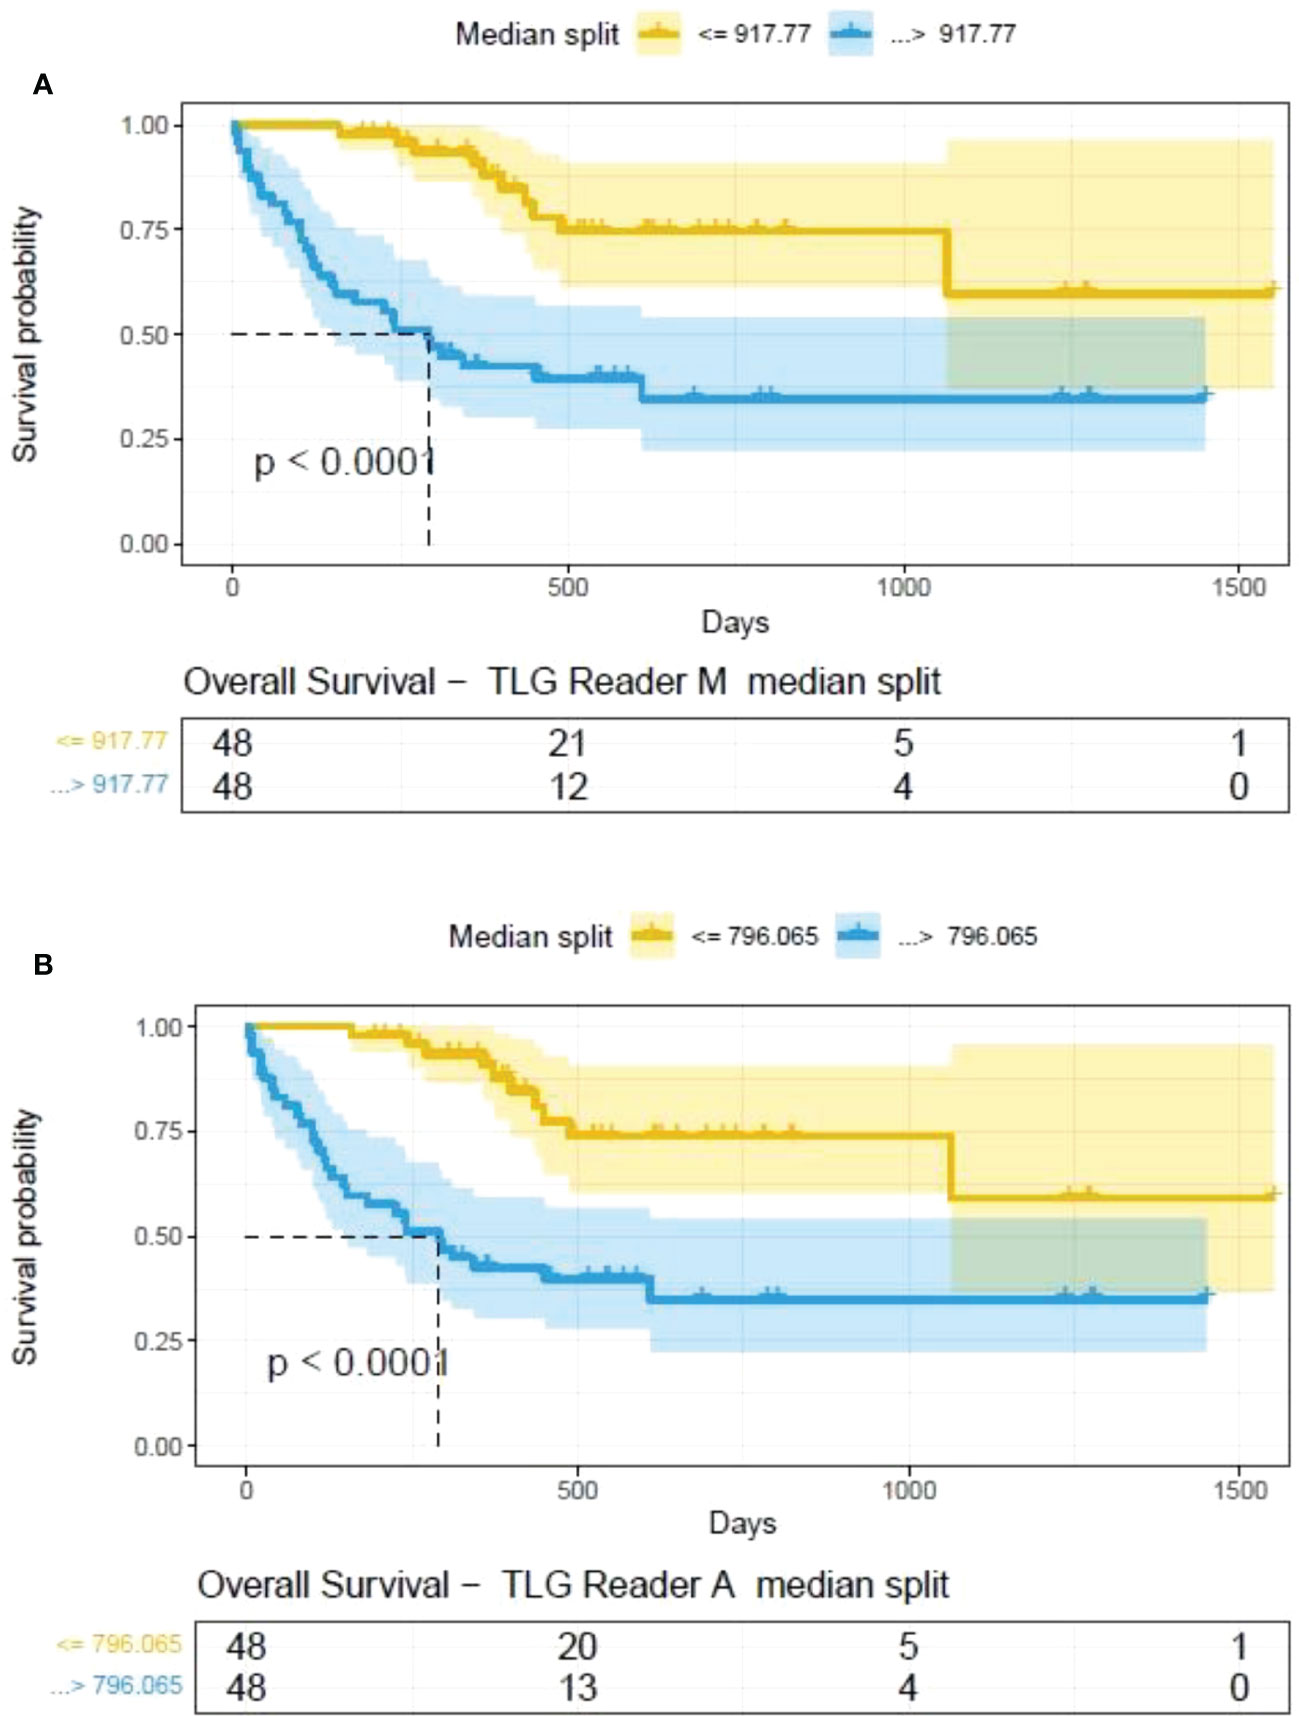
Figure 7 Survival difference between patient groups obtained using median split of Tumor Lesions Glycolysis (TLG) estimates obtained by (A) Reader -M (manual) and (B) Reader -A (auto), shown using Kaplan Meier plots. Significance between the patient groups estimated using log-rank statistical test.
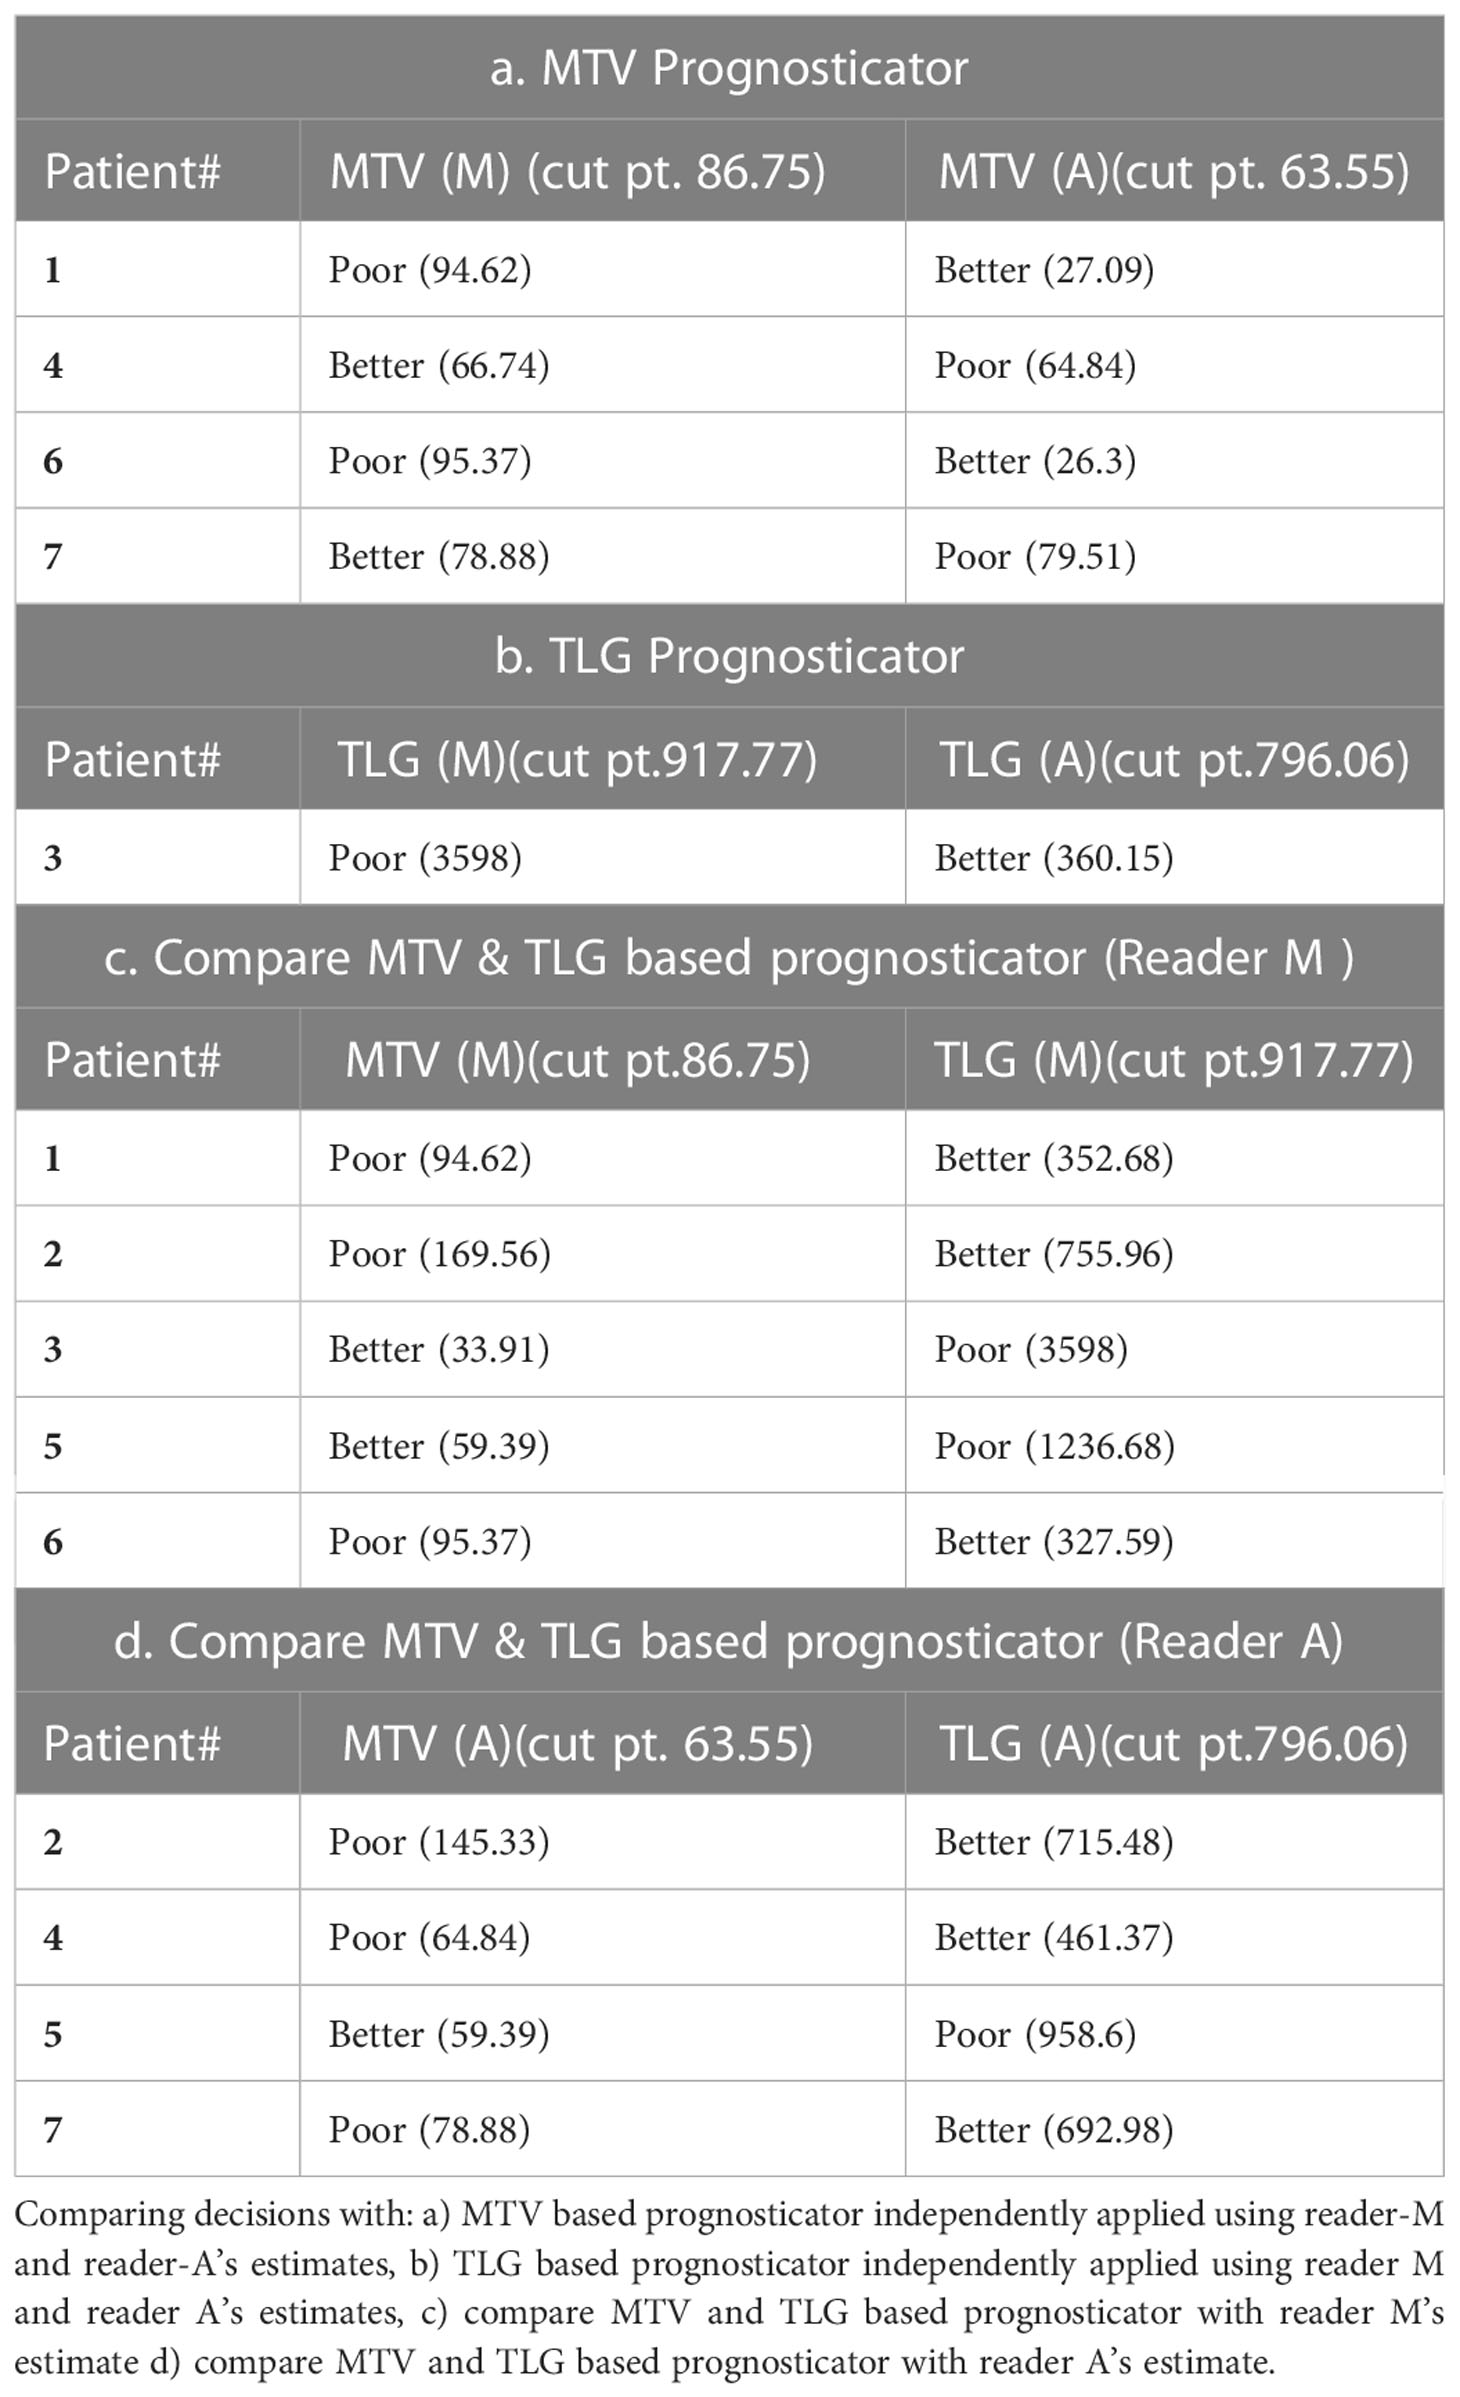
Table 4 Patient level discrepancy in prognostic decisions.
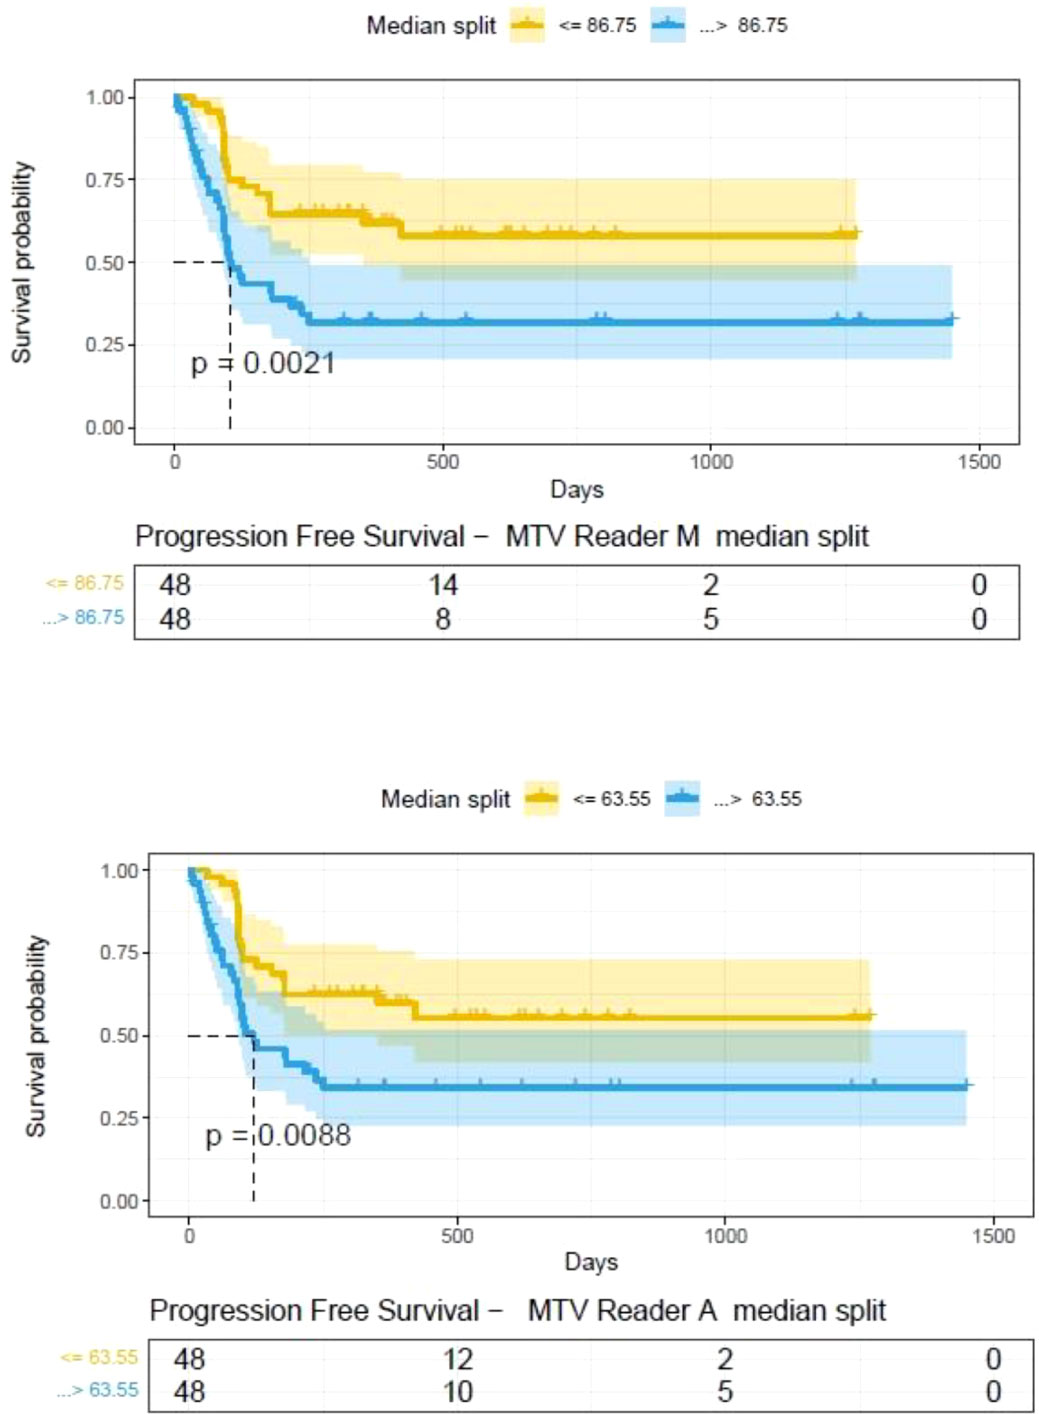
Figure 8 Progression free survival between patient groups obtained using median split of Metabolic Tumor Volume (MTV) estimates obtained by (A) Reader -A (auto) and (B) Reader -M (manual), shown using Kaplan Meier plots. Significance between the patient groups computed using log-rank testing.
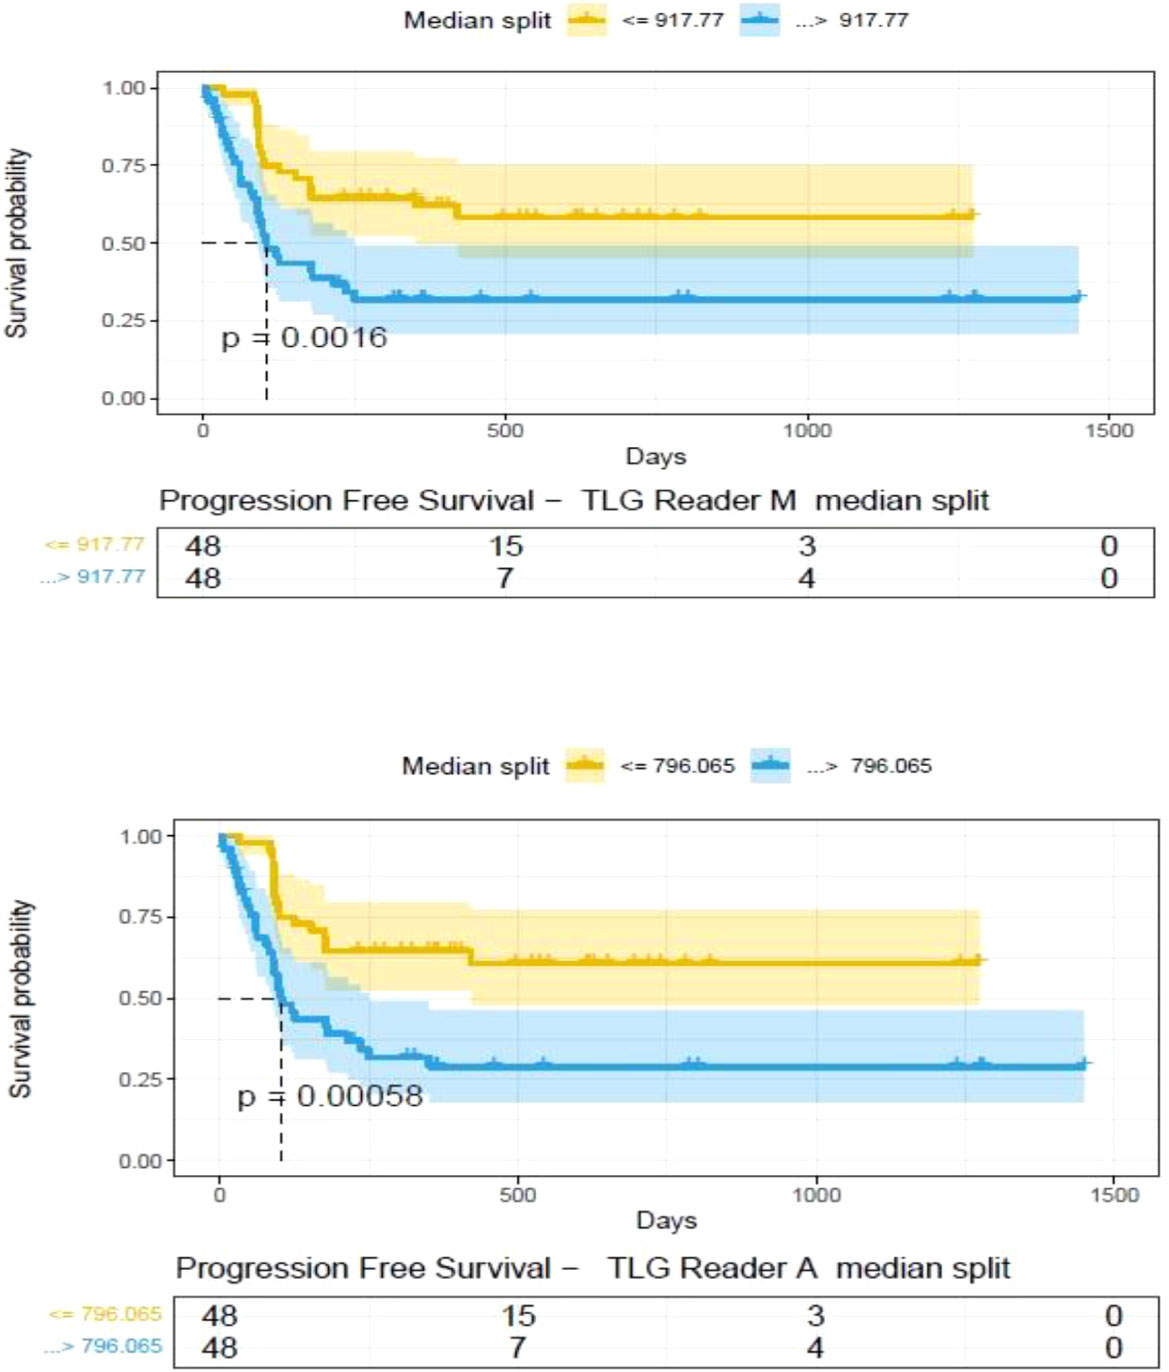
Figure 9 Progression free survival between patient groups obtained using median split of Tumor Lesion Glycolysis (TLG) estimates obtained by (A) Reader -A (auto) and (B) Reader -M (manual), shown using Kaplan Meier plots. Significance between the patient groups computed using log-rank testing.
4 Discussion
Metabolic tumor volume and total lesion glycolysis derived from PET/CT scans provide a measure of active tumor regions and overall disease condition. There are no standardized processes for determining the regions for inclusion on MTV calculation, our study compared two processes to compute these estimates by manual (Reader M) and one semi-automated (Reader A) and its influence on the prognosis of treatment outcome.
There have been many studies that have shown utility in the use of PET imaging to estimate metabolic tumor volume (MTV) that has been shown relevance in many advanced diseases (43–45). Their few best practice guidelines for the clinical use of PET/CT, that provides recommendations for standardization of protocol to reduce variability, has been valuable to promote clinical usage (46, 47). Adoption to lymphoma disease has been qualitative as agreed consensus recommendation by the Lugano classification scheme (6, 48).
The metabolic tumor burden as a metric has been shown to be a marker of disease prognosis after treatment of axi-cel in DLBCL by our team and others (21, 24, 25, 29). In this study we compared estimates of MTV & TLG assessed by the readers, a clinical expert (Reader manual or M), and with imaging clinical experts (radiologists) (Reader auto or A). We compared these two estimates and showed that immaterial of the approaches, both metrics are prognostic of patient outcome to axi-cel treatment. In our prior study (25), using a training cohort of 48 patients and MTV (with a cutoff of 147.5 mL) was shown to be prognostic (p=0.005). Using the same cut off, we showed prognosis in an independent cohort of 48 patients (p=0.0003), which served to validate the approach. Others have shown a similar prognosis in a relatively smaller number of patients with p-value of 0.02 (49). There are many other studies that have tried to use clinical variables such as the standardized uptake value maximum (SUVmax) at different cutoffs to show patient prognosis after treatment (21). The current study outlines the role of lesion boundary correction on the MTV, TLG estimates using two approaches (M and A) and comparison of the influence of each on the clinical outcome, measured as over-all survival and progression free survival.
In this study, we find differences in MTV computations do exist due to: a) differences in detection, possibility due to limitation in using fixed threshold based reference, b) clinical interpretation between an inflammation and a lesion that may lead to accept, delete or alter a lesion, c) size based limitation included in detection algorithms, which allows to differentiate detected lesions with a metabolically active organ, both with a high SUV uptake (see Figure 10). Comparing MTV (Manual & Auto) there were four cases that switched prognosis (see Table 4a). It is interesting to note there were seven cases in total that switched prognosis groups comparing both MTV (Manual & Auto) and TLG (Manual & Auto), (see Table 4). Due to differences in weightage in computing metabolically active regions, prognostic decisions do affect comparing MTV and TLG. In our study there were 5 patients that switched prognostic groups in Manual estimates and 4 patients in Auto estimates (see Table 4c, d). While TLG between Manual and Auto showed a difference in prognosis for one patient (see Table 4b). We find these shifts are due to the patient’s metrics being close to the threshold point, adding to possible discrepancy in the decisions. In practice, patients close to cut points would need secondary validation or a follow up assessment to improve the strength of the prognosticator.
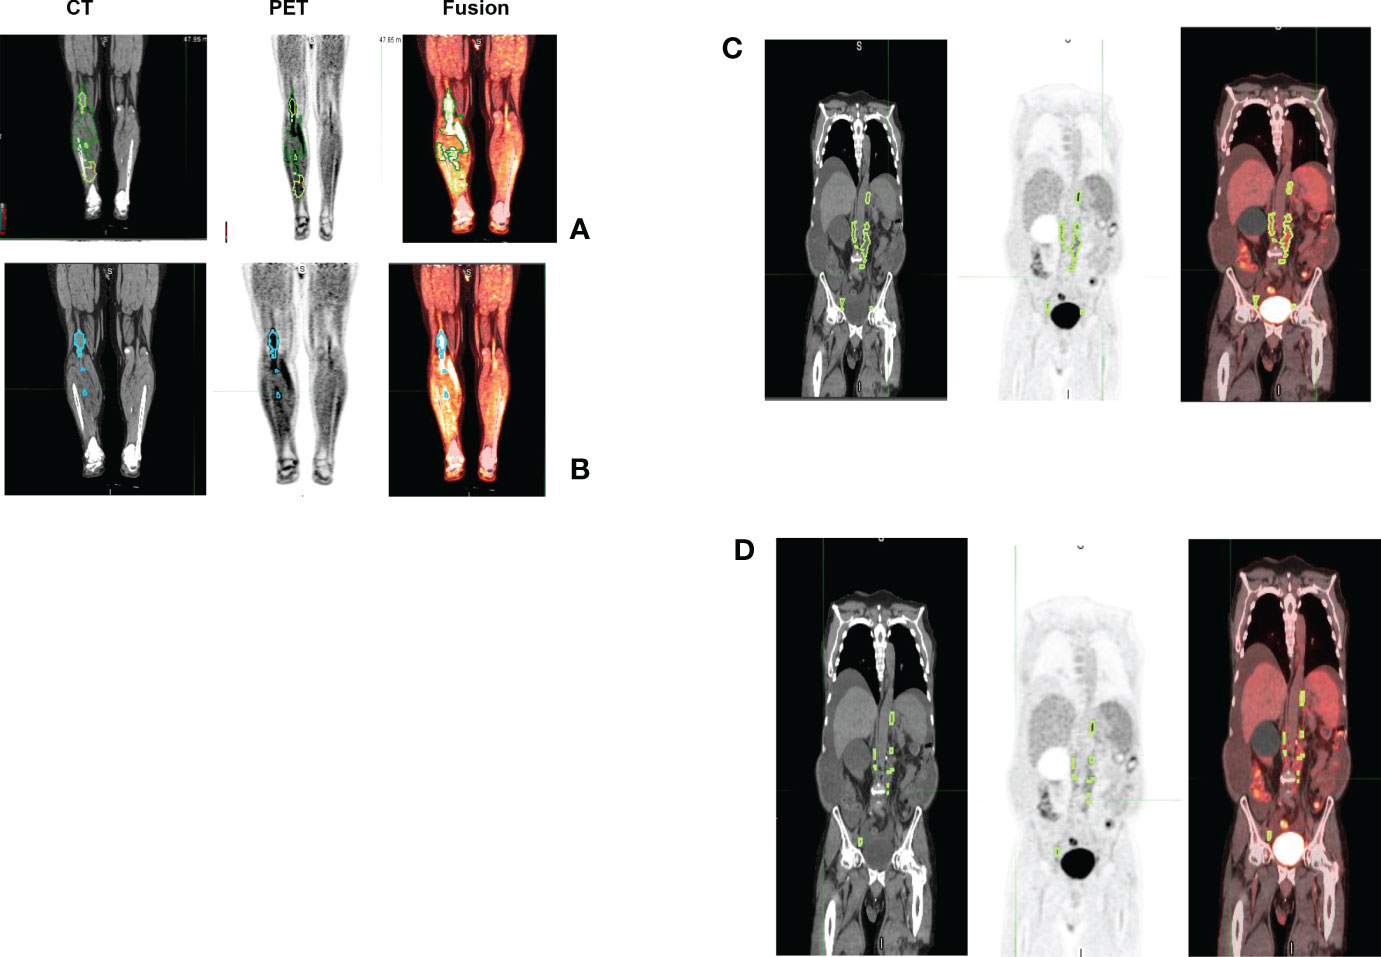
Figure 10 Representative patient scans (CT, PET, Fusion) with lesions detected using manual and auto procedure that showed larger differences in metabolic tumor burden. Estimated MTV using manual (case 1) was 94.62ml (TLG 352.68) (see A). Using auto (case 1) we estimated it to be 27.09ml (TLG 272.52) (see B). While, in case 2 we estimated MTV using manual (case 2) to be 95.37 ml (TLG 327.59) (see C) and using auto we estimated it to be 20.3ml (TLG 116.27) (see D).
Some known issues in FDG-PET scan interpretations (37, 50) that are relevant to lymphoma have been listed (see Section 2.3). There are constraints in identifying metabolically active regions from normal physiology on the PET/CT scans (37). Some known issues include, altered tracer uptake in certain organs can be affected by medications, such as metformin related drugs that are known to increase in the colonic glycolysis, or increased bone marrow and splenic tracer uptake from hematopoietic stem cell factors given to the lymphoma patient population. Another example is focal increased FDG uptake in skeletal muscle related to physiologic muscular contraction by the patient in the PET scanner. Physiologic tracer uptake may thus occasionally lead to variability in interpretation between readers; despite the variabilities, there was a high concordance between the readers in our study.
Another critical factor affecting MTV measurements is the accurate discrimination of inflammation from lesions. Recognition of inflammatory processes involves identifying spatial and metabolic tracer patterns that do not match expected oncologic activity. Examples include tracer activity in anatomic regions that are distant from a locally advanced malignancy, tracer activity in anatomic regions not typical for a particular cancer’s pattern of spread (e.g. gall bladder update in prostate cancer or mesenteric fat necrosis in lymphoma), and treatment-related increased tracer uptake in tissues near tumor sites (i.e radiation therapy) (50) or distant from tumor sites. We would expect the concordance for such nodules to be low to moderate between the readers for these events.
It is evident that small changes in MTV seem to have a scaled effect in TLG metric, due to the multiplicative factor of SUVmax. We find, in the repeatability testing (Reader 1& 2), at certain ranges with small number of outliers (mid tertitle) influences the concordance coefficient (drops to 0.453 from 0.958 & 0.969 for smaller or larger tertiles).
Despite these potential reasons for discordance, the tumor metabolic volumes assessed by the two clinical readers (Reader A & M or Auto & Manual) showed high concordance and are prognostic to survival after treatment. We find the concordance correlation coefficient between readers dropped to 0.648 for lower tertiles and 0.882 for the highest tertiles, compared to 0.926 for the mid-range. It is evident that any changes made by the reader to patient studies with smaller tumor burden seem to impact the concordance metric. Alterations to larger region boundaries also makes a difference while assessing the MTV as the 41% on SUVmax significantly affects the boundary regions.
Conventional radiological assessment of solid tumors to date uses single dimensional lesions size measurements (RECIST, Response Evaluation Criteria in Solid Tumors) (51–53). It has been widely reported that there is a wide variability in tumor size estimations between the tumor measurements drawn by the clinical radiologists, which can be as much as 30% or greater, in some cases (17, 18). While use of PET/CT imaging in lymphoma provides both morphological and functional FDG-PET activity at the lesion level, availability of metabolic assessment at the lesion level allows for better convergence between the clinical readers. In DLBCL, the potentially large number of lesions found on body scans makes manual human interpretation exceptionally challenging. In our study, the patient cohort had an average of 12 lesions per patient, with a median of 6 and deviation of 16. Additional review time needed for detailed manual study interpretations makes the real time clinical implementation non practical. Methods for rapid and robust automated tumor assessments are desired, which is possible with the ongoing development of advanced imaging methods (54, 55).
It is nonetheless well understood that current detection methods have limitations, and human inputs are required for accurate disease assessment. Implementing a rule-based approach where a region of normal liver is used as a baseline measure provides for a more uniform disease burden assessment, as shown in this study. The study compares two clinical readers’ assessment of MTV/TLG estimates with slight differences in their approaches. The study clearly shows that at the population level any regional adjustments have minimal effect to outcome inference. The KM plot cut point for MTV estimates for Reader M using Manual method (86.75 mL) was higher compared to one with Reader A (63.55 mL), and comparable to previously reported clinical studies (24, 29), which in most cases followed manual approaches. The methods show a different cutoff range, which is evident on how lesion boundaries are adjusted to include perceived (manual or reader M) and following a rule-based cut point (auto or reader A). It is evident that following a procedure (manual or auto) one could translate the finding to derive prognosis at a patient level. It is cautioned that interchanging the MTV cutoff estimated by one method (manual or auto) may not be appropriate, due to subtle methodological differences. It is cautioned that, any inference or methodological preferences based on estimated prognosis threshold (Manual 86.76ml vs Auto 63.55ml) may not be appropriate. The study shows that smaller lesion level differences at the patient level will have minimal effect on the population level inferences for systemic disease with larger tumor burden such in DLBCL. Our study shows that using semi-automated lesion detection for MTV (or TLG) computation would provide statistically similar prognosis as a manual corrected lesions to estimate MTV, which we believe would allow development of automated methods and reducing clinical burden to estimate these metrics.
4.1 Study limitations
We acknowledge the limitations in our study, which include a relatively smaller patient sample size used for the research study. It has been understood that there are a very small number of institutions that offer advanced immunotherapy (axi-cell or similar), making the patient samples scares. We made our best effort to assemble a sample size that would allow us to obtain statistically meaningful observations. We understand that the study findings need independent secondary validation.
5 Conclusion
The study systematically compares two reader approaches who independently estimated MTV and TLG assessment. The use of a semi-automated approach to lesion identification allows greater clinical adoption due to ease in computation and lessens the need for manual contouring. We conclude that lesion boundary alterations have minimal effects in the population level prognosis of outcome with both methods with comparable statistical significance. Our study supports development of automated methods for determination of MTV to improve clinical throughput and reduce reader biases.
Data availability statement
The original contributions presented in the study are included in the article/Supplementary Material. Further inquiries can be directed to the corresponding authors.
Ethics statement
The study protocol was approved by the Institutional Review Board at the University of South Florida/Moffitt Cancer Center.
Author contributions
JC, ED, FL, YB: Hypothesis, methods direction. FL, ED, MJ, GK: Clinical data curation, clinical care. HL, JQ, JC, ED: Lesions identification and marking. YB, ZT: Results inference, implementation of methods. YB, FL, JC, ED Manuscript writing and editing. JC, ED, HL, JQ, ZT, GK, MJ, FL, YB: Manuscript proof-read and approval. All authors contributed to the article and approved the submitted version.
Funding
The authors would like to acknowledge the Moffitt Cancer Center’s CCSG Support award (NCI’s P30-CA076292) and the services of BBSR core, clinical staff and unwavering trust of our patients, who consented to use of their data for the research study. FL is a Clinical Scholar Award recipient of the Leukemia and Lymphoma Society. This work was in part supported by funding from Kite, a Gilead Company. HL acknowledges research support from Dr Gillies Lab, during her sabbatical at Moffitt Cancer Center, an NCI designated Comprehensive Cancer Center.
Conflict of interest
This study was in part funded by Kite Pharma, a Gilead Company which allowed protected research time for the following authors FL, YB and JQ.
Author HL acknowledges research support from Dr Gillies Lab, during her sabbatical at H Lee Moffitt Cancer Center, an NCI designated Comprehensive Cancer Center.
Author MDJ has the following to report.
A consultancy/advisory for Kite/Gilead, Novartis, BMS, and Myeloid Therapeutics and received research funding from Kite/Gilead and Incyte Inc.
Author FL has the following to report.
Scientific Advisory Role/Consulting Fees: A2, Allogene, Amgen, Bluebird Bio, BMS/Celgene, Calibr, Caribou, Cellular Biomedicine Group, Cowen, Daiichi Sankyo, EcoR1, Emerging Therapy Solutions, GammaDelta Therapeutics, Gerson Lehrman Group (GLG), Iovance, Kite Pharma, Janssen, Legend Biotech, Novartis, Sana, Takeda, Wugen, Umoja.
Research Contracts for Services: Kite Pharma (Institutional), Allogene (Institutional), CERo Therapeutics (Institutional), Novartis (Institutional), BlueBird Bio (Institutional), BMS (Institutional), National Cancer Institute, Leukemia and Lymphoma Society.
Patents, Royalties, Other Intellectual Property: Several patents held by the institution in my name (unlicensed) in the field of cellular immunotherapy.
Education or Editorial Activity: Aptitude Health, ASH, BioPharma Communications CARE Education, Clinical Care Options Oncology, Imedex, Society for Immunotherapy of Cancer.
Author YB has the following to report.
Has received funding from the National Cancer Institute and holds several patents with institutional partnership.
Inference derived in this work was a research contribution of the authors and was not influenced by the funding received.
The remaining authors declare that the research was conducted in the absence of any commercial or financial relationships that could be construed as a potential conflict of interest.
Publisher’s note
All claims expressed in this article are solely those of the authors and do not necessarily represent those of their affiliated organizations, or those of the publisher, the editors and the reviewers. Any product that may be evaluated in this article, or claim that may be made by its manufacturer, is not guaranteed or endorsed by the publisher.
Supplementary material
The Supplementary Material for this article can be found online at: https://www.frontiersin.org/articles/10.3389/fimmu.2023.994520/full#supplementary-material
References
1. Connors JM, Cozen W, Steidl C, Carbone A, Hoppe RT, Flechtner H-H, et al. Hodgkin Lymphoma. Nat Rev Dis Primers (2020) 6(1):61. doi: 10.1038/s41572-020-0189-6
2. Miller TP, Dahlberg S, Cassady JR, Adelstein DJ, Spier CM, Grogan TM, et al. Chemotherapy alone compared with chemotherapy plus radiotherapy for localized intermediate- and high-grade non-hodgkin's lymphoma. New Engl J Med (1998) 339(1):21–6. doi: 10.1056/nejm199807023390104
3. ACS. Cancer facts & figures: Survival rates & factors that affect prognosis for non-hodgkin lymphoma. American Cancer society (2022). Available at: https://www.cancer.org/cancer/non-hodgkin-lymphoma/detection-diagnosis-staging/factors-prognosis.html#references.
4. Juweid ME, Stroobants S, Hoekstra OS, Mottaghy FM, Dietlein M, Guermazi A, et al. Use of positron emission tomography for response assessment of lymphoma: consensus of the imaging subcommittee of international harmonization project in lymphoma. J Clin Oncol (2007) 25(5):571–8. doi: 10.1200/jco.2006.08.2305
5. Barrington SF, Mikhaeel NG, Kostakoglu L, Meignan M, Hutchings M, Müeller SP, et al. Role of imaging in the staging and response assessment of lymphoma: consensus of the international conference on malignant lymphomas imaging working group. J Clin Oncol (2014) 32(27):3048–58. doi: 10.1200/jco.2013.53.5229
6. Cheson BD, Fisher RI, Barrington SF, Cavalli F, Schwartz LH, Zucca E, et al. Recommendations for initial evaluation, staging, and response assessment of Hodgkin and non-Hodgkin lymphoma: the lugano classification. J Clin Oncol (2014) 32(27):3059–68. doi: 10.1200/jco.2013.54.8800
7. Hutchings M, Loft A, Hansen M, Pedersen LM, Berthelsen AK, Keiding S, et al. Position emission tomography with or without computed tomography in the primary staging of hodgkin's lymphoma. Haematologica (2006) 91(4):482–9.
8. Luminari S, Biasoli I, Arcaini L, Versari A, Rusconi C, Merli F, et al. The use of FDG-PET in the initial staging of 142 patients with follicular lymphoma: a retrospective study from the FOLL05 randomized trial of the fondazione italiana linfomi. Ann Oncol (2013) 24(8):2108–12. doi: 10.1093/annonc/mdt137
9. Shankar LK, Hoffman JM, Bacharach S, Graham MM, Karp J, Lammertsma AA, et al. Consensus recommendations for the use of 18F-FDG PET as an indicator of therapeutic response in patients in national cancer institute trials. J Nucl Med (2006) 47(6):1059–66.
10. Larson SM, Schwartz LH. 18F-FDG PET as a candidate for "qualified biomarker": functional assessment of treatment response in oncology. J Nucl Med (2006) 47(6):901–3.
11. Barrington SF, MacKewn JE, Schleyer P, Marsden PK, Mikhaeel NG, Qian W, et al. Establishment of a UK-wide network to facilitate the acquisition of quality assured FDG-PET data for clinical trials in lymphoma. Ann Oncol (2011) 22(3):739–45. doi: 10.1093/annonc/mdq428
12. Boellaard R, Oyen WJ, Hoekstra CJ, Hoekstra OS, Visser EP, Willemsen AT, et al. The Netherlands protocol for standardisation and quantification of FDG whole body PET studies in multi-centre trials. Eur J Nucl Med Mol Imaging (2008) 35(12):2320–33. doi: 10.1007/s00259-008-0874-2
13. Meignan M, Gallamini A, Meignan M, Gallamini A, Haioun C. Report on the first international workshop on interim-PET-Scan in lymphoma. Leukemia lymphoma (2009) 50(8):1257–60. doi: 10.1080/10428190903040048
14. Radford J, Barrington S, Counsell N, Pettengell R, Johnson P, Wimperis J, et al. Involved field radiotherapy versus no further treatment in patients with clinical stages IA and IIA Hodgkin lymphoma and a ‘Negative’ PET scan after 3 cycles ABVD. results of the UK NCRI RAPID trial. Blood (2012) 120(21):547. doi: 10.1182/blood.V120.21.547.547
15. Johnson P, Federico M, Kirkwood A, Fosså A, Berkahn L, Carella A, et al. Adapted treatment guided by interim PET-CT scan in advanced hodgkin's lymphoma. New Engl J Med (2016) 374(25):2419–29. doi: 10.1056/NEJMoa1510093
16. Milgrom SA, Dong W, Akhtari M, Smith GL, Pinnix CC, Mawlawi O, et al. Chemotherapy response assessment by FDG-PET-CT in early-stage classical Hodgkin lymphoma: Moving beyond the five-point deauville score. Int J Radiat oncology biology Phys (2017) 97(2):333–8. doi: 10.1016/j.ijrobp.2016.10.029
17. Bellomi M, De Piano F, Ancona E, Lodigiani AF, Curigliano G, Raimondi S, et al. Evaluation of inter-observer variability according to RECIST 1.1 and its influence on response classification in CT measurement of liver metastases. Eur J Radiol (2017) 95:96–101. doi: 10.1016/j.ejrad.2017.08.001
18. Yoon SH, Kim KW, Goo JM, Kim DW, Hahn S. Observer variability in RECIST-based tumour burden measurements: a meta-analysis. Eur J Cancer (2016) 53:5–15. doi: 10.1016/j.ejca.2015.10.014
19. Hofheinz F, Maus J, Zschaeck S, Rogasch J, Schramm G, Oehme L, et al. Interobserver variability of image-derived arterial blood SUV in whole-body FDG PET. EJNMMI Res (2019) 9(1):23. doi: 10.1186/s13550-019-0486-9
20. Hwang SH, Jung M, Jeong YH, Jo K, Kim S, Wang J, et al. Prognostic value of metabolic tumor volume and total lesion glycolysis on preoperative (18)F-FDG PET/CT in patients with localized primary gastrointestinal stromal tumors. Cancer Metab (2021) 9(1):8. doi: 10.1186/s40170-021-00244-x
21. Yoon Y-H, Lee S-H, Hong S-L, Kim S-J, Roh H-J, Cho K-S. Prognostic value of metabolic tumor volume as measured by fluorine-18-fluorodeoxyglucose positron emission tomography/computed tomography in nasopharyngeal carcinoma. Int Forum Allergy Rhinology (2014) 4(10):845–50. doi: 10.1002/alr.21363
22. Han S, Kim H, Kim YJ, Suh CH, Woo S. Prognostic value of volume-based metabolic parameters of 18F-FDG PET/CT in uterine cervical cancer: A systematic review and meta-analysis. Am J Roentgenology (2018) 211(5):1112–21. doi: 10.2214/AJR.18.19734
23. Pinochet P, Texte E, Stamatoullas-Bastard A, Vera P, Mihailescu S-D, Becker S. Prognostic value of baseline metabolic tumour volume in advanced-stage hodgkin’s lymphoma. Sci Rep (2021) 11(1):23195. doi: 10.1038/s41598-021-02734-w
24. Casasnovas R-O, Kanoun S, Tal I, Cottereau A-S, Edeline V, Brice P, et al. Baseline total metabolic volume (TMTV) to predict the outcome of patients with advanced Hodgkin lymphoma (HL) enrolled in the AHL2011 LYSA trial. J Clin Oncol (2016) 34(15_suppl):7509. doi: 10.1200/JCO.2016.34.15_Supplementary7509
25. Dean EA, Mhaskar RS, Lu H, Mousa MS, Krivenko GS, Lazaryan A, et al. High metabolic tumor volume is associated with decreased efficacy of axicabtagene ciloleucel in large b-cell lymphoma. Blood Adv (2020) 4(14):3268–76. doi: 10.1182/bloodadvances.2020001900
26. Im HJ, Bradshaw T, Solaiyappan M, Cho SY. Current methods to define metabolic tumor volume in positron emission tomography: Which one is better? Nucl Med Mol Imaging (2018) 52(1):5–15. doi: 10.1007/s13139-017-0493-6
27. Paidpally V, Mercier G, Shah BA, Senthamizhchelvan S, Subramaniam RM. Interreader agreement and variability of FDG PET volumetric parameters in human solid tumors. Am J Roentgenology (2014) 202(2):406–12. doi: 10.2214/AJR.13.10841
28. Im HJ, Solaiyappan M, Lee I, Bradshaw T, Daw NC, Navid F, et al. Multi-level otsu method to define metabolic tumor volume in positron emission tomography. Am J Nucl Med Mol Imaging (2018) 8(6):373–86.
29. Cottereau AS, Meignan M, Nioche C, Capobianco N, Clerc J, Chartier L, et al. Risk stratification in diffuse large b-cell lymphoma using lesion dissemination and metabolic tumor burden calculated from baseline PET/CT(†). Ann Oncol (2021) 32(3):404–11. doi: 10.1016/j.annonc.2020.11.019
30. Milgrom SA, Rechner L, Berthelsen A. The optimal use of PET/CT in the management of lymphoma patients. Br J Radiol (2021) 94(1127). doi: 10.1259/bjr.20210470
31. Moghbel MC, Kostakoglu L, Zukotynski K, Chen DL, Nadel H, Niederkohr R, et al. Response assessment criteria and their applications in lymphoma: Part 1. J Nucl Med (2016) 57(6):928–35. doi: 10.2967/jnumed.115.166280
32. Seam P, Juweid ME, Cheson BD. The role of FDG-PET scans in patients with lymphoma. Blood (2007) 110(10):3507–16. doi: 10.1182/blood-2007-06-097238
33. JH O, Lodge MA, Wahl RL. Practical PERCIST: A simplified guide to PET response criteria in solid tumors 1.0. Radiology (2016) 280(2):576–84. doi: 10.1148/radiol.2016142043
34. Hatt M, Tixier F, Pierce L, Kinahan PE, Le Rest CC, Visvikis D. Characterization of PET/CT images using texture analysis: the past, the present… any future? Eur J Nucl Med Mol Imaging (2017) 44(1):151–65. doi: 10.1007/s00259-016-3427-0
35. Sridhar P, Mercier G, Tan J, Truong MT, Daly B, Subramaniam RM. FDG PET metabolic tumor volume segmentation and pathologic volume of primary human solid tumors. AJR Am J roentgenology (2014) 202(5):1114–9. doi: 10.2214/ajr.13.11456
36. Tamayo P, Martín A, Díaz L, Cabrero M, García R, García-Talavera P, et al. (18)F-FDG PET/CT in the clinical management of patients with lymphoma. Rev espanola medicina Nucl e imagen Mol (2017) 36(5):312–21. doi: 10.1016/j.remn.2017.03.004
37. Hofman MS, Hicks RJ. How we read oncologic FDG PET/CT. Cancer Imaging (2016) 16(1):35. doi: 10.1186/s40644-016-0091-3
38. Rahman WT, Wale DJ, Viglianti BL, Townsend DM, Manganaro MS, Gross MD, et al. The impact of infection and inflammation in oncologic (18)F-FDG PET/CT imaging. Biomedicine pharmacotherapy = Biomedecine pharmacotherapie (2019) 117:109168. doi: 10.1016/j.biopha.2019.109168
39. Lin LI-K. A concordance correlation coefficient to evaluate reproducibility. Biometrics (1989) 45(1):255–68.
40. Altman DG, Bland JM. Measurement in medicine: The analysis of method comparison studies. J R Stat Soc Ser D (The Statistician) (1983) 32(3):307–17. doi: 10.2307/2987937
41. Lee DW, Gardner R, Porter DL, Louis CU, Ahmed N, Jensen M, et al. Current concepts in the diagnosis and management of cytokine release syndrome. Blood (2014) 124(2):188–95. doi: 10.1182/blood-2014-05-552729
42. RStudio Team. RStudio: Integrated Development for R. RStudio, Inc., Boston, MA (2015). (Computer Software v0.98.1074) Available at: http://www.rstudio.com/.
43. Pietrzak A, Marszalek A, Paterska M, Golusinski P, Narozna J, Cholewinski W. Initial and delayed metabolic activity of palatine tonsils measured with the PET/CT-dedicated parameters. Diagnostics. (2020) 10(10):836. doi: 10.3390/diagnostics10100836
44. Pietrzak AK, Czepczynski R, Wierzchoslawska E, Cholewinski W. Detection of the prostate cancer bone metastases: Is it feasible to compare 18F-fluorocholine PET/CT, 18F-fluorodeoxyglucose PET/CT and 99mTc-methyl diphosphonate bone scintigraphy? Urol J (2018) 15(5):242–7. doi: 10.22037/uj.v0i0.4065
45. Martens RM, Noij DP, Koopman T, Zwezerijnen B, Heymans M, de Jong MC, et al. Predictive value of quantitative diffusion-weighted imaging and 18-F-FDG-PET in head and neck squamous cell carcinoma treated by (chemo)radiotherapy. Eur J Radiol (2019) 113:39–50. doi: 10.1016/j.ejrad.2019.01.031
46. Adam JA, Loft A, Chargari C, Delgado Bolton RC, Kidd E, Schöder H, et al. EANM/SNMMI practice guideline for [(18)F]FDG PET/CT external beam radiotherapy treatment planning in uterine cervical cancer v1.0. Eur J Nucl Med Mol Imaging (2021) 48(4):1188–99. doi: 10.1007/s00259-020-05112-2
47. Lopci E, Hicks RJ, Dimitrakopoulou-Strauss A, Dercle L, Iravani A, Seban RD, et al. Joint EANM/SNMMI/ANZSNM practice guidelines/procedure standards on recommended use of [(18)F]FDG PET/CT imaging during immunomodulatory treatments in patients with solid tumors version 1.0. Eur J Nucl Med Mol Imaging (2022) 49(7):2323–41. doi: 10.1007/s00259-022-05780-2
48. Johnson SA, Kumar A, Matasar MJ, Schöder H, Rademaker J. Imaging for staging and response assessment in lymphoma. Radiology (2015) 276(2):323–38. doi: 10.1148/radiol.2015142088
49. Voorhees TJ, Zhao B, Oldan J, Hucks G, Khandani A, Dittus C, et al. Pretherapy metabolic tumor volume is associated with response to CD30 CAR T cells in Hodgkin lymphoma. Blood Adv (2022) 6(4):1255–63. doi: 10.1182/bloodadvances.2021005385
50. Kashyap R, Lau E, George A, Seymour JF, Lade S, Hicks RJ, et al. High FDG activity in focal fat necrosis: a pitfall in interpretation of posttreatment PET/CT in patients with non-Hodgkin lymphoma. Eur J Nucl Med Mol Imaging (2013) 40(9):1330–6. doi: 10.1007/s00259-013-2429-4
51. Schwartz LH, Litière S, de Vries E, Ford R, Gwyther S, Mandrekar S, et al. RECIST 1.1-update and clarification: From the RECIST committee. Eur J Cancer (2016) 62:132–7. doi: 10.1016/j.ejca.2016.03.081
52. Julka PK, Doval DC, Gupta S, Rath GK. Response assessment in solid tumours: a comparison of WHO, SWOG and RECIST guidelines. Br J Radiol (2008) 81(966):444–9. doi: 10.1259/bjr/32785946
53. Nishino M, Jagannathan JP, Ramaiya NH, Van den Abbeele AD. Revised RECIST guideline version 1.1: What oncologists want to know and what radiologists need to know. AJR Am J roentgenology (2010) 195(2):281–9. doi: 10.2214/ajr.09.4110
54. Fedorov A, Beichel R, Kalpathy-Cramer J, Clunie D, Onken M, Riesmeier J, et al. Quantitative imaging informatics for cancer research. JCO Clin Cancer Inf (2020) 4:444–53. doi: 10.1200/cci.19.00165
Keywords: metaboloic tumor burden, CART-therapy, lymphoma – diagnosis, imaging in CAR-T therapy, reproducible imaging biomarkers
Citation: Choi JW, Dean EA, Lu H, Thompson Z, Qi J, Krivenko G, Jain MD, Locke FL and Balagurunathan Y (2023) Repeatability of metabolic tumor burden and lesion glycolysis between clinical readers. Front. Immunol. 14:994520. doi: 10.3389/fimmu.2023.994520
Received: 14 July 2022; Accepted: 10 January 2023;
Published: 15 February 2023.
Edited by:
Heying Duan, Stanford University, United StatesReviewed by:
Luca Camoni, University of Brescia, ItalyAlessandro Gonfiotti, University of Florence, Italy
Copyright © 2023 Choi, Dean, Lu, Thompson, Qi, Krivenko, Jain, Locke and Balagurunathan. This is an open-access article distributed under the terms of the Creative Commons Attribution License (CC BY). The use, distribution or reproduction in other forums is permitted, provided the original author(s) and the copyright owner(s) are credited and that the original publication in this journal is cited, in accordance with accepted academic practice. No use, distribution or reproduction is permitted which does not comply with these terms.
*Correspondence: Frederick L. Locke, RnJlZGVyaWNrLkxvY2tlQG1vZmZpdHQub3Jn; Yoganand Balagurunathan, eW9nYW5hbmQuYmFsYWd1cnVuYXRoYW5AbW9mZml0dC5vcmc=
†These authors have contributed equally to this work