- 1Stem Cell Translational Research Center, Tongji Hospital, School of Medicine, Tongji University, Shanghai, China
- 2Shanghai Institute of Stem Cell Research and Clinical Translation, Shanghai East Hospital, School of Medicine, Tongji University, Shanghai, China
- 3Division of Rheumatology, Tongji Hospital of Tongji University School of Medicine, Shanghai, China
by Cui Y, Zhang H, Wang Z, Gong B, Al-Ward H, Deng Y, Fan O, Wang J, Zhu W and Sun YE (2023). Front. Immunol. 14:1212330. doi: 10.3389/fimmu.2023.1212330
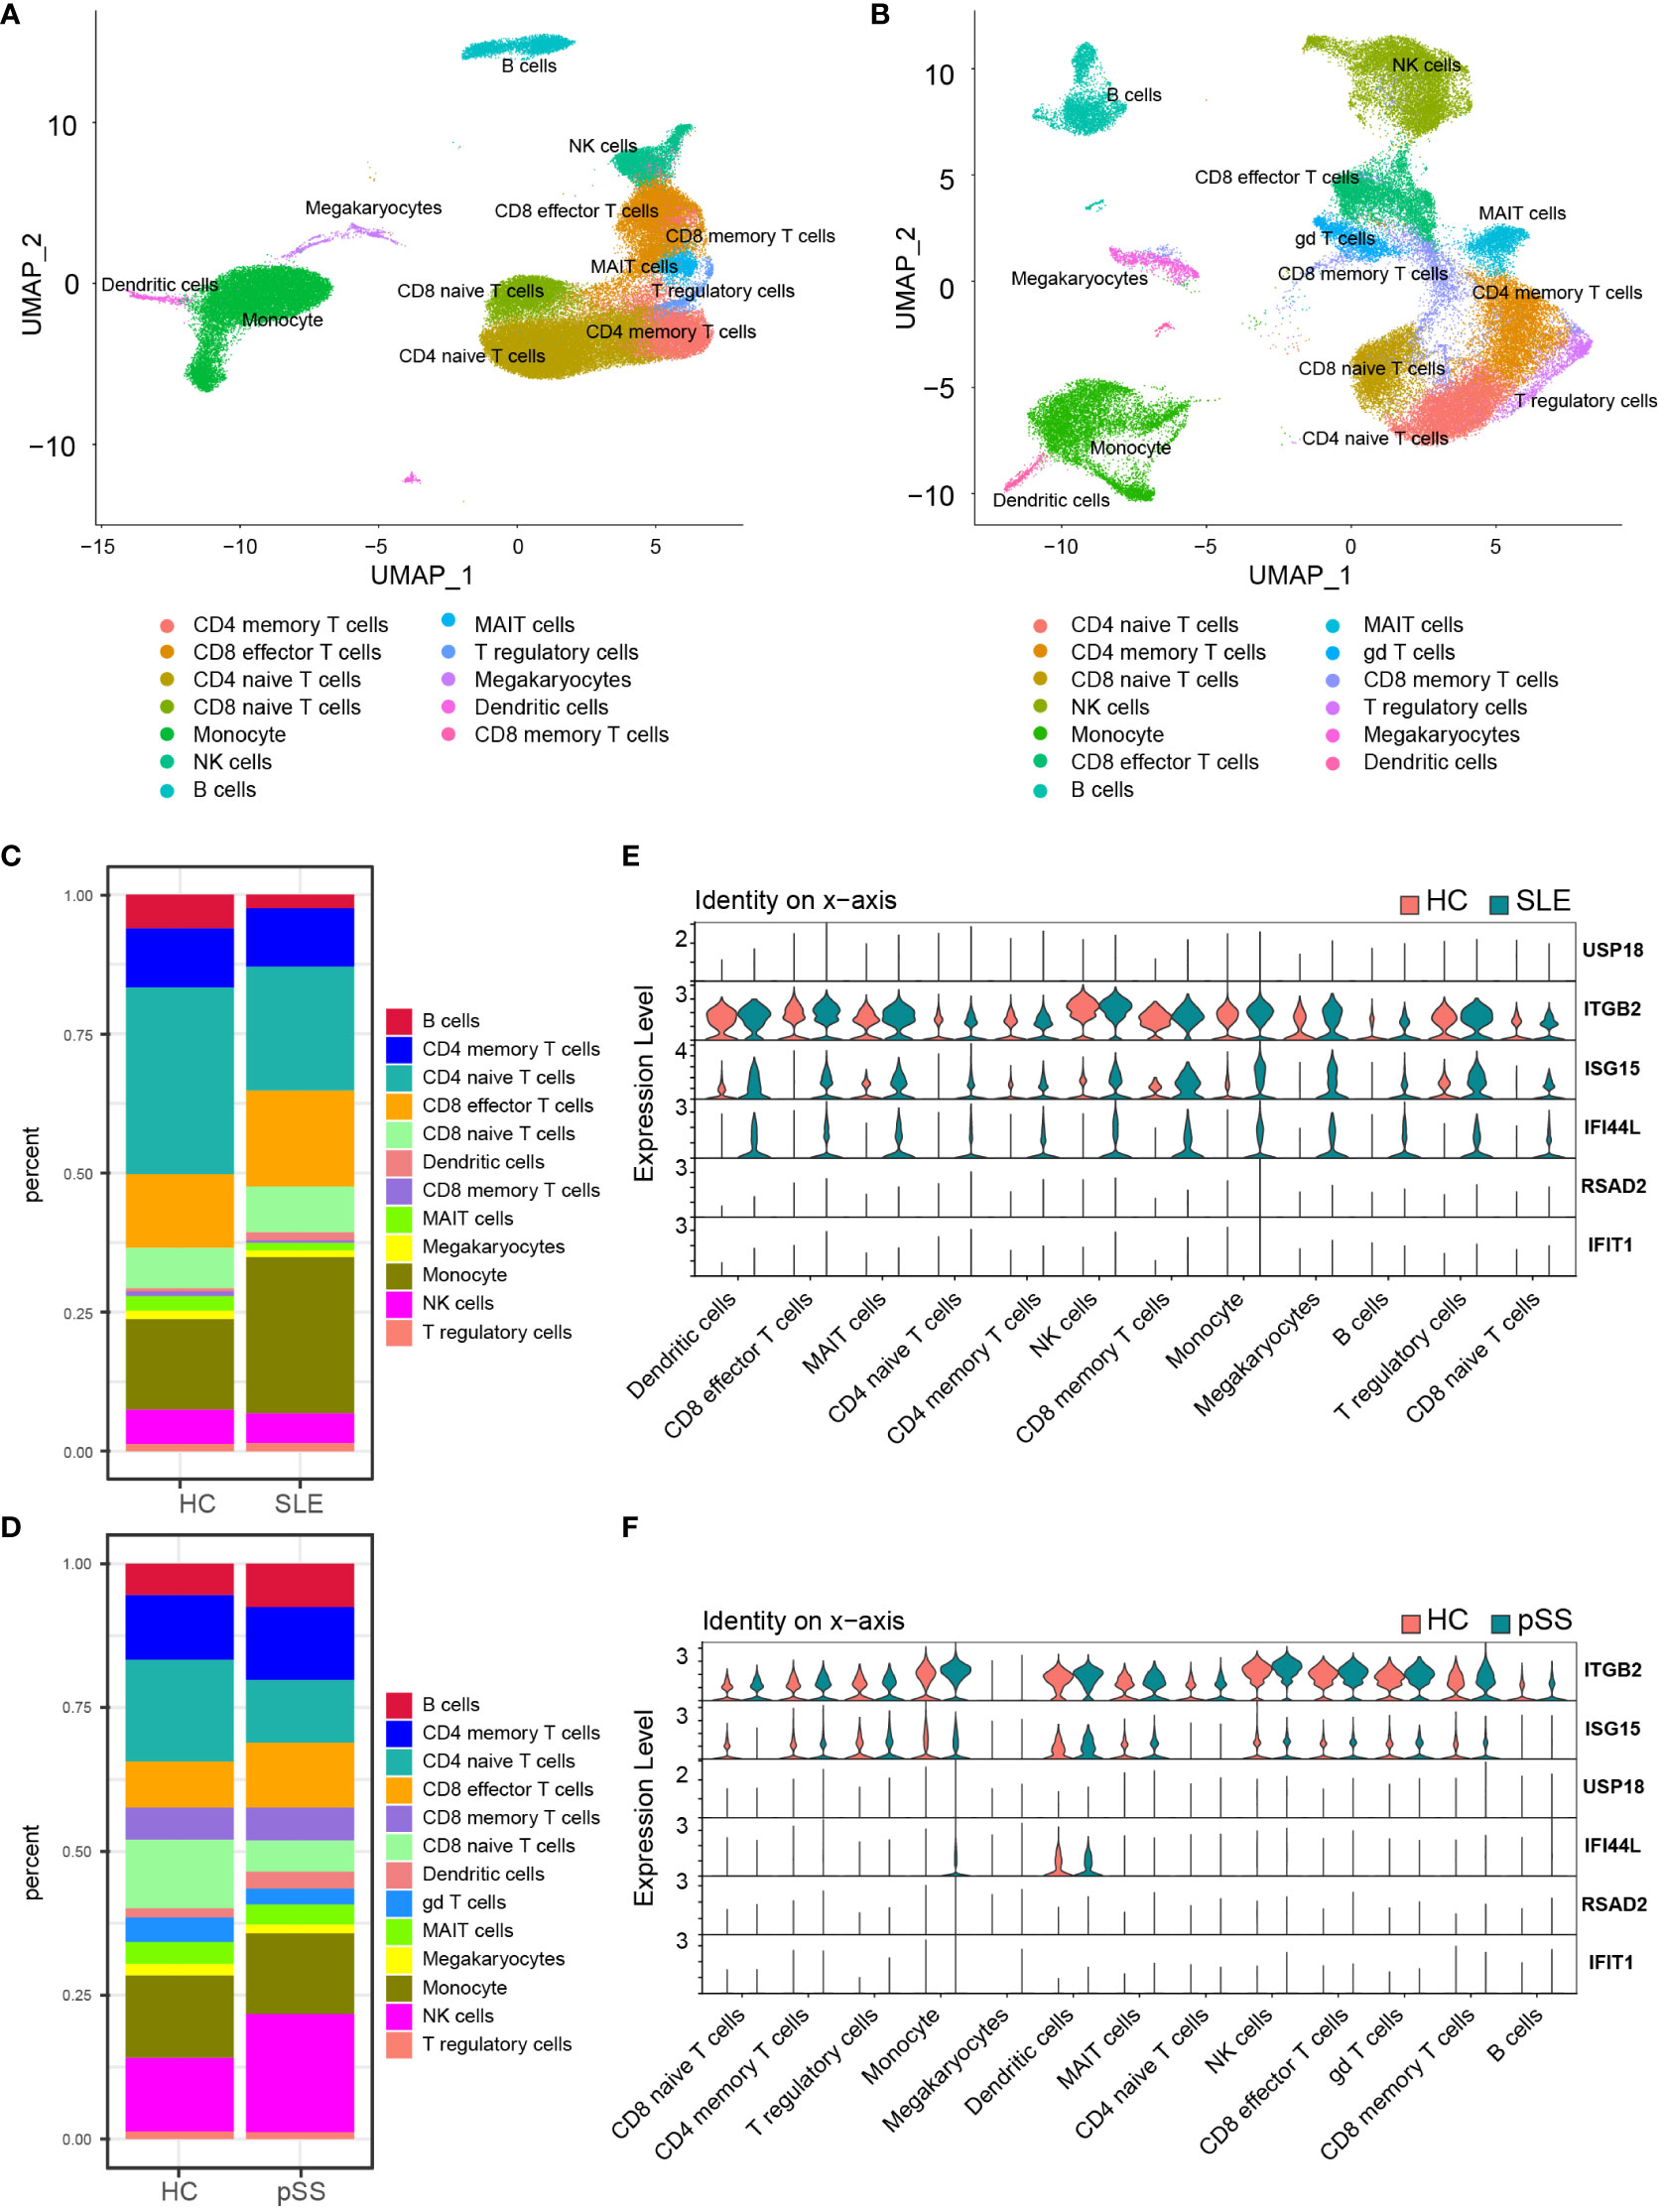
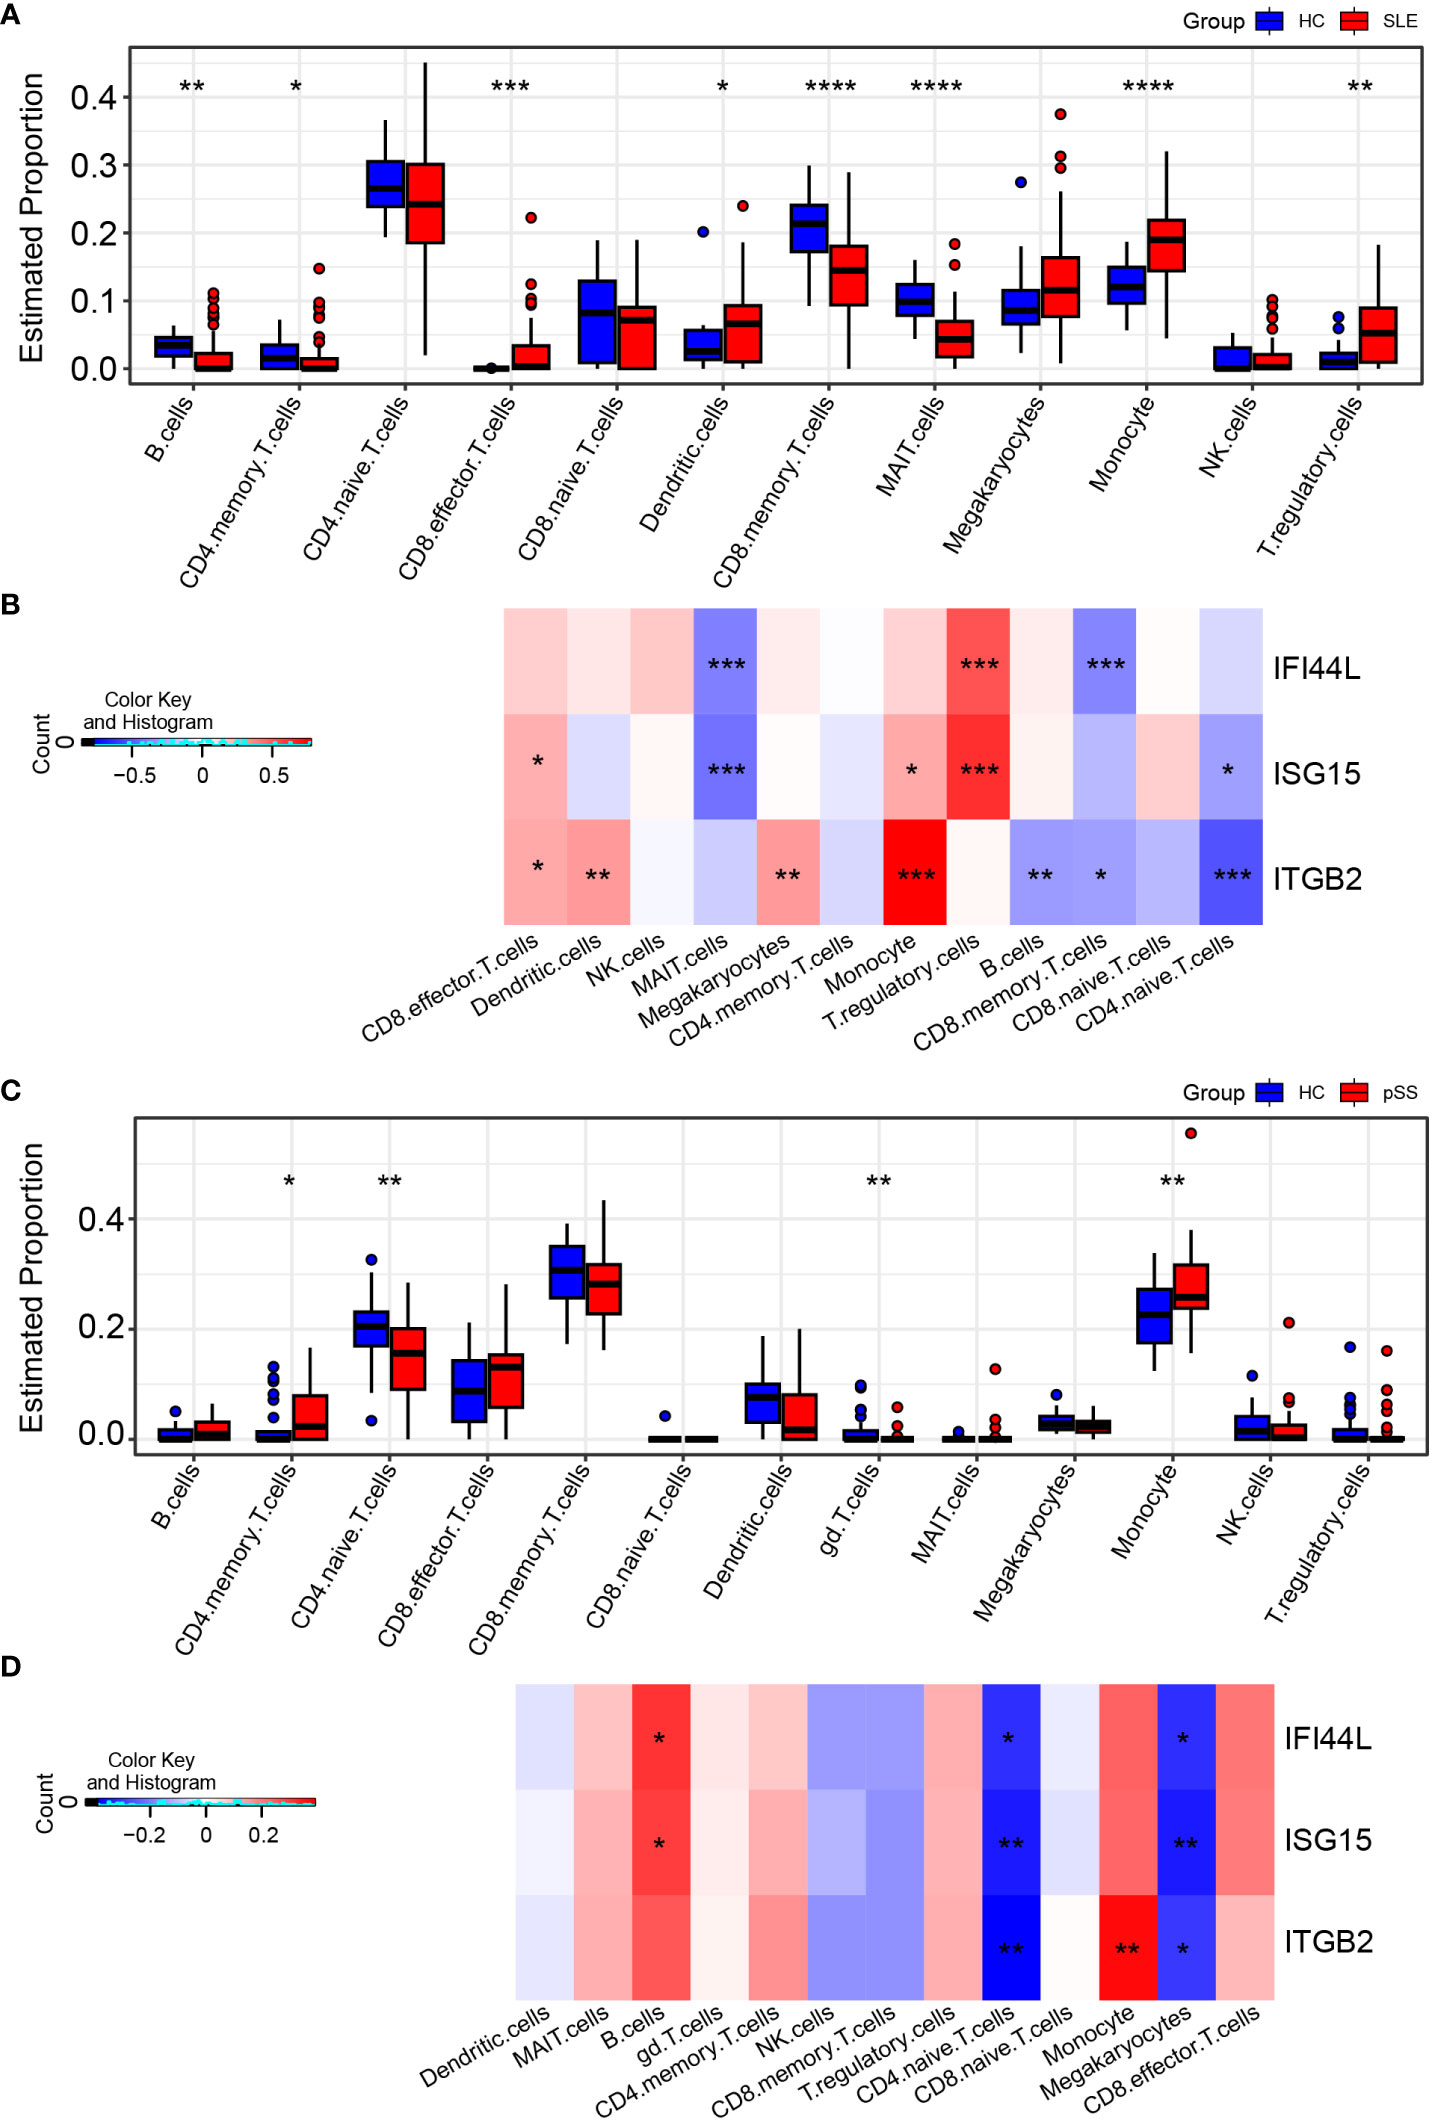
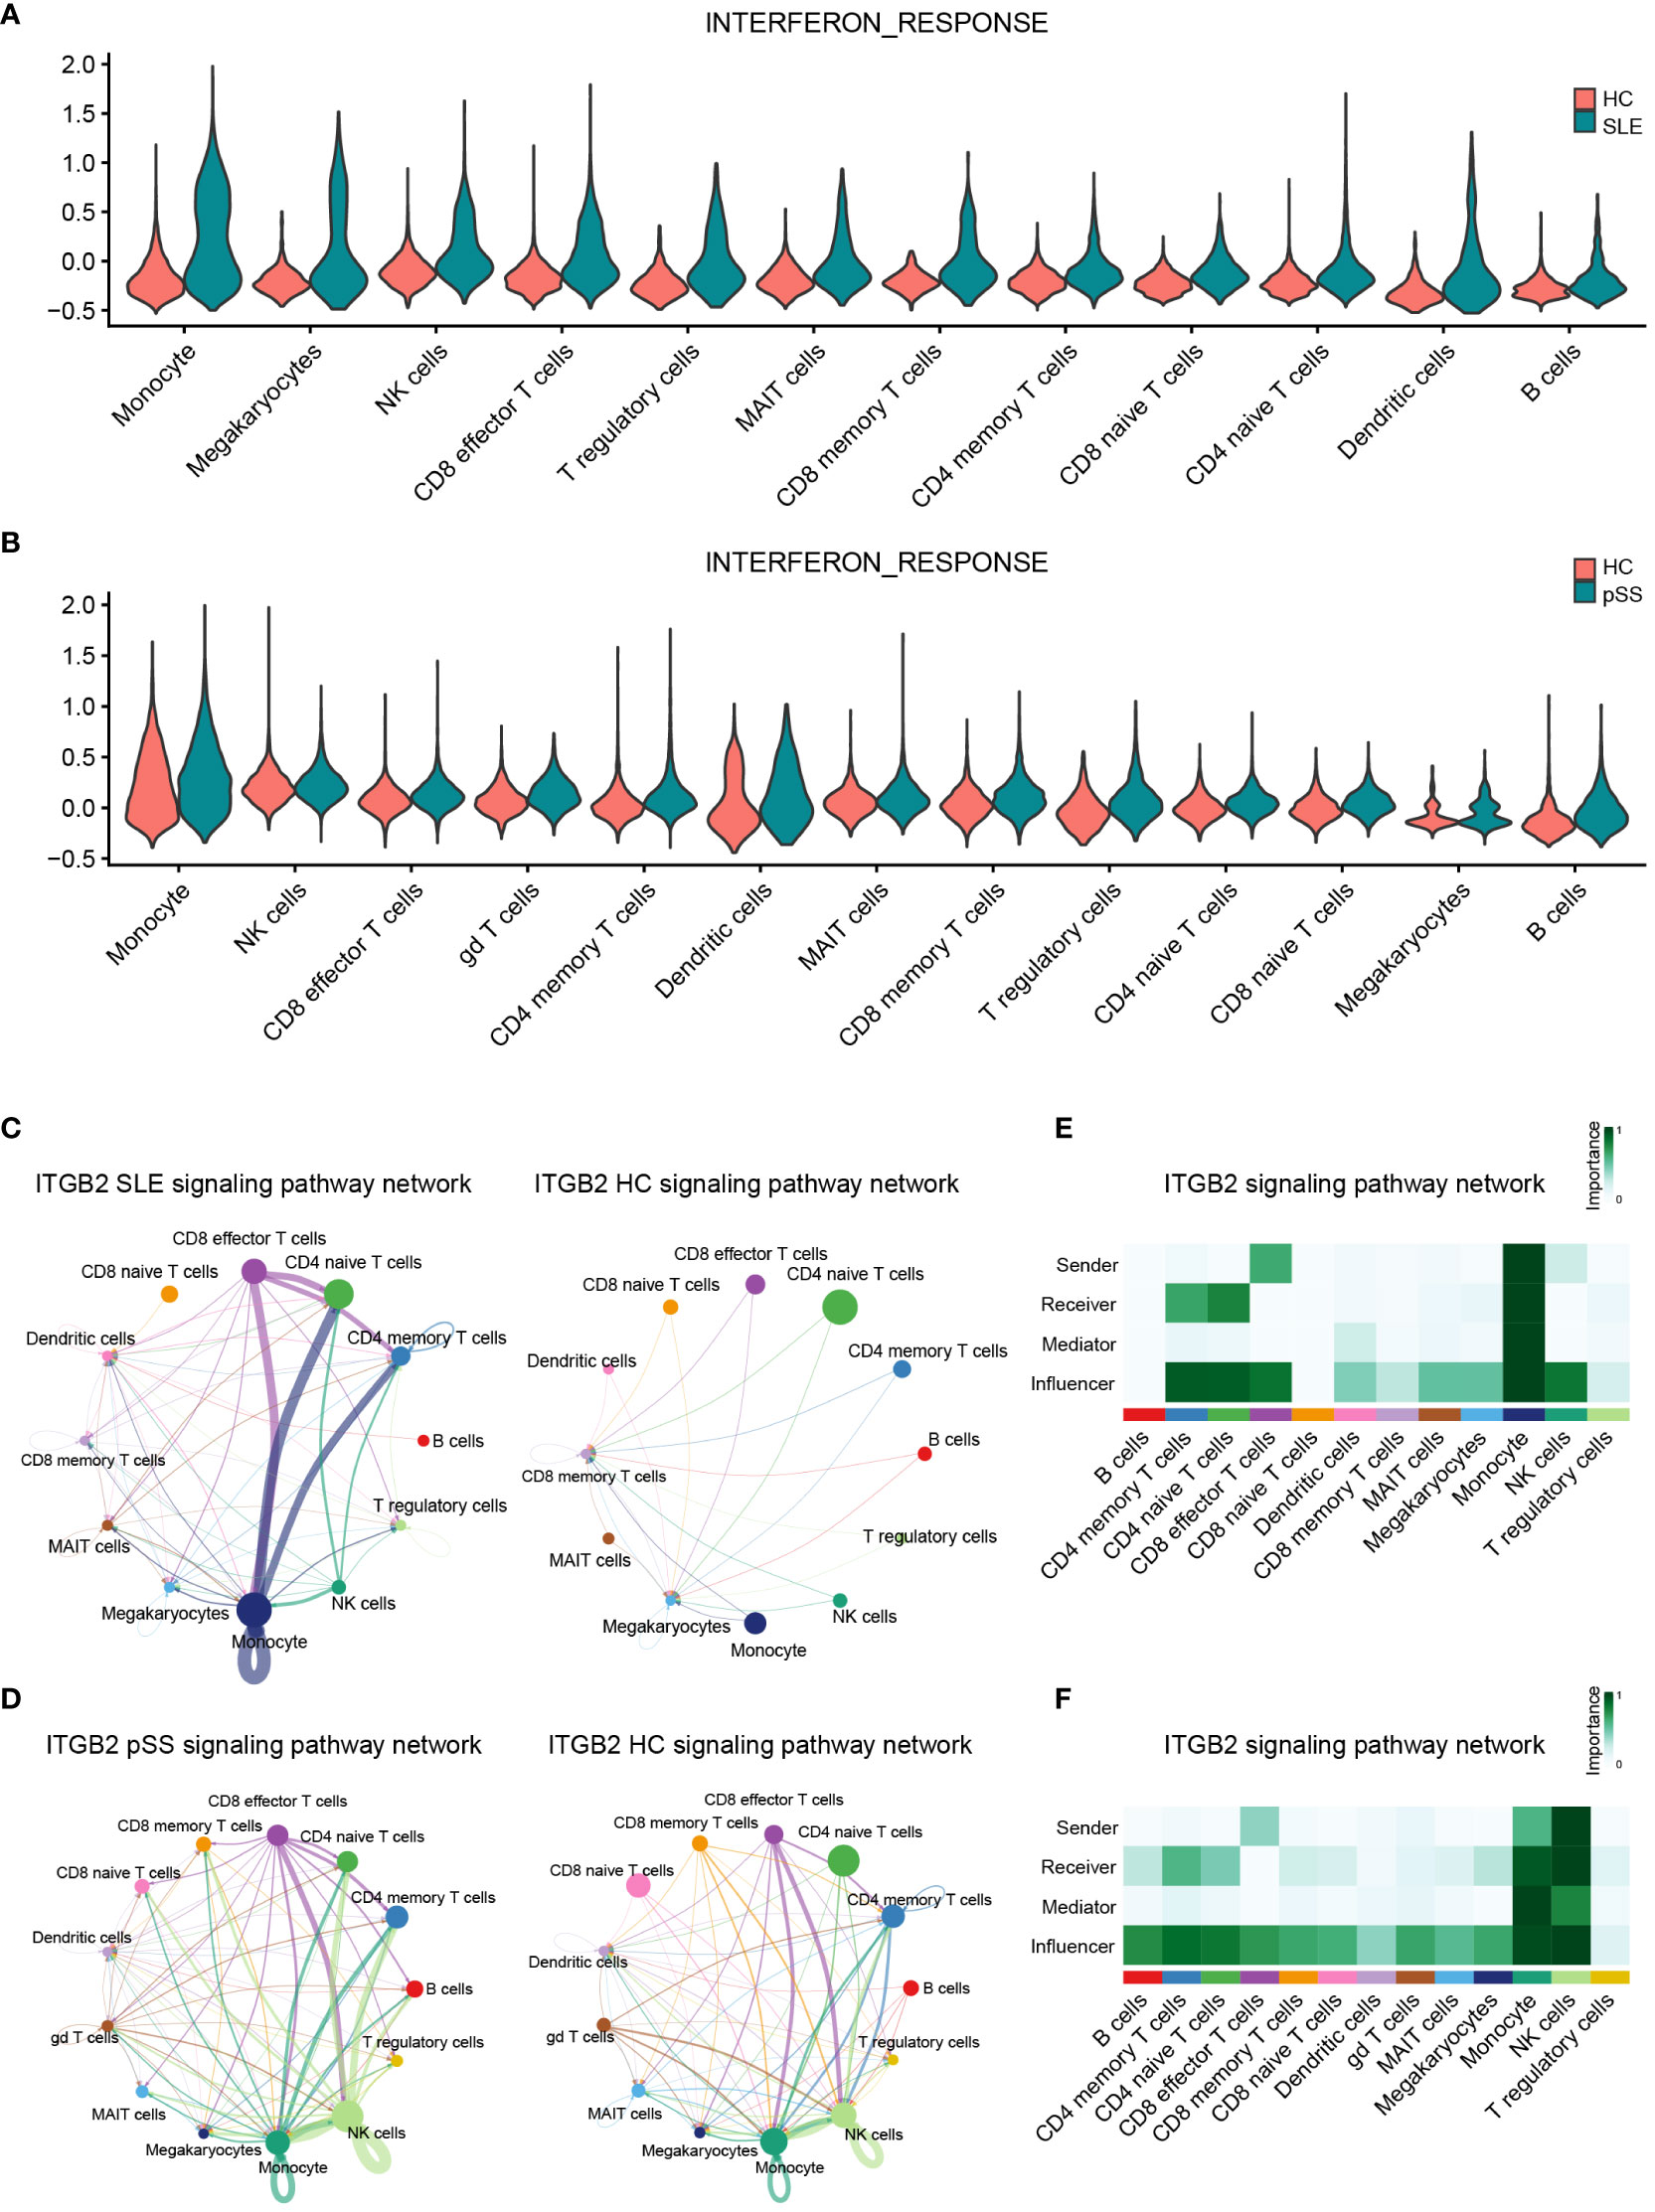
In the published article, there was an error in Figures 8C, 9A, 9B, 10C, 10E and Supplementary Figures S5E, S6A, S7E as published. We noticed that a cell type was incorrectly described. The “gd T cells” should be “CD8 memory T cells” in our article since the R codes were not revised in time. The corrected Figures 8, 9, 10 and Supplementary Figures 5, 6 and 7 and their captions “FIGURE 8 Validation of hub genes in scRNA-seq datasets”, “FIGURE 9 Landscape map of IC in SLE and pSS datasets”, “FIGURE 10 Verification of related pathways in scRNA-seq datasets”, “Supplementary Figure 5 Functional analysis of upregulated DEGs in scRNA-seq”, “Supplementary Figure 6 Heatmap of correlation matrix”, “Supplementary Figure 7 The expression levels of ITGB2 signaling pathway related genes (ITGB2, ICAM1, ICAM2, CD226 and ITGAL)” appear below or can be found in the Supplementary Material of the original article.

Figure 8 Validation of hub genes in scRNA-seq datasets. (A) UMAP visualization GSE157278 scRNA-seq datasets. (B) UMAP visualization GSE135779 scRNAseq datasets; Different colors indicate distinct cell types. (C) Cellular composition in SLE and HCs group (D) Cellular composition in pSS and HCs group. The colors represent different cell types. (E) Violin plot of hub genes expression in different cell types in SLE. (F) Violin plot of hub genes expression in different cell types in pSS. SLE, systemic lupus erythematosus; pSS, primary Sjögren’s syndrome.

Figure 9 Landscape map of IC in SLE and pSS datasets. (A) Boxplot showing the differences of IC between SLE and HC. (B) Correlation matrix between IC and hub gene in SLE. (C) Boxplot showing the differences of IC between pSS and HC. (D) Correlation matrix between IC and hub gene in pSS. Red: positive correlation; blue: negative correlation. SLE, systemic lupus erythematosus; pSS, primary Sjögren’s syndrome. *p < 0.05, **p < 0.01, ***p < 0.001, ****p < 0.0001.

Figure 10 Verification of related pathways in scRNA-seq datasets. (A) Violin plot of INTERFERON_RESPONSE expression in SLE. (B) Violin plot of INTERFERON_RESPONSE expression in pSS. (C) Circos plot showing the ITGB2 signaling pathway network across major cell types in SLE and HCs. (D) Circos plot showing the ITGB2 signaling pathway network across major cell types in pSS and HCs. (E) Heatmap showing the relative importance of each cell type based on the computed four network centrality measures of the ITGB2 signaling pathway in SLE. (F) Heatmap showing the relative importance of each cell type based on the computed four network centrality measures of the ITGB2 signaling pathway in pSS. SLE, systemic lupus erythematosus; pSS, primary Sjögren’s syndrome.
The authors apologize for this error and state that this does not change the scientific conclusions of the article in any way. The original article has been updated.
Publisher’s note
All claims expressed in this article are solely those of the authors and do not necessarily represent those of their affiliated organizations, or those of the publisher, the editors and the reviewers. Any product that may be evaluated in this article, or claim that may be made by its manufacturer, is not guaranteed or endorsed by the publisher.
Keywords: systemic lupus erythematosus, primary Sjögren’s syndrome, bioinformatics, hub genes, TFs, scRNA-seq
Citation: Cui Y, Zhang H, Wang Z, Gong B, Al-Ward H, Deng Y, Fan O, Wang J, Zhu W and Sun YE (2023) Corrigendum: Exploring the shared molecular mechanisms between systemic lupus erythematosus and primary Sjögren’s syndrome based on integrated bioinformatics and single-cell RNA-seq analysis. Front. Immunol. 14:1339929. doi: 10.3389/fimmu.2023.1339929
Received: 17 November 2023; Accepted: 27 November 2023;
Published: 08 December 2023.
Edited and Reviewed by:
Kuang-Hui Sun, National Yang Ming Chiao Tung University, TaiwanCopyright © 2023 Cui, Zhang, Wang, Gong, Al-Ward, Deng, Fan, Wang, Zhu and Sun. This is an open-access article distributed under the terms of the Creative Commons Attribution License (CC BY). The use, distribution or reproduction in other forums is permitted, provided the original author(s) and the copyright owner(s) are credited and that the original publication in this journal is cited, in accordance with accepted academic practice. No use, distribution or reproduction is permitted which does not comply with these terms.
*Correspondence: Yi Eve Sun, eWkuZXZlLnN1bkBnbWFpbC5jb20=
†These authors have contributed equally to this work
 Yanling Cui
 Huina Zhang1,2†
 Bangdong Gong
 Hisham Al-Ward
 Junbang Wang