
94% of researchers rate our articles as excellent or good
Learn more about the work of our research integrity team to safeguard the quality of each article we publish.
Find out more
ORIGINAL RESEARCH article
Front. Immunol. , 18 January 2024
Sec. Cancer Immunity and Immunotherapy
Volume 14 - 2023 | https://doi.org/10.3389/fimmu.2023.1335207
This article is part of the Research Topic The Role of TGF-beta Superfamily Members in Immune Homeostasis and Disease View all 6 articles
 Katarina Pinjusic1
 Giovanna Ambrosini2,3
 Joao Lourenco4Nadine Fournier4Christian Iseli2,3
 Nicolas Guex2,3Olga Egorova1
 Sina Nassiri4†
 Daniel B. Constam1*
The transforming growth factor-β (TGF-β) family member activin A (hereafter Activin-A) is overexpressed in many cancer types, often correlating with cancer-associated cachexia and poor prognosis. Activin-A secretion by melanoma cells indirectly impedes CD8+ T cell-mediated anti-tumor immunity and promotes resistance to immunotherapies, even though Activin-A can be proinflammatory in other contexts. To identify underlying mechanisms, we here analyzed the effect of Activin-A on syngeneic grafts of Braf mutant YUMM3.3 mouse melanoma cells and on their microenvironment using single-cell RNA sequencing. We found that the Activin-A-induced immune evasion was accompanied by a proinflammatory interferon signature across multiple cell types, and that the associated increase in tumor growth depended at least in part on pernicious STING activity within the melanoma cells. Besides corroborating a role for proinflammatory signals in facilitating immune evasion, our results suggest that STING holds considerable potential as a therapeutic target to mitigate tumor-promoting Activin-A signaling at least in melanoma.
Therapies that enhance the ability of the immune system to recognize and eliminate cancer cells have significantly improved patient survival across some but not all tumor types (1). Ongoing clinical efforts to boost anti-tumor immunity include targeted delivery of agonists of the stimulator of interferon response cGAMP interactor (STING) pathway (2). However, chronic activation of this and other pro-inflammatory signals such as interferon (IFN)-γ can lead to tolerogenic responses and immune evasion (2–5). The efficacy or durability of available immunotherapies thus is limited by primary or acquired therapy resistance in a large proportion of patients. Mechanisms of resistance include the paucity of tumor antigens or their inefficient presentation to immune cells, resistance to T cell-mediated killing, and T cell exclusion that can be mediated by immunosuppressive cells in the tumor microenvironment (TME), inhibition of dendritic cell (DC) maturation or recruitment, downregulation of proinflammatory cytokines, or upregulation of immune checkpoint receptors and their ligands or other inhibitory factors (3, 4). In addition, chronic inflammation of tumors evading immune-mediated elimination frequently reprograms the microenvironment to provide a panoply of factors that stimulate tumor vascularization and cancer cell survival, proliferation, and migration, thereby promoting disease progression instead of tumor immune surveillance.
Activin-A, a secreted TGF-β related protein encoded by the INHBA gene, binds to complexes of cognate activin receptors (ActR)-IIA or -IIB with ActR-IB (also known as ALK4), or with the lower affinity type I receptor ActR-IC (also known as ALK7 or ACVR1C) (6). These proteins are encoded by ACVR2A, ACVR2B, and ACVR1B or ACVR1C, respectively. Receptor binding enables the phosphorylation and nuclear translocation of the transcription factors SMAD2 and SMAD3, as well as non-canonical signal transduction mediated by phosphoinositide 3-kinase (PI3K) and mitogen-activated kinase (MAPK) pathways (7, 8). Activin-A can be secreted by numerous cell types, including cells of the innate and adaptive immune systems, where it can promote or inhibit immune responses, depending on the cell state (9). Activin-A signaling can also inhibit or promote tumor progression, depending on the tumor type and its context (10–12). Elucidating tumor-promoting functions of INHBA and their underlying mechanisms is important, because increased expression and elevated circulating Activin-A levels in various cancer types correlate with poor prognosis and with cancer-associated cachexia (13–15). In addition, several recent studies implicate Activin-A in facilitating tumor immune evasion and immunotherapy resistance. In particular, overexpression of INHBA in syngeneic grafts of mouse B16-F1 or YUMM3.3 mouse melanoma, or inhibition of endogenous Activin-A in syngeneic iBIP2 melanoma grafts by a ligand trap revealed that Activin-A secretion by the cancer cells stimulates both primary and metastatic tumor growth specifically in immunocompetent hosts, but not in nu/nu or Rag1-/- mice lacking adaptive immunity (16, 17). Immune profiling of these preclinical melanoma models by flow cytometry, together with T cell depletion experiments and adoptive cell transfers showed that Activin-A inhibits anti-tumor immunity by attenuating CD8+ T cell infiltration, correlating with diminished secretion of the chemokines CXCL9 and CXCL10 by myeloid cells. By contrast, the activation of cytotoxic T cells by antigen in vitro and their cytotoxicity after adoptive cell transfer were not inhibited, confirming that Activin-A impaired their function indirectly (17). Immunosuppressive Activin-A signaling in melanoma and possibly other cancers is likely clinically relevant because elevated INHBA expression correlates with resistance to immune checkpoint blockade (ICB) therapy in melanoma patients and impairs the response to both ICB and T cell-based immunotherapy in mouse melanoma grafts (17). In keeping with a role in promoting tumor immune evasion, INHBA overexpression in keratinocytes in a transgenic model of skin squamous cell carcinoma has been shown to alter the TME by enriching immunosuppressive macrophages and regulatory T cells at the expense of skin-resident γδ T cells (18, 19). In addition, recent studies using single-cell and spatial transcriptomics analysis of basal cell carcinomas have identified Activin-A as a tissue remodeling factor in the invasive niche and as a biomarker for an immunosuppressive TME with CD8 T cell exclusion in ICB-resistant patients (20, 21). Together, these findings established Activin-A as an important TME remodeling factor that promotes tumor immune evasion and resistance to ICB therapy. However, a comprehensive analysis of the TME composition and transcriptome changes induced by Activin-A in cancer is lacking.
Here, we used the syngeneic mouse melanoma model YUMM3.3 and single-cell RNA sequencing (scRNA-seq) analysis to interrogate the changes induced by INHBA overexpression in tumor cells. Besides identifying cell types in the TME that respond to Activin-A, our analysis shows that Activin-A-induced melanoma growth involves the STING pathway and upregulation of interferon (IFN) signaling via JAK transcription factors. Together, these findings shed important new light on the mechanisms mediating a tumor-promoting function of Activin-A in melanoma.
For all cell lines, culture media were supplemented with 10% fetal bovine serum, 50 µg/mL gentamicin (Gibco, Thermo Fisher Scientific, Waltham, MA, USA), and 1% GlutaMAX (Gibco). HEK293T cells were purchased from ATCC and maintained in DMEM (Sigma-Aldrich, St. Louis, MO, USA). YUMM3.3-Ctrl and -βA cells were previously described (17) and maintained in DMEM/F12 (Gibco). Cell morphology was regularly inspected, and cultures tested negative for mycoplasma (Mycospy kit, Biontex) were used throughout the study.
YUMM3.3-Ctrl and -βA cells with stable expression of GFP were generated by lentiviral transduction. In short, HEK293T cells were co-transfected with CMVΔR8.74 (Addgene, Watertown, MA, USA 22036), pMD2.VSVg (Addgene 12259) and GFP containing transfer vector, shLuc, shSting 320 or shSting 266 transfer plasmid (provided by Dr. Denarda Dangaj Laniti) or Fucci reporter (provided by Dr. Cathrin Brisken). Lentiviral particles were collected from filtered culture supernatant by ultracentrifugation and resuspended in sterile PBS. YUMM3.3-Ctrl or -βA cells were transduced in a 12-well plate. GFP transduction efficiency was over 95% and was not further selected, while shLuc,shSting 320 and 266 cell lines were selected by culturing for 2 weeks with 300 µg/ml G418 (InvivoGen, ant-gn).
For quantification of the cytostatic effect of IFN-γ, YUMM3.3 cells were seeded at a density of 5x10³ cells/well in 96-well plate and incubated 48 hrs with 20 ng/ml IFN-γ (485-MI, R&D) and 50 ng/ml Activin-A (R&D Systems) or 10 μM SB-431542, and, where indicated, Ruxolitinib or Fludarabine, 0.5 μM Nifuroxazide (all from MedChem Express), 100 μg/ml Carboplatin (C2043-1G, TCI America), E64 (HY-15282, MedChemExpress), or Petesicatib (HY-109069, MedChemExpress). Alamar Blue reagent (Invitrogen, DAL1025) was added to subconfluent cells (<90% confluence, inspected manually), and fluorescence was measured 3-4 hrs later on a TECAN spectrophotometer at the emission wavelength of 590 nm after excitation at 560 nm.
2x10⁵ YUMM3.3 cells were seeded in 24-well plates and incubated with 20 ng/ml IFN-γ (485-MI, R&D Systems), 10 μM SB-431542, 50 ng/ml of Activin-A for 24 h where indicated. Cells were lysed in RIPA buffer supplemented with protease inhibitor cocktail (Roche, Basel, CH) and phosphatase inhibitors (Sigma-Aldrich). Proteins were separated on 9-12% SDS-PAGE gels under reducing conditions and transferred on nitrocellulose membranes. Membranes were blocked with 5% skim milk (Sigma) in Tris-buffered saline containing 0.1% Tween-20, before incubation with primary antibodies against γ-tubulin (Sigma GTU88) or pSTAT (9167S), STAT1 (9172), or STING (13647S) antibodies (all from Cell Signaling) for 2 hrs at room temperature or overnight at 4°C. Chemiluminescence was revealed on X-ray film (Kodak, Rochester, NY, USA) or ChemiDoc MP (Biorad, Hercules, CA, USA) using HRP-coupled secondary antibodies and ECL reagents (Thermo Fisher).
Immortalized mouse cDC1 cells (22) were cultured in IMDM medium supplemented with 10% heat-inactivated FBS, 100x Glutamax, 10 mM HEPES, 100 μM Pen/Strep, 50 μM β-mercaptoethanol at 37° and 5% CO2. PBS supplemented with 20 mM HEPES and 5 mM EDTA was used for cell passaging. For activation, 2.5 x 10⁵ cells were seeded per well in a 12-well plate and incubated for 24 hrs with 5 μg/ml LPS and 10 ng/ml IFN-γ (485-MI, R&D Systems). Where indicated, cells were also incubated with 50 ng/ml recombinant Activin-A, TGF-β (Invitrogen), or BMP4 (Biotechne), or with 10 μM SB-431542. During the last 3 hrs of incubation, Golgi Plug (BD 555029) was added to the cells. Cells were then detached using PBS supplemented with 1% FBS and 2 mM EDTA, washed and stained for surface markers H2Kb FITC (Biolegend, clone AF88.5) and IA/IE AlexaFluor700 (BioLegend, clone M5/114.15.2), followed by fixation and permeabilization using FoxP3 staining buffer set (eBioscience) before intracellular staining with Ki67 eFluor 450 (Invitrogen, clone SolA15) and CXCL9 AlexaFluor647 (eBioscience, clone MIG-2F5.5). After the staining, cells were collected in FACS buffer (2% FBS, 2 mM EDTA in PBS), and data were acquired using an LSRII SORP or an LSR Fortessa cytometer (Becton Dickinson, Franklin Lakes, NJ, USA).
2.5x10⁵ YUMM3.3 cells were injected subcutaneously into the right flank of 8-12 week old female C57BL/6 mice (Charles River laboratories). To inhibit JAK1/2 signaling, mice were treated with 1 mg ruxolitinib (INCB018424) dissolved in 50 µl of DMSO, or a vehicle daily, starting one day before the tumor injection. Tumors were measured 3 times/week, and volumes were calculated using the formula V = [1.58π x (length x width)3/2]/6 (23). All procedures were according to Swiss legislation and approved by the cantonal veterinary administration.
YUMM3.3-Ctrl.GFP and -βA.GFP tumors were dissected, minced using rounded scissors, and digested in Dnase-I (0.02 mg/mL, Sigma) and collagenase (1 mg/mL, Sigma) in RPMI using a gentleMACS Octo Dissociator (Miltenyi). In total, we collected six Ctrl and six βA tumors. Two tumors of each genotype were pooled for each biological replicate based on tumor volumes to have comparable starting amounts for each replicate. To minimize the time that cells spent on the ice, samples were randomized, and live single-cell sorted on two machines (Becton Dickinson FACSAria II and ACSAria Fusion) into GFPhi tumor cells and GFPint stromal populations. For dead cell staining, Propidium Iodide Solution (421301, Biolegend) was added to the cells immediately before sorting. Immediately after sorting, cells were counted, centrifuged at 300 g for 5 min at RT, and resuspended at a density of 1000 cells/μl in DMEM supplemented with 10% filtered FBS. GFPhi fractions were added back to GFPint cells to account for 10% of the final volume. Cell concentrations and quality were again assessed using trypan blue staining. Samples contained less than 5% dead cells and 3-5% doublets. Single-cell RNA sequences were obtained using 10x Genomics Chromium v3.1 kit and Illumina Hiseq 4000.
Following demultiplexing of sequencing libraries into individual FASTQ files, sequencing reads were quantified using Cell Ranger v5 and 10X Genomics pre-built mouse reference genome, which was modified to include the GFP sequence. Cell Ranger’s filtered feature by barcode matrices were then imported into R for downstream analysis. Low quality cells were flagged and excluded using the scuttle Bioconductor package (v1.0.0) with default parameters based on percentage of mitochondrial reads, library size, and number of genes detected per cell. Potential doublets were also excluded using the scDblFinder package from Bioconductor (v1.3.25). Cells that passed the quality control were imported into the Seurat R package (v4.0.2) for further analysis. We performed data normalization and feature selection using the SCTransform functionality with default settings from Seurat. Dimensionality reduction and data integration were subsequently performed using Pearson residuals obtained from SCTransform. Following unsupervised clustering of integrated data using FindNeighbors and FindClusters functionalities with default settings, we used literature-derived marker genes and cell type-specific signatures obtained from PanglaoDB database to annotate major cell types (24). We used the presto R package (https://github.com/immunogenomics/presto) that provides a fast implementation of Wilcoxon rank sum test and auROC analysis to further derive cluster- and cell type-specific marker genes, as well as to perform differential expression analysis between βA and Ctrl samples. Given that cells from the same sample are not independent observations, p-values obtained from Wilcoxon rank sum test can be too optimistic; therefore we used predictive power defined as abs(AUC-0.5)*2, along with log fold change for gene ranking. We defined the predictive power multiplied by logFC as the ranking statistic to perform pre-ranked GSEA of Hallmark pathways from MSigDB, using the fGSEA package (v1.15.2) from Bioconductor (25). For downregulated genes, the predictive power values were multiplied with -1 to indicate that the fold change in gene expression was negative. To further explore T cell states, we projected our data unto a published reference atlas of mouse T cell states (26), using the functionalities provided by the authors (https://github.com/carmonalab/ProjecTILs).
To assess gene ontologies enriched in INHBA-expressing human melanomas, we mined public data of the PanCancer Atlas Studies (https://www.cbioportal.org/). The mRNA Expression, RSEM (Batch normalized from Illumina HiSeq_RNASeqV2) patient data were separated into quartiles based on INHBA mRNA expression z-scores relative to all samples (log RNA Seq V2 RSEM). Only patients with the lowest (1st quartile) and highest (4th quartile) expression levels were compared. Genes significantly up-regulated (p<0.05 and logFC>0) in the highest INHBA-expressing tumors were used for gene ontology enrichment analysis in Enrichr (27).
In order to study intercellular communication, we used the nichenetr R package (v1.1.0). The analysis was aimed at predicting which target genes in receiver cell populations were most likely to be affected by changes in the expression of Inhba in tumor cells (sender cells). As a prior model of ligand-receptor, receptor-target and ligand-target interactions, we used the prebuilt ligand-target matrix (“https://zenodo.org/record/3260758/files/ligand_target_matrix.rds”), ligand-receptor network (“https://zenodo.org/record/3260758/files/lr_network.rds”) and weighted integrated network (“https://zenodo.org/record/3260758/files/weighted_networks.rds”). Gene symbols were converted from human to mouse based on one-to-one orthology. We considered receptors as active if expressed in receiver cells. As potential targets, we only considered genes expressed in at least 10% of cells in receiver populations, and which were also significantly differentially expressed (P-value ≤ 0.05, average fold change ≥ 0.5). Potential targets were ranked according to regulatory potential (from the prior model), and the top 100 were selected for representation in the circos plot (28).
For BRB-seq, YUMM3.3 cells were seeded in 6-well plates in quadruplicates at a density of 0.5x10⁶ per well and treated with 20 ng/ml IFN-γ and 40 ng/ml Activin-A individually or together for 4 or 12 hrs. Transcriptomes were determined by paired-end sequencing of a MERCURIUS BRB-seq library (Alithea Genomics) using an Illumina NovaSeq 6000 instrument. DEG analysis was performed using DESeq2 v1.36.0 (29). Raw read count matrices were normalized with the median of ratios normalization method implemented in DESeq2 that accounts for sequencing depth and RNA composition. Wald test was used for significance testing. For DEG analysis, adjusted p-values with a threshold of <0.05 were retained. For visualization or clustering, transformed versions of the count data were used using the Variance Stabilizing Transformations (VST) function. This function uses a statistical model to transform the raw count data (normalized by division by dimension or normalization factors), resulting in a matrix of values that have an approximately constant variance across the range of mean values. This normalization produces data transformed on a log2 scale and eliminates the dependence of the variance on the mean. Gene set enrichment analysis (GSEA) was performed using the GSEA function of the Bioconductor ClusterProfiler package (v4.4.4) and the following annotated gene set from MSigDB v6.2: the Hallmark gene set. Normalized enrichment scores and adjusted p-values were calculated separately for each comparison with the genes ranked according to sign(log2FoldChange)*-log10(pval) (25, 30).
The BRB-seq and scRNA-sec data in this publication have been deposited in NCBI’s Gene Expression Omnibus (31) and are accessible through GEO Series accession numbers GSE247229 (https://www.ncbi.nlm.nih.gov/geo/query/acc.cgi?acc=GSE247229) and GSE247228 (https://www.ncbi.nlm.nih.gov/geo/query/acc.cgi?acc=GSE247228, respectively.
Statistical tests were performed using the Prism software (GraphPad). Unless indicated, data represent mean ± SEM of at least 2 independent experiments. When comparing two groups, normal distributions were analyzed by the Shapiro-Wilk normality test, and p-values calculated by Student’s t-test (normal distribution) or Mann-Whitney’s test (non-parametric test). One-way ANOVA was used to compare several groups of unpaired values. Data points identified as outliers by the regression and outlier (ROUT) removal method in Prism 9 with a False Discovery Rate ≤1% were excluded. Power Analysis was waved by the animal experimentation authorities due to pre-existing data about the effect sizes of Activin-A induced tumor growth and cachexia. Tumor volumes at the endpoint were compared by ANOVA or Student’s t-test, as indicated in the figure legends. Statistical significance of the effect of STING knockdown was independently validated using the Levene test to confirm the assumption that all groups have the same variance, and that the null hypothesis (same variance in all groups) was not rejected. Two-way ANOVA, analysis of the normality of its residuals, and computation of the Tukey Honest Significant Differences (Tukey HSD) to find the means that are significantly different from each other confirmed that there are only differences when comparing any group with the βA groups expressing shLuc.
To assess activin-induced changes in melanoma and in their TME, YUMM3.3 mouse melanoma grafts expressing lentiviral INHBA (βA) or empty control lentivirus (Ctrl) were analyzed by scRNA-seq using the 10x Genomics platform (Figure 1A). To distinguish stromal and cancerous cells, the YUMM3.3-Ctrl and -βA melanoma cells were transduced with lentiviral green fluorescent protein (GFP) expression vector. Flow cytometry and Alamar blue assays confirmed that YUMM3.3-Ctrl and -βA melanoma cell lines each expressed similar levels of GFP and proliferated at comparable rates in vitro (Supplementary Figures 1A, B). Nevertheless, in syngeneic mice, tumor grafts of GFP-expressing YUMM3.3-βA tumors grew faster than Ctrl (Supplementary Figure 1C), as described previously for analogous grafts without GFP (17). To limit the variability among tumor sizes and its potential effect on gene signatures, triplicate Ctrl and βA samples consisting each of two tumors were collected on day 13 post-injection when tumor sizes were not yet significantly enlarged by Activin-A (Supplementary Figures 1D, E). To enrich the sequencing libraries for stromal cell transcripts, we separated single-cell suspensions into GFPhi tumor cells and GFPint/low stromal cells (Supplementary Figure 1F) and then mixed them at a 1:9 ratio. 10X Genomics sequencing yielded 155.8 and 153.5 x 10⁶ reads from a total of 2258 and 2017 cells on average per Ctrl and βA sample, respectively. Library sizes were around 67.8 and 77.1 x 10³ reads, and 2282 and 2894 genes per cell in Ctrl and βA samples, respectively (Supplementary Figures 1G, H, Supplementary Table 1). After filtering out low-quality cells and potential doublets, 25 distinct clusters corresponding to different cell types were identified by the unsupervised clustering of integrated data using FindNeighbors and FindClusters functionalities of Seurat R package (v4.0.2) (Figures 1B, C, Supplementary Figures 1I–K). Analysis of cell numbers revealed that monocytes and macrophages (MonoMacs) were most abundant (5500 cells) and significantly enriched in βA compared to Ctrl tumors (Figure 1D). On the other hand, neutrophils which were the second-most abundant population (1644 cells), as well as rare B cells (37 cells) were instead enriched in Ctrl samples. Other relatively rare cell types included 158 fibroblasts, 134 endothelial cells, and 69 pericytes. Of note, while βA did not affect the number of fibroblasts or endothelial cells, it almost completely depleted pericytes, as well as a distinct cluster of only 50 monocytic progenitor-like cells that we named unknown because they lacked definitive MonoMacs markers (Figures 1D, Supplementary Figures 1L–N). By contrast, the number of tumor-infiltrating T cells, dendritic cells (DCs), natural killer (NK) cells, or basophils (1185, 1113, 600, 585, or 460 cells, respectively) were not significantly altered by βA compared to Ctrl at the early stage examined.
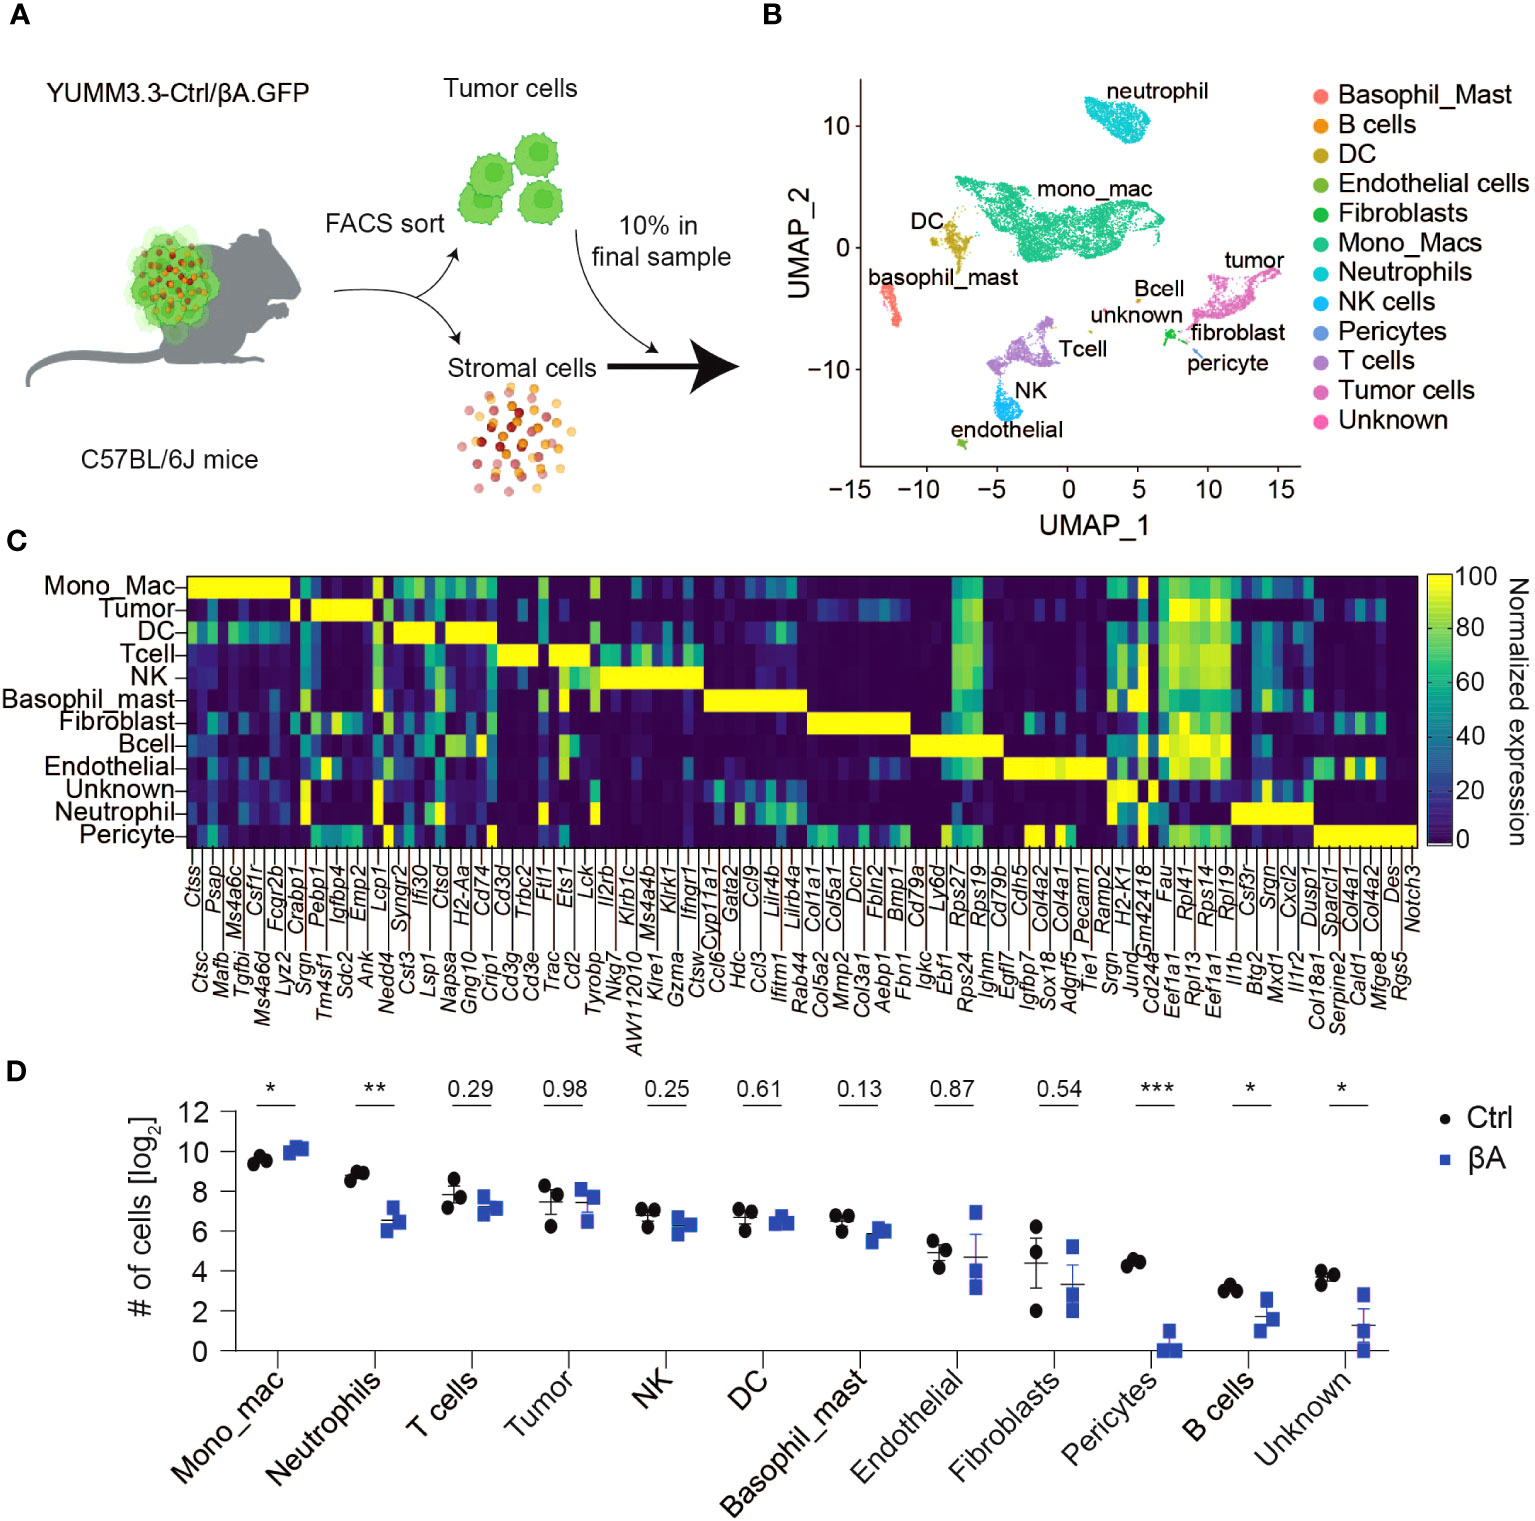
Figure 1 Characterization of YUMM3.3.GFP melanoma for scRNA-seq analysis. (A) Strategy to assess βA-induced changes in tumors by scRNA-seq: YUMM3.3-Ctrl and -βA tumors were dissociated into a single-cell suspension, and GFP+ tumor cells were sorted out by flow cytometry. Tumor cells were added back to account for 10% of cells in a final sample before analysis by 10x Genomics sequencing. (B) Uniform Manifold Approximation and Projection (UMAP) representation of annotated cell types identified in YUMM3.3 tumors. (C) Normalized expression of the top 10 genes used to identify different cell types in tumors. (D) Comparison of numbers of non-immune cells and unknown population (left panel), and immune cells (right panel) identified in Ctrl and βA tumors. Error bars, SEM (n = 3). *p<0.05, **p<0.01, ***p<0.001, Student’s t-test.
To explore which cell types may respond to Activin-A and/or to other TGF-β family members, we first assessed the expression of TGF-β-related ligands and their receptors. Analysis across cell types revealed the highest expression of Inhba in tumor cells, as expected due to lentiviral overexpression (Figures 2A, B). Additionally, tumor cells expressed Bmp2 and low levels of Gdf11, Bmp4, and Tgfb1 (Figures 2A, B; Supplementary Table 2). The most significant source of TGF-β related ligands were fibroblasts, which mostly expressed Inhba, followed by Inhbb, Tgfb1/2/3, Gdf10 and Gdf11 alongside the tolloid-like metalloprotease encoded by Bmp1. Tgfb1 was also transcribed at low levels in all other cell types, except in B cells, and in neutrophils. Fibroblasts also expressed the highest levels of type I and II activin, TGF-β and BMP receptors, except Acvr2b and Acvr1c mRNAs. Acvr2b was even more highly transcribed in tumor cells. Acvr1c mRNA was most abundant in basophils, followed by tumor and NK cells, but below detection in fibroblasts. Acvr1b encoding the type I activin receptor ALK4 was highly expressed in the clusters of fibroblasts, tumor cells, MonoMacs, DCs, endothelial cells, and pericytes. Similar expression patterns were observed for Acvr2a/b receptors and Smad2/3/4, except for DCs that show lower levels of Acvr2b and Smad3 transcripts (Figures 2A, B; Supplementary Table 2). To address which cells in the TME respond to Activin-A, we investigated active ligand-target interactions between cells using the computational method NicheNetR (28). The analysis revealed activin-induced signaling in tumor cells, DCs, MonoMacs, fibroblasts, and endothelial and pericyte populations (Figure 2C). Gene ontology enrichment analysis in tumor cells revealed upregulation of developmental programs such as bone, heart, neuron, and endoderm formation, pseudo-epithelial-mesenchymal transition (EMT) and ECM organization, alongside increased IFN responses, antigen processing, and MHC I presentation (Supplementary Figures 2A, B). Upregulation of a pseudo-EMT signature and of known Smad2,3 target genes such as Pmepa1 and Skil within the tumor cells (Figure 2C) is consistent with increased autocrine Activin-A signaling.
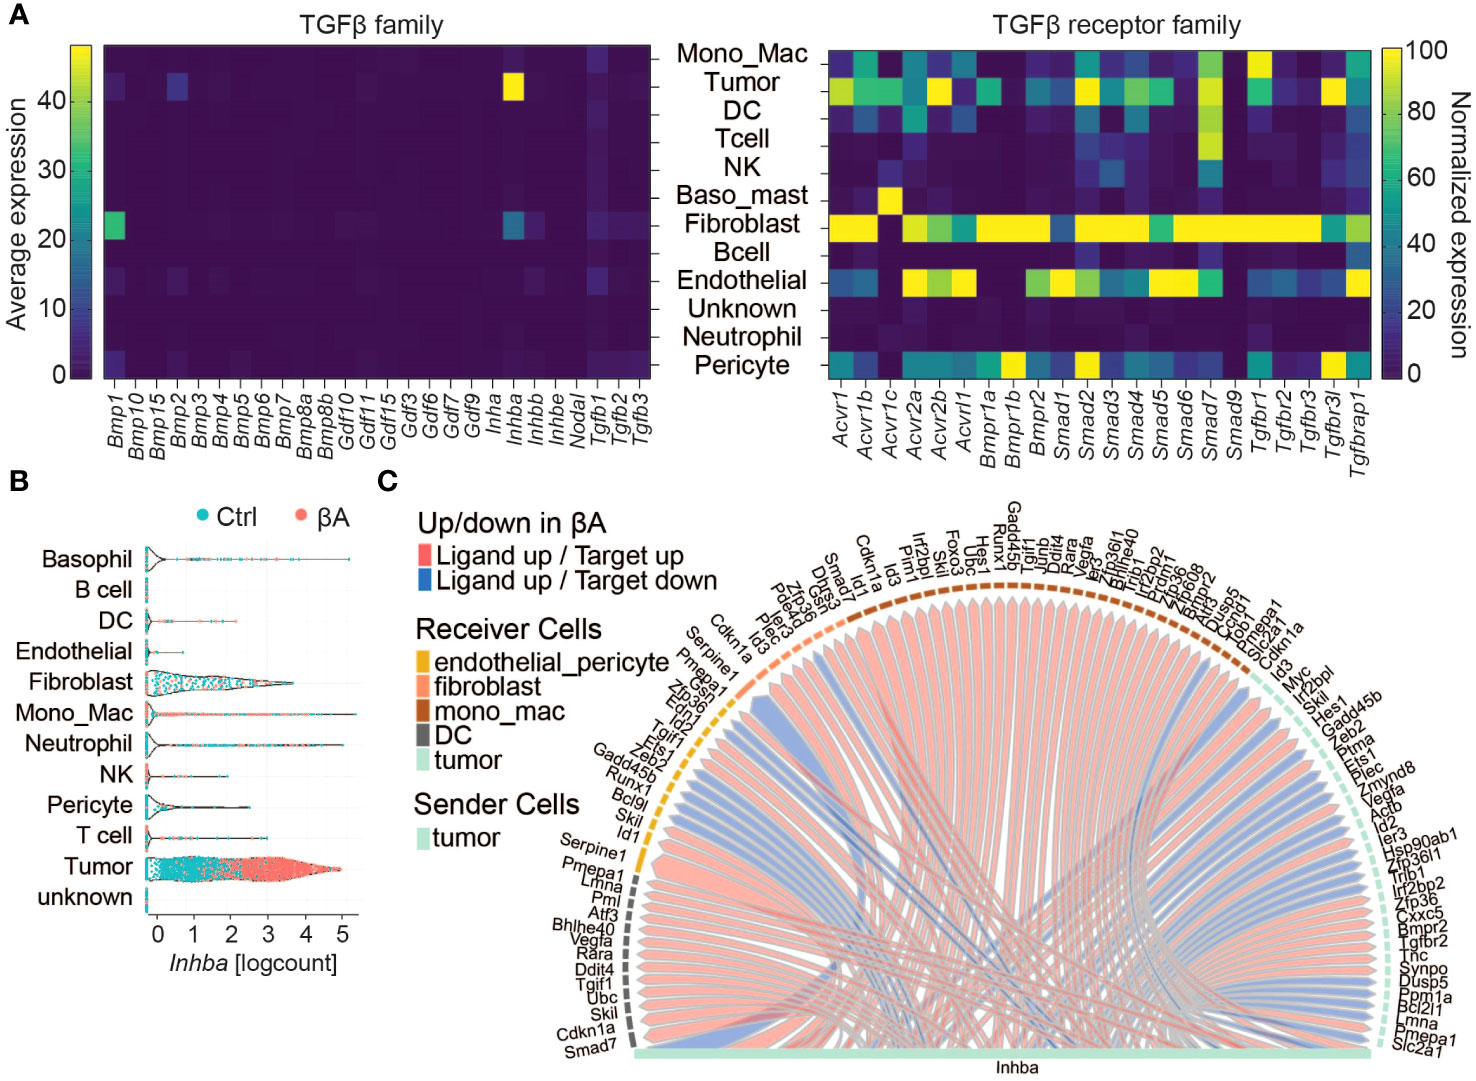
Figure 2 Characterization of Activin-A responding cells in the TME. (A) Left: Heatmap displaying the average expression of TGF-β family members (columns) in different cell types (rows). Right: Normalized expression of TGF-β family receptors (columns) in cell types (rows). (B) Violin plot of INHBA expression in cell types of Ctrl and βA expressing YUMM3.3.GFP tumors. (C) Intercellular communication analysis of Activin-A responsive cells in the TME.
To survey activin-induced changes in the TME related to cancer, we performed gene set enrichment analyses using curated Hallmark gene sets (32). As shown in Figure 3A, the cell types with the most significant changes in these Hallmark signatures in βA compared to Ctrl tumors were DCs, followed by MonoMacs, fibroblasts, tumor cells, and pericytes, whereas T cells were changed the least, consistent with predicted target cells from the intercellular communication analysis. In βA tumors, DCs and MonoMacs, together with almost all other cell types, also significantly increased the signature of hypoxia (Figure 3A, Supplementary Figure 3A). A notable exception were pericytes and tumor cells, where several hypoxia response genes were instead downregulated. On the other hand, the signatures Oxidative phosphorylation and Myc Targets were significantly decreased by βA, especially in fibroblasts, MonoMacs, DCs, and within the tumor cells themselves (Figure 3A, Supplementary Figures 3B, C). Remarkably, aside from pericytes, all cell types in βA tumors showed an elevated inflammatory response signature and signs of increased type I and type II interferon signaling, especially DCs, followed by MonoMacs, fibroblasts, and tumor cells (Figures 3A, B). Concomitantly, MonoMacs, fibroblasts, and tumor cells showed increased TNFA signaling via NFκB in βA as compared to Ctrl tumors (Figure 3A, Supplementary Figure 3D).
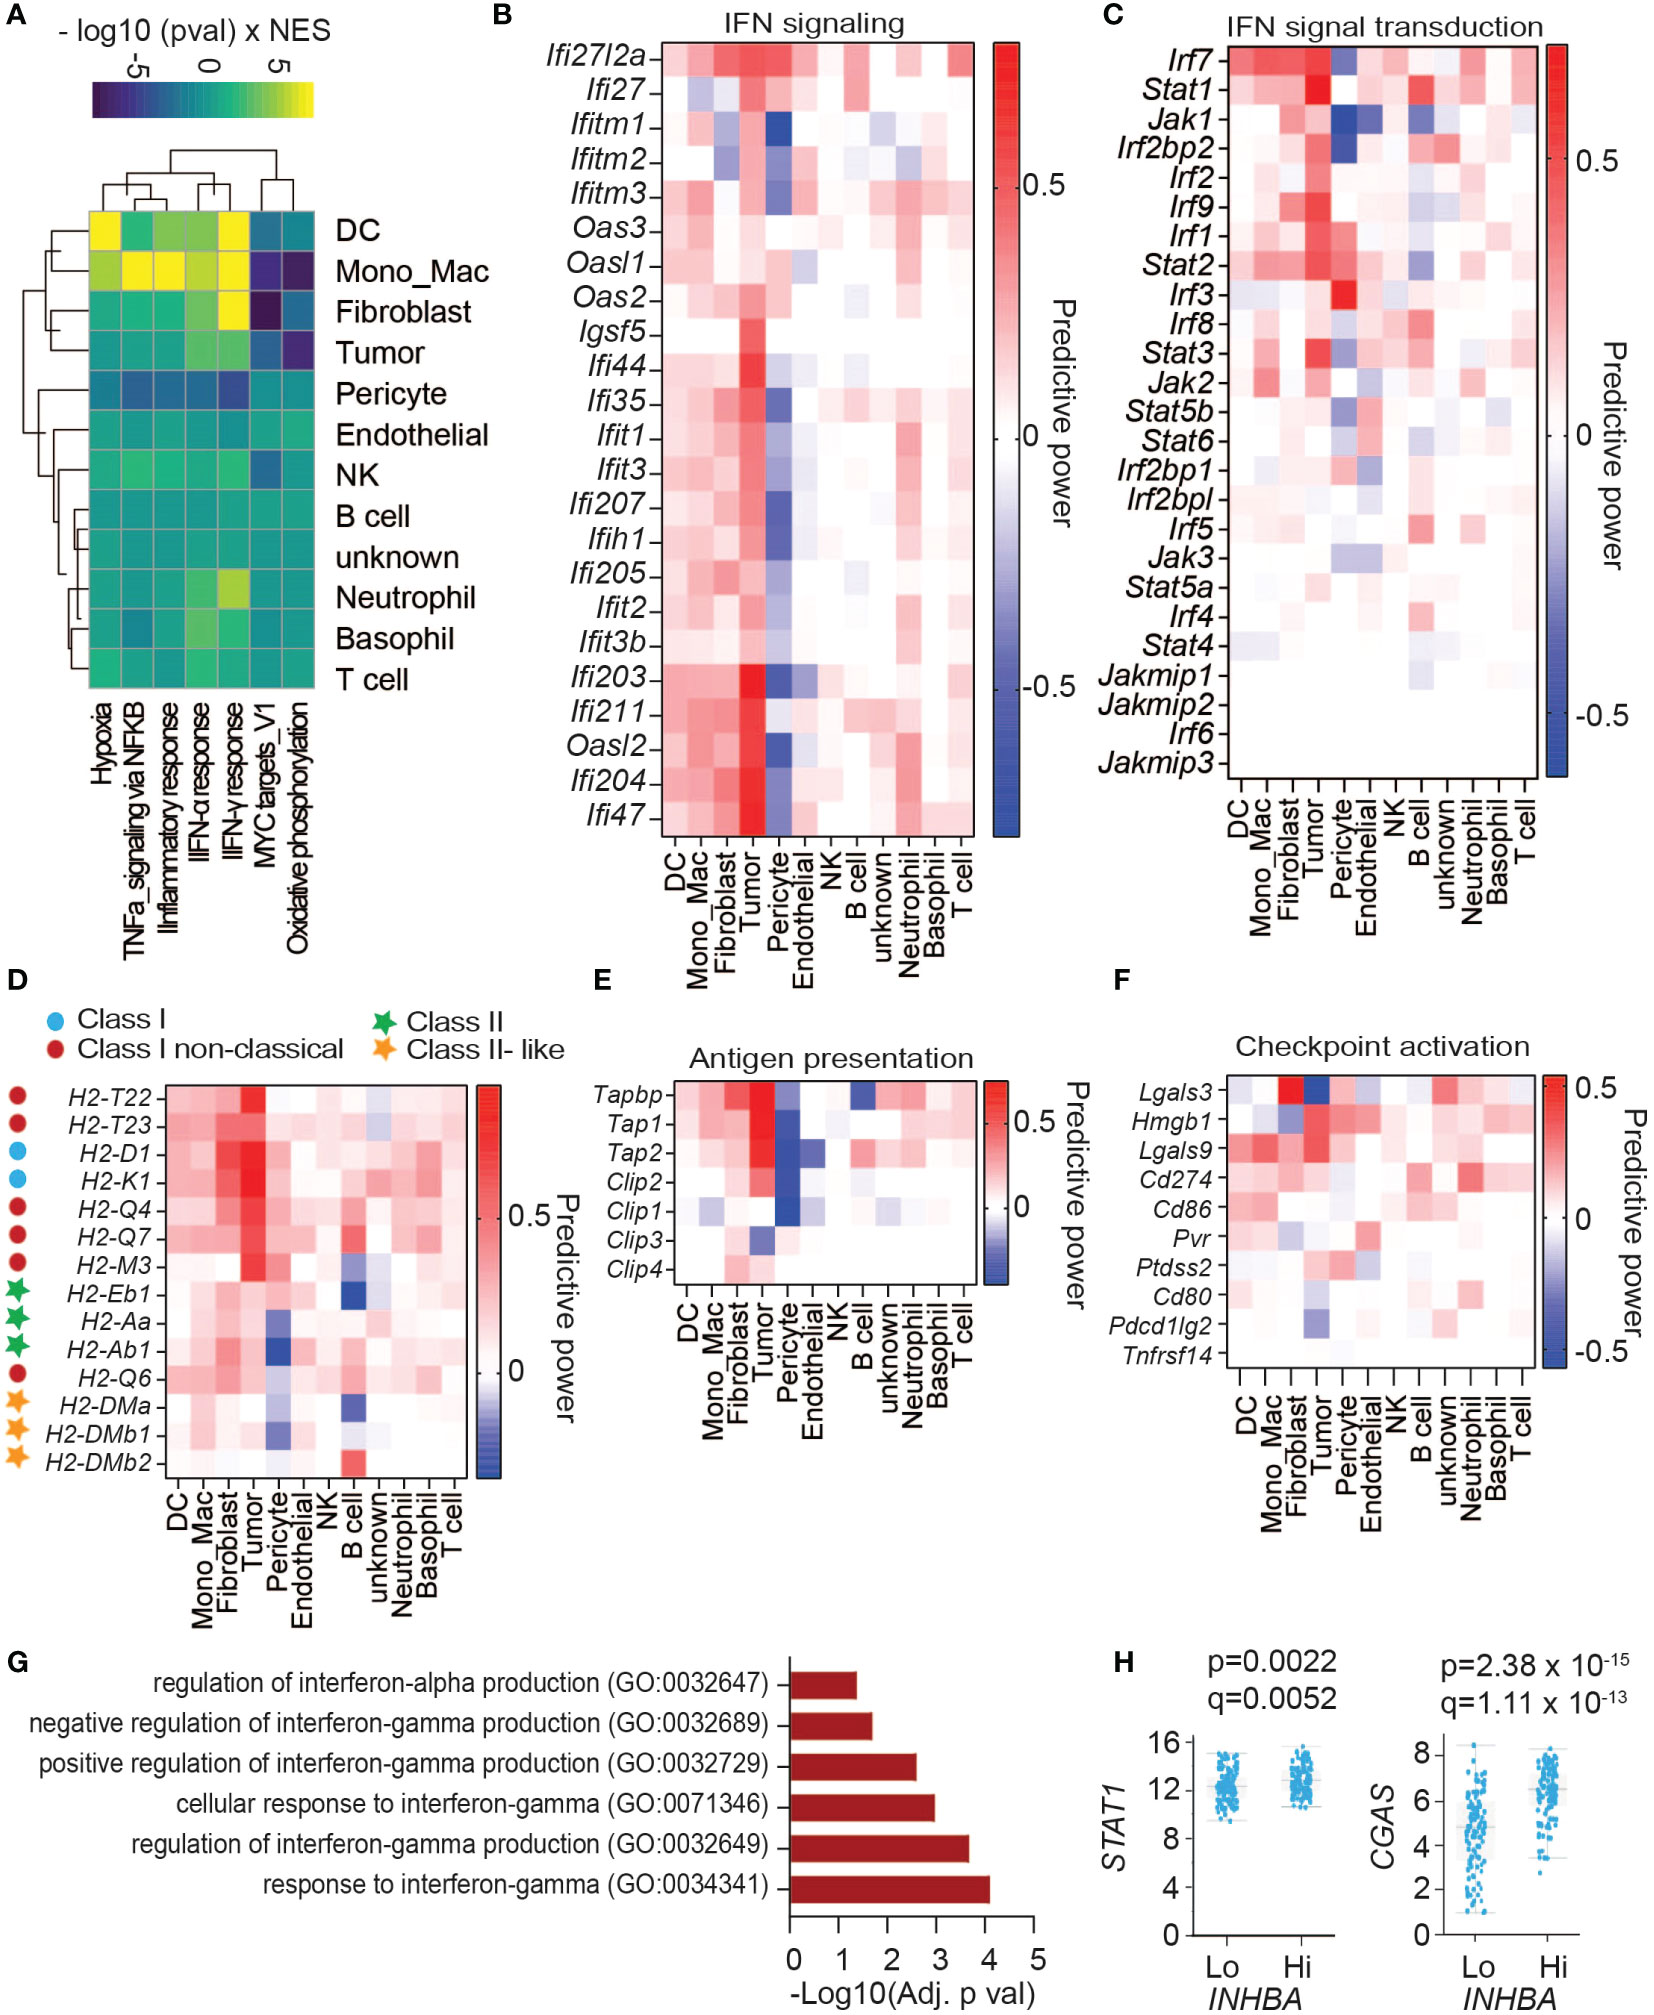
Figure 3 Activin-associated increase in IFN signature does not lead to higher CD8+ T cell infiltration. (A) Heatmap showing top changes in enrichment of cancer Hallmark gene sets (rows) in cell types (columns) induced by melanoma-derived Activin-A. (B) Heatmap showing the predictive power of differentially regulated genes of IFN signaling hallmark signatures. Predictive power was defined as 2 * sign(logFC) * abs(AUC- 0.5), reflecting the directionality of change as well as the discriminatory power. (C–F) Heatmaps showing the predictive power of differentially regulated (C) genes of IFN signaling pathway, (D) MHC genes, (E) genes encoding enzymes that mediate antigen processing, and (F) genes of ligands for immune checkpoints activation. (G, H) GO biological processes enriched among up-regulated genes in PanCancer melanoma sample expressing the highest levels of INHBA (G), and (H) differential expression of STAT1 and CGAS in high compared to low INHBA-expressing melanoma tumors.
Interferon signal transduction is mediated by JAK, STAT, and IRF proteins (33). Analysis of differentially expressed genes (DEGs) showed upregulation of several IFN signal transduction components across cell types, including Irf7, Stat1, Stat2, and to a lesser extent Irf1/2/9 and Jak1/2 expression (Figure 3C). Among these, upregulation of Stat1 expression was most significant within the tumor cells themselves. Key components of an IFN signature involve antigen presentation and immune checkpoints. Analysis of genes involved in antigen processing and presentation showed that βA-expressing tumors upregulated the expression of classical and non-classical MHC-I genes across different cell types, especially in the INHBA-expressing tumor cells themselves (Figure 3D). INHBA-expressing Tumor cells also increased their expression of Transporter Associated With Antigen Processing (TAP) genes responsible for MHC I antigen loading (Figure 3E). A survey of immune checkpoint receptor ligands revealed upregulation of Lgals3 in fibroblasts, Hmgb1 in tumor cells, and Lgals9 and Cd274 across cell clusters (Figure 3F). These data point to increased activation of the corresponding immune checkpoint receptors LAG3, PD1, and TIM3 in βA-expressing tumors. To address whether INHBA expression correlates with increased IFN signaling also in human melanoma, we analyzed the Melanoma PanCancer database. A comparison of tumors expressing low or high INHBA mRNA levels, combined with gene ontology analysis of upregulated genes revealed that INHBA-high tumors upregulate signatures related to cellular responses to type I and II IFNs in (Figure 3G), as well as STAT1 and CGAS expression (Figure 3H). These results suggest that Activin-A enhances IFN signaling also in human tumors.
As the most significantly upregulated Hallmark gene sets in βA tumors were related to inflammatory responses, we systematically surveyed changes in the expression of proinflammatory chemokines, cytokines, and matrix metalloproteases (MMPs). Among cytokines, βA most significantly increased the expression of Il1b, Il18 Il33, and Il15, both within tumor cells and fibroblasts. Il1b expression also increased in DCs and MonoMacs, whereas βA-expressing tumor cells showed also elevated levels of Il16 mRNA (Supplementary Figures 4A, B). Notably, Ifng expression was comparable between the groups (Supplementary Figure 4B). In keeping with the increased enrichment of the IFN signaling gene set described above (Figure 3A), multiple cell types in βA tumors also upregulated the IFN-γ inducible Cxcl9, Cxcl10 and Ccl5 genes.
Despite the observed increase in their mRNA levels, a previous analysis established that secretion of CXCL9 and CXCL10 proteins is not increased by Activin-A, but rather decreased both in tumors and in an activated mouse DC1 cell line (17) (Supplementary Figure 4C). CXCL9 and CXCL10 can be degraded by cysteine proteases of the cathepsin family (34). To address if Activin-A modulates chemokine degradation by cysteine cathepsins, we treated DC1 cells with the cysteine protease inhibitor E64 or with the cathepsin S inhibitor Petesicatib. Treatment of DC1 cells with Activin-A diminished CXCL9 protein levels in DC1 cells regardless of the presence of any of these inhibitors, suggesting that cysteine proteases or cathepsin S are unlikely responsible (Supplementary Figures 4D–F).
Cytokine and chemokine activities may be regulated directly or indirectly through the remodeling of ECM by MMPs (35). Among MMPs, we observed that βA-expressing tumors significantly upregulated MMP2, 3, 14, and 19 (Supplementary Figure 4G). However, potential interactions of these or other proteases with chemokines remain to be explored.
To survey the composition of tumor-infiltrating T cell subsets, we projected our scRNA-seq data onto a reference atlas of T cell signatures (26). Already at the early stage of tumor growth examined here by scRNA-seq, we observed a strong trend for reduced CD8+ T cell infiltration in βA compared to Ctrl tumors, whereas the number of CD4+ T cells was unchanged (Figures 4A, B). Quantification of T cell subtypes based on their gene signatures showed that βA expression reduced the intratumoral accumulation of naïve-like T cells, whereas a trend for a decrease in effector memory T cells and early active CD8+ T cells did not reach statistical significance at this stage, and the number of CD4+ Tregs was unchanged compared to Ctrl (Figure 4C). Interestingly, T cells in βA tumors showed reduced expression of the activation markers CD28 and/or CD69, and analysis of known secreted effector molecules and of selected markers of cell migration revealed that their power values all remained below 0.2, suggesting that they were only minimally changed, or not at all (Figures 4D, E). Observed changes in the gene expression of NK cells were also minimal at the stage examined, with only 25 genes showing power values higher then 0.2 (Supplementary Figure 4H).
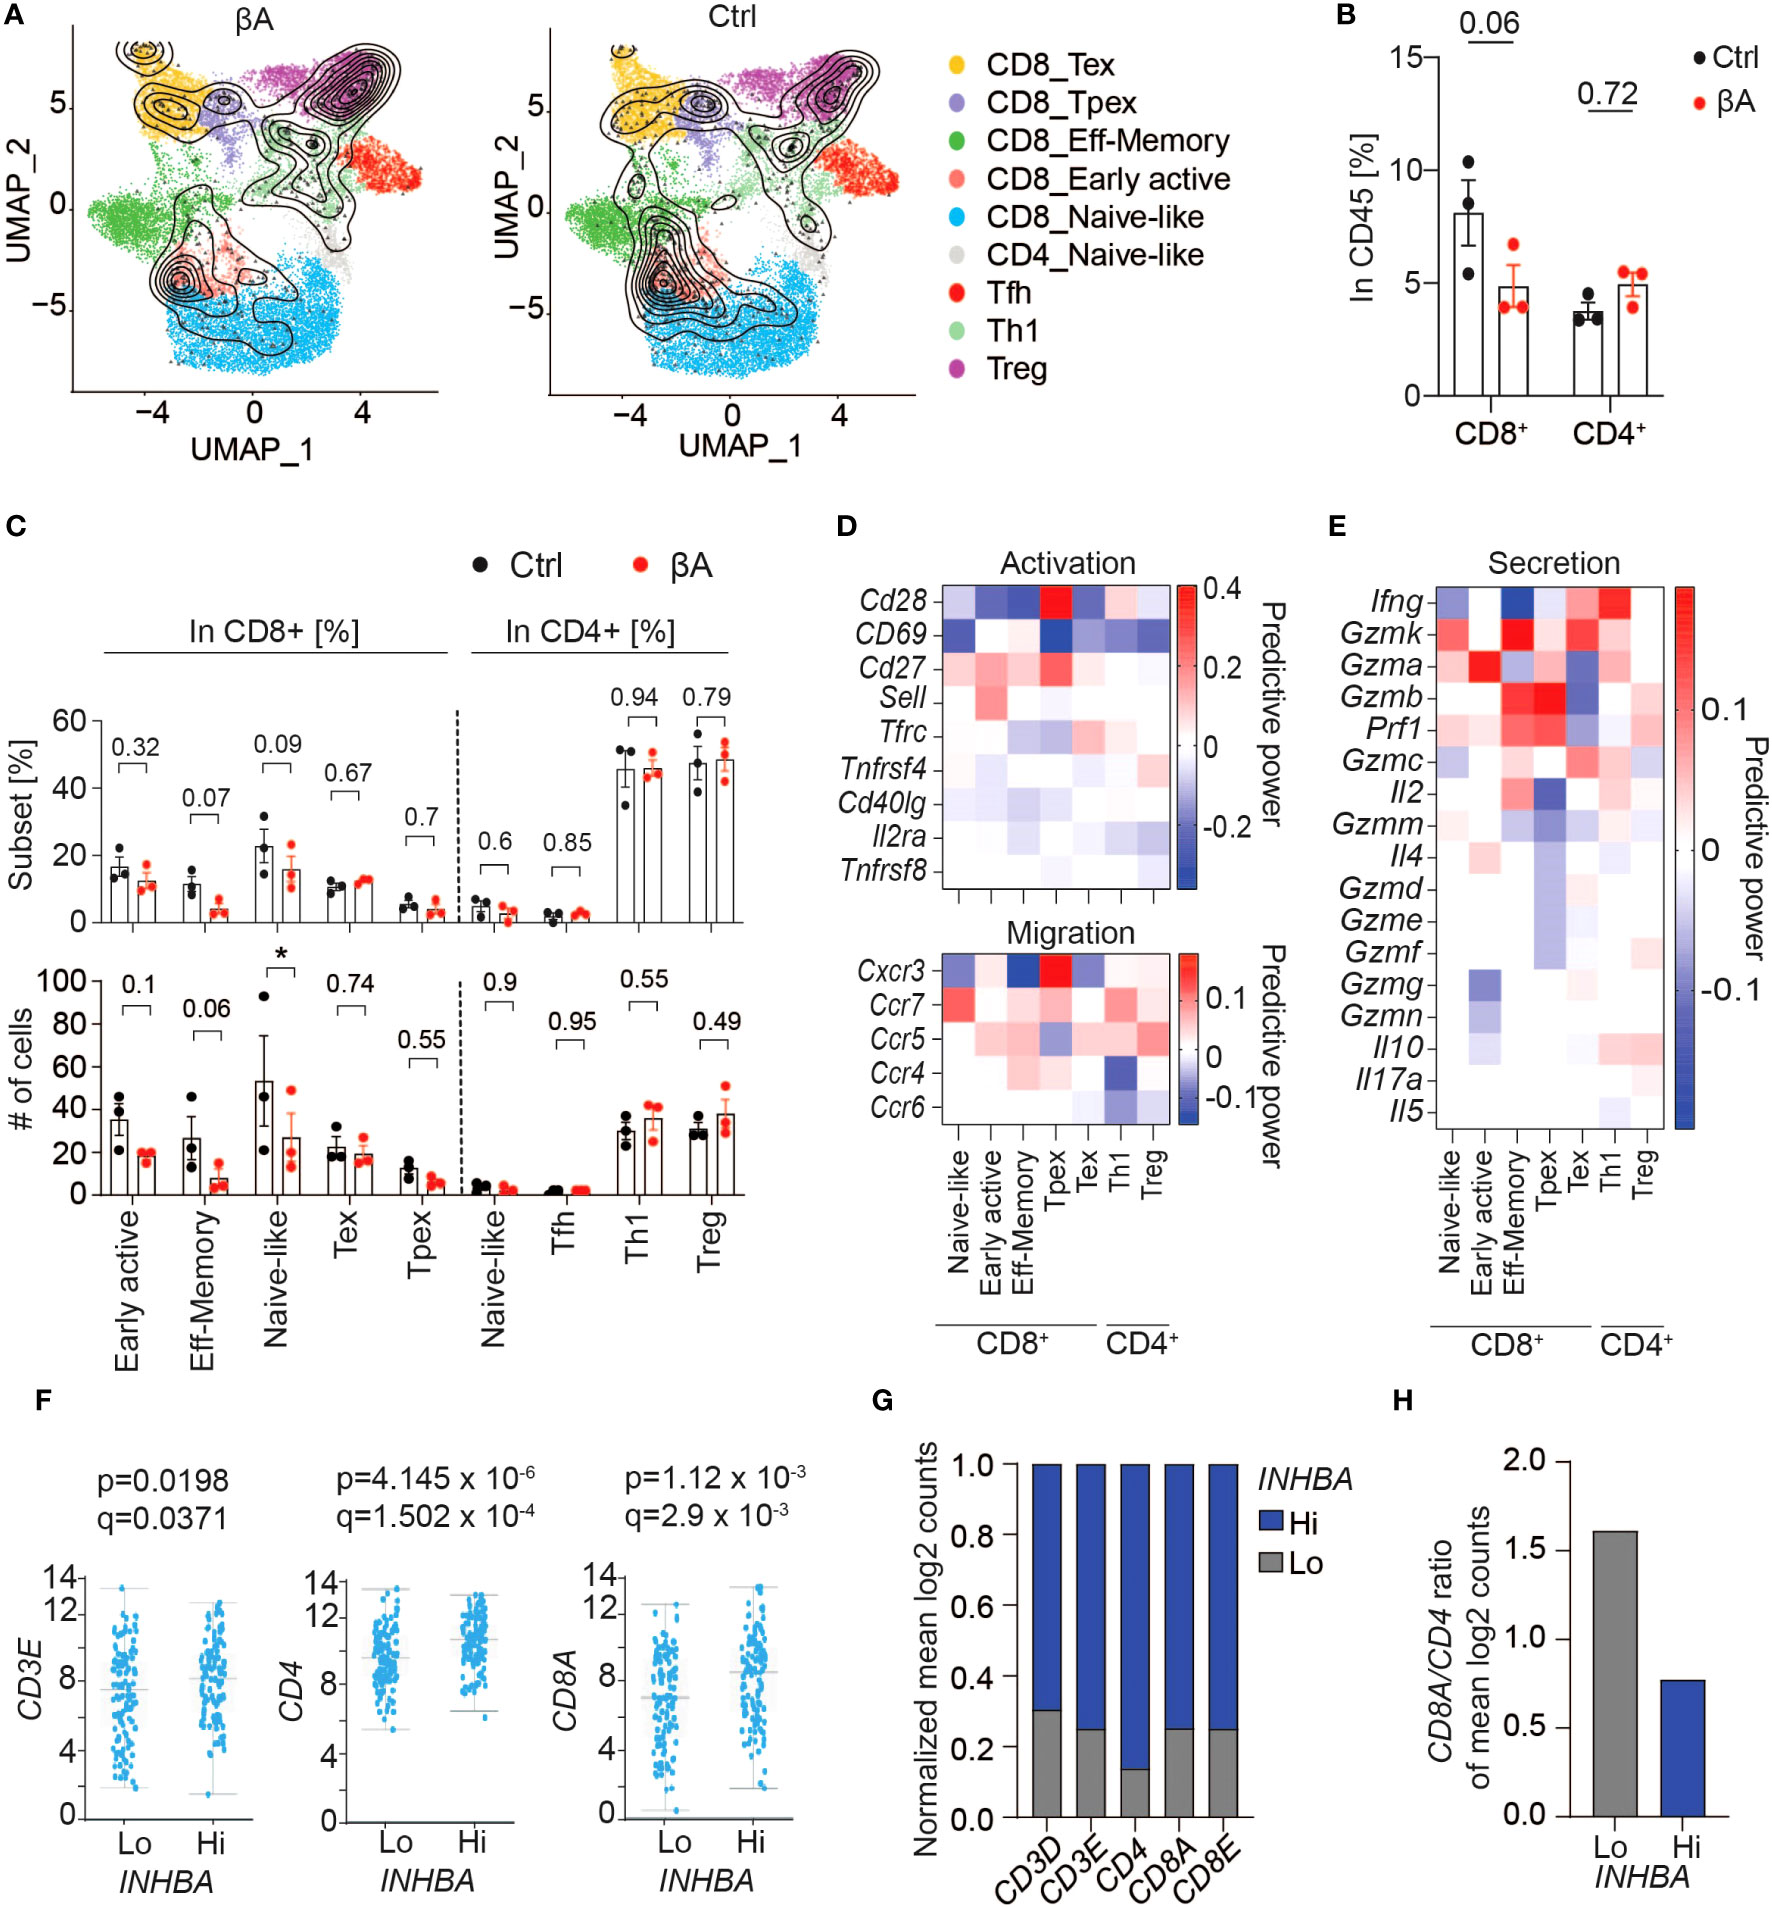
Figure 4 Activin-A expression in tumors does not lead to increased CD8 T cell activation. (A) UMAP representing βA (left) or Ctrl (right) T cell clusters projected onto a reference mouse T cell atlas (26). (B) Numbers of CD8+ or CD4+ T cells in βA compared to Ctrl conditions (n = 3). (C) Frequencies (top) and numbers (bottom) of T cell subtypes from (A) in βA compared to Ctrl conditions. Error bars, SEM (n = 4-5); *p<0.05. Student’s t-test. (D, E) Heatmaps showing changes in expression of [(D), top panel] activation markers, [(D), bottom panel] chemokine receptors, and (E) secretion profile in T cell subtypes in βA compared to Ctrl conditions. (F) TCGA database analysis of differential expression of CD3E, CD4, and CD8A in high compared to low INHBA-expressing melanomas (scale, mean log2 counts). (G, H) Mean log2 counts of CD3D, CD3E, CD4, CD8A, and CD8E transcripts normalized to total number of trancripts in both groups (G), and (H) ratios of CD8A to CD4 log2 counts in Hi versus Lo INHBA-expressing melanomas in TCGA database.
To investigate a possible influence of Activin-A on CD8+ T cell infiltration in melanoma patients, we analyzed the expression of CD3, CD4, and CD8 as a proxy of T cell infiltration in the PanCancer Melanoma database. Despite an overall increase in T cell infiltration (Figures 4F, G), human melanoma with high levels of INHBA had a two-fold lower CD8 to CD4 ratio (Figure 4H). Taken together, these data support the notion that Activin-A in melanoma diminishes intratumoral CD8+ compared to CD4+ T cells, and despite increased IFN signaling across the TME.
Since Activin-A secretion by melanoma grafts stimulated an IFN signature not only in the TME but also within the tumor cells themselves, we investigated whether Activin-A could directly modify the impact of IFN-γ on cultured melanoma cells. To address this, we treated YUMM3.3-Ctrl cells for 48 hrs with IFN-γ alone or together with recombinant Activin-A. In the presence of IFN-γ alone, YUMM3.3-Ctrl cells congregated in abnormal clumps and grew approximately 1.7-fold less than if treated with vehicle control, whereas co-treatment with Activin-A suppressed these effects (Figure 5A, Supplementary Figures 5A, B). Co-treatment with Activin-A conferred similar resistance to cytostatic IFN-γ activity also in parental YUMM3.3 cells, ruling out a possible artifact linked to lentiviral transduction (Supplementary Figures 5A, B). In good agreement, cytostatic activity of IFN-γ was also abolished by lentiviral INHBA expression in YUMM3.3-βA cells, whereas co-treatment with the ALK4 inhibitor SB-431542 rescued it (Figure 5B). To test if autocrine Activin-A signaling in YUMM3.3-βA cells interferes with IFN-γ signal transduction, we monitored the IFN-γ induced activation of STAT1 and the expression of STING. Western blot analysis revealed that IFN-γ treatment for 24 hrs similarly increased STAT1 and STING expression in both YUMM3.3-Ctrl and -βA cells (Figures 5C, D). By contrast, the levels of STAT1 phosphorylation induced by IFN-γ increased 2-fold in βA compared to Ctrl cells.
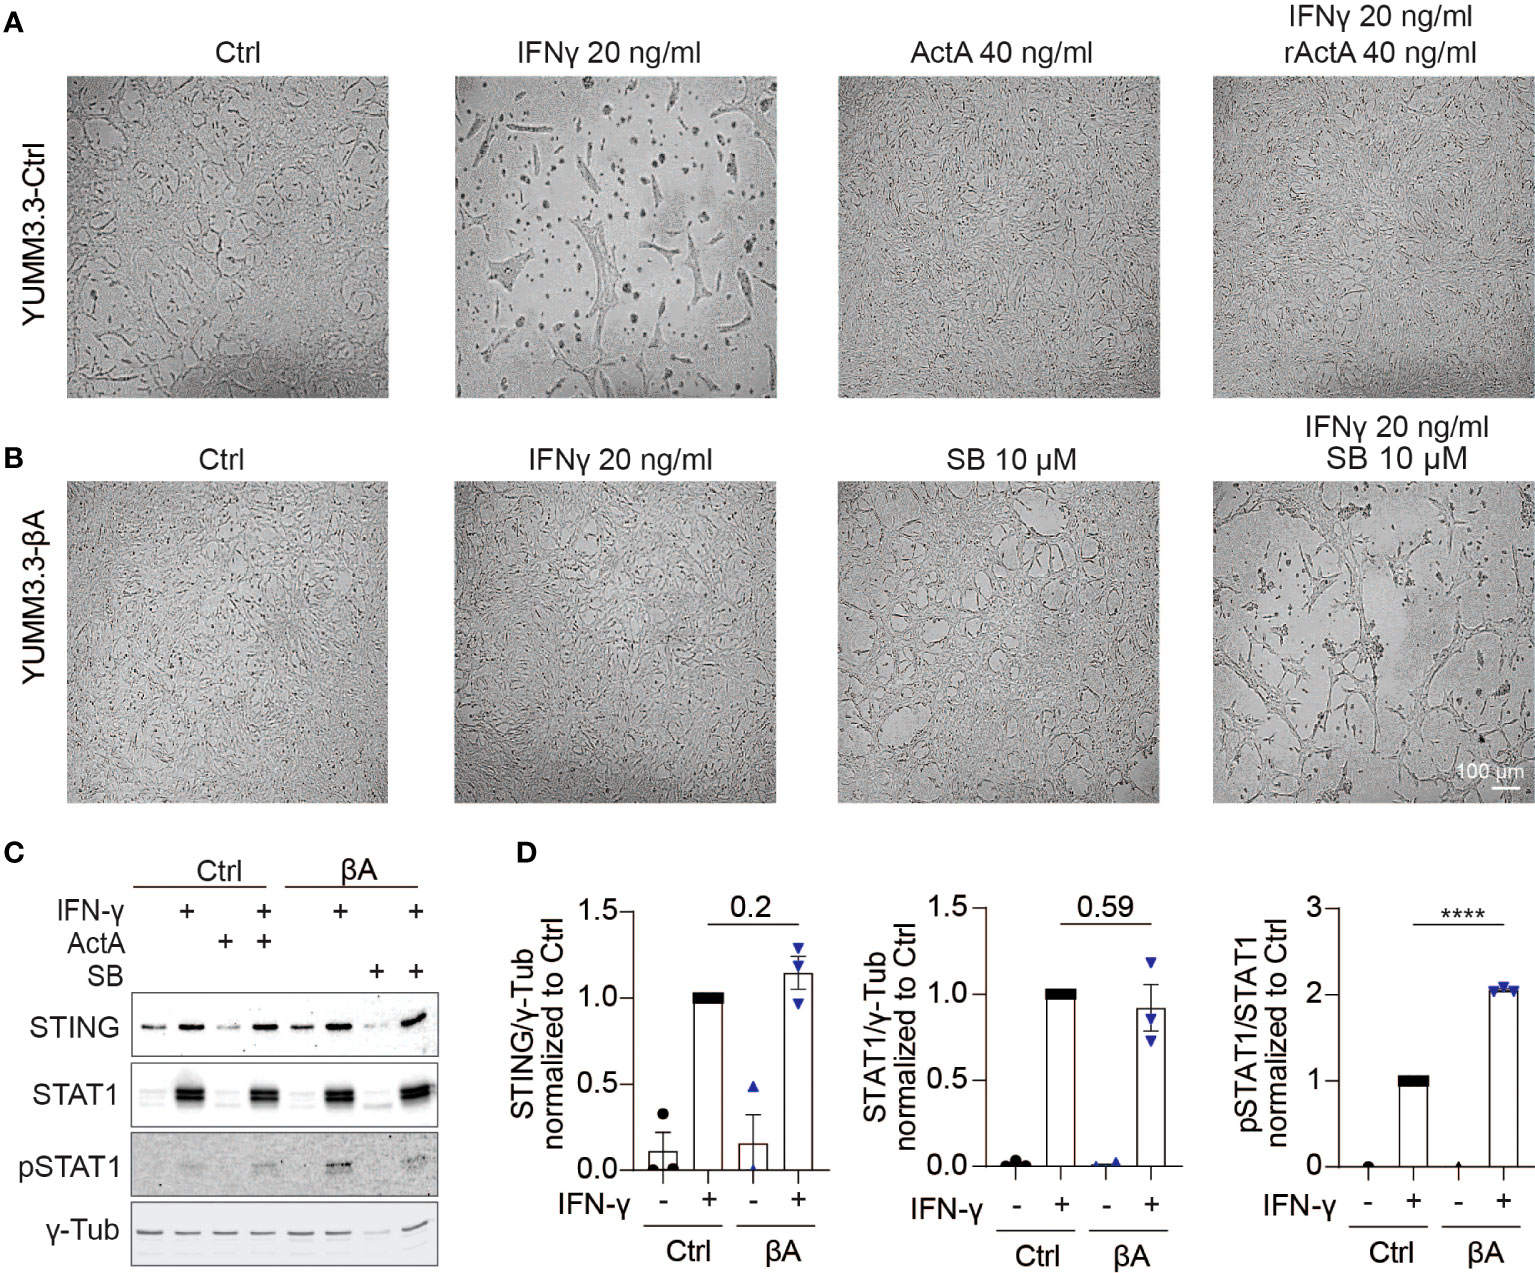
Figure 5 Activin-A promotes IFNγ-induced Stat1 activation in YUMM3.3 cells. (A, B) Representative images of (A) YUMM3.3-Ctrl or (B) YUMM3.3-βA cells treated for 48 hrs with 40 ng/ml Activin-A, 20 ng/ml IFN-γ or 10 μM SB-431542 (SB) where indicated (scale bar, 100 µm). (C) Representative Western blots of STING, STAT1, pSTAT1, and γ-Tubulin (loading control) in YUMM3.3-Ctrl and -βA cells treated during 24 h with 20 ng/ml IFN-γ, 40 ng/ml Activin-A or 10 μM SB-431542 where indicated. (D) Quantification of STING, STAT1, and pSTAT1 levels Western blots relative to γ-Tubulin in YUMM3.3-Ctrl and -βA treated with 20 ng/ml IFN-γ or control (H2O) during 24 h. Error bars, SEM (n = 3); ****p<0.0001, Student’s t-test.
To compare the contributions of STAT1 and other candidate effectors to IFN-γ induced growth inhibition, we treated cells with the STAT1/3/5 inhibitors Fludarabine and Nifuroxazide, or with the JAK1/2 inhibitor Ruxolitinib. Co-administration with either Fludarabine or Nifuroxazide enhanced the growth inhibitory effect of IFN-γ, rather than suppressing it (Supplementary Figure 5B). In sharp contrast, incubation of IFN-γ treated cells with Ruxolitinib restored their proliferation as efficiently as co-treatment with Activin-A. To address if Activin-A similarly increases the resistance of cancer cells to chemotherapy, we treated YUMM3.3 cells with Carboplatin together with or without Activin-A. Analysis of the proliferation of viable cells by Alamar Blue staining showed that carboplatin treatment inhibited cell proliferation regardless of the presence of Activin-A (Supplementary Figure 5C). Collectively, these results indicate that crosstalk with Activin-A signaling can augment STAT1 activation by IFN-γ and confer resistance to anti-proliferative IFN-γ/JAK signaling within melanoma cells.
To assess how crosstalk of Activin-A with IFN-γ influences gene expression in the absence of the TME, mRNA from YUMM3.3 cells that were treated with IFN-γ and Activin-A individually or together for 4 or 12 hrs was analyzed by Bulk RNA Barcoding and Sequencing (BRB-seq) (36). Analysis of DEGs (adjusted p-val <0.05) revealed that IFN-γ treatment alone altered the expression of 551 genes, compared to 123 activin-regulated genes, and that co-administration of both factors changed only 53 genes compared to IFN-γ alone (Supplementary Figures 6A–C). Furthermore, gene set enrichment analysis (GSEA) of these DEGs showed that the hallmark signatures IFN Responses, Allograft Rejection, JAK/STAT3 signaling, and Inflammatory Response were specifically upregulated by IFN-γ (Figure 6A), whereas treatment with Activin-A alone instead stimulated the cancer hallmark signatures of EMT, angiogenesis, and hypoxia, alongside a “TGF-β signaling” signature genes (Figure 6B). Activin-A also induced the EMT and TGF-β signatures when administered together with IFN-γ, which is expected given that Activin-A and TGF-β activate the same Smad transcription factors. However, compared to cells treated with IFN-γ alone, the cells receiving IFN-γ together with Activin-A differentially enriched their interferon-gamma and alpha responses, as well as apoptosis and p53 pathway signatures (Figures 6C, D, Supplementary Figure 6D). To assess if Activin-A antagonizes the cytostatic activity of IFN-γ by interfering with cell death, we conducted Alamar Blue assays on cells that were co-treated with the pan-caspase inhibitor Z-VAD-FMK, or with the necroptosis or ferroptosis inhibitors Nec1s or Ferrostatin-1, respectively, together with IFN-γ and with or without Activin-A. We found that IFN-γ treatment severely diminished YUMM3.3 cell proliferation regardless of the presence of these cell death inhibitors, and that the presence of Activin-A largely restores cell proliferation (Supplementary Figures 6E, F). Conversely, the addition of Activin-A could not rescue the survival and proliferation of YUMM3.3 cells that were treated with the ferroptosis-inducing agent Erastin (Supplementary Figure 6F). These data suggest that Activin-A protects YUMM3.3 cells against inhibition of cell proliferation by IFN-γ likely via a mechanism other than by inhibiting apoptosis, necroptosis or ferroptosis.
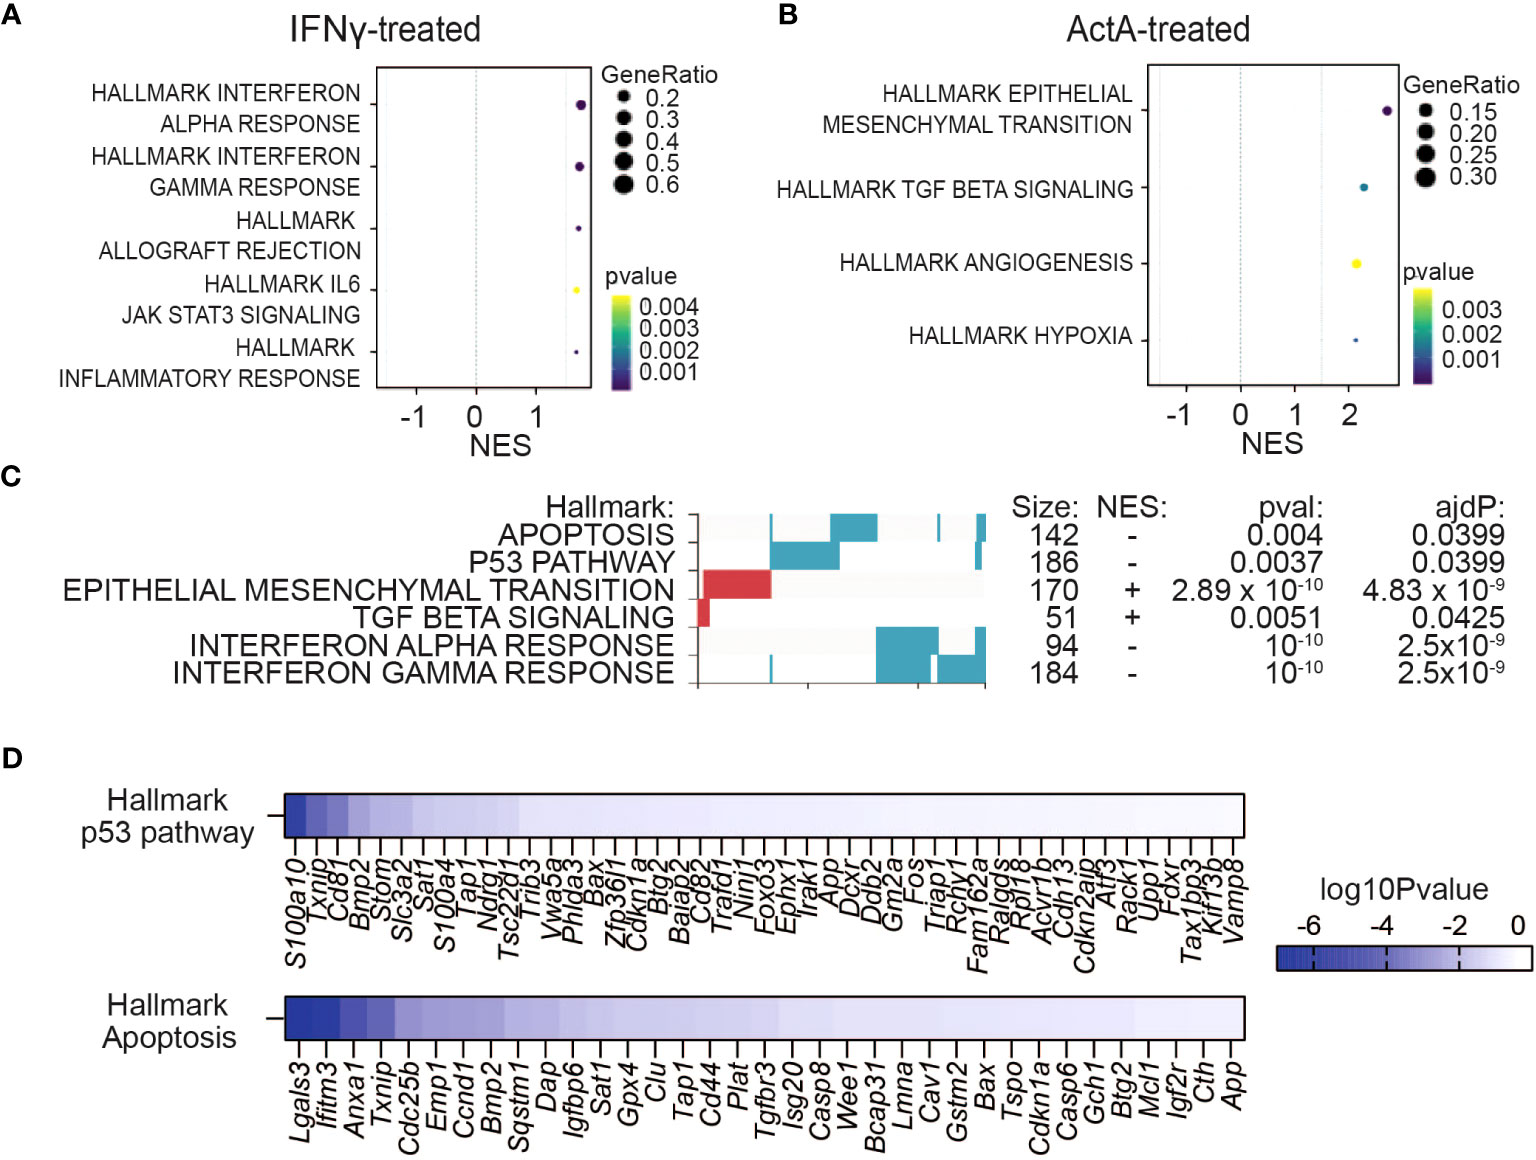
Figure 6 Activin-A precludes IFNγ-induced cytostatic effect in melanoma cells without directly augmenting IFN gene signatures in vitro. (A, B) GSEA plots showing enriched hallmark pathways in YUMM3.3 cells treated with 50 ng/ml ActA (A) or 20 ng/ml IFN-γ (B) during 12 hrs. (C) GSEA analysis showing differential regulation of Hallmark gene set signatures (red, upregulated; blue downregulated) in YUMM3.3 cells treated 12 hrs with 20 ng/ml IFN-γ plus 50 ng/ml ActA, versus IFN-γ alone. (D) Genes leading the p53 and apoptosis hallmarks downregulation by the Activin-A/IFN-γ combo compared to treatment with IFN-γ alone.
To test if IFN-γ interferes with the cell cycle, we transduced YUMM3.3 cells with the fluorescence ubiquitination cell cycle indicator (FUCCI) (37) and assessed the percentages of cells in G1 or G2/S/M phase upon treatment with IFN-γ that were co-treated or not with Activin-A. We found that in YUMM3.3 cells that survived in the presence of IFN-γ, Activin-A did not change the cell cycle progression (Supplementary Figure 6G). To address how many of these genes might be directly deregulated by Activin-A in tumor cells also in vivo, we compared the DEGs that are common in YUMM3.3 cells both in culture and in tumor grafts. We observed that only 1.25% of DEGs in engrafted tumor cells overlapped with the 123 DEGs that were also regulated by Activin-A treatment in cultured cells (Supplementary Figures 6H, I). Importantly, this overlap did not include IFN-regulated genes (Supplementary Table 3). These data suggest that stimulation of the IFN signature by Activin-A in vivo likely depends primarily on the TME.
To assess the contribution of IFN signaling to Activin-A induced tumor growth, mice bearing YUMM3.3-Ctrl or YUMM3.3-βA tumors were treated with the JAK1/2 inhibitor Ruxolitinib or with empty vehicle control (DMSO). In the DMSO-treated group, βA-expressing tumors retained their expected growth advantage compared to Ctrl. By contrast, in Ruxolitinib-treated hosts, Ctrl tumors grew almost as fast as βA tumors (Figures 7A, B). Thus, in presence of Ruxolitinib, a trend for βA to still accelerate both the volume and the weight of tumors no longer reached statistical significance (Figures 7B, C). To further demonstrate the significant reduction in JAK-mediated tumor immune surveillance by βA, we also plotted the volumes of Ruxolitinib-treated tumors at the endpoint relative to the volumes of analogous tumors in DMSO-treated mice. We found that Ruxolitinib treatment increased the growth of Ctrl tumors by 546%, compared to only 247% in βA tumors, which corresponds to a 2.2-fold difference (Figure 7D). These results indicate that Activin-A promotes tumor growth at least in part by interfering with anti-tumoral JAK1/2.
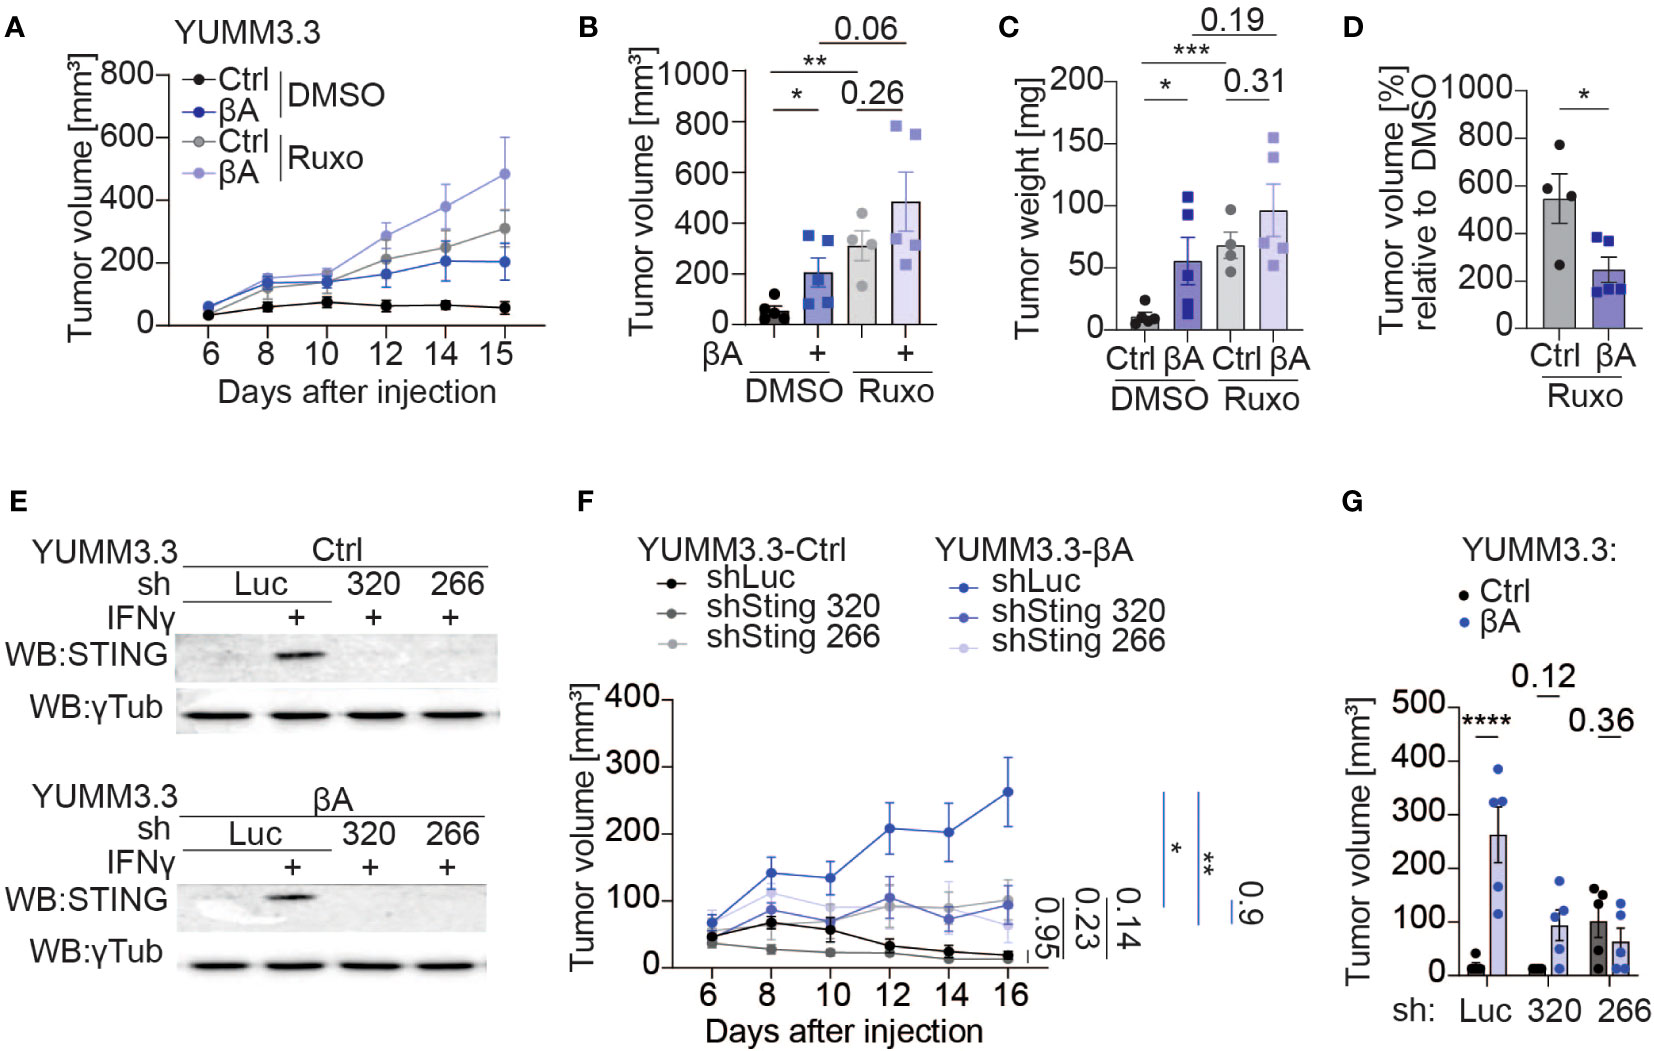
Figure 7 Sting knockdown partially diminishes the tumor-promoting function of Activin-A. (A–D) Growth curves (A), individual tumor volumes (B), tumor weights (C), and tumor volumes of treatment groups normalized to a vehicle (D) at the endpoint of YUMM3.3-Ctrl and YUMM3.3-βA tumor grafts in C57BL/6J mice after treatment with 1 mg of Ruxolitinib, or DMSO control. Error bars, SEM (n=5 per genotype); **p<0.01, ***p<0.001, ordinary one-way ANOVA with Holm-Šídák correction for multiple comparisons. (E) Western blot analysis of STING protein levels in YUMM3.3-Ctrl (top) and YUMM3.3-βA cells (bottom) that were stimulated with 20 ng/ml IFN-γ for 12 hrs after stable transduction with the indicated lentiviral shRNA expression vectors. Analysis of γ-Tubulin served as a loading control. (F, G) Growth curves (F) and tumor volumes at the endpoint (G) of syngeneic YUMM3.3-Ctrl and YUMM3.3-βA melanoma grafts expressing shLuc, shSting 320 or shSting 266. Error bars, SEM (n=5 per genotype); *p<0.05, **p<0.01, ****p<0.0001, two-way ANOVA with Holm-Šídák correction for multiple comparisons.
JAK1/2 signaling is necessary to mount effective anti-tumor responses, which in turn are required to slow the growth of Ctrl compared to βA-expressing melanoma (17, 38). Considering that Activin-A secretion in YUMM3.3-βA tumors did not increase Ifng transcription at the stage examined, we hypothesized that its tumor-promoting function may involve STING activation, because STING can upregulate an IFN signature independently of IFN-γ via type I interferons (39). To address this, we transduced YUMM3.3-Ctrl and YUMM3.3-βA cells with shRNAs 320 or 266 targeting Sting, or with luciferase (shLuc) as a control. Upon treatment with IFN-γ, STING protein accumulated specifically in shLuc-transduced cells both in the presence and absence of the βA transgene, but not in sh320 or sh266 cells, confirming efficient KD (Figure 7E, Supplementary Figure 7A). Knock-down of Sting did not impair YUMM3.3 cell proliferation or suppress its inhibition by IFN-γ in Alamar Blue assays (Supplementary Figure 7B). To investigate the influence of STING in tumor cells on the effect of Activin-A in vivo, we grafted YUMM3.3-ctrl or βA cells expressing shSting 320 or 266 or shLuc in syngeneic mice. Analysis of tumor growth curves revealed that shLuc-expressing cells only efficiently formed tumors if they also express βA, confirming that immune protection and its possible stimulation by shRNA vector can be potently inhibited by Activin-A (40). Compared to shLuc, Sting shRNAs did not significantly influence the growth of YUMM3.3-Ctrl tumors. However, they specifically reduced the growth of βA tumors. Consequently, Ctrl and βA tumors depleted of STING grew at comparable rates (Figures 7F, G). These results suggest that the tumor-promoting role of Activin-A depends on pernicious STING activation in tumor cells.
Previously, we reported that Activin-A secretion by melanoma cells promoted tumor growth in three independent syngeneic grafting models by facilitating CD8+ T cell exclusion (16, 17). Here, transcriptional profiling by scRNA-seq in one of these models at a stage prior to overt CD8 T cell exclusion revealed that Activin-A first enriched a population of monocytes and macrophages (MonoMacs) at the expense of neutrophils, coinciding with prominent transcriptional changes within the cancer cells themselves, DC, MonoMacs, and fibroblast populations. Interestingly, among several significantly altered hallmark gene set signatures of cancer, Activin-A secreting tumors most prominently upregulated IFN pathways across multiple cell types. Further emphasizing an intersection with IFN signaling, Activin-A also modulated an IFN-γ response within these melanoma cells in vitro, as shown by increased STAT1 phosphorylation accompanied by a marked attenuation of IFN-γ induced cytostasis. Finally, knockdown of Sting and, to a lesser extent, pharmacological inhibition of JAK diminished the tumor growth-promoting effect of Activin-A in syngeneic grafts. Besides a first snapshot of Activin-A induced changes in the TME of a solid cancer at single-cell resolution, these findings provide proof of principle that the associated immune evasion and tumor growth can be mitigated by targeting a novel interaction with the STING pathway.
Depending on the context, Activin-A signaling can be pro- or anti-inflammatory in multiple cell types of the innate and adaptive immune systems during infectious and autoimmune diseases, and in allergic disorders (9). However, available insights into the roles of Activin-A in regulating anti-tumor immunity are scarce. Here, transcriptional profiling of the widely used Braf mutant syngeneic YUMM3.3 mouse melanoma model showed that gain of Activin-A secretion enriched MonoMacs population at the expense of neutrophil infiltration already at an early stage of tumor growth. An increase of monocyte and macrophage populations by cancer cell-derived Activin-A has also been observed by flow cytometry in YUMM3.3 and iBIP2 melanoma, and in skin cancer models (17, 19). Depletion of neutrophils by Activin-A to our knowledge has not been described in these or other cancer types, but is consistent with an inhibitory effect of Activin-A on the chemotaxis and recruitment of neutrophils to S. aureus infection sites in mouse skin (41). In our dataset, neutrophils expressed only very low levels of activin receptors, though, suggesting that Activin-A may deplete neutrophils indirectly. Indeed, ligand-target interaction analysis of Activin-A responsive cells in the TME identified no neutrophils, but DCs, MonoMacs, Fibroblasts, Pericytes, and Endothelial and Tumor cells, all of which also transcribed activin type I and II receptors. Thus, Activin-A may promote immune suppression and the associated tumor growth by several mechanisms, including remodeling of innate immune responses and of the perivascular niche, alongside changes in the transcriptome of tumor cells.
Interestingly, while Activin-A secretion by the melanoma cells did not significantly alter the numbers of fibroblasts or endothelial cells, it almost completely depleted the pericytes. Since pericytes are crucial for the maturation and function of microvessels, future studies should investigate how Activin-A diminished their numbers, and how this depletion might influence tumor vascularization. In endothelial cells, Activin-A can directly inhibit cell proliferation (42–44), or stimulate it by promoting VEGF-A expression (45, 46). Although we observed no upregulation of Vgfa in endothelial cells of YUMM3.3 tumors, INHBA overexpression also promotes tumor vascularization in B16-F1 melanoma and in transgenic mouse models of skin squamous cell carcinoma, where this effect was enhanced by a polarizing effect on tumor-associated macrophages (16, 19). Whether tumor vascularization is similarly enhanced by Activin-A in YUMM3.3 melanoma grafts, or whether a proangiogenic activity can be masked by the depletion of pericytes warrants further study. Here, we also did not further investigate a role in fibroblasts because these cells were scarce. However, fibroblast activation by Activin-A plays a crucial role in wound healing, scarring and extracellular matrix remodeling (47, 48). Furthermore, fibroblasts that are activated by INHBA expression in keratinocytes of human papilloma virus-induced skin tumors have been shown to promote tumor cell migration, angiogenesis and an inflammatory response gene signature (49). Activin-A signaling is also increased in cancer-associated fibroblasts of the invasive niche in human basal cell carcinoma (21). Consistent with these studies, we found that fibroblasts in INHBA-overexpressing melanoma increased their expression of chemokines, cytokines, inflammatory responses, and hallmark signatures associated with TNF signaling.
Gene set enrichment analysis showed the most pronounced alteration of cancer hallmark gene set signatures in DCs and MonoMacs. A previous ex vivo analysis established that monocyte-derived DC subsets can also secrete Activin-A by themselves to thereby promote their phagocytic activity (50) while dampening MHC-II expression and T cell activation (51) and the LPS-induced secretion of the chemokines CCL2, CXCL8, and CXCL10, and of IL-6 and IL-12p70 (52). Furthermore, analysis of DCs derived from the bone marrow of Inha-/- mice lacking the activin receptor antagonist inhibin indicated that one or several endogenous activins dampen DC maturation both in vitro and in vivo (53). Here, Activin-A secretion by YUMM3.3 cells did not diminish MHC I expression in DCs but rather increased it. Furthermore, MHC II gene expression was unchanged, concurring with the fact that a tolerogenic downregulation of MHC II in lymph node DCs by Activin-A in a mouse model of allergic airway disease is indirect and mediated by the induction of Tregs (54). In good agreement, melanoma cell-derived Activin-A also did not induce Tregs or impair the maturation of cDC1 cells (17).
Our previous cytokine and chemokine profiling in short term cultures of dissociated YUMM3.3 melanoma grafts showed that Activin-A secretion by the cancer cells diminishes both the levels of IFN-γ and the secretion of CXCL9 and CXCL10 in the conditioned medium (17). Quantification of intracellular CXCL10 staining by flow cytometry confirmed that Activin-A signaling also downregulated CXCL10 in intratumoral macrophages of INHBA-expressing tumors, and in murine cDC1 cells. However, as shown in the present study, INHBA overexpression in YUMM3.3 tumors did not result in a corresponding decrease in Cxcl9 or Cxcl10 mRNA levels, strongly suggesting that the expression of these chemokines is regulated post-transcriptionally. The functional relevance of Activin-A signaling in DCs for its tumor-promoting function in melanoma or other cancers, and possible mechanisms of how it attenuates CXCL9/10 secretion in myeloid lineages warrant further investigation. Separate studies will also be needed to define the precise roles of activin signaling in tumor-associated macrophage subsets. Antibody depletion of CSF1R+ macrophages in INHBA-driven skin squamous cell carcinoma delayed the onset of tumor growth and decreased tumor vascularization (19). By contrast, depletion of this subset in YUMM3.3 melanoma did not diminish the tumor-promoting activity of Activin-A (17). However, a possible tumor-promoting role for other MonoMacs populations cannot be excluded.
Within the melanoma cells themselves, INHBA expression led to an increase in gene signatures related to EMT transition, neuron development, neural crest cell migration, and regulation of stem cell differentiation, consistent with known functions of Activin-A and SMAD2/3 transcription factors in stimulating melanoma cell migration (16, 55, 56). While TGF-β is an established EMT inducer in various cell lines, the role of Activin-A in this process is less clear, even though both ligands share the same SMAD transcription factors for canonical signal transduction. In ovarian cancer cells, Activin-A treatment promotes EMT via canonical SMAD2/3 signaling together with SMAD4 (57), whereas in colon and breast cancer cells, it has been reported to promote EMT and cell migration or invasiveness independently of SMAD4 (7, 58). In addition, our comparison of differentially regulated gene signatures in control and Activin-A secreting tumors identified inflammatory IFN-A and IFN-γ responses as the cancer hallmark signatures that were most significantly upregulated by Activin-A in nearly all cell types, including the cancer cells themselves. We observed no corresponding increase in the transcription of either type I or II interferons aside from Th1 cells, where it also remained very modest. However, melanocytes in neonatal skin and UVB-initiated melanoma cells are protected from immune-mediated killing by IFN-γ that is secreted by CCR2+ macrophages (59). Thus, Activin-A may increase IFN-γ in YUMM3.3 melanoma grafts indirectly by enriching the TME for macrophages. Importantly, the striking increase in the inflammatory IFN signatures by Activin-A did not improve T cell recruitment or the expression of T cell activation markers, but instead correlates with CD8 T cell exclusion and increased tumor growth (17). We also did not observe increased recruitment of NK cells or major changes in their transcriptome, even though Activin-A has been reported to noticeably slow their proliferation and modulate their cytokine expression when added as a recombinant protein or presented by dendritic cells in vitro (60, 61). Chronic exposure of B16 mouse melanoma cells to IFN-γ stimulates the expression of the checkpoint receptors PD-1, CTLA-4, LAG-3, and of TIM-3 ligands, as well as the resistance to combined ICB therapies in tumor grafts (62). At the early stage of YUMM3.3 tumor growth examined here, Activin-A secretion increased the expression of the ligands Lgals3, Hmgb1, Lgals9, CD274 in various cell types. This is consistent with the notion that chronic IFN-γ signaling in melanoma patients promotes immune evasion (63).
While crucial in the innate and adaptive immune responses, IFNs also have direct effects on cancer cells. For example, in prostate cancer, JAK/STAT inflammatory signaling initiates lineage dedifferentiation and outgrowth of castration-resistant organoids (64). By contrast, IFN-γ treatment of patient-derived melanoma cells for 7 days has recently been shown to inhibit growth between 20-80% in 29 out of 31 cases examined (65). Here, sustained INHBA expression or acute treatment of YUMM3.3 melanoma cells with recombinant Activin-A enhanced STAT1 phosphorylation by IFN-γ but interfered with cytostatic IFN-γ signaling in vitro without further upregulating IFN target genes. These observations indicate that Activin-A likely stimulates an inflammatory IFN signature in vivo by altering the TME. Several mechanisms have been described how IFN-γ can induce growth inhibition in cancer cells, including activation of ERK signaling (63, 65). Here, we found that the cytostatic effect observed in YUMM3.3 treatments was independent of apoptosis, necroptosis, ferroptosis or cell cycle arrest. Whether ERK signaling or a pseudo-EMT signature are involved remains to be determined. EMT tends to de-sensitize epithelial cancers to chemotherapies (66). However, here, upregulation of an EMT signature in YUMM3.3 cells provided no resistance to the chemotherapeutic agent carboplatin, indicating that Activin-A signaling in these cells selectively promoted the evasion of cytostatic IFN-γ signaling but not chemoresistance. IFN signaling in cancer cells is necessary for the response to immunotherapies, and loss of JAK1/2 or of IFN-inducible MHC I genes frequently accounts for therapy resistance (67–69). Furthermore, an IFN signature can positively predict responses to PD1 inhibition in several cancer types (70). However, others have found that IFN signature can be upregulated in both responders and non-responders, and that increased expression of IFN related genes can even predict poor response to ICB therapy, chemotherapy and radiation (62, 64, 71–74). Interestingly, the 18 genes of an IFN signature marking non-responders include INHBA and CCL2 (72). Here, our analysis in YUMM3.3 melanoma showed that Ccl2 was upregulated by Activin-A both in the tumor cells and in fibroblasts. Furthermore, our survey of publicly available gene expression data revealed upregulation of IFN response gene signatures and increased STAT1 and CGAS expression in presence of high levels of INHBA transcripts in human tumors. In keeping with the dual role of IFN signaling in both inhibiting and promoting anti-tumor immunity, treatment of YUMM3.3 melanoma-bearing mice with JAK1/2 inhibitors drastically accelerated the growth of Ctrl tumors, thereby minimizing the difference compared to the growth rate of βA tumors. This corroborates the conclusion of previous reports that Activin-A promotes growth by inhibiting CD8+ T cell responses in several melanoma models (16, 17).
Increased IFN signaling in cancer can also be a consequence of the release of double-stranded DNA into the cytoplasm that induces the synthesis of cyclic GMP-AMP (cGAMP) by cGAMP synthase (cGAS) upstream of STING (75). Secretion of cGAMP by cancer cells stimulates STING in various immune cells, including anti-tumor NK cells (76). By contrast, in a chemically induced mouse model of squamous cell carcinoma of the skin, STING is responsible for tumor-promoting inflammation and cancer formation, acting both within epidermal cells and in bone marrow-derived immune cells (5). Furthermore, cancer cell-intrinsic STING signaling associated with an inflamed cell state has been shown to facilitate metastatic growth in preclinical models of breast cancer by activating NFκB (77), and it also mediates tumor immune evasion and immunotherapy resistance in genetically unstable BRCA1 mutant ovarian cancer by driving VEGFA-induced tumor vascularization (78). For patients receiving immunotherapies, these and possibly other tumor-promoting functions of STING are clinically highly relevant. Indeed, in clinical trials across multiple cancer types, pharmacological STING agonists that boost anti-tumor immunity showed limited efficacy when administered alone because they tend to activate immune checkpoints and tolerogenic Tregs (2). In addition, efficacy of STING agonists in B16-F10 and in the YUMM3.3-related YUMM1.7 melanoma models is limited by epigenetic inhibition of gene transcription (79, 80). Here, we found that STING expression in YUMM3.3 cells was enhanced upon treatment with IFN-γ. Furthermore, while knockdown of Sting did not alter YUMM3.3 cell proliferation in vitro or its inhibition by IFN-γ treatment, it slowed down the growth of INHBA-expressing tumors. Thus, Activin-A depends at least in part on tumor-promoting STING signaling in melanoma cells to accelerate the tumor growth. Overall, these observations uncover a novel interplay of melanoma cell-intrinsic STING and IFN/JAK signaling pathways that will be important to consider for future therapeutic strategies that seek to inhibit melanoma progression and immunotherapy resistance associated with paracrine Activin-A signaling.
The datasets presented in this study can be found in online repositories. The names of the repository/repositories and accession number(s) can be found below: GEO Series accession numbers GSE247229 and GSE247228.
The animal study was approved by the cantonal veterinary administration of the canton of Vaud, Chemin des Boveresses 155, 1066 Epalinges. The study was conducted in accordance with the local legislation and institutional requirements.
KP: Conceptualization, Formal analysis, Investigation, Validation, Visualization, Writing – original draft, Writing – review & editing, Methodology, Project administration, Resources, Data curation. GA: Data curation, Formal analysis, Investigation, Writing – review & editing. JL: Data curation, Formal analysis, Investigation, Validation, Writing – review & editing, Methodology, Visualization. NF: Data curation, Formal analysis, Investigation, Writing – review & editing, Project administration, Supervision, Validation. CI: Supervision, Validation, Writing – review & editing, Project administration. NG: Data curation, Formal analysis, Supervision, Validation, Visualization, Writing – review & editing, Project administration. OE: Writing – review & editing, Resources. SN: Conceptualization, Formal analysis, Investigation, Visualization, Writing – review & editing, Data curation, Methodology, Resources, Software. DC: Conceptualization, Formal analysis, Funding acquisition, Investigation, Project administration, Supervision, Validation, Visualization, Writing – original draft, Writing – review & editing.
The author(s) declare financial support was received for the research, authorship, and/or publication of this article. This work was supported by grants 31003A_179330 of the Swiss National Science foundation and KFS-4454-02-2018 from Oncosuisse, and by the Anna Fuller Fund award 20495 to DBC.
The authors thank Dr. Denarda Dangaj (Lausanne, Switzerland) for providing Sting1 shRNA expression vectors, and Drs Anna C. Obenauf (Vienna, Austria) and Martin McMahon (San Francisco, USA) for the generous gift of YUMM3.3 cells, and to Dr. Linda Mhalla (EPFL) for help with statistical analysis. They are also grateful for the services of the staff of the Flow Cytometry Research Core Facility, and of the animal care takers of the Center of PhenoGenomics of the EPFL School of Life Sciences.
The authors declare that the research was conducted in the absence of any commercial or financial relationships that could be construed as a potential conflict of interest.
All claims expressed in this article are solely those of the authors and do not necessarily represent those of their affiliated organizations, or those of the publisher, the editors and the reviewers. Any product that may be evaluated in this article, or claim that may be made by its manufacturer, is not guaranteed or endorsed by the publisher.
The Supplementary Material for this article can be found online at: https://www.frontiersin.org/articles/10.3389/fimmu.2023.1335207/full#supplementary-material
1. Waldman AD, Fritz JM, Lenardo MJ. A guide to cancer immunotherapy: from T cell basic science to clinical practice. Nat Rev Immunol (2020) 20:651–68. doi: 10.1038/s41577-020-0306-5
2. Motedayen Aval L, Pease JE, Sharma R, Pinato DJ. Challenges and opportunities in the clinical development of STING agonists for cancer immunotherapy. J Clin Med (2020) 9:3323. doi: 10.3390/jcm9103323
3. Sharma P, Hu-Lieskovan S, Wargo JA, Ribas A. Primary, adaptive, and acquired resistance to cancer immunotherapy. Cell (2017) 168:707–23. doi: 10.1016/j.cell.2017.01.017
4. Gide TN, Wilmott JS, Scolyer RA, Long GV. Primary and acquired resistance to immune checkpoint inhibitors in metastatic melanoma. Clin Cancer Res (2018) 24:1260–70. doi: 10.1158/1078-0432.CCR-17-2267
5. Ahn J, Xia T, Konno H, Konno K, Ruiz P, Barber GN. Inflammation-driven carcinogenesis is mediated through STING. Nat Commun (2014) 5:5166. doi: 10.1038/ncomms6166
6. Moustakas A, Heldin CH. Non-smad TGF-beta signals. J Cell Sci (2005) 118:3573–84. doi: 10.1242/JCS.02554
7. Bauer J, Ozden O, Akagi N, Carroll T, Principe DR, Staudacher JJ, et al. Activin and TGFβ use diverging mitogenic signaling in advanced colon cancer. Mol Cancer (2015) 14:182. doi: 10.1186/s12943-015-0456-4
8. Loomans HA, Andl CD, Loomans HA, Andl CD. Intertwining of Activin A and TGFβ Signaling: Dual roles in cancer progression and cancer cell invasion. Cancers (2014) 7:70–91. doi: 10.3390/cancers7010070
9. Morianos I, Papadopoulou G, Semitekolou M, Xanthou G. Activin-A in the regulation of immunity in health and disease. J Autoimmun (2019) 104:102314. doi: 10.1016/J.JAUT.2019.102314
10. Chen L, De Menna M, Groenewoud A, Thalmann GN, Kruithof-de Julio M, Snaar-Jagalska BE. A NF-ĸB-Activin A signaling axis enhances prostate cancer metastasis. Oncogene (2020) 39:1634–51. doi: 10.1038/s41388-019-1103-0
11. Takeda H, Kataoka S, Nakayama M, Ali MAE, Oshima H, Yamamoto D, et al. CRISPR-Cas9-mediated gene knockout in intestinal tumor organoids provides functional validation for colorectal cancer driver genes. Proc Natl Acad Sci U.S.A. (2019) 116:15635–44. doi: 10.1073/pnas.1904714116
12. Danila DC, Zhang X, Zhou Y, Sleiman Haidar JN, Klibanski A. Overexpression of wild-type activin receptor Alk4-1 restores activin antiproliferative effects in human pituitary tumor cells. J Clin Endocrinol Metab (2002) 87:4741–6. doi: 10.1210/jc.2002-020527
13. Loumaye A, De Barsy M, Nachit M, Lause P, Frateur L, Van Maanen A, et al. Role of activin A and myostatin in human cancer cachexia. J Clin Endocrinol Metab (2015) 100:2030–8. doi: 10.1210/jc.2014-4318
14. Loumaye A, de Barsy M, Nachit M, Lause P, van Maanen A, Trefois P, et al. Circulating Activin A predicts survival in cancer patients. J Cachexia Sarcopenia Muscle (2017) 8:768–77. doi: 10.1002/jcsm.12209
15. Ries A, Schelch K, Falch D, Pany L, Hoda MA, Grusch M. Activin A: an emerging target for improving cancer treatment? Expert Opin Ther Targets (2020) 20:985–96. doi: 10.1080/14728222.2020.1799350
16. Donovan P, Dubey OA, Kallioinen S, Rogers KW, Muehlethaler K, Müller P, et al. Paracrine Activin-A signaling promotes melanoma growth and metastasis through immune evasion. J Invest Dermatol (2017) 137:2578–87. doi: 10.1016/j.jid.2017.07.845
17. Pinjusic K, Dubey OA, Egorova O, Nassiri S, Meylan E, Faget J, et al. Activin-A impairs CD8 T cell-mediated immunity and immune checkpoint therapy response in melanoma. J Immunother Cancer (2022) 10:e004533. doi: 10.1136/JITC-2022-004533
18. Antsiferova M, Huber M, Meyer M, Piwko-Czuchra A, Ramadan T, MacLeod AS, et al. Activin enhances skin tumourigenesis and Malignant progression by inducing a pro-tumourigenic immune cell response. Nat Commun (2011) 2:576. doi: 10.1038/ncomms1585
19. Antsiferova M, Piwko-Czuchra A, Cangkrama M, Wietecha M, Sahin D, Birkner K, et al. Activin promotes skin carcinogenesis by attraction and reprogramming of macrophages. EMBO Mol Med (2017) 9:27–45. doi: 10.15252/emmm.201606493
20. Pich-Bavastro C, Yerly L, Di Domizio J, Tissot-Renaud S, Gilliet M, Kuonen F. Activin A–mediated polarization of cancer-associated fibroblasts and macrophages confers resistance to checkpoint immunotherapy in skin cancer. Clin Cancer Res (2023) 29:3498–513. doi: 10.1158/1078-0432.CCR-23-0219
21. Yerly L, Pich-Bavastro C, Di Domizio J, Wyss T, Tissot-Renaud S, Cangkrama M, et al. Integrated multi-omics reveals cellular and molecular interactions governing the invasive niche of basal cell carcinoma. Nat Commun (2022) 13:1–16. doi: 10.1038/s41467-022-32670-w
22. Fuertes Marraco SA, Grosjean F, Duval A, Rosa M, Lavanchy C, Ashok D, et al. Novel murine dendritic cell lines: A powerful auxiliary tool for dendritic cell research. Front Immunol (2012) 3:331. doi: 10.3389/fimmu.2012.00331
23. Feldman JP, Goldwasser R. A mathematical model for tumor volume evaluation using two-dimensions. J Appl Quant Methods (2009) 4:455–62. Available at: http://www.jaqm.ro/issues/volume-4,issue-4/6_feldman_goldwasser_mark_schwartz_orion.php.
24. Franzén O, Gan L-M, Björkegren JLM. PanglaoDB: a web server for exploration of mouse and human single-cell RNA sequencing data. Database (2019) 2019:baz046. doi: 10.1093/database/baz046
25. Liberzon A, Birger C, Thorvaldsdóttir H, Ghandi M, Mesirov JP, Tamayo P. The Molecular Signatures Database (MSigDB) hallmark gene set collection. Cell Syst (2015) 1:417–25. doi: 10.1016/j.cels.2015.12.004
26. Andreatta M, Corria-Osorio J, Müller S, Cubas R, Coukos G, Carmona SJ. Interpretation of T cell states from single-cell transcriptomics data using reference atlases. Nat Commun (2021) 12:1–19. doi: 10.1038/s41467-021-23324-4
27. Chen EY, Tan CM, Kou Y, Duan Q, Wang Z, Meirelles GV, et al. Enrichr: interactive and collaborative HTML5 gene list enrichment analysis tool. BMC Bioinf (2013) 14:128. doi: 10.1186/1471-2105-14-128
28. Browaeys R, Saelens W, Saeys Y. NicheNet: modeling intercellular communication by linking ligands to target genes. Nat Methods (2020) 17:159–62. doi: 10.1038/s41592-019-0667-5
29. Love MI, Huber W, Anders S. Moderated estimation of fold change and dispersion for RNA-seq data with DESeq2. Genome Biol (2014) 15:1–21. doi: 10.1186/S13059-014-0550-8
30. Wu T, Hu E, Xu S, Chen M, Guo P, Dai Z, et al. clusterProfiler 4.0: A universal enrichment tool for interpreting omics data. Innov Camb Mass (2021) 2:100141. doi: 10.1016/j.xinn.2021.100141
31. Edgar R, Domrachev M, Lash AE. Gene Expression Omnibus: NCBI gene expression and hybridization array data repository. Nucleic Acids Res (2002) 30:207–10. doi: 10.1093/nar/30.1.207
32. Liberzon A, Birger C, Thorvaldsdóttir H, Ghandi M, Mesirov JP, Tamayo P. The molecular signatures database hallmark gene set collection. Cell Syst (2015) 1:417–25. doi: 10.1016/j.cels.2015.12.004
33. Platanias LC. Mechanisms of type-I- and type-II-interferon-mediated signalling. Nat Rev Immunol (2005) 5:375–86. doi: 10.1038/nri1604
34. Repnik U, Starr AE, Overall CM, Turk B. Cysteine cathepsins activate ELR chemokines and inactivate non-ELR chemokines. J Biol Chem (2015) 290:13800–11. doi: 10.1074/jbc.M115.638395
35. Bronger H, Magdolen V, Goettig P, Dreyer T. Proteolytic chemokine cleavage as a regulator of lymphocytic infiltration in solid tumors. Cancer Metastasis Rev (2019) 38:417–30. doi: 10.1007/s10555-019-09807-3
36. Alpern D, Gardeux V, Russeil J, Mangeat B, Meireles-Filho ACA, Breysse R, et al. BRB-seq: Ultra-affordable high-throughput transcriptomics enabled by bulk RNA barcoding and sequencing. Genome Biol (2019) 20:1–15. doi: 10.1186/s13059-019-1671-x
37. Zielke N, Edgar BA. FUCCI sensors: powerful new tools for analysis of cell proliferation. WIREs Dev Biol (2015) 4:469–87. doi: 10.1002/wdev.189
38. Villarino AV, Kanno Y, O’Shea JJ. Mechanisms and consequences of Jak–STAT signaling in the immune system. Nat Immunol (2017) 18:374–84. doi: 10.1038/ni.3691
39. Sun L, Wu J, Du F, Chen X, Chen ZJ. Cyclic GMP-AMP synthase is a cytosolic DNA sensor that activates the type I interferon pathway. Science (2013) 339:786–91. doi: 10.1126/science.1232458
40. Meng Z, Lu M. RNA interference-induced innate immunity, off-target effect, or immune adjuvant? Front Immunol (2017) 8:331. doi: 10.3389/fimmu.2017.00331
41. Qi Y, Jiang L, Wu C, Li J, Wang H, Wang S, et al. Activin A impairs ActRIIA+ neutrophil recruitment into infected skin of mice. iScience (2021) 24:102080. doi: 10.1016/j.isci.2021.102080
42. Breit S, Ashman K, Wilting J, Rössler J, Hatzi E, Fotsis T, et al. The N-myc oncogene in human neuroblastoma cells: Down-regulation of an angiogenesis inhibitor identified as activin A. Cancer Res (2000) 60:4596–601. Available at: https://aacrjournals.org/cancerres/article/60/16/4596/506569/The-N-myc-Oncogene-in-Human-Neuroblastoma-Cells.
43. Kaneda H, Arao T, Matsumoto K, De Velasco MA, Tamura D, Aomatsu K, et al. Activin A inhibits vascular endothelial cell growth and suppresses tumour angiogenesis in gastric cancer. Br J Cancer (2011) 105:1210–7. doi: 10.1038/bjc.2011.348
44. Panopoulou E, Murphy C, Rasmussen H, Bagli E, Rofstad EK, Fotsis T. Activin A suppresses neuroblastoma xenograft tumor growth via antimitotic and antiangiogenic mechanisms. Cancer Res (2005) 65:1877–86. doi: 10.1158/0008-5472.CAN-04-2828
45. Maeshima K, Maeshima A, Hayashi Y, Kishi S, Kojima I. Crucial role of activin A in tubulogenesis of endothelial cells induced by vascular endothelial growth factor. Endocrinology (2004) 145:3739–45. doi: 10.1210/en.2004-0213
46. Poulaki V, Mitsiades N, Kruse FE, Radetzky S, Iliaki E, Kirchhof B, et al. Activin a in the regulation of corneal neovascularization and vascular endothelial growth factor expression. Am J Pathol (2004) 164:1293–302. doi: 10.1016/S0002-9440(10)63216-6
47. Cangkrama M, Wietecha M, Werner S. Wound repair, scar formation, and cancer: converging on Activin. Trends Mol Med (2020) 26:1107–17. doi: 10.1016/j.molmed.2020.07.009
48. Ohga E, Matsuse T, Teramoto S, Ouchi Y. Activin receptors are expressed on human lung fibroblast and activin a facilitates fibroblast-mediated collagen gel contraction. Life Sci (2000) 66:1603–13. doi: 10.1016/S0024-3205(00)00480-X
49. Wietecha MS, Pensalfini M, Cangkrama M, Müller B, Jin J, Brinckmann J, et al. Activin-mediated alterations of the fibroblast transcriptome and matrisome control the biomechanical properties of skin wounds. Nat Commun (2020) 11:1–20. doi: 10.1038/s41467-020-16409-z
50. Scutera S, Riboldi E, Daniele R, Elia AR, Fraone T, Castagnoli C, et al. Production and function of activin A in human dendritic cells. Eur Cytokine Netw (2008) 19:60–8. doi: 10.1684/ecn.2008.0121
51. Segerer SE, Müller N, Van den Brandt J, Kapp M, Dietl J, Reichardt HM, et al. The glycoprotein-hormones activin A and inhibin A interfere with dendritic cell maturation. Reprod Biol Endocrinol (2008) 6:1–10. doi: 10.1186/1477-7827-6-17
52. Robson NC, Phillips DJ, McAlpine T, Shin A, Svobodova S, Toy T, et al. Activin-A: A novel dendritic cell derived cytokine that potently attenuates CD40 ligand specific cytokine and chemokine production. Blood (2008) 111:2733–43. doi: 10.1182/blood-2007-03-080994
53. Olguín-Alor R, de la Fuente-Granada M, Bonifaz LC, Antonio-Herrera L, García-Zepeda EA, Soldevila G. A key role for inhibins in dendritic cell maturation and function. PloS One (2016) 11:e0167813. doi: 10.1371/journal.pone.0167813
54. Semitekolou M, Morianos I, Banos A, Konstantopoulos D, Adamou-Tzani M, Sparwasser T, et al. Dendritic cells conditioned by activin A–induced regulatory T cells exhibit enhanced tolerogenic properties and protect against experimental asthma. J Allergy Clin Immunol (2018) 141:671–84. doi: 10.1016/j.jaci.2017.03.047
55. Cantelli G, Orgaz JL, Rodriguez-Hernandez I, Karagiannis P, Maiques O, Matias-Guiu X, et al. TGF-β-induced transcription sustains amoeboid melanoma migration and dissemination. Curr Biol (2015) 25:2899–914. doi: 10.1016/j.cub.2015.09.054
56. Tuncer E, Calçada RR, Zingg D, Varum S, Cheng P, Freiberger SN, et al. SMAD signaling promotes melanoma metastasis independently of phenotype switching. J Clin Invest (2019) 129:2702–16. doi: 10.1172/JCI94295
57. Yi Y, Cheng JC, Klausen C, Leung PCK. Activin A promotes ovarian cancer cell migration by suppressing E-cadherin expression. Exp Cell Res (2019) 382:111471. doi: 10.1016/j.yexcr.2019.06.016
58. Bashir M, Damineni S, Mukherjee G, Kondaiah P. Activin-A signaling promotes epithelial–mesenchymal transition, invasion, and metastatic growth of breast cancer. NPJ Breast Cancer (2015) 1:15007. doi: 10.1038/npjbcancer.2015.7
59. Zaidi MR, Davis S, Noonan FP, Graff-Cherry C, Hawley TS, Walker RL, et al. Interferon-γ 3 links ultraviolet radiation to melanomagenesis in mice. Nature (2011) 469:548–55. doi: 10.1038/nature09666
60. Robson NC, Wei H, McAlpine T, Kirkpatrick N, Cebon J, Maraskovsky E. Activin-A attenuates several human natural killer cell functions. Blood (2009) 113:3218–25. doi: 10.1182/blood-2008-07-166926
61. Rautela J, Dagley LF, De Oliveira CC, Schuster IS, Hediyeh-Zadeh S, Delconte RB, et al. Therapeutic blockade of activin-A improves NK cell function and antitumor immunity. Sci Signal (2019) 12:7527. doi: 10.1126/scisignal.aat7527
62. Benci JL, Xu B, Qiu Y, Wu TJ, Dada H, Twyman-Saint Victor C, et al. Tumor interferon signaling regulates a multigenic resistance program to immune checkpoint blockade. Cell (2016) 167:1540–1554.e12. doi: 10.1016/j.cell.2016.11.022
63. Zaidi MR. The interferon-gamma paradox in cancer. J Interferon Cytokine Res (2019) 39:30–8. doi: 10.1089/jir.2018.0087
64. Chan JM, Zaidi S, Love JR, Zhao JL, Setty M, Wadosky KM, et al. Lineage plasticity in prostate cancer depends on JAK/STAT inflammatory signaling. Science (2022) 377:1180–91. doi: 10.1126/science.abn0478
65. Champhekar A, Heymans R, Saco J, Turon Font G, Gonzalez C, Gao A, et al. ERK mediates interferon gamma-induced melanoma cell death. Mol Cancer (2023) 22:165. doi: 10.1186/s12943-023-01868-x
66. Redfern AD, Spalding LJ, Thompson EW. The Kraken Wakes: induced EMT as a driver of tumour aggression and poor outcome. Clin Exp Metastasis (2018) 35:285–308. doi: 10.1007/s10585-018-9906-x
67. Gao J, Shi LZ, Zhao H, Chen J, Xiong L, He Q, et al. Loss of IFN-γ pathway genes in tumor cells as a mechanism of resistance to anti-CTLA-4 therapy. Cell (2016) 167:397–404. doi: 10.1016/j.cell.2016.08.069
68. Zappasodi R, Wolchok JD, Merghoub T. Strategies for predicting response to checkpoint inhibitors. Curr Hematol Malig Rep (2018) 13:383–95. doi: 10.1007/s11899-018-0471-9
69. Hu-Lieskovan S, Malouf GG, Jacobs I, Chou J, Liu L, Johnson ML. Addressing resistance to immune checkpoint inhibitor therapy: An urgent unmet need. Future Oncol (2021) 17:1401–39. doi: 10.2217/fon-2020-0967
70. Ayers M, Lunceford J, Nebozhyn M, Murphy E, Loboda A, Kaufman DR, et al. IFN-γ-related mRNA profile predicts clinical response to PD-1 blockade. J Clin Invest (2017) 127:2930–40. doi: 10.1172/JCI91190
71. Benci JL, Johnson LR, Choa R, Xu Y, Qiu J, Zhou Z, et al. Opposing functions of interferon coordinate adaptive and innate immune responses to cancer immune checkpoint blockade. Cell (2019) 178:933–48. doi: 10.1016/j.cell.2019.07.019
72. Cui C, Xu C, Yang W, Chi Z, Sheng X, Si L, et al. Ratio of the interferon-γ signature to the immunosuppression signature predicts anti-PD-1 therapy response in melanoma. NPJ Genomic Med (2021) 6:1–12. doi: 10.1038/s41525-021-00169-w
73. De Angelis C, Fu X, Cataldo ML, Nardone A, Pereira R, Veeraraghavan J, et al. Activation of the IFN signaling pathway is associated with resistance to CDK4/6 inhibitors and immune checkpoint activation in ER-positive breast cancer. Clin Cancer Res (2021) 27:4870–82. doi: 10.1158/1078-0432.CCR-19-4191
74. Weichselbaum RR, Ishwaran H, Yoon T, Nuyten DSA, Baker SW, Khodarev N, et al. An interferon-related gene signature for DNA damage resistance is a predictive marker for chemotherapy and radiation for breast cancer. Proc Natl Acad Sci U.S.A. (2008) 105:18490–5. doi: 10.1073/pnas.0809242105
75. Decout A, Katz JD, Venkatraman S, Ablasser A. The cGAS–STING pathway as a therapeutic target in inflammatory diseases. Nat Rev Immunol (2021) 21:548–69. doi: 10.1038/s41577-021-00524-z
76. Marcus A, Mao AJ, Lensink-Vasan M, Wang L, Vance RE, Raulet DH. Tumor-derived cGAMP triggers a STING-mediated interferon response in non-tumor cells to activate the NK cell response. Immunity (2018) 49:754–763.e4. doi: 10.1016/j.immuni.2018.09.016
77. Bakhoum SF, Ngo B, Laughney AM, Cavallo J-A, Murphy CJ, Ly P, et al. Chromosomal instability drives metastasis through a cytosolic DNA response. Nature (2018) 553:467–72. doi: 10.1038/nature25432
78. Bruand M, Barras D, Mina M, Ghisoni E, Morotti M, Lanitis E, et al. Cell-autonomous inflammation of BRCA1-deficient ovarian cancers drives both tumor-intrinsic immunoreactivity and immune resistance via STING. Cell Rep (2021) 36:109412. doi: 10.1016/j.celrep.2021.109412
79. Falahat R, Berglund A, Putney RM, Perez-Villarroel P, Aoyama S, Pilon-Thomas S, et al. Epigenetic reprogramming of tumor cell–intrinsic STING function sculpts antigenicity and T cell recognition of melanoma. Proc Natl Acad Sci (2021) 118:e2013598118. doi: 10.1073/pnas.2013598118
Keywords: cancer, intercellular communication, scRNA-seq, profiling, knockdown, activin, interferon, STING
Citation: Pinjusic K, Ambrosini G, Lourenco J, Fournier N, Iseli C, Guex N, Egorova O, Nassiri S and Constam DB (2024) Inhibition of anti-tumor immunity by melanoma cell-derived Activin-A depends on STING. Front. Immunol. 14:1335207. doi: 10.3389/fimmu.2023.1335207
Received: 08 November 2023; Accepted: 22 December 2023;
Published: 18 January 2024.
Edited by:
Venkateshwar Keshamouni, University of Michigan, United StatesReviewed by:
Michał Zarobkiewicz, Medical University Of Lublin, PolandCopyright © 2024 Pinjusic, Ambrosini, Lourenco, Fournier, Iseli, Guex, Egorova, Nassiri and Constam. This is an open-access article distributed under the terms of the Creative Commons Attribution License (CC BY). The use, distribution or reproduction in other forums is permitted, provided the original author(s) and the copyright owner(s) are credited and that the original publication in this journal is cited, in accordance with accepted academic practice. No use, distribution or reproduction is permitted which does not comply with these terms.
*Correspondence: Daniel B. Constam, RGFuaWVsLkNvbnN0YW1AZXBmbC5jaA==
†Present address: Sina Nassiri, Roche Pharma Research and Early Development, Roche Innovation Center Basel, Basel, Switzerland
Disclaimer: All claims expressed in this article are solely those of the authors and do not necessarily represent those of their affiliated organizations, or those of the publisher, the editors and the reviewers. Any product that may be evaluated in this article or claim that may be made by its manufacturer is not guaranteed or endorsed by the publisher.
Research integrity at Frontiers
Learn more about the work of our research integrity team to safeguard the quality of each article we publish.