 Yuping Wang
 Yongli Yang
 Xiaocan Jia
 Nana Wang
 Xuezhong Shi
- Department of Epidemiology and Biostatistics, College of Public Health, Zhengzhou University, Zhengzhou, Henan, China
Background: The common clinical symptoms and immunopathological mechanisms have been observed among multiple autoimmune diseases (ADs), but the shared genetic etiology remains unclear.
Methods: GWAS summary statistics of seven ADs were downloaded from Open Targets Genetics and Dryad. Linkage disequilibrium score regression (LDSC) was applied to estimate overall genetic correlations, bivariate causal mixture model (MiXeR) was used to qualify the polygenic overlap, and stratified-LDSC partitioned heritability to reveal tissue and cell type specific enrichments. Ultimately, we conducted a novel adaptive association test called MTaSPUsSet for identifying pleiotropic genes.
Results: The high heritability of seven ADs ranged from 0.1228 to 0.5972, and strong genetic correlations among certain phenotypes varied between 0.185 and 0.721. There was substantial polygenic overlap, with the number of shared SNPs approximately 0.03K to 0.21K. The specificity of SNP heritability was enriched in the immune/hematopoietic related tissue and cells. Furthermore, we identified 32 pleiotropic genes associated with seven ADs, 23 genes were considered as novel genes. These genes were involved in several cell regulation pathways and immunologic signatures.
Conclusion: We comprehensively explored the shared genetic architecture across seven ADs. The findings progress the exploration of common molecular mechanisms and biological processes involved, and facilitate understanding of disease etiology.
1 Introduction
Autoimmune diseases(ADs) represent a heterogeneous group of disorders characterized by an immune response against self-antigens, leading to target tissues destruction (1). Genetic factors are widely acknowledged to play an essential role in the pathogenesis of multiple ADs (2). Previous studies document that monozygotic twins have a higher concordance rates of ADs compared to the dizygotic twins, and that siblings are at higher risk than general population (3, 4). In addition, these diseases are also comorbid that individuals who are susceptible to one disease have a heightened risk of another disease, with dual diagnoses being more frequent, suggesting that ADs may share the common genetic basis (5, 6).
Genome wide association studies (GWAS) have discovered thousands of susceptibility loci related to ADs, and confirmed their polygenic property (4). Particularly, many genetic loci display a common link to multiple ADs. For instance, PTPN22, known as one the strongest risk gene to promote the development of ADs, is particularly related to systemic lupus erythematosus (SLE), rheumatoid arthritis (RA), and type 1 diabetes (T1D) (7). IL2RA is predisposed to multiple ADs including RA, T1D and multiple sclerosis (MS) (8). Additionally, CTLA4 is responsible for various T cells immune regulation, and its blockade results to major fatal autoimmunity (9). Inversely, targeting CTLA-4 pathway binding the costimulatory molecules can be extensively used to treat ADs, such as RA. Therefore, exploration of genetic pleiotropy is essential to reveal common disease mechanisms and develop potential treatments.
To date, the shared genetic and functional profile of ADs have been mostly identified by simple comparison based on univariate or bivariate analyses, which have insufficient power without combining the related phenotypes (10). Recently, combined studies that incorporate several diseases have proven to be a powerful way to determine the genetic overlap existing in several diseases. A cross-disorder analysis reveals new shared loci converging in T cell activation and signaling pathways by combining 9 immune diseases (11). A multi-trait meta-analysis discovered 4 novel loci shared between several autoimmune and allergic diseases (12). Furthermore, Kwak et al. (13) proposed an adaptive analysis on the basis of summary of powered score (MTSPUsSet), that allows identification of gene-level associations by assembling information from multiple phenotypes and SNPs. MTSPUsSet has been employed to recognize potentially genes involved in five psychiatric disorders (14). Accordingly, researchers are dedicated to explore common genetic mechanisms and pathogenesis through multivariate analytical methods.
In this study, comprehensively and systematically multivariate association analyses were performed to elucidate the shared genetic architecture of seven ADs including T1D, SLE, RA, MS, celiac disease (CEL), ulcerative colitis (UC) and primary biliary cirrhosis (PBC), based on GWAS summary statistics from three levels: heritability and genetic correlation, tissue and cell specificity, and pleiotropy. The analysis flowchart was illustrated in Figure 1.

Figure 1 Flow chart of study design.
2 Materials and methods
2.1 Study samples
GWAS summary statistics were downloaded from Open Targets Genetics for CEL, MS, PBC, RA, UC and SLE (website: https://genetics.opentargets.org/) (15). In particular, the CEL summary statistics was derived from 4533 patients and 10750 controls with 523402 variants (16). The summary statistics for MS comprised 464357 SNPs variants involving 9772 cases from 23 research groups (17). The PBC dataset with 1134141 SNPs variates were derived from a meta-analysis together with another cohort containing 6480 patients and 14736 controls (18). The RA summary statistics included 8254863 variants obtaining from meta-analysis of 12307 patients and 28975 controls (8). The UC summary statistics consisted of 1407735 variants from a meta-analysis of 16315 patients and 32635 controls (19). The SLE dataset comprised 7915251 variants from a meta-analysis with 7219 patients and 15991 controls (20). The summary statistics for T1D involving 8781607 variants included 5913 patients and 8828 controls from a meta-analysis in Dryad (website: https://datadryad.org/stash/) (21). All samples of seven phenotypes were from population of European ancestry. GWAS summary statistics were subjected to rigorous quality control as described in the original publication. The information of summary statistics was showed in Supplementary Table 1.
2.2 Linkage disequilibrium score regression analysis
Linkage disequilibrium score regression (LDSC) is a statistical methodology that estimates the SNP heritability () and genetic correlations (rg) between traits with GWAS summary data. This method could minimize the impact arising from confounding factors and population stratification (22). This study used the pre-calculated LD scores based on 1000 Genomes Project’s European population to ensure imputation quality. The analysis was conducted using LDSC software, version v1.0.1 (https://github.com/bulik/ldsc).
2.3 Quantification of polygenic overlap using MiXeR
The causal mixture model provided by MiXeR was employed to quantify both the unique and common polygenic components contributing to complex phenotypes, using the GWAS summary data (https://github.com/precimed/mixer). In cross-traits analysis, the bivariate MiXeR model additive effects with 4 independent genetic components based on the principle that only a small subset of variants significantly influences the trait (23),
where is fraction of null SNPs in both traits; and are fraction of SNPs having unique impact on the one trait; is fraction of SNPs having common impact on two traits; in variance-covariance matrix, represents correlation of the overlap component, and indicate the variance of effective SNPs for the two traits. We used 1000 Genomes Europeans as a reference panel to assess the count of specific and shared effective genetic variants.
2.4 Tissue and cell specificity
To identify the tissue and cell specificity regarding seven ADs on the basis of heritability enrichment, we performed stratified-LDSC (24), which partitions heritability into different categories and calculates category-specific enrichments. We performed the tissue specificity analyses based on Genotype-Tissue Expression (GTEx) data that provide insights into gene expression variation across 53 non-diseased human primary tissues (25). In addition, cell specificity analysis was performed utilizing 220 cell annotations from four histone marks: H3K4me1, H3K4me3, H3K9ac and H3K27ac (24). To establish a general overview of the cell types associated with the phenotype, we further divided the 220 cell annotations into 10 groups, representing the system or organ-level structure. The significance thresholds were set at P<0.05/53 = 9.4×10⁻⁴ for tissue specificity, at P<0.05/220 = 2.3×10⁻⁴ for cell-type specificity and at P<0.05/10 = 5×10⁻³ for cell-type-group specificity.
2.5 Gene-based adaptive association tests
The data underwent multiple processing steps to obtain common SNPs suitable for pleiotropic analyses. SNP pruning based on LD was firstly applied with threshold (50 5 0.1) to eliminate highly correlated SNPs, and a set of 40957 SNPs were retained. The HapMap 3 CEU genotypes served as reference panel. Subsequently, gene annotation was conducted for the maintained SNPs using the hg38 genome dataset (http://www.genome.ucsc.edu/cgi-bin/hgTables). Eventually, a total of 21897 common SNPs was located in 9886 gene for identifying pleiotropic variants.
The statistic tests for the association of multiple SNPs with single trait, and the association of multiple SNPs with multiple traits on the basis of summary statistics are as follows, respectively:
indicates the hth trait in the matrix Z. and are adaptive weights for SNP and trait, respectively, and both are greater than or equal to 1.
In order to select the optimal values of , we propose adaptive tests as:
Where and indicate the p values of SPUs and MTSPUsSet , respectively (13).
The adaptive association tests require a matrix of Z scores (Z), correlation matrix of SNPs (R), correlation matrix of multiple traits (V) and the weighting index γ. The optimal choice of γ, weighting the SNPs or traits, depends on the unknown association patterns, by default, Γ={1, 2, 4, 8}. The potential pleiotropic genes related to seven ADs were initially detected applying MTaSPUsSet. Subsequently, the aSPUs test was employed to discover genes specifically linked to individual phenotype. P<0.05/9886 = 5.06×10⁻⁶ was considered significant after Bonferroni correction.
2.6 GWAS catalog analysis
To investigate whether previous studies reported the identified pleiotropic genes to be associated with seven ADs, we performed a systematic search in GWAS Catalog (https://www.ebi.ac.uk/gwas/) (26).
2.7 Functional annotation
To explore putative biological implications of pleiotropic genes, we performed the gene set analyses including Gene Ontology (GO) gene sets and immunologic signatures obtained from MsigDB using software functional mapping and annotation (FUMA) (27, 28). Moreover, we performed the protein-protein interaction (PPI) analysis utilizing available STRING dataset (https://string-db.org/), to offer valuable insights into the functional associations and interactions between proteins encoded by these pleiotropic genes (29).
2.8 Statistical analysis
The genetic correlation as well as tissue and cell specificity were performed on the basis of all SNPs for each phenotype, and pleiotropic analyses were implemented based on the common SNPs of seven ADs. All statistical analyses were conducted using R 4.0.3 and PLINK 1.9.
3 Results
3.1 Genetic correlations among seven ADs
The SNP heritability () of seven ADs was first evaluated by univariate LDSC, the estimates of varied between 0.1228 and 0.5972 (Figure 2A). Bivariate LDSC was then applied to evaluate genetic correlations across ADs with ranges of 0.185 and 0.721 (Figure 2B). Notably, we discovered multiple significant correlations (P<0.05/21 = 0.002), with the strongest genetic correlation for MS-PBC (rg=0.701, se=0.213), followed by PBC-SLE (rg=0.584, se=0.082) and RA-SLE (rg=0.478, se=0.061). Furthermore, the LD score intercepts for seven ADs near 1, indicating the inflation is primarily driven by the polygenic effect.
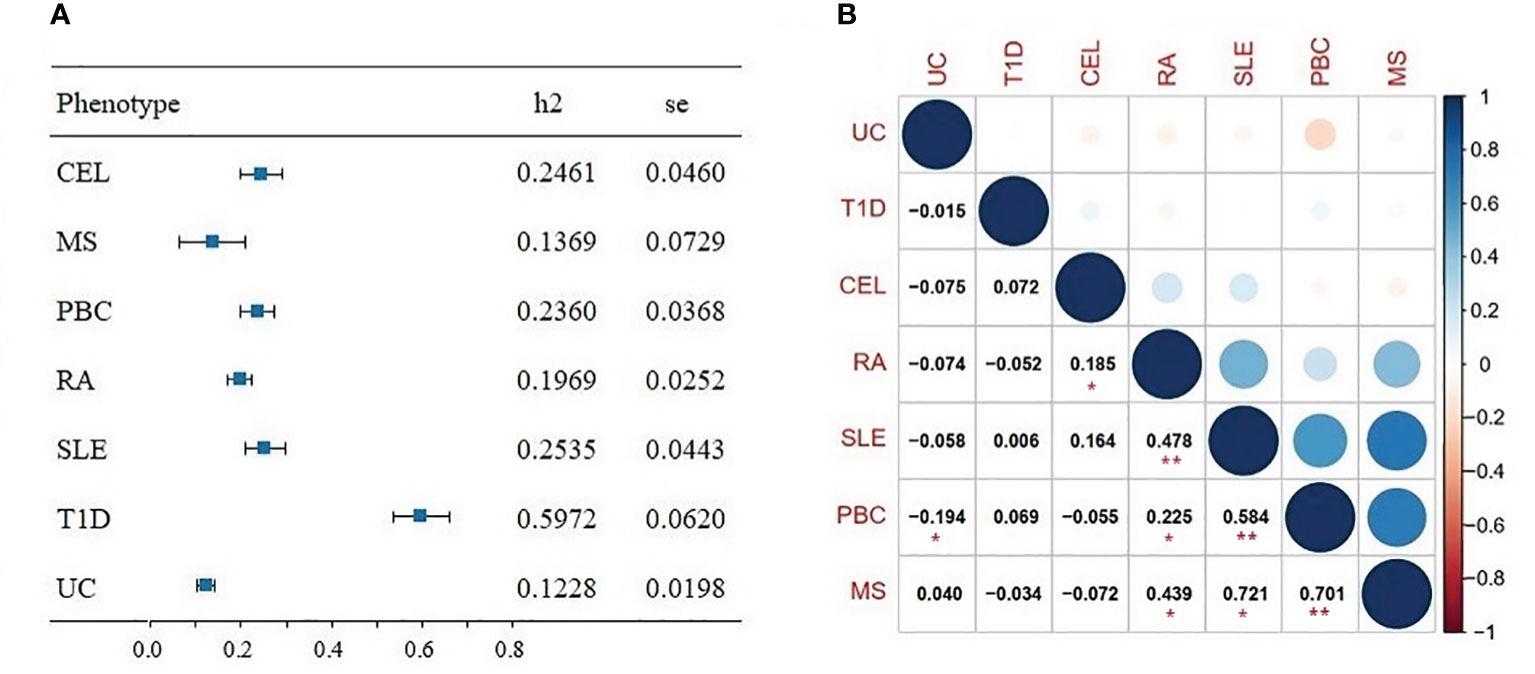
Figure 2 (A) Forest plot of SNP-heritability estimates (h2) for seven autoimmune diseases using univariate linkage disequilibrium score regression (LDSC). (B) Genetic correlation for seven autoimmune diseases using bivariate LDSC. Significant results (P<0.05/21 = 0.002) are marked with asterisk (**), nominally significant results (P<0.05) are marked with asterisk (*).
3.2 Genetic overlap across seven ADs
As shown in conditional Q-Q plots, each line displayed leftward separation, indicating polygenic overlap between seven ADs (Supplementary Figure 1). Performing MiXeR analysis, we further quantified the polygenic overlap between ADs and represented the polygenic components as Venn diagrams (Figure 3). There was substantial polygenic overlap for CEL and PBC, sharing 0.21K out of 0.30K causal variants. PBC and UC shared 0.19K out of 0.35K causal variants. Further, CEL and UC also exhibited genetic overlap, sharing 0.17K out of 0.37K causal variants. The amount of polygenic overlap was relatively small in other pairs of diseases.
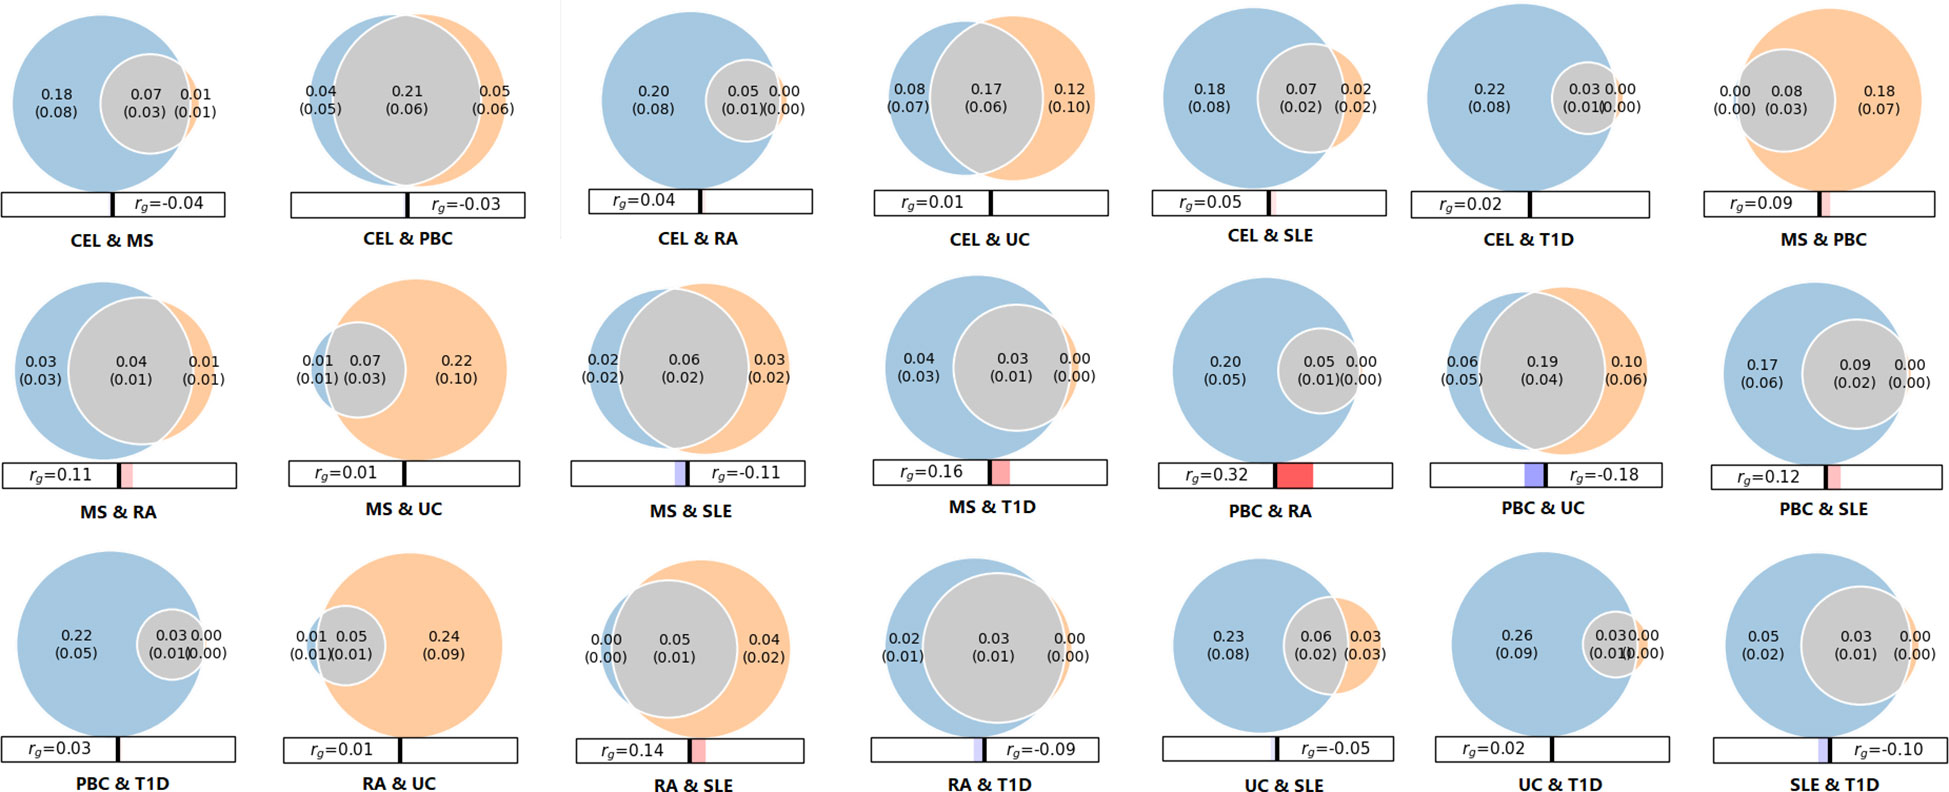
Figure 3 Venn diagrams of unique and shared polygenic variants across seven autoimmune diseases. The gray presents polygenic overlap between two phenotypes, the blue represents unique variants of first phenotype, and the orange represents unique variants of second phenotype. The numbers indicate the estimated quantity of effective variants (in thousands) per phenotype, explain 90% of SNP heritability in each phenotype, followed by the standard error. The size of the circles reflects the degree of effective variants. The panels beneath Venn diagram represents the genetic correlation calculated by MiXeR, red/blue bars indicate positive and negative correlations, respectively.
3.3 Tissue and cell specificity for seven ADs
We applied S-LDSC to explore tissue specific enrichment of heritability for seven ADs, using GTEx data for 53 tissues (Figure 4; Supplementary Table 2). We identified substantial heritability enrichment for seven ADs in immune-related tissues of cells Epstein-Barr Virus (EBV) transformed lymphocytes, lung, spleen, and whole blood. Notably, T1D and UC were also significantly enriched in adipose visceral (omentum) and colon transverse, respectively. Additionally, MS, PBC, RA and UC showed higher enrichment in small intestine terminal ileum, although failing to reach Bonferroni significance.
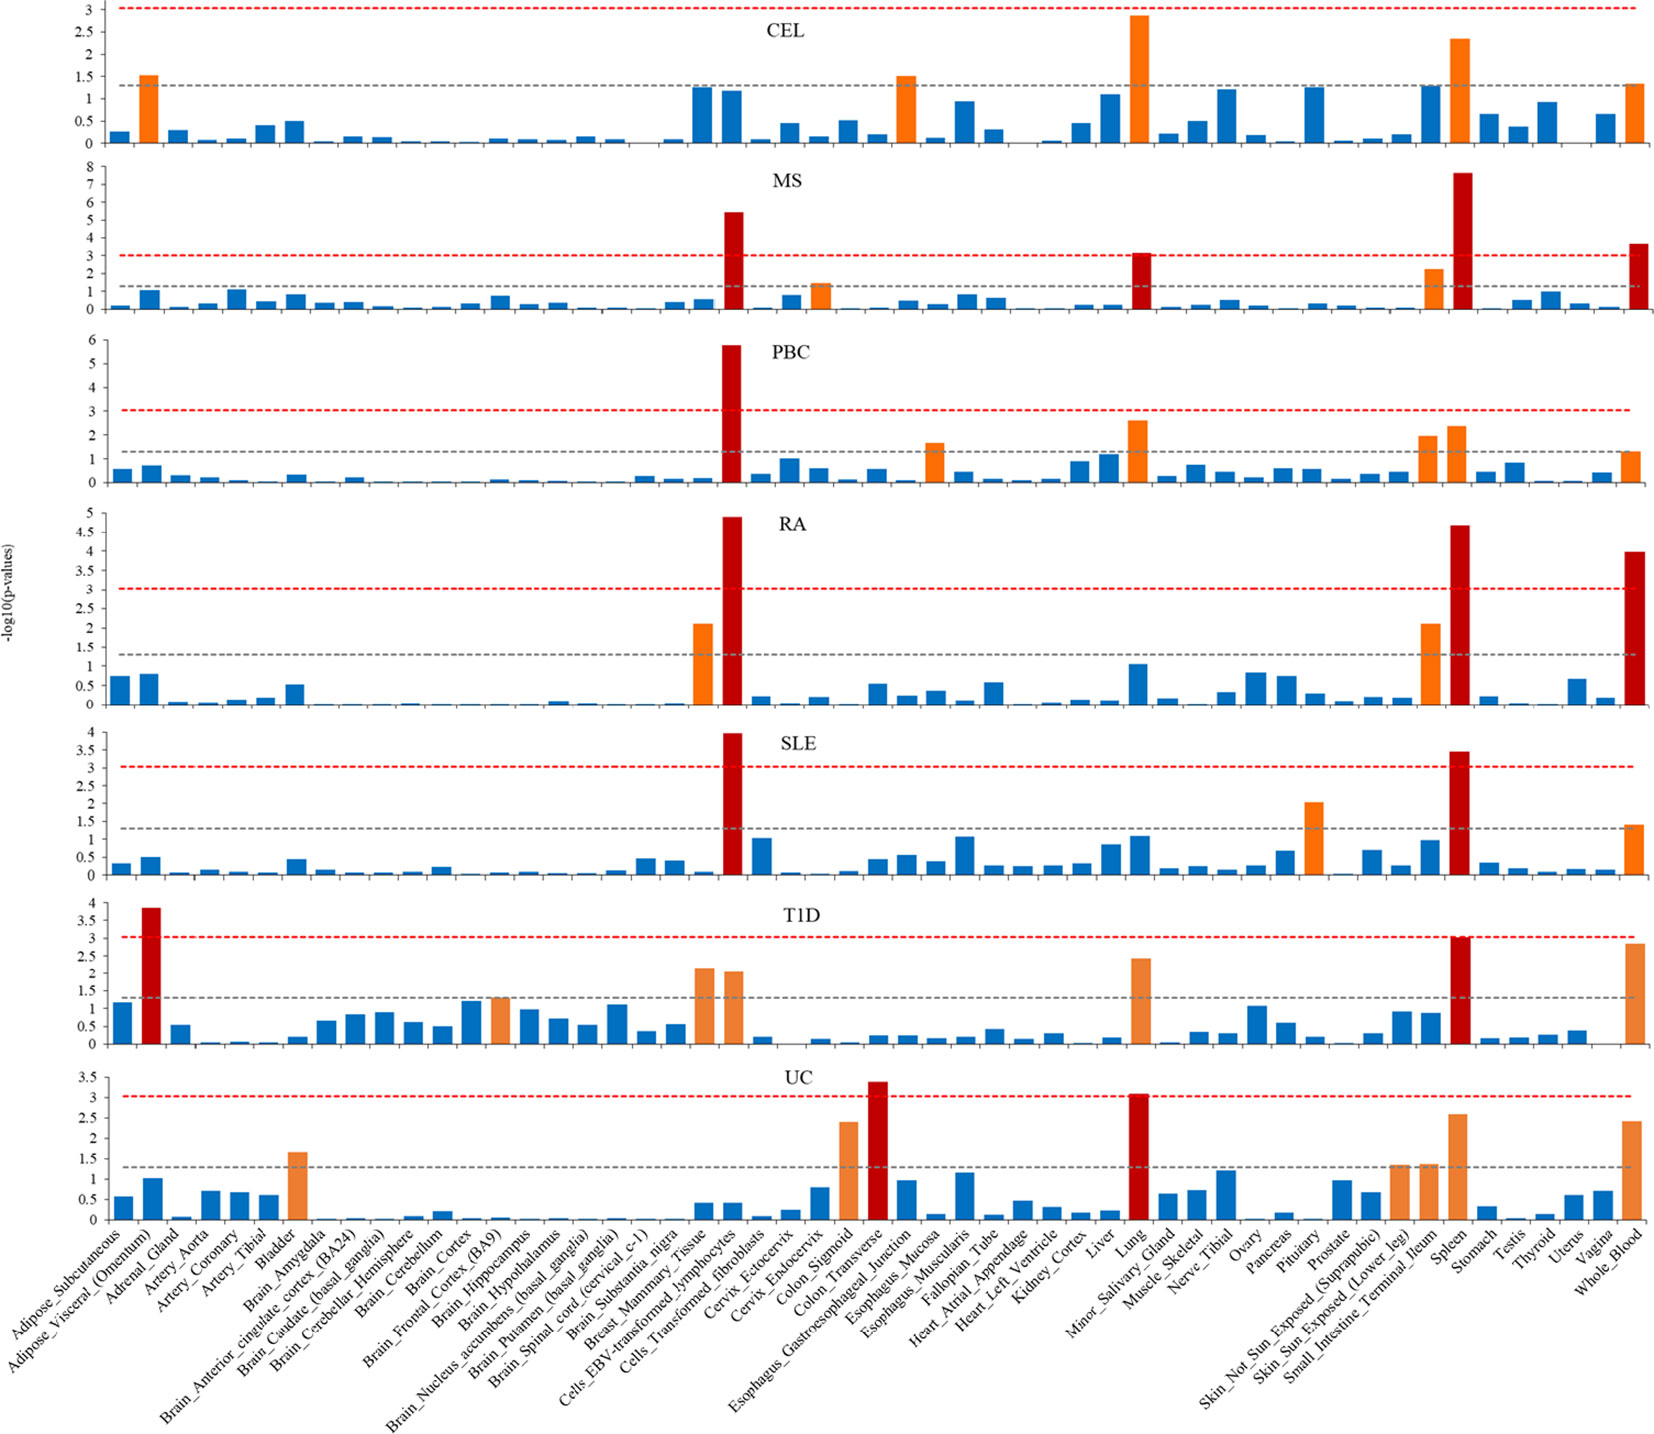
Figure 4 Tissue type-specific enrichment of SNP heritability for seven autoimmune diseases using stratified linkage disequilibrium score regression (S-LDSC). The x-axis represents tissue type, y-axis represents the log-transformed P-value of coefficient Z scores. Annotations with statistical significance after Bonferroni corrections (P<0.05/53) were plotted in red, annotations with nominal significance (P<0.05) were plotted in orange, otherwise in blue. The horizontal grey dash line indicates P-threshold of 0.05; horizontal red dash line indicates P-threshold of 0.05/53.
The S-LDSC was extended to explore the cell type specificity for seven ADs. To capture an overview of cell type associated with phenotypes, we firstly evaluated the enrichment in 10 cell groups (Figure 5; Supplementary Table 3). All seven ADs revealed significant enrichment in immune/hematopoietic group only. We then assessed heritability enrichment at cell type level to differentiate the cell type within the group (Supplementary Figure 2, Supplementary Table 4). There were 32 significant cell type enrichments for CEL, 53 for MS, 12 for PBC, 26 for RA, 8 for SLE, 45 for T1D and 7 for UC. The seven ADs were significantly enriched in several immune cells, such as CD4, CD8, CD25, T helper (Th) Th1, Th2, Th17, regulatory CD4+ T (Treg) cells, peripheral blood mononuclear primary and so on.
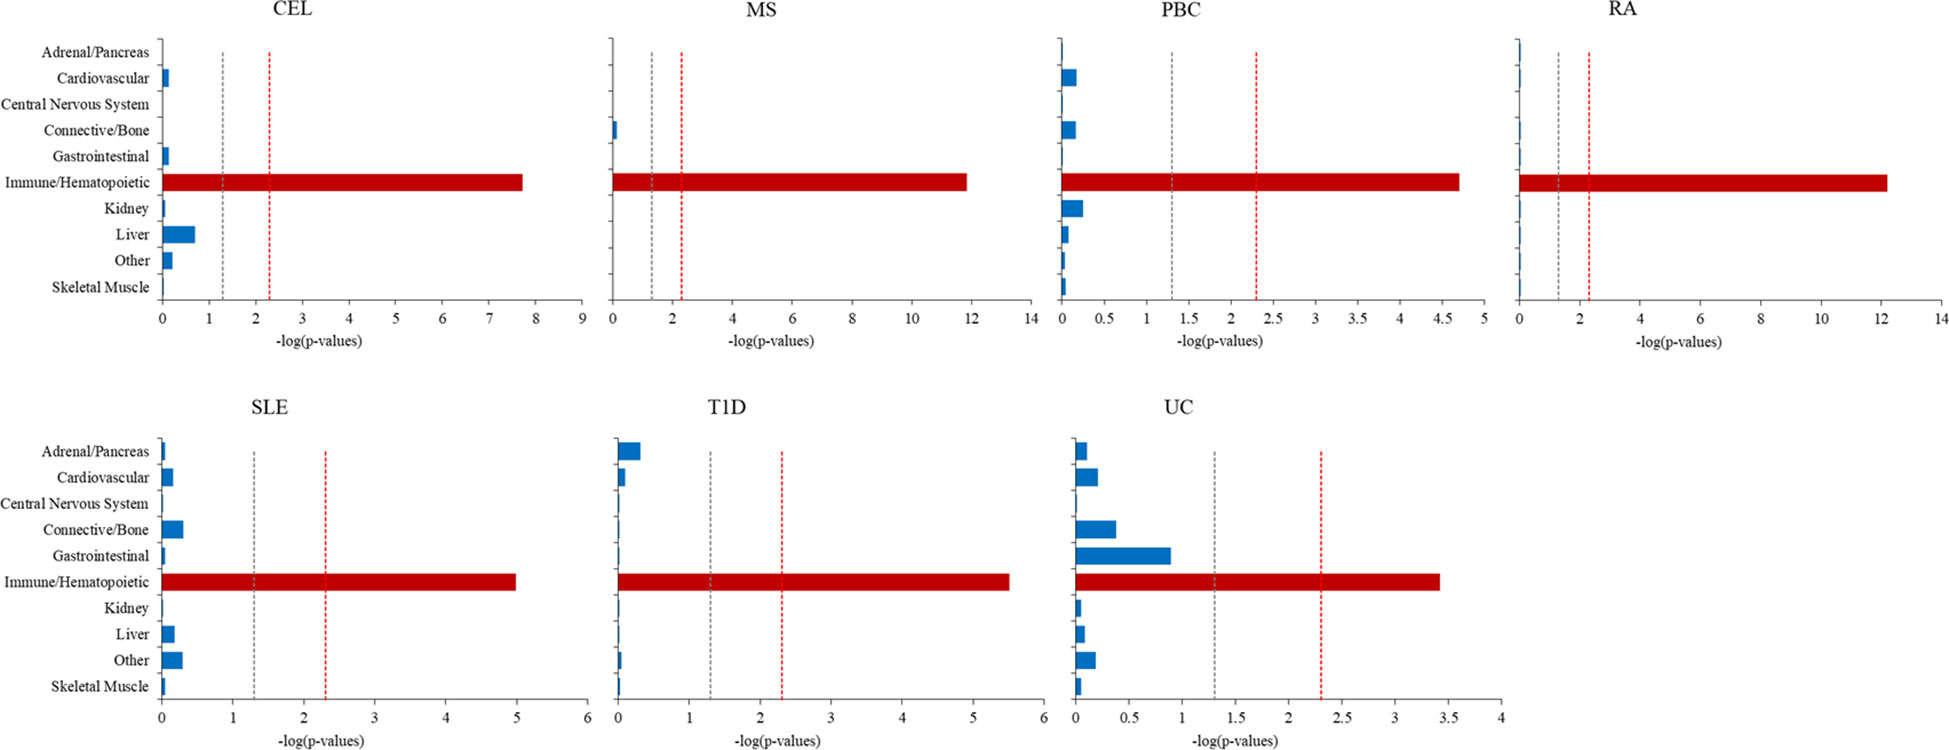
Figure 5 Cell-type-group-specific enrichment of SNP heritability for seven autoimmune diseases using stratified linkage disequilibrium score regression (S-LDSC). The x-axis represents cell types, y-axis represents the log-transformed P-value of coefficient Z scores. Annotations with statistical significance after Bonferroni corrections (P<0.05/10) were plotted in red, annotations with nominal significance (P<0.05) were plotted in orange, otherwise in blue. The horizontal grey dash line indicates P-threshold of 0.05 and horizontal red dash line indicates P-threshold of 0.05/10.
3.4 Potential pleiotropic genes for seven ADs
Based on significant correlation among seven ADs, the adaptive association tests were implemented to aggregate genetic effects for detecting pleiotropic variants. The multivariate analysis of MTaSPUsSet identified a total of 44 potential pleiotropic genes associated with seven phenotypes. Subsequently, the univariate aSPUs test was applied to discover genes specifically related to individual phenotype. There were 2 significant genes for CEL, 3 genes for PBC, 8 genes for RA, 14 genes for UC, 7 genes for SLE and 5 genes for T1D. Eventually, a total of 32 pleiotropic genes were not only significant in MTaSPUsSet test, but also linked to at least one autoimmune disease identified by aSPUs test. Additionally, based on GWAS Catalog searching for pleiotropic genes, 9 genes had been reported to be related to ADs in previous studies, of which 2 genes were associated with CEL, 4 with MS, 5 with UC, 2 with PBC, 5 with SLE, 5 with RA, and 4 with T1D. Therefore, we detected 23 novel pleiotropic genes. The details of identified genes were showed in Table 1.
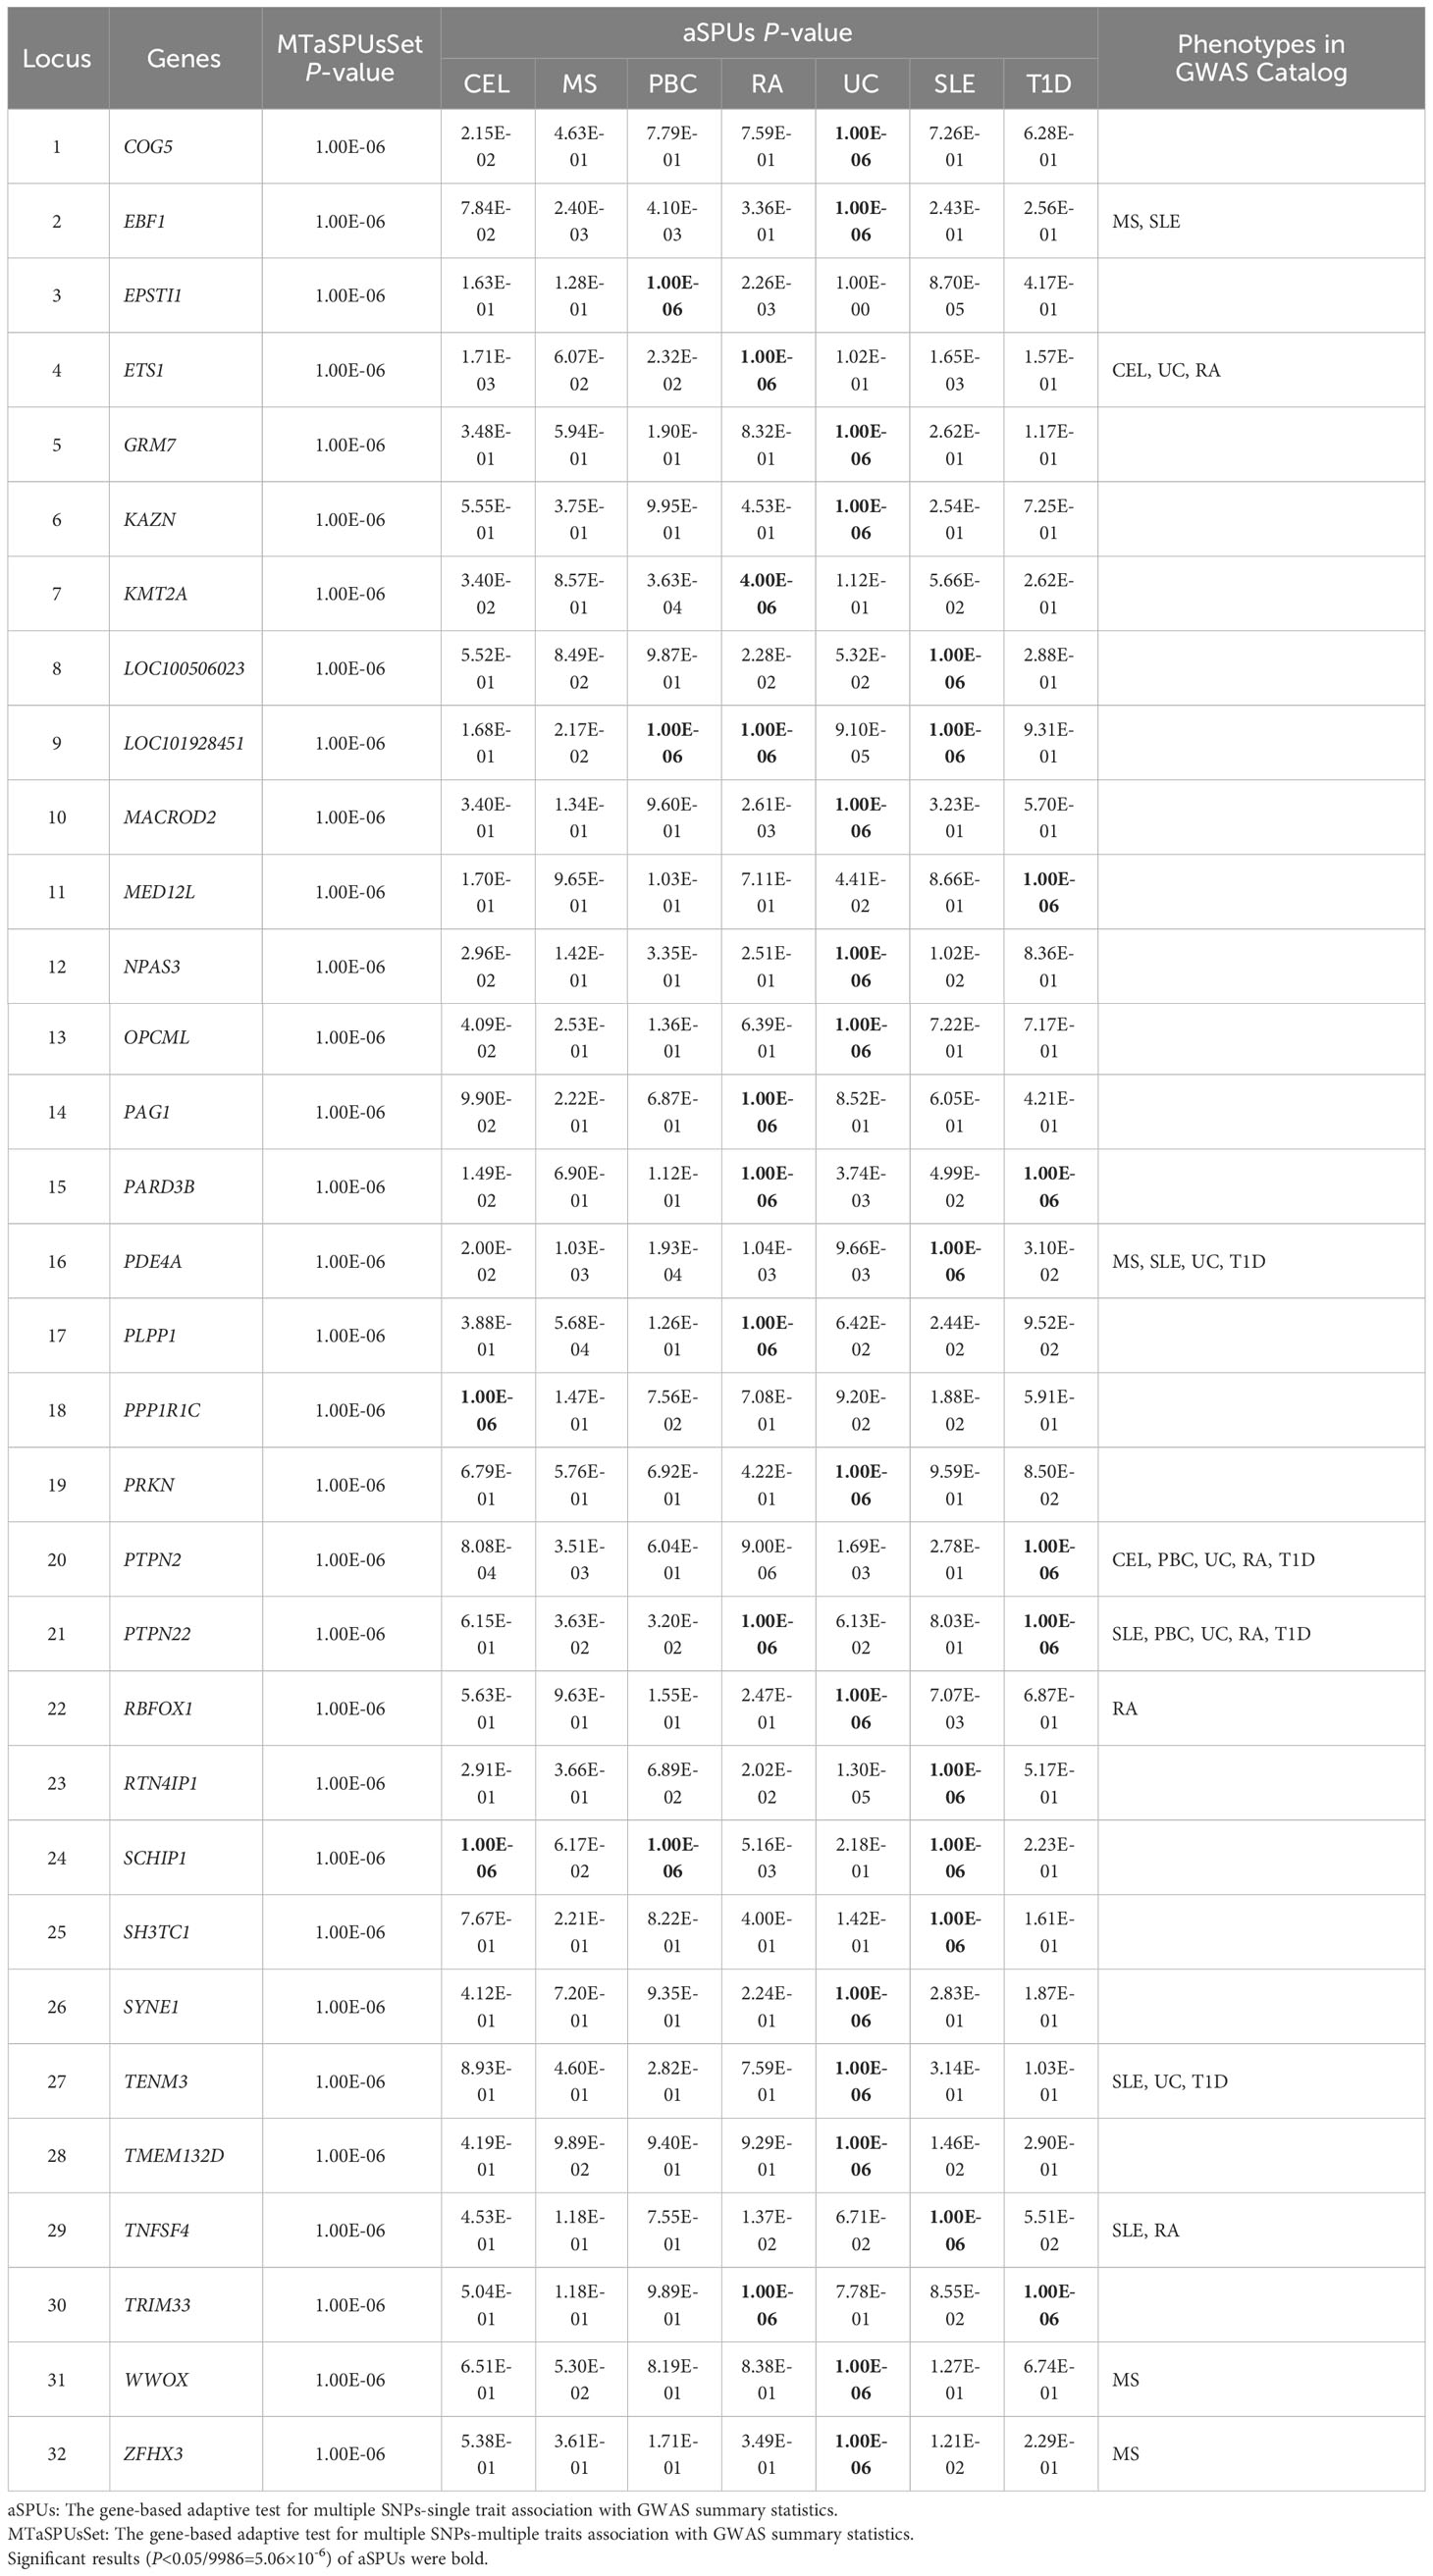
Table 1 The pleiotropic genes identified by the MTaSPUsSet, aSPUs test and GWAS catalog.
3.5 Functional annotations of pleiotropic genes
To clarify the biological process involved in pleiotropic genes, we conducted the functional annotations using FUMA. For gene-set analyses, we discovered two significant GO biological processes about the regulation of cell adhesion. In addition, there were three significant immunologic signatures regarding genes up-regulated in natural killer (NK) cell, dendritic cells (DC) and CD4 T cells. The information of significant annotations was showed in Table 2. Furthermore, PPI analysis was applied to visualize the interaction of pleiotropic genes. We observed a prominent gene cluster containing WWOX (Supplementary Figure 3).
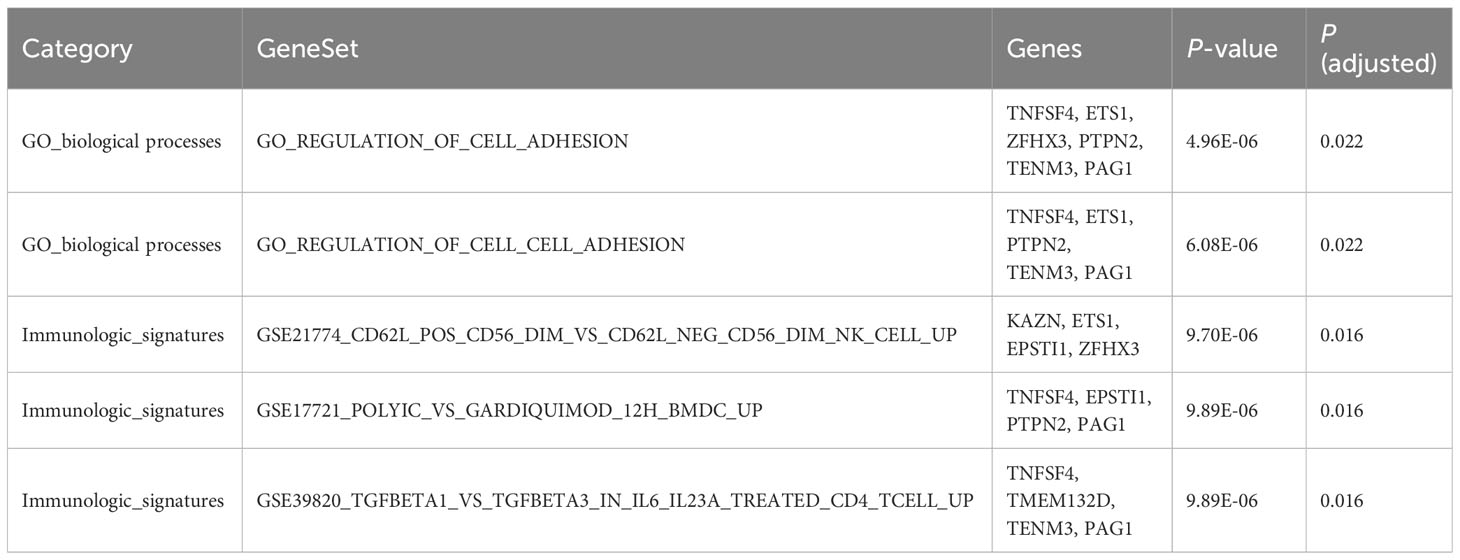
Table 2 The significant enrichment of functional annotation for the pleiotropic genes using FUMA.
4 Discussion
This study systematically investigated the genetic architecture of seven ADs in terms of genetic correlation, tissue and cell specificity, and pleiotropy using multiple large GWAS summary statistics. We revealed the high heritability and strong genetic correlations among seven ADs. The SNP heritability was enriched in the immune-related tissue such as cells EBV transformed lymphocytes, lung, spleen, and whole blood, as well as the immune/hematopoietic related cells. Furthermore, we discovered 32 pleiotropic genes related to seven ADs, 23 of which were considered as novel genes. The pleiotropic genes participated in regulation of cell adhesion and immunologic signatures. Our findings offered potential rationale for genetic mechanisms and provided important evidence for the common genetic architecture of seven ADs.
Genetic analyses suggested genetic factors making a strong contribution to the development of ADs. We identified high heritability among seven ADs, ranging from 0.1228 (UC) to 0.5972 (T1D). These results were consistent with findings detected by Li YR et al (30), which reported the heritability estimates of ADs for pediatric age-of-onset between 0.42 and 0.91, and slightly lower estimates for adult. Moreover, genetic studies documented a familial aggregation and increased concordance in monozygotic, suggesting a remarkable role for genetic factors in pathogenesis of ADs (31). In addition, we identified several significant genetic correlations among certain ADs. For instance, there was a strong correlation between RA and MS (rg=0.439), consistent with evidence that prevalence of RA in MS patients was assessed to range from 0.35% to 2.4% (32). Moreover, Weng et al (33) studied several comorbid ADs, and found significantly increased occurrence of RA, MS and PBC in patients with inflammatory bowel diseases. And a meta-analysis of 10 pediatric ADs stated that 81% of risk loci were associated with at least two ADs, which indicated a relatively high degree of common genetic predisposition (34). Furthermore, we found and quantified substantial polygenic overlap among multiple ADs using MiXeR. The large proportion of overlap variants reconfirmed strong correlations and shared genetic background.
The tissue and cell specificity of heritability enrichment suggested a distinct common etiology for multiple ADs. Across all tissue types, heritability for seven ADs were abundantly enriched in immune system-related tissues including cells EBV transformed lymphocytes, lung, spleen, and whole blood. Similar tissue enrichments for ADs had also been reported in considerable previous studies (35, 36). These findings together reflected a shared mechanism that inappropriate or dysregulated immune responses were responsible for triggering multiple ADs. Nevertheless, depending on the disease-specific context, tissue enrichment may show differentiation (37), as we found that UC was significantly enriched in the transverse colon, whereas T1D was enriched in adipose visceral. In addition, most GWAS associations were attributable to regulatory variations, which were generally cell specific and controlled gene expression in relation to cell state (38). Our cell type-specific analysis revealed the remarkable enrichment in immune/hematopoietic group and various immune-related T cells for ADs. Bourges C et al (39) had demonstrated that regulation loci of primary CD4 T cells was most enriched for immune-mediated disease SNPs. Substantial evidence supported that CD4 T cell subsets, such as Th17 and Th1 cells, were involved in many ADs such as MS, RA and SLE (40). Moreover, Treg cells were a subset of T-cell specialized for immune suppression and maintained autoimmune tolerance by expressing inhibitory receptors and secreting anti-inflammatory cytokines (41). Together, these findings demonstrated the significant role of immune function in pathogenesis of multiple ADs.
The pleiotropic genes further support the common genetic mechanisms across ADs. Among 32 pleiotropic genes detected, 9 pleiotropic genes had been revealed to influence ADs development in previous studies. We identified that PTPN22 was a shared susceptibility gene affecting multiple ADs with an increased risk of T1D, SLE, PBC, RA, and UC. Previous reports had demonstrated that PTPN22 could both inhibit T cell activation through confining downstream signals of the T cell receptor (TCR) and promote type I interferon generation of myeloid cell selectively by enhancing downstream signals of recognition receptors (42). TNFSF4 encoded a membrane-bound protein and served as a T cell co-stimulator (TNFRSF4) ligand (43). Increasing evidence supported that TNFSF4-TNFRSF4 pair could promote the survival and generation of effector T cells as well as memory CD4+ T cells, thereby participating in the occurrence and development of multiple ADs (44). Additionally, the functional annotation analysis found that TNFSF4 participated in controlling of immunologic signatures in dendritic cells and CD4 T cells. Our PPI result also revealed an interaction between PTPN22 and TNFSF4 highlighting the significant function of pleiotropic genes in immune response. Except these several confirmed pleiotropic genes, the present study inspected 23 novel genes utilizing adaptive tests, which may add new evidence for the common genetic mechanism of multiple ADs. For example, PAG1 encoded a transmembrane adaptor protein that negatively regulated immune receptor signaling in T cell, B cells and mast cells, as well as inhibited the formation of immune synapse (45). Evidence from GWAS suggested that PAG1 was related to risk of allergic and inflammatory diseases, such as asthma, although there was no direct proof of an association with AD (46). Additionally, our function results indicated that PAG1 participated in cell adhesion signaling and regulation of dendritic and CD4 T cells. The novel pleiotropic gene WWOX is a cancer suppressor gene that could induce apoptosis and inhibit growth in various cancers. The PPI analysis also showed WWOX interacted with multiple genes. Previous researches showed that WWOX had an important effect on T cells proliferation and FasL expression, and ultimately regulated the T cells apoptosis (47). Generally, loss of WWOX expression could suppress immune attack through producing apoptotic signaling.
In terms of uncovering the common genetic architecture in multiple ADs, we systematically quantified the genetic correlations and assessed functional mechanisms using the large available GWAS summary statistics. Importantly, our gene-level analysis based on MTaSPUsSet has increased power by consolidating the multi-level association information and reducing the burden caused by multiple testing. Despite the strengths, several limitations should also be considered. First, although MTaSPUsSet identified some novel genes, it was not compared with other existing multivariate methods. Second, the common genetic mechanism underlying multiple ADs was explored only based on the genomic data, and further studies combined with other omics are needed.
In conclusion, our comprehensive analyses revealed relatively substantial heritability and significantly robust genetic correlations across seven ADs. The SNP heritability of ADs were significantly enriched in immune-related tissue and cells. In addition, we identified 32 pleiotropic genes shared in multiple ADs, 23 of which were novel pleiotropic genes. Our findings contribute to the understanding of genetic mechanisms, and reveal the common pathogenesis among complex diseases.
Data availability statement
The datasets presented in this study can be found in online repositories. The names of the repository/repositories and accession number(s) can be found in the article/Supplementary Material.
Author contributions
YW: Data curation, Formal analysis, Methodology, Writing – original draft. YY: Formal analysis, Methodology, Writing – review & editing. XJ: Conceptualization, Writing – review & editing. CZ: Data curation, Formal analysis, Methodology, Writing – review & editing. CY: Writing – review & editing. JF: Writing – review & editing. NW: Writing – review & editing. XS: Conceptualization, Funding acquisition, Validation, Writing – review & editing.
Funding
The author(s) declare financial support was received for the research, authorship, and/or publication of this article. This research was supported by the National Natural Science Foundation of China [grant no.82073670]; and Key Scientific Research Program of Higher Education Institutions of Henan Province [grant no.23A330003].
Acknowledgments
We thank Open Targets Genetics for sharing the genome-wide summary statistics of CEL, MS, PBC, RA, UC and SLE, all investigators and participants of T1D cohort for providing access to summary data, and National Supercomputing Center in Zhengzhou for providing the data calculation platform.
Conflict of interest
The authors declare that the research was conducted in the absence of any commercial or financial relationships that could be construed as a potential conflict of interest.
Publisher’s note
All claims expressed in this article are solely those of the authors and do not necessarily represent those of their affiliated organizations, or those of the publisher, the editors and the reviewers. Any product that may be evaluated in this article, or claim that may be made by its manufacturer, is not guaranteed or endorsed by the publisher.
Supplementary material
The Supplementary Material for this article can be found online at: https://www.frontiersin.org/articles/10.3389/fimmu.2023.1303675/full#supplementary-material
References
1. Rosenblum MD, Remedios KA, Abbas AK. Mechanisms of human autoimmunity. J Clin Invest (2015) 125(6):2228–33. doi: 10.1172/JCI78088
2. Cho JH, Feldman M. Heterogeneity of autoimmune diseases: pathophysiologic insights from genetics and implications for new therapies. Nat Med (2015) 21(7):730–8. doi: 10.1038/nm.3897
3. Bogdanos DP, Smyk DS, Rigopoulou EI, Mytilinaiou MG, Heneghan MA, Selmi C, et al. Twin studies in autoimmune disease: genetics, gender and environment. J Autoimmun (2012) 38(2-3):J156–J69. doi: 10.1016/j.jaut.2011.11.003
4. Seldin MF. The genetics of human autoimmune disease: A perspective on progress in the field and future directions. J Autoimmun (2015) 64:1–12. doi: 10.1016/j.jaut.2015.08.015
5. Cotsapas C, Voight BF, Rossin E, Lage K, Neale BM, Wallace C, et al. Pervasive sharing of genetic effects in autoimmune disease. PloS Genet (2011) 7(8):e1002254. doi: 10.1371/journal.pgen.1002254
6. Bao YK, Weide LG, Ganesan VC, Jakhar I, McGill JB, Sahil S, et al. High prevalence of comorbid autoimmune diseases in adults with type 1 diabetes from the HealthFacts database. J Diabetes (2019) 11(4):273–9. doi: 10.1111/1753-0407.12856
7. Tizaoui K, Terrazzino S, Cargnin S, Lee KH, Gauckler P, Li H, et al. The role of PTPN22 in the pathogenesis of autoimmune diseases: A comprehensive review. Semin Arthritis Rheumatol (2021) 51(3):513–22. doi: 10.1016/j.semarthrit.2021.03.004
8. Stahl EA, Raychaudhuri S, Remmers EF, Xie G, Eyre S, Thomson BP, et al. Genome-wide association study meta-analysis identifies seven new rheumatoid arthritis risk loci. Nat Genet (2010) 42(6):508–14. doi: 10.1038/ng.582
9. Rowshanravan B, Halliday N, Sansom DM. CTLA-4: a moving target in immunotherapy. Blood (2018) 131(1):58–67. doi: 10.1182/blood-2017-06-741033
10. de Leeuw CA, Mooij JM, Heskes T, Posthuma D. MAGMA: generalized gene-set analysis of GWAS data. PloS Comput Biol (2015) 11(4):e1004219. doi: 10.1371/journal.pcbi.1004219
11. Demela P, Pirastu N, Soskic B. Cross-disorder genetic analysis of immune diseases reveals distinct gene associations that converge on common pathways. Nat Commun (2023) 14(1):2743. doi: 10.1038/s41467-023-38389-6
12. Shirai Y, Nakanishi Y, Suzuki A, Konaka H, Nishikawa R, Sonehara K, et al. Multi-trait and cross-population genome-wide association studies across autoimmune and allergic diseases identify shared and distinct genetic component. Ann Rheum Dis (2022) 81(9):1301–12. doi: 10.1136/annrheumdis-2022-222460
13. Kwak IY, Pan W. Gene- and pathway-based association tests for multiple traits with GWAS summary statistics. Bioinformatics (2017) 33(1):64–71. doi: 10.1093/bioinformatics/btw577
14. Wang Y, Yang Y, Jia X, Zhao C, Yang C, Fan J, et al. Identifying pleiotropic genes for major psychiatric disorders with GWAS summary statistics using multivariate adaptive association tests. J Psychiatr Res (2022) 155:471–82. doi: 10.1016/j.jpsychires.2022.09.038
15. Ghoussaini M, Mountjoy E, Carmona M, Peat G, Schmidt EM, Hercules A, et al. Open Targets Genetics: systematic identification of trait-associated genes using large-scale genetics and functional genomics. Nucleic Acids Res (2021) 49(D1):D1311–D20. doi: 10.1093/nar/gkaa840
16. Dubois PCA, Trynka G, Franke L, Hunt KA, Romanos J, Curtotti A, et al. Multiple common variants for celiac disease influencing immune gene expression. Nat Genet (2010) 42(4):295–302. doi: 10.1038/ng.543
17. Sawcer S, Hellenthal G, Pirinen M, Spencer CCA, Patsopoulos NA, Moutsianas L, et al. Genetic risk and a primary role for cell-mediated immune mechanisms in multiple sclerosis. Nature (2011) 476(7359):214–9. doi: 10.1038/nature10251
18. Cordell HJ, Han Y, Mells GF, Li Y, Hirschfield GM, Greene CS, et al. International genome-wide meta-analysis identifies new primary biliary cirrhosis risk loci and targetable pathogenic pathways. Nat Commun (2015) 6:8019. doi: 10.1038/ncomms9019
19. Anderson CA, Boucher G, Lees CW, Franke A, D'Amato M, Taylor KD, et al. Meta-analysis identifies 29 additional ulcerative colitis risk loci, increasing the number of confirmed associations to 47. Nat Genet (2011) 43(3):246–52. doi: 10.1038/ng.764
20. Bentham J, Morris DL, Graham DSC, Pinder CL, Tombleson P, Behrens TW, et al. Genetic association analyses implicate aberrant regulation of innate and adaptive immunity genes in the pathogenesis of systemic lupus erythematosus. Nat Genet (2015) 47(12):1457–64. doi: 10.1038/ng.3434
21. Censin JC, Nowak C, Cooper N, Bergsten P, Todd JA, Fall T. Childhood adiposity and risk of type 1 diabetes: A Mendelian randomization study. PloS Med (2017) 14(8):e1002362. doi: 10.1371/journal.pmed.1002362
22. Bulik-Sullivan BK, Loh PR, Finucane HK, Ripke S, Yang J, Schizophrenia Working Group of the Psychiatric Genomics C, et al. LD Score regression distinguishes confounding from polygenicity in genome-wide association studies. Nat Genet (2015) 47(3):291–5. doi: 10.1038/ng.3211
23. Frei O, Holland D, Smeland OB, Shadrin AA, Fan CC, Maeland S, et al. Bivariate causal mixture model quantifies polygenic overlap between complex traits beyond genetic correlation. Nat Commun (2019) 10(1):2417. doi: 10.1038/s41467-019-10310-0
24. Finucane HK, Bulik-Sullivan B, Gusev A, Trynka G, Reshef Y, Loh P-R, et al. Partitioning heritability by functional annotation using genome-wide association summary statistics. Nat Genet (2015) 47(11):1228–35. doi: 10.1038/ng.3404
25. Consortium GT, Laboratory DA, Coordinating Center -Analysis Working G, Statistical Methods groups-Analysis Working G, Enhancing Gg, Fund NIHC, et al. Genetic effects on gene expression across human tissues. Nature (2017) 550(7675):204–13. doi: 10.1038/nature24277
26. Buniello A, MacArthur JAL, Cerezo M, Harris LW, Hayhurst J, Malangone C, et al. The NHGRI-EBI GWAS Catalog of published genome-wide association studies, targeted arrays and summary statistics 2019. Nucleic Acids Res (2019) 47(D1):D1005–D12. doi: 10.1093/nar/gky1120
27. Watanabe K, Taskesen E, van Bochoven A, Posthuma D. Functional mapping and annotation of genetic associations with FUMA. Nat Commun (2017) 8(1):1826. doi: 10.1038/s41467-017-01261-5
28. Liberzon A, Birger C, Thorvaldsdóttir H, Ghandi M, Mesirov JP, Tamayo P. The Molecular Signatures Database (MSigDB) hallmark gene set collection. Cell Sys (2015) 1(6):417–25. doi: 10.1016/j.cels.2015.12.004
29. Szklarczyk D, Morris JH, Cook H, Kuhn M, Wyder S, Simonovic M, et al. The STRING database in 2017: quality-controlled protein-protein association networks, made broadly accessible. Nucleic Acids Res (2017) 45(D1):D362–D8. doi: 10.1093/nar/gkw937
30. Li YR, Zhao SD, Li J, Bradfield JP, Mohebnasab M, Steel L, et al. Genetic sharing and heritability of paediatric age of onset autoimmune diseases. Nat Commun (2015) 6:8442. doi: 10.1038/ncomms9442
31. Kuo C-F, Grainge MJ, Valdes AM, See L-C, Luo S-F, Yu K-H, et al. Familial aggregation of systemic lupus erythematosus and coaggregation of autoimmune diseases in affected families. JAMA Intern Med (2015) 175(9):1518–26. doi: 10.1001/jamainternmed.2015.3528
32. Somers EC, Thomas SL, Smeeth L, Hall AJ. Autoimmune diseases co-occurring within individuals and within families: a systematic review. Epidemiol (2006) 17(2):202–17. doi: 10.1097/01.ede.0000193605.93416.df
33. Weng X, Liu L, Barcellos LF, Allison JE, Herrinton LJ. Clustering of inflammatory bowel disease with immune mediated diseases among members of a northern california-managed care organization. Am J Gastroenterol (2007) 102(7):1429–35. doi: 10.1111/j.1572-0241.2007.01215.x
34. Li YR, Li J, Zhao SD, Bradfield JP, Mentch FD, Maggadottir SM, et al. Meta-analysis of shared genetic architecture across ten pediatric autoimmune diseases. Nat Med (2015) 21(9):1018–27. doi: 10.1038/nm.3933
35. Yang Y, Musco H, Simpson-Yap S, Zhu Z, Wang Y, Lin X, et al. Investigating the shared genetic architecture between multiple sclerosis and inflammatory bowel diseases. Nat Commun (2021) 12(1):5641. doi: 10.1038/s41467-021-25768-0
36. Finucane HK, Reshef YA, Anttila V, Slowikowski K, Gusev A, Byrnes A, et al. Heritability enrichment of specifically expressed genes identifies disease-relevant tissues and cell types. Nat Genet (2018) 50(4):621–9. doi: 10.1038/s41588-018-0081-4
37. Ding J, Frantzeskos A, Orozco G. Functional interrogation of autoimmune disease genetics using CRISPR/Cas9 technologies and massively parallel reporter assays. Semin Immunopathol (2022) 44(1):137–47. doi: 10.1007/s00281-021-00887-4
38. Hnisz D, Abraham BJ, Lee TI, Lau A, Saint-André V, Sigova AA, et al. Super-enhancers in the control of cell identity and disease. Cell (2013) 155(4):934–47. doi: 10.1016/j.cell.2013.09.053
39. Bourges C, Groff AF, Burren OS, Gerhardinger C, Mattioli K, Hutchinson A, et al. Resolving mechanisms of immune-mediated disease in primary CD4 T cells. EMBO Mol Med (2020) 12(5):e12112. doi: 10.1101/2020.01.16.908988
40. Chávez MD, Tse HM. Targeting mitochondrial-derived reactive oxygen species in T cell-mediated autoimmune diseases. Front In Immunol (2021) 12:703972. doi: 10.3389/fimmu.2021.703972
41. Ohkura N, Sakaguchi S. Transcriptional and epigenetic basis of Treg cell development and function: its genetic anomalies or variations in autoimmune diseases. Cell Res (2020) 30(6):465–74. doi: 10.1038/s41422-020-0324-7
42. Stanford SM, Bottini N. PTPN22: the archetypal non-HLA autoimmunity gene. Nat Rev Rheumatol (2014) 10(10):602–11. doi: 10.1038/nrrheum.2014.109
43. Webb GJ, Hirschfield GM, Lane PJL. OX40, OX40L and autoimmunity: a comprehensive review. Clin Rev Allergy Immunol (2016) 50(3):312–32. doi: 10.1007/s12016-015-8498-3
44. Yang Y, Li X, Li B, Mu L, Wang J, Cheng Y, et al. Associations between TNFSF4 gene polymorphisms (rs2205960 G > A, rs704840 T > G and rs844648 G > A) and susceptibility to autoimmune diseases in Asians: a meta-analysis. Immunol Invest (2021) 50(2-3):184–200. doi: 10.1080/08820139.2020.1718693
45. Ullah MA, Vicente CT, Collinson N, Curren B, Sikder MAA, Sebina I, et al. PAG1 limits allergen-induced type 2 inflammation in the murine lung. Allergy (2020) 75(2):336–45. doi: 10.1111/all.13991
46. Vicente CT, Edwards SL, Hillman KM, Kaufmann S, Mitchell H, Bain L, et al. Long-range modulation of PAG1 expression by 8q21 allergy risk variants. Am J Hum Genet (2015) 97(2):329–36. doi: 10.1016/j.ajhg.2015.06.010
Keywords: genetic architecture, autoimmune diseases, multiple adaptive association tests, pleiotropic, genome-wide association studies
Citation: Wang Y, Yang Y, Jia X, Zhao C, Yang C, Fan J, Wang N and Shi X (2024) Identification of the shared genetic architecture underlying seven autoimmune diseases with GWAS summary statistics. Front. Immunol. 14:1303675. doi: 10.3389/fimmu.2023.1303675
Received: 28 September 2023; Accepted: 11 December 2023;
Published: 08 January 2024.
Edited by:
Anette S. B. Wolff, Haukeland University Hospital, NorwayReviewed by:
Rebecca Darlay, Newcastle University, United KingdomIris Karina Madera-Salcedo, Instituto Nacional de Ciencias Médicas y Nutrición Salvador Zubirán (INCMNSZ), Mexico
Copyright © 2024 Wang, Yang, Jia, Zhao, Yang, Fan, Wang and Shi. This is an open-access article distributed under the terms of the Creative Commons Attribution License (CC BY). The use, distribution or reproduction in other forums is permitted, provided the original author(s) and the copyright owner(s) are credited and that the original publication in this journal is cited, in accordance with accepted academic practice. No use, distribution or reproduction is permitted which does not comply with these terms.
*Correspondence: Xuezhong Shi, eHpzaGlAenp1LmVkdS5jbg==