
95% of researchers rate our articles as excellent or good
Learn more about the work of our research integrity team to safeguard the quality of each article we publish.
Find out more
ORIGINAL RESEARCH article
Front. Immunol. , 21 December 2023
Sec. Molecular Innate Immunity
Volume 14 - 2023 | https://doi.org/10.3389/fimmu.2023.1289223
Background: The role of complement component 1q (C1Q) related genes on human atherosclerotic plaques (HAP) is less known. Our aim is to establish C1Q associated hub genes using single-cell RNA sequencing (scRNA-seq) and bulk RNA analysis to diagnose and predict HAP patients more effectively and investigate the association between C1Q and HAP (ischemic stroke) using bidirectional Mendelian randomization (MR) analysis.
Methods: HAP scRNA-seq and bulk-RNA data were download from the Gene Expression Omnibus (GEO) database. The C1Q-related hub genes was screened using the GBM, LASSO and XGBoost algorithms. We built machine learning models to diagnose and distinguish between types of atherosclerosis using generalized linear models and receiver operating characteristics (ROC) analyses. Further, we scored the HALLMARK_COMPLEMENT signaling pathway using ssGSEA and confirmed hub gene expression through qRT-PCR in RAW264.7 macrophages and apoE-/- mice. Furthermore, the risk association between C1Q and HAP was assessed through bidirectional MR analysis, with C1Q as exposure and ischemic stroke (IS, large artery atherosclerosis) as outcomes. Inverse variance weighting (IVW) was used as the main method.
Results: We utilized scRNA-seq dataset (GSE159677) to identify 24 cell clusters and 12 cell types, and revealed seven C1Q associated DEGs in both the scRNA-seq and GEO datasets. We then used GBM, LASSO and XGBoost to select C1QA and C1QC from the seven DEGs. Our findings indicated that both training and validation cohorts had satisfactory diagnostic accuracy for identifying patients with HPAs. Additionally, we confirmed SPI1 as a potential TF responsible for regulating the two hub genes in HAP. Our analysis further revealed that the HALLMARK_COMPLEMENT signaling pathway was correlated and activated with C1QA and C1QC. We confirmed high expression levels of C1QA, C1QC and SPI1 in ox-LDL-treated RAW264.7 macrophages and apoE-/- mice using qPCR. The results of MR indicated that there was a positive association between the genetic risk of C1Q and IS, as evidenced by an odds ratio (OR) of 1.118 (95%CI: 1.013–1.234, P = 0.027).
Conclusion: The authors have effectively developed and validated a novel diagnostic signature comprising two genes for HAP, while MR analysis has provided evidence supporting a favorable association of C1Q on IS.
Atherosclerosis is a disease in which several cell types, such as SMCs, ECs, and immune cells, are activated pathophysiologically (1–3). Atherosclerosis progresses gradually over time, and as the lumen narrows, clinical symptoms such as angina and dizziness emerge. Eventually, this narrowing leads to an ischemic stroke or myocardial infarction due to plaque rupture or erosion (4, 5). Therefore, developing an accurate method for diagnosing HAP is crucial for early intervention.
Currently, the diagnosis of HAP heavily relies on clinical manifestations, functional outcomes, and invasive intravascular imaging techniques such as computed tomography angiography and magnetic resonance angiography that thoroughly assess vessel stenosis and wall thickness. Non-invasive medical imaging can accurately identify vulnerable plaques and stratify cardiovascular risk with the advancement of molecular biology and non-invasive molecular tools developed for the diagnosis and risk stratification of atherosclerotic plaques (6–14).
Atherosclerosis is a persistent inflammatory ailment that is distinguished by the buildup of macrophages that are laden with lipids in the vascular wall (15, 16). Numerous studies have shown that immune cell infiltration within the vessel wall is strongly associated with atherosclerosis initiation and progression (11, 17, 18). The immune composition of atherosclerotic plaque was inferred from multiple sources such as bulk RNA-seq data, CyTOF analysis of a single plaque, and scRNA-seq analysis of atherosclerotic tissue (17, 19–22). Single-cell RNA sequencing and time-of-flight cytometry have been utilized to analyze immune cell composition in both murine and human atherosclerotic plaques (17, 20). Bioinformatics analysis of immune cell infiltration using bulk RNA-seq data from atherosclerotic tissue has been previously explained (7–13). However, very few studies have been conducted utilizing scRNA-seq to predict HPA diagnosis (14, 23).
Recently, C1Q has been identified as a distinct subset of tissue resident macrophages, tumor-associated macrophages (TAMs) and tumor immune microenvironments (TIMs), and is commonly acknowledged as a facilitator of cancer progression (24–27). In the present study, we also identified a significant involvement of the C1Q cell cluster in the pathogenesis of atherosclerosis. Moreover, to gain deeper insights into the potential risk factor of C1Q in the development of HAP, we employed a statistical technique known as mendelian randomization (MR). MR utilizes single nucleotide polymorphisms (SNPs) to simulate randomized controlled trials, aiming to ascertain and explore the causal association between exposure and outcome variables in epidemiological research. By effectively eliminating the confounding effects of extraneous factors and employing genetic variations as instrumental variables (IVs), MR enables the analysis of disease relationships (28–32).
Therefore, our goal is to develop gene signatures utilizing the molecular characteristics of C1Q associated genes for the effective diagnosis and prediction of patients with human atherosclerotic plaques (HAP) and investigating the association between C1Q and ischemic stroke (large artery atherosclerosis) with MR. Initially, we analyzed scRNA-seq and bulk RNA-seq data of human atherosclerotic plaque (HAP) to identify immunomarkers for the diagnosis and prediction of HAP. Subsequently, we validated the diagnostic value of hub markers using GEO datasets and analyzed the relationship between the signatures and the landscape of immune cell infiltration. Additionally, we screened the potential transcription factors (TFs) that may regulate the hub genes in GEO datasets and examined both the hub genes and TFs in apoE-/- mice. Finally, we investigated the association between C1Q and IS (large artery atherosclerosis) using bidirectional MR analysis.
Single-cell transcriptome profiles of human carotid atherosclerotic plaques (HAP) and adjacent normal tissue samples were obtained from the Gene Expression Omnibus (GEO) database (accession code GSE159677). To supplement the analysis, we accessed bulk RNA-sequencing data from four other GEO datasets for atherosclerotic patients, namely GSE28829 (33), GSE43292 (34), GSE41571 (35), and GSE100927 (36), each containing over 10 patient cases (Table S1).
The GSE28829 dataset comprises 13 early and 16 advanced specimens of carotid atherosclerotic plaque that were detected using the Affymetrix Human Genome U133 Plus 2.0 Array. The GSE43292 dataset contains 32 early-stage and 32 advanced-stage specimens of carotid atherosclerotic plaque that were detected using the Affymetrix Human Gene 1.0 ST Array. The GSE41571 dataset has 5 ruptured and 6 stable specimens of atherosclerotic plaque that were detected using the Affymetrix Human Genome U133 Plus 2.0 Array. The GSE100927 dataset includes 35 healthy arteries, consisting of 12 carotid, 12 femoral, and 11 infra-popliteal territories arteries. Additionally, the dataset has 69 atherosclerotic arteries, which comprise 29 carotid, 26 femoral, and 14 infra-popliteal territories atherosclerotic arteries. All these were detected using the Agilent-039494 SurePrint G3 Human GE v2 8x60K Microarray. We divided the GSE100927 dataset, which initially contained three sets, into three subparts. These are GSE100927_Carotid that has 29 carotid atherosclerotic arteries and 12 carotid normal arteries; GSE100927_Femoral containing 26 femoral atherosclerotic arteries and 12 femoral normal arteries, and GSE100927_Infra that has 14 infra-popliteal territories atherosclerotic arteries and 11 infra-popliteal territories normal arteries.
The present research utilized a publicly available dataset with pre-existing ethics approval. Every participant gave their informed consent. The present study was conducted as per the principles of the Declaration of Helsinki.
To analyze the ScRNA-seq data, we relied on the "Seurat" (version 4.1.2) and "SingleR" (version 1.6.1) packages (37). Initially, we eliminated low-quality cells by applying specific criteria, including minimum expression cells greater than 3, gene numbers less than 200, and mitochondrial genes exceeding 15%. The remaining cells were subjected to further bioinformatic analysis. To perform a principal component analysis (PCA), we selected the top 2,000 genes with the highest variability in expression. Subsequently, we utilized the T-distributed stochastic neighbor embedding (t-SNE) technique for dimension reduction based on the top 15 principal components. Ultimately, we identified significant marker genes with an adjusted p-value less than 0.05 and a |log2 (fold change)| greater than 1.
We performed cell clustering and sub-clustering analyses using the FindClusters function of the Seurat package, utilizing appropriate resolutions. We filtered cells with ribosome gene ratios higher than 15% for the re-clustering of each type of cell cluster. We utilized the Uniform Manifold Approximation and Projection (UMAP) technique to display the identified cell clusters and sub-clusters. We annotated the cell clusters with highly-expressed genes, marker genes from differential expression gene (DEG) analysis, and reported cellular markers. We applied the DEG analysis to all of the cell clusters using the FindAllMarkers function embedded in Seurat (version 4.1.2) to identify useful information marking the plaque state. We selected the top five genes based on their log2 fold-change value to serve as the initial feature input for machine learning.
Conducted a Gene Ontology (GO) and Kyoto Encyclopedia of Genes and Genomes (KEGG) analysis of the differential marker genes between subclusters using ClusterProfiler 4.0 in R (38). We used GSVA package (39) to analyze the differential marker genes among subclusters. All gene sets were obtained from the Molecular Signatures Database MSigDB (https://www.gseamsigdb.org/gsea/downloads.jsp) (40). We used the Scillus package to perform Gene Set Enrichment Analysis (GSEA) on the differential marker gene expression among subclusters (https://github.com/xmc811/Scillus).
In this study, the immune microenvironment (IME) was assessed using various algorithms, namely EPIC, XCell, MCPCOUNTER, QUANTISEQ, IPS, ESTIMATE, and TIMER, which were obtained from the IMvigor210CoreBiologies R package (41). Additionally, the ssGSEA algorithm from the "GSVA" package was added to calculate infiltration scores for 29 immune cells (42). Furthermore, immunomodulators (43), including Antigen presentation, Cell adhesion, Co-inhibitor Co-stimulator, Ligand, Receptor, and Other, were estimated based on high and low C1Q expression level. Lastly, the enrichment of 16 signal pathways (44) in the three datasets was analyzed by the ssGSEA algorithm from the "GSVA" package using C1Q.
We employed Gradient Boosting Machine (GBM), logistic least absolute shrinkage and selection operator (LASSO) regression, and extreme gradient boosting (XGBoost) algorithms to identify C1Q-related hub genes (45). The diagnostic performance of our model was evaluated using receiver operating characteristic (ROC) curves and the area under the curve (AUC), employing a generalized linear model.
RAW264.7 cells were cultured using DMEM supplemented with 10% FBS and 1% penicillin/streptomycin in an automatic incubator set to 37°C and 5% CO2. The cells were passaged or plated at 80-90% confluency. Then, the cells were seeded into 6-well plates at a density of 5000 cells per well. Following cell adhesion, 50ug/ml ox-LDL were added and incubated for 1, 3, 5 days, respectively. To extract RNA for qRT-PCR, total RNA was isolated from RAW264.7 macrophages using Trizol reagent and reverse transcribed with the Color Reverse Transcription Kit (EZB, USA).
Six-week-old male apoE-/- mice (Gempharmacy Co., Ltd, China) and six-week-old male C57/B6J wild-type mice (Gempharmacy Co., Ltd, China, no apoE-/- background) were housed individually in the experimental animal center's specific pathogen-free barrier system (SPF) of Shanghai Sixth People's Hospital Affiliated to Shanghai Jiao Tong University School of Medicine. The six apoE-/- knockout mice were fed a high-fat diet (68.3% chow diet, 31.7% lard) for 18 weeks, while the remaining six C57/B6J wild-type mice were used as the control group and were fed a chow diet for 18 weeks. At the end of the 18th week, the mice were euthanized, and blood samples were obtained from the abdominal aorta to measure lipid metabolism indexes. Both the thoracic and abdominal arteries of each mouse were dissected and harvested for real-time quantitative polymerase chain reaction (qPCR) analysis. Additionally, the aortic arch samples were collected, fixed in 4% paraformaldehyde (PFA) for at least 24 hours, and processed for immunohistochemistry analysis.
Total cellular RNA was extracted following the instructions of the manufacturer and using a TRIzol reagent (Invitrogen, USA). Subsequently, cDNA was generated through reverse transcription of RNA, employing PrimeScript RT Master Mix (Takara). For the thoracic and abdominal artery tissues, the primer sequences used were (5’-3'): GAPDH (forward: 5'-CCTCGTCCCGTAGACAAAATG-3', reverse: 5’- TGAGGTCAATGAAGGGGTCGT-3), C1QA (forward: 5'- TCACCAACCAGGAG- AGTCCA -3', reverse: 5'- CACCTGAAAGAGCCCCTTGT- 3'), C1QC (forward: 5'- GCCGATACAAA- CAGAAGCACCA-3', reverse: 5'- AACTTCCCTGTGCTTGG- GTTGT-3'), SPI1 (forward: 5'- TTTGAGAACTTCCCTGAGAACCAC-3', reverse: 5’- GCATG TAGGAAACCTGGTGACT- G-3'), IL1B (forward: 5'- GCATCCAG- CTTCAAATCTCGC-3', reverse: 5'- TGTTCATCTCG- GAGCCTGTAGTG- 3'), ABCG1 (forward: 5'- TTGTGCTGTTCGCTGCTCTG-3', reverse: 5'- GTCACGG- GACCCACAAATGT-3') synthesized by shanghai Generay Biotech. The primer sequence was obtained from Primer Bank (https://pga.mgh.harvard.edu/primerbank/index.html) and synthesized by Shanghai Sangon Biotechnology (Shanghai, China). The GAPDH gene was used as an internal reference gene. Calculation of the expression of the target gene was performed based on the 2-ΔΔCt method.
We conducted statistical analysis using R software (version 4.2.1). Mean and standard deviation (SD) were used to present the data. We used Wilcoxon or Student's t-test to compare the difference between two groups. For comparing three or more groups, we employed Student t-test and analyzed variance (ANOVA). To determine the correlation between variables, we used either Pearson's or Spearman's correlation tests. The statistical p-values we used were two-sided, and we considered p-values where p < 0.05 as statistically significant.
In order to assess the correlation between C1Q and ischemic stroke, specifically in relation to large artery atherosclerosis, we conducted datasets of relevant diseases from the IEU openGWAS (https://gwas.mrcieu.ac.uk). Given that the data originated from publicly accessible databases, no supplementary ethical clearance was deemed necessary. The study utilized GWAS data encompassing 4373 cases of ischemic stroke (large artery atherosclerosis) and 406,111 control cases, and C1Q protein were also obtained from GWAS data for the study (Table S8). The study utilized samples exclusively derived from individuals of European descent. A bidirectional two-sample Mendelian randomization (MR) investigation was conducted to examine the potential relationship between C1Q and IS. MR was employed to assess the potential association between C1Q and IS using carefully selected instrumental variables (IVs). Additionally, sensitivity analysis was performed to evaluate the robustness of the findings. Lastly, reverse causality verification was undertaken to obtain a comprehensive analysis report. Figure S6 provides a visual representation of the Mendelian randomization study investigating the relationship between C1Q and IS.
The data analysis for this study was conducted utilizing the R software (version 4.2.2) with the TwoSampleMR package (0.5.7), following the guidelines provided at https://mrcieu.github.io/TwoSampleMR/. Mendelian randomization (MR) employs genetic variation as an instrumental variable (IV) to estimate the causal effect of risk factors on complex diseases. We conducted a genome-wide association study (GWAS) to identify single nucleotide polymorphisms (SNPs) that were both independent and nominally associated with a significance threshold of P < 1×10⁻⁵. We used a clumping algorithm with a cutoff of r2 = 0.01 and kb = 10000 to select SNPs that were in linkage disequilibrium with each other (28, 29). Previous studies have described the methods used for other Mendelian randomization (MR) analyses (30–32). To assess heterogeneity among instrumental variables (IVs), we employed Cochran's Q test, with a P-value greater than 0.05 indicating no significant heterogeneity. We considered an IV to exhibit horizontal pleiotropy if the MR-Egger regression intercept was not equal to 0 and had a statistically significant P-value less than 0.05. In the reverse MR analysis, a P-value greater than 0.05 indicated no evidence of reverse causality between the exposure factors and the outcome variables.
The workflow of the study design is depicted in Figure S1. ScRNA-seq data were obtained from plaque specimens and adjacent tissues of the patient who underwent carotid endarterectomy (CEA). Three patients provided plaque specimens from near full-thickness sections of arteries and plaques from the atherosclerotic core (AC: patient 1-3), as well as adjacent tissue from full-thickness proximally adjacent (PA: patient 1-3) arterial sections. The proximally adjacent (PA) tissues were deemed to be the normal tissue. A total of 50,856 cell samples from six patients with HAP were retrieved from the GEO database containing 38,611 AC cells and 12,245 PA cells (Table S2). The number of cells in AC was three times greater than that in PA. Following initial quality control, 44,843 cells including 34,378 cells and 10,465 normal cells from all six samples were used for further analysis of their single-cell transcriptomic data (Table S3). The number of cells from the AC region was significantly higher than those analyzed by Li et al. (46), as we analyzed the AC and PA data together.
Following batch effect correction and normalization through the Harmony R package, the evaluation yielded twenty-four major cell clusters that exhibited distinct gene expression patterns at a resolution of 0.8 (Figures 1A–C). The genes in twenty-four cell clusters were shown in Table S4. The clusters were then combined to form a total of 12 cell clusters, which comprised of 8 immune cell subtypes (CD8+ T, CD4+ T, macrophage, monocyte, B cells, mast cells, plasma cells, and dendritic cells), 3 non-immune cell subtypes (SMC, EC, and Firboblast clusters), and a miscellaneous cell cluster (Figure 1D). The FindAllMarkers embedded in Seurat were then applied to all the cell clusters to search for DEGs to compare all of the cell clusters (Table S5; Figure 1D). Finally, we performed FindMarkers to estimate DEGs between AC and PA, and 781 DEGs were obtained (Table S6).
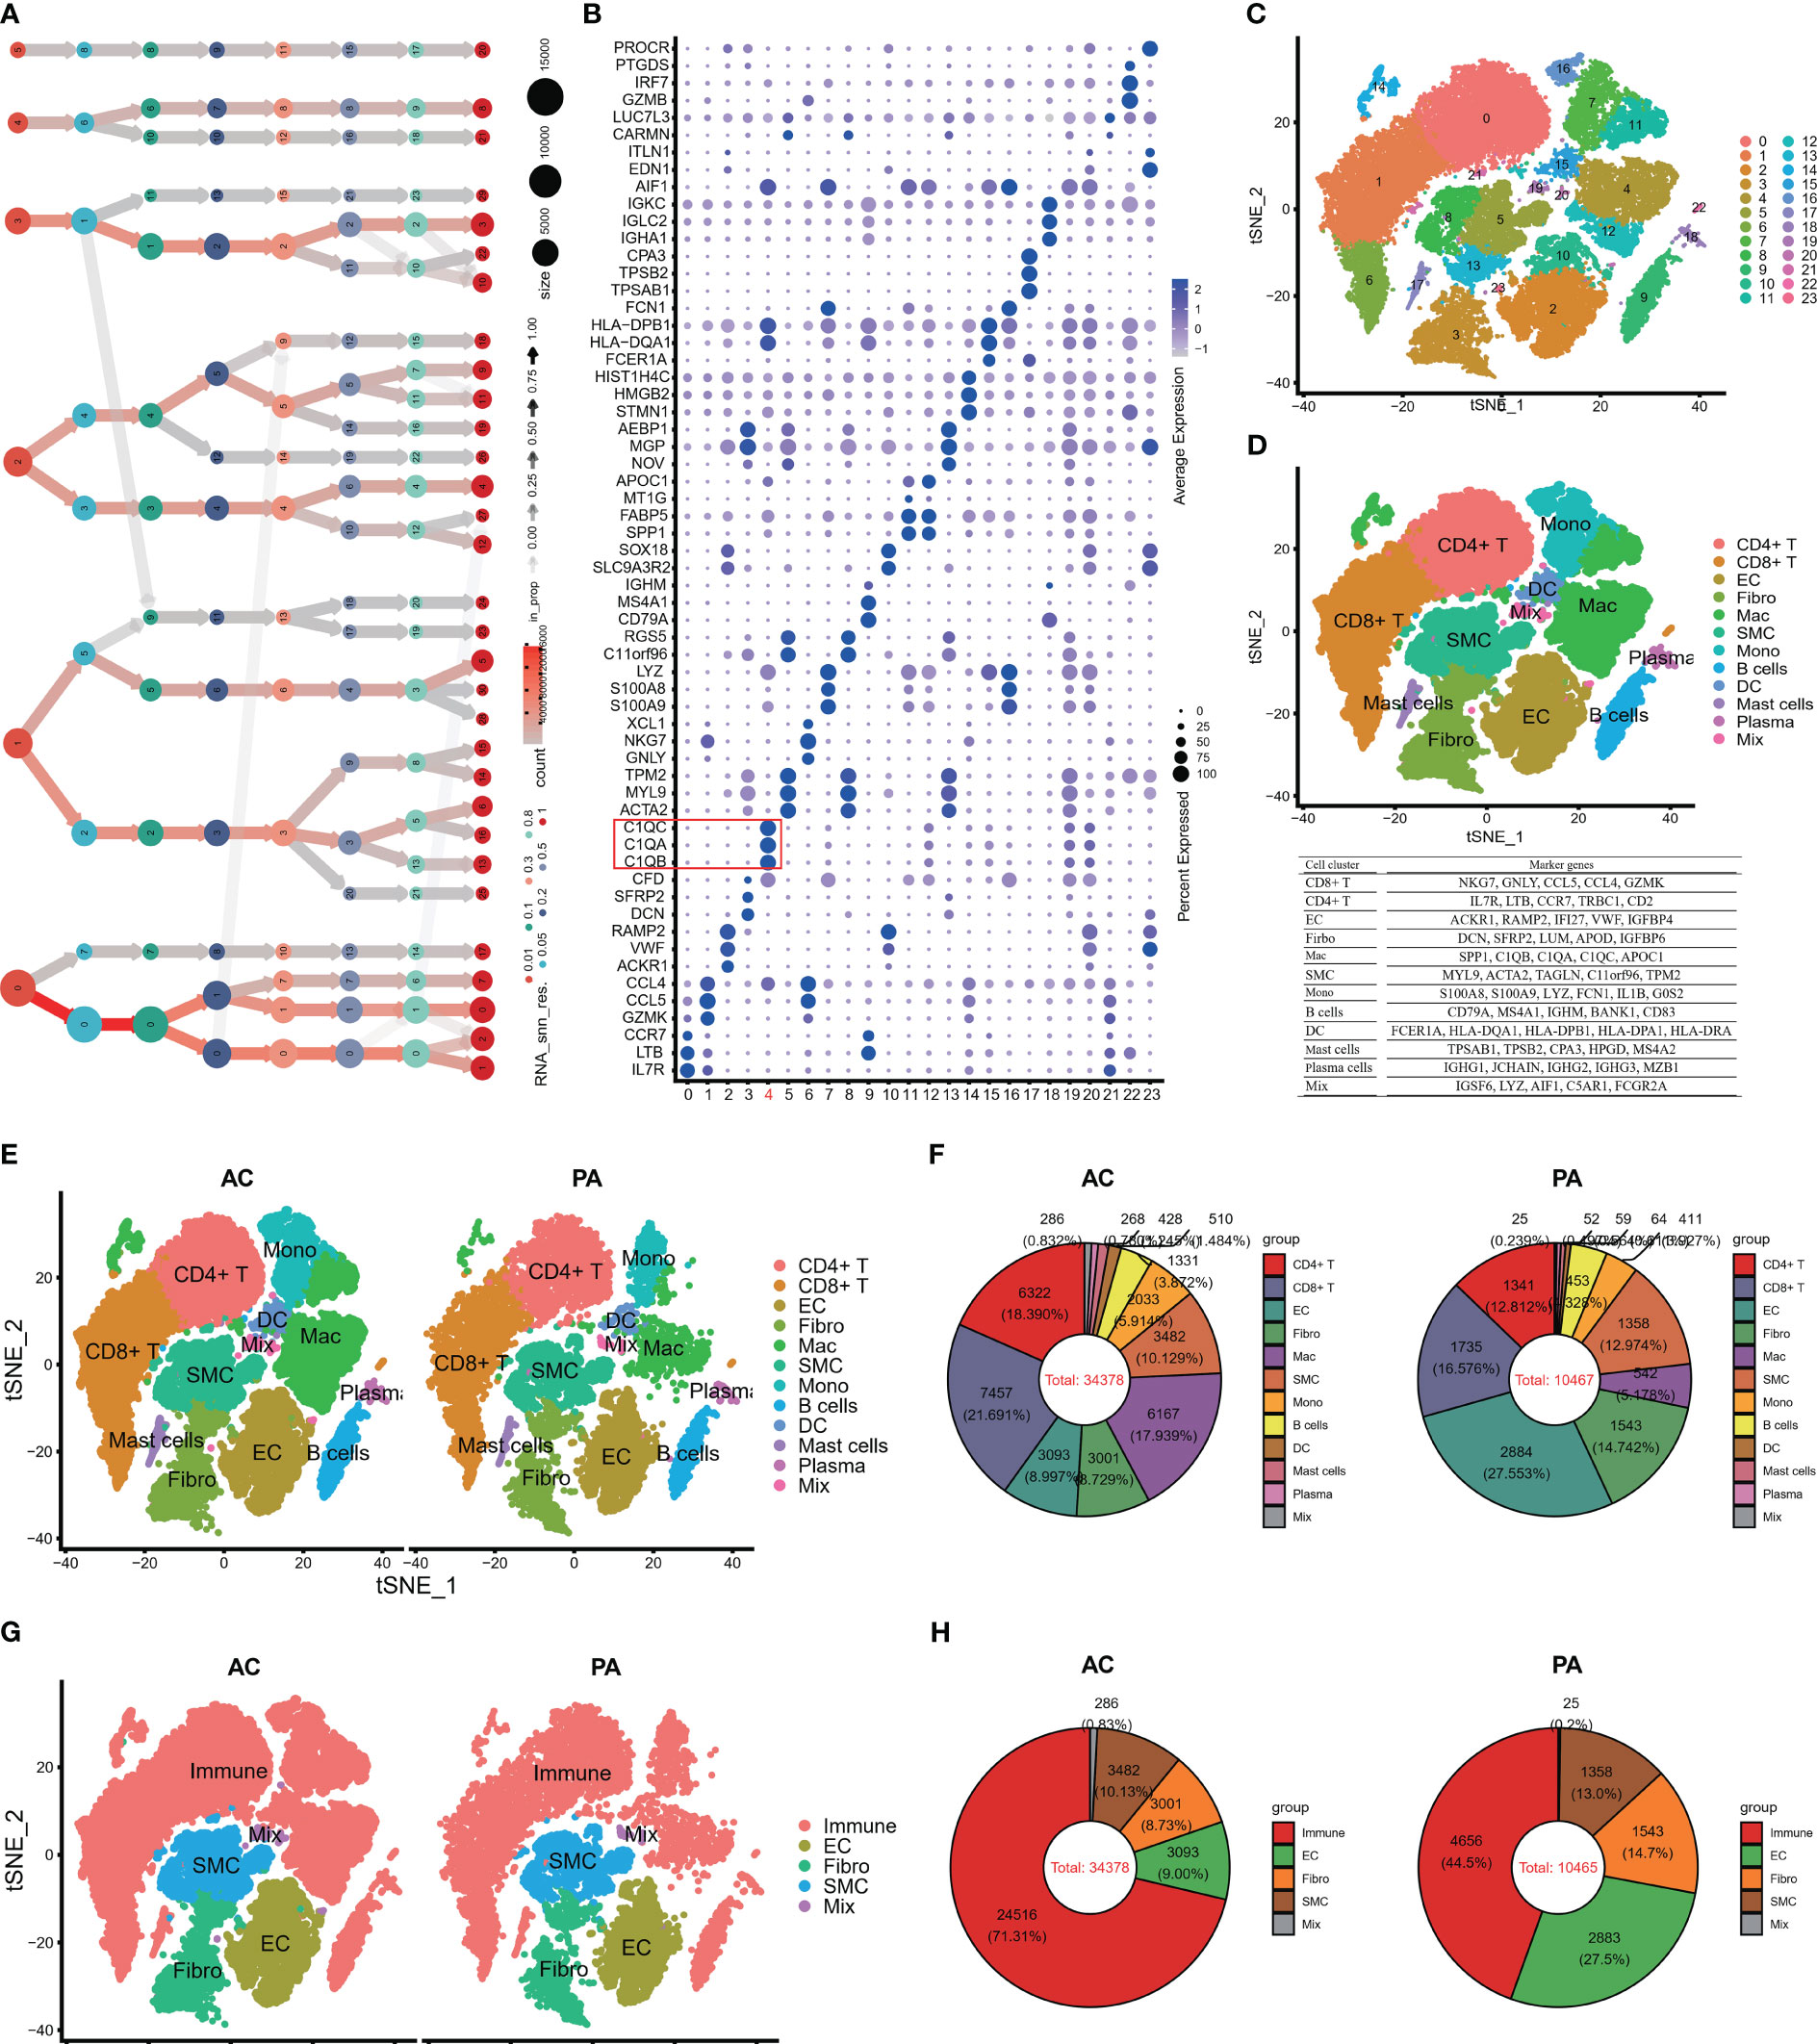
Figure 1 Single-cell RNA-seq of human AP tissues. (A) The clustering tree of total scRNA-seq mate data was analyzed at different resolutions. (B) The top three markers of each cluster were plotted using the “FindAllMarkers” function from the Seurat package (4.1.2). The red box indicates C1Q cell cluster. (C) T-distributed stochastic neighbor embedding (tSNE) revealed 24 clusters under a resolution of 0.8. (D) The tSNE plot was colored to display 12 distinct cell types. Note: The marker gene is located below the tSNE plot. (E) An overview of the 12 cell types between AC and PA groups was generated and colored by cell types. (F) Using a pie plot, the proportion of cell types in each group was compared. (G, H) The tSNE and pie plots were used to depict cell types between AC and AP groups after merging the immune cells with the Seurat package (4.1.2). AC, Atherosclerotic core; PA, Proximally adjacent; EC, Endothelial cells; Mac, Macrophages; SMC, Smooth muscle cells; Mono, Monocytes; DC, Dendritic cells.
Several studies have demonstrated the involvement of immune cell infiltrations and pathways in atherosclerosis, highlighting their crucial role in atherosclerotic plaque progression (9, 11, 17, 47, 48). Figures 1E, F illustrates that in the PA group, endothelial cells (EC) and clusters of CD8+ T cells and fibroblasts constituted the top three cell clusters, whereas in the AC group, CD8+ T, CD4+ T, and macrophages were predominant. When considering all immune cell types together, namely CT4+ T, CT8+ T, macrophages, monocytes, dendritic cells, B cells, mast cells, and plasma cells, they accounted for more than 70% of the total cells in the AC groups (Figures 1G, H), whereas immune cells made up less than 45% of the total cells in the PA groups (Figures 1G, H). These findings indicate that immune cell involvement in atherosclerotic plaque progression increased significantly.
Two steps were applied to select C1Q-associated hub genes. First, the top 10 genes in C1Q subcluster were extracted as initial features (Figure 2A). And then, we detected the 10 genes in 781 DEGs between AC and PA groups in scRNA-seq (Figure 2B), and seven DEGs (C1QA, C1QB, C1QC, CCL3, HLA-DPA1, FOLR2 and HLA-DQA1) was obtained for further analysis. Second, the dataset GSE43292 was utilized to select characteristic genes in atheroma plaque (stage IV and over) and distant macroscopically intact tissue (stages I and II) using machine learning models (LASSO (Figure 2C) Gradient Boosting Machine (Figure 2D), and XGBoost (Figure 2E)). The three algorithm was used to reduce the number of biomarkers, resulting in the selection of 2 biomarkers (C1QA and C1QC), as shown in Figure 2F. Hence, the two biomarkers were identified as the definitive diagnostic prediction biomarkers.

Figure 2 C1Q hub genes selection from scRNA-seq and GEO dataset. (A) The top ten genes extract from C1Q cell cluster. (B) The 10 genes are detected in 781 DEGs between AC and PA groups in scRNA-seq, and seven genes (C1QA, C1QB, C1QC, CCL3, HLA-DPA1, FOLR2 and HLA-DQA1) was obtained for further analysis. (C) C1Q hub genes selection by LASSO algorithm. (D) C1Q hub genes selection by GBM algorithm. (E) C1Q hub genes selection by XGBoost algorithm. (F) Two genes (C1QA and C1QC) are identified by the three algorithms.
After identifying the biomarker genes, we prioritized investigating their expression in HAP cells. As displayed in Figures 3A–C, C1QA and C1QC were mainly expressed in macrophage cells, and upregulated in AC group (Figure 3D), while SPI1 was expressed in macrophages, monocytes, dendritic cells (Figures 3A–C), and also upregulated in AC group (Figure 3D). Subsequently, we conducted GSEA for all the identified cells. The GSEA demonstrated significant enrichment of crucial signaling pathways in HAP tissues (Figure 3E). These signaling pathways include immune signaling (INTERFERON_GAMMA_ RESPONSE, IL6_JAK_STAT3_SIGNALING, IL2_STAT5_SIGNALING, COMPLEMENT), allograft rejection, complement, inflammatory response, metabolism, apoptosis, and glycolysis. We conducted KEGG pathway enrichment analysis for macrophages derived from all differentially expressed genes between AC and PA. KEGG pathway analysis revealed the enrichment of various immune pathways involving Th17 cell differentiation, as well as the differentiation of Th1 and Th2 cells, toll-like receptor signaling pathway, and complement and coagulation cascades, among others (Figure 3F). These results suggest that multiple immune pathways and signals contribute to the pathophysiological progression of atherosclerotic plaque.
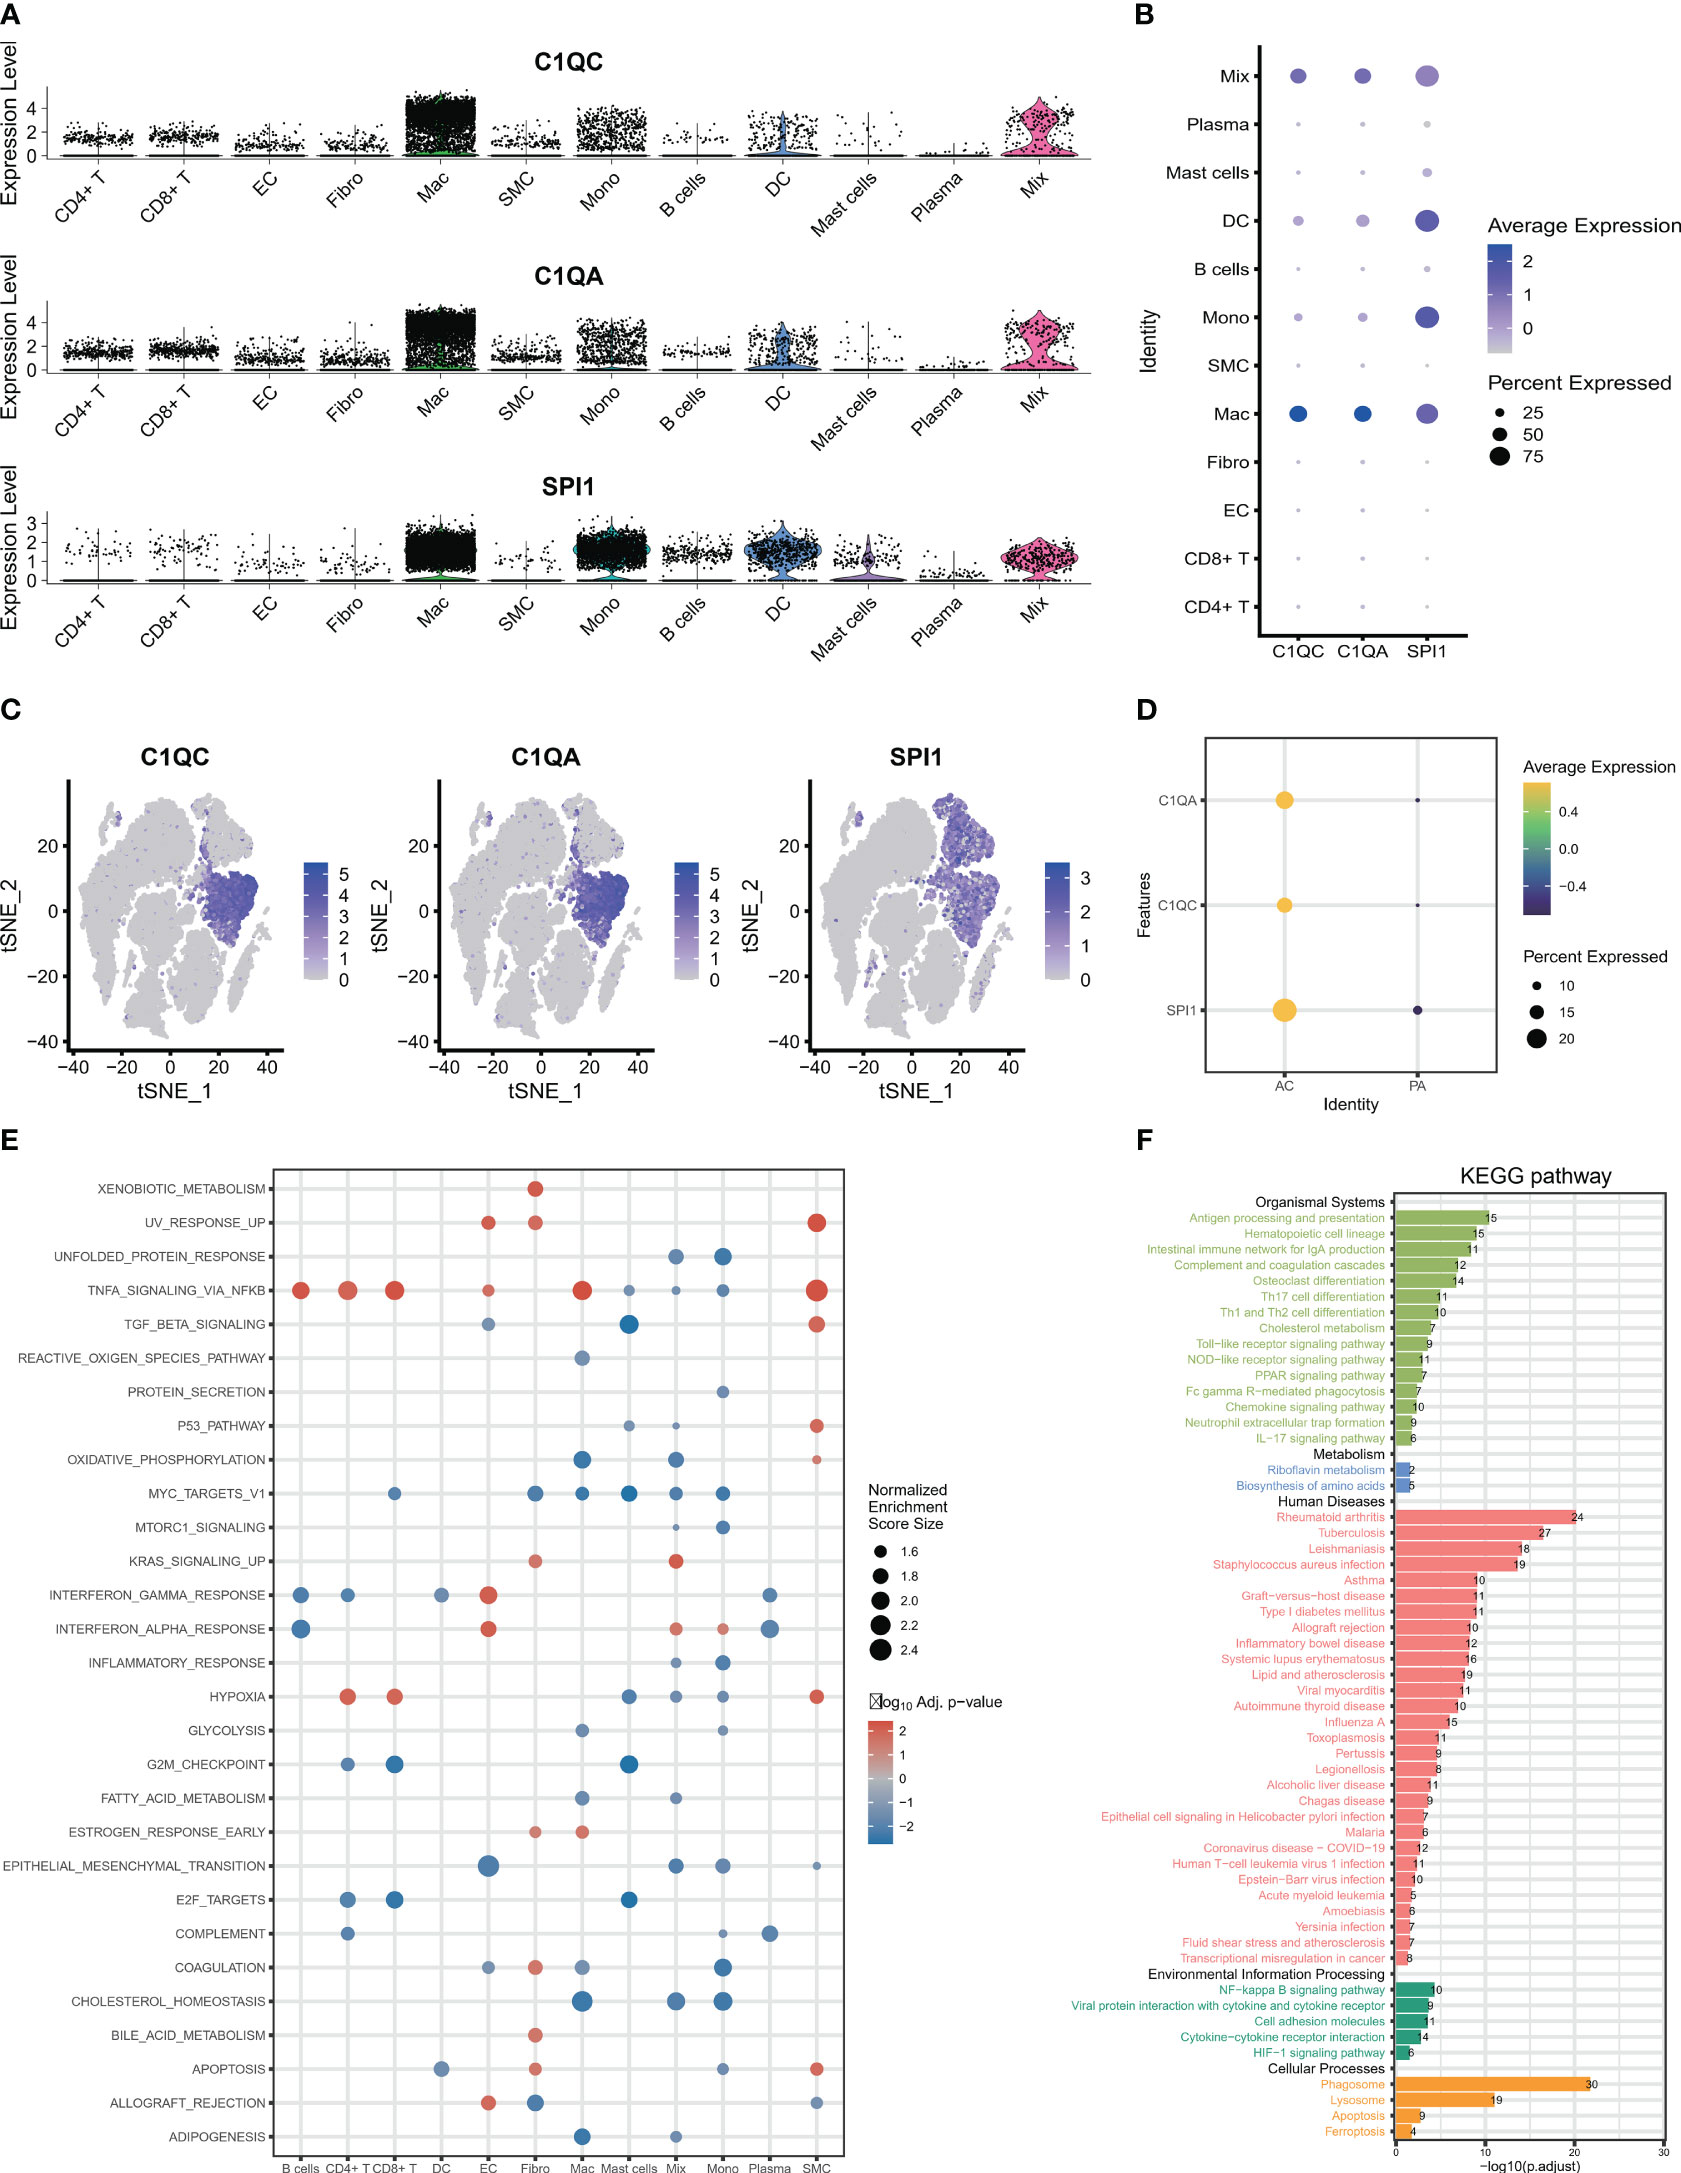
Figure 3 The expression and signaling pathways involved in characteristic genes in scRNA-seq. (A–C) The plots display the expression of C1QA, C1QC and SPI1 in cell clusters using scRNA-seq. (D) The three characteristic genes were upregulated in AC group. (E) The GSEA showed that the signaling pathways in all 12 cells clusters. (F) The KEGG plot shows the KEGG pathway in macrophage clusters.
After selection of the immune DEGs, we trained and validated our model using GEO data. GSE43292 was used as training datasets, respectively, while GSE41571 and GSE28829 was used as an external validation dataset to develop and validate the signatures for diagnosing and predicting atherosclerotic plaque progression between HAP tissues and adjacent tissues. Firstly, a model was built with two biomarkers using a generalized linear model (regression). The model score was -24.304 + (1.169 * C1QA + 1.339 * C1QC) (Table S7). Fitting the two markers into the model revealed high consistency between predicted results and surgical diagnosis results in the training dataset (Figure 4A). The AUC of the ROC curve was 0.842 while the specificity and sensitivity were 71.9% and 81.2%, respectively. This indicates good diagnostic efficiency in predicting atherosclerosis progression (Figure 4B). PCoA visualization was used with signatures and revealed a significant difference between HAP and adjacent tissues (Figure 4C).
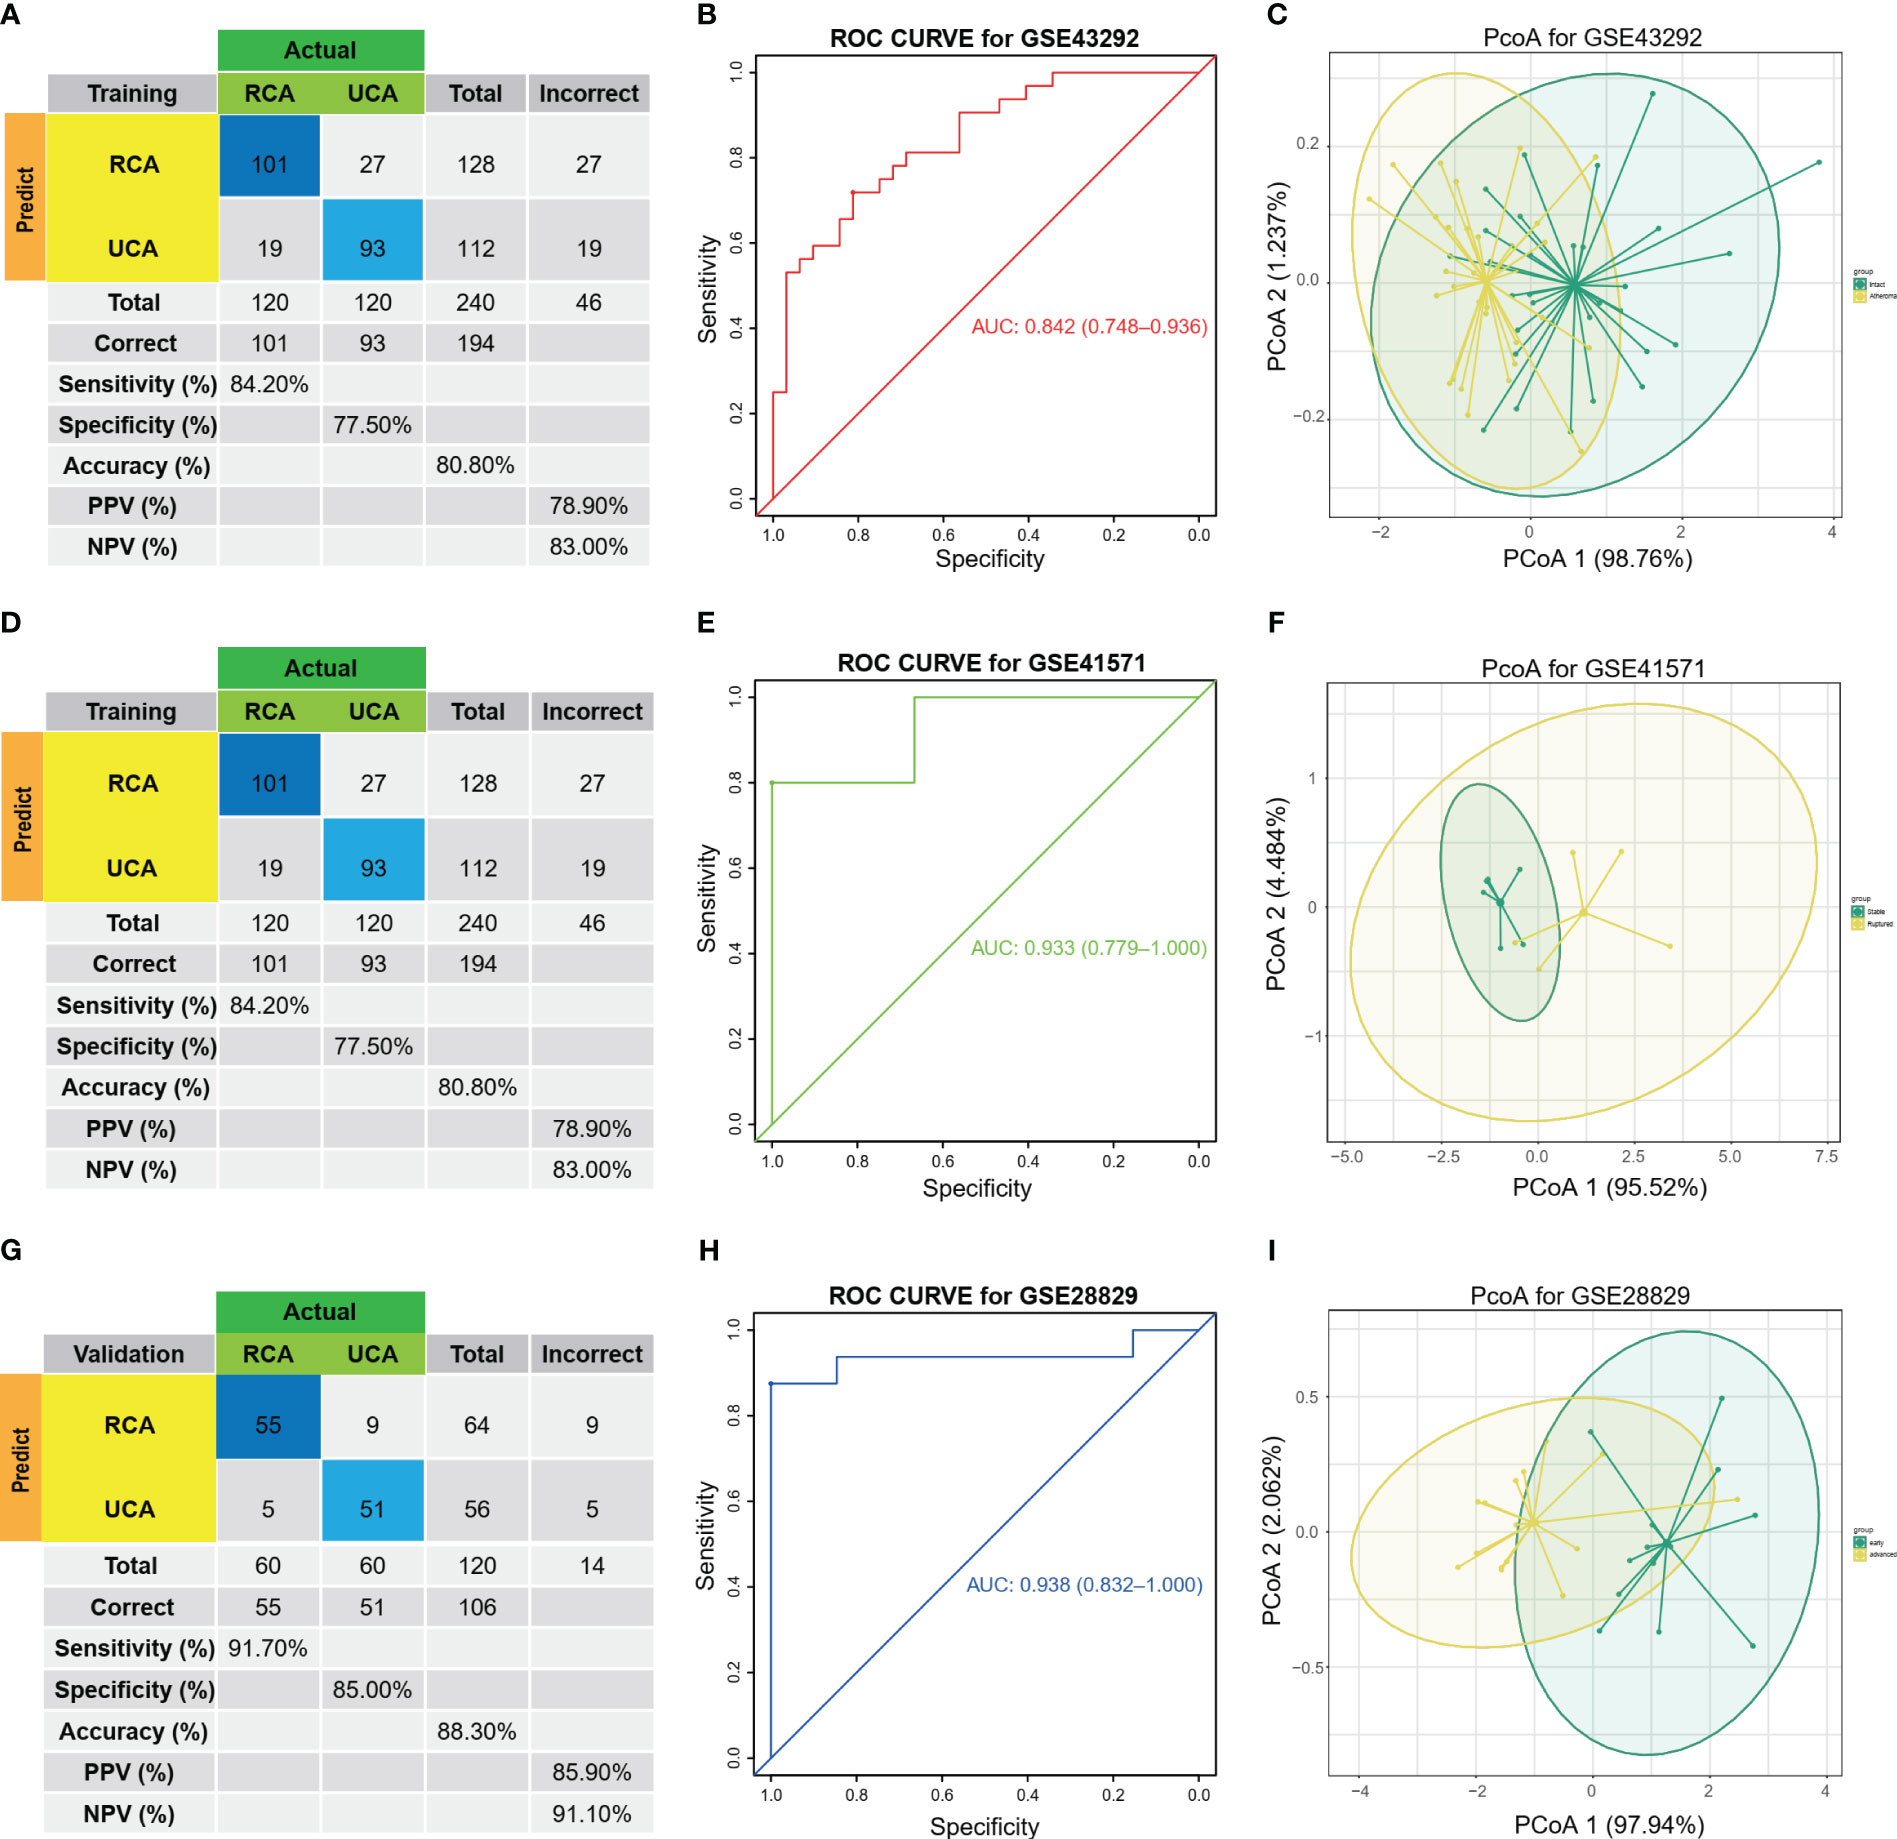
Figure 4 Diagnostic prediction model for AP progression. (A) The actual and predicted samples with confusion matrices built from the diagnostic prediction model using the two biomarkers with generalized linear models (regressions) between Atheroma and intact in the GSE43292 training cohorts. (B) Assessment of the diagnostic predictive accuracy for the training cohort for the two signatures using ROC curves (Atheroma = 32, intact = 32, AUC = 0.842). (C) PCoA analysis showing that the two signatures can distinguish between Atheroma and intact samples significantly. (D) The actual and predicted samples with confusion matrices built from the diagnostic prediction model using the two biomarkers with generalized linear models (regressions) in the GSE41571 external validation cohorts. (E) Assessment of the diagnostic predictive accuracy for the validation cohort for the two signatures using ROC curves (Ruptured = 5, Stable = 6, AUC = 0.933). (F) PCoA analysis showing that the two signatures can discriminate ruptured from stable samples significantly. (G) The actual and predicted samples with confusion matrices built from the diagnostic prediction model using the two biomarkers in the GSE28829 external validation cohorts. (H) Assessment of the diagnostic predictive accuracy for the validation cohort for the two signatures using ROC curves (advanced = 13, early = 16, AUC = 0.938). (I) PCoA analysis showing that the two signatures can discriminate advanced from early samples significantly.
The two biomarkers and the same statistical model were then used to evaluate the accuracy of the signature in predicting atherosclerotic plaque progression in the external validation cohorts (GSE41571 & GSE28829). Furthermore, the model demonstrated high consistency between the predicted and surgical diagnosis results in both validation cohorts, as depicted in Figures 4D, G. Additionally, the two biomarkers yielded satisfactory diagnostic accuracy in identifying patients with HPAs, with respective AUCs of 0.933 (95% CI: 0.779–1.0) for GSE41571 and 0.938 (95% CI: 0.832–1.0) for GSE28829. These results are depicted in Figures 4E, H. Similarly, there was a significant difference between the two groups on both validation cohorts, as shown in Figures 4F, I, when using PCoA.
The expression levels of the two immune biomarkers in HAP tissues and adjacent tissues were compared in the three GEO datasets. The results, shown in Figures S2A–C, demonstrated significant differences between the two groups across all three datasets. Furthermore, Figures S2D–F demonstrates strong correlations between the two immune biomarkers in all three datasets.
The study proceeded to perform an external validation of the efficient machine learning models for GSE100927, which included 69 atherosclerotic arteries and 35 healthy normal arteries from three different artery types, namely GSE100927_Carotid, GSE100927_Femoral, and GSE100927_Infra. To assess the validity of the method and the precision of the results, the study employed the two biomarkers and the same statistical model for GSE100927 and its three subsets. The model continued to exhibit a high level of consistency between the predicted outcomes and the surgical diagnosis for all four validation cohorts (Figures 5A, D, G, J). The two biomarkers demonstrated satisfactory diagnostic accuracy in identifying HPAs patients from normal patients, with the Area Under the Curve (AUCs) values of 0.899 for GSE100927 (Figure 5B), 0.928 for GSE100927_Carotid (Figure 5E), 0.971 for GSE100927_Femoral (Figure 5H), and 0.916 for GSE100927_Infra (Figure 5K). Figures 5C, F, I, L presented that the two groups could consistently be distinguished by utilizing the two signatures across all four datasets.
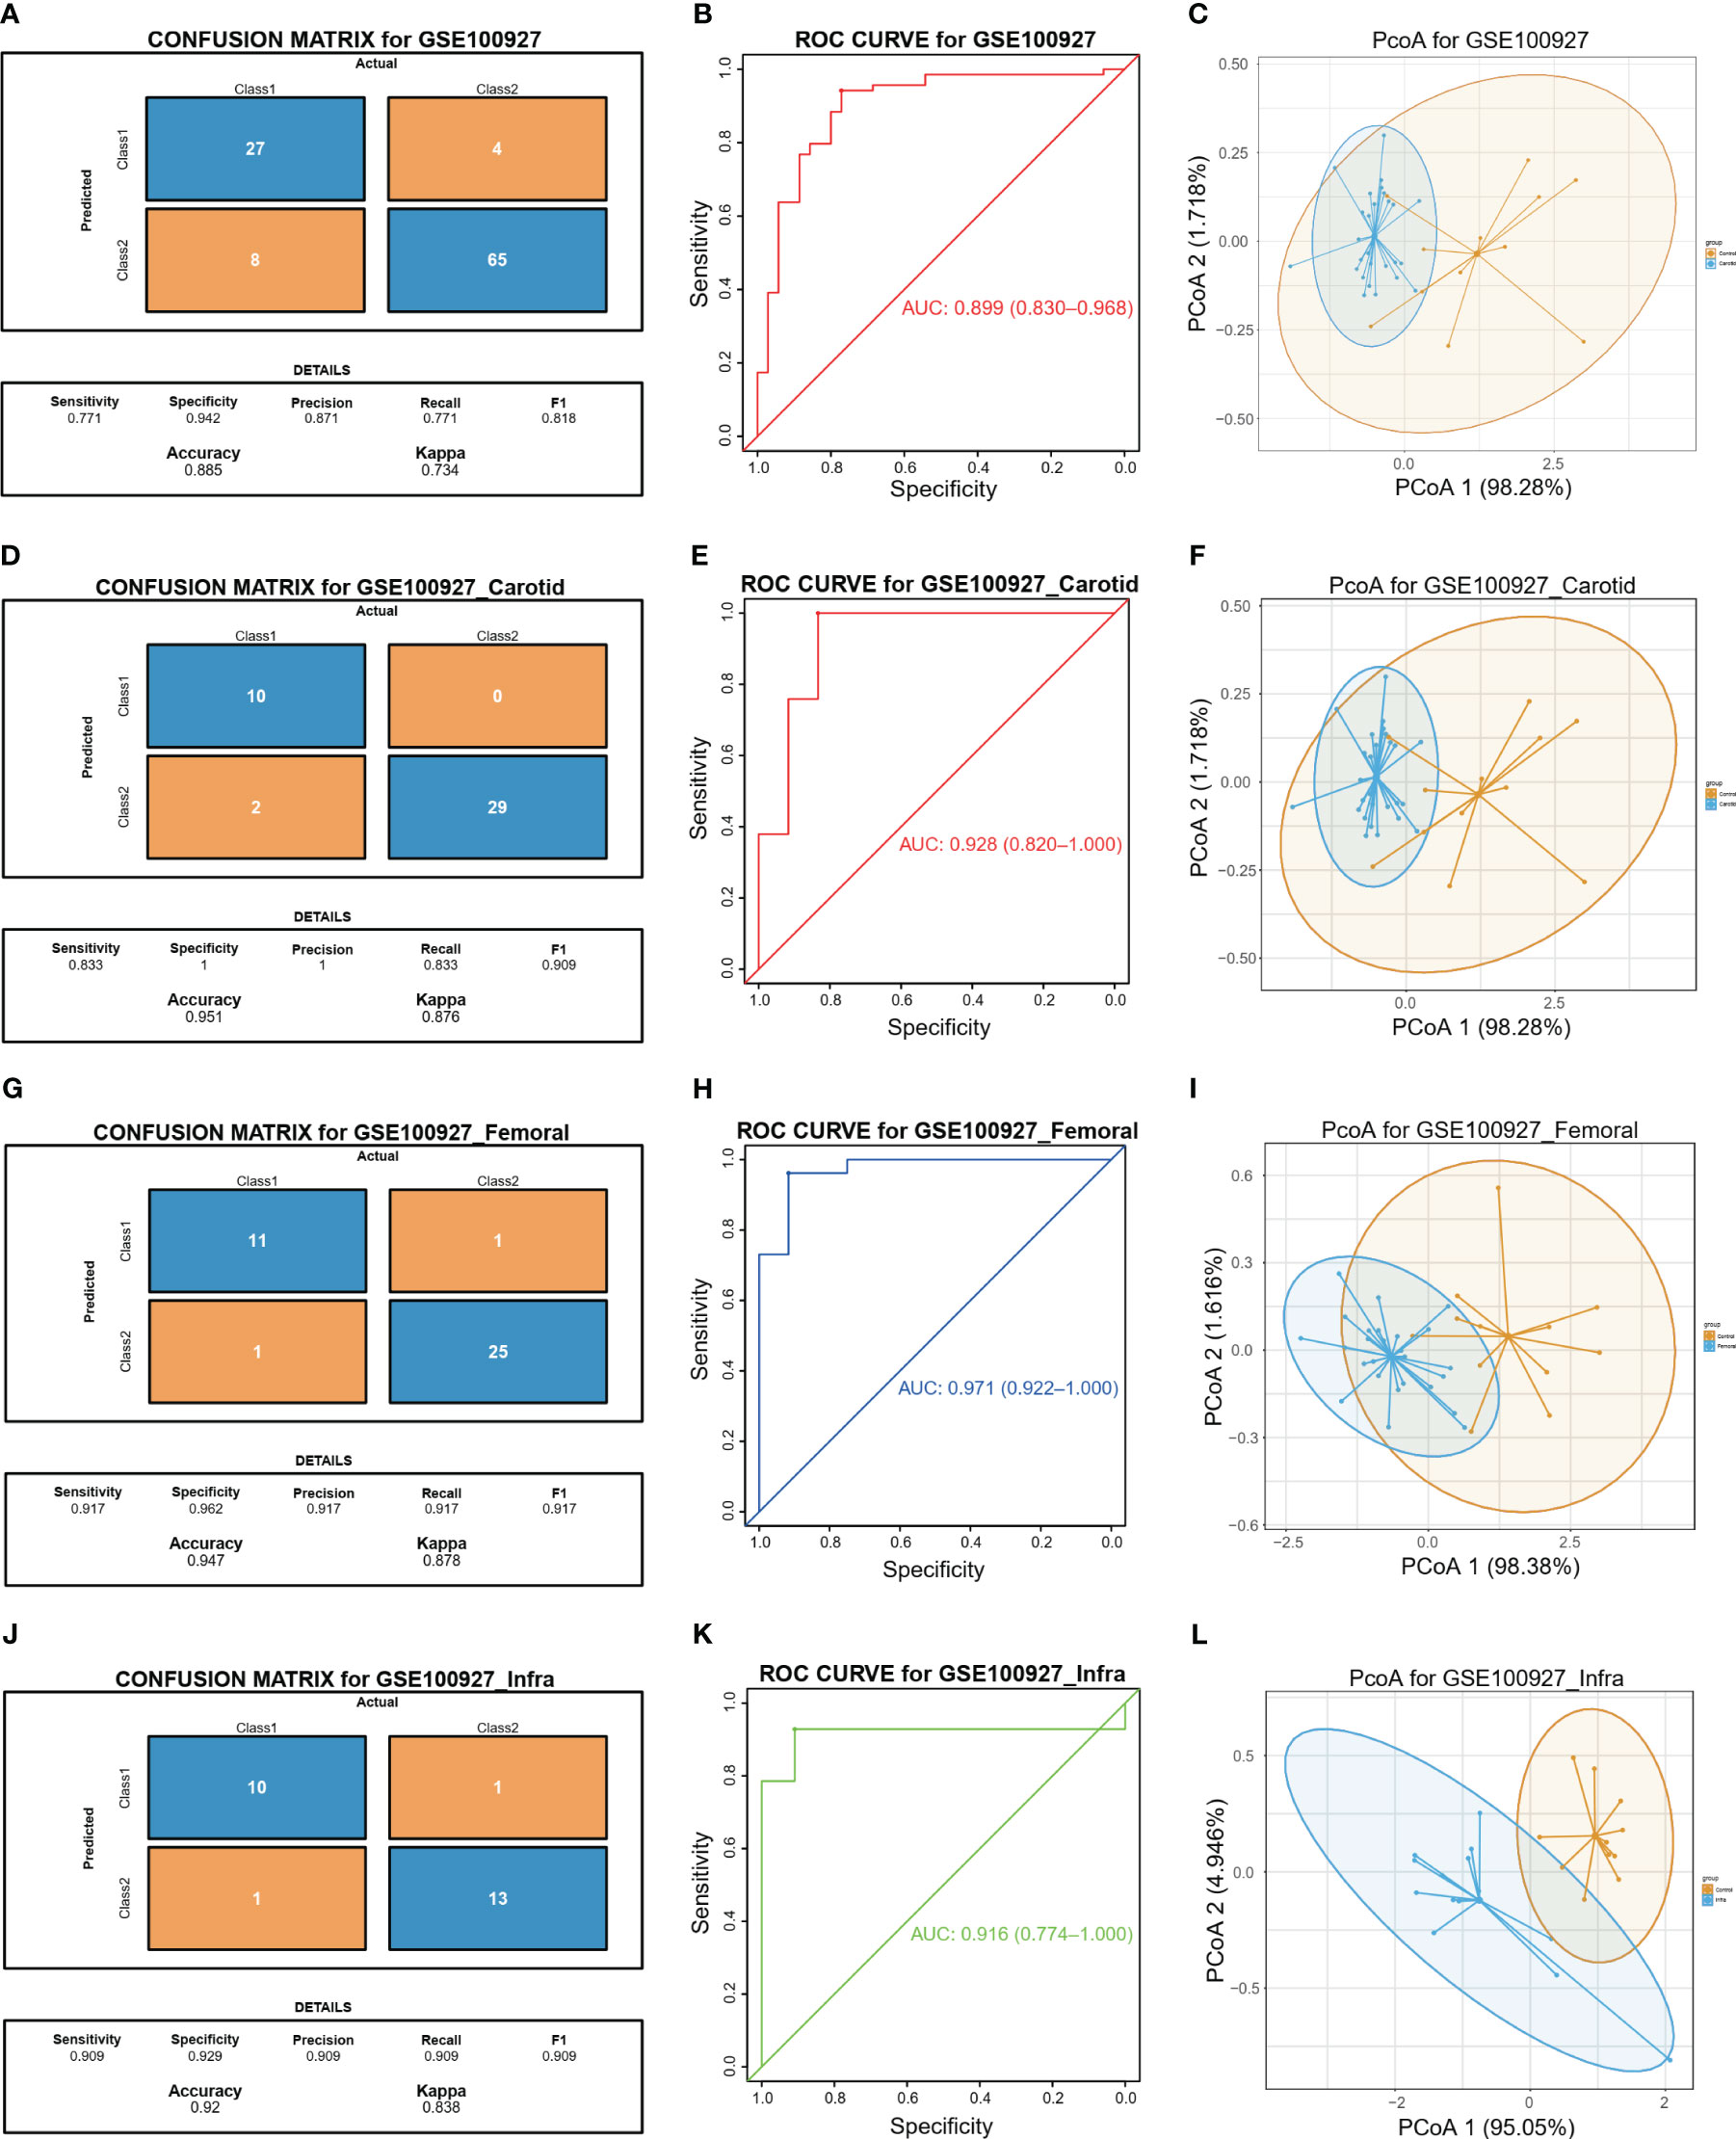
Figure 5 Diagnostic prediction model for diagnosis and predicting HAP from normal controls. (A) The actual and predicted samples with confusion matrices built from the diagnostic prediction model using the two biomarkers in the GSE100927 external validatin cohorts. (B) Assessment of the diagnostic predictive accuracy for the validation cohort for the two signatures using ROC curves (atherosclerotic arteries = 69, normal arteries = 35, AUC = 0.899). (C) PCoA analysis showing that the two signatures can distinguish between atherosclerotic arteries and normal arteries significantly. (D) The actual and predicted samples with confusion matrices built from the diagnostic prediction model using the two biomarkers in the GSE100927_Carotid external validatin cohorts. (E) Assessment of the diagnostic predictive accuracy for the validation cohort for the two signatures using ROC curves (Carotid = 29, Normal = 12, AUC = 0.928). (F) PCoA analysis showing that the two signatures can distinguish between carotid atherosclerotic arteries and normal arteries significantly. (G) The actual and predicted samples with confusion matrices built from the diagnostic prediction model using the two biomarkers in the GEO100927_Femoral external validation cohorts. (H) Assessment of the diagnostic predictive accuracy for the validation cohort for the two multi-omics signatures using ROC curves (Femoral = 26, Normal = 12, AUC = 0.981). (I) PCoA analysis showing that the two signatures can discriminate AP in femoral artery from normal samples significantly. (J) The actual and predicted samples with confusion matrices built from the diagnostic prediction model using the two biomarkers in the GSE100927_Infra validation cohorts. (K) Assessment of the diagnostic predictive accuracy for the validation cohort for the two signatures using ROC curves (Infra-popliteal territories = 14, Normal = 11, AUC = 0.89). (L) PCoA analysis showing that the two signatures can discriminate AP in infra-popliteal artery from normal samples significantly.
Last, the expression of the two immune biomarkers between HAP tissues and normal tissues in the three GEO datasets were presented at Figures S3A–D, and the significant differences between the two groups were observed in all datasets. In addition, the correlations between the two immune biomarkers were displayed in Figures S3E–H, and strong correlations were found in all datasets.
Finally, the expression levels of the two immune biomarkers in HAP tissues and normal tissues were compared in the three GEO datasets. The results, shown in Figures S3A–D, demonstrated significant differences between the two groups across all three datasets. Furthermore, Figures S3E–H demonstrates strong correlations between the two immune biomarkers in all three datasets.
In order to further investigate the correlation between C1Q and the immune microenvironment of the HAP samples, a comparative analysis was conducted on the differences in immune cells between normal/early samples and HAP samples in three GEO datasets using eight algorithms (Figures 6A–C). The results revealed that a majority of the immune cells in the HAP samples exhibited distinct characteristics compared to the normal/early samples across the three GEO datasets. Furthermore, patients in the HAP group displayed significantly higher stromal scores, ESTIMATE scores, and immune scores, while the plaque purity was found to be lower than that of the normal or early group (P < 0.001) (Figures 6D–F). The findings of this study suggest that the HAP tissue obtained from the subgroup with high C1Q levels exhibited a greater abundance of immune cells and immune molecules.
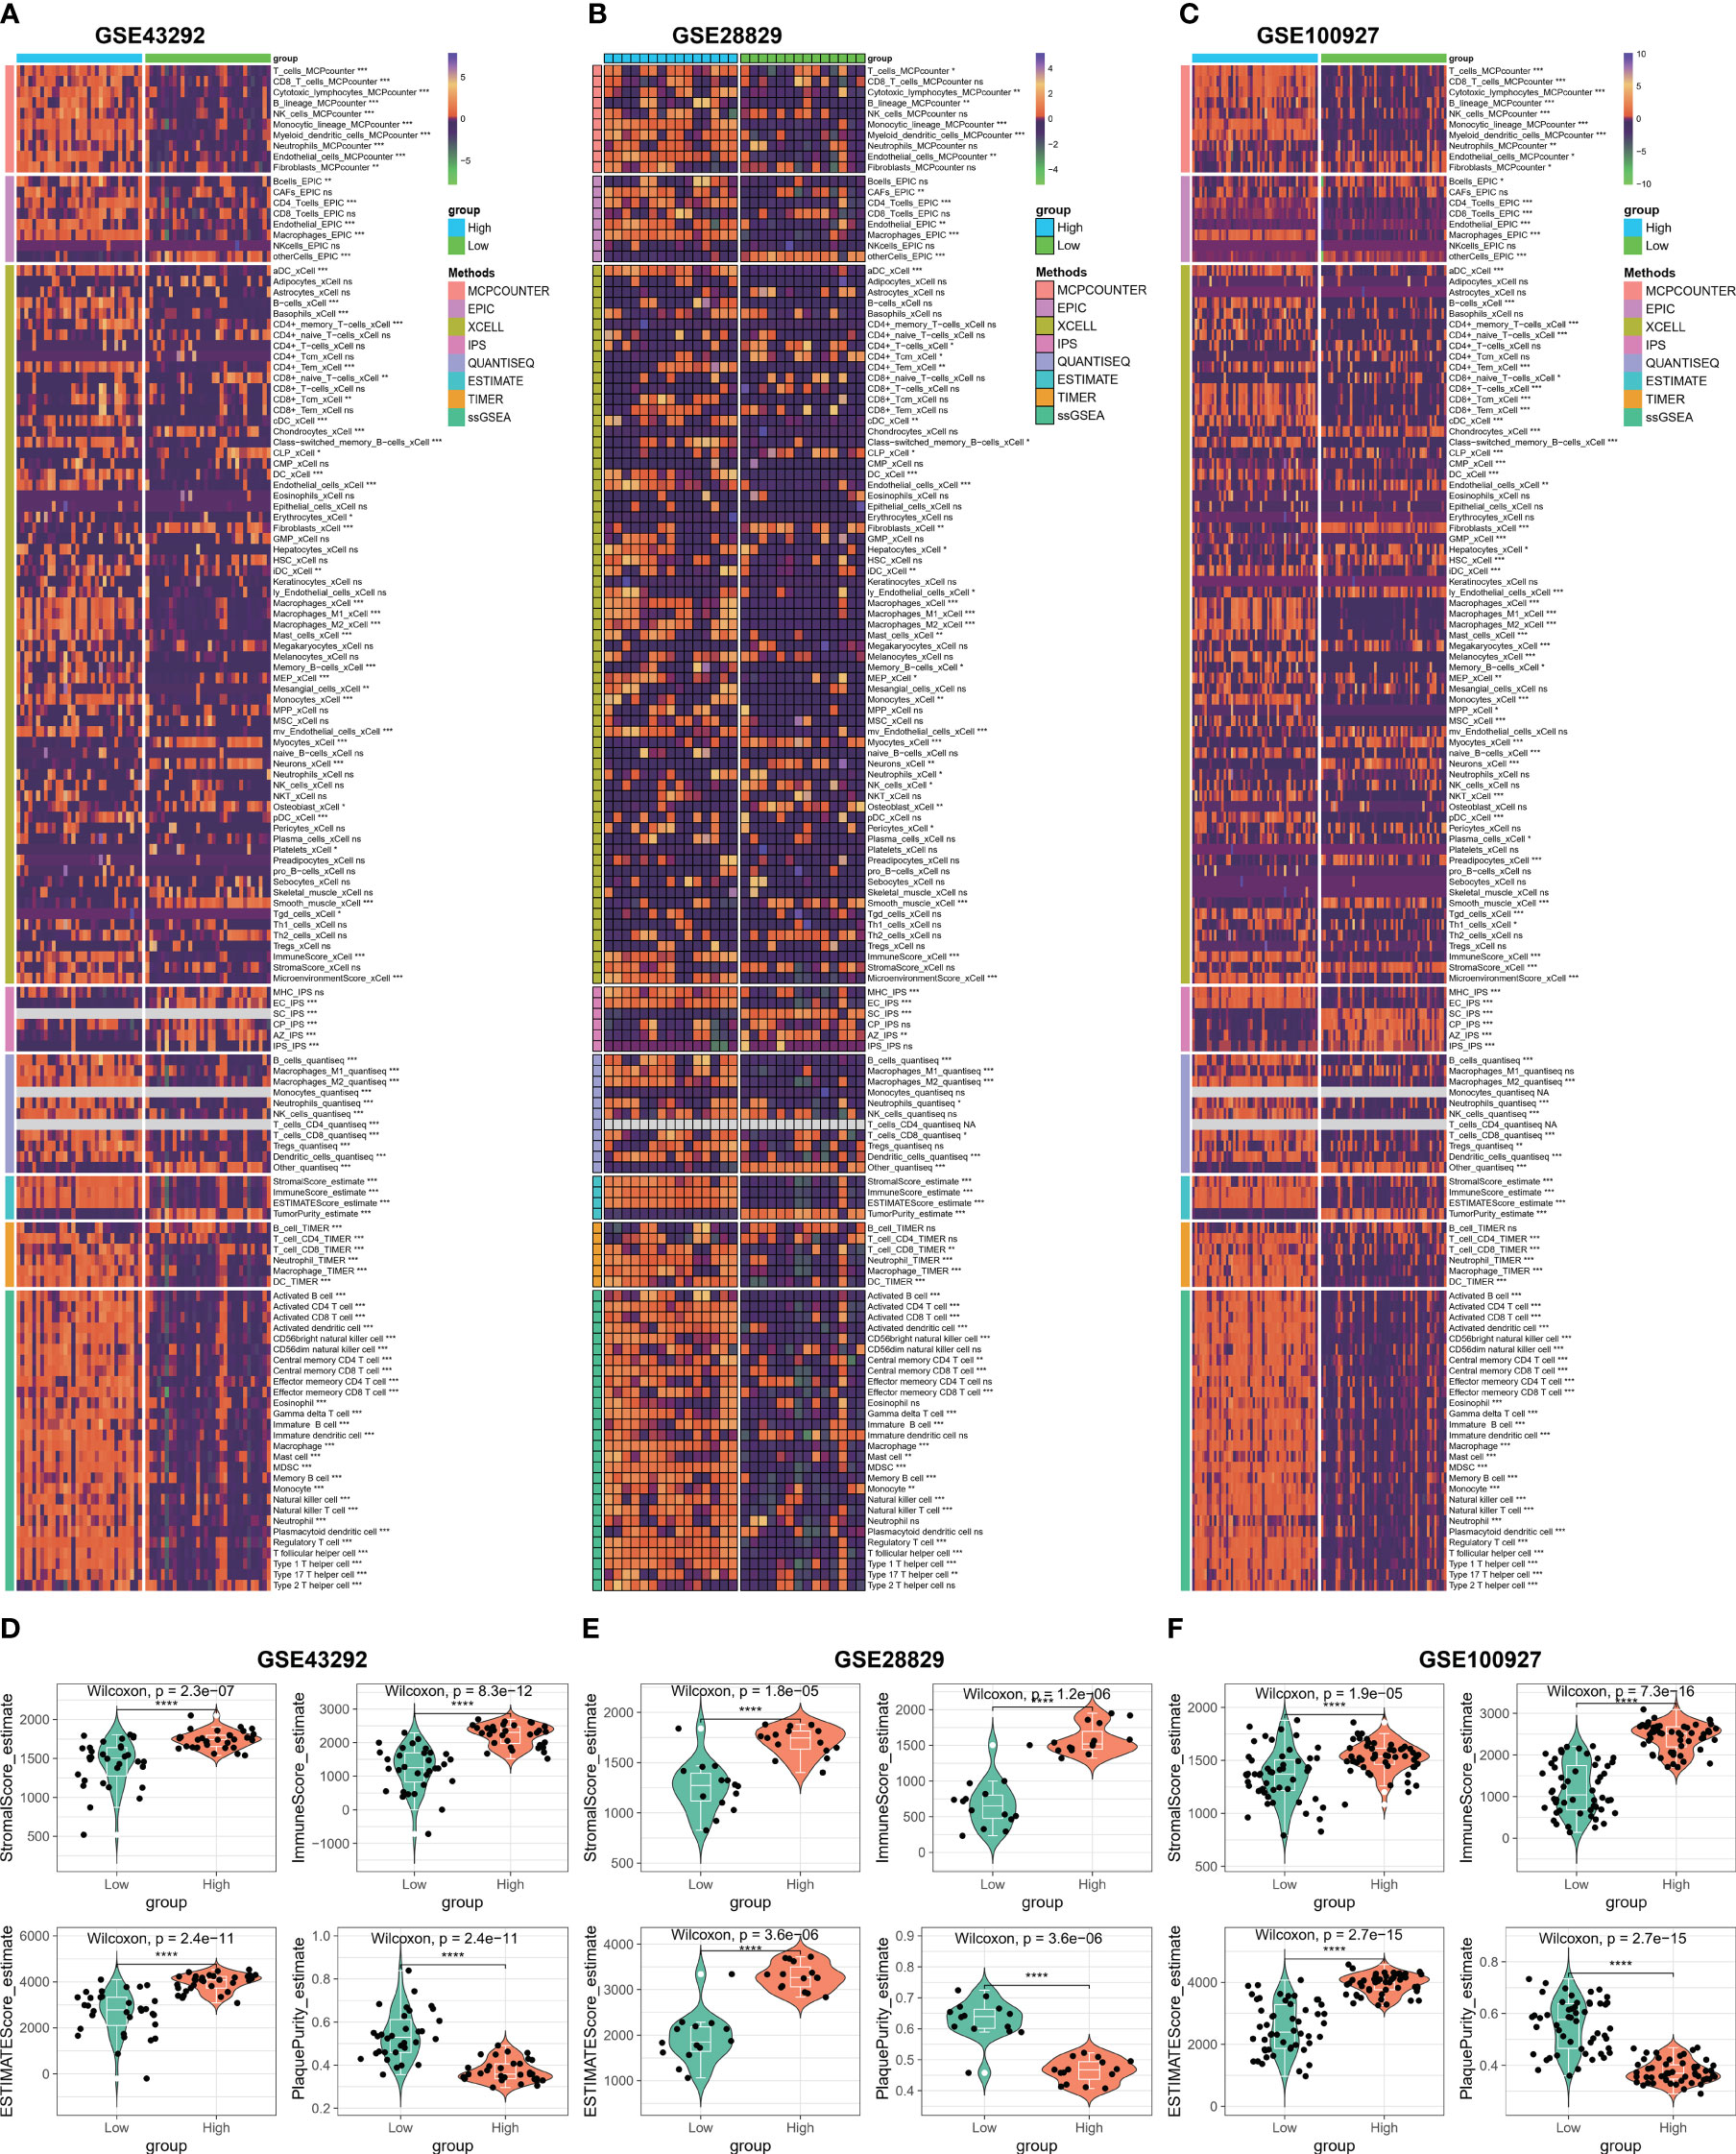
Figure 6 Immune microenvironment analysis based on C1Q hub genes. (A) Heatmap displaying enrichment of immune-infiltrating cells through 8 algorithms between atheroma and intact samples in the GSE43292 cohorts. (B) Heatmap displaying enrichment of immune-infiltrating cells through 8 algorithms between early and advanced samples in the GSE28829 cohorts. (C) Heatmap displaying enrichment of immune-infiltrating cells through 8 algorithms between atherosclerotic plaques and control samples in the GSE100927 cohorts. (D–F) The stromal scores, immune scores, ESTIMATE scores, and plaque purity are compared between high- and low C1Q groups in the GSE43292 (D), GSE28829 (E), and GSE100927 (F) datasets. *P <0.05, **P < 0.01, ***P < 0.001.
Based on our observations, it has been noted that HAP tissue with a high level of C1Q contains a greater number of immune cells and immune molecules. In order to further investigate this phenomenon, we proceeded to examine the immune signaling pathway and immunomodulators based on C1Q hub genes. The results, as depicted in Figures 7A–C, indicate that the majority of the 16 immune signal pathways were found to be enriched in the high C1Q group in HAPs. Furthermore, a positive correlation was observed between the majority of C1QA and C1QC and the 16 immune signal pathways in three GEO datasets. Additionally, the heatmap in Figures 7D–F illustrates that HAP samples with a high C1Q level exhibited significantly higher levels of immunomodulators levels. The findings of this study suggest that the HAP tissue obtained from individuals with high levels of C1Q exhibited a greater enrichment of immune signal pathways and a higher abundance of immunomodulators.
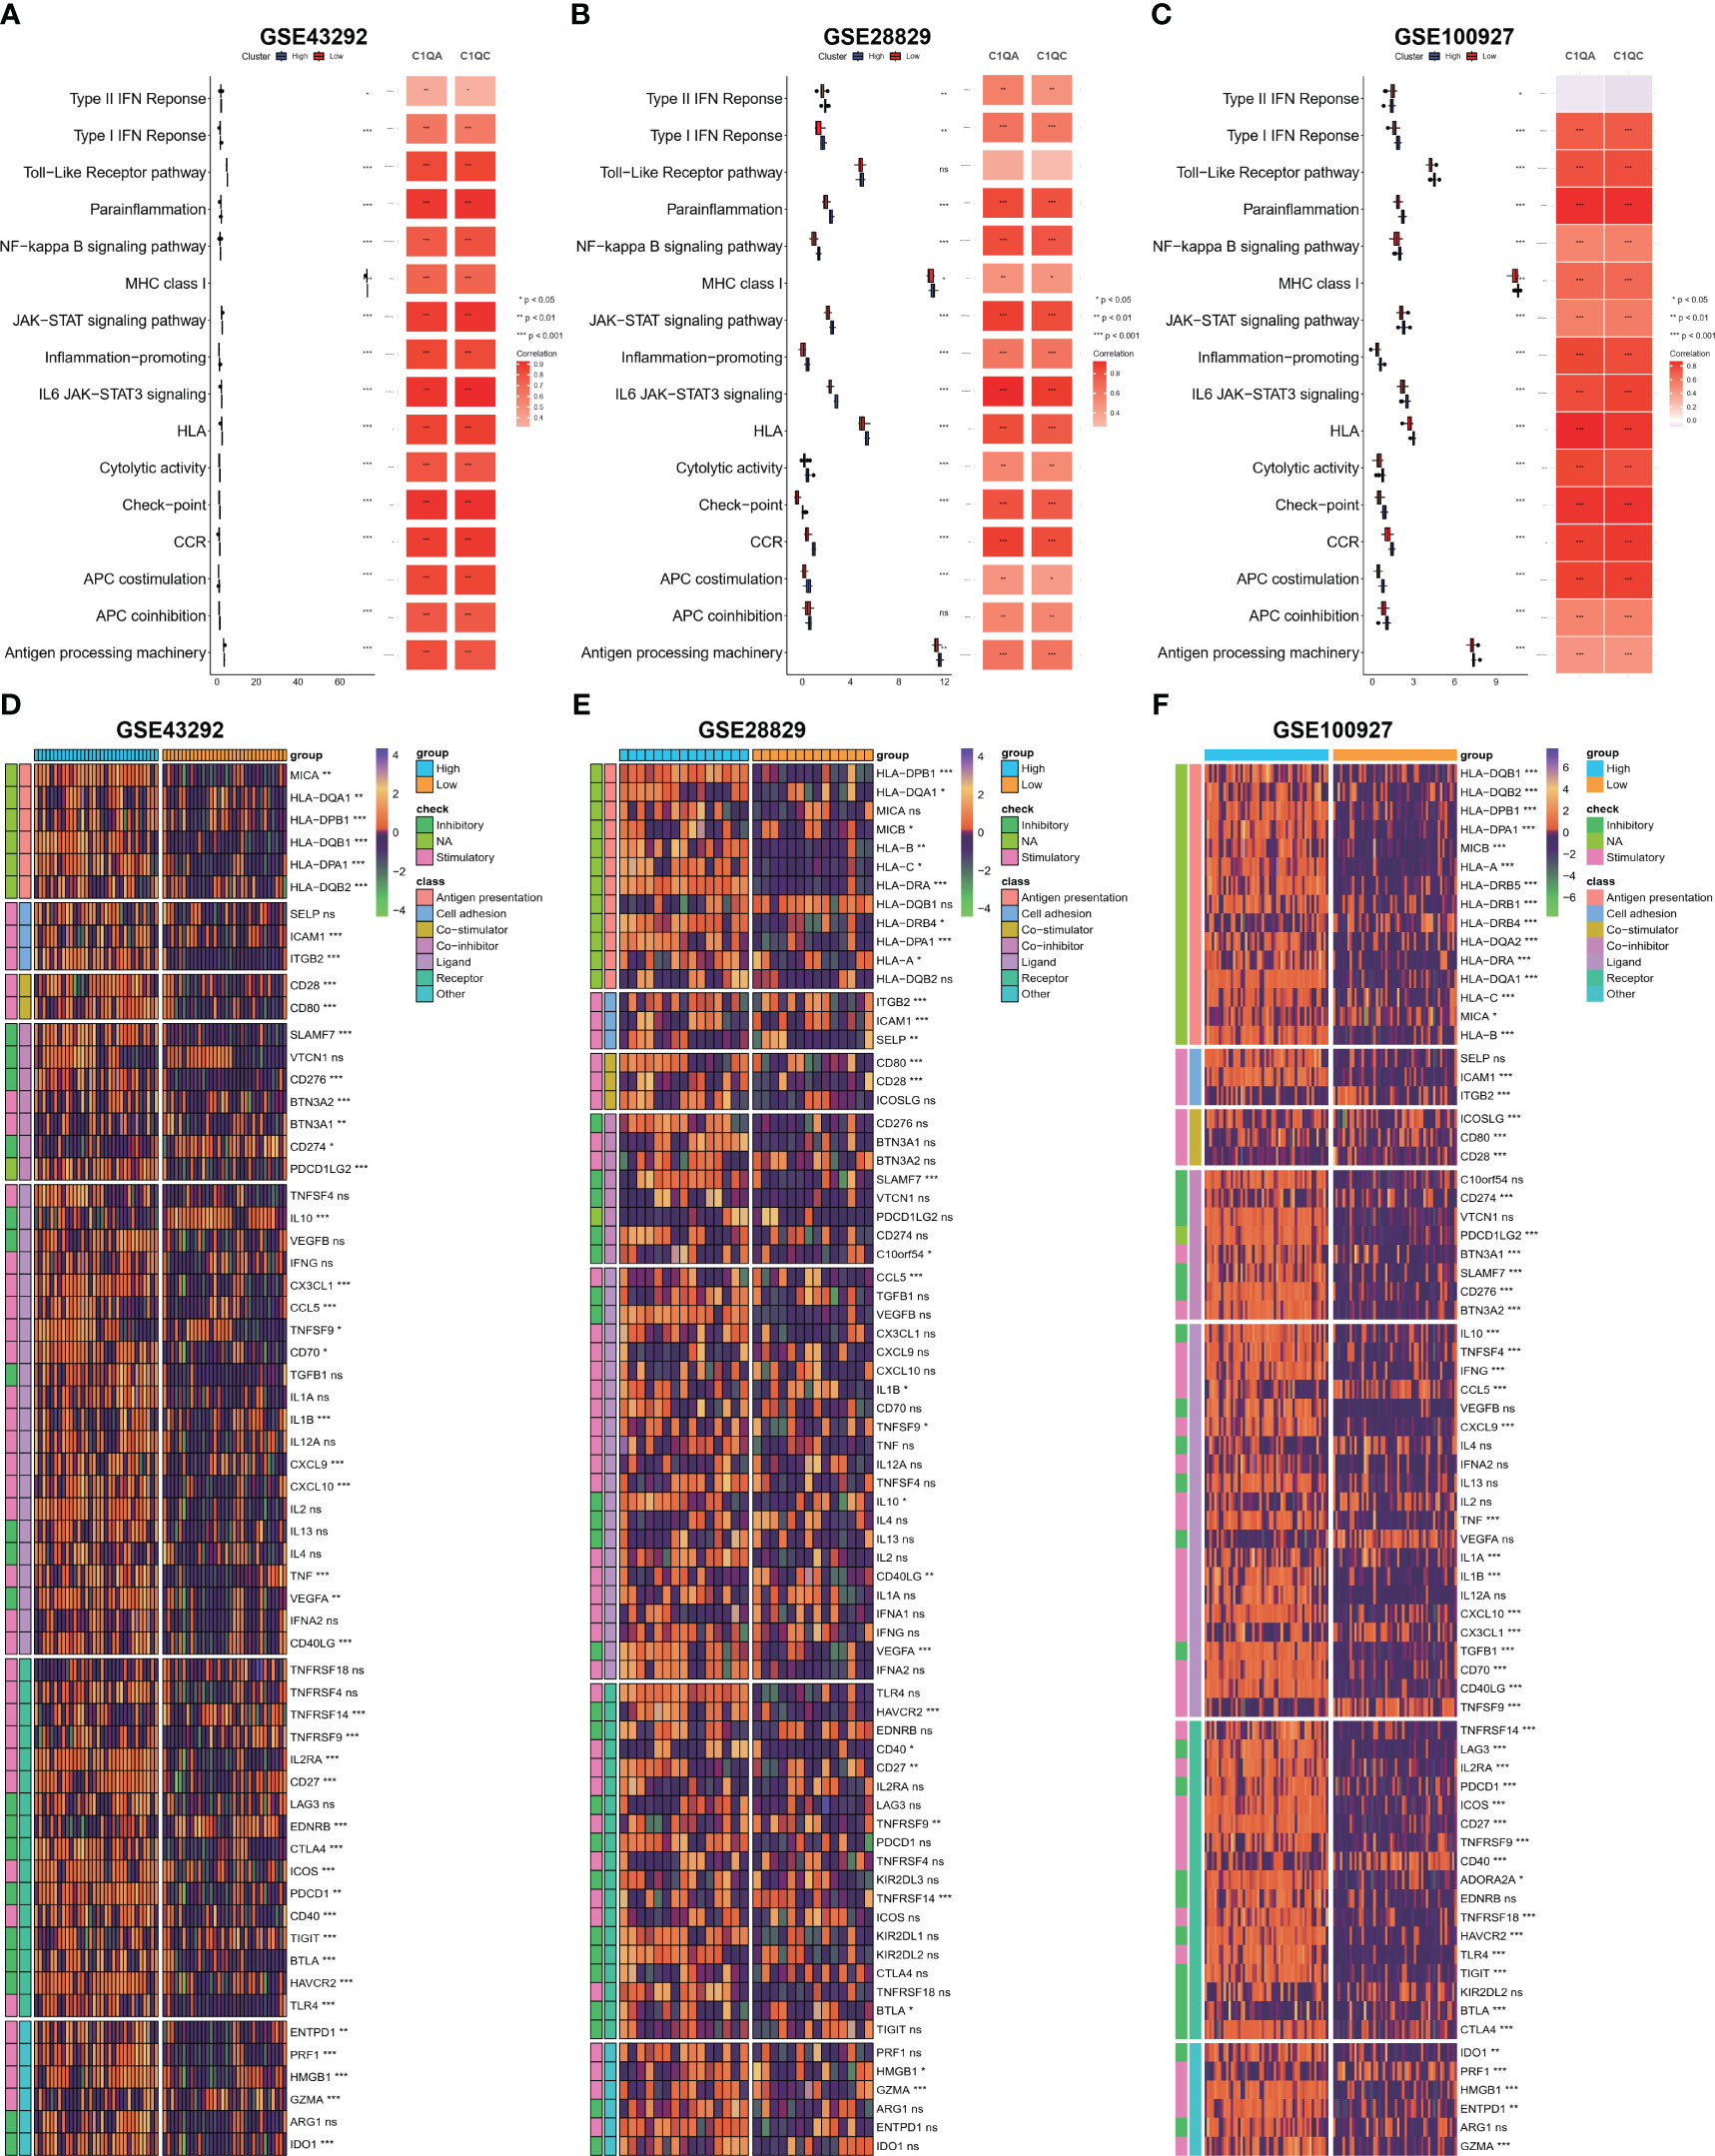
Figure 7 Evaluation of immune signaling pathway and immunomodulators based on C1Q hub genes. (A–C) Comparison of 16 immune signaling pathway between high- and low C1Q groups and correlation analysis between immune signaling pathway and C1QA or C1QC in the GSE43292 (A), GSE28829 (B) and GSE100927 (C) datasets. (D–F) The enrichment of immunomodulators is visualized through heatmap analysis using seven algorithms in the same datasets: GSE43292 (D), GSE28829 (E), and GSE100927 (F).
To explore the molecular function of HAP in detail, we investigated whether C1QA and C1QC activate the HALLMARK_COMPLEMENT signaling pathway in GEO datasets. We conducted GSEA analysis on three GEO datasets (GSE43292, GSE28829, and GSE100927) to identify any signaling pathway that might be altered between AP and control samples. As anticipated, the HALLMARK_COMPLEMENT signaling pathway was activated in all three datasets (Figures 8A–F), indicating its crucial implication in HAP.
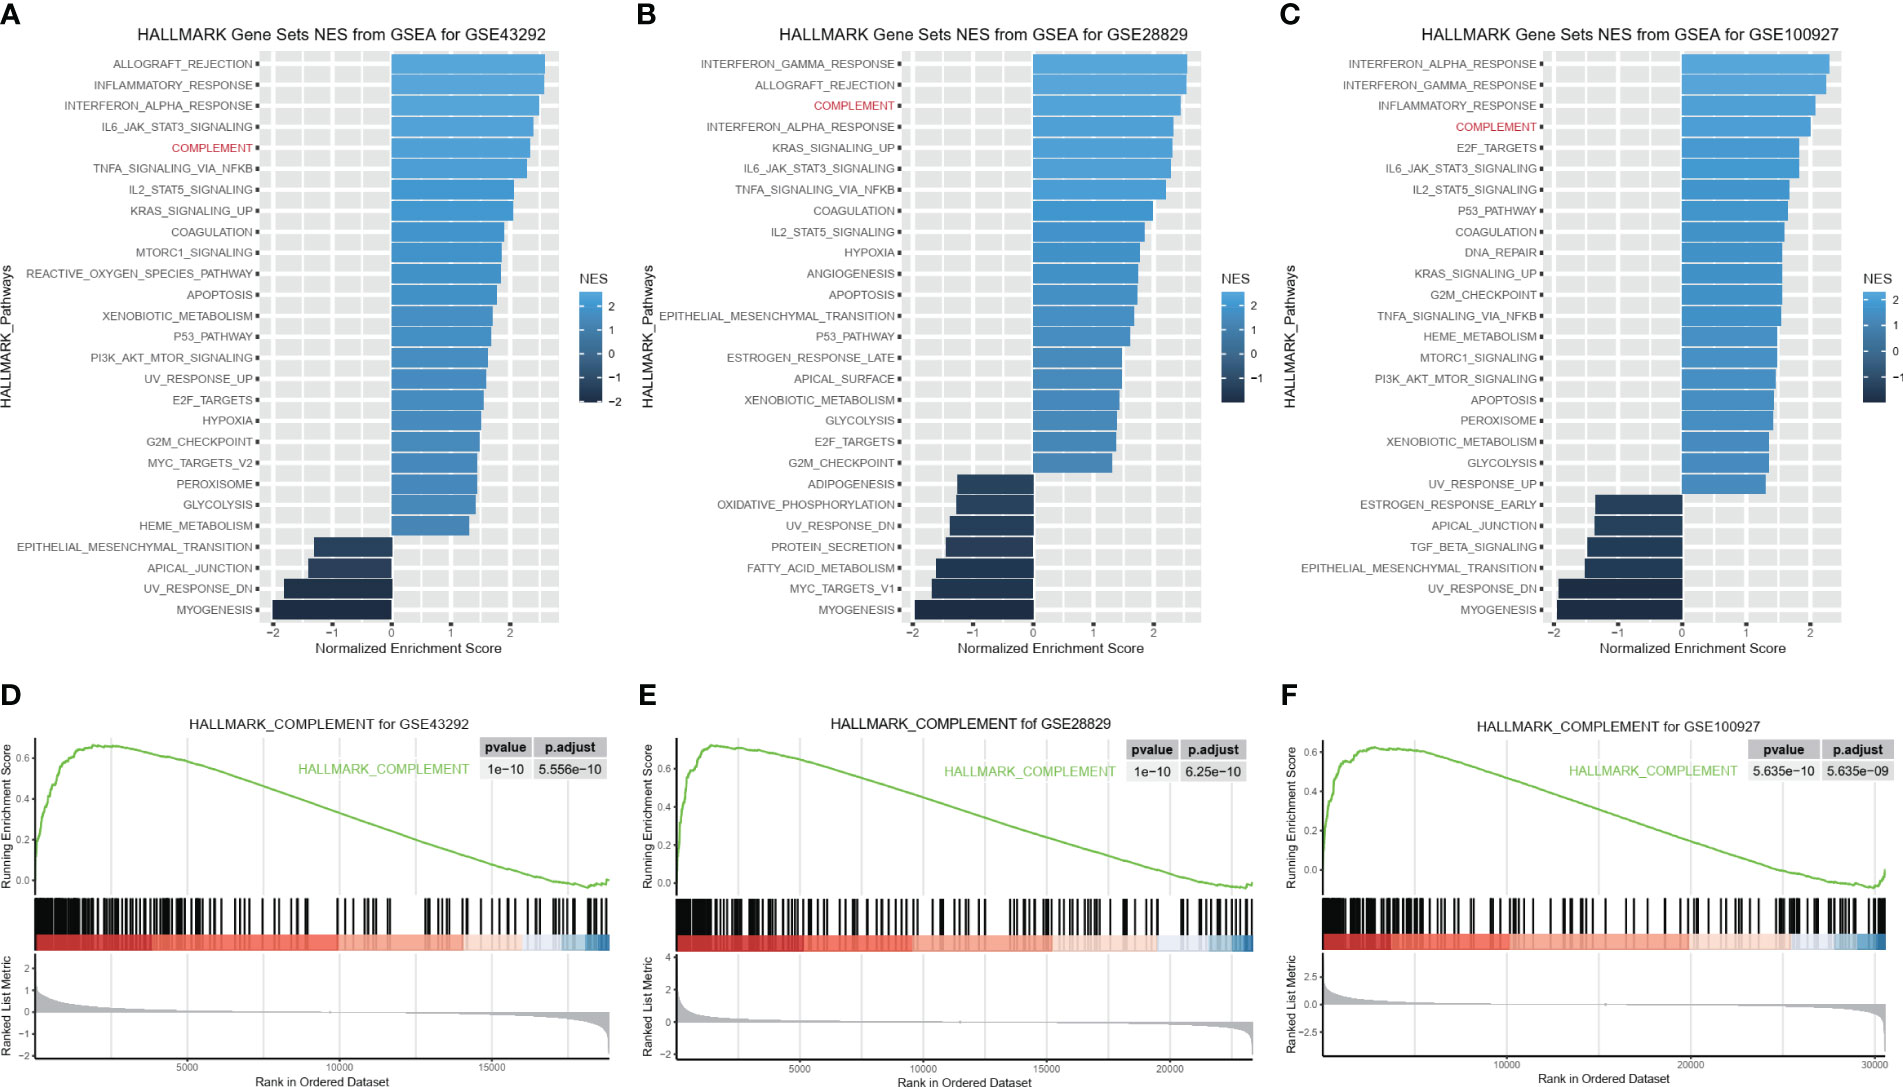
Figure 8 C1QA activated HALLMARK_COMPLEMENT signaling pathway in HAP. (A–F) GSEA analysis results of C1QA for three GEO datasets (GSE43292, GSE28829 and GSE100927).
The activation of the HALLMARK_COMPLEMENT signaling pathway by C1QA and C1QC in HAP was investigated. Subsequently, a correlation analysis was conducted between C1QA/C1QC and the HALLMARK_COMPLEMENT signaling pathway using three GEO datasets. Notably, our analysis revealed a positive correlation between C1QA and the majority of genes in this pathway (Figures 9A, E, I). Specifically, C2, CD36, CTSB, APOC1, CCL5, and others exhibited a high correlation with C1QA across all three datasets. Furthermore, the ssGSEA algorithm was employed to score the HALLMARK_COMPLEMENT signaling pathway for the three GEO datasets. Based on the obtained scores, a distinct positive correlation was observed between C1QA and the HALLMARK_COMPLEMENT signaling pathway (Figures 9B, F, J). The present study demonstrates the ability to discriminate pathway scores for subgroups with high and low C1QA expression (Figures 9C, G, K), as well as to distinguish C1QA expression levels between subgroups with high and low pathway scores (Figures 9D, H, L). These findings suggest that heightened C1QA expression is implicated in the progression of AP via the HALLMARK_COMPLEMENT signaling pathway. Furthermore, a comparable positive correlation between C1QC and the HALLMARK_COMPLEMENT signaling pathway was identified in HAP (Figure S5).
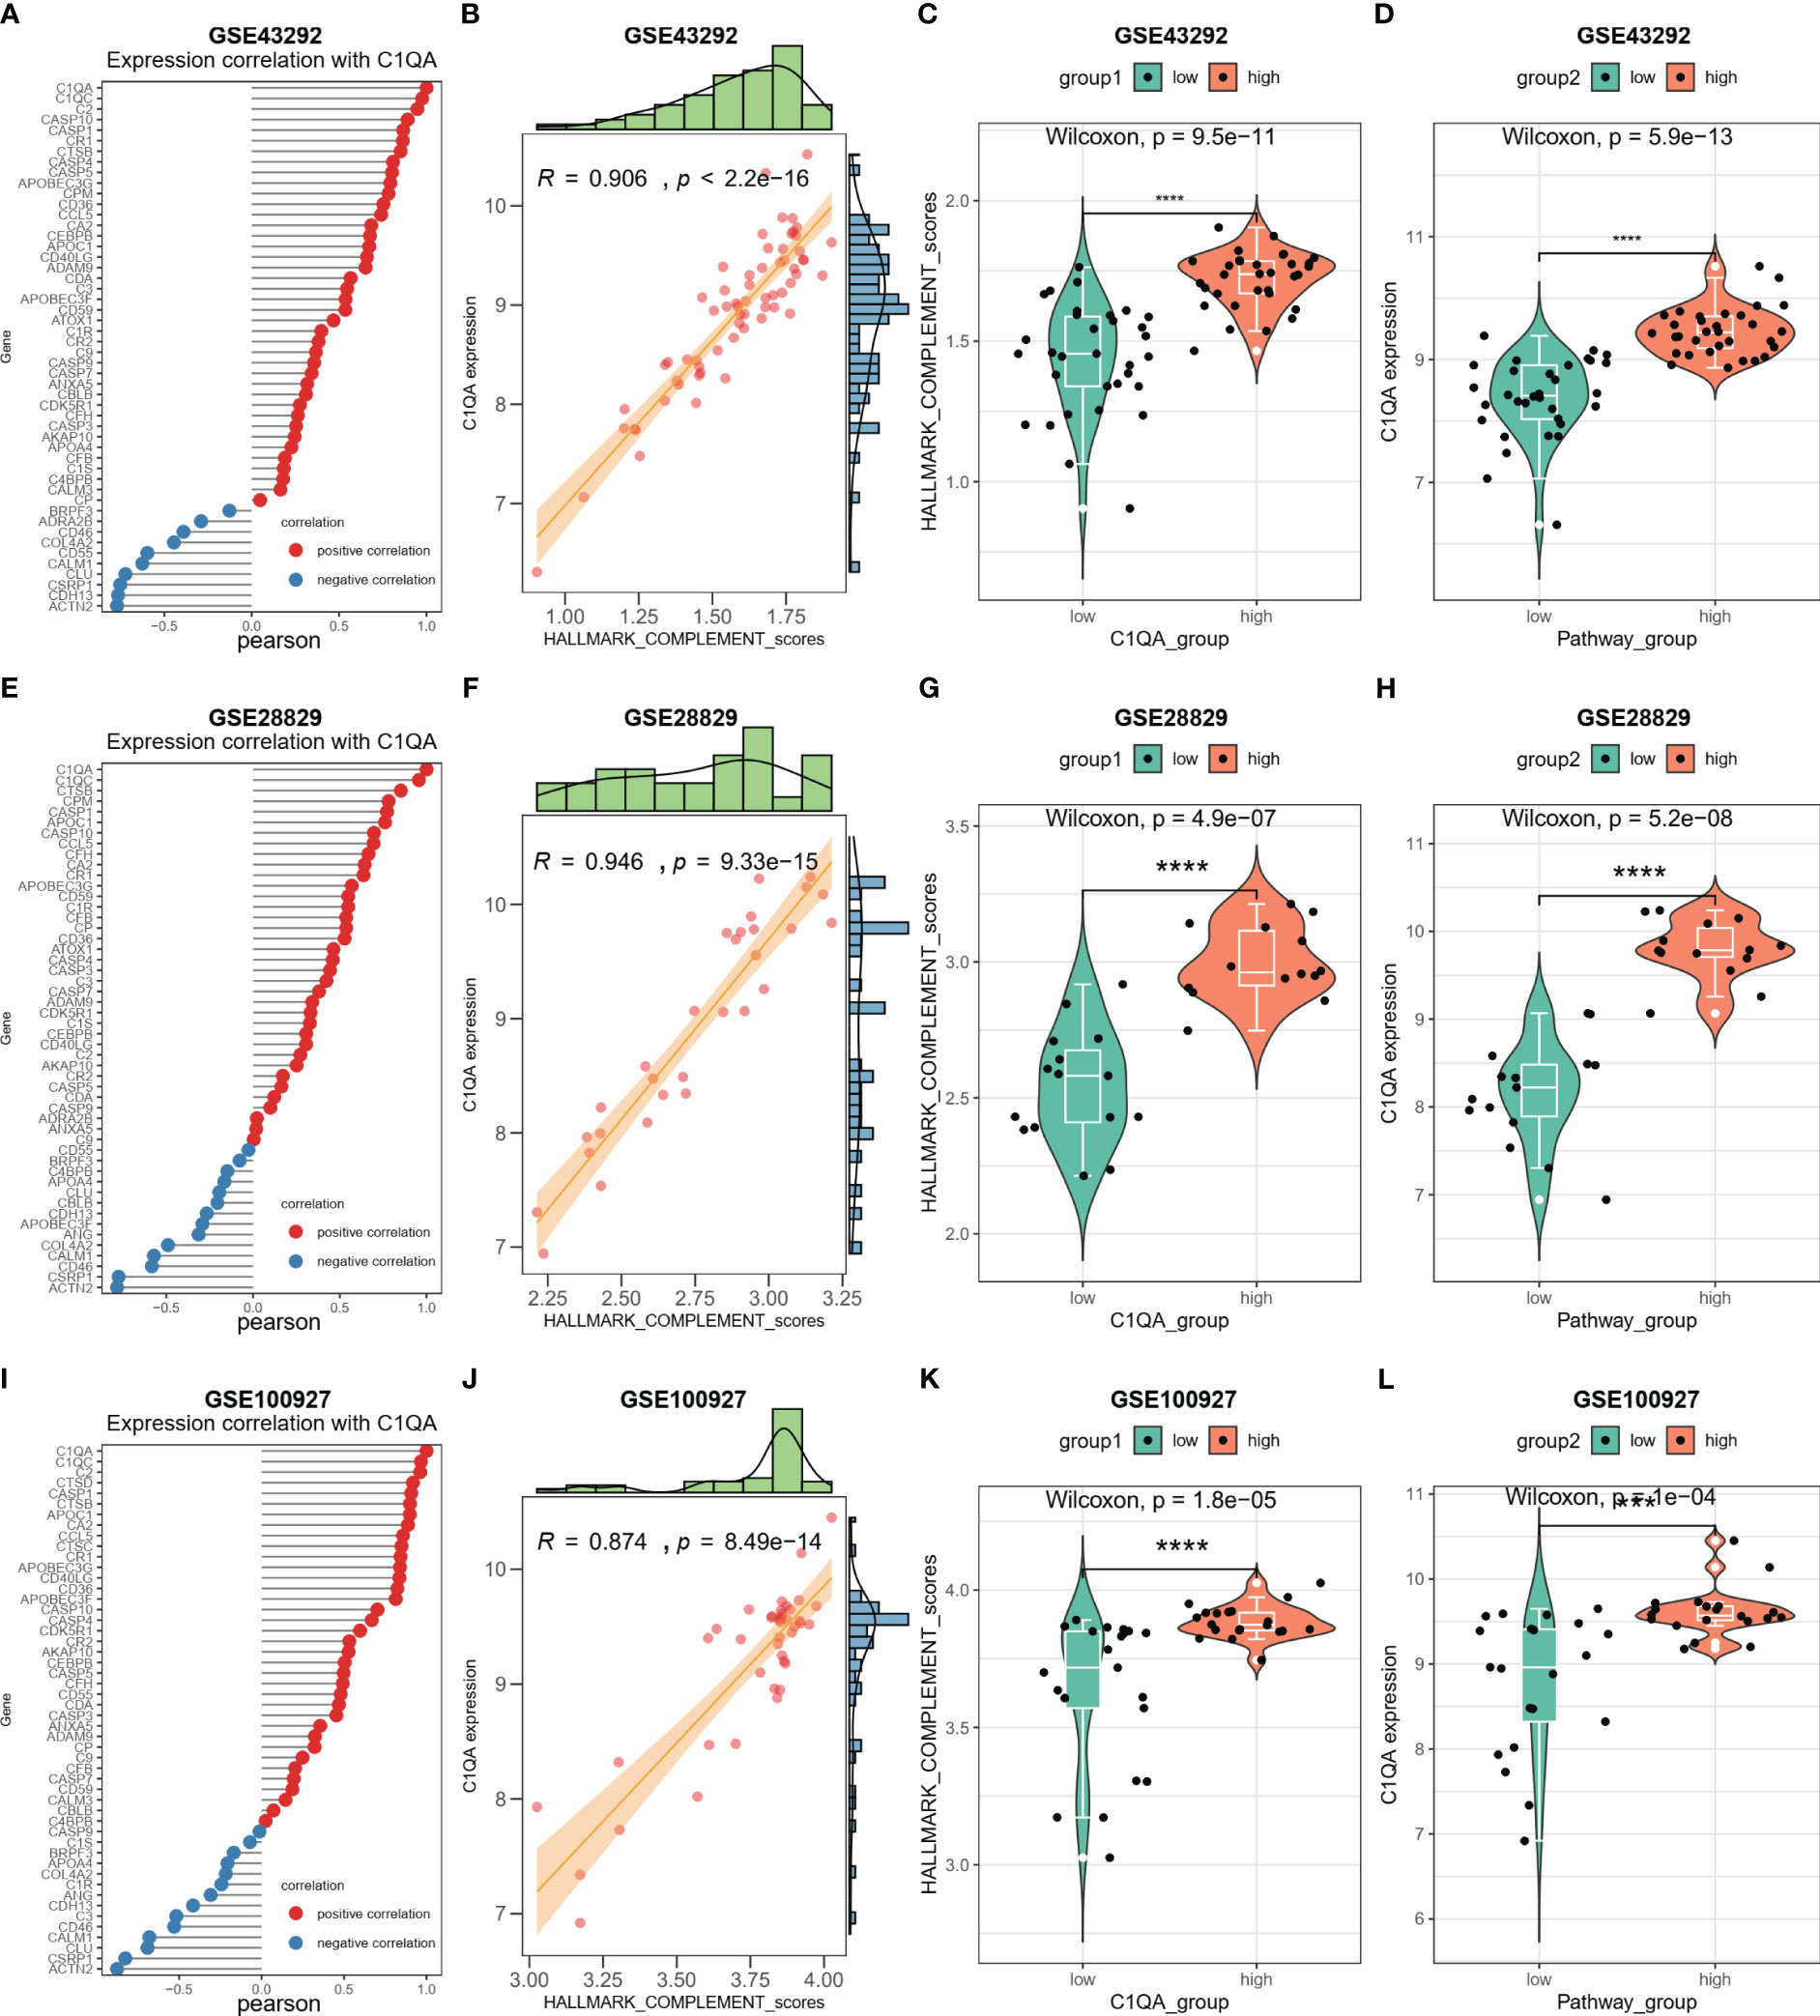
Figure 9 C1QA correlated HALLMARK_COMPLEMENT signaling pathway in HAP. (A) Correlation between C1QA and HALLMARK_COMPLEMENT signaling pathway genes in the GSE43292 dataset. (B) Correlation between C1QA and HALLMARK_COMPLEMENT signaling pathway scores in the GSE43292 dataset. (C) Comparison of the HALLMARK_COMPLEMENT signaling pathway scores between subgroups with high and low C1QA expression in the GSE43292 dataset. (D) Comparison of the expression of C1QA between subgroups with high and low HALLMARK_COMPLEMENT signaling pathway scores in the GSE43292 dataset. (E) Correlation between C1QA and HALLMARK_COMPLEMENT signaling pathway genes in GSE28829 dataset. (F) Correlation between C1QA and HALLMARK_COMPLEMENT signaling pathway scores in GSE28829 dataset. (G) Comparison of the HALLMARK_COMPLEMENT signaling pathway scores between high and low C1QA expression subgroups in GSE28829 dataset. (H) Comparison of C1QA expression between high and low subgroups of HALLMARK_COMPLEMENT signaling pathway scores in GSE28829 dataset. (I) Correlation between C1QA and HALLMARK_COMPLEMENT signaling pathway genes in GSE100927 dataset. (J) Correlation between C1QA and HALLMARK_COMPLEMENT signaling pathway scores in GSE100927 dataset. (K) Comparison of the HALLMARK_COMPLEMENT signaling pathway scores between high and low C1QA expression subgroups in GSE100927 dataset. (L) Comparison of C1QA expression between high and low subgroups of HALLMARK_COMPLEMENT signaling pathway scores in GSE100927 dataset.
The potential transcription factors (TFs) that could regulate the two crosstalk genes C1QA and C1QC were first screened from three databases (ENCODE, JASPAR, and ChEA) by using NetworkAnalyst 3.0. Figures 10A–C presents the TFs that could regulate the two crosstalk genes from the ENCODE, JASPAR, and ChEA databases as 2, 1, and 4, respectively. The mRNA expression levels of these TF were calculated in three GEO datasets, and as a result, the expression levels of SPI1 were considerably upregulated in all three datasets (Figure 10D). Hence, it can be concluded that SPI1 could be the crucial TF regulating the two crosstalk genes in HAP. Due to cytokines interleukin-1β (IL-1β) is considered to be the key mediators of HAP (49), and lipid metabolism related genes, such as ABCG1, etc., were the key to the transformation of macrophages into foam cells (50), hence we examined the expression levels of IL-1β, CXCL1, CCL3, CCL4, and ABCG1 in the three GEO datasets. Figures 10E–I shows that the expression levels of IL-1β, CXCL1, CCL3, CCL4, and ABCG1 were upregulated in all three GEO datasets.
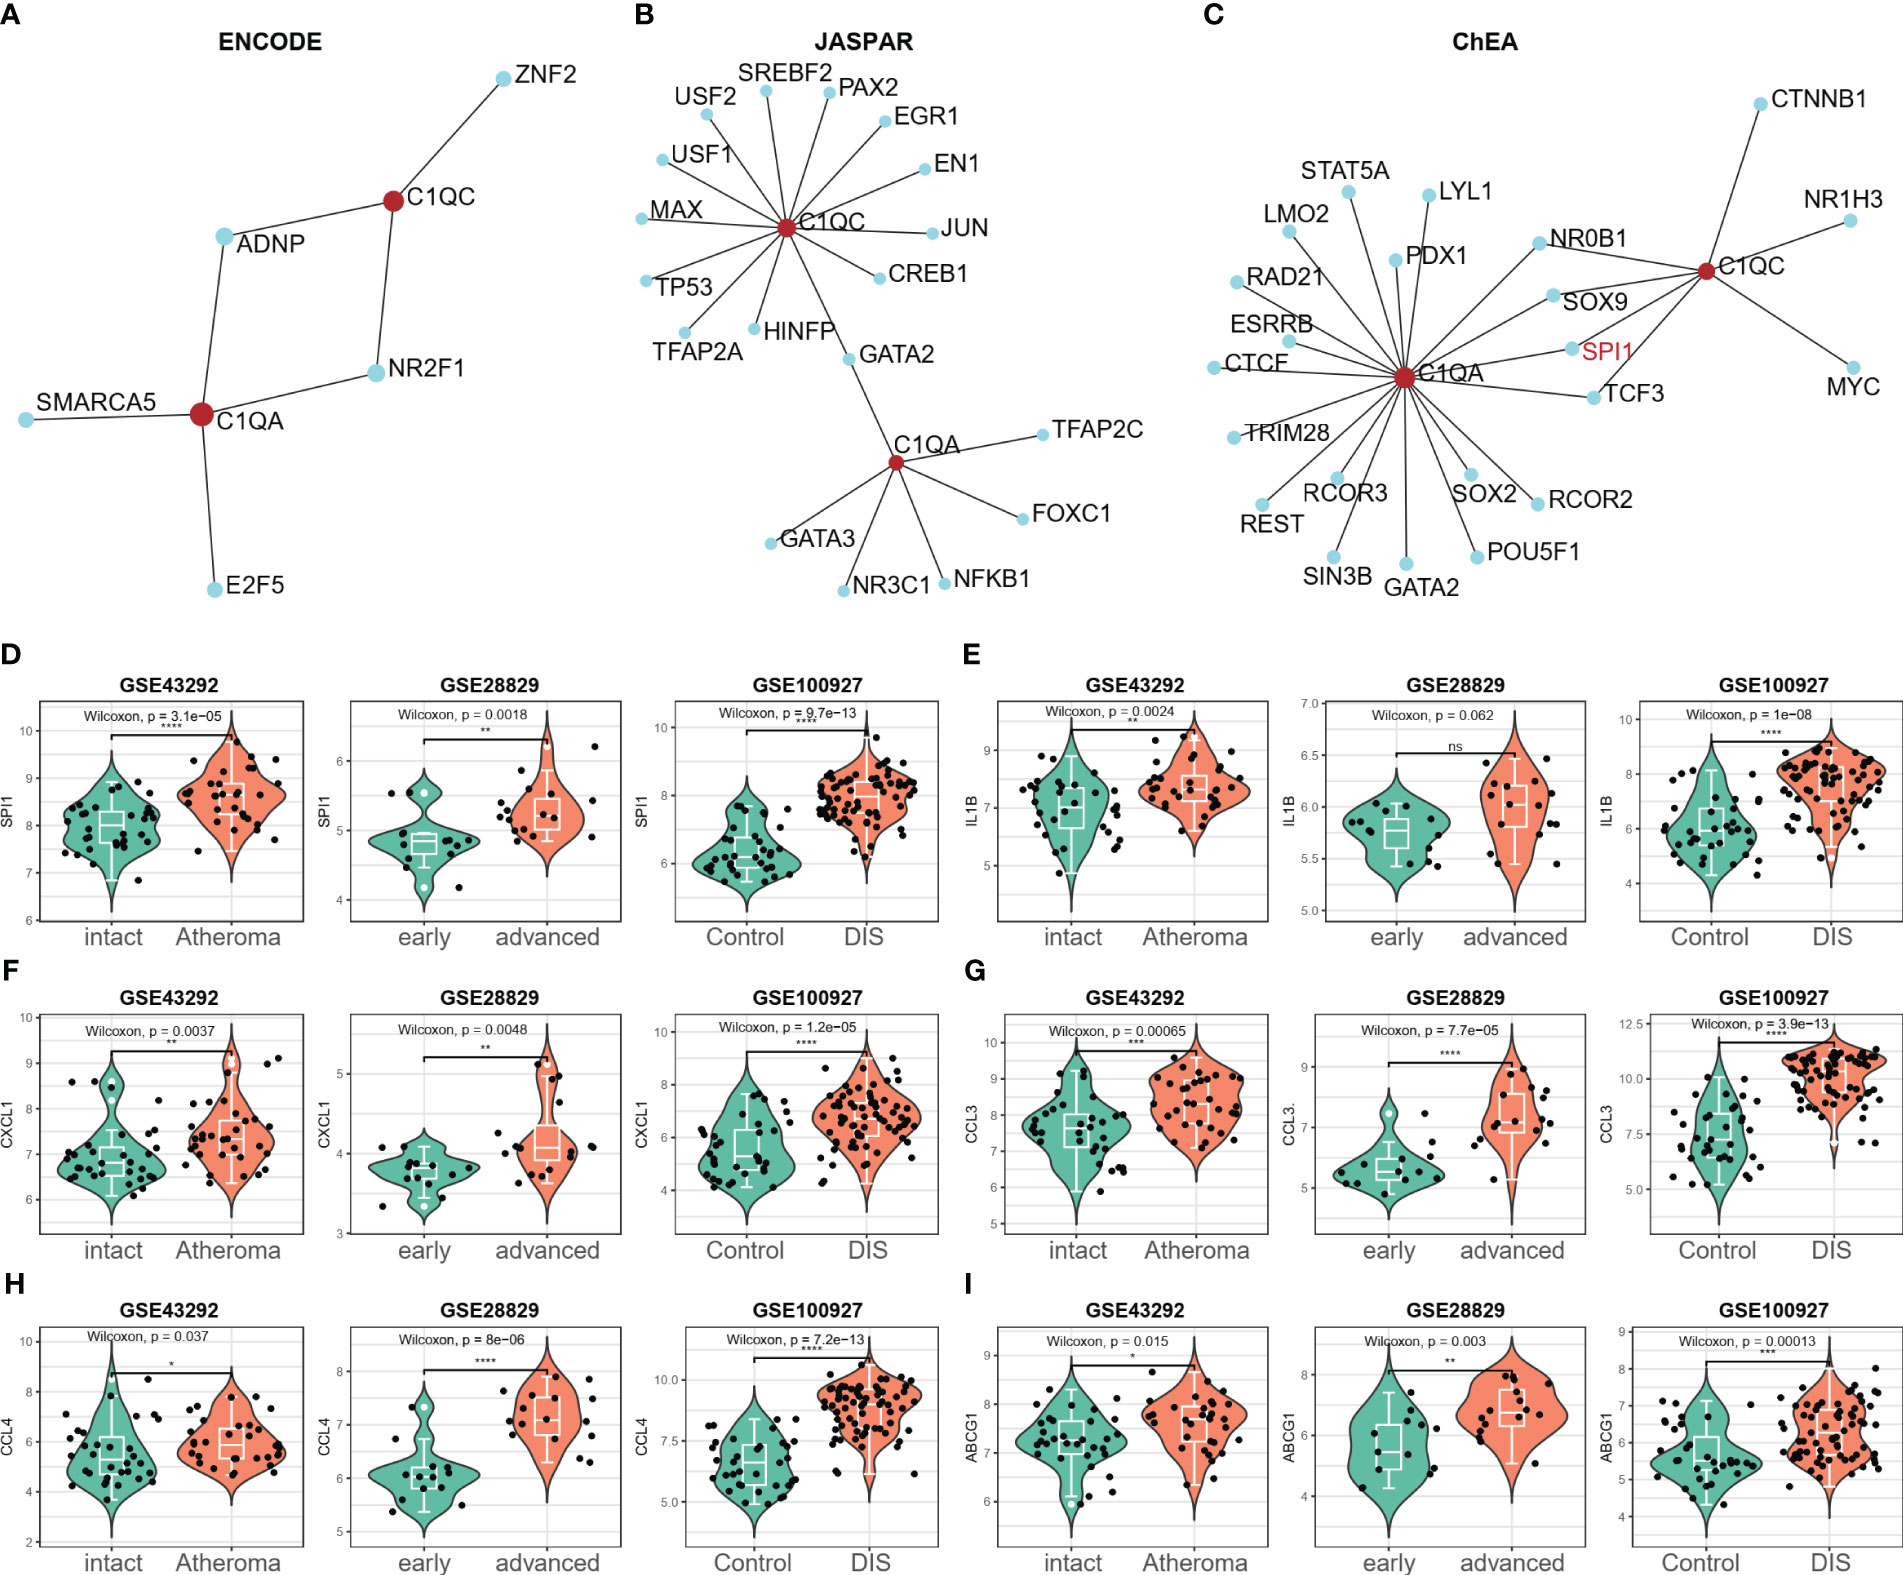
Figure 10 SPI1 was identified as a potential key TF in HAP. (A–C) The potential TFs that may regulate the C1QA and C1QC gene was screened from three databases (ENCODE, JASPAR and ChEA) via the NetworkAnalyst 3.0. (D) Only the expression of SPI1 significantly elevated in all the three GEO datasets (GSE43292, GSE28829 and GSE100927), and regarded as the potential TFs for C1QA and C1QC genes. (E–I) The expression of IL-1β, CXCL1, CCL3, CCL4 and ABCG1genes were upregulated in all the three GEO datasets.
To validate our diagnostic prediction model, we conducted in vitro and in vivo experiments to confirm the biological function of C1QA and C1QC. In vitro, we upregulated the mRNA expression of C1QA (Figure 11A), C1QC (Figure 11B) and SPI1 (Figure 11C) in the ox-LDL-treated RAW264.7 macrophages group compared to the control group (RAW264.7 macrophages group treated with normal saline).
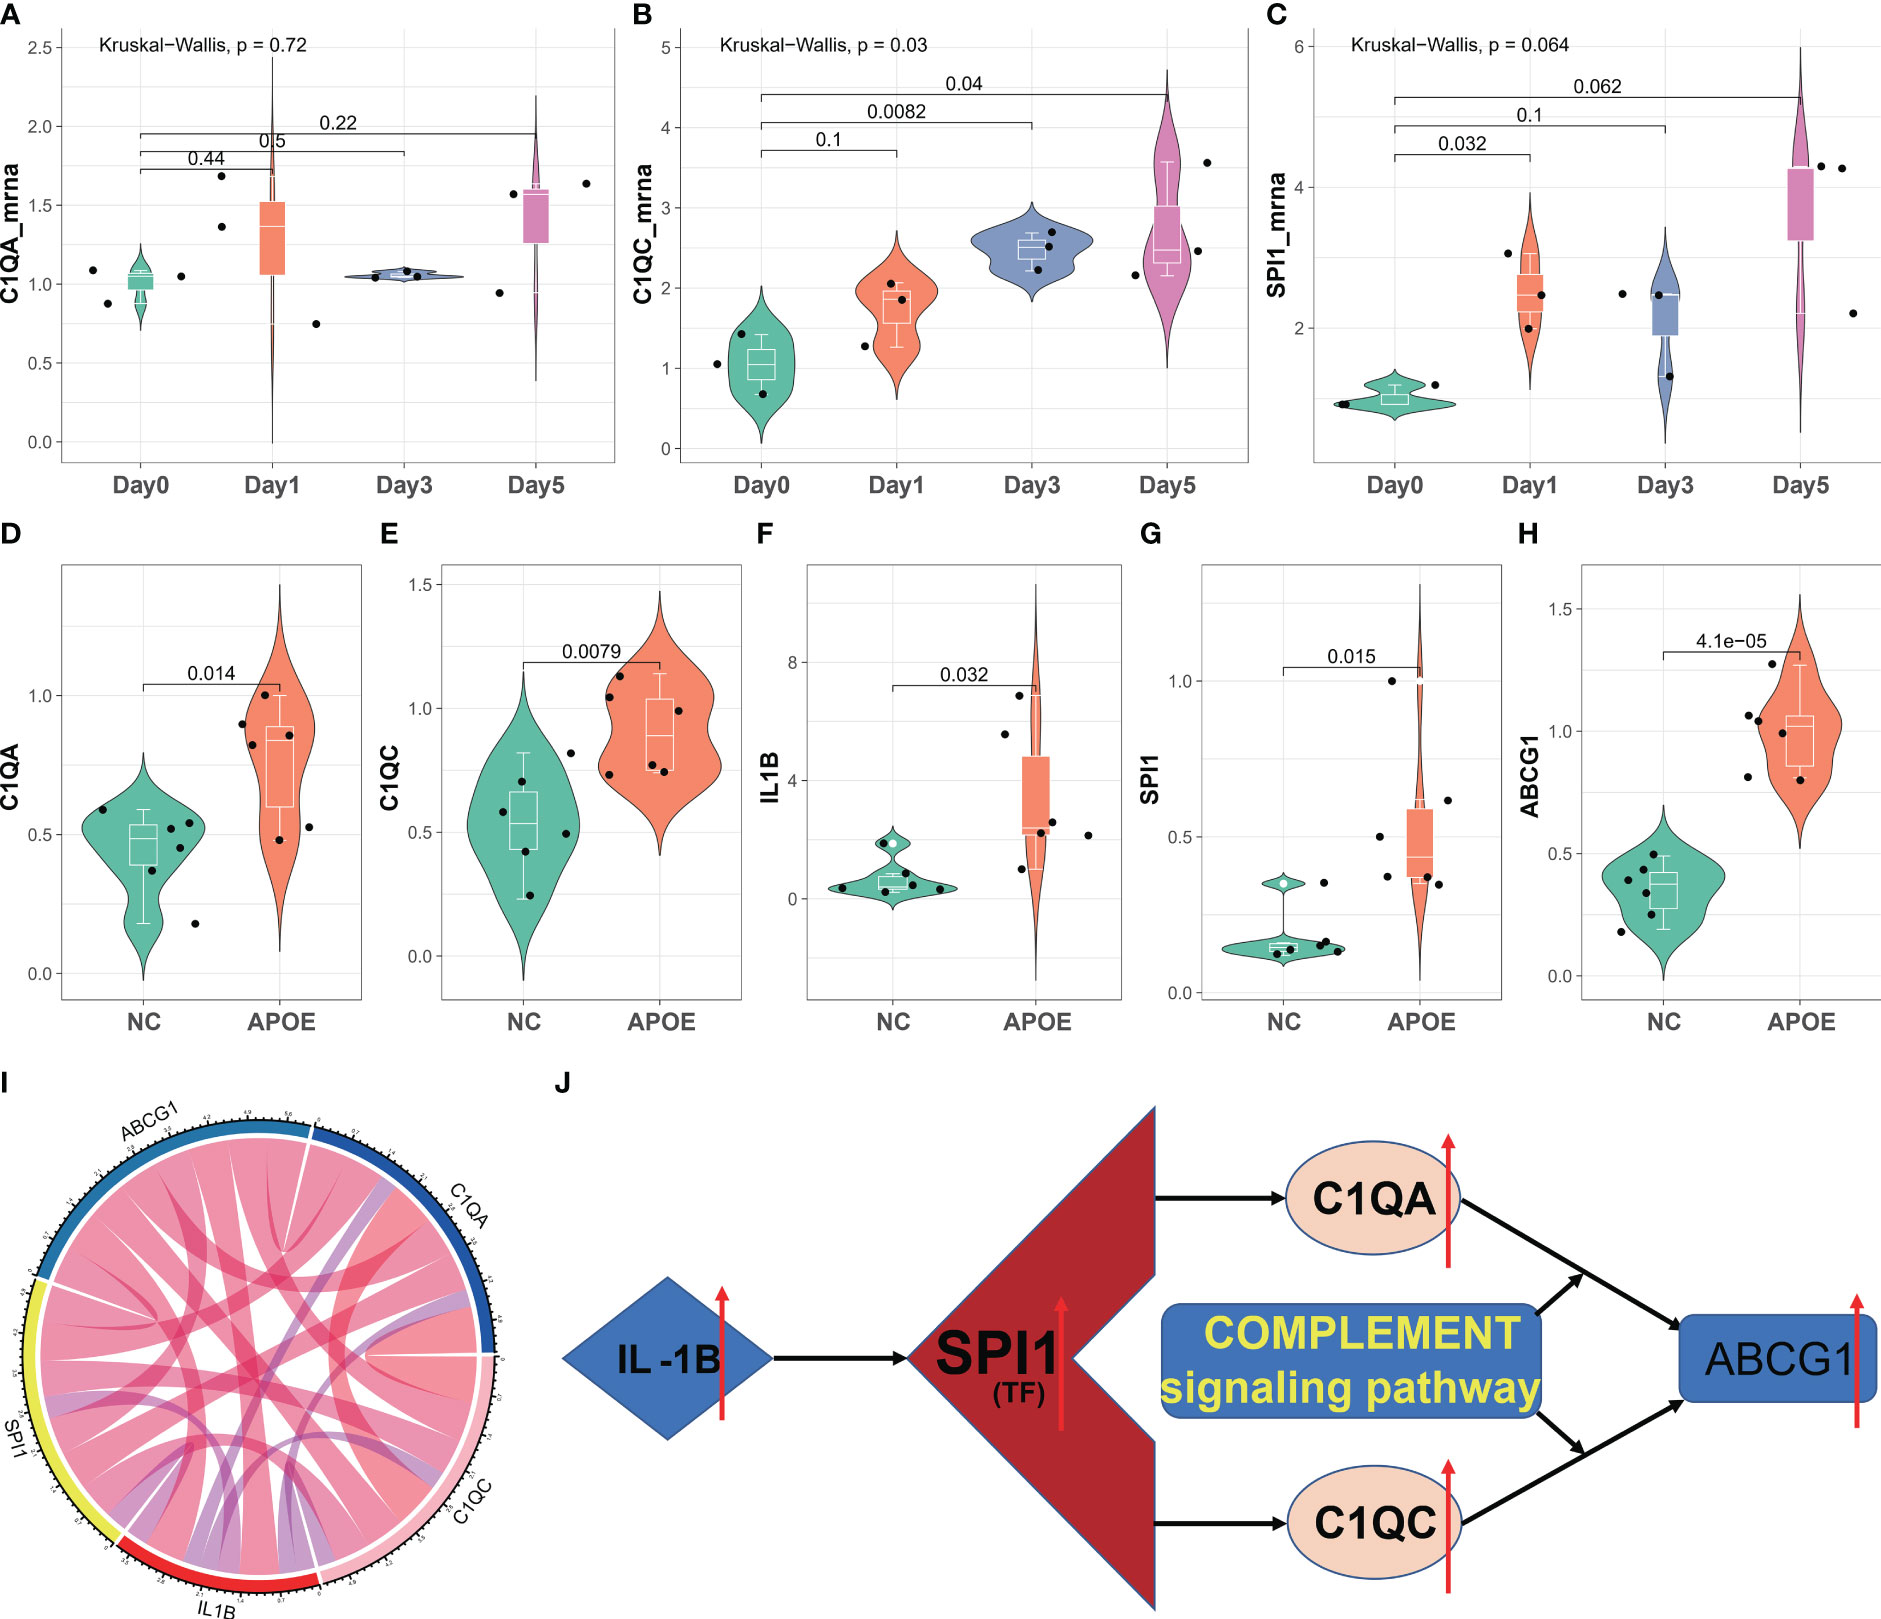
Figure 11 In vitro and in vivo validation of C1QA and C1QC. (A–C) Relative mRNA expression of C1QA and C1QC detected by real-time PCR in ox-LDL-treated RAW264.7 macrophages group and normal control group. (D–H) Relative mRNA expression value of C1QA, C1QC, IL1B, SPI1, and ABCG1 detected by real-time PCR in thoracic and abdominal arteries of apoE-/- mice and normal mice. (I) The five genes were positive correlated with each other. (J) The potential mechanism for HAP development regulated by the C1QA and C1QC genes.
The results of the in vivo study revealed that compared to healthy control mice, the expression of C1QA (Figure 11D) and C1QC (Figure 11E) genes were upregulated in the thoracic and abdominal arteries of apoE-/- mice, as confirmed by RT-qPCR. Additionally, the expression of IL1B (Figure 11F), SPI1 (Figure 11G), and ABCG1 (Figure 11H) genes also showed upregulation in the thoracic and abdominal arteries of the apoE-/- mice as compared to the healthy control mice. Moreover, these five genes displayed a positive correlation with each other (Figure 11I). These findings imply that C1QA and C1QC may promote the migration and proliferation of ABCG1 in macrophage cells. Based on the findings depicted in Figure 11J, it is postulated that SPI1 may augment the expression of IL1B, thereby inducing an upregulation of the C1QA and C1QC genes. This, in turn, results in the accumulation of ABCG1 genes within macrophages, leading to a reduction in foam cell formation and atheroma development. Ultimately, this mechanism confers protection against atherosclerosis, aligning with previously published research (51, 52).
In the two-way Mendelian randomization (MR) analysis, six single nucleotide polymorphisms (SNPs) were selected to investigate the relationship between C1Q as the exposure and ischemic stroke (specifically, large artery atherosclerosis) as the outcome. The findings from the analysis revealed significant results for the inverse variance weighted (IVW) method (odds ratio [OR] = 1.118, 95% confidence interval [CI] = 1.013 - 1.234, p-value = 0.027), MR-Egger method (OR = 0.863, 95%CI = 0.568 - 1.31, p-value = 0.527), and weighted median method (OR = 1.093, 95%CI = 0.964 - 1.24, p-value = 0.1665). These results suggest that individuals with C1Q are genetically predisposed to a 1.118 times higher risk of ischemic stroke compared to those without C1Q, indicating a positive association between C1Q and ischemic stroke (Table S9 and Figure 12). The Cochran’s Q report indicated the absence of heterogeneity among the independent variables (IVs) (Table S10, P>0.05), suggesting no heterogeneity among these IVs. The scatter plots in Figure 12A display the SNP effect sizes for C1Q and ischemic stroke (large artery atherosclerosis). The MR-Egger analysis revealed no evidence of horizontal pleiotropy (C1Q on risk of IS: intercept = 0.0641, P = 0.2795, Table S11 and Figure 12B). The leave-one-out analysis identified high-impact points in 83.3% (5/6) of SNPs (P < 0.05), indicating that the association between C1Q and IS was influenced by the collective action of multiple SNPs (Table S12 and Figure 12C). The results support a positive genetic relationship between C1Q and IS (large artery atherosclerosis).
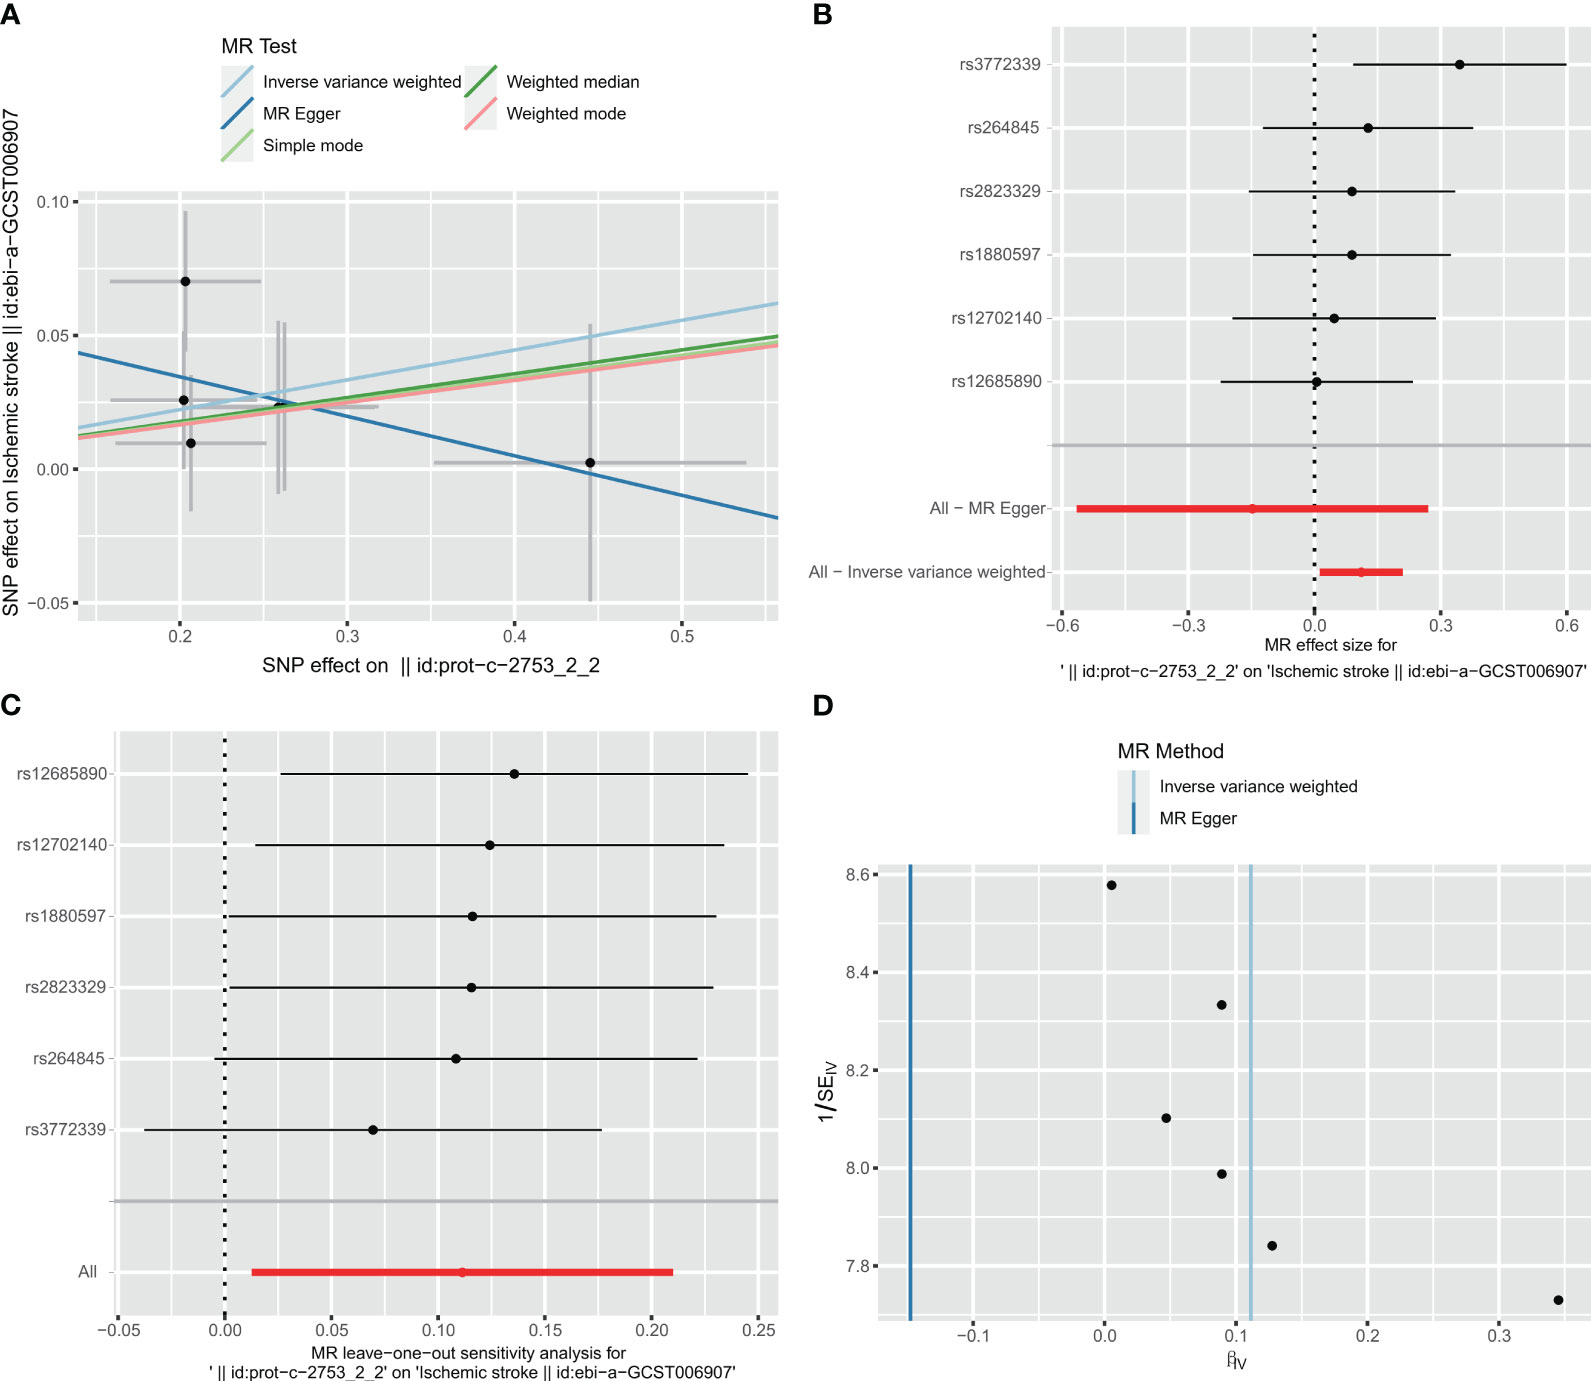
Figure 12 Visualization of the MR analysis of C1Q on ischemic stroke (IS). (A) Scatterplot of the MR analysis of the effect of C1Q on IS. (B) Forest plots of causal effects of C1Q-associated single nucleotide polymorphisms (SNPs) on IS. (C) Leave-one-out sensitivity analysis of the effect of C1Q on IS. (D) Funnel plot showed there were no significant heterogeneity among SNPs.
Taking IS (large artery atherosclerosis) as exposure and C1Q as outcome, a total of 77 single nucleotide polymorphisms (SNPs) were extracted for analysis. The results of the analysis using the inverse variance weighted (IVW) method showed an odds ratio (OR) of 0.827 with a 95% confidence interval (CI) of 0.626 – 1.092, and a p-value of 0.181. The MR-egger method yielded an OR of 0.697 with a 95% CI of 0.294 – 1.569, and a p-value of 0.4067. The weighted median method resulted in an OR of 0.773 with a 95% CI of 0.529 – 1.128, and a p-value of 0.1817. These findings indicate that there was no significant correlation between ischemic stroke and C1Q, as shown in Table S9 and Figure 13A. The Cochran’s Q report indicated the absence of heterogeneity among the independent variables (IVs) (Table S10, P>0.05), suggesting no heterogeneity among these IVs. The MR-Egger analysis revealed no evidence of horizontal pleiotropy (IS on risk of C1Q: intercept = 0.0338, P = 0.6462) (Table S11 and Figure 13B). The leave-one-out analysis results demonstrated no significant abnormalities (Table S12 and Figures 13C, D). Therefore, the findings do not support a reverse genetic relationship between C1Q and IS (large artery atherosclerosis).
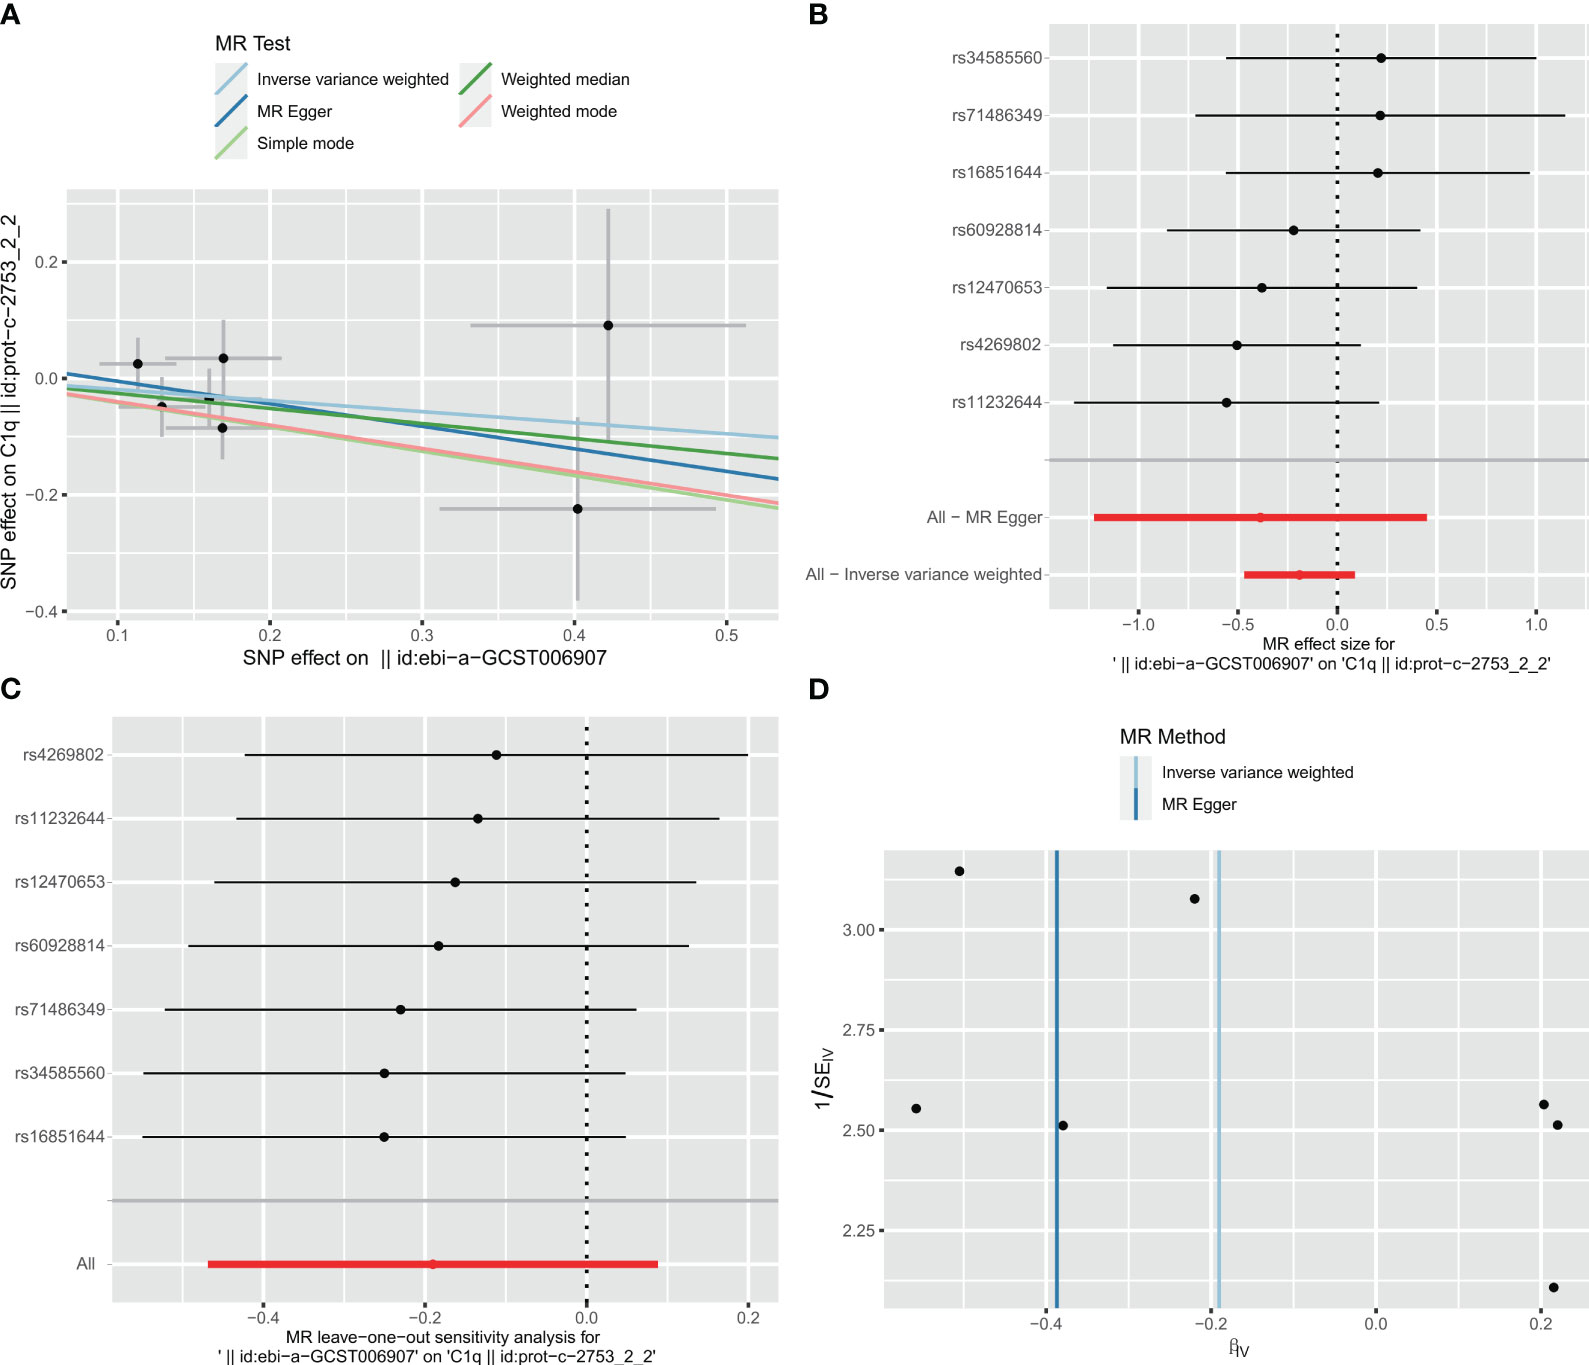
Figure 13 Visualization of the MR analysis of ischemic stroke (IS) on C1Q. (A) Scatterplot of the MR analysis of the effect of IS on C1Q. (B) Forest plots of causal effects of IS-associated single nucleotide polymorphisms (SNPs) on C1Q. (C) Leave-one-out sensitivity analysis of the effect of IS on C1Q. (D) Funnel plot showed there were no significant heterogeneity among SNPs.
Atherosclerotic lesions comprise cells generated by innate and adaptive immunity, which exert a substantial influence on the modulation of diverse immune cells during the evolution and advancement of atherosclerotic lesions (47). The utilization of scRNA-seq has facilitated the exploration of the molecular characteristics of immune cells infiltrating high plaque areas, as well as the roles of C1Q-related genes during the course of atherosclerosis. In the initial phase of this investigation, we performed scRNA-seq analysis of HAP and contiguous tissues to discern the subpopulations of cells present in HAP, and demonstrated the presence of C1Q cell cluster in HAP tissue. We then extracted the top 10 C1Q-related genes from C1Q cell cluster. We identified seven significant DEGs between AC and PA from scRNA-seq analysis. The GBM, LASSO and XGBoost algorithms were employed to create a diagnostic prediction model assigning GLM regression, which identified C1QA and C1QC as suitable C1Q hub genes for predicting the diagnosis of HAP. We further investigated SPI1 as a potential key transcription factor that regulates C1QA and C1QC in HAP and found that C1QA and C1QC were interdependent and activated by HALLMARK_COMPLEMENT signaling pathway. Furthermore, qPCR analysis confirmed the upregulated expression of C1QA, C1QC, SPI1, IL1B, and ABCG1 genes in the thoracic and abdominal arteries of apoE-/- mice. Finally, bidirectional mendelian randomization analysis conducted on the IEU open GWAS data revealed a positive correlation between C1Q and HAP (ischemic stroke (large artery atherosclerosis)). Upon successful validation, it is expected that the two hub genes associated with C1Q could serve as valuable diagnostic tools and provide guidance for the development of immunotherapeutic strategies in patients with HAP.
In the HAP, the scRNA-seq has found immune cells in plaques to be associated with cerebrovascular events (17, 19, 20, 22), while bioinformatics analyses have confirmed that immune cell infiltrations and immune-associated pathways (IAP) play a role in AP development (7–14). In this study, 8 of 12 cell clusters, including CT4+ T, CT8+ T, macrophages, monocytes, dendritic cells, B cells, mast cells and plasma cells, were immune cells from scRNA-seq analysis of GSE159677 data. In AC groups, immune cells represented more than 70% of the total cells, whereas in adjacent groups, they accounted for less than 45%. The GSEA showed that the most common signaling pathways, such as the immune signaling (INTERFERON_GAMMA_RESPONSE, IL6_JAK_STAT3_SIGNALING and IL2_STAT5_ SIGNALING), allograft rejection, the complement response, the inflammatory response, metabolism and glycolysis were enriched in HAP tissues. These observations unveil the pivotal part played by the immune system in the pathogenesis of atherosclerosis.
When compared with the adjacent tissues in GSE159677, we found that the proportion of T cells increased from 29.39% to 40.08%, while the percentage of macrophages increased from 5.17% to 17.94%. There was a remarkably high level of upregulation of both C1QA and C1QC across all scRNA-seq and bulk-RNA datasets observed as atherosclerosis progressed. The ROC curves showed that both C1QA and C1QC were able to distinguish HAP samples from adjacent/normal tissues. The findings of our study indicate that the immune marker genes we have identified may have significant implications in the pathogenesis of atherosclerosis. Conducting further research on the disease-associated molecular processes and immune cell regulation may facilitate the development of potential therapeutic interventions.
Figures 3A–C shows the scRNA-seq analysis results indicating that C1QA and C1QC were predominantly expressed in macrophages. Consistent with previous findings, Castellano G et al. have confirmed that dendritic cells derived from monocytes and macrophages are the main producers of C1Q (53). Therefore, our study’s two marker genes align with these prior observations. Given that macrophages constitute a major immune cell population in atherosclerosis (54, 55), with macrophages playing a significant role, we selected them for functional experiments at the cellular level.
C1Q, a classical component of the complement system, can perform immunological and non-immune functions, either complement-dependent or complement-independent (56). The complement system’s effects can be either beneficial or harmful, contingent upon the pathophysiological mechanisms at play, and in certain instances, it may cause tissue damage (57). Research has demonstrated that C1Q plays a protective role in the initial phases of neuronal injury and amyloid-induced neurotoxicity by suppressing inflammation (58). Additionally, during cholesterol ingestion, C1Q can promote macrophage survival and enhance foam cell efferocytosis function, suggesting a possible protective role in the early stages of atherosclerosis (59, 60).
Previous research has indicated a positive correlation between C1Q and coronary artery disease, with the potential for it to serve as a cardiovascular event indicator (61, 62). Our own investigation supports this finding, as heightened C1Q expression may significantly contribute to atherosclerotic plaque instability or rupture. Additionally, Chen LH et al. have proposed that groups exhibiting elevated levels of C1QA, C1QB, and C1QC display notably enriched signaling pathways associated with immune functions, such as allograft rejection, complement response, and inflammatory response (56). Our research revealed that C1QA and C1QC were significantly overexpressed in HAP and were also enriched in signaling pathways of allograft rejection, the complement response, and the inflammatory response. Additionally, we confirmed that macrophage-derived foam cells had overexpression in RAW264.7 macrophages treated with oxLDL. Therefore, the confirmed overexpression of C1QA and C1QC in atherosclerotic plaques indicated that these two markers are correlated with plaque macrophages.
Previous research has examined the correlation between HAP immune scores and diagnostic predictions for patients with TNFSF13B, CCL5, CCL19, ITGAL, CD14, GZMB, and BTK genes, which were utilized as predictive targets (9). For clinicians, the immune score is a reliable tool for predicting the progression of atherosclerotic plaques. In another comparable study, it was found that C1QA and ITGB2 could have pathogenic effects on the complete atherogenic process (13). In a recent study, Li et al (14) proposed five innovative diagnostic biomarkers for atherosclerosis based on oxidative stress and macrophage ferroptosis and confirmed them using GSE100927 and atherosclerosis tissues from animals. The primary theme in all three studies was the selection of hub genes utilizing the protein-protein interaction (PPI) network. The hub genes obtained may vary based on the datasets. In this study, we established hub genes on DEGs using scRNA-seq and two GEO datasets, which reduced the inconsistency in hub genes and improved the reliability of the outcomes. We obtained an AUC value similar to the three scholars with two immune genes (9, 13, 14).
It is remarkable that SPI1 might be the key transcription factor regulating the C1QA and C1QC genes in HAP pathology. As HAP progresses, IL1B and/or S100A8 are released (15, 63), inducing the growth of SPI1 and further upregulating C1QA and C1QC expression. As a consequence, excessive amounts of free cholesterol accumulate in macrophages as lipid droplets, leading to the formation of foam cells (high expression of ABCG1, etc.) (64–66). Our study showed that C1QA, C1QC, SPI1, IL1B, and ABCG1 expressions were all upregulated, not only in GEO datasets but also in apoE-/- mice thoracic and abdominal arteries. The elevated SPI1, stimulated by inflammatory cytokines, increases C1QA and C1QC, which ultimately leads to the formation of foam cells in macrophages. The hypothesis needs to be tested further with basic cellular and animal experiments. Additionally, we observed that the expression of C1QA and C1QC genes was positively correlated with the HALLMARK_COMPLEMENT signaling pathway in the analysis of three GEO datasets. Therefore, SPI1 may be upregulating C1QA and C1QC through the HALLMARK_COMPLEMENT pathway.
Our study has demonstrated an association between C1Q and an increased risk of HAP; however, Mendelian randomization studies do not provide supporting evidence for this relationship. To address this issue, biodirectional Mendelian randomization (MR) utilizing data from genome-wide association studies (GWAS) was employed to evaluate causality in a potential exposure-outcome pathway. In this particular investigation, C1Q was considered as the exposure variable, while ischemic stroke (specifically large artery atherosclerosis) was utilized as the outcome measure in place of HAP. To our surprise, the initial findings of the study revealed a statistically significant positive association between C1Q and IS, as indicated by the forward results (IVW: OR = 1.118, 95%CI = 1.013 -1.234, P = 0.027). This suggests that there is a genetic risk associated with C1Q and IS. Additionally, the leave-one-out analysis demonstrated that certain SNPs in C1Q have a substantial impact on IS (83.3% (5/6), P < 0.05). However, upon conducting a reverse MR analysis using the IVW and leave-one-out results, it was determined that there is no significant correlation between IS and C1Q. Despite this, the evidence gathered supports a positive genetic association between C1Q and IS, specifically in cases of large artery atherosclerosis.
Despite the identification of characteristic atherosclerotic plaque progression- and immune-associated genes through machine learning algorithms, which have been confirmed to be diagnostically effective in external datasets, this study is subject to certain limitations. In order to investigate the potential of these genes in predicting the progression of atherosclerotic plaques, prospective cohorts will need to be conducted. Additionally, to gain a more comprehensive understanding of the mechanisms underlying these characteristic genes, further experimentation is necessary. Ultimately, further studies are warranted to clarify the underlying mechanisms. Finally, the statistical measure of genetic aggregation constrains the analytical scope, while also accounting for interindividual variations.
In conclusion, our research has effectively established and validated a unique diagnostic signature comprising two C1Q-related marker genes by employing both single-cell and bulk RNA sequencing techniques. Furthermore, the utilization of MR analysis has confirmed a positive correlation between C1Q and HAP (ischemic stroke (large artery atherosclerosis)). The aforementioned signature exhibits considerable promise as a diagnostic biomarker and has the potential to enhance the prognostication of atherosclerosis progression. Additionally, our research has yielded valuable insights into the importance of C1Q-related hub genes in diagnosing and predicting the response to immunotherapy in patients with HAP.
The datasets presented in this study can be found in online repositories. The names of the repository/repositories and accession number(s) can be found in the article/Supplementary Material.
The animal studies were approved by Shanghai Sixth People’s Hospital Affiliated to Shanghai Jiao Tong University School of Medicine. The studies were conducted in accordance with the local legislation and institutional requirements. Written informed consent was obtained from the owners for the participation of their animals in this study.
HC: Software, Writing – original draft, Writing – review & editing. CT: Writing – review & editing. YG: Data curation, Resources, Methodology, Writing – original draft. ZL: Data curation, Resources, Writing – review & editing. JZ: Writing – review & editing, Data curation, Investigation, Resources. YL: Formal Analysis, Software, Writing – review & editing.
The author(s) declare that no financial support was received for the research, authorship, and/or publication of this article.
We thank Dr. Jian-Ming Zeng (University of Macau), and all the members of his bioinformatics team, biotrainee, for generously sharing their experience and codes. We thank Home for Researchers editorial team (www.home-forresearchers.com) for language editing service.
The authors declare that the research was conducted in the absence of any commercial or financial relationships that could be construed as a potential conflict of interest.
All claims expressed in this article are solely those of the authors and do not necessarily represent those of their affiliated organizations, or those of the publisher, the editors and the reviewers. Any product that may be evaluated in this article, or claim that may be made by its manufacturer, is not guaranteed or endorsed by the publisher.
The Supplementary Material for this article can be found online at: https://www.frontiersin.org/articles/10.3389/fimmu.2023.1289223/full#supplementary-material
1. Stary HC, Chandler AB, Dinsmore RE, Fuster V, Glagov S, Insull W Jr, et al. A definition of advanced types of atherosclerotic lesions and a histological classification of atherosclerosis. A report from the Committee on Vascular Lesions of the Council on Arteriosclerosis, American Heart Association. Circulation (1995) 92(5):1355–74. doi: 10.1161/01.cir.92.5.1355
2. Geovanini GR, Libby P. Atherosclerosis and inflammation: overview and updates. Clin Sci (Lond) (2018) 132(12):1243–52. doi: 10.1042/CS20180306
3. Libby P, Lichtman AH, Hansson GK. Immune effector mechanisms implicated in atherosclerosis: from mice to humans. Immunity (2013) 38(6):1092–104. doi: 10.1016/j.immuni.2013.06.009
4. Bentzon JF, Otsuka F, Virmani R, Falk E. Mechanisms of plaque formation and rupture. Circ Res (2014) 114(12):1852–66. doi: 10.1161/CIRCRESAHA.114.302721
5. Chang HJ, Lin FY, Lee SE, Andreini D, Bax J, Cademartiri F, et al. Coronary atherosclerotic precursors of acute coronary syndromes. J Am Coll Cardiol (2018) 71(22):2511–22. doi: 10.1016/j.jacc.2018.02.079
6. Lenz T, Nicol P, Castellanos MI, Engel LC, Lahmann AL, Alexiou C, et al. Small dimension-big impact! Nanoparticle-enhanced non-invasive and intravascular molecular imaging of atherosclerosis in vivo. Molecules (2020) 25(5):1029. doi: 10.3390/molecules25051029
7. Wang L, Gao B, Wu M, Yuan W, Liang P, Huang J. Profiles of immune cell infiltration in carotid artery atherosclerosis based on gene expression data. Front Immunol (2021) 12:599512. doi: 10.3389/fimmu.2021.599512
8. Huo TM, Wang ZW. Comprehensive analysis to identify key genes involved in advanced atherosclerosis. Dis Markers (2021) 2021:4026604. doi: 10.1155/2021/4026604
9. Yang Y, Yi X, Cai Y, Zhang Y, Xu Z. Immune-associated gene signatures and subtypes to predict the progression of atherosclerotic plaques based on machine learning. Front Pharmacol (2022) 13:865624. doi: 10.3389/fphar.2022.865624
10. Liu C, Zhang H, Chen Y, Wang S, Chen Z, Liu Z, et al. Identifying RBM47, HCK, CD53, TYROBP, and HAVCR2 as hub genes in advanced atherosclerotic plaques by network-based analysis and validation. Front Genet (2021) 11:602908. doi: 10.3389/fgene.2020.602908
11. Tan L, Xu Q, Shi R, Zhang G. Bioinformatics analysis reveals the landscape of immune cell infiltration and immune-related pathways participating in the progression of carotid atherosclerotic plaques. Artif Cells Nanomed Biotechnol (2021) 49(1):96–107. doi: 10.1080/21691401.2021.1873798
12. Gao J, Shi L, Gu J, Zhang D, Wang W, Zhu X, et al. Difference of immune cell infiltration between stable and unstable carotid artery atherosclerosis. J Cell Mol Med (2021) 25(23):10973–9. doi: 10.1111/jcmm.17018
13. Xu J, Chen C, Yang Y. Identification and validation of candidate gene module along with immune cells infiltration patterns in atherosclerosis progression to plaque rupture via transcriptome analysis. Front Cardiovasc Med (2022) 9:894879. doi: 10.3389/fcvm.2022.894879
14. Li M, Xin S, Gu R, Zheng L, Hu J, Zhang R, et al. Novel diagnostic biomarkers related to oxidative stress and macrophage ferroptosis in atherosclerosis. Oxid Med Cell Longev (2022) 2022:8917947. doi: 10.1155/2022/8917947
15. Tabas I, Bornfeldt KE. Macrophage phenotype and function in different stages of atherosclerosis. Circ Res (2016) 118(4):653–67. doi: 10.1161/CIRCRESAHA.115.306256
16. Benjamin EJ, Blaha MJ, Chiuve SE, Cushman M, Das SR, Deo R, et al. Heart disease and stroke statistics-2017 update: A report from the american heart association. Circulation (2017) 135(10):e146–603. doi: 10.1161/CIR.0000000000000485
17. Fernandez DM, Rahman AH, Fernandez NF, Chudnovskiy A, Amir ED, Amadori L, et al. Single-cell immune landscape of human atherosclerotic plaques. Nat Med (2019) 25(10):1576–88. doi: 10.1038/s41591-019-0590-4
18. Saigusa R, Winkels H, Ley K. T cell subsets and functions in atherosclerosis. Nat Rev Cardiol (2020) 17(7):387–401. doi: 10.1038/s41569-020-0352-5
19. Depuydt MAC, Prange KHM, Slenders L, Örd T, Elbersen D, Boltjes A, et al. Microanatomy of the human atherosclerotic plaque by single-cell transcriptomics. Circ Res (2020) 127(11):1437–55. doi: 10.1161/CIRCRESAHA.120.316770
20. Winkels H, Ehinger E, Vassallo M, Buscher K, Dinh HQ, Kobiyama K, et al. Atlas of the immune cell repertoire in mouse atherosclerosis defined by single-cell RNA-sequencing and mass cytometry. Circ Res (2018) 122(12):1675–88. doi: 10.1161/CIRCRESAHA.117.312513
21. Lin JD, Nishi H, Poles J, Niu X, Mccauley C, Rahman K, et al. Single-cell analysis of fate-mapped macrophages reveals heterogeneity, including stem-like properties, during atherosclerosis progression and regression. JCI Insight (2019) 4(4):e124574. doi: 10.1172/jci.insight.124574
22. Cochain C, Vafadarnejad E, Arampatzi P, Pelisek J, Winkels H, Ley K, et al. Single-cell RNA-seq reveals the transcriptional landscape and heterogeneity of aortic macrophages in murine atherosclerosis. Circ Res (2018) 122(12):1661–74. doi: 10.1161/CIRCRESAHA.117.312509
23. Cheng CK, Lin X, Pu Y, Tse JKY, Wang Y, Zhang CL, et al. SOX4 is a novel phenotypic regulator of endothelial cells in atherosclerosis revealed by single-cell analysis. J Adv Res (2023) 43:187–203. doi: 10.1016/j.jare.2022.02.017
24. Revel M, Sautès-Fridman C, Fridman WH, Roumenina LT. C1q+ macrophages: passengers or drivers of cancer progression. Trends Cancer (2022) 8(7):517–26. doi: 10.1016/j.trecan.2022.02.006
25. Bulla R, Tripodo C, Rami D, Ling GS, Agostinis C, Guarnotta C, et al. C1q acts in the tumor microenvironment as a cancer-promoting factor independently of complement activation. Nat Commun (2016) 7:10346. doi: 10.1038/ncomms10346
26. Tu J, Wang D, Zheng X, Liu B. Single-cell RNA datasets and bulk RNA datasets analysis demonstrated C1Q+ tumor-associated macrophage as a major and antitumor immune cell population in osteosarcoma. Front Immunol (2023) 14. doi: 10.3389/fimmu
27. Li X, Zhang Q, Chen G, Luo D. Multi-omics analysis showed the clinical value of gene signatures of C1QC+ and SPP1+ TAMs in cervical cancer. Front Immunol (2021) 12:694801. doi: 10.3389/fimmu.2021.694801
28. Gu Y, Jin Q, Hu J, Wang X, Yu W, Wang Z, et al. Causality of genetically determined metabolites and metabolic pathways on osteoarthritis: a two-sample mendelian randomization study. J Transl Med (2023) 21(1):357. doi: 10.1186/s12967-023-04165-9
29. Xiao G, He Q, Liu L, Zhang T, Zhou M, Li X, et al. Causality of genetically determined metabolites on anxiety disorders: a two-sample Mendelian randomization study. J Transl Med (2022) 20(1):475. doi: 10.1186/s12967-022-03691-2
30. Li Y, Guo J, Cao Z, Wu J. Causal association between inflammatory bowel disease and psoriasis: A two-sample bidirectional mendelian randomization study. Front Immunol (2022) 13:916645. doi: 10.3389/fimmu.2022.916645
31. Wang Y, Wang X, Gu X, Pan J, Ouyang Z, Lin W, et al. Evidence for a causal association between psoriasis and psychiatric disorders using a bidirectional Mendelian randomization analysis in up to 902,341 individuals. J Affect Disord (2023) 337:27–36. doi: 10.1016/j.jad.2023.05.059
32. Li Y, Liu H, Ye S, Zhang B, Li X, Yuan J, et al. The effects of coagulation factors on the risk of endometriosis: a Mendelian randomization study. BMC Med (2023) 21(1):195. doi: 10.1186/s12916-023-02881-z
33. Döring Y, Manthey HD, Drechsler M, Lievens D, Megens RT, Soehnlein O, et al. Auto-antigenic protein-DNA complexes stimulate plasmacytoid dendritic cells to promote atherosclerosis. Circulation (2012) 125(13):1673–83. doi: 10.1161/CIRCULATIONAHA.111.046755
34. Ayari H, Bricca G. Identification of two genes potentially associated in iron-heme homeostasis in human carotid plaque using microarray analysis. J Biosci (2013) 38(2):311–5. doi: 10.1007/s12038-013-9310-2
35. Lee K, Santibanez-Koref M, Polvikoski T, Birchall D, Mendelow AD, Keavney B. Increased expression of fatty acid binding protein 4 and leptin in resident macrophages characterizes atherosclerotic plaque rupture. Atherosclerosis (2013) 226(1):74–81. doi: 10.1016/j.atherosclerosis.2012.09.037
36. Steenman M, Espitia O, Maurel B, Guyomarch B, Heymann MF, Pistorius MA, et al. Identification of genomic differences among peripheral arterial beds in atherosclerotic and healthy arteries. Sci Rep (2018) 8(1):3940. doi: 10.1038/s41598-018-22292-y
37. Aran D, Looney AP, Liu L, Wu E, Fong V, Hsu A, et al. Reference-based analysis of lung single-cell sequencing reveals a transitional profibrotic macrophage. Nat Immunol (2019) 20(2):163–72. doi: 10.1038/s41590-018-0276-y
38. Wu T, Hu E, Xu S, Chen M, Guo P, Dai Z, et al. clusterProfiler 4.0: A universal enrichment tool for interpreting omics data. Innovation (Camb) (2021) 2(3):100141. doi: 10.1016/j.xinn.2021.100141
39. Hänzelmann S, Castelo R, Guinney J. GSVA: gene set variation analysis for microarray and RNA-seq data. BMC Bioinf (2013) 14:7. doi: 10.1186/1471-2105-14-7
40. Liberzon A. A description of the molecular signatures database (MSigDB) web site. Stem Cell Transcriptional Networks: Springer (2014) 1150:153–60. doi: 10.1007/978-1-4939-0512-6_9
41. Mariathasan S, Turley SJ, Nickles D, Castiglioni A, Yuen K, Wang Y, et al. TGFβ attenuates tumour response to PD-L1 blockade by contributing to exclusion of T cells. Nature (2018) 554(7693):544–8. doi: 10.1038/nature25501
42. Bindea G, Mlecnik B, Tosolini M, Kirilovsky A, Waldner M, Obenauf AC, et al. Spatiotemporal dynamics of intratumoral immune cells reveal the immune landscape in human cancer. Immunity (2013) 39(4):782–95. doi: 10.1016/j.immuni.2013.10.003
43. Thorsson V, Gibbs DL, Brown SD, Wolf D, Bortone DS, Ou Yang TH, et al. The immune landscape of cancer. Immunity (2018) 48(4):812–30. doi: 10.1016/j.immuni.2018.03.023
44. Chen Z, Chen R, Ou Y, Lu J, Jiang Q, Liu G, et al. Construction of an HLA classifier for early diagnosis, prognosis, and recognition of immunosuppression in sepsis by multiple transcriptome datasets. Front Physiol (2022) 13:870657. doi: 10.3389/fphys.2022.870657
45. Li W, Hong T, Fang J, Liu W, Liu Y, He C, et al. Incorporation of a machine learning pathological diagnosis algorithm into the thyroid ultrasound imaging data improves the diagnosis risk of Malignant thyroid nodules. Front Oncol (2022) 12:968784. doi: 10.3389/fonc.2022.968784
46. Li S, Gao Y, Ma K, Li Y, Liu C, Yan Y, et al. Lipid-related protein NECTIN2 is an important marker in the progression of carotid atherosclerosis: An intersection of clinical and basic studies. J Transl Int Med (2021) 9(4):294–306. doi: 10.2478/jtim-2021-0044
47. Tong W, Hui H, Shang W, Zhang Y, Tian F, Ma Q, et al. Highly sensitive magnetic particle imaging of vulnerable atherosclerotic plaque with active myeloperoxidase-targeted nanoparticles. Theranostics (2021) 11(2):506–21. doi: 10.7150/thno.49812
48. Lenz M, Kaun C, Krychtiuk KA, Haider P, Brekalo M, Maier N, et al. Effects of nicorandil on inflammation, apoptosis and atherosclerotic plaque progression. Biomedicines (2021) 9(2):120. doi: 10.3390/biomedicines9020120
49. Duewell P, Kono H, Rayner KJ, Sirois CM, Vladimer G, Bauernfeind FG, et al. NLRP3 inflammasomes are required for atherogenesis and activated by cholesterol crystals. Nature (2010) 464(7293):1357–61. doi: 10.1038/nature08938
50. Song Z, Lv S, Wu H, Qin L, Cao H, Zhang B, et al. Identification of foam cell biomarkers by microarray analysis. BMC Cardiovasc Disord (2020) 20(1):211. doi: 10.1186/s12872-020-01495-0
51. Cui K, Gao X, Wang B, Wu H, Arulsamy K, Dong Y, et al. Epsin nanotherapy regulates cholesterol transport to fortify atheroma regression. Circ Res (2023) 132(1):e22–42. doi: 10.1161/CIRCRESAHA.122.321723
52. Out R, Hoekstra M, Meurs I, de Vos P, Kuiper J, Van Eck M, et al. Total body ABCG1 expression protects against early atherosclerotic lesion development in mice. Arterioscler Thromb Vasc Biol (2007) 27(3):594–9. doi: 10.1161/01.ATV.0000257136.24308.0c
53. Castellano G, Woltman AM, Nauta AJ, Roos A, Trouw LA, Seelen MA, et al. Maturation of dendritic cells abrogates C1q production in vivo and in vitro. Blood (2004) 103(10):3813–20. doi: 10.1182/blood-2003-09-3046
54. Colin S, Chinetti-Gbaguidi G, Staels B. Macrophage phenotypes in atherosclerosis. Immunol Rev (2014) 262(1):153–66. doi: 10.1111/imr.12218
55. Barrett TJ. Macrophages in atherosclerosis regression. Arterioscler Thromb Vasc Biol (2020) 40(1):20–33. doi: 10.1161/ATVBAHA.119.312802
56. Chen LH, Liu JF, Lu Y, He XY, Zhang C, Zhou HH. Complement C1q (C1qA, C1qB, and C1qC) may be a potential prognostic factor and an index of tumor microenvironment remodeling in osteosarcoma. Front Oncol (2021) 11:642144. doi: 10.3389/fonc.2021.642144
57. van Beek J, Elward K, Gasque P. Activation of complement in the central nervous system: roles in neurodegeneration and neuroprotection. Ann N Y Acad Sci (2003) 992:56–71. doi: 10.1111/j.1749-6632.2003.tb03138.x
58. Tenner AJ, Fonseca MI. The Double-Edged Flower: roles of complement protein C1q in neurodegenerative diseases. In: Lambris JD, editor. Current topics in complement, vol. 586 . California: Springer (2006). p. 153–76.
59. Pulanco MC, Cosman J, Ho MM, Huynh J, Fing K, Turcu J, et al. Complement protein C1q enhances macrophage foam cell survival and efferocytosis. J Immunol (2017) 198(1):472–80. doi: 10.4049/jimmunol.1601445
60. Bhatia VK, Yun S, Leung V, Grimsditch DC, Benson GM, Botto MB, et al. Complement C1q reduces early atherosclerosis in low-density lipoprotein receptor-deficient mice. Am J Pathol (2007) 170(1):416–26. doi: 10.2353/ajpath.2007.060406
61. Guo S, Mao X, Li X, Ouyang H, Gao Y, Ming L. Serum complement C1q activity is associated with obstructive coronary artery disease. Front Cardiovasc Med (2021) 8:618173. doi: 10.3389/fcvm.2021.618173
62. Sasaki S, Nishihira K, Yamashita A, Fujii T, Onoue K, Saito Y, et al. Involvement of enhanced expression of classical complement C1q in atherosclerosis progression and plaque instability: C1q as an indicator of clinical outcome. PloS One (2022) 17(1):e0262413. doi: 10.1371/journal.pone.0262413
63. Kong P, Cui ZY, Huang XF, Zhang DD, Guo RJ, Han M. Inflammation and atherosclerosis: signaling pathways and therapeutic intervention. Signal Transduct Target Ther (2022) 7(1):131. doi: 10.1038/s41392-022-00955-7
64. Li J, Meng Q, Fu Y, Yu X, Ji T, Chao Y, et al. Novel insights: Dynamic foam cells derived from the macrophage in atherosclerosis. J Cell Physiol (2021) 236(9):6154–67. doi: 10.1002/jcp.30300
65. Liu Z, Zhu H, Dai X, Wang C, Ding Y, Song P, et al. Macrophage liver kinase B1 inhibits foam cell formation and atherosclerosis. Circ Res (2017) 121(9):1047–57. doi: 10.1161/CIRCRESAHA.117.311546
Keywords: atherosclerotic plaque (AP), ScRNA-seq, Mendelian randomization (MR), complement component 1q (C1q), LASSO
Citation: Cui H-K, Tang C-J, Gao Y, Li Z-A, Zhang J and Li Y-D (2023) An integrative analysis of single-cell and bulk transcriptome and bidirectional mendelian randomization analysis identified C1Q as a novel stimulated risk gene for Atherosclerosis. Front. Immunol. 14:1289223. doi: 10.3389/fimmu.2023.1289223
Received: 20 September 2023; Accepted: 05 December 2023;
Published: 21 December 2023.
Edited by:
Zhichao Fan, UCONN Health, United StatesReviewed by:
Marco Orecchioni, Augusta University, United StatesCopyright © 2023 Cui, Tang, Gao, Li, Zhang and Li. This is an open-access article distributed under the terms of the Creative Commons Attribution License (CC BY). The use, distribution or reproduction in other forums is permitted, provided the original author(s) and the copyright owner(s) are credited and that the original publication in this journal is cited, in accordance with accepted academic practice. No use, distribution or reproduction is permitted which does not comply with these terms.
*Correspondence: Hong-Kai Cui, Y2hrLTE5ODBAMTYzLmNvbQ==; Yong-Dong Li, ZHJfbGl5b25nZG9uZ0BzaW5hLmNvbQ==
†These authors have contributed equally to this work
Disclaimer: All claims expressed in this article are solely those of the authors and do not necessarily represent those of their affiliated organizations, or those of the publisher, the editors and the reviewers. Any product that may be evaluated in this article or claim that may be made by its manufacturer is not guaranteed or endorsed by the publisher.
Research integrity at Frontiers

Learn more about the work of our research integrity team to safeguard the quality of each article we publish.