 Maria Maddalena Angioni1,2*
 Alberto Floris1,2
 Ignazio Cangemi1
 Mattia Congia1,2
 Elisabetta Chessa1,2
 Micaela Rita Naitza1
 Matteo Piga1,2Alberto Cauli1,2
- 1Department of Medical Science and Public Health, University of Cagliari, Cagliari, Italy
- 2Rheumatology Unit, Azienda Ospedaliero - Universitaria di Cagliari, Cagliari, Italy
Background: In psoriatic arthritis (PsA), the primary goal of treatment is clinical remission. This study aimed to characterize the molecular profile underlying the induced clinical remission in patients with PsA, comparing the remission state and the healthy condition.
Methods: Whole blood transcriptomic analysis was performed on groups of 14 PsA patients in TNFi-induced clinical remission (DAPSA ≤ 4), 14 PsA patients with active disease (DAPSA > 14), and 14 healthy controls (HCs). Then, all differentially expressed genes (DEGs) derived from remission vs. HC comparison were analyzed for functional and biological characteristics by bioinformatics software. The gene expression of 12 genes was then validated by RT-qPCR in an extended cohort of 39 patients in clinical remission, 40 with active disease, and 40 HCs.
Results: The transcriptomic analysis of PsA remission vs. HCs highlighted the presence of 125 DEGs, and out of these genes, 24 were coding genes and showed a great involvement in immune system processes and a functional network with significant interactions. The RT-qPCR validation confirming the down- and upregulation of FOS (FC −2.0; p 0.005) and CCDC50 (FC +1.5; p 0.005) genes, respectively, in line with their role in orchestrating inflammation and bone metabolism processes, may be related to PsA pathophysiology.
Conclusion: The transcriptomic profile of clinical remission in PsA is similar to a healthy condition, but not identical, differing for the expression of FOS and CCDC50 genes, which appears to play a key role in its achievement.
1 Introduction
Psoriatic arthritis (PsA) is a chronic inflammatory disease characterized by wide clinical heterogeneity due to the variable combination of six major domains, namely, skin and nail psoriatic lesions, peripheral arthritis, axial disease, dactylitis, and enthesitis (1). It is recognized as a potentially disabling disease, as late and inadequate control of disease activity may result in structural damage and disability (2).
According to the European Alliance of Associations for Rheumatology (EULAR) and the Group for Research in Psoriasis and PsA (GRAPPA) recommendations, treatment of PsA should aim primarily at reaching the target of remission by regular disease activity assessment and appropriate adjustment of therapy (3, 4). Although this approach represents one of the strongest and most widely shared recommendations, there are still relevant issues regarding its application in clinical practice. In particular, the definition of remission is still open to discussion among experts and represents a significant challenge in the management of PsA (5). Several definitions of clinical remission, based on composite indices combining objective (e.g., tender and swollen joint count or enthesitis and dactylitis count (6)) and subjective (e.g., scales for pain or general health) measurements of disease activity are currently used in clinical practice and trials (7). However, the clinical heterogeneity of PsA, the potential persistence of subclinical disease activity demonstrated in ultrasonography studies, and the possible progression of structural damage in patients classified as in clinical remission (8), highlight the urgent need for a sensitive and specific biomarker supporting the accurate identification of remission.
Several genetic, circulating, and tissue factors have been studied as biomarkers in the management of different aspects of PsA, including diagnosis and assessment or prediction of disease activity, severity, and response to treatment (9–13). However, none of these has been extensively validated and then translated into routine clinical practice (10, 14). In particular, despite remission being recommended as the primary goal in PsA treatment, to our knowledge, no studies have been specifically designed to identify the underlying molecular mechanisms and potential biomarkers.
Transcriptomic profiling has become a standard technology in searching for biomarkers of susceptibility, disease activity, progression, and response to treatment in several diseases, including PsA (15, 16). However, the transcriptomic approach has yet to be applied so far in the assessment of clinical remission. Since sustained clinical remission without drug treatment is extremely rare in patients with PsA, a substantial molecular difference between clinical remission and the healthy state may be assumed, but it needs to be demonstrated and characterized. In this regard, an intriguing question is whether the achievement of clinical remission reflects a molecular profile closer to healthy individuals rather than PsA active patients, which we refer to as “molecular remission”.
This study aimed to identify molecular remission biomarkers by comparing the gene expression profile of PsA patients in clinical remission vs. healthy controls and PsA patients with active disease.
2 Methods
2.1 Patients and controls
The present study was based on the comparative transcriptomic profiling of three groups of subjects: PsA patients in clinical remission for at least 1 year (PsA-R), PsA patients with active disease (PsA-A), and healthy controls (HCs). The PsA patients, recruited from a monocentric cohort, were diagnosed according to the classification criteria for psoriatic arthritis (CASPAR) (17) and classified as in clinical remission or active if they had a Disease Activity PsA (DAPSA) score of ≤4 or >14, respectively (18). To ensure a higher level of homogeneity of the PsA group in clinical remission, all the recruited patients were on treatment with TNF inhibitors (TNFi) after the failure of methotrexate. The treatment regimen of the PsA group with active disease is reported in Table 1. Patients undergoing concomitant treatment with glucocorticoids were excluded from both groups. The healthy control group was matched for mean age and gender ratio with the remission group, as this study was primarily focused on comparing these two conditions.
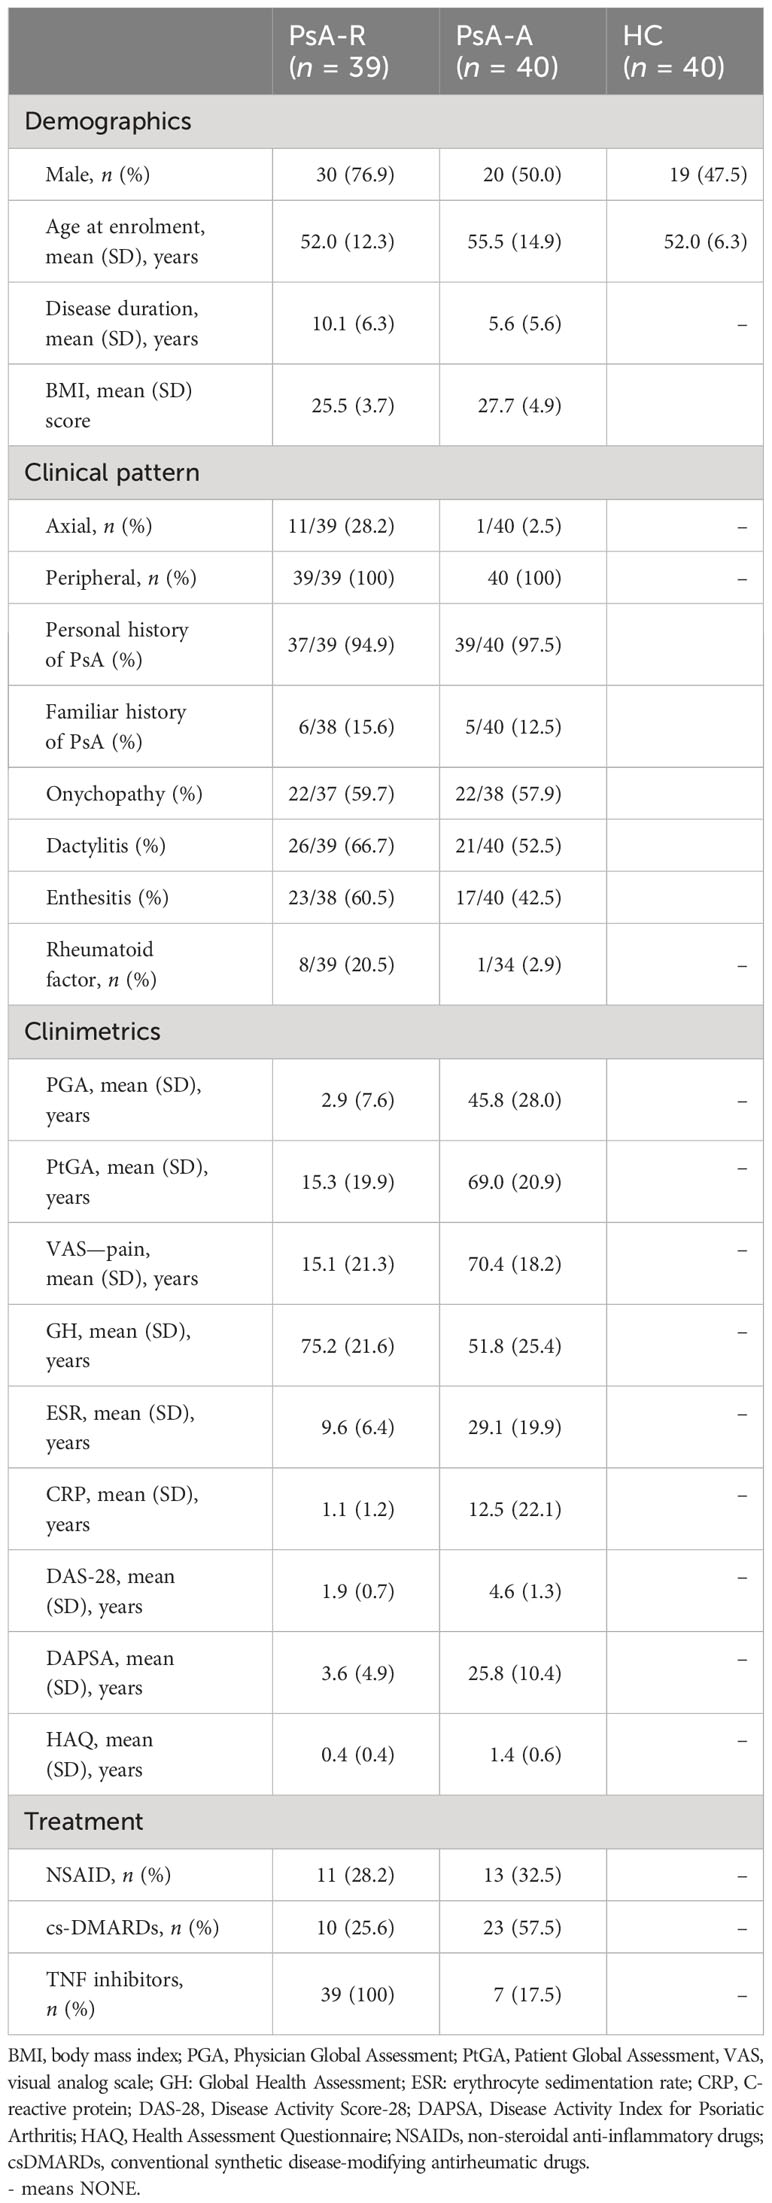
Table 1 Demographic, clinical, and therapeutic data of the recruited PsA patients in clinical remission (PsA-R), PsA patients with active disease (PsA-A), and healthy controls (HCs).
The demographic and clinical features of the three study groups are reported in Table 1.
The study was approved by the local ethical committee (PG/2018/16313; 12th November 2018), and written informed consent was obtained from all subjects. All procedures were in accordance with the Good Clinical Practice standards and Helsinki Declaration.
2.2 Study design
The study consisted of three consecutive phases:
I. Explorative transcriptomic profiling: To identify a preliminary list of differentially expressed genes (DEGs), transcriptomic analysis was performed on pooled RNAs from peripheral blood in biological duplicates of a group of 14 PsA patients in clinical remission, 14 PsA patients with active disease, and 14 HCs (groups of 7 patients in biological duplicates for each condition, for a total of 6 microarrays).
II. Functional and biological analysis of dysregulated transcripts: First, the complete list of DEGs identified by comparing the PsA-R vs. HC groups were analyzed in silico for functional and biological characteristics. Then, only mRNAs related to coding genes were selected and re-analyzed in silico to select those of greater interest to be assessed in the validation phase.
III. RT-qPCR validation analysis: A quantitative reverse transcription PCR (RT-qPCR) for single gene expression analysis of DEGs selected from the previous phases was extended in the whole cohort of 39 PsA patients in clinical remission, 40 PsA with active disease, and 40 HCs.
2.3 Transcriptomic analysis
2.3.1 Target preparation
RNAs were extracted from peripheral blood in RNAlater preservative (Invitrogen) by Ambion RiboPure Kit followed by DNAse treatment. The quality of total RNA was assessed using an Agilent Bioanalyzer 2100 (Agilent Technologies, Palo Alto, CA, USA). Extracted RNAs were pooled in groups of seven patients in biological duplicates for each condition (remission, active, healthy controls) for a total of six microarrays.
Biotin-labeled cDNA targets were synthesized starting from 150 ng of total RNA. Double-stranded cDNA synthesis and related cRNA were performed with GeneChip® WT Plus Kit (Affymetrix, Santa Clara, CA, USA). With the same kit, the sense strand cDNA was synthesized before being fragmented and labeled. All steps of the labeling protocol were performed as suggested by Affymetrix. Each eukaryotic GeneChip® probe array contains probe sets for several Bacillus subtilis genes that are absent in the samples analyzed (lys, phe, thr, and dap). This Poly-A RNA Control Kit contains in-vitro synthesized, polyadenylated transcripts for the B. subtilis genes that are premixed at staggered concentrations to allow GeneChip® probe array users to assess the overall success of the assay. The Poly-A RNA Control final concentrations in each target are as follows: lys, 1:100,000; phe, 1:50,000; thr, 1:25,000; and dap, 1:6,667.
2.3.2 DNA microarray hybridization
This was performed using the GeneChip® Hybridization, Wash and Stain Kit. It contains a mix for target dilution, DMSO at a final concentration of 7%, and premixed biotin-labeled control oligo B2 and bioB, bioC, bioD, and cre controls (Affymetrix cat. #900299, Santa Clara, CA, USA) at a final concentration of 50 pM, 1.5 pM, 5 pM, 25 pM, and 100 pM, respectively. Targets were diluted in a hybridization buffer at a 25-ng/μL concentration and denatured at 99°C for 5 min, incubated at 45°C for 5 min, and centrifuged at maximum speed for 1 min before introduction into the GeneChip® cartridge. A single GeneChip® Human Transcriptome Array 2.0 was then hybridized with each biotin-labeled sense target. Hybridizations were performed for 16 h at 45°C in a rotisserie oven. GeneChip® cartridges were washed and stained with the GeneChip® Hybridization, Wash and Stain Kit in the Affymetrix Fluidics Station 450 following the FS450_0002 standard protocol, including the following steps: 1) (wash) 10 cycles of 2 mixes/cycle with Wash Buffer A at 30°C; 2) (wash) 6 cycles of 15 mixes/cycle with Wash Buffer B at 50°C; 3) stain of the probe array for 5 min in SAPE solution at 35°C; 4) (wash) 10 cycles of 4 mixes/cycle with Wash Buffer A at 30°C; 5) stain of the probe array for 5 min in antibody solution at 35°C; 6) stain of the probe array for 5 min in SAPE solution at 35°C; 7) (final wash) 15 cycles of 4 mixes/cycle with Wash Buffer A at 35°C; and 8) fill the probe array with Array Holding buffer.
2.3.3 Image acquisition, data processing, and bioinformatics analysis
GeneChip arrays were scanned using an Affymetrix GeneChip® Scanner 3000 7G (Affymetrix, Santa Clara, CA, USA) using default parameters. Affymetrix GeneChip® Command Console Software (AGCC) was used to acquire GeneChip® images and generate.DAT and.CEL files, which were used for subsequent analysis with proprietary software (Partek Genomics suite V6.6).
To identify differentially expressed transcripts (concordantly on both biological duplicates of each profiled condition), a fold change (FC) ± 1.5 cutoff and a p-value of 0.05 were set.
2.4 Functional and biological analysis of dysregulated transcripts
For the bioinformatics Gene Ontology (GO) analysis, only differentially expressed transcripts between the PsA-R group vs. HC, with paired RefSeq, were included. Then, gene set enrichment analysis of other represented GO classes was made by fold enrichment and associated p-value (absolute count of identified transcripts vs. expected) for macro- and microcategories. Additionally, coding DEGs were represented in a chromosomic map to visualize their distribution. From the comparative list of DEGs in the PsA-R vs. HC condition, coding mRNAs were selected, interactions were analyzed by the STRING software (free version, V 10.5), and biological functions and annotations were determined by Gene Ontology.
2.5 RT-qPCR validation analysis
Twelve genes were selected from the abovementioned analysis considering literature, GO, and STRING data results and included in the validation phase completed in a larger PsA cohort (39 PsA-R + 40 PsA-A) and 40 HCs.
Extracted RNAs from whole blood were quantified by Qubit 3.0 fluorometer (Thermo Fisher Scientific, Waltham, MA, USA) and retrotranscribed by a High-Capacity RNA-cDNA kit (Invitrogen, Vilnius, Lithuania). The qPCR reactions were prepared in a final volume of 10 µL, with 5 µL of 2× TaqMan Fast Advanced Master Mix (Applied Biosystems, Foster City, CA, USA), 0.5 µL of each 20× primer, and 1 µL of sample (5 ng of cDNA template per reaction). Thermal profiling consisted of a first cycle at 50°C for 2 min, a second cycle at 95°C for 2 min, followed by 40 cycles of amplification at 95°C for 1 s and 60°C for 20 s. qPCR reactions were run in triplicate on a thermal cycler StepOne Plus (Applied Biosystems, Foster City, CA, USA).
Gene expression was measured using the following TaqMan Gene Expression Assay primers (Applied Biosystems, Foster City, CA, USA): FCAR (Hs02572026_s1), CEACAM8 (Hs00266198_m1), FOS (Hs04194186_s1), BPI (Hs01552756_m1), DEFA1B (Hs07287122_m1), ANPEP (Hs00174265_m1), ALPL (Hs01029144_m1), CHI3L1 (Hs01072228_m1), PADI2 (Hs01042505_m1), KLRB1 (Hs00174469_m1), CCD50 (Hs01047000_m1), and TNSF14 (Hs00542476_g1). Glyceraldehyde 3 phosphate dehydrogenase (GAPDH) was used as the housekeeping gene (Hs02758991_g1).
Gene expression quantification was made by the 2−ΔΔCt method for relative quantification (RQ), and the fold change (FC) cutoff was ±1.5 for RQ comparative analysis between groups.
2.6 Statistical analysis
Categorical variables were expressed as absolute values and frequencies (%). Normally and non-normally distributed continuous variables were reported as the mean ± standard deviation (SD) and median and IQR, respectively. Student’s t-test was applied in the validation phase to compare the mean relative quantification values in the three study groups. The following comparisons were performed: PsA-R vs. HC, PsA-R vs. PsA-A, and PsA-A vs. HC. A p-value of <0.05 was considered statistically significant.
3 Results
3.1 Transcriptomic profiling of the remission state
More than 1,000 transcripts differentially expressed in at least one of the three comparisons were identified. The hierarchical clustering with heatmap is reported in Figure 1A. In particular, 125 DEGs (65 up- and 60 downregulated) were identified comparing the PsA-R vs. the HC group, 1,184 (753 up- and 431 downregulated) comparing the PsA-R vs. the PsA-A group, and 378 (378 up- and 314 downregulated) comparing the PsA-A vs. the HC group. The numbers of DEGs for each comparison and the respective overlaps are represented in the Venn diagram in Figure 1B, and the complete list of all DEGs identified in the comparison object of this study is reported in Supplementary Material 1.
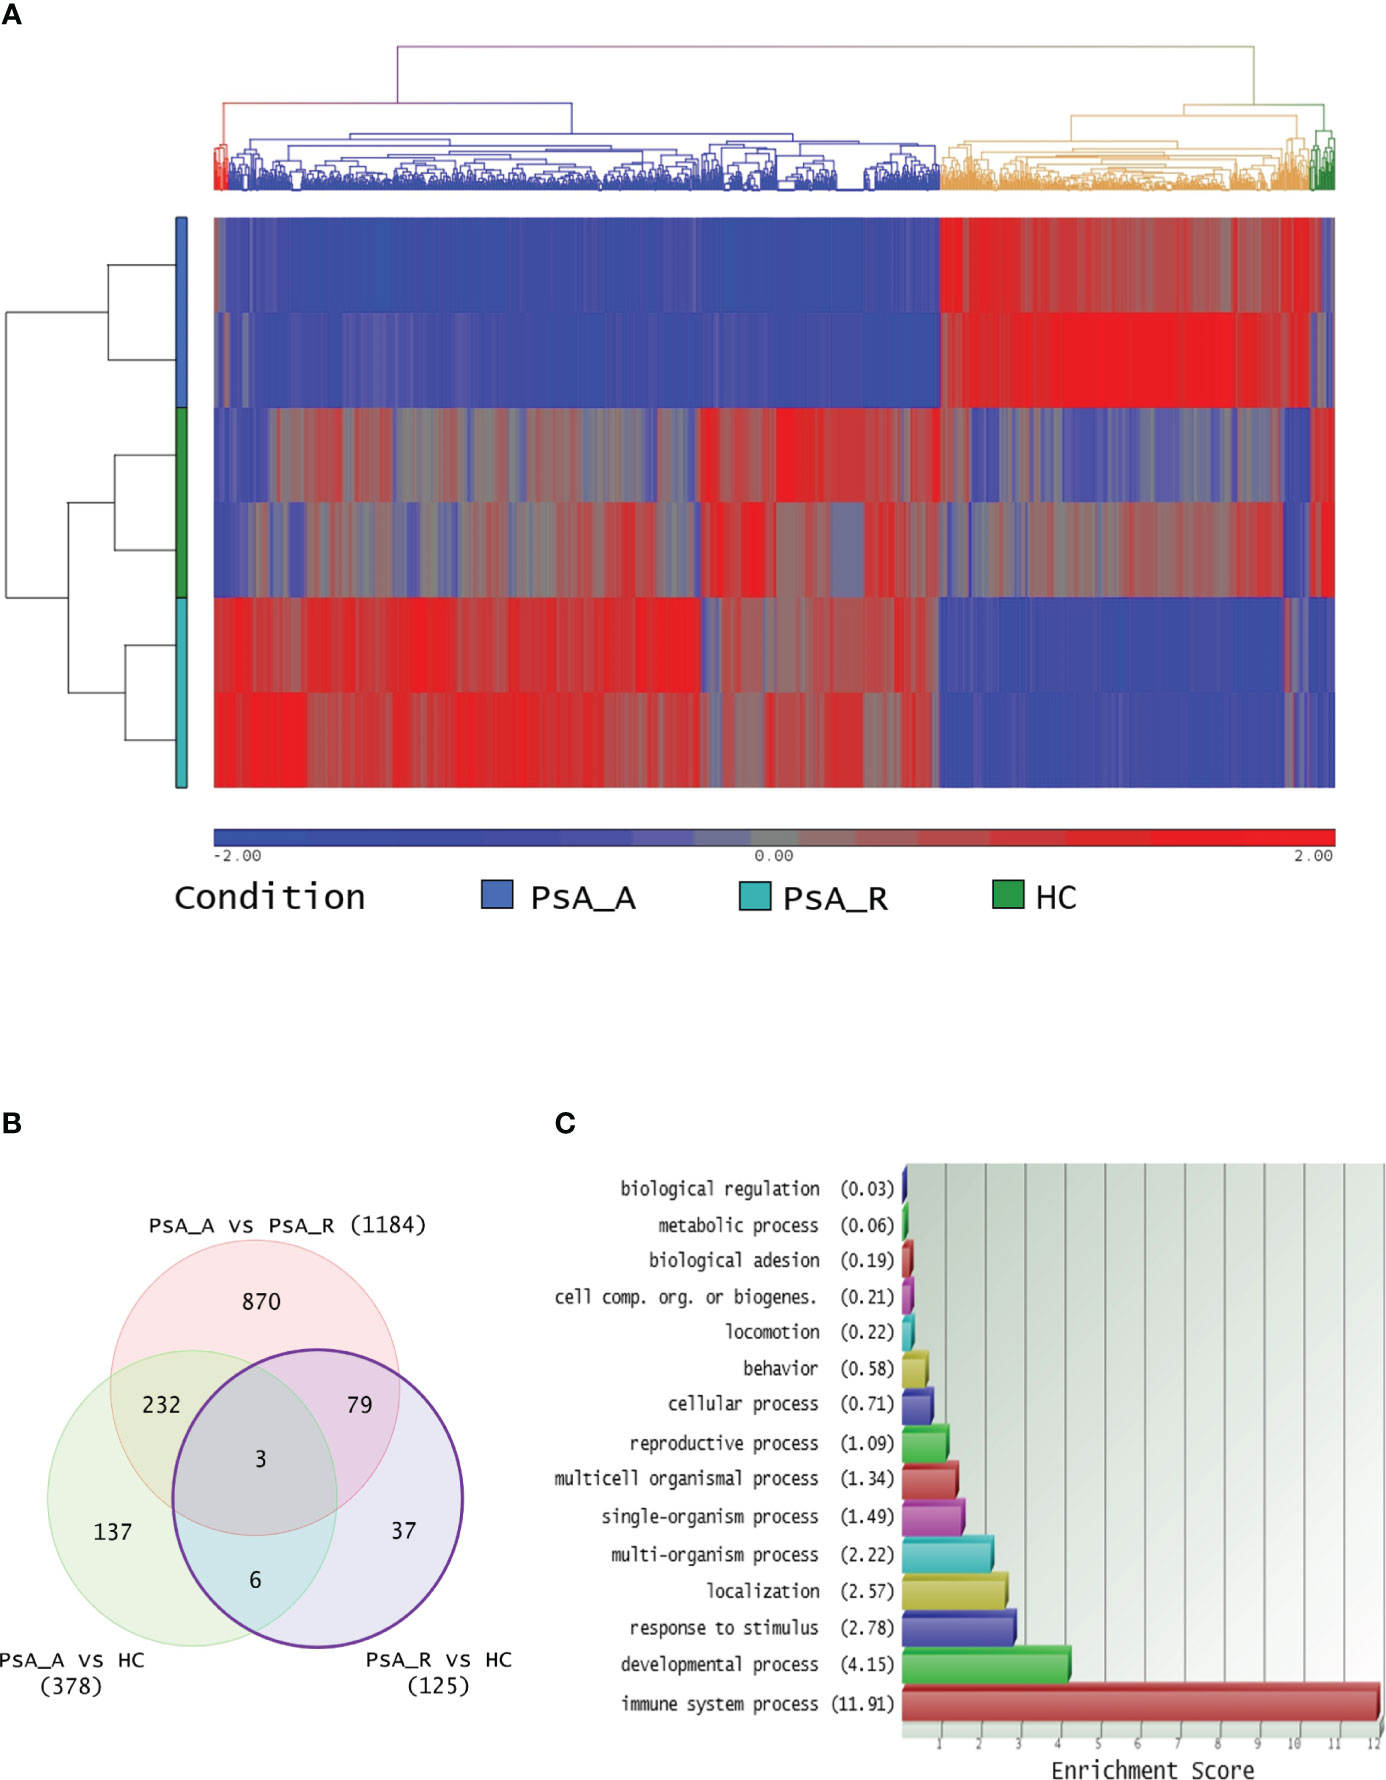
Figure 1 (A) Transcriptomic analysis and clustering. Hierarchical clustering of 1,364 differentially expressed transcripts in at least one comparison in analysis (FC 1.5 and p-value 0.05). The profiled conditions are in the rows (in duplicates, two rows/condition. PsA_A, active psoriatic arthritis; PsA_R, remission psoriatic arthritis; HCs, healthy controls), and the transcripts are in the columns by a pseudocolor scale with expression values normalized to zero, SD = 1 (blue, lower abundance; red, higher abundance), as indicated in the legend scale. Four clusters are represented by four colors in the upper dendrogram, suggesting that these conditions have distinct signatures (or similarities). (B) Venn diagram illustrating the overlap between 1,364 transcripts differentially expressed on three comparative lists (identified with a minimum HR of 1.5 and p-value 0.05, no FDR correction applied). (C) DEG Gene Ontology analysis. For the bioinformatics Gene Ontology (GO) analysis, only differentially expressed transcripts between PsA-R condition vs. HC, with paired RefSeq, were included. The enrichment analysis about more represented GO classes (histogram bars) was made by fold enrichment and associated p-value (the reported enrichment score in brackets is the absolute count of identified transcripts vs. expected), both for macro- and microcategories.
3.2 Biological function analysis of DEGs in clinical remission
The bioinformatics gene set enrichment analysis by the GO software of the 125 DEGs identified in the PsA-R vs. the HC comparison showed that they were primarily involved in the “immune system processes” (Figure 1C). A subanalysis on “microcategories” of the immune system process related to the DEGs is reported in Supplementary Material 2.
Out of the 125 DEGs identified by comparing the PsA-R vs. the HC group, only 25 were coding genes. Thus, according to the preset methodology, they were selected for the in-depth functional and biological analysis. The respective hierarchical clustering with the heatmap is reported in Figure 2A, and similar to the previous GO analysis, the biological function study of the 25 coding DEGs demonstrated their primary involvement in the “immune system processes” (Figure 2B; for the complete list of symbols and annotated functions by the Partek software, see Supplementary Material 3). Moreover, when such DEGs were further analyzed for functions and interactions, the bioinformatics STRING software tool built an interaction network between 24 putative proteins, with more significant interactions than expected (Figure 3). For the STRING raw data analysis, legend, settings, and results, see Supplementary Material 4. Lastly, in Supplementary Material 5, the karyomap figure shows these genes’ chromosomic mapping.
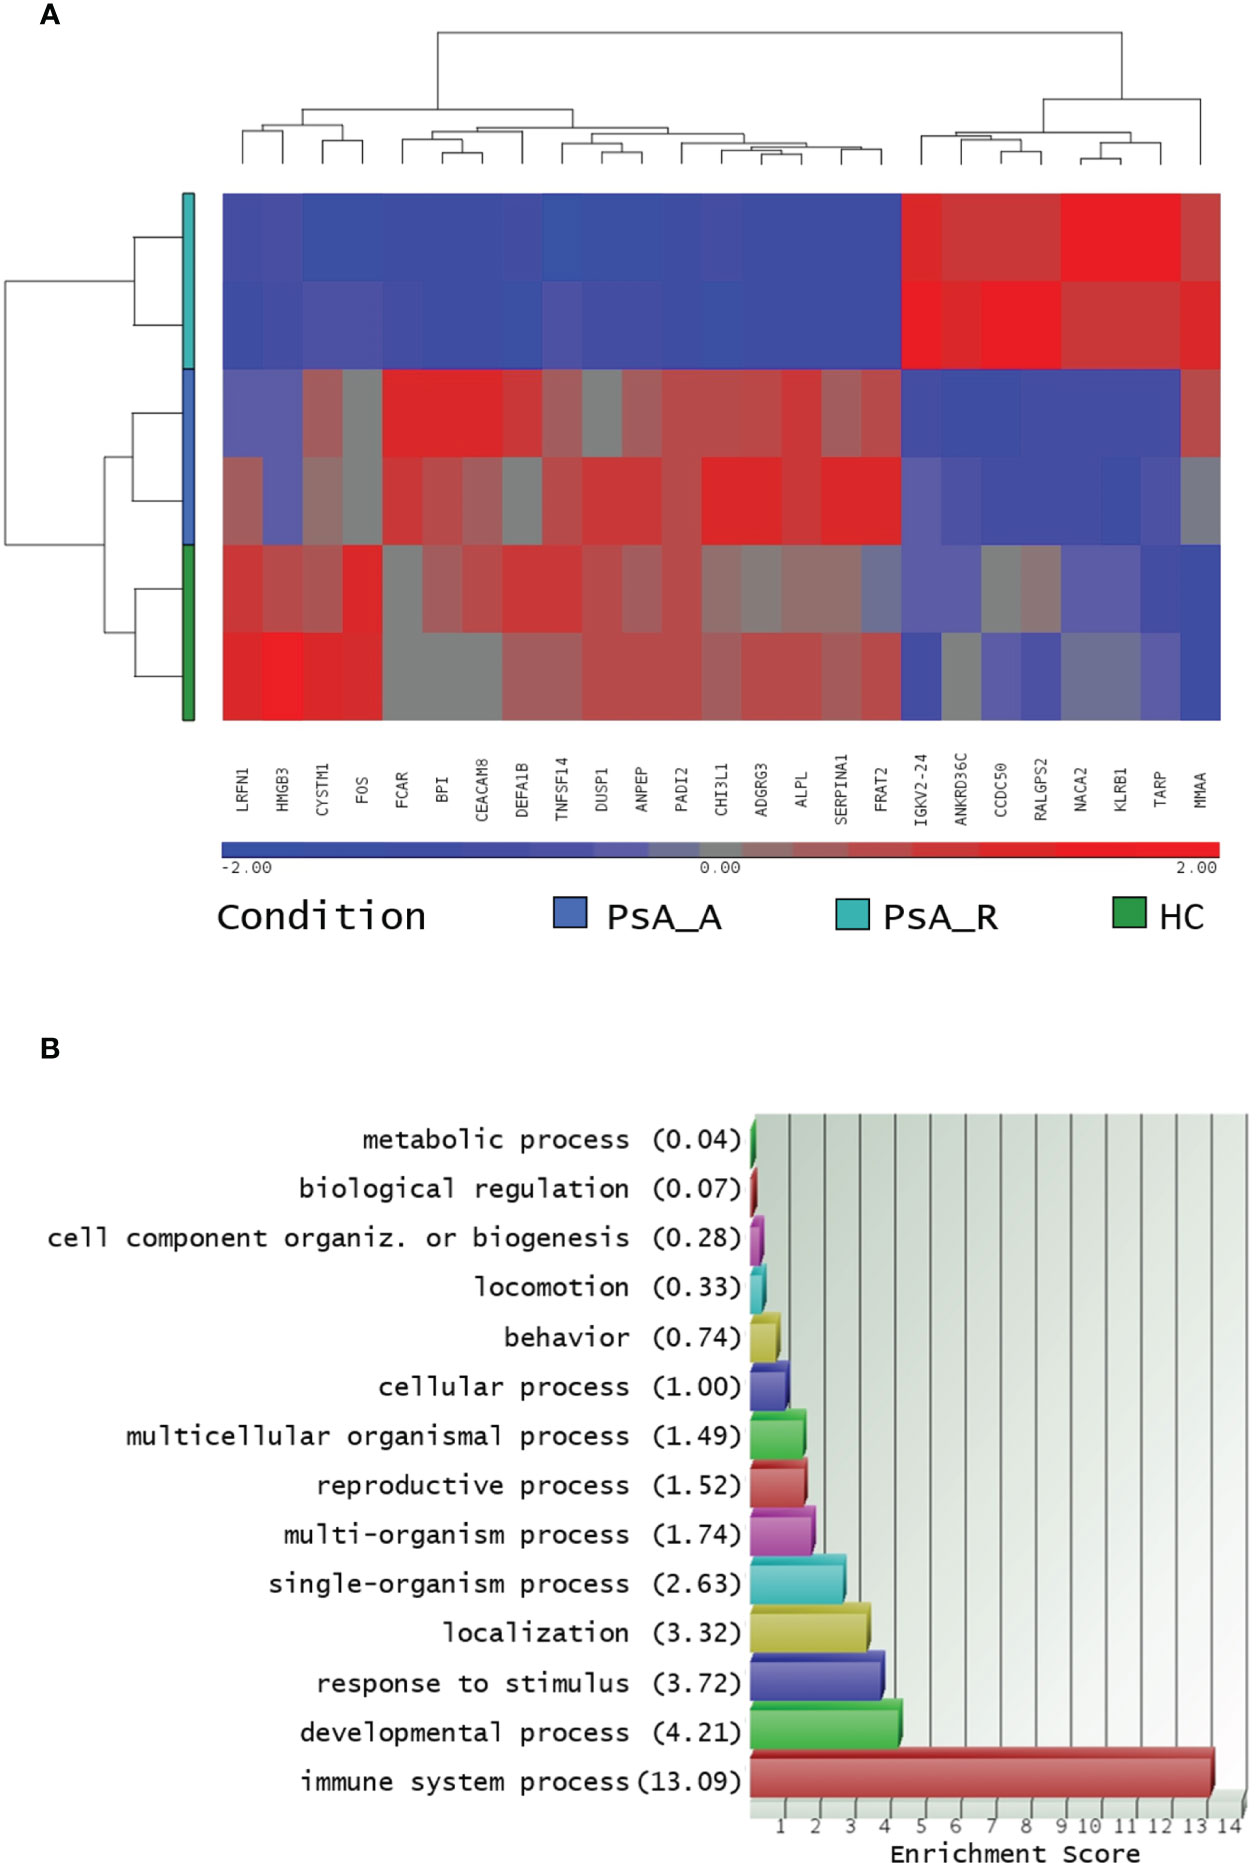
Figure 2 (A) Hierarchical clustering of coding DEGs in remission state. Heatmap of 24 filtered coding DEGs in the PsA remission state and their expression in all profiled conditions, analysis in biological duplicates (cutoff FC ± 1.5, p-value 0.05). The profiled conditions are in the rows (in duplicates, two rows/condition: PsA_A, active psoriatic arthritis; PsA_R, remission psoriatic arthritis; HCs, healthy controls), and the DEGs are in the columns by a pseudocolor scale with expression values normalized to zero, SD = 1 (blue, lower abundance; red, higher abundance), as indicated in the legend scale. (B): coding DEGs Gene Ontology analysis. Only coding DEGs in the PsA-R condition vs. HC, with paired RefSeq, were included. The enrichment analysis about more represented GO classes (histogram bars) was made by fold enrichment and associated p-value (the reported enrichment score in brackets is the absolute count of identified transcripts vs. expected).
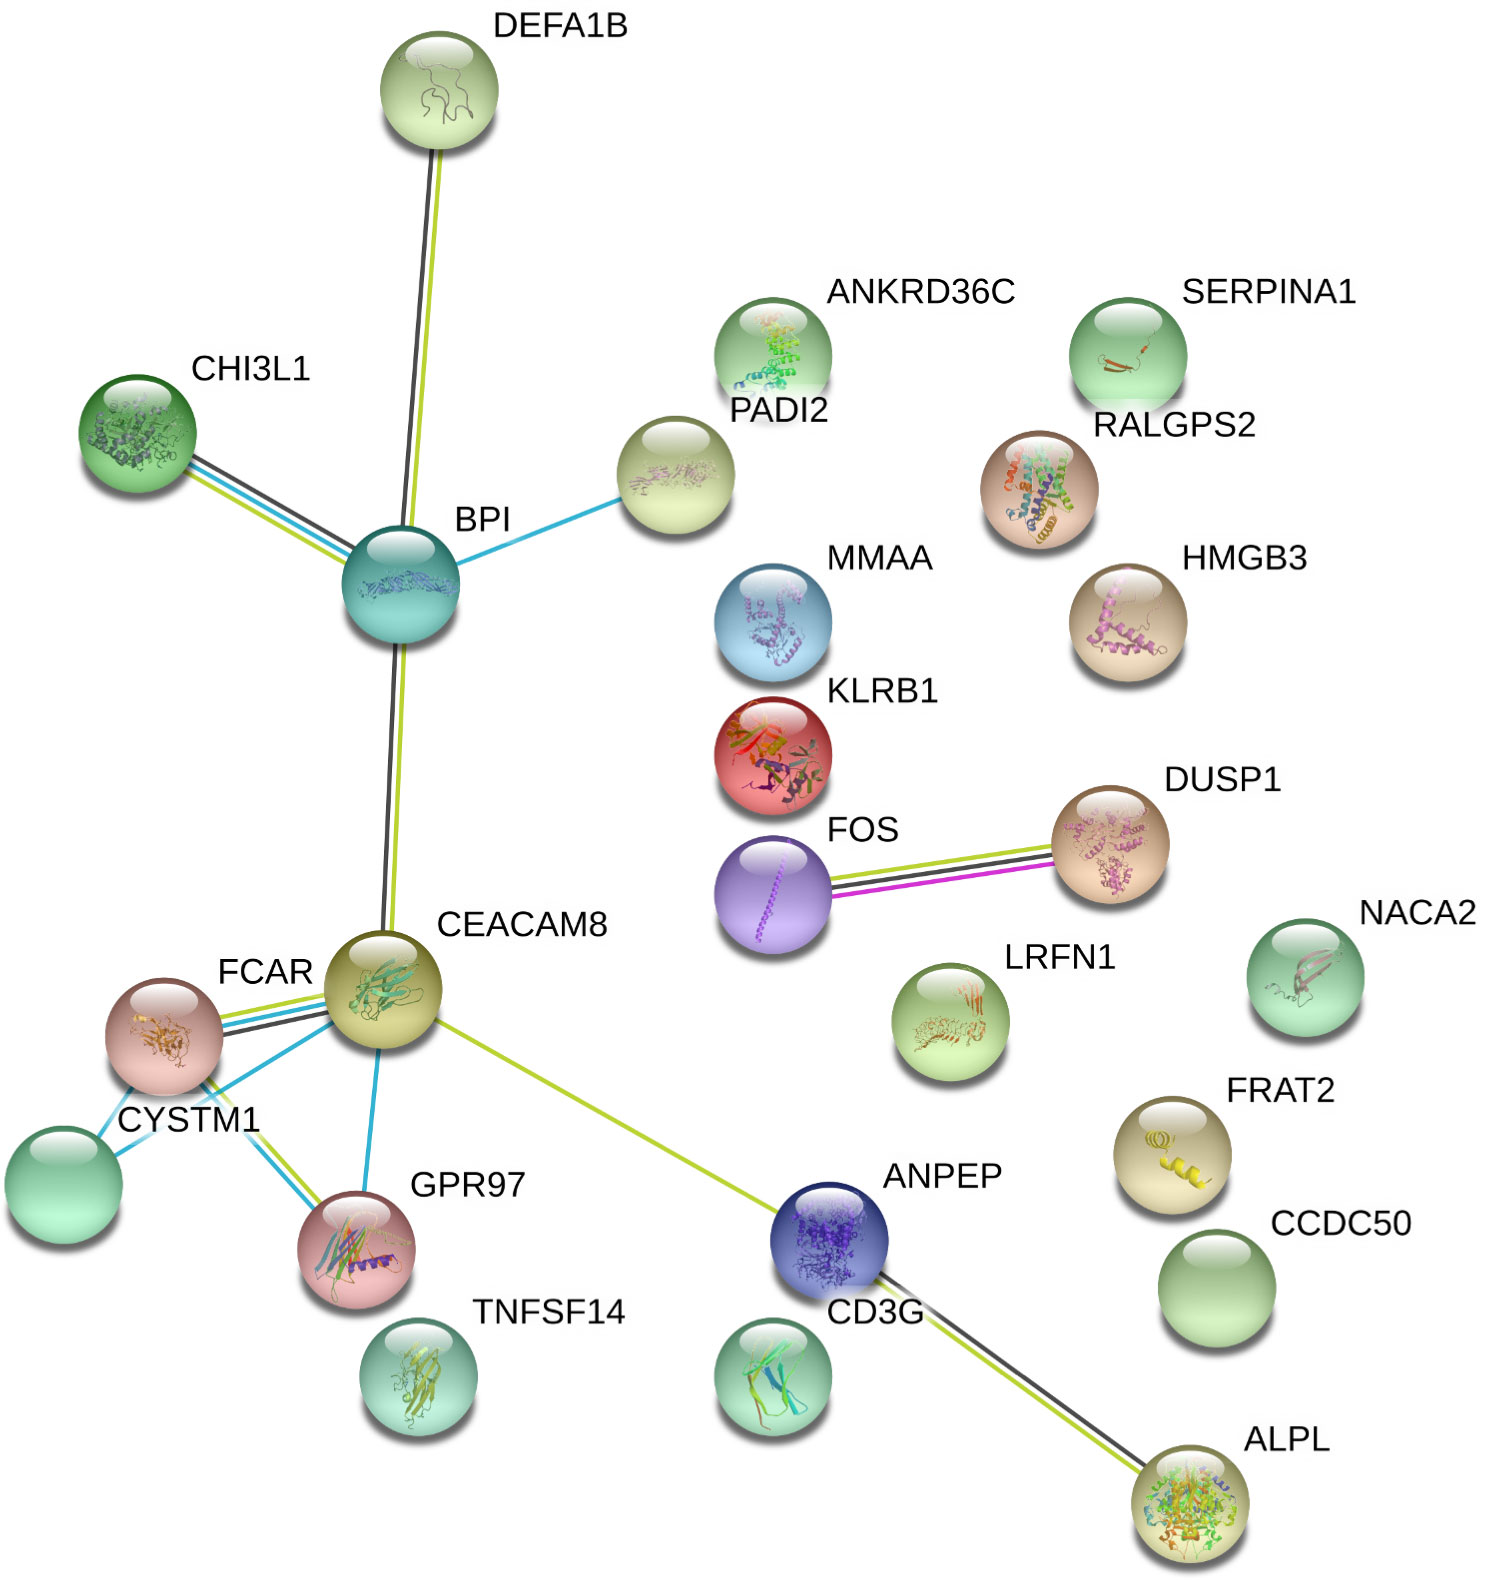
Figure 3 Interactome of coding DEGs misregulated on PsA clinical remission. Differentially expressed genes (DEGs) in the remission (PsA-R) group vs. healthy controls (HCs) analyzed for multiple protein interactions by the STRING software V10.5 (raw data and coordinates in Supplementary Material 4). Network nodes representing proteins, splice isoforms, or post-translational modifications are collapsed, i.e., each node represents all the proteins produced by a single, protein-coding gene locus. Edges represent protein–protein associations and are drawn as follows: red line = presence of fusion evidence; green line = neighborhood evidence; blue line = cooccurrence evidence; purple line = experimental evidence; yellow line = textmining evidence; light blue line = database evidence; black line = coexpression evidence. Edge associations are meant to be specific and meaningful, i.e., proteins jointly contribute to a shared function; this does not necessarily mean they are physically binding to each other. Represented network stats: number of nodes = 24; number of edges = 12; average node degree = 1; avg. local clustering coefficient = 0.369; expected number of edges = 3; PPI enrichment p-value = 3.17e−05.
3.3 Extended gene expression analysis of coding DEGs in the remission state
Matching our bioinformatics data with the current evidence regarding the 25 coding DEGs identified in the PsA-R vs. the HC comparison, 12 were selected for the validation phase by gene expression quantification. Their symbols, RefSeq, annotated functions, and chromosomic position are described in Table 2.
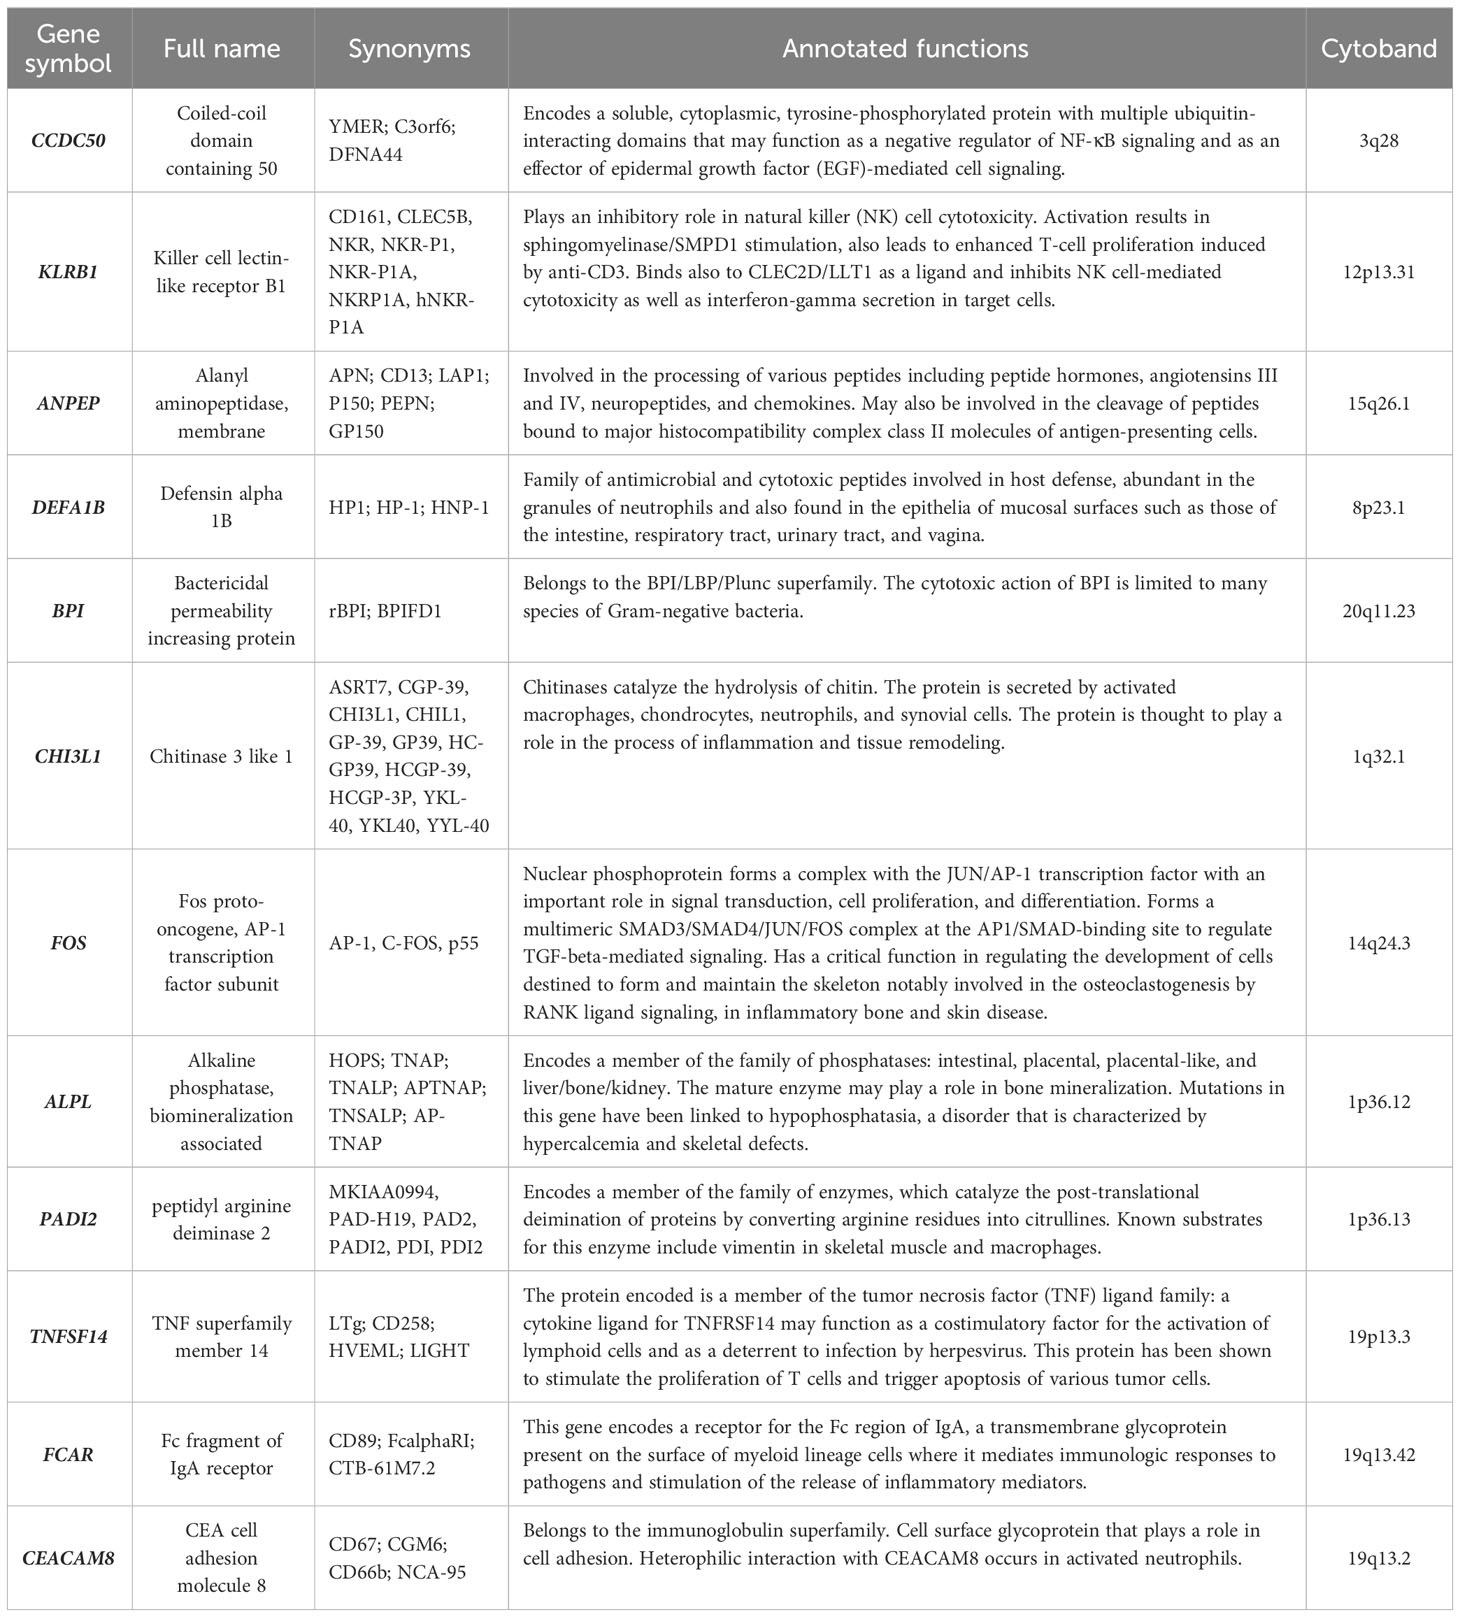
Table 2 All validated DEGs listed for their gene symbol, full name, synonyms, cytoband, and functions annotated by RefSeq and UniProt sources.
The RT-qPCR validations in the large PsA cohort (39 PsA-R + 40 PsA-A patients) and 40 HCs measured the expression of all selected genes in all subjects as shown in Table 3.
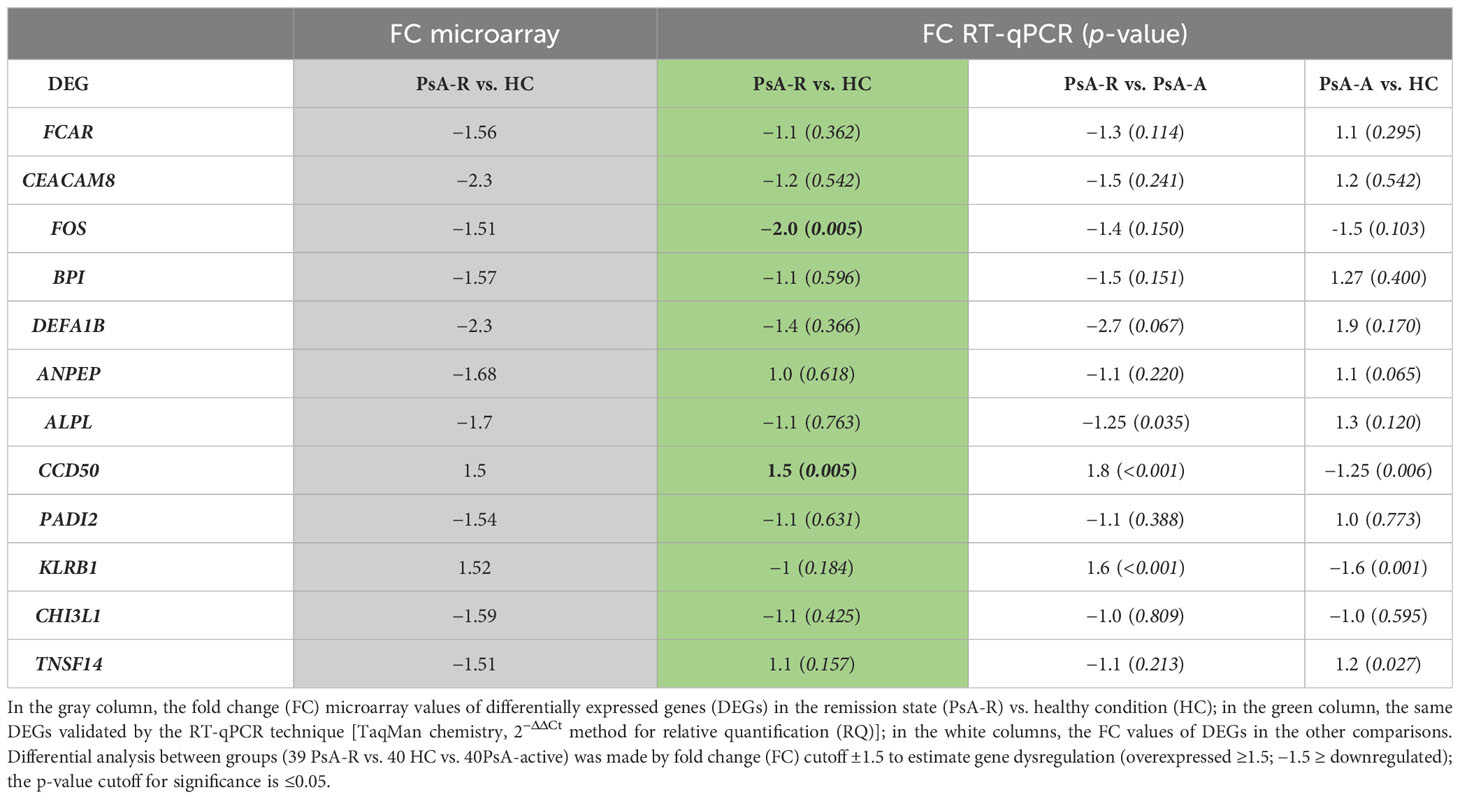
Table 3 Gene expression quantification of DEGs on PsA remission state.
In the clinical remission vs. healthy condition comparison, data obtained in the single-gene expression dosage significantly confirmed the downregulation (FC −2.0; p 0.005) of FOS and the upregulation (FC + 1.5; p 0.005) of CCDC50 (alias YMER) genes in the PsA-R state (Figure 4). For further analysis, we evaluated the association between CRP levels and RQ values of both these genes, demonstrating a significant negative and positive correlation, respectively, with CCDC50 [Pearson’s correlation coefficient (r): −0.240; p = 0.035] and FOS (r: 0.386; p = 0.001).
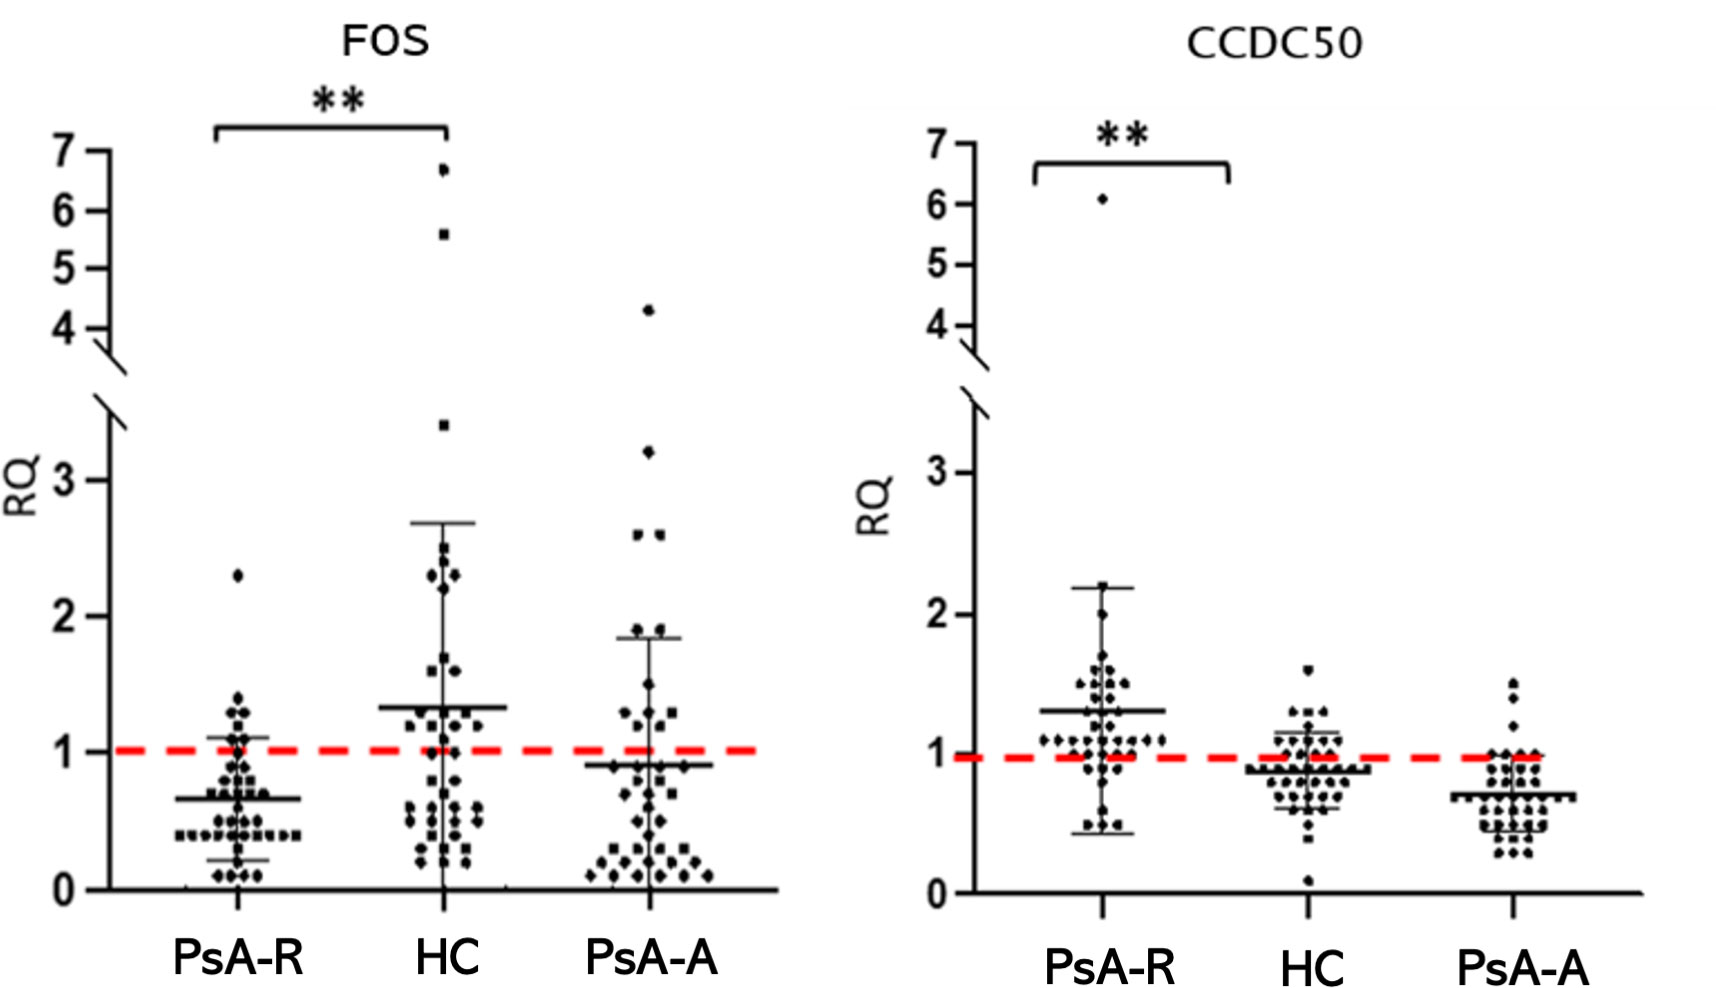
Figure 4 The FOS and CCDC50 dysregulation in the PsA clinical remission. Mean (SD) of relative quantification (RQ) of FOS and CCDC50 genes in the remission (PsA-R), active (PsA-A), and healthy condition (HC). Analysis by the 2−ΔΔCt method. **p-value = 0.005.
The differential analysis between groups also showed a significative misregulation of other genes in other comparisons (PsA-R vs. PsA-A; PsA-A vs. HC) (see Table 3). In particular, there was a significative downregulation of KLRB1 (FC −1.6; p 0.001) in the active disease vs. healthy condition, while the comparison between the remission vs. active PsA exhibited the overexpression of CCDC50 (FC 1.8; p < 0.001) and KLRB1 (FC 1.6; p < 0.001) (RQ and FC values of all validated DEGs are shown in Table 3).
4 Discussion
This is the first gene expression study specifically designed to explore the molecular mechanisms underlying the clinical remission in PsA patients through an investigative approach primarily based on comparing the remission and the healthy condition.
The comparative transcriptomic analysis showed that clinical remission was similar but not identical to the healthy state. Indeed, the presence of 125 DEGs suggests that the TNFi-induced clinical remission is not synonymous with molecular disease inactivation leading to a “back to a healthy state,” but it is a condition characterized by several misregulated transcripts that, on the one hand, may represent the persistence of underlying disease activity and, on the other hand, may mean the activation of mechanisms sustaining disease remission.
The subsequent phase of bioinformatics analysis showed that the coding DEGs in clinical remission were strictly correlated to each other in a strong interaction network and were primarily involved in functions related to immune system processes. These in-silico predictions were confirmed by the validation phase of this study, where the RT-qPCR single-gene expression analysis showed in all profiled conditions the dysregulation of genes strictly involved in inflammatory and immune processes.
The primary analysis of this study, based on comparing the clinical remission with the healthy condition, revealed the down- and upregulation of FOS and CCDC50 genes, respectively, which are both reported as having a significant role in the inflammatory process and osteoclastogenesis.
FOS (Fos Proto-Oncogene, AP-1 Transcription Factor Subunit) is a protein-coding gene. The FOS gene family consists of four members: FOS, FOSB, FOSL1, and FOSL2. These genes encode leucine zipper proteins that can dimerize with proteins of the JUN family, thereby forming the transcription factor complex AP-1 (19). After being induced by several extra- and intracellular stimuli, the immediate early gene product Fos translates into the regulation of downstream target genes implicated in various cellular processes, including inflammatory response and osteoclastogenesis regulation (20). In this regard, it has been described how Fos/AP-1 has an important role in the induction of NFAT-dependent genes coding many cytokines such as IL-2 and IL-3, granulocyte–macrophage colony-stimulating factor, IL-4, IL-5, IL-13, IFNγ, TNFα, CD40L, FasL, CD5, Igκ, CD25, and the chemokines IL-8 and MIP1α (21). Furthermore, previous studies reported that AP-1 could affect the severity of inflammation through other mechanisms, including the regulation of naive T-cell differentiation into T helper 1 (Th1) or Th2 cells and modulation of the activity of the innate immune system (22–24).
Aside from its role in the inflammatory process, there is much evidence that FOS has an important role in the regulation of osteoclastogenesis by RANK ligand signaling (25, 26), which in turn is demonstrated to have a crucial role in developing joint/bone destructive lesions in inflammatory arthropathies, such as rheumatoid arthritis and psoriatic arthritis (27). After binding with its receptor, RANKL triggers a signaling cascade leading to the activation of key transcription factors such as NF-κB and Fos, leading to the expression of osteoclast-specific target genes (25, 26). In particular, activation of RANKL/Fos is required for the expression of Nuclear Factor for activation of T cells c1 (NFATc1) and interferon-b (IFN-b), two critical actors in osteoclast differentiation (28, 29). Notably, AP-1 activity can also affect the severity of primary arthritis with mechanisms different from the regulation of osteoclastogenesis, such as induction of MMP production (30).
A scarce amount of data is available on the potential role of FOS in PsA. Interestingly, data are available on rheumatoid arthritis (RA), where previous studies reported that Fos/AP-1 and interleukin 1β (IL-1β) influence each other’s gene expression and activity, resulting in an orchestrated cross-talk that, in turn, seems to have an important role in the accrual of joint damage in experimental RA models characterized by the enhancement of Fos/AP-1 activity. For this purpose, Yukiko et al. designed and synthesized a selective inhibitor of Fos/AP-1 to resolve arthritis in a mouse model of the RA disease (31).
Our analysis shows a downregulation of FOS in remission and active PsA patients vs. healthy controls (remission < active < healthy), suggesting that such misregulation may occur to counterbalance its pro-inflammatory and pro-osteoclastogenic functions. The fact that FOS is slightly downregulated in PsA-A vs. HC could suggest that this mechanism is also established in patients with active disease, but not sufficiently to maintain homeostasis.
CCDC50 (alias YMER) encodes a soluble, cytoplasmic, tyrosine-phosphorylated protein with multiple ubiquitin-interacting domains that may be multifunctional in several signaling pathways (32). CCDC50 overexpression attenuates NF-κB, a critical regulator of innate and adaptive immunity, in collaboration with A20 deubiquitinase (33), that, in turn, plays an important role in the termination of NF-κB signaling and the resolution of inflammation. In particular, CCDC50 harbors a ubiquitin-binding domain (UBD) that may act as an adaptor molecule for A20, a mechanism important for NF-κB inhibition (33). In fact, the ubiquitin-modifying protein A20 is a broadly expressed cytoplasmic protein induced by TNFα stimulation, and it has been identified as an inhibitor of TNF-induced NF-κB activation or apoptosis. In the literature, it is established that A20 is a critical negative regulator of NF-κB (34), and A20-deficient cells fail to terminate TNF-induced NF-κB signaling (35). Furthermore, CCDC50 was identified as a gene whose expression is highly decreased in osteoclastogenesis upon myostatin treatment in vitro. It could inhibit the function of myostatin in osteoclastogenesis by blocking NF-κB and MAPK pathways. In this model, overexpression of CCDC50 diminishes NF-κB signaling, whereas knockdown of endogenous CCDC50 upregulates NF-κB signaling, suggesting that CCD50 functions as a negative regulator for NF-κB signaling (36).
To our knowledge, no specific data are currently available on the role of CCDC50 in PsA. In affected patients in clinical remission from our cohort, the upregulation of CCDC50 could have a protective role, contributing to bone homeostasis recovery and avoiding the most aggressive disease outcome, such as articular erosion, by inhibiting the osteoclastogenesis process. This assumption is further supported by the demonstration that CCDC50 is downregulated in active patients compared with those in clinical remission. Therapeutic strategies targeting CCDC50 may be conducive to treating diseases related to its aberrant expression.
Taken together, the opposite function of the two inversely misregulated genes, FOS and CCDC50, in PsA patients in clinical remission would confirm that the former did not represent “a back to the healthy condition,” but it is probably the result of a new balance between inhibition of pro-inflammatory and pro-osteoclastic processes and enhancement of protective mechanism against the same inflammatory and osteogenic phenomena. In particular, clinical remission might be molecularly driven by FOSgene downregulation, determining the minor activation of RANKL and subsequently slight osteoclastogenesis, and CCDC50 overexpression, which imply major NF-κB inhibition and type I IFN pathway restriction. No data from the literature showed direct interactions between the products of these two genes; however, a cooperation cannot be excluded because of their involvement in the same downstream pathway. In this regard, bioinformatics tools such as the Gene Transcription Regulation Database (GTRD, website http://gtrd20-06.biouml.org/) allow us to hypothesize that the CCDC50 gene sequence may be a possible target of the Fos transcription factor; however, further studies need to be conducted for this purpose.
The secondary analysis of our study comparing the remission with active disease, and the latter with healthy controls, showed that there was, as expected, a significant difference in terms of the transcriptomic profile also between TNFi-induced remission and the active disease, as well as between the active disease and the healthy condition. The DEG validation extended to these further comparisons showed the misregulation of DEFA1B and KLRB1 (PsA-A vs. HC) and BPI, CEACAM8, DEFA1B, and KLRB1 (PsA-R vs. PsA-A), respectively. However, these comparisons were not the primary objective of this study and deserve further, separate, in-depth investigation.
This work provides previous unreported information on the molecular characterization of the clinical remission in PsA, describing for the first time in this condition the dysregulation of two key genes notably involved in inflammatory and bone metabolism processes. These findings pave the way into a research field that is of clinical interest and provide data to the debate about considering remission as a condition with molecular disease inactivation leading to a “back to a healthy state.” In the precision medicine era, more molecular data about PsA disease activity assessment are needed: in the near future, the biomarker discovery of a molecular remission state achievement, for a better and precise assessment of the actual major goal of PsA management, should be improved.
This study has some limitations. First, the enrolment of PsA patients in clinical remission solely induced by TNFi prevents a generalization of the results of the remission induced by other treatments. However, this methodological choice assumed that different treatments might induce different molecular mechanisms sustaining remission. Thus, for this reason, a homogeneous PsA cohort in remission with the most widely used first-line bioDMARD was selected (37). It is noteworthy that remission induced by TNFi is particularly consistent with the result of our study and corroborates their validity, as both FOS and CCD50 are involved in the regulation of pathways where TNF has a key role. Second, in the validation phase of the study, only the coding transcripts were evaluated, aiming to assess the interaction between gene products in existing biological pathways and processes. Finally, in the RT-qPCR validation phase, 12 coding genes out of 24 mRNAs were evaluated. Although this selection was based on previous in-silico investigations (GO gene set enrichment and STRING software) and an in-depth literature review, also the remaining genes potentially may have a role in sustaining the TNFi remission, deserving further research.
To date, no successful models of TNFi prediction in PsA are available clinically (38), and the research field of biomarker discovery related to molecular remission achievement is only at an early stage (39–41). Whole-blood transcriptomic profiling performed in this study suggests that TNFi-induced clinical remission in PsA is similar to a healthy condition, but not identical, differing for a list of 125 transcripts and particularly for the FOS and CCDC50 gene expression amount. The molecular characterization of PsA disease activity may have a crucial role in identifying biological as well as clinical remission, favoring a more effective application of the prospective treat-to-target strategy.
Data availability statement
The original contributions presented in the study are included in the article/Supplementary Material. Further inquiries can be directed to the corresponding author.
Ethics statement
The studies involving humans were approved by the local ethical committee (PG/2018/16313; 12th November 2018). The studies were conducted in accordance with the local legislation and institutional requirements. The participants provided their written informed consent to participate in this study.
Author contributions
MMA: Conceptualization, Data curation, Formal Analysis, Investigation, Methodology, Software, Validation, Writing – original draft. AF: Data curation, Formal Analysis, Investigation, Methodology, Writing – original draft. IC: Data curation, Formal Analysis, Investigation, Methodology, Writing – review & editing. MC: Data curation, Formal Analysis, Investigation, Writing – review & editing. EC: Data curation, Formal Analysis, Investigation, Writing – review & editing. MNR: Data curation, Formal Analysis, Investigation, Writing – review & editing. MP: Data curation, Formal Analysis, Investigation, Writing – review & editing. AC: Conceptualization, Data curation, Formal Analysis, Supervision, Validation, Writing – original draft.
Funding
The author(s) declare that no financial support was received for the research, authorship, and/or publication of this article.
Acknowledgments
The authors thank all the patients and healthy controls who participated in the study and also Dr. S. Minardi of the COGENTECH/IFOM (Milan) microarray and bioinformatic facility.
Conflict of interest
The authors declare that the research was conducted in the absence of any commercial or financial relationships that could be construed as a potential conflict of interest.
The author(s) declared that they were an editorial board member of Frontiers, at the time of submission. This had no impact on the peer review process and the final decision.
Publisher’s note
All claims expressed in this article are solely those of the authors and do not necessarily represent those of their affiliated organizations, or those of the publisher, the editors and the reviewers. Any product that may be evaluated in this article, or claim that may be made by its manufacturer, is not guaranteed or endorsed by the publisher.
Supplementary material
The Supplementary Material for this article can be found online at: https://www.frontiersin.org/articles/10.3389/fimmu.2023.1274539/full#supplementary-material
Abbreviations
PsA, psoriatic arthritis; DEGs, differentially expressed genes; EULAR, European Alliance of Associations for Rheumatology; GRAPPA, Group for Research in Psoriasis and PsA; PsA-R, PsA patients in clinical remission; PsA-A, PsA patients with active disease; HCs, healthy controls; CASPAR, classification criteria for psoriatic arthritis; DAPSA, Disease Activity PsA; TNFi, TNF inhibitors; GO, Gene Ontology.
References
1. Ritchlin CT, Colbert RA, Gladman DD. Psoriatic arthritis. N Engl J Med (2017) 376:957–70. doi: 10.1056/NEJMra1505557
2. McHugh NJ, Balachrishnan C, Jones SM. Progression of peripheral joint disease in psoriatic arthritis: a 5-yr prospective study. Rheumatology (2003) 42:778–83. doi: 10.1093/rheumatology/keg217
3. Gossec L, Baraliakos X, Kerschbaumer A, de Wit M, McInnes I, Dougados M, et al. EULAR recommendations for the management of psoriatic arthritis with pharmacological therapies: 2019 update. Ann Rheum Dis (2020) 79:700–12. doi: 10.1136/annrheumdis-2020-217159
4. Coates LC, Soriano ER, Corp N, Bertheussen H, Callis Duffin K, Campanholo CB, et al. Group for Research and Assessment of Psoriasis and Psoriatic Arthritis (GRAPPA): updated treatment recommendations for psoriatic arthritis 2021. Nat Rev Rheumatol (2022) 18:465–79. doi: 10.1038/s41584-022-00798-0
5. Mease PJ, Coates LC. Considerations for the definition of remission criteria in psoriatic arthritis. Semin Arthritis Rheum (2018) 47:786–96. doi: 10.1016/j.semarthrit.2017.10.021
6. Macchioni P, Marchesoni A, Ciancio G, Sandri G, Zabotti A, Vukatana G, et al. Residual inflammation in psoriatic arthritis patients in stable minimal disease activity. Front Med (2022) 9:1096547. doi: 10.3389/fmed.2022.1096547
7. Coates LC, Conaghan PG, D’Agostino MA, De Wit M, FitzGerald O, Kvien TK, et al. Remission in psoriatic arthritis-where are we now? Rheumatol Oxf Engl (2018) 57:1321–31. doi: 10.1093/rheumatology/kex344
8. Wiell C, Szkudlarek M, Hasselquist M, Møller JM, Vestergaard A, Nørregaard J, et al. Ultrasonography, magnetic resonance imaging, radiography, and clinical assessment of inflammatory and destructive changes in fingers and toes of patients with psoriatic arthritis. Arthritis Res Ther (2007) 9:R119. doi: 10.1186/ar2327
9. Wirth T, Balandraud N, Boyer L, Lafforgue P, Pham T. Biomarkers in psoriatic arthritis: A meta-analysis and systematic review. Front Immunol (2022) 13:1054539 (accessed 27 Feb 2023. doi: 10.3389/fimmu.2022.1054539
10. Pouw J, Leijten E, Radstake T, Boes M. Emerging molecular biomarkers for predicting therapy response in psoriatic arthritis: A review of literature. Clin Immunol (2020) 211:108318. doi: 10.1016/j.clim.2019.108318
11. Leijten E, Tao W, Pouw J, van Kempen T, Olde Nordkamp M, Balak D, et al. Broad proteomic screen reveals shared serum proteomic signature in patients with psoriatic arthritis and psoriasis without arthritis. Rheumatol (Oxford). (2021) 60(2):751–61. doi: 10.1093/rheumatology/keaa405
12. Mulder MLM, van Hal TW, Wenink MH, Koenen HJPM, van den Hoogen FHJ, de Jong EMGJ, et al. Clinical, laboratory, and genetic markers for the development or presence of psoriatic arthritis in psoriasis patients: a systematic review. Arthritis Res Ther (2021) 23(1):168. doi: 10.1186/s13075-021-02545-4
13. Pennington SR, FitzGerald O. Early origins of psoriatic arthritis: clinical, genetic and molecular biomarkers of progression from psoriasis to psoriatic arthritis. Front Med (Lausanne). (2021) 8:723944. doi: 10.3389/fmed.2021.723944
14. FitzGerald O, Behrens F, Barton A, Bertheussen H, Boutouyrie-Dumont B, Coates L, et al. Application of clinical and molecular profiling data to improve patient outcomes in psoriatic arthritis. Ther Adv Musculoskelet Dis (2023) 15:1–14. doi: 10.1177/1759720X231192315
15. Jadon DR, Stober C, Pennington SR, FitzGerald O. Applying precision medicine to unmet clinical needs in psoriatic disease. Nat Rev Rheumatol (2020) 16:609–27. doi: 10.1038/s41584-020-00507-9
16. Angioni MM, Floris A, Cangemi I, Congia M, Chessa E, Orrù S, et al. Gene expression profiling of monozygotic twins affected by psoriatic arthritis. Open Access Rheumatol Res Rev (2021) 13:23–9. doi: 10.2147/OARRR.S291391
17. Tillett W, Costa L, Jadon D, Wallis D, Cavill C, McHugh J, et al. The classification for psoriatic arthritis (CASPAR) criteria – A retrospective feasibility, sensitivity, and specificity study. J Rheumatol (2012) 39:154–6. doi: 10.3899/jrheum.110845
18. Mease PJ. Measures of psoriatic arthritis: Tender and Swollen Joint Assessment, Psoriasis Area and Severity Index (PASI), Nail Psoriasis Severity Index (NAPSI), Modified Nail Psoriasis Severity Index (mNAPSI), Mander/Newcastle Enthesitis Index (MEI), Leeds Enthesitis Index (LEI), Spondyloarthritis Research Consortium of Canada (SPARCC), Maastricht Ankylosing Spondylitis Enthesis Score (MASES), Leeds Dactylitis Index (LDI), Patient Global for Psoriatic Arthritis, Dermatology Life Quality Index (DLQI), Psoriatic Arthritis Quality of Life (PsAQOL), Functional Assessment of Chronic Illness Therapy-Fatigue (FACIT-F), Psoriatic Arthritis Response Criteria (PsARC), Psoriatic Arthritis Joint Activity Index (PsAJAI), Disease Activity in Psoriatic Arthritis (DAPSA), and Composite Psoriatic Disease Activity Index (CPDAI). Arthritis Care Res (2011) 63 Suppl 11:S64–85. doi: 10.1002/acr.20577
19. Mastronikolis S, Tsiambas E, Pagkalou M, Makri OE, Thomopoulou VK, Peschos D, et al. c-FOS expression analysis in pterygia cell spot arrays. Vivo Athens Greece (2022) 36:2143–8. doi: 10.21873/invivo.12940
20. Durchdewald M, Angel P, Hess J. The transcription factor Fos: a Janus-type regulator in health and disease. Histol Histopathol (2009) 24:1451–61. doi: 10.14670/HH-24.1451
21. Zenz R, Eferl R, Scheinecker C, Redlich K, Smolen J, Schonthaler HB, et al. Activator protein 1 (Fos/Jun) functions in inflammatory bone and skin disease. Arthritis Res Ther (2008) 10:201. doi: 10.1186/ar2338
22. Macián F, López-Rodríguez C, Rao A. Partners in transcription: NFAT and AP-1. Oncogene (2001) 20:2476–89. doi: 10.1038/sj.onc.1204386
23. McGuire KL, Iacobelli M. Involvement of Rel, Fos, and Jun proteins in binding activity to the IL-2 promoter CD28 response element/AP-1 sequence in human T cells. J Immunol Baltim Md 1950 (1997) 159:1319–27. doi: 10.4049/jimmunol.159.3.1319
24. Roy S, Charboneau R, Melnyk D, Barke RA. Interleukin-4 regulates macrophage interleukin-12 protein synthesis through a c-fos mediated mechanism. Surgery (2000) 128:219–24. doi: 10.1067/msy.2000.108063
25. Wagner EF, Matsuo K. Signalling in osteoclasts and the role of Fos/AP1 proteins. Ann Rheum Dis (2003) 62:ii83–5. doi: 10.1136/ard.62.suppl_2.ii83
26. Matsuo K, Ray N. Osteoclasts, mononuclear phagocytes, and c-Fos: new insight into osteoimmunology. Keio J Med (2004) 53:78–84. doi: 10.2302/kjm.53.78
27. Veale DJ, Ritchlin C, FitzGerald O. Immunopathology of psoriasis and psoriatic arthritis. Ann Rheum Dis (2005) 64:ii26–9. doi: 10.1136/ard.2004.031740
28. Takayanagi H, Kim S, Matsuo K, Suzuki H, Suzuki T, Sato K, et al. RANKL maintains bone homeostasis through c-Fos-dependent induction of interferon-beta. Nature (2002) 416:744–9. doi: 10.1038/416744a
29. Takayanagi H, Kim S, Koga T, Nishina H, Isshiki M, Yoshida H, et al. Induction and activation of the transcription factor NFATc1 (NFAT2) integrate RANKL signaling in terminal differentiation of osteoclasts. Dev Cell (2002) 3:889–901. doi: 10.1016/s1534-5807(02)00369-6
30. Hess J, Porte D, Munz C, Angel P. AP-1 and cbfa/runt physically interact and regulate parathyroid hormone-dependent MMP13 expression in osteoblasts through a new osteoblast-specific element 2/AP-1 composite element*. J Biol Chem (2001) 276:20029–38. doi: 10.1074/jbc.M010601200
31. Aikawa Y, Morimoto K, Yamamoto T, Chaki H, Hashiramoto A, Narita H, et al. Treatment of arthritis with a selective inhibitor of c-Fos/activator protein-1. Nat Biotechnol (2008) 26:817–23. doi: 10.1038/nbt1412
32. Tashiro K, Konishi H, Sano E, Nabeshi H, Yamauchi E, Taniguchi H. Suppression of the ligand-mediated down-regulation of epidermal growth factor receptor by ymer, a novel tyrosine-phosphorylated and ubiquitinated protein*. J Biol Chem (2006) 281:24612–22. doi: 10.1074/jbc.M604184200
33. Bohgaki M, Tsukiyama T, Nakajima A, Maruyama S, Watanabe M, Koike T, et al. Involvement of Ymer in suppression of NF-kappaB activation by regulated interaction with lysine-63-linked polyubiquitin chain. Biochim Biophys Acta (2008) 1783:826–37. doi: 10.1016/j.bbamcr.2007.09.006
34. Wertz IE, O’Rourke KM, Zhou H, Eby M, Aravind L, Seshagiri S, et al. De-ubiquitination and ubiquitin ligase domains of A20 downregulate NF-kappaB signalling. Nature (2004) 430:694–9. doi: 10.1038/nature02794
35. Lee EG, Boone DL, Chai S, Libby SL, Chien M, Lodolce JP, et al. Failure to regulate TNF-induced NF-kappaB and cell death responses in A20-deficient mice. Science (2000) 289:2350–4. doi: 10.1126/science.289.5488.2350
36. Zhi X, Chen Q, Song S, Gu Z, Wei W, Chen H, et al. Myostatin promotes osteoclastogenesis by regulating ccdc50 gene expression and RANKL-induced NF-κB and MAPK pathways. Front Pharmacol (2020) 11:565163 (accessed 27 Feb 2023. doi: 10.3389/fphar.2020.565163
37. Brahe CH, Ørnbjerg LM, Jacobsson L, Nissen MJ, Kristianslund EK, Mann H, et al. Retention and response rates in 14 261 PsA patients starting TNF inhibitor treatment-results from 12 countries in EuroSpA. Rheumatol Oxf Engl (2020) 59:1640–50. doi: 10.1093/rheumatology/kez427
38. Curry PDK, Morris AP, Barton A, Bluett J. Do genetics contribute to TNF inhibitor response prediction in Psoriatic Arthritis? Pharmacogenom J (2023) 23:1–7. doi: 10.1038/s41397-022-00290-8
39. Angioni MM, Piras C, Floris A, Leoni VP, Congia M, Chessa E, et al. POS0422 metabolomic fingerprint to discriminate remission from active disease and healthy controls in psoriatic arthritis. Ann Rheum Dis (2023) 82:467. doi: 10.1136/annrheumdis-2023-eular.2949
40. Li B, Li G, Song Z, Zhang Z. Serum calprotectin as a promising inflammatory biomarker in psoriatic arthritis: a 1-year longitudinal study. Rheumatol Ther (2023) 10:149–60. doi: 10.1007/s40744-022-00501-5
Keywords: psoriatic arthritis, clinical remission, transcriptomic, FOS, CCDC50
Citation: Angioni MM, Floris A, Cangemi I, Congia M, Chessa E, Naitza MR, Piga M and Cauli A (2023) Molecular profiling of clinical remission in psoriatic arthritis reveals dysregulation of FOS and CCDC50 genes: a gene expression study. Front. Immunol. 14:1274539. doi: 10.3389/fimmu.2023.1274539
Received: 10 August 2023; Accepted: 11 October 2023;
Published: 27 October 2023.
Edited by:
Katarzyna Bogunia-Kubik, Polish Academy of Sciences, PolandReviewed by:
René Huber, Hannover Medical School, GermanyBeniamin Oskar Grabarek, Academy of Silesia, Poland
Copyright © 2023 Angioni, Floris, Cangemi, Congia, Chessa, Naitza, Piga and Cauli. This is an open-access article distributed under the terms of the Creative Commons Attribution License (CC BY). The use, distribution or reproduction in other forums is permitted, provided the original author(s) and the copyright owner(s) are credited and that the original publication in this journal is cited, in accordance with accepted academic practice. No use, distribution or reproduction is permitted which does not comply with these terms.
*Correspondence: Maria Maddalena Angioni, bS5tYWRkYWxlbmEuYW5naW9uaUBnbWFpbC5jb20=