 Yaqing Zhao1
 Jiazhong Ren2*
- 1Department of General Affairs Section, The Second Affiliated Hospital of Shandong University of Traditional Chinese Medicine, Jinan, Shandong, China
- 2Department of Medical Imaging, PET-CT Center, Shandong Cancer Hospital and Institute, Shandong First Medical University and Shandong Academy of Medical Sciences, Jinan, Shandong, China
Purpose: This prospective study examined whether metabolism parameters obtained using the tracer 18F-AlFNOTA-fibroblast activation protein inhibitor (FAPI)-04 (denoted as 18F-FAPI-04) in positron emission tomography/computed tomography (PET/CT) can predict programmed death ligand-1 (PD-L1) expression in patients with locally advanced esophageal squamous cell carcinoma (LA-ESCC).
Patients and methods: The 24 enrolled LA-ESCC patients underwent an 18F-FAPI-04 PET/CT scan. The maximum, mean, peak and standard deviation standard uptake values (SUVmax, SUVmean, SUVpeak and SUVsd), metabolic tumor volume (MTV), and total lesion FAP (TLF) expression of the primary tumor were collected. Additionally, we evaluated PD-L1 expression on cancer cells by immunohistochemistry and immunofluorescence methods. Patients were divided into negative and positive expressions according to the expression of PD-L1 (CPS < 10 and CPS ≥ 10), and the variables were compared between the two groups.
Results: The SUVmax, SUVmean, SUVpeak and SUVsd were significantly higher in patients with positive expression than in negative expression (all p < 0.05). Receiver operating characteristic curve analysis identified SUVmean (area under the curve [AUC] = 0.882, p = 0.004), SUVsd (AUC = 0.874, p = 0.005), SUVpeak (AUC = 0.840, p = 0.010) and SUVmax (AUC = 0.765, p = 0.045) as significant predictors of the PD-L1 positive expression, with cutoff values of 9.67, 1.90, 9.67 and 13.71, respectively. On univariate logistic regression analysis, SUVmean (p = 0.045), SUVsd (p = 0.024), and SUVpeak (p = 0.031) were significantly correlated with the PD-L1 positive expression. On multivariable logistic regression analysis, SUVsd (p = 0.035) was an optimum predictor factor for PD-L1 positive expression.
Conclusion: 18F-FAPI-04 PET/CT parameters, including SUVmean, SUVpeak, and SUVsd, correlated with PD-L1 expression in patients with LA-ESCC, and thus SUVsd was an optimum predictor for PD-L1 positive expression, which could help to explore the existence of immune checkpoints and select ESCC candidates for immunotherapy.
1 Introduction
Esophageal cancer (EC) is one of the most common malignant tumors of the digestive system in the world, ranking seventh in incidence and sixth in mortality overall in 2020 (1, 2). Esophageal squamous cell carcinoma (ESCC) is the main histological type of esophageal cancer in China. The prognosis for esophageal cancer is poor, with a 5-year survival rate of only 15%-25% worldwide (3). At present, the treatment options available are limited.
With the development and application of immunotherapy, programmed death ligand-1 (PD-L1) has been shown to significantly prolong the overall survival of EC patients with manageable safety (4–6). In 2019, the immune checkpoint inhibitor pembrolizumab was approved by the Food and Drug Administration (FDA) as a second-line therapy to treat patients with locally advanced or metastatic ESCC whose tumors are positively expressing PD-L1 (Combined Positive Score [CPS] ≥10) (5). Immunohistochemistry (IHC) expression of PD-L1 is the most widely used biomarker for predicting the efficacy of esophageal cancer immunotherapy, and accurate and reliable PD-L1 testing is crucial for screening potential beneficiaries of immunotherapy.
Fibroblast activation protein (FAP) is a member of the dipeptidyl peptidase 4 protein family and has both endopeptidase and dipeptidyl peptidase activities. FAP is highly expressed in stromal fibroblasts of more than 90% of epithelial carcinomas (7, 8). Research has shown that high expression of FAP in stromal fibroblasts of breast cancer, colon cancer, esophageal cancer and other malignant tumors is related to poor prognosis (9–11). 68Ga-DOTAFAPI-04 has diagnostic and therapeutic potential in oncologic and nononcologic diseases (12, 13). 68Ga-FAPI-04 has been explored the value of predicting treatment outcomes and prognosis for EC patients (14–16). We previously performed a pilot clinical study in which 18F-FAPI-04, a novel tracer, was safe and offered high specificity for FAP imaging (17). However, the ability of 68Ga-FAPI/18F-FAPI-04 PET/CT to predict PD-L1 expression in EC needs to be validated by prospective studies.
The present study aimed to identify imaging parameters that could predict tumor PD-L1 expression by comparing 18F-FAPI-04 PET/CT parameters between patients with EC classified as negative (CPS < 10) and positive expression (CPS ≥ 10). Identifying patients with PD-L1 positively expressed by imaging will help realize the individualized treatment of tumors and improve prognosis.
2 Methods
2.1 Patients
Potentially eligible locally advanced esophageal squamous cell carcinoma (LA-ESCC) patients were recruited at Shandong Cancer Hospital and Institute from June 2021 to July 2022 (Table 1). All patients volunteered to participate in this study, and the local ethics committee of Shandong Cancer Hospital and Institute approved the prospective study.
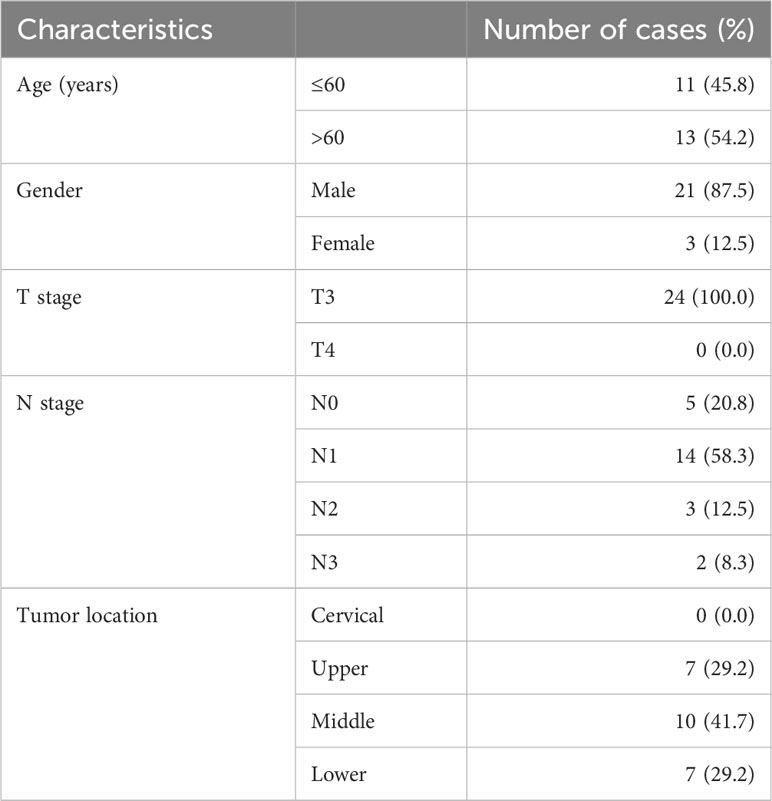
Table 1 Characteristics of enrolled LA-ESCC patients (N=24).
Patients were enrolled based on the following criteria: (1) histopathologically confirmed esophageal squamous cell carcinoma(T3~4N0~3M0); (2) age ≥ 18 years; (3) presence of measurable primary tumors;(4) PD-L1 expression assay was conducted and (5) 18F-FAPI-04 PET/CT scanning was performed.
The exclusion criteria included: (1) pregnancy or breastfeeding; and (2) unwillingness to participate or withdraw. The flow chart of research and design is shown in Figure 1.
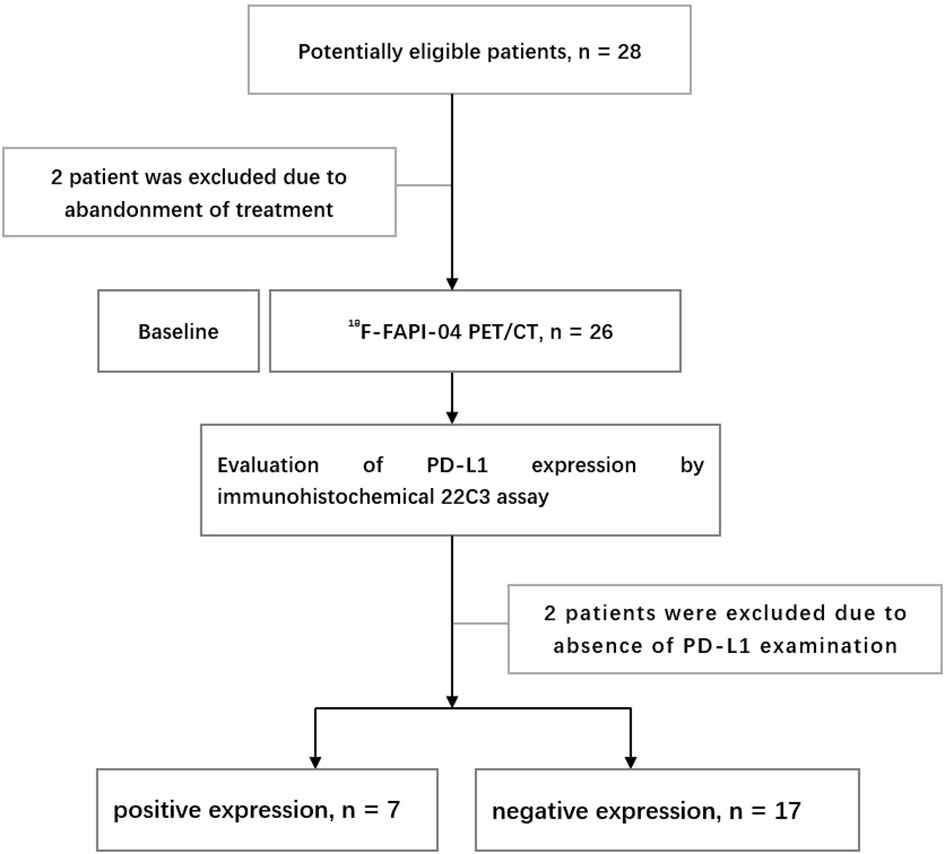
Figure 1 Research flowchart.
2.2 18F-FAPI-04 PET/CT scanning
18F-FAPI-04 was synthesized as described previously (18). Patients were not required to fast or under blood glucose measurement before scanning. After intravenous injection of 18F-FAPI-04 (4.81 MBq/kg), the patients needed to rest for approximately 1 h. Scanning was then performed with two different PET/CT(GE MINI TF Big Bore; Philips Healthcare, Cleveland, OH, USA). Whole-body CT scans were obtained using a low-dose protocol (300 mAs, 120 kV, a 512 × 512 matrix, rotation time of 1.0 s, and pitch index of 0.688; reconstructed with a soft-tissue kernel to a slice thickness of 2 mm) for attenuation correction. PET data were acquired in three-dimensional mode using a 200 × 200 matrix with an imaging time of 1 min per bed position. During image acquisition, the patients maintained normal shallow breathing. Subsequently, after attenuation and correction (Biograph 3D iterative reconstruction software, time of flight [TOF] correction), we viewed attenuation-corrected PET images, CT images, and PET/CT fusion images.
2.3 Imaging analysis
The attenuation-corrected CT images, PET images, and fused PET/CT images were displayed in coronal, sagittal, and transaxial slices, which were viewed and analyzed on the Nuclear Medicine Information System (Beijing Mozi Healthcare Ltd, Beijing, China). Two experienced PET/CT physicians (J.Z. and J.R., with 18 and 6 years, respectively, of nuclear oncology experience) visually assessed the 18F-FAPI-04 PET/CT images and reached a consensus regarding the image interpretations for primary tumors. Regions of interest were drawn around tumor lesions with higher uptake in transaxial sections, and 18F-FAPI-04 PET/CT parameters were generated by an automated 3-dimensional contouring program with a 30% isocontour. The uptake values in the region of interest were normalised to the injected dose per kilogram of patient body weight, and the standardised uptake values were derived according to the following formula: [measured radioactivity concentration (Bq/mL) × body weight (g)]/injected radioactivity concentration (Bq). Regions of interest were drawn around the primary tumor lesion, and the obtained parameters, including SUVmax, SUVmean, SUVpeak, SUVsd, metabolic tumor volume (MTV), and total lesion FAP expression (TLF), were generated by an automated contouring program provided by the vendor. TLF (total lesion FAP expression) was calculated as the product of the SUVmean of the lesion and the MTV (TLF= SUVmean× MTV). We also measured the SUVmean of 1 cm3 areas in the ascending aorta, liver and Lumbar 5 (L5) vertebrae. The circular region of interest (ROI) of 1cm3 was drawn in the normal regions of segments VII and VIII of the liver. The average of the liver SUVmean was calculated. The ratio of the SUVmax of the primary tumor to the SUVmean of the normal tissue (blood, liver and L5 vertebrae) is then calculated and is called the tumor to background ratio (TBRblood, TBRliver and TBRbone). For controversial lesions, discussion among the imaging experts with consideration of the results from other imaging modalities proceeded until a final consensus was reached.
2.4 Evaluation of PD-L1 expression by immunohistochemical 22C3 assay
In our study, PD-L1 expression in all patients was obtained by gastroscopic biopsy for pathological tissue of esophageal cancer.
PD-L1 expression was assessed by CPS, which was defined as the number of PD-L1 stained cells (tumor cells, lymphocytes and macrophages) divided by the total number of surviving tumor cells multiplied by 100. The maximum CPS is defined as 100. All other cells, such as tumor-associated plasma cells, neutrophils, normal/non-neoplastic cells, and necrotic cells, were excluded from the evaluation. The cutoff value was determined according to an FDA-approved test and the guidelines of pembrolizumab treatment and separated into two classifications: negative (CPS < 10) and positive expression (CPS ≥ 10) (5, 17). Patients without sufficient viable tumor cells (<100) were excluded. Each slide was blindly given a CPS for PD-L1 expression by two experienced pathologists. Both hematoxylin–eosin (HE) staining and PD-L1 IHC staining were assessed to reach a final CPS value. Two experienced pathologists (D.Z. and H.J., with 25 and 22 years, respectively, of oncology experience) evaluated pathological slides. Each case has a final consistent result after discussion.
2.5 Statistical analysis
Statistical analyzes were performed using SPSS software (version 27.0 for Windows; SPSS INC.). Continuous data were described as the mean ± standard deviation (mean ± SD) or median and interquartile, depending on whether they followed a normal distribution. and non-normally distributed data (including MTV) was expressed as the median and interquartile. Comparisons of normally distributed data between the two groups were performed using a paired two-sample t test, and comparisons of non-normally distributed data between the two groups were performed using the Mann–Whitney U test. Binary logistic regression analyses were performed to ascertain the relationships between 18F-FAPI-04 PET/CT parameters, tumor location, degree of differentiation and PD-L1 expression. Receiver operating characteristic (ROC) curve analysis was used to determine the threshold values with the maximum Youden index of 18F-FAPI-04 PET/CT parameters for PD-L1 positive expression. Spearman rank correlation coefficients were calculated to assess the relationship between 18F-FAPI-04 PET/CT parameters and PD-L1 expression. All tests were two-sided, and a probability of less than 0.05 was considered statistically significant.
3 Results
3.1 Patients’ characteristics
From June 2021 to July 2022, 24 patients diagnosed with LA-ESCC based on histological examinations at Shandong Cancer Hospital and Institute were enrolled in this study. The characteristics of the patients are presented in Table 1. Among all patients, 17 patients were classified as negative expression (CPS < 10), and 7 patients as positive expression (CPS ≥ 10). Figure 2 shows representative 18F-FAPI-04 PET/CT imaging results for two cases classified as positive and negative PD-L1 expression.
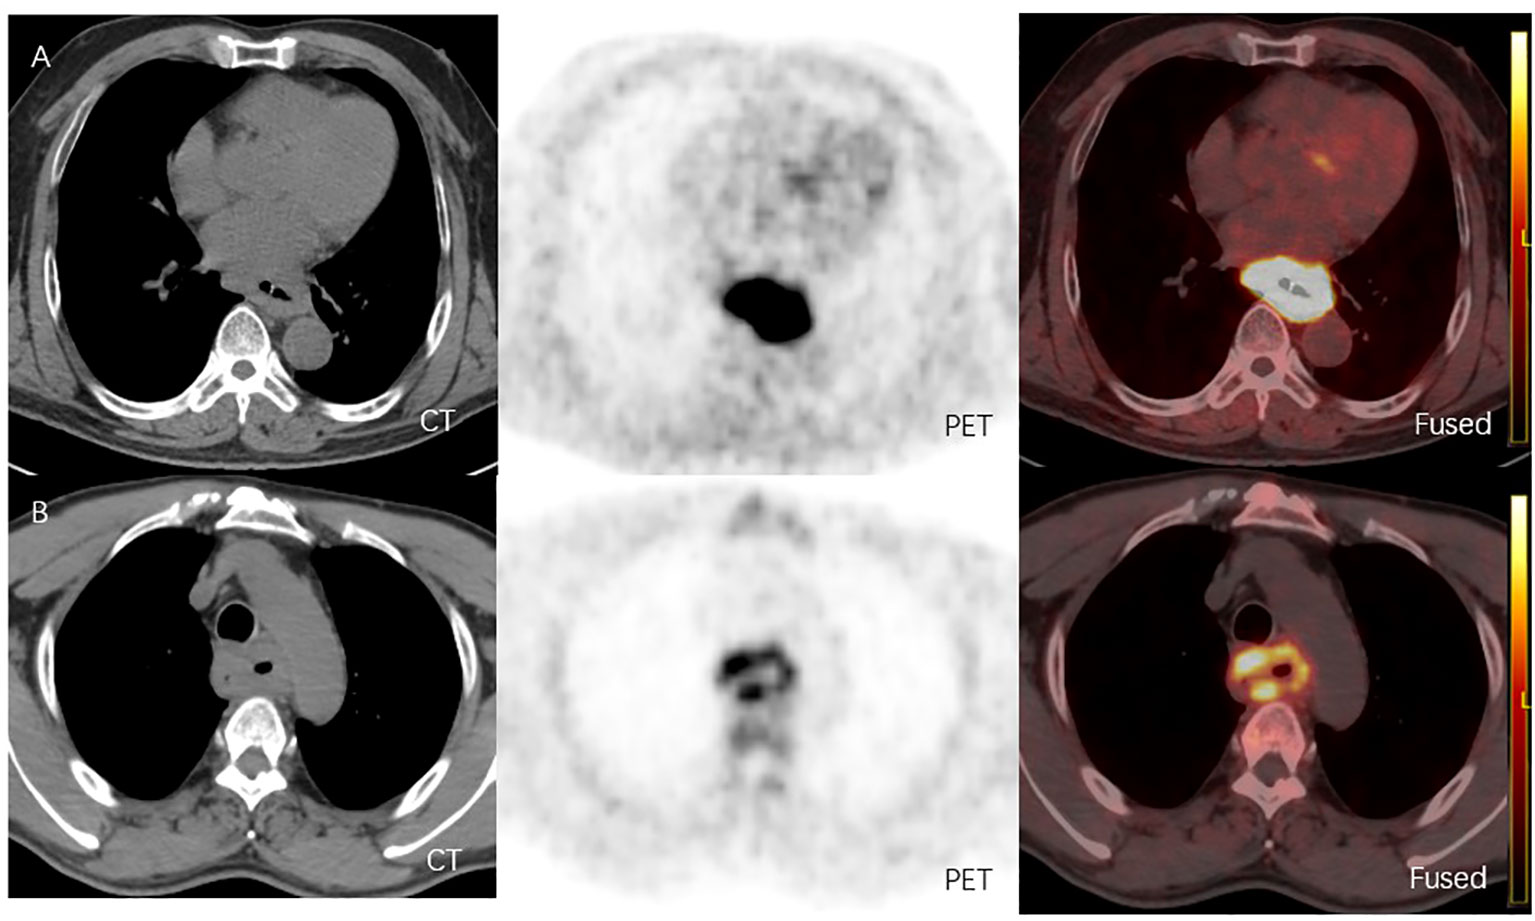
Figure 2 (A) 18F-FAPI-04 PET/CT and CT images of a LA-ESCC patient with an outcome classified as PD-L1 positive expression(CPS about 70), with SUVmax 15.36, SUVmean 8.60, SUVpeak 11.02, SUVsd 2.47, MTV 51.52 cm3 and TLF 443.07g. (B) 18F-FAPI-04 PET/CT and CT images of a LA-ESCC patient with an outcome classified as PD-L1 positive expression(CPS<1) , with SUVmax 6.45, SUVmean 3.36, SUVpeak 4.51, SUVsd 0.89, MTV 53.99 cm3 and TLF 181.41g.
3.2 Quantitative 18F-FAPI-04 PET/CT parameters
The quantitative 18F-FAPI-04 PET/CT parameters SUVmax, SUVmean, SUVpeak, SUVsd, MTV and TLF are shown in Table 2 for all patients, negative (CPS < 10) and positive expression (CPS≥10) patients. SUVmax, SUVmean, SUVpeak, and SUVsd were significantly higher in positive expression patients than in negative (14.13 ± 4.41 vs. 10.61 ± 2.77, p = 0.027; 8.67 ± 1.97 vs. 5.74 ± 1.60, p<0.001; 11.15 ± 2.90 vs.7.77 ± 2.31, p = 0.006 and 2.57 ± 0.48 vs. 1.73 ± 0.59, p = 0.003) (Table 2). None of the other parameters showed a significant difference between negative and positive PD-L1 expression.
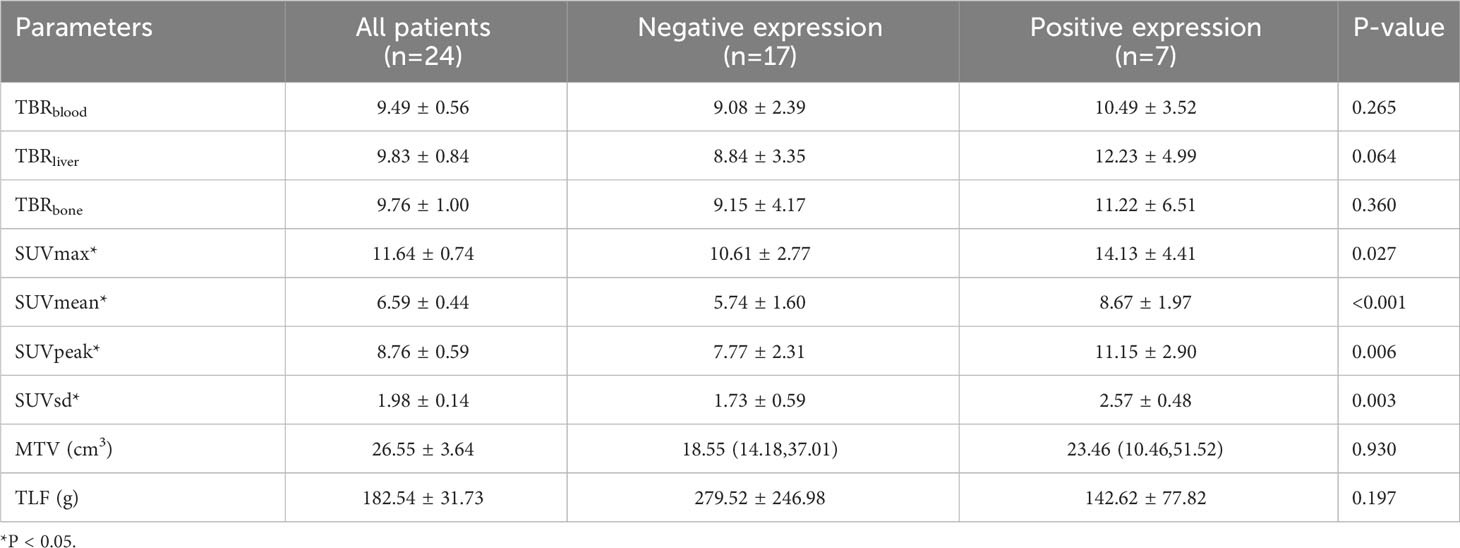
Table 2 Parameters calculated from 18F-FAPI-04 PET/CT scans.
3.3 The ability of 18F-FAPI-04 PET/CT parameters to predict PD-L1 expression
ROC curves were generated to evaluate the predictive accuracy of 18F-FAPI-04 PET/CT parameters for identifying negative and positive expression patients (Table 3; Figure 3). The AUC value for SUVmean (AUC = 0.882) was higher than those for SUVsd (AUC =0.874), SUVpeak (AUC =0.840) and SUVmax (AUC=0.765) (Table 3), while the AUC values for all four parameters were significant (p = 0.004, p = 0.005, p = 0.010 and p = 0.045, respectively) (Table 3). The cutoff values for SUVmean, SUVsd, SUVpeak and SUVmax, based on the Youden indexes, were 7.38, 1.90, 9.67 and 13.71, respectively (Table 3).
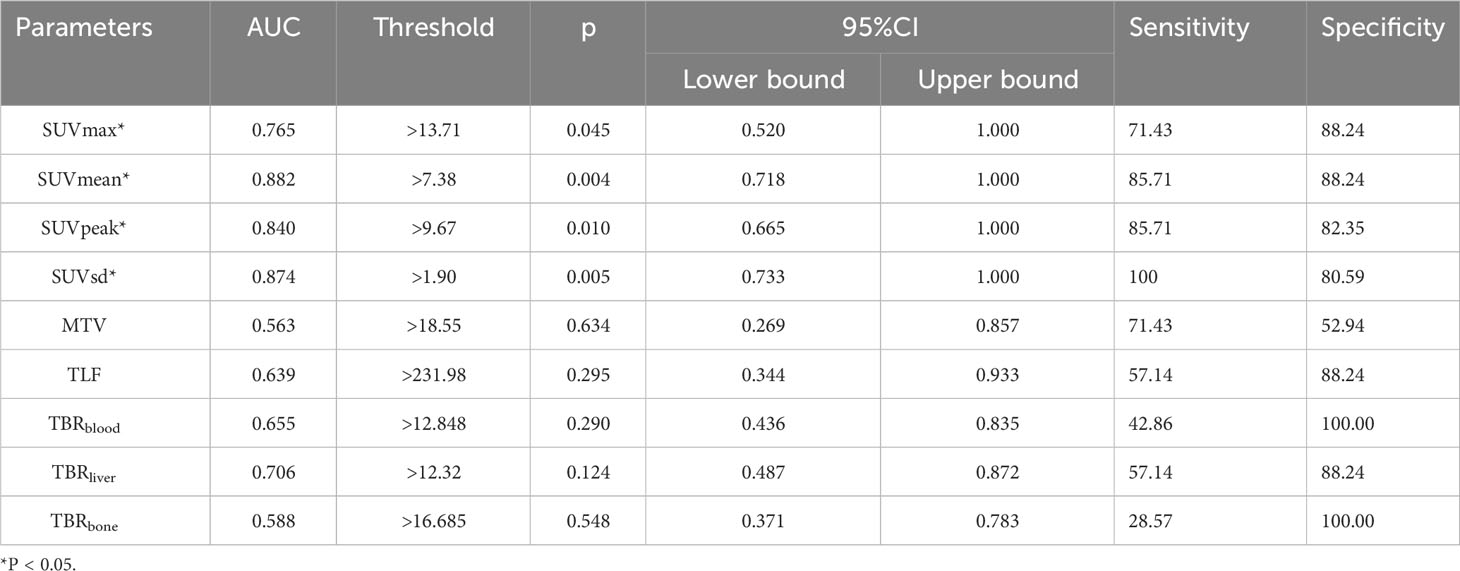
Table 3 Areas under the curve for the ability of 18F-FAPI-04 PET/CT parameters to predict PD-L1 expression.
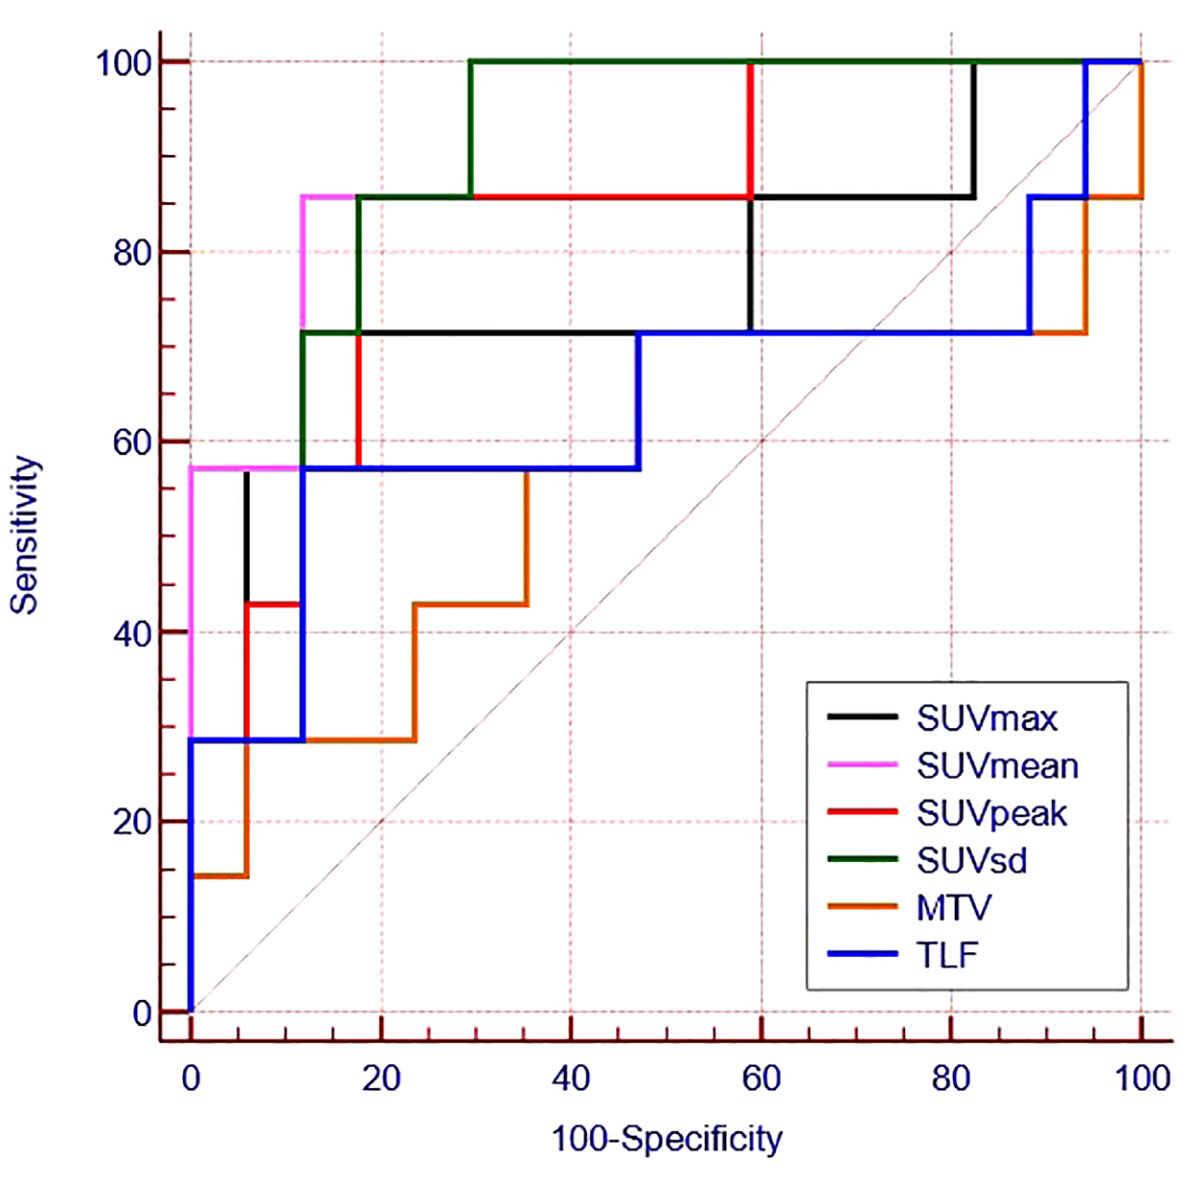
Figure 3 Receiver operating characteristic curves for the ability of 18F -FAPI-04 PET/CT parameters to predict PD-L1 expression.
3.4 Correlations between 18F-FAPI-04 PET/CT parameters and PD-L1 expression
We found a moderate correlation between SUVsd, SUVean, SUVPeak, SUVmax and PD-L1 expression (rs=0.584,p=0.003; rs=0.571,p=0.004; rs=0.511,p=0.011; rs=0.462,p=0.024, respectively). The correlation between 18F-FAPI-04PET/CT biomarkers extracted from tumor lesions and PD-L1 expression is shown in Table 4.
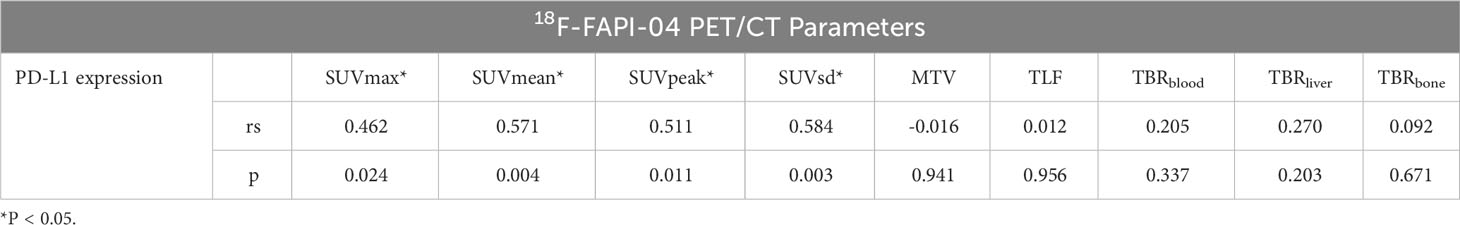
Table 4 Correlations between 18F-FAPI-04 PET/CT parameters and PD-L1 expression.
3.5 Associations between 18F-FAPI-04 PET/CT parameters, clinical features and PD-L1 expression
According to univariate logistic regression analyses, SUVmean (p = 0.026), SUVpeak (p = 0.031), and SUVsd (p = 0.024) were independently associated with the PD-L1 expression in LA-ESCC patients (Table 5). Due to the moderate positive correlation among SUVmean, SUVsd and SUVpeak, we only included SUVsd (the largest correlation coefficient) and TBRliver (p = 0.059) in the multivariate logistic analysis. Finally, only SUVsd (p = 0.035) was an optimum predictor of PD-L1 expression in these patients (Table 5).
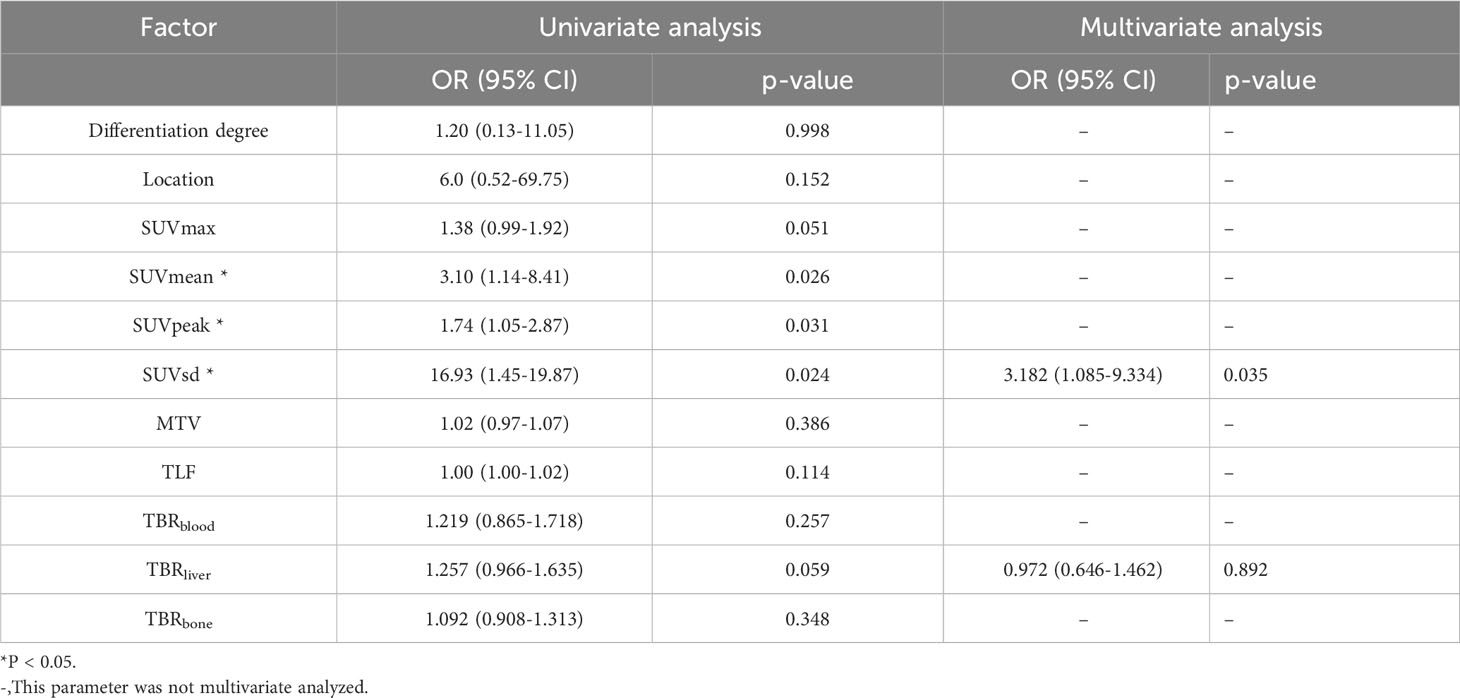
Table 5 Univariate and multivariate logistic regression analyses of 18F-FAPI-04 PET/CT parameters and clinical factors for predicting PD-L1 expression.
4 Discussion
ESCC is the most common type of esophageal cancer, and about 46.8% of ESCC showed positive PD-L1 expression (19). PD-L1 expression in ESCC is an indicator for immunotherapy and a potential prognostic marker for untreated ESCC patients (20, 21). 68Ga-FAPI-04 PET/CT can not only better display the primary tumor and regional lymph nodes, but also the high uptake rate and low background activity of esophageal cancer to facilitate accurate delineation of the target area (22). Therefore, whether parameters from 18F/68Ga-FAPI-04 PET/CT scans can predict PD-L1 expression in esophageal cancer warrants a prospective study.
In 2019, the immune checkpoint inhibitor pembrolizumab was approved by the Food and Drug Administration (FDA) as a second-line therapy to treat patients with locally advanced or metastatic ESCC whose tumors are positively expressing PD-L1 (Combined Positive Score [CPS] ≥10) (22). Therefore, we chose CPS ≥10 as PD-L1 positive expression in our study and investigated PD-L1 expression correlation with parameters of 18F- FAPI-04 PET/CT and clinicopathological characteristics in ESCC.
18F-FDG PET/CT can predict tumor microenvironment and PD-L1 expression in many tumors (14, 23). It has been reported that 18F-FDG PET/CT can provide metabolic information on tumor immune microenvironment in breast cancer and clear cell renal cell carcinoma (23, 24). Many literatures reported that SUVmax of 18F-FDG PET/CT could predict PD-L1 expression in lung adenocarcinomas and squamous cell carcinomas (25, 26). Meanwhile, SUVmax could predict PD-L1 status in cervical cancer (27). These all revealed that the tumor lesion FDG activity (glucose activity) was mainly associated with PD-L1 positive expression.
In our study, the results suggest that specific parameters derived from 18F-FAPI-04 PET/CT scans, particularly SUVmean, SUVpeak, and SUVsd were associated with predicting PD-L1 expression of ESCC. By multivariable logistic regression analysis, SUVsd was an optimum predictor for PD-L1 positive expression in ESCC. SUVsd could reflect intratumoral heterogeneity (28–31). The tumor microenvironment can promote the heterogeneity of tumors, including fibroblasts, vascular and immune cells, and the extracellular matrix (32, 33), which also impacts the PD-L1 expression. Thus, different from the correlation between PD-L1 expression and tumor glucose activity (FDG activity) in 18F-FDG PET/CT imaging, SUVsd was an optimal predictor of PD-L1 positive expression in 18F-FAPI-04 PET/CT imaging, which may be related to its can reflect tumor microenvironment.
The main limitations of the present study include its single-center design and the relatively small sample size. Further large-scale, multi-center clinical studies are needed to confirm our findings before their clinical application. Additionally, many antibodies in PD-L1 expression detection, such as 22C3, SP263, SP142, etc. We use 22C3 for PD-L1 expression detection in our hospital, and the correlation between other methods for PD-L1 expression and 18F-FAPI-04 PET/CT parameters needs further study. In addition, probably due to the short follow-up period or small sample size, the 18F-FAPI-04 PET/CT parameters could not predict the prognosis of the patients, and we will continue to study this topic.
5 Conclusion
18F-FAPI-04 PET/CT parameters, including SUVmean, SUVpeak, and SUVsd, were associated with PD-L1 expression in patients with LA-ESCC, and thus, SUVsd was an optimal predict for PD-L1 positive expression, which could help to explore the existence of immune checkpoints and select ESCC candidates for immunotherapy.
Data availability statement
The original contributions presented in the study are included in the article/supplementary material. Further inquiries can be directed to the corresponding author.
Ethics statement
The studies involving humans were approved by Tumour Hospital of Shandong First Medical University. The studies were conducted in accordance with the local legislation and institutional requirements. The participants provided their written informed consent to participate in this study.
Author contributions
YZ: Writing – original draft, Data curation. JR: Software, Writing – original draft, Writing – review & editing.
Funding
The author(s) declare that no financial support was received for the research, authorship, and/or publication of this article.
Acknowledgments
We thank experienced nuclear medicine physician J.Z. and pathologist (D.Z. and H.J.,) for their help.
Conflict of interest
The authors declare that the research was conducted in the absence of any commercial or financial relationships that could be construed as a potential conflict of interest.
Publisher’s note
All claims expressed in this article are solely those of the authors and do not necessarily represent those of their affiliated organizations, or those of the publisher, the editors and the reviewers. Any product that may be evaluated in this article, or claim that may be made by its manufacturer, is not guaranteed or endorsed by the publisher.
References
1. Siegel RL, Miller KD, Fuchs HE, Jemal A. Cancer statistics, 2022. CA Cancer J Clin (2022) 72:7–33. doi: 10.3322/caac.21708
2. Sung H, Ferlay J, Siegel RL, Laversanne M, Soerjomataram I, Jemal A, et al. Global cancer statistics 2020: GLOBOCAN estimates of incidence and mortality worldwide for 36 cancers in 185 countries. CA Cancer J Clin (2021) 71:209–49. doi: 10.3322/caac.21660
3. Uhlenhopp DJ, Then EO, Sunkara T, Gaduputi V. Epidemiology of esophageal cancer: update in global trends, etiology and risk factors. Clin J Gastroenterol (2020) 13:1010–21. doi: 10.1007/s12328-020-01237-x
4. Huang J, Xu J, Chen Y, Zhuang W, Zhang Y, Chen Z, et al. Camrelizumab versus investigator's choice of chemotherapy as second-line therapy for advanced or metastatic oesophageal squamous cell carcinoma (ESCORT): a multicentre, randomised, open-label, phase 3 study. Lancet Oncol (2020) 21:832–42. doi: 10.1016/S1470-2045(20)30110-8
5. Kato K, Cho BC, Takahashi M, Okada M, Lin CY, Chin K, et al. Nivolumab versus chemotherapy in patients with advanced oesophageal squamous cell carcinoma refractory or intolerant to previous chemotherapy (ATTRACTION-3): a multicentre, randomised, open-label, phase 3 trial. Lancet Oncol (2019) 20:1506–17. doi: 10.1016/S1470-2045(19)30626-6
6. Shah MA, Kojima T, Hochhauser D, Enzinger P, Raimbourg J, Hollebecque A, et al. Efficacy and safety of pembrolizumab for heavily pretreated patients with advanced, metastatic adenocarcinoma or squamous cell carcinoma of the esophagus: the phase 2 KEYNOTE-180 study. JAMA Oncol (2019) 5:546–50. doi: 10.1001/jamaoncol.2018.5441
7. Zi F, He J, He D, Li Y, Yang L, Cai Z. Fibroblast activation protein alpha in tumor microenvironment: recent progression and implications (review). Mol Med Rep (2015) 11:3203–11. doi: 10.3892/mmr.2015.3197
8. Altmann A, Haberkorn U, Siveke J. The latest developments in imaging of fibroblast activation protein. J Nucl Med (2021) 62:160–7. doi: 10.2967/jnumed.120.244806
9. Shi M, Yu DH, Chen Y, Zhao CY, Zhang J, Liu QH, et al. Expression of fibroblast activation protein in human pancreatic adenocarcinoma and its clinicopathological significance. World J Gastroenterol (2012) 18:840–6. doi: 10.3748/wjg.v18.i8.840
10. Park H, Lee Y, Lee H, Kim JW, Hwang JH, Kim J, et al. The prognostic significance of cancer-associated fibroblasts in pancreatic ductal adenocarcinoma. Tumour Biol (2017) 39:1010428317718403. doi: 10.1177/1010428317718403
11. Saigusa S, Toiyama Y, Tanaka K, Yokoe T, Okugawa Y, Fujikawa H, et al. Cancer-associated fibroblasts correlate with poor prognosis in rectal cancer after chemoradiotherapy. Int J Oncol (2011) 38:655–63. doi: 10.3892/ijo.2011.906
12. Mori Y, Dendl K, Cardinale J, Kratochwil C, Giesel FL, Haberkorn U. FAPI PET: fibroblast activation protein inhibitor use in oncologic and nononcologic disease. Radiology (2023) 306:e220749. doi: 10.1148/radiol.220749
13. Wang L, Tang G, Hu K, Liu X, Zhou W, Li H, et al. Comparison of (68)Ga-FAPI and (18)F-FDG PET/CT in the evaluation of advanced lung cancer. Radiology (2022) 303:191–9. doi: 10.1148/radiol.211424
14. Hu X, Zhou T, Ren J, Duan J, Wu H, Liu X, et al. Response prediction using (18)F-FAPI-04 PET/CT in patients with esophageal squamous cell carcinoma treated with concurrent chemoradiotherapy. J Nucl Med (2023) 64:625–31. doi: 10.2967/jnumed.122.264638
15. Zhao L, Pang Y, Chen S, Chen J, Li Y, Yu Y, et al. Prognostic value of fibroblast activation protein expressing tumor volume calculated from [(68) Ga]Ga-FAPI PET/CT in patients with esophageal squamous cell carcinoma. Eur J Nucl Med Mol Imaging (2023) 50:593–601. doi: 10.1007/s00259-022-05989-1
16. Liu Q, Shi S, Xu X, Yu X, Song S. The superiority of [(68)Ga]-FAPI-04 over [(18)F]-FDG PET/CT in imaging metastatic esophageal squamous cell carcinoma. Eur J Nucl Med Mol Imaging (2021) 48:1248–9. doi: 10.1007/s00259-020-04997-3
17. Wei Y, Zheng J, Ma L, Liu X, Xu S, Wang S, et al. [(18)F]AlF-NOTA-FAPI-04: FAP-targeting specificity, biodistribution, and PET/CT imaging of various cancers. Eur J Nucl Med Mol Imaging (2022) 49:2761–73. doi: 10.1007/s00259-022-05758-0
18. Wei Y, Cheng K, Fu Z, Zheng J, Mu Z, Zhao C, et al. [(18)F]AlF-NOTA-FAPI-04 PET/CT uptake in metastatic lesions on PET/CT imaging might distinguish different pathological types of lung cancer. Eur J Nucl Med Mol Imaging (2022) 49:1671–81. doi: 10.1007/s00259-021-05638-z
19. Huang Z, Jin Y, Cai X, Chen L, Shen X, Li B, et al. Association of the programmed death ligand-1 combined positive score in tumors and clinicopathological features in esophageal cancer. Thorac Cancer (2022) 13:523–32. doi: 10.1111/1759-7714.14285
20. Rong L, Liu Y, Hui Z, Zhao Z, Zhang Y, Wang B, et al. PD-L1 expression and its clinicopathological correlation in advanced esophageal squamous cell carcinoma in a Chinese population. Diagn Pathol (2019) 14:6. doi: 10.1186/s13000-019-0778-4
21. Yagi T, Baba Y, Ishimoto T, Iwatsuki M, Miyamoto Y, Yoshida N, et al. PD-L1 expression, tumor-infiltrating lymphocytes, and clinical outcome in patients with surgically resected esophageal cancer. Ann Surg (2019) 269:471–8. doi: 10.1097/SLA.0000000000002616
22. Peng D, He J, Liu H, Cao J, Wang Y, Chen Y. FAPI PET/CT research progress in digestive system tumours. Dig Liver Dis (2022) 54:164–9. doi: 10.1016/j.dld.2021.07.011
23. Wu C, Cui Y, Liu J, Ma L, Xiong Y, Gong Y, et al. Noninvasive evaluation of tumor immune microenvironment in patients with clear cell renal cell carcinoma using metabolic parameter from preoperative 2-[(18)F]FDG PET/CT. Eur J Nucl Med Mol Imaging (2021) 48:4054–66. doi: 10.1007/s00259-021-05399-9
24. Kimura Y, Sasada S, Emi A, Masumoto N, Kadoya T, Arihiro K, et al. (18)F-fluorodeoxyglucose positron emission tomography/computed tomography predicts tumor immune microenvironment function in early triple-negative breast cancer. Anticancer Res (2023) 43:127–36. doi: 10.21873/anticanres.16141
25. Wu X, Huang Y, Zhao Q, Wang L, Song X, Li Y, et al. PD-L1 expression correlation with metabolic parameters of FDG PET/CT and clinicopathological characteristics in non-small cell lung cancer. EJNMMI Res (2020) 10:51. doi: 10.1186/s13550-020-00639-9
26. Cui Y, Li X, Du B, Diao Y, Li Y. PD-L1 in lung adenocarcinoma: insights into the role of (18)F-FDG PET/CT. Cancer Manag Res (2020) 12:6385–95. doi: 10.2147/CMAR.S256871
27. Ji J, Pang W, Song J, Wang X, Tang H, Liu Y, et al. Retrospective analysis of the predictive value of (18)F-FDG PET/CT metabolic parameters for PD-L1 expression in cervical cancer. Diagnostics (Basel) (2023) 13:1015. doi: 10.3390/diagnostics13061015
28. Zhou W, Zhou Z, Wen J, Xie F, Zhu Y, Zhang Z, et al. A nomogram modeling (11)C-MET PET/CT and clinical features in glioma helps predict IDH mutation. Front Oncol (2020) 10:1200. doi: 10.3389/fonc.2020.01200
29. Yeh R, Trager MH, Rizk EM, Finkel GG, Barker LW, Carvajal RD, et al. FLT-PET at 6 weeks predicts response assessed by CT at 12 weeks in melanoma patients treated with pembrolizumab. Clin Nucl Med (2020) 45:267–75. doi: 10.1097/rlu.0000000000002967
30. Ke L, Wu L, Yu J, Meng X. Feasibility of semiquantitative 18F-fluorodeoxyglucose PET/computed tomography in patients with advanced lung cancer for interim treatment evaluation of combining immunotherapy and chemotherapy. Nucl Med Commun (2021) 42:1017–23. doi: 10.1097/mnm.0000000000001428
31. Hua T, Zhou W, Zhou Z, Guan Y, Li M. Heterogeneous parameters based on 18F-FET PET imaging can non-invasively predict tumor grade and isocitrate dehydrogenase gene 1 mutation in untreated gliomas. Quantitative Imaging Med Surgery (2021) 11:317–27. doi: 10.21037/qims-20-723
32. Ren Q, Zhang P, Lin H, Feng Y, Chi H, Zhang X, et al. A novel signature predicts prognosis and immunotherapy in lung adenocarcinoma based on cancer-associated fibroblasts. Front Immunol (2023) 14:1201573. doi: 10.3389/fimmu.2023.1201573
Keywords: fibroblast activation protein, positron emission tomography, PD-L1 expression, esophageal carcinoma, 18F-FAPI-04 PET/CT parameters
Citation: Zhao Y and Ren J (2023) 18F-FAPI-04 PET/CT parameters predict PD-L1 expression in esophageal squamous cell carcinoma. Front. Immunol. 14:1266843. doi: 10.3389/fimmu.2023.1266843
Received: 25 July 2023; Accepted: 25 October 2023;
Published: 15 November 2023.
Edited by:
Ines Zidi, Tunis El Manar University, TunisiaReviewed by:
Jules Zhang-Yin, Vivalia, BelgiumFlávia Dornelas Kurkowski, Pontifical Catholic University of Rio Grande do Sul, Brazil
Copyright © 2023 Zhao and Ren. This is an open-access article distributed under the terms of the Creative Commons Attribution License (CC BY). The use, distribution or reproduction in other forums is permitted, provided the original author(s) and the copyright owner(s) are credited and that the original publication in this journal is cited, in accordance with accepted academic practice. No use, distribution or reproduction is permitted which does not comply with these terms.
*Correspondence: Jiazhong Ren, MTA4NDQwNTIxMUBxcS5jb20=