 Shiyun Xiao
 Wen Zhang
 Nancy R. Manley
94% of researchers rate our articles as excellent or good
Learn more about the work of our research integrity team to safeguard the quality of each article we publish.
Find out more
ORIGINAL RESEARCH article
Front. Immunol. , 06 October 2023
Sec. T Cell Biology
Volume 14 - 2023 | https://doi.org/10.3389/fimmu.2023.1261081
Thymic epithelial cells (TECs) are essential for T cell development in the thymus, yet the mechanisms governing their differentiation are not well understood. Lin28, known for its roles in embryonic development, stem cell pluripotency, and regulating cell proliferation and differentiation, is expressed in endodermal epithelial cells during embryogenesis and persists in adult epithelia, implying postnatal functions. However, the detailed expression and function of Lin28 in TECs remain unknown. In this study, we examined the expression patterns of Lin28 and its target Let-7g in fetal and postnatal TECs and discovered opposing expression patterns during postnatal thymic growth, which correlated with FOXN1 and MHCII expression. Specifically, Lin28b showed high expression in MHCIIhi TECs, whereas Let-7g was expressed in MHCIIlo TECs. Deletion of Lin28a and Lin28b specifically in TECs resulted in reduced MHCII expression and overall TEC numbers. Conversely, overexpression of Lin28a increased total TEC and thymocyte numbers by promoting the proliferation of MHCIIlo TECs. Additionally, our data strongly suggest that Lin28 and Let-7g expression is reliant on FOXN1 to some extent. These findings suggest a critical role for Lin28 in regulating the development and differentiation of TECs by modulating MHCII expression and TEC proliferation throughout thymic ontogeny and involution. Our study provides insights into the mechanisms underlying TEC differentiation and highlights the significance of Lin28 in orchestrating these processes.
Lin28 is a small mRNA-binding protein that blocks processing of the Let-7 miRNA. Both Lin28 and Let-7 were originally identified by their important roles in developmental timing control in C. elegans (1–3) and are evolutionarily conserved in sequence and function from worms to humans, which highlights the important role of these two ancient small molecules (4, 5). Lin28 and Let-7 are frequently expressed in opposing patterns during embryonic development and differentiation, in the early postnatal period, and in adults. In general, Lin28 is expressed in stem and immature cells and is generally considered to promote pluripotency, while Let-7 is expressed in mature cells and promotes differentiation. Lin28 specifically suppresses the expression and function of Let-7, and in turn, Let-7 feeds back on Lin28 (6, 7). Importantly, both Lin28 and Let-7 also have the broad capability of regulating the expression of multiple genes. Thus, the Lin28/Let-7 system forms a regulatory axis that plays critical roles in a wide range of physiological development and pathogenesis in many organisms, including humans (8, 9). These processes include stem cell self-renewal and differentiation (10, 11), glucose metabolism (8), tissue repair (12), hematopoietic progenitor reprogramming (13–15), and the attraction of inflammatory endothelium into cancer cells (16). Additionally, Lin28 may act as an oncogene, while Let-7 acts as a cancer suppressor in a variety of human cancers; an imbalance in the expression of both genes has been linked to the formation, progression, diagnosis, and therapy of multiple cancer types (16–19).
Lin28/Let-7 has different expression patterns with regard to level, timing, and function during the fetal to postnatal period (20–23), with studies focused mostly on tissues of germline, ectodermal, and mesodermal origin (24). Less progress has been made on endodermal cell types; however, the general pattern of Lin28 expression in progenitors and Let-7 expression in more differentiated cells is also seen in the epithelia of the small intestine and the seminiferous epithelium of the testis (25, 26). Lin28 has two orthologs in mammals, Lin28a and Lin28b (22, 23), which have divergent temporal and cellular expression patterns in the seminiferous epithelium, with LIN28a expressed in undifferentiated A cells and LIN28b in spermatid cells at a later stage (25, 26). Let-7s also show opposing profiles to that of Lin28b in this adult tissue (26). There are also temporal dynamics for Lin28 expression; Lin28a mRNA levels peak in neonates and Lin28b in young adults during postnatal maturation (25, 26). Lin28b expression in the seminiferous epithelium in mice is also consistent with genome-wide association studies in which the Lin28b locus was associated with the timing of puberty at menarche and height in humans (27).
Although Lin28b (but not Lin28a) and Let-7g have been reported to be expressed in fetal and early postnatal thymocytes (13) and thymic pro B cells (28), their expression and function in thymic epithelial cells (TECs) is poorly characterized. Let-7 has 12 homologs in mice (5, 29), of which only Let-7g and Let-7f2 have relatively high expression levels in TECs (30). Let-7g, but not Let-7f2, also has predicted sites in the 3’ and 5’UTRs (untranslated regions) of the Lin28a and Lin28b genes (31, 32), suggesting that these genes form a negative regulatory loop. The thymic primordium initiates from the endoderm of the third pharyngeal pouches in mid-gestation (33). Endoderm-derived TECs are critical for most aspects of T cell development from thymocytes. FOXN1 is a key transcription factor required for TEC proliferation, differentiation, and homeostasis that is expressed in TECs from embryonic day 11.25 (E11.25) (33–36). The thymus also undergoes age-associated degeneration, called thymic involution, which is associated with reduced thymocyte number and T cell production. Current evidence suggests that this decline is initiated primarily due to the decline in Foxn1 expression in TECs (37). However, the mechanisms by which FOXN1 regulates these various aspects of TEC biology have not been fully investigated.
In this study, we investigated the expression and function of Lin28 and Let-7 in TECs. Lin28a was expressed at very low levels or undetected in fetal and postnatal TECs. Lin28b and Let-7g were detected in TEC progenitors at E13.5; their expression increased from fetal to adult stages but then declined by 6 months of age, associated with the process of age-related thymic involution. However, their expression showed opposite patterns in relation to major histocompatibility complex (MHC) class II (MHCII)hi and MHCIIlo TECs. Lin28b genes were highly expressed in MHCIIhi TECs and expressed at very low or undetectable levels in MHCIIlo TECs, while the Let-7g gene was highly expressed in MHCIIlo and expressed at very low levels in MHCIIhi TECs. Immunofluorescence staining showed that both Lin28a and Lin28b were differentially correlated with FOXN1 and MHCII expression. TEC-specific Lin28a gain and Lin28a and Lin28b loss of function showed that Lin28a promoted the proliferation of MHCIIlo TECs and that both Lin28a and Lin28b were required for maintaining MHCII expression in TECs. We also showed that Foxn1 expression was correlated with both Lin28b and Let-7g expression during ontogeny and that reducing Foxn1 expression in Foxn1Z/Z mice reduced Lin28 and Let-7g expression. Lin28b, but not Let-7g, expression increased during thymic rebound induced by sex steroid ablation. In summary, our findings indicate that Lin28 and Let-7 may both modulate MHCII expression and regulate thymic growth and involution by controlling TEC proliferation in the postnatal thymus.
C57BL6/J mice were purchased from Jackson Laboratory. Foxn1lacZ/lacZ (Z/Z) and Foxn1Cre mice were generated by Dr. Manley’s laboratory as described previously and are maintained on a C57Bl6/J background (37, 38). Lin28afl/flbfl/fl mice (Lin28btm2.1GqdaLin28btm2.1Gqda/J, stock No. 02395) were purchased from the Jackson Laboratory (39). R26iLin28a inducible transgenic mice were originally provided by Eric Moss (Department of Molecular Biology, Rowan University, Stratford, NJ 08084 USA) and transferred from Dr. Jianfu Chen (Department of Genetics, University of Georgia. Current address: Herman Ostrow School of Dentistry of USC) (40). The Lin28afl/flbfl/fl;Foxn1Cre TEC-specific deletion of Lin28a and b and R26iLin28a;Foxn1Cre TEC-specific overexpression of Lin28a mice were generated by crossing the Lin28afl/flbfl/fl strain or the R26iLin28a strain with the Foxn1Cre mouse strain, respectively. All analyses were performed using littermate animals whenever possible. Data from both male and female mice were combined because no difference was detected based on sex. All mice were maintained in a pathogen-free facility at the University of Georgia. The experiments were approved by the University of Georgia Institutional Animal Care and Use Committee.
For thymocyte analysis, freshly isolated thymocytes in suspension (1×10⁶) were used for each sample. Cells were blocked with an anti-CD16/32 (Clone: 93) antibody before staining. For a phenotypic profile of thymocyte subsets, the thymocytes were incubated with anti-CD4 APC-Cy7 (GK1.5), anti-CD8 PE-cy7 (53-6.7), anti-CD44 allophycocyanin (APC) (IM7), and anti-CD25 PerCP (3C7) on ice for 20 min.
For TEC isolation, one thymic lobe (fetal thymi were mixed) was cut into approximately 1 mm3 sections and gently washed in 2% FBS RPMI 1640 medium to remove thymocytes. The thymic pieces were digested in 5 ml of collagenase/dispose (1 mg/ml, Roche) plus DNase I (20 ng/mL, Sigma) in 2% FBS RPMI 1640 medium, placed in a 37°C water bath for 60 minutes, and agitated by passing through an 18G needle 8 times and a 25G needle twice. Cells were then filtered by passing through a 70 μm cell strainer.
For TEC phenotypical analysis, the digested cells (1-2 ×10⁶) were incubated with anti-CD45-PE-Cy7 (30-F11), MHCII-PerCp (M5/114.15.2), EpCAM-APC (G8.8), UEA-1-FITC (Vector, CA), and Ly51-PE (6C3) for 20 min. Cells were then placed in a 1% PFA PBS solution for analysis. For LIN28a antibody staining, we followed the Cell Signaling protocol for intracellular antibody staining. Briefly, digested thymic cells (1-2 ×10⁷/ml) were fixed in 4% PFA-PBS and placed in a 37°C water bath for 10 min. The cells were permeabilized by slowly adding 1 ml of ice-cold 90% methanol and incubating for 30 min on ice. The cells were then washed in 2% FBS-PBS buffer and incubated with anti-LIN28a (1:200) and UEA-1-Biotin at RT for 1 hr. The cells were then washed and incubated with the following antibodies: anti-CD45-PE-Cy7, MHCII-PerCp, EpCAM-APC, Ly51-PE, Strepavidin-APC-Cy7, and donkey anti-Rabbit-Alexa-488 (1:800) at RT for 30 min. For BrdU and LIN28a staining together, anti-CD45-PE-Cy7, MHCII-PerCp, EpCAM-PE, UEA-1-biotin following streptavidin-APC-Cy7, BrdU-FITC and LIN28a following donkey anti-Rabbit-Alexa-647 were used.
For TEC sorting, the digested cells were incubated with anti-CD45 APC, EpCAM PE, and MHCII FITC. The CD45-Epcan+MHCII+ cells were sorted as TECs and separated into MHCIIhi and MHCIIlo subpopulations by MoFlo-DXP cytometry (Dako Cytomation). All antibodies were purchased from Biolegend if not noted (San Diego, CA). Phenotypical analysis was performed with a Cyan ADP Flow Cytometer (Beckman Coulter, Miami, FL). The data were analyzed by Flowjo™ Software (Tree Star, Ashland, OR).
Primary antibodies included specific polyclonal rabbit anti-LIN28a (A117, Cell Signaling Technology, Beverly, MA; 1:100); specific polyclonal rabbit anti-LIN28b (ProteinTech Group, Inc; Chicago, IL; 1:50) (25, 41); goat anti-mouse FOXN1 (WHN G-20, Santa Cruz Biotechnology; Santa Cruz, CA. 1:200); and rat anti-IA/IE (M5/114.15.2, Biolegend, San Diego, CA 1:200). Secondary antibodies included donkey anti-rabbit IgG-FITC (1:200), donkey anti-goat IgG Alexa-555 (1:800), donkey anti-rat IgG Alexa-555 (1:800); UEA-1-biotin (Vector Laboratories, Brulingame, CA 1:200); and streptavidin Alexa-647 (1:800) (Jackson Immunoresearch Laboratories, West Grove, PA). For FOXN1 staining, the embryos and adult thymi were fixed with 4% paraformaldehyde (PFA) in PBS at 4°C overnight. The samples were dehydrated in gradient ethanol solutions (70, 80, 90, 96, and 100%), embedded in paraffin, and then sectioned at 10 μm. The slides were rinsed in xylene before rehydration through a reversed ethanol series. Antigen retrieval was performed by boiling slides in pH 6, 10 mM sodium citrate buffer for 30 mins. For MHCII staining, embryos and adult thymi embedded in OCT were snap-frozen in liquid nitrogen and then stored at -80°C until sectioning. These samples were cut at 10 μm and fixed in ice-cold acetone for 2 min. All antibodies were diluted in 0.1% BSA+PBS, the primary antibodies were then added to each sample after blockage with 10% donkey serum overnight, and the secondary antibodies or streptavidin were stained for 40 min at RT. Images were obtained using a Zeiss Axioplan2 imaging microscope with an AxioCam HRM and AxioVision Rel 4.5 software (Jena, Germany). Quantitation of fluorescent cells was measured using ImageJ free software.
Each mouse was given a single intraperitoneal injection. with 1 mg of BrdU (Sigma−Aldrich) and hydrated with BrdU-containing water (0.8 mg/ml) for 5 days. One thymic lobe was digested for TEC, and one was ground for thymocyte analysis. For BrdU staining, freshly isolated thymocytes were incubated with anti-CD4-PE-Cy7, CD8-APC-Cy7, CD25-PerCp, and CD44-APC antibodies. The digested cells were incubated with anti-CD45 PE-Cy7, EpCAM APC, MHCII PE, and UEA-1-Biotin following Avidin-APC-Cy7. The surface-stained cells were then fixed and permeabilized in PBS containing 1% paraformaldehyde plus 0.01% Tween 20 for 48 h at 4°C and then incubated with 2 mg/ml DNase I for 15 min in a 37°C water bath. FITC-anti-BrdU Ab (clone 3D4; BD Pharmingen) was used for BrdU staining according to the manufacturer’s instructions. For Annexin V staining, freshly isolated thymocytes (5 X 10⁵) or total digested thymic cells (1 X 10⁶) were incubated with surface antibodies and then incubated with Annexin V FITC and PI in Annexin V binding buffer. The samples were analyzed within 1 hour following the protocol of the Annexin V kit (Biolegend, San Diego, CA).
The fetal thymi and sorted total TECs or MHCIIlo and MHCIIhi TEC subsets were extracted for mRNA by the RNeasy micro kit (QIAGEN). Reverse transcription PCR was performed with the superscript III system (Invitrogen). Gene expression levels of Lin28a (Mm00524077_m1), Lin28b (Mm01190673_m1), Let-7g (Mm04231484_s1), and H2-IAb (00439216_m1) in total TECs or MHCIIlo and MHCIIhi subsets of TECs were measured by Q-PCR, with a GAPDH FAM (Mm99999915_g1) primer/probe used as an endogenous control. All primers/probes were ordered from Applied Biosystems. Q-PCR was performed following the manufacturer’s instructions in a 10 μl volume using the AB 7500 Sequence Detector.
Mice were anesthetized using isoflurane anesthesia and then placed in dorsal recumbency. A 0.5-1 cm ventral midline incision was made in the scrotum, and the skin retracted to expose the tunica. The tunica was pierced, and the testes were pushed out sequentially. The testes were raised to expose the underlying blood vessels and tubules. Mouse testes were removed using forceps; cauterization was not needed. All deferential vessels and ducts were replaced back into the tunica. Skin incisions were closed with stainless steel wound clips. All of the excised paired tissues from each animal were retained to verify completeness of removal. Sham castration was performed as described above except for the removal of the testes.
All data were collected in a Microsoft Excel file and analyzed using Prism software (GraphPad Software, Boston, MA 02110) by one-way analysis of variance (ANOVA)-Bonferroni test or Student’s t test, P value in two-tailed. For statistical analysis, the significance was set at P ≤ 0.05.
To assess LIN28 in the fetal thymus, we first performed immunofluorescence (IF) on E13.5 and E18.5 thymi from C57BL6/J WT mice using LIN28a and LIN28bspecific antibodies. No LIN28a signal was detected in the E13.5 and E18.5 thymi (Supplementary Figures 1A, B). At E13.5, LIN28b was detected in the cytoplasm of both FOXN1-negative cells (FOXN1-) (Figure 1A, white arrows) and in a minor subset of FOXN1-positive (FOXN1+) TECs (Figure 1A, pink arrows). A small number of MHCII+ K14+ early medullary TECs (mTECs) were also detected in the center of the thymus but were found to be LIN28b negative (Figure 1B, Supplementary Figures 1C, D). At E18.5, LIN28b was found to be expressed in a subset of TECs in both the cortex and medulla, colocalizing with FOXN1 and MHCII (Figures 1C, D; pink arrows). Quantitative analysis showed the frequency of LIN28b+ cells increased in total FOXN1+ cells (Figure 1E). Some LIN28blo FOXN1- cells were also detected in the outer area but were absent from the central area of the thymi, which might represent early developing thymocytes (Figures 1C, D; white arrows).
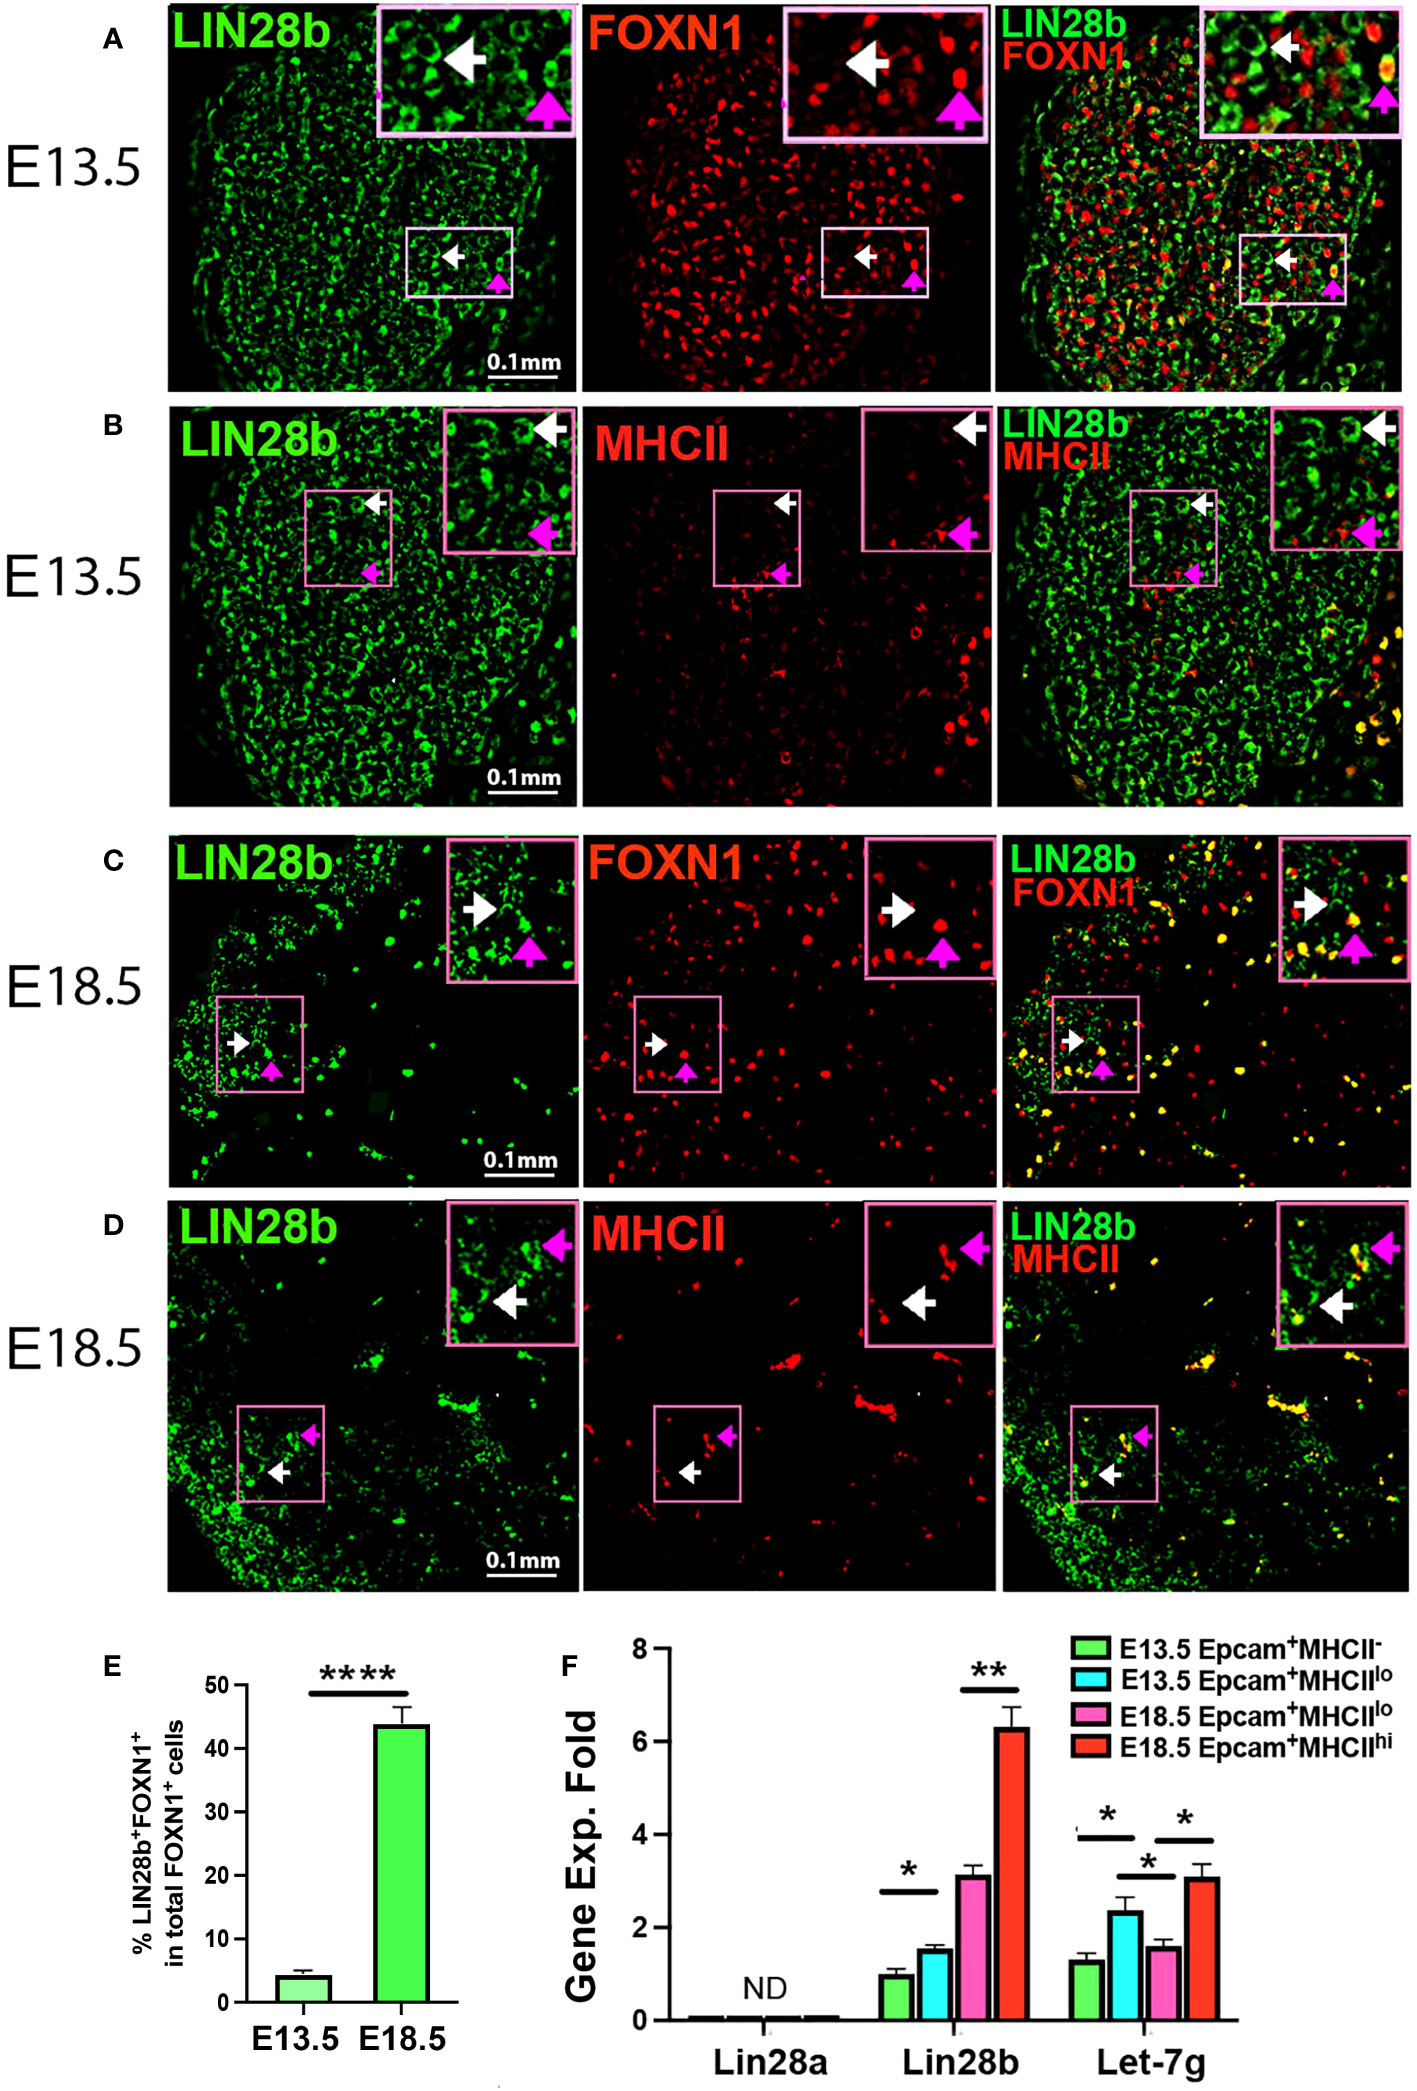
Figure 1 Lin28a, Lin28b, and Let-7g expressed in fetal murine thymi. Immunofluorescence staining of fetal thymic sections. (A) 4% PFA-fixed E13.5 thymic sections were stained for LIN28b (green, white arrow shows cytoplasm staining) and FOXN1 (red, pink arrow shows nuclear staining). (B) The frozen thymic sections were stained for LIN28b (green) and MHCII (red). (C) 4% PFA-fixed E18.5 thymic sections were stained for LIN28b (green) and FOXN1 (red). (D) The frozen thymic sections were stained for LIN28b (green) and MHCII (red). The top right shows a digitally enlarged image of the area indicated in panels (A-D). (E) Quantitative analysis of LIN28b+FOXN1+ cells in FOXN1+ TECs. (F). Gene expression levels of Lin28a, Lin28b, and Let-7g were measured in EpCAM+MHCII- and EpCAM+MCHIIlo TECs sorted from E13.5 thymi, as well as in EpCAM+MHCIIlo and EpCAM+MHCIIhi TECs sorted from E18.5 thymi. The mRNA level of Lin28b in EpCAM+MHCII- TECs at E13.5 was used as a reference with a value of 1, and the mRNA levels of other genes were normalized accordingly and expressed as fold changes. Data are representative of two individual experiments and at least 3-5 samples per time point. Student’s t test (E, F) results between EpCAM+ MCHII- or MHCIIlo and MHCIIhi TEC subsets: *P <0.05, **P <0.01, ****P<0.0001, Scale bar = 0.1 mm. ND, Not detected.
To further investigate expression in fetal TECs, we analyzed the gene expression of Lin28a and b and Let-7g in fetal TEC subsets sorted based on EpCAM and MHCII expression at E13.5 and E18.5. At E13.5, all TECs are MHCII negative or low (Supplementary Figures 2A-D). Lin28a was not detected or was present at very low levels in all fetal TEC subsets. Lin28b was correlated with the expression of MHCII, increasing significantly in MHCIIlo compared to MHCII- TEC at E13.5, increasing further at E18.5 in MHCIIlo TEC, and increasing two-fold higher in MHCIIhi than in MHCIIlo at E18.5 (Figure 1F). Let-7g expression also correlated with MHCII expression and was higher in MHCIIlo TECs than MHCII- TECs at E13.5 and higher in MHCIIhi than MHCIIlo TECs at E18.5. However, at E18.5, expression declined in MHCIIlo TECs relative to that at E13.5 (Figure 1F), suggesting more complex regulation. These results indicated that Lin28b and Let7g but not Lin28a may be involved in TEC differentiation during fetal thymic development.
To understand Lin28 and Let-7 expression in the postnatal thymus, we first assessed LIN28a and LIN28b at the protein level in postnatal TECs. Sections from C57BL6/J WT thymi obtained at 2 months of age were stained along with FOXN1 and MHCII. Both LIN28a and LIN28b in the medulla colocalized with both FOXN1 (Figures 2A, B) and MHCII (Figures 2C, D), indicating that they are each expressed in a subset of mTECs at this stage. Quantitative analysis showed the frequency of LIN28b+ cells in total FOXN1+ cells was higher than LIN28a+ cells (Figure 2E). We further investigated the gene expression of Lin28a, Lin28b, and Let-7g in sorted MHCIIlo and MHCIIhi TEC subsets from 2-month-old WT mice (Figure 2F). Both Lin28a and Lin28b were preferentially expressed in MHCIIhi TECs with little or no expression in MHCIIlo TECs. Lin28b expression was 2.8-fold higher than that of Lin28a. Conversely, Let-7g was almost exclusively expressed in MHCIIlo TECs (Figure 2F). This opposing expression profile is consistent with the known reciprocal regulation pattern for Lin28 and Let-7 in other tissues. These patterns for Lin28a and Lin28b are at least broadly consistent with Let-7g expression. However, the Let-7g pattern is the opposite of that observed at E18.5, where Let-7g was in both MHCII subsets but higher in MHCIIhi (Figure 1F), which suggests complex regulation of this miRNA gene.
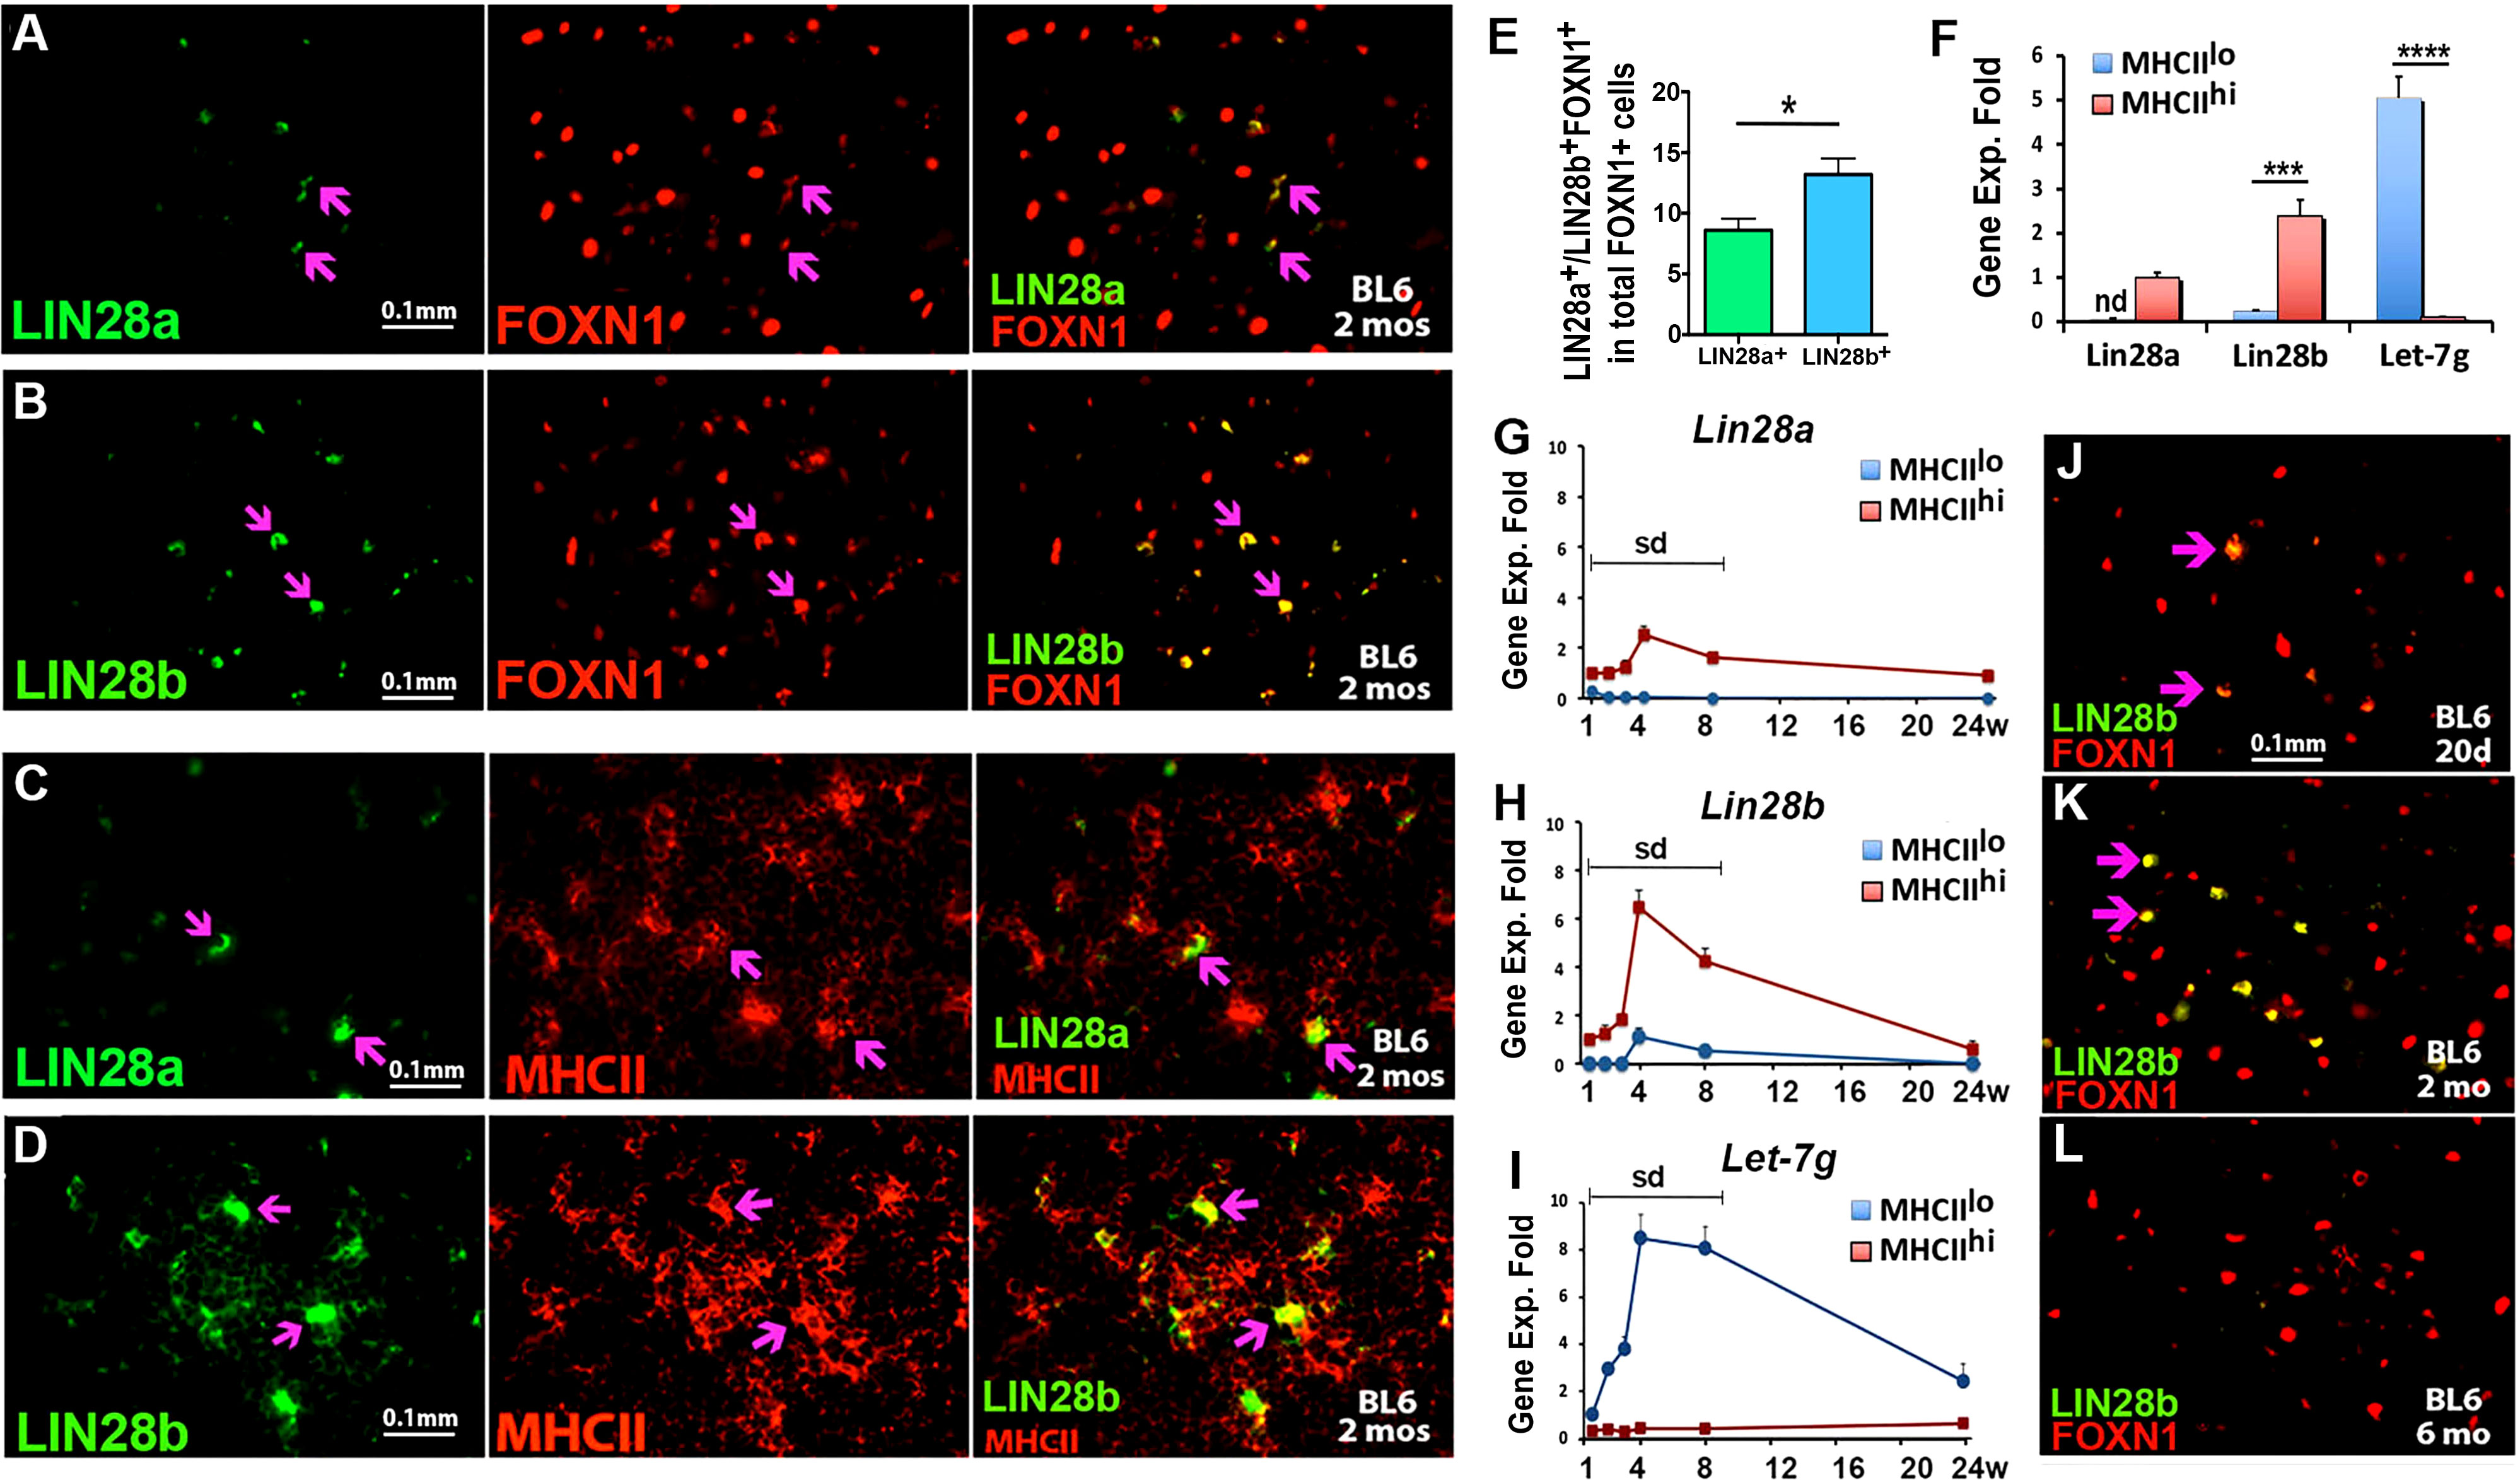
Figure 2 Lin28a, Lin28b and Let-7g are expressed in postnatal murine thymi. Immunofluorescence staining of thymic sections from BL6 WT mice at 2 months of age (A-D). (A, B). 4% PFA-fixed thymic sections were stained for LIN28a (A, green) or LIN28b (B, green) with FOXN1 (red). (C, D). The frozen thymic sections were stained for anti-LIN28a (C, green), anti-LIN28b (D, green), and anti-MHCII (red). (E) Quantitative analysis showed the frequency of LIN28a+ and LIN28b+ cells in total FOXN1+ TECs. (F) Gene expression levels of Lin28a, Lin28b and Let-7g were measured by qPCR in MHCIIlo and MHCIIhi TEC subsets sorted from 2-month-old murine thymi. The mRNA level of Lin28a in MHCIIhi subsets was used as a reference with a value of 1, and the mRNA levels of Lin28b and Let-7g were normalized accordingly and expressed as fold changes. (G-I). Gene expression levels of Lin28a, Lin28b, and Let-7g were measured by qPCR in MHCIIlo and MHCIIhi TEC subsets sorted from 1-, 2-, 3-, 4-, 8- and 24-week-old thymi. The mRNA levels of Lin28a and Lin28b in MHCIIhi TECs and Let-7g in MHCIIlo TECs at week 1 were used as references with a value of 1, and the mRNA levels of Lin28a, Lin28b, and Let-7g at other time points were normalized accordingly and expressed as fold changes. Each time point represents at least three to five individuals. (J-L). Immunofluorescence staining, 4% PFA-fixed thymic sections from BL6 white mice at 20 days (J), 2 months (K), and 6 months (L) of age were stained for LIN28b (green) and FOXN1 (red) antibodies. The double-positive staining is shown in yellow (purple arrows). One-way ANOVA (F-H) results are shown between MHCIIlo and MHCIIhi TEC subsets: *P <0.05, ***P <0.001, ****P <0.0001. Bars indicate means ± SEMs. Nd, not detected; Sd, significant difference. Scale bar = 0.1 mm.
We next traced the temporal dynamics of Lin28a, Lin28b, and Let-7g expression in postnatal MHCIIlo and MHCIIhi TEC subsets. The expression of both Lin28a and Lin28b gradually increased from 1 week, peaked at 1 month, and then gradually declined at 2 and 6 months in MHCIIhi TECs; a parallel pattern was found at a much lower level for Lin28b in MHCIIlo TECs (Figures 2G, H). Let-7g showed a similar temporal profile but in MHCIIlo TECs, with very low levels in MHCIIhi TECs (Figure 2I). Consistent with these gene expression kinetics, IF staining showed that LIN28b was present at a low level in a subset of FOXN1+ mTECs at day 20 (Figure 2J), increasing in cell number and intensity per cell at 2 months (Figure 2K), then dramatically declined or was undetectable at 6 months (Figure 2L). These data indicate that the expression of Lin28a, Lin28b, and Let-7g is correlated with both thymic growth and the early stages of age-associated involution.
Lin28a and Lin28b single and double null mutants have a variety of defects that could confound analysis of their function in TECs (20, 21); therefore, we generated TEC-specific deletion of Lin28a and Lin28b using Foxn1+/Cre (38). Since similar genetic and phenotypic analysis results were shown at multiple time points, we show here representative results from 2-month-old mice. Q-PCR analysis showed that at 2 months, both Lin28a and Lin28b transcripts were undetectable in Lin28afl/flbfl/fl;Foxn1Cre/+ double mutant TECs and that only Lin28a was detected in the MHCIIhi TECs from Lin28a+/+bfl/fl;Foxn1Cre/+ single mutants (Figures 3A, B). Specificity of LIN28a and LIN28b antibody staining on the thymic sections from Lin28afl/flbfl/fl;Foxn1+/+ control and Lin28afl/flbfl/fl;Foxn1Cre/+ double knockout adult mice confirmed the specific deletion of Lin28a and b in TECs (Supplementary Figures 3A–D). Deletion of Lin28b alone or of both Lin28a and Lin28b was associated with increased Let-7g expression in MHCIIhi TECs and even showed a 1.3-fold increase in MHCIIlo TECs (Figure 3C), despite overall low expression of both Lin28a and Lin28b in these cells. These data support a negative regulatory relationship between Lin28 and Let-7g expression in MHCIIhi TECs.
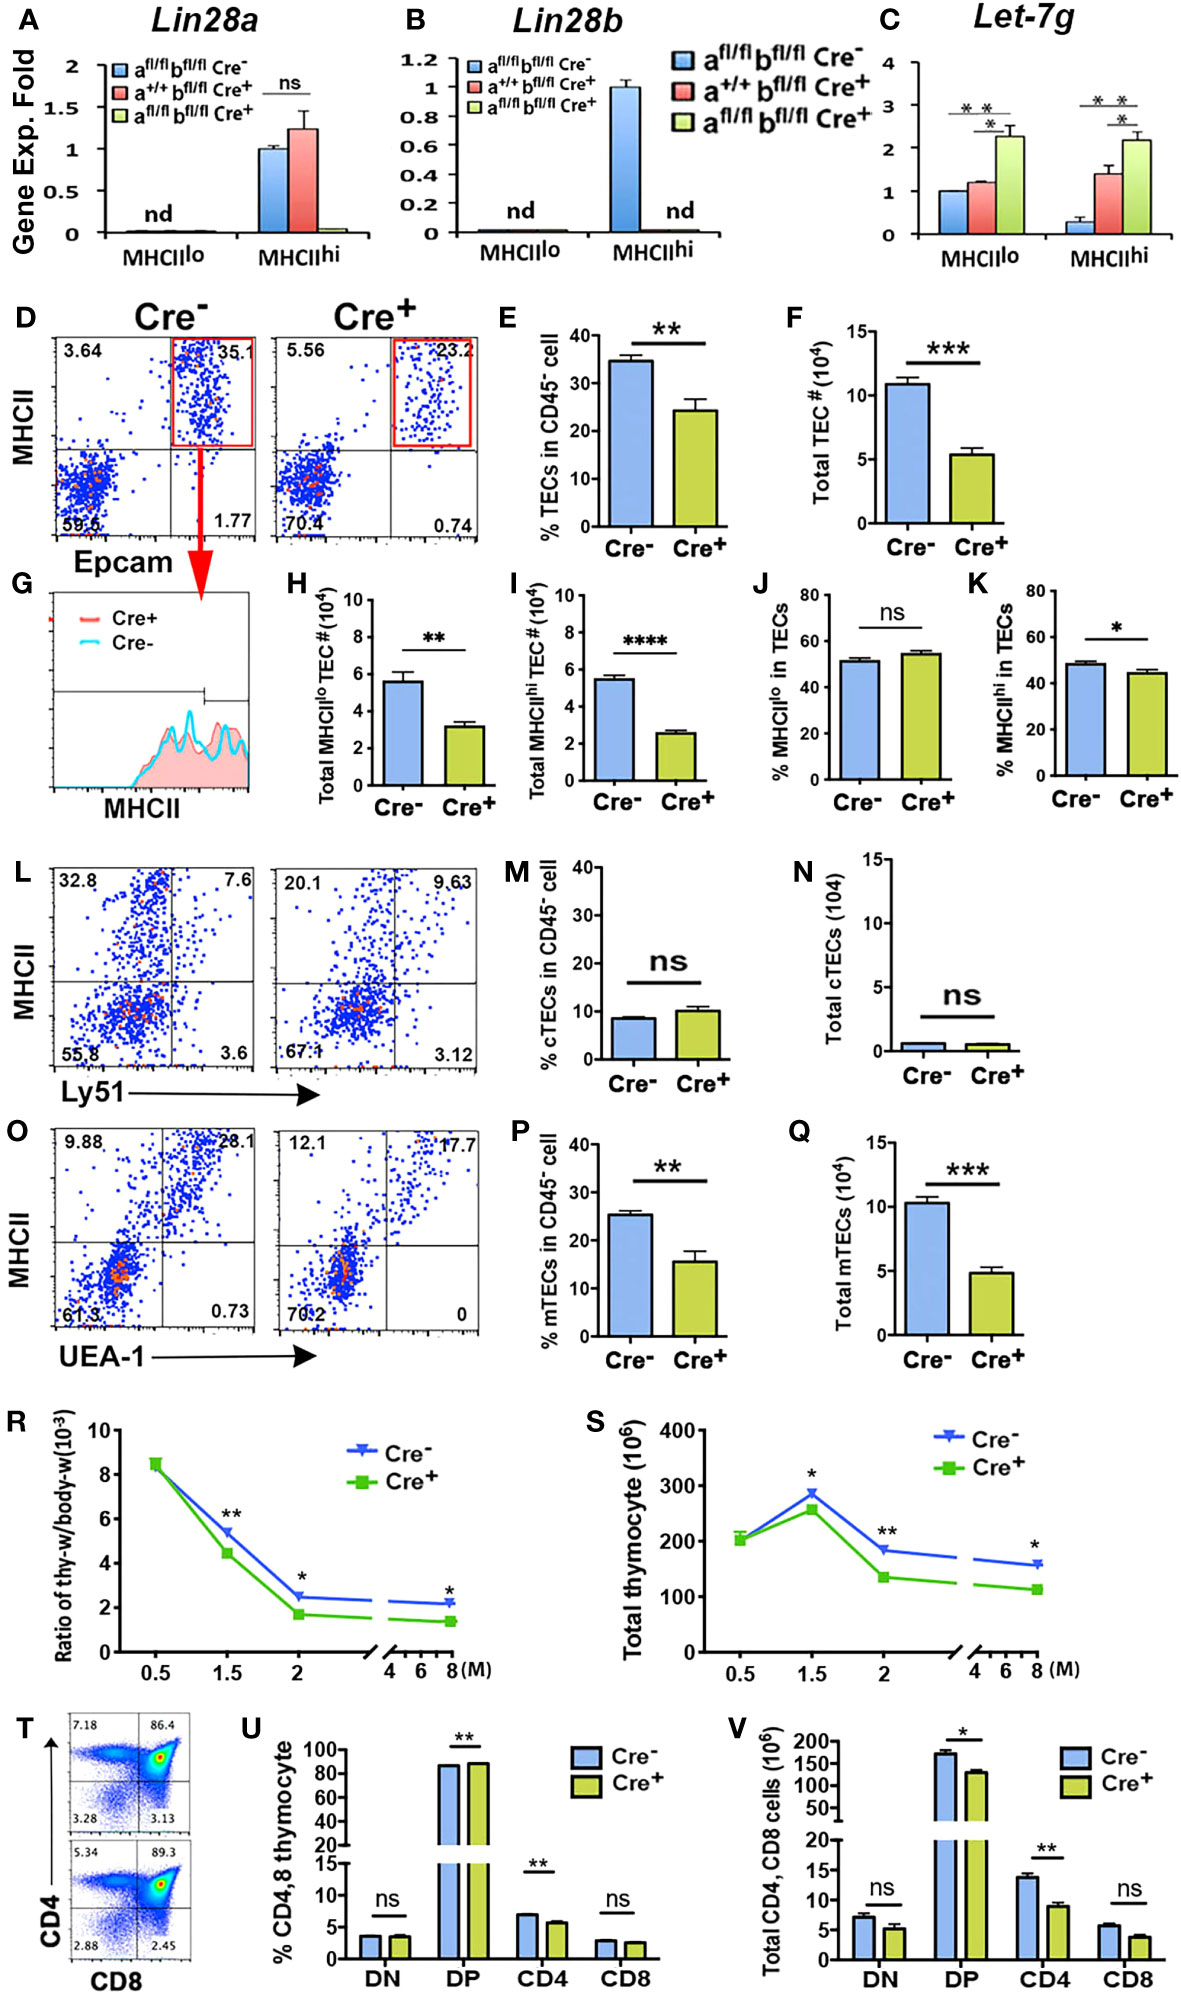
Figure 3 Specific deletion of Lin28a and Lin28b in TECs caused a reduction of TECs and generated fewer thymocytes in the adult murine thymus. (A-C). Gene expression of Lin28a (A), Lin28b (B), and Let-7g (C) was measured in MHCIIlo and MHCIIhi TECs sorted from Lin28afl/flbfl/fl, Foxn1Cre- (Cre-, n= 4), Lin28a+/flbfl/fl,Foxn1Cre+ (n=3) and Lin28afl/flbfl/fl,Foxn1Cre+ (Cre+, n=4) mice. Data are representative of two individual experiments. The gene expression levels of Lin28a (A) and Lin28b (B) in Lin28afl/flbfl/fl, Foxn1Cre- MHCIIhi TECs and Let-7g (C) in Lin28afl/flbfl/fl, Foxn1Cre- MHCIIlo TECs were used as controls with a value of 1. (D). Flow cytometry analysis showed the profile of EpCAM and MHCII staining in total CD45- cells of Cre- and Cre+ mice and the gate of EpCAM+MHCII+ for TECs. (E, F). Histogram showing the percentage of TECs in CD45- cells (E) and the total number of TECs (F). (G). Histogram showing MHCII expression on gated TECs in Cre- and Cre+ mice. (H, I). Total number of MHCIIlo (H) and MHCIIhi (I) TECs. (J, K). Percentage of MHCIIlo (J) and MHCIIhi (K) TEC subsets in gated total MHCII+EpCAM+ TECs. (L). Representative profile of MHCII and Ly51 showed cTECs in CD45- cells. (M, N). Percentage of cTECs) (M) in CD45- cells and total number of cTECs (N). (O). Representative profile of MHCII and UEA-1 showed TECs) in CD45- cells. (P, Q). Percentage of mTECs (P) in CD45- cells and total number of mTECs (Q). (R). Ratio of thymus weight/body weight at the indicated months of age. (S). Total thymocyte number at the indicated months of age. (T). Representative expression of CD4 and CD8 on total thymocytes. (U). Percentage of CD4 and CD8 thymocytes. (V). Total number of CD4 and CD8 thymocytes. Each time point represents at least three to five individuals. Student’s t test results between Cre- and Cre+ mice: *P <0.05, **P <0.01 ,***P <0.001,****P < 0.0001.. Bars indicate means ± SEMs.
We next assessed the role of Lin28 and Let-7g in TEC differentiation and MHCII expression in 2-month-old double mutant mice. TEC-specific deletion of both Lin28a and Lin28b caused a significant reduction in both the percentage of TECs within total CD45- stromal cells and in total TEC number (Figures 3D–F). Reductions were similar in both MHCIIlo and MHCIIhi TEC numbers, with a slight decline in the frequency of MHCIIhi TECs (Figures 3G–K). Analysis of cortical (cTEC) and mTEC populations showed that this reduction was entirely in mTECs in the Lin28afl/flbfl/fl Foxn1Cre/+ double mutants (Figures 3L–Q). These TEC defects caused a significant reduction in thymus size (Figure 3R) and in total thymocyte number (Figure 3S) starting at 6 weeks of age. The overall decline in thymocyte numbers was reflected in small but significant declines in DP and CD4SP numbers (Figures 3T–V). These results suggest that Lin28a and Lin28b impact thymocyte differentiation indirectly, primarily by regulating the differentiation and/or proliferation of MHCIIhi mTECs in the postnatal thymus.
To further test LIN28 activity in TECs, we overexpressed (OE) Lin28a by activating the iLin28a transgene (iLin28a-Tg) (40) specifically in TECs with Foxn1Cre (38). Activation of the transgene resulted in a 34-fold increase in Lin28a expression in MHCIIlo TECs and a 14-fold increase in MHCIIhi TECs in 6-week-old iLin28a+/Tg;Foxn1Cre/+ (iLin28a OE) transgenic mice (Figure 4A). Flow cytometry analysis was consistent with these data, with a low level of LIN28a signal detected in MHCII+ TECs in iLin28a+/+ controls and a strong LIN28a signal in the iLin28a OE mice in both MHCIIlo and MHCIIhi TECs, although LIN28a overexpression was detected only in a subset of TECs (Figures 4B, C). Consistent with the mRNA levels and flow cytometry, LIN28a was difficult to detect by IF in the iLin28a+/+ control thymus at 3 weeks of age (Figures 4D, F), but LIN28a dramatically increased in iLin28a OE mice (Figures 4E, G). LIN28a protein in transgenics was found primarily in the cytoplasm but was also present in the nucleus of TECs (Figure 4E, inset). Interestingly, Lin28b expression in MHCIIhi subsets was reduced in iLin28a OE mice compared to controls (Figure 4H), which suggests cross-regulation of these two related genes. Expression of the transgene was associated with a 60% reduction in Let-7g in MHCIIlo TECs but no significant change in Let-7g in MHCIIhi TECs (Figure 4I), possibly because of the reduction in Lin28b expression in these cells.
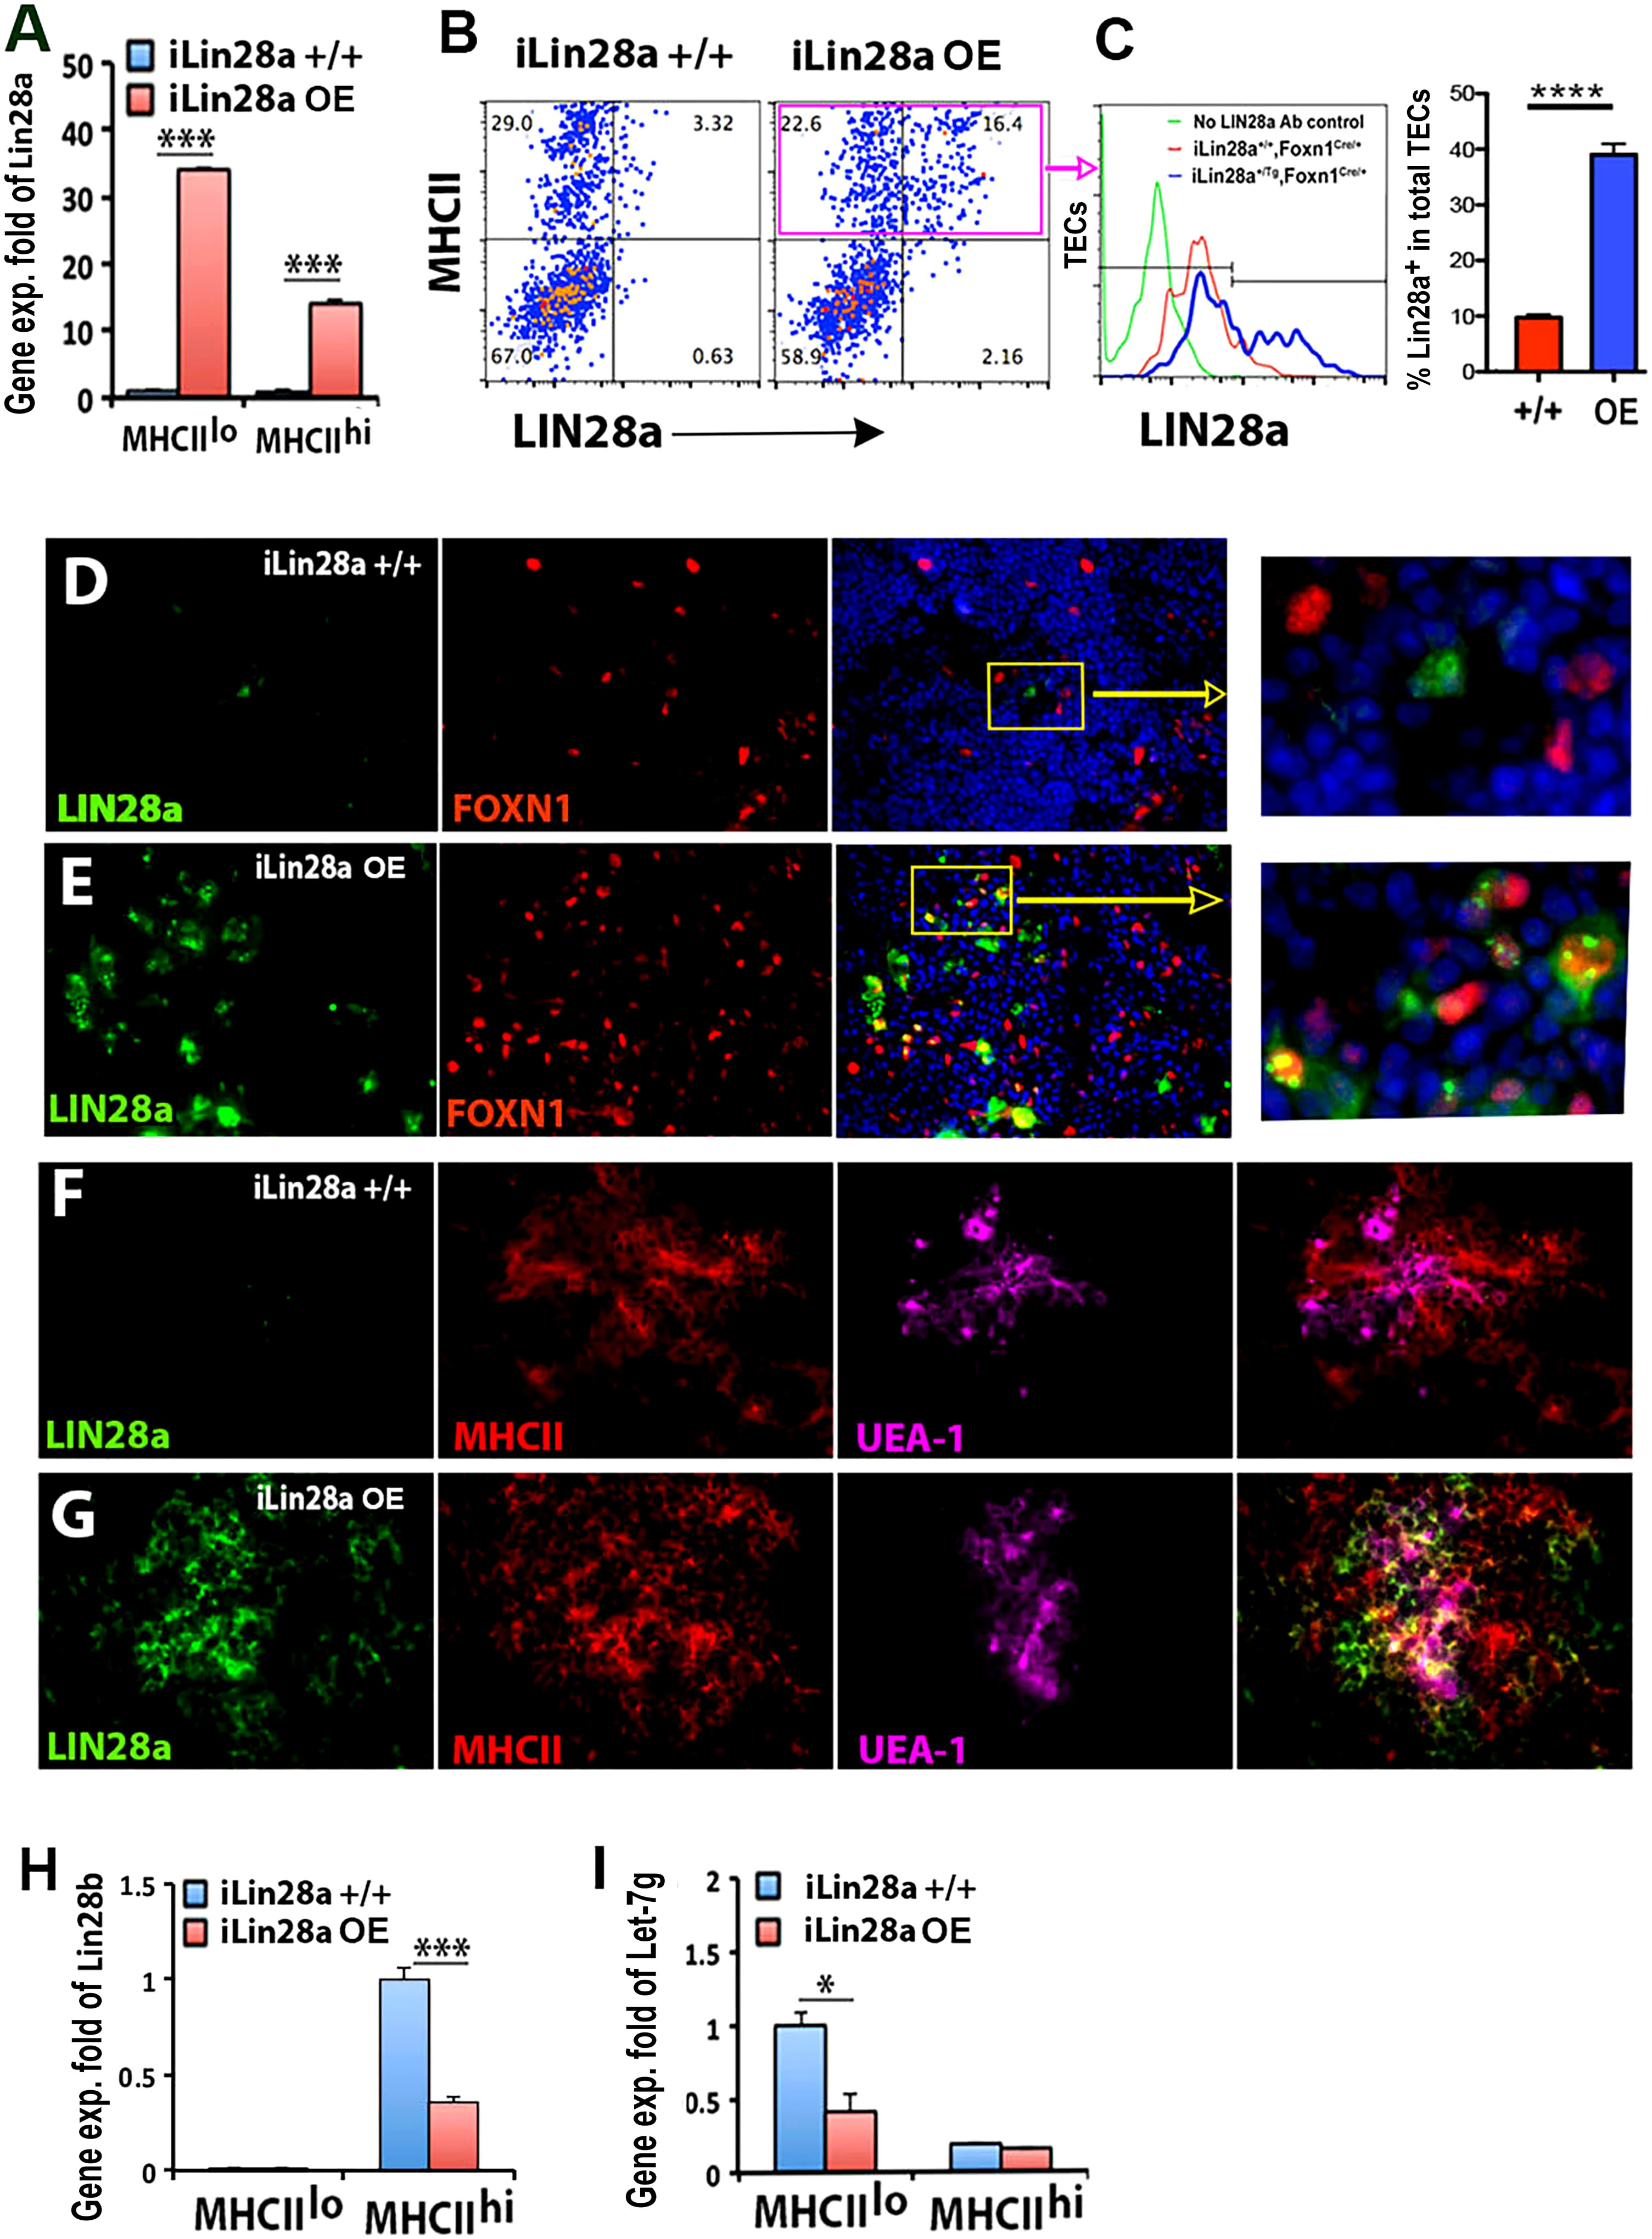
Figure 4 Specific overexpression of LIN28a in TECs in iLin28a transgenic adult mice. (A) Gene expression of Lin28a was measured in MHCIIlo and MHCIIhi TECs sorted from iLin28a+/+ WT (+/+) and iLin28a OE transgenic (OE) mice at 6 weeks of age. Data are representative of two individual experiments (+/+: n= 4; OE: n=5). (B) Flow cytometry intracellular staining analysis. Representative profiles of LIN28a and MHCII staining in total CD45- cells. (C) The histogram shows LIN28a overlapping expression on gate MHCII+ cells, and the summary data of LIN28a percentage are shown on the right. (D-G) Immunofluorescence staining, 4% PFA-fixed postnatal day 21 thymic sections, the thymi of +/+ (D) and OE (E) mice were stained for LIN28a (green), FOXN1 (red) antibodies, and DAPI (blue). The frozen thymic sections of +/+ (F) and OE (G) mice were stained for anti-LIN28a (green) and MHCII (red) antibodies and UEA-1 (purple). (H, I) Gene expression of Lin28b (H) and Let-7g (I) was measured in MHCIIlo and MHCIIhi TECs sorted from +/+ (H) and OE (I) mice at 6 weeks of age. Data are representative of three individual experiments. (+/+: n=7, OE: =5) Student’s t test (A, C, H, I) results between +/+ and OE mice: *P <0.05, ***P <0.001, ****P<0.0001. Bars indicate means ± SEMs. Scale bar = 0.1 mm.
Overexpression of iLin28a in TECs caused an increase in thymus weight and the ratio of thymus weight to body weight in iLin28a OE mice (Supplementary Figures 4A-D), although it did not change the frequencies of cTECs and mTECs (Figures 5A–D). Increased thymus size was associated with significant increases in the number of both cTECs and mTECs (Figures 5E–G). To further analyze TEC phenotypes, we assessed MHCII expression. The frequency of MHCIIlo cTECs was increased, and the frequency of MHCIIhi mTECs was reduced in iLin28a OE mice (Figures 5H–L). Consistent with the overall increased size, the numbers of all MHCII subsets were increased, except for MHChi cTECs (Supplementary Figures 4E, F). Overall, the ratio of MHCIIlo to MHCIIhi cells increased in iLin28a OE mice (Supplementary Figure 4G).
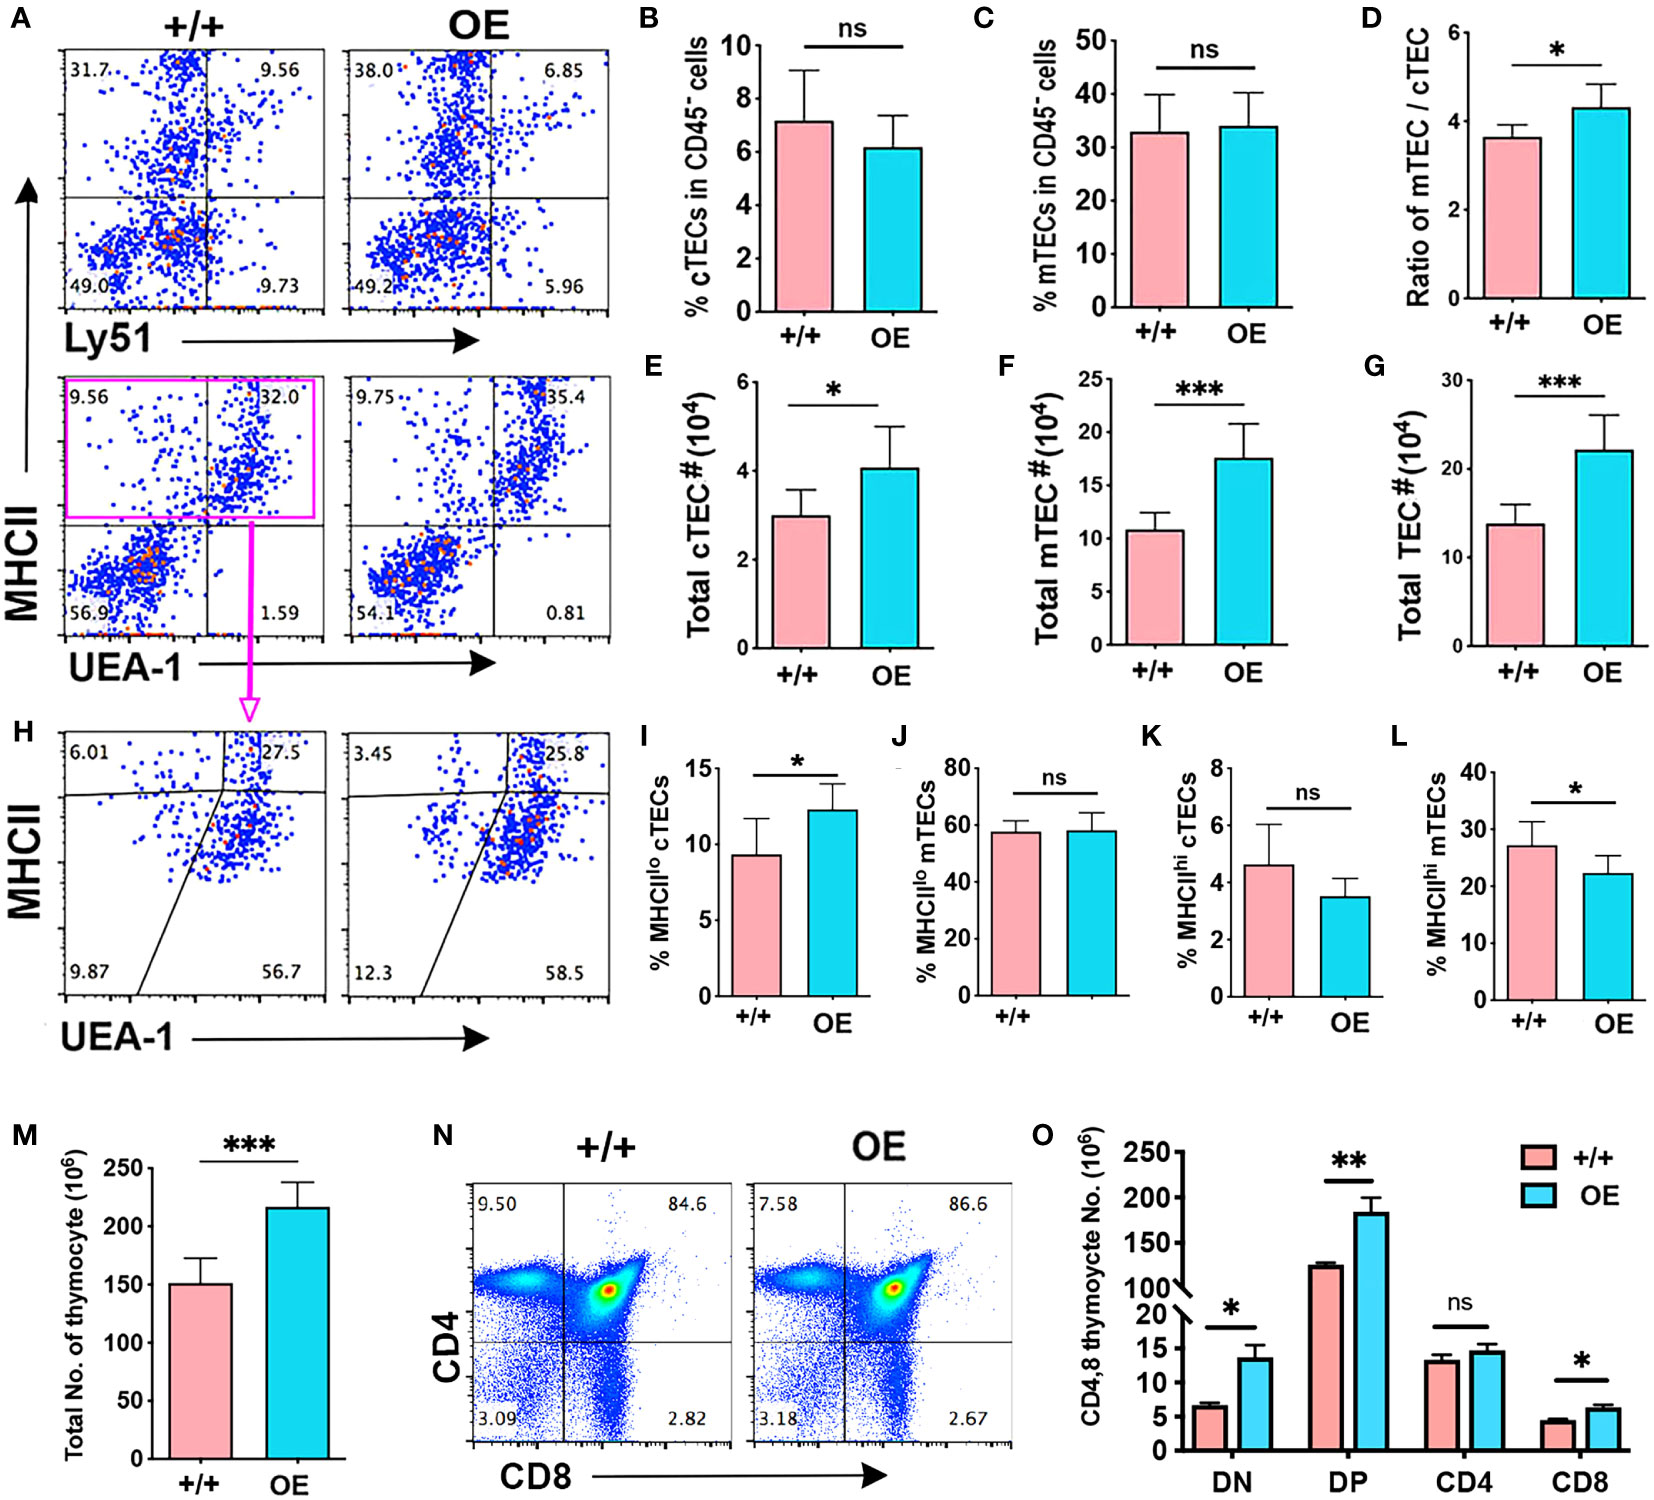
Figure 5 Specific Lin28a overexpression in TECs increased the total TEC number and produced more thymocytes. Flow cytometry analysis data. (A) Representative expression of MHCII and Ly51 (top) or UEA-1 (bottom) on total CD45- cells. (B-D) Histogram showing the percentage of cTECs (B) and mTECs (C) in total CD45- cells and the ratio of mTECs/cTECs (D). (E-G) Total number of cTECs (E), mTECs (F) and total TECs (G). (H) Representative profiles of MHCII and UEA-1 staining in gated total TECs (EPCAN+MHCII+). (I-L). (I-L) Percentage of MHCIIlo cTECs (I), MHCIIlo mTEC (J), MHCIIhi cTECs (K), and MHCIIhi mTEC (L). (M) Total number of thymocytes. (N) Representative profiles of CD4 and CD8 staining of total thymocytes. (O) Total number of CD4 and CD8 subsets of thymocytes. Student test results between +/+ and OE mice: *P <0.05, **P<0.01, ***P <0.001.
Consistent with increased thymus size and TEC number, total thymocyte number was significantly increased in iLin28a OE mice (Figure 5M) with increases in the number of all subsets except for CD4SP cells, which declined in percentage (Figures 5N, O; Supplementary Figure 4H). The decline in CD4SP cell frequency is consistent with the decline in the frequency of MHCIIhi mTECs in iLin28a OE mice (Figure 5L).
The above results showed that TEC-specific deletion of both Lin28a and Lin28b caused a selective reduction in MHCIIhi mTECs, while overexpression of Lin28a expanded all TEC subsets but preferentially expanded MHCIIlo TECs. Because Lin28a and Lin28b are typically expressed in stem/progenitor cells associated with cell proliferation, we hypothesized that Lin28a and Lin28b promote TEC proliferation in the postnatal thymus, especially in MHCIIlo TECs. To test this hypothesis, we measured TEC proliferation in iLin28a OE mice at 6 weeks of age. Compared to control mice, in iLin28a OE mice, the total number of BrdU+ TECs was significantly increased in total TECs (Figures 6A, B) but was selectively higher in MHCIIlo TECs (Figures 6C–E). LIN28a+ TECs incorporated a significantly higher level of BrdU than LIN28a- TECs, indicating that this is a cell-autonomous effect (Figures 6F, G). In addition, the frequency of BrdU+ cells did not change in thymocyte subsets (Supplementary Figure 5A), and thymocytes and TECs from both mutant and control mice did not show a significant change in apoptosis (Supplementary Figures 5B-D). These data suggest that overexpressing Lin28a primarily affects TEC subsets by directly or indirectly increasing the proliferation of MHCIIlo TECs.
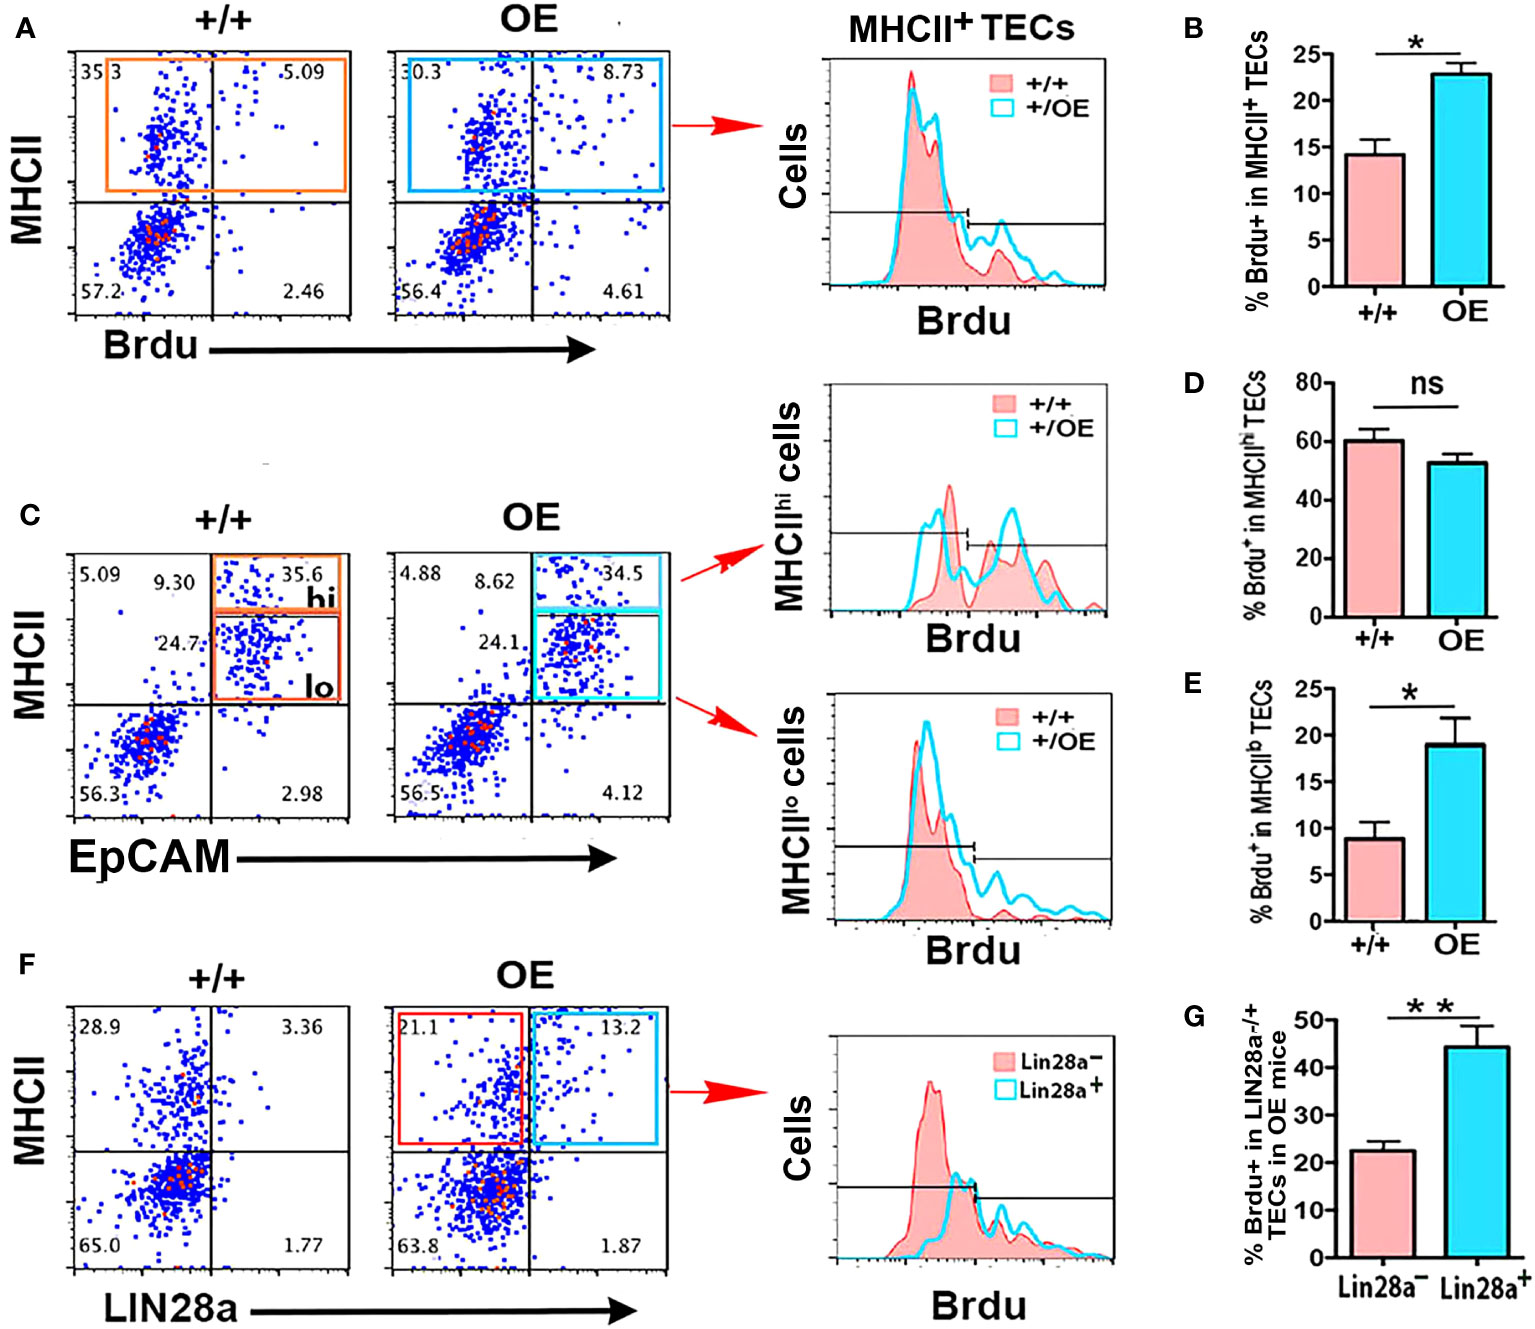
Figure 6 Specific overexpression of Lin28a in TECs increased the proliferation capability of MHCIIlo TECs. (A) Representative profiles of MHCII and BrdU staining on total CD45- cells in +/+ and OE mice and histograms show overlapping profiles of BrdU staining on gated MHCII+ cells. (B) Summary of the percentage of BrdU+ cells in total TECs. (C) Representative profiles of MHCII and EpCAM staining on gated CD45- cells and the gates of MHCIIlo and MHCIIhi TEC subsets in TECs, and histograms show overlapping profiles of BrdU staining on gated MHCIIhi and MHCIIlo TECs. (D) Percentage of BrdU+ cells in MHCIIhi TECs. (E) Percentage of BrdU+ cells in MHCIIlo TECs. (F) Representative profiles of MHCII and Lin28a staining on gated CD45- cells and histograms show overlapping profiles of BrdU staining on gated Lin28a- (red) and Lin28a+ (blue) TECs. (G) Percentage of BrdU+ cells in gated Lin28a- and Lin28a+ TECs from OE mice only. Data are representative of two individual experiments (+/+: n= 5; OE: n=5). Data are representative of three individual experiments. Mice aged 6-7 weeks were used. Student’s t test results between +/+ and OE mice: *P <0.05, **P <0.01. Bars indicate means ± SEMs. ns: not significant.
TEC differentiation and proliferation are also controlled by the transcription factor FOXN1, and Foxn1 downregulation is considered an initiating event for age-associated thymic involution (37). The dynamic patterns of Lin28a, Lin28b, and Let-7g across age, the loss of MHCIIhi mTECs in Lin28a and Lin28b loss-of-function mutants and the selective effect on proliferation of MHCIIlo TECs with Lin28a OE all mirror aspects of Foxn1 expression and function (37). To test the relationship between FOXN1 and Lin28b and Let-7g in TECs, we generated an allelic series using two alleles of Foxn1: the hypomorphic allele Foxn1Lacz/LacZ (Z/Z) (37) and the null allele Foxn1nu (42). In Z/Z mutants, Foxn1 expression is downregulated in TECs beginning at P7, resulting in a relative reduction in MHCIIhi and an increase in MHCIIlo TEC subsets. Combining the Z allele with the nu allele results in a progressive decline in thymus size and TEC phenotypes (37). We first analyzed Lin28b and Let-7g gene expression in total TECs from +/+, +/Z, Z/Z and Z/N (Z/nude) mice at 3 weeks of age. We found that with the progressive reduction in Foxn1 expression, both Lin28b and Let-7g in total TECs were downregulated in a Foxn1 dose-specific manner (Figures 7A, B). Consistent with their wild-type expression patterns, Lin28b was reduced in MHCIIhi TECs, and Let-7g was reduced in MHCIIlo TECs in the Z/Z mutants compared to +/Z controls (Figures 7C, D). These data indicated that the differential expression of both genes is controlled directly or indirectly by FOXN1.
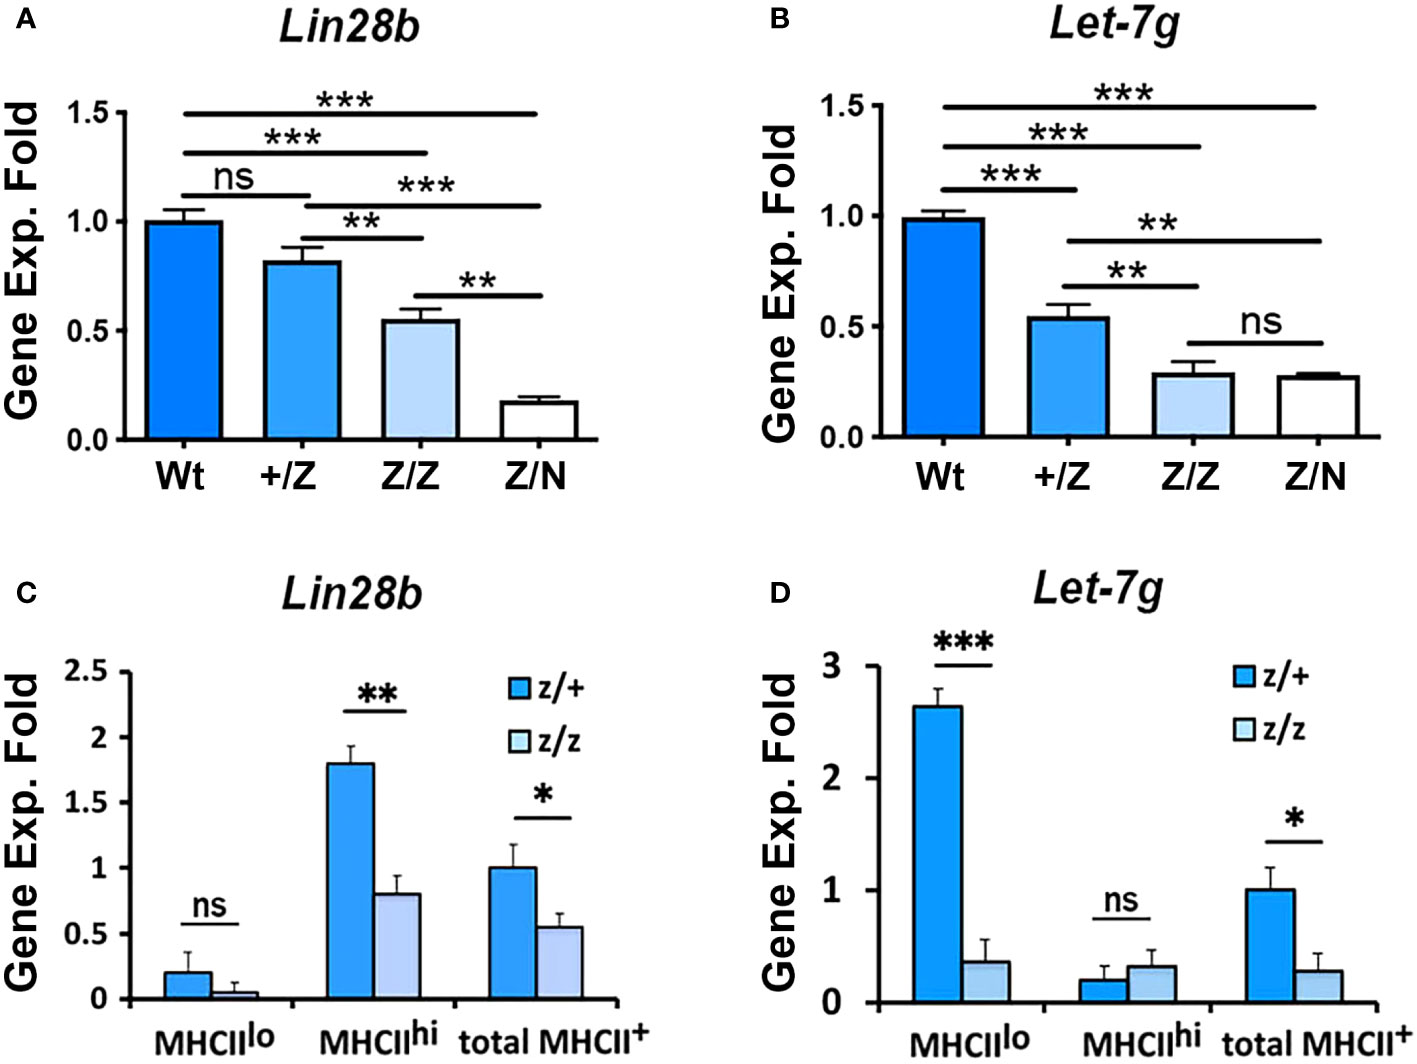
Figure 7 The gene expression of Lin28b and Let-7g was associated with the Foxn1 expression in the thymus. (A, B). Gene expression of Lin28b (A) and Let-7g (B) in total TECs from +/+, +/Z, Z/Z, and Z/N thymi of 3-week-old mice. Data are representative of three individual experiments, (+/+: n= 3; +/Z: n=5, Z/Z: n=5, Z/N: n=4). (C, D). Gene expression of Lin28b (C) and Let-7g (D) in MHCIIlo and MHCIIhi TEC subsets and total TECs from +/Z and Z/Z thymi. Data are representative of two individual experiments, (+/Z: n=4, Z/Z: n=5). One-way ANOVA (A, B) results between each colony of mice; Student’s t-test (C, D) results between Z/+ and Z/Z mice: *P <0.05, **P <0.01, ***P <0.001. ns: not significant. Bars indicate means ± SEM.
To further investigate the regulation of Lin28 and Let-7 relative to thymic involution, we performed sex steroid ablation (SSA)-induced thymic rebound in 2.5- and 6-month-old Wt mice and analyzed gene expression early at day 3.5 after castration. SSA significantly increased Lin28b but not Lin28a expression specifically in MHCIIhi TECs at both 2.5 and 6 months, while expression in MHCIIlo TECs remained undetected (Figures 8A, B). SSA also caused a reduction in Let-7g expression in both MHCIIlo and MHCIIhi TECs at 2.5 months but no change in either subset at 6 months (Figure 8C). Based on microRNA search results, we found that the mouse class II transactivator-encoding gene Ciita (a critical regulator of MHCII gene expression) and several H2 genes had the predicted target sites for Let-7g and some other Let-7s (Table 1). To test the effect of Let-7g, we further measured the changes of these two genes after SSA, and consistent with down-regulation of Let-7g, both Ciita and H2-IAb mRNA were increased in MHCIIlo and MHCIIhi TECs at 2.5 months, but still increased in MHCIIhi TECs at 6 months even without Let-7g change (Figures 8D, E). These changes in gene expression were associated with an increase in the total number of TECs (Figure 8F), including MHCIIlo and MHCIIhi TECs (Figure 8G). Hiweverthe increase was much greater in MHCIIhi TECs (Figure 8H), causing an increase in the ratio of MHCIIhi : MHCIIlo (Figure 8I). These data suggest that SSA-induced thymic rebound is associated with an increase in Lin28b in MHCIIhi TECs, with higher frequency of MHCIIhi TECs, and increased MHCII gene expression in these cells. The increase in MHCII gene expression in these cells may be caused by reducing the inhibitory effect of Let-7g to Ciita and H2 genes.
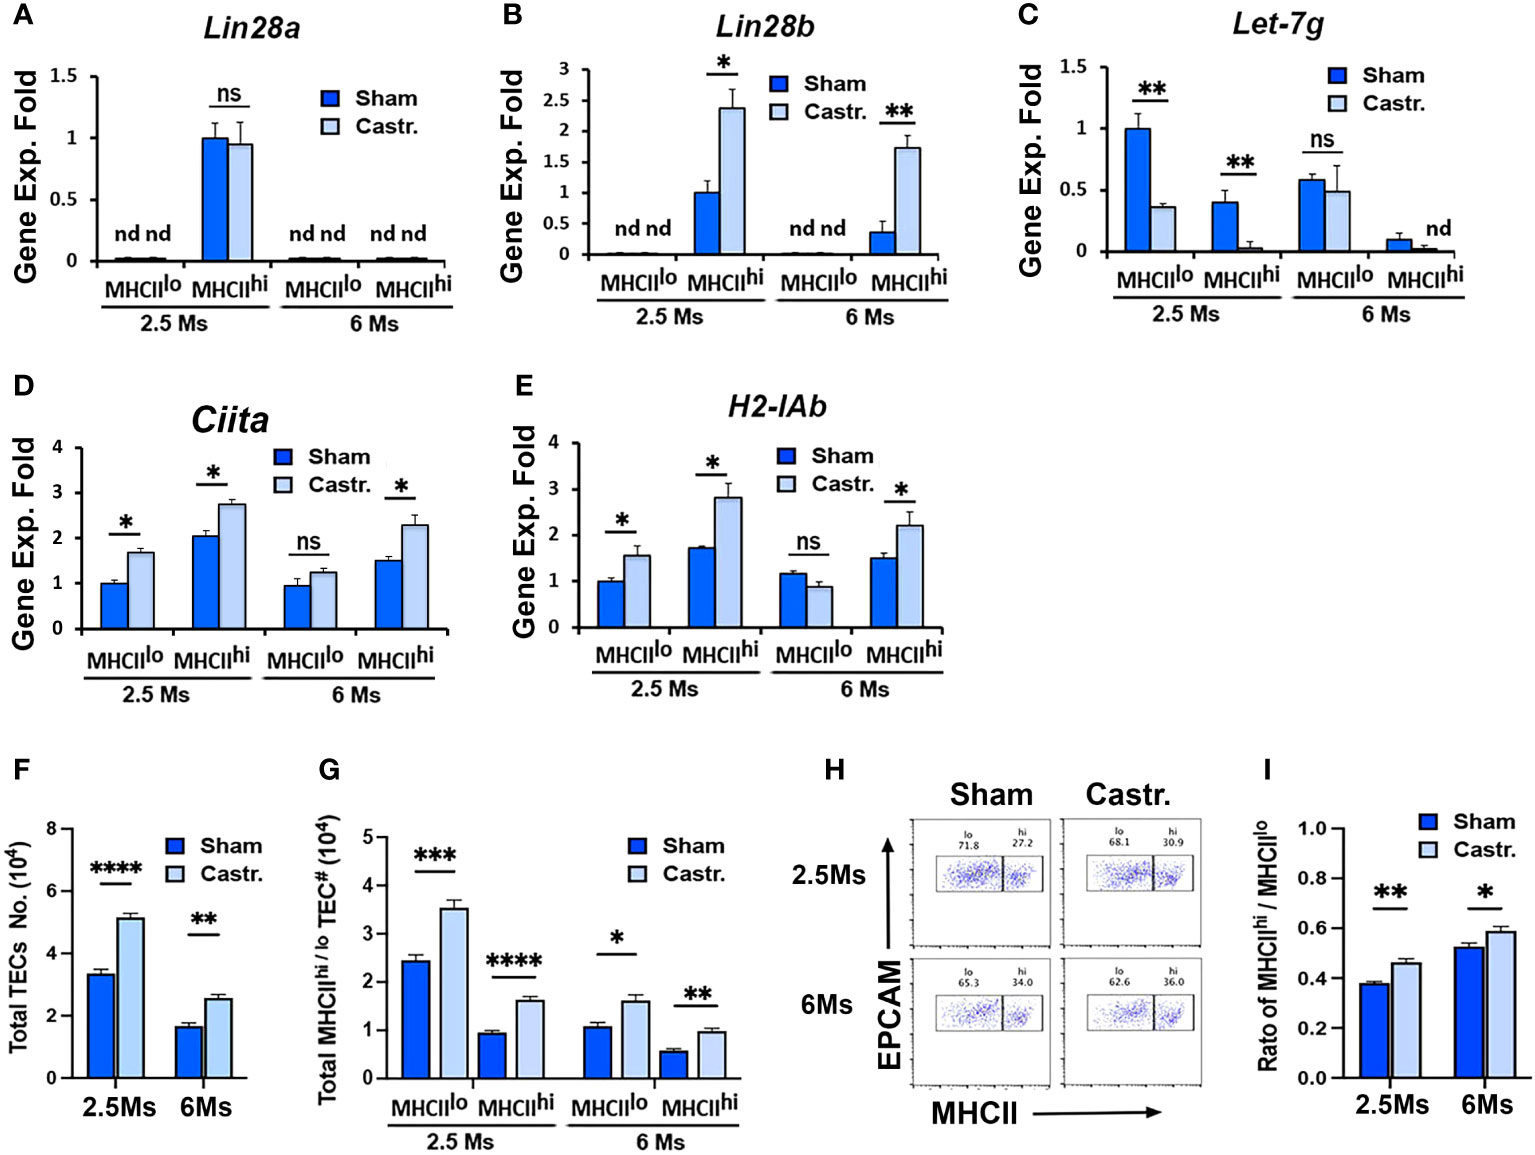
Figure 8 Lin28b increased in sex steroid ablation-induced thymic rebound. 2.5 and 6 months BL6 WT mice underwent castration surgery. Three days later, TECs were isolated, and MHCIIlo and MHCIIhi TEC subsets were sorted for gene expression analysis and phenotypic analysis. (A-D) Gene expression of Lin28a (A) , Lin28b (B), Let-7g (C), Ciita (D), and H2-IAb (E) in MHCIIlo and MHCIIhi TEC subsets in 2.5- and 6-month-old sham and castrated mice. The gene expression levels of Lin28a and Lin28b in MHCIIhi TECs and Let-7g and H2-IAb in MHCIIlo TECs of 2.5-month sham mice were used as controls with a value of 1. (F-I) Flow cytometry analysis data. (F) Total number of TECs. (G) Total number of MHCIIlo and MHCIIhi TEC subsets. (H) Representative profiles of MHCII and EpCAM staining on gated total TECs. (I) Ratio of MHCIIhi/MHCIIlo TECs. Data are representative of two individual experiments, (Sham: n= 5; Castr.: n=6). Student’s t-test results between Sham and Castr mice: *P <0.05, **P <0.01, ***P <0.001, ****P <0.0001. ns: not significant. Bars indicate means ± SEM.
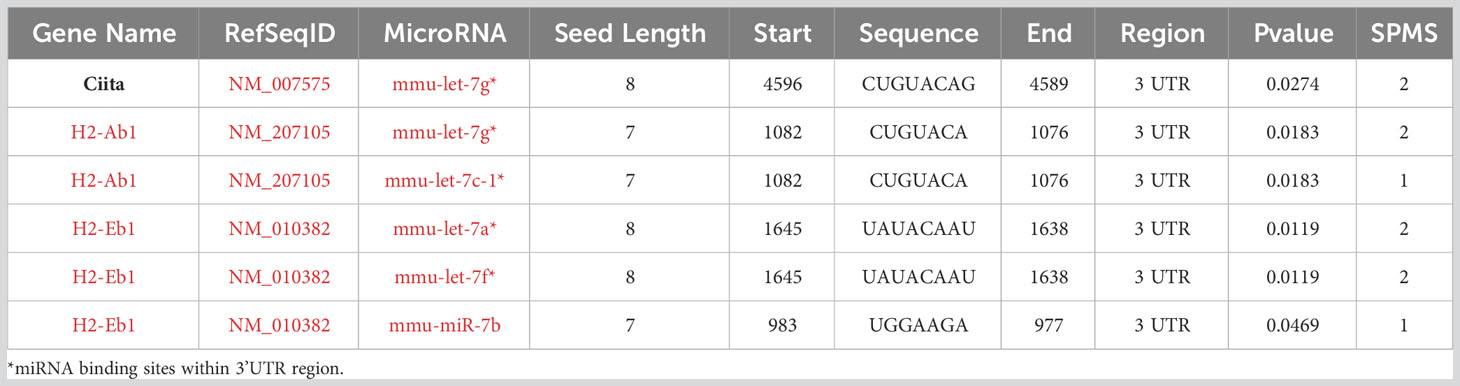
Table 1 Predicted target sites for miRNA Let-7 in Ciita and H2 genes.
In this study, we linked the expression profiles of Lin28a, Lin28b, and Let-7g in MHCIIhi and MHCIIlo TEC subsets to the development and differentiation of TECs during thymic ontogeny and involution. We found that, as in other systems, at murine postnatal stages, Lin28a, Lin28b, and Let-7g had inversely correlated expression patterns in TECs. Both Lin28a and Lin28b were more highly expressed in MHCIIhi TECs but were expressed at low or undetectable levels in MHCIIlo TECs (Lin28b was more highly expressed overall than Lin28a), while Let-7g was expressed at the highest level in MHCIIlo TECs but was absent or undetectable in MHCIIhi TECs.
Several lines of evidence suggest that Lin28 and Let-7 expression and function in TECs are downstream of FOXN1 and are consistent with mediating some of the effects of Foxn1 downregulation that is thought to precipitate age-related involution. Lin28a, Lin28b, and Let-7g expression all peak at 1 month of age in their respective cell types and then decline with aging starting at 3 months, similar to Foxn1 (37). Loss of Lin28b specifically in TECs (which causes an increase in Let-7g) resulted in a smaller thymus with selective loss of MHCIIhi mTECs, while overexpression of Lin28a (which causes a loss of Let-7g) causes a larger thymus due to selectively increased proliferation in MHCIIlo TECs. Both phenotypes are consistent with known roles for Foxn1 in promoting TEC differentiation and selectively impacting the proliferation of MHCIIlo TECs (37). Furthermore, we demonstrated a dose-dependent expression relationship between Foxn1 expression and both Lin28b and Let-7g expression, consistent with Foxn1 acting upstream of both genes. Taken together, these data suggest that at least some functions of Foxn1 are mediated by its regulation of Lin28 and Let-7, both in the steady-state thymus and during involution.
Lin28a and Lin28b have redundant roles in other cell types at both fetal and adult stages (21, 25, 26). Our data support both unique and redundant functions for Lin28a and Lin28b in TECs. While only Lin28b is expressed at fetal stages, both genes are expressed in postnatal TECs, with similar patterns of expression at least in bulk analysis: higher in MHCIIhi than MHCIIlo TECs, peaking at 1 month and then declining with age. Comparison of the Lin28b single knockout (KO) and Lin28a and Lin28b double KO phenotypes indicates a redundant function in suppressing Let-7g expression, even in MHCIIlo TECs where neither gene has much expression. However, their expression patterns do not directly overlap, and immunofluorescence analysis shows that LIN28a and b proteins are expressed in distinct subsets of TECs, with LIN28a protein tending to correlate with lower FOXN1 levels and LIN28b correlating with higher levels of FOXN1. These data suggest that both genes mediate their effects by acting in different subsets of TECs, and while both may act similarly to suppress Let-7g, the effects could differ in detail. Their impacts could also differ if Let-7g regulates different sets of target genes in different TEC subsets. Regarding the inhibitory effect of LIN28 on Let-7g, while the gene expression of Lin28 and Let-7g showed opposite patterns in MHCIIhi and MHCIIlo TECs during postnatal thymic ontogeny, there were instances where Let-7g expression did not follow the changes in Lin28 expression in TECs. For example, Lin28b showed a positive correlation with Let-7g expression in E13.5 and E18.5 TECs (Figure 1F); specific deletion of Lin28a and b caused a 1.3-fold increase in MHCIIlo TECs (Figure 3C), despite overall low expression of both Lin28a and Lin28b in these cells; overexpression of Lin28a did not lead to Let-7g reduction in MHCIIhi TECs (Figures 4H, I); and the rebound of Lin28b reduced Let-7g expression in MHCIIlo TECs in 2.5-month-old but not in 6-month-old SSA mice (Figure 6G). These findings suggest that Let-7g has additional regulatory inputs beyond LIN28 in TECs (28, 43), which would be a potentially fruitful avenue for future study. The lack of a change in Let-7g expression at 6 months combined with the increased expression of Lin28b suggests that increases in H2-IAb expression correlated specifically with increased Lin28b and may be independent of Let-7g,
Another important point is that the preferential expression of Let-7g in MHCIIlo TECs, which are typically considered to represent less mature TECs, is the opposite of what would be predicted from its expression in the most differentiated cells in other cell types. The high expression of Let-7g in MHCIIlo TECs thus raises the possibility that this expression is due to a subset of MHCIIlo postnatal TECs called post-Aire TECs, which represent a senescent, post-proliferative TEC subset that is derived from mature AIRE+ mTEC (44, 45). In this case, expression could potentially drive cells into the post-AIRE state. Alternatively, Let-7g could have a different pattern and function in TECs compared to other cell types. It may suppress the expression of a critical differentiation marker MHCII in less mature TECs, with upregulation of Lin28 during TEC differentiation acting to suppress Let-7g and thus allow upregulation of MHCII. Supporting this possibility, several H2 genes and the class II transactivator encoding gene Ciita, a critical regulator of MHCII gene expression, have Let-7g binding sites in their 3’UTRs (Table 1). Notably, the expression of Ciita and H2-IAb were consistent with Let-7g down-regulation in 2.5-month SSA mice (Figures 8D, E), suggesting that Lin28 promotes MHCII expression by reducing the inhibitory influence of Let-7g on Ciita and H2 genes.
The data from Foxn1Lacz mutants showed a Foxn1 dose-dependent downregulation of both Let-7g and Lin28b expression in TECs, suggesting that expression of both genes requires FOXN1 at some level. This regulation could be direct or indirect, and other regulators are clearly needed to restrict expression to specific TEC subsets. Indeed, mTECs have been implicated in the regulation of Let-7 levels in developing natural killer T cells in the thymus (46), supporting that TECs can indirectly regulate Let-7. Our own data show that the same signals (RA, vitamin D3) regulate Let-7g levels in thymic progenitor B cells and depend on Foxn1 levels (28). Collectively, our data are consistent with a model in which during postnatal TEC development and differentiation, Let-7g is broadly upregulated in TECs by increasing FOXN1 levels, while Lin28b is upregulated in a subset of TECs due to both FOXN1 and an unidentified regulator(s). In those cells, LIN28b blocks Let-7g, allowing for increased MHCII expression and driving the maturation of TECs to MHCIIhi cells. With the downregulation of Foxn1 during aging, both Let-7g and Lin28b expression decline, but the reduction in Lin28b offsets this Let-7g downregulation and results in increased inhibition of MCHII expression, which results in long-term declines in MHCII expression during aging and involution.
The original contributions presented in the study are included in the article/Supplementary Material. Further inquiries can be directed to the corresponding author.
The animal study was approved by University of Georgia Institutional Animal Care and Use Committee. The study was conducted in accordance with the local legislation and institutional requirements.
SX: Conceptualization, Data curation, Formal Analysis, Investigation, Methodology, Writing – review & editing – original draft. WZ: Investigation, Methodology, writing-review & editing. JL: Investigation, Methodology, writing-review & editing. NM: Funding acquisition, Resources, Supervision, Writing – review & editing, Investigation.
The authors declare financial support was received for the research, authorship, and/or publication of this article. This work was supported by the National Institute of Health (grant number: P01 AG052359. Project 1 to NM).
We thank Lauren Ehrlich for critical discussions. We thank Dr. Jianfu Chen (Department of Genetics, University of Georgia. Current address: Herman Ostrow School of Dentistry of USC, Los Angeles, CA 90089) for providing iLin28a mice and Dr. Eric Moss (Department of Molecular Biology, Rowan University, Stratford, NJ 08084 USA) for sharing the mouse strain used. We thank Julie Nelson in the Center for Tropical and Emerging Global Diseases Flow Cytometry Facility at the University of Georgia for technical support for cell sorting. InsightMed Communications, LLC provided manuscript editing services..
The authors declare that the research was conducted in the absence of any commercial or financial relationships that could be construed as a potential conflict of interest.
All claims expressed in this article are solely those of the authors and do not necessarily represent those of their affiliated organizations, or those of the publisher, the editors and the reviewers. Any product that may be evaluated in this article, or claim that may be made by its manufacturer, is not guaranteed or endorsed by the publisher.
The Supplementary Material for this article can be found online at: https://www.frontiersin.org/articles/10.3389/fimmu.2023.1261081/full#supplementary-material
Supplementary Figure 1 | Immunofluorescence staining of fetal thymic sections. (A, B). 4% PFA-fixed E13.5 (A) and E18.5 (B) thymic sections were stained by FOXN1 (red) and LIN28a (green, no positive signaling was detected on thymi). (C). Frozen E13.5 thymic sections were stained for LIN28b (green), MHCII (red), and K14 (pink). (D). The digitally enlarged images of the area indicated in C. Scale bar = 0.1 mm.
Supplementary Figure 2 | TECs sorted from fetal and postnatal thymi. (A-D). The gate settings for TEC sorting (left). Representative profiles of EpCAM and MHCII staining and gates of EpCAM+ MHCII-, EpCAM+MHCIIlo, and/or EpCAM+MHCIIhi TCE subsets in the gated CD45- cells from thymi of fetal E13.5 (A), E18.5 (B), postnatal 30 days (C), and 6 months (D).
Supplementary Figure 3 | Immunofluorescence staining of Lin28a and b double KO thymic sections. (A, B). 4% PFA fixed Lin28afl/flbfl/fl;Foxn1+/+ control (2 month-old) thymic sections were stained by FOXN1 (red) and LIN28a (A) and LIN28b (B) (green). (C, D). 4% PFA fixed Lin28afl/flbfl/fl;Foxn1Cre/+ double KO (2 month-old) thymic sections were stained by FOXN1 (red) and LIN28a (C) and LIN28b (D) (green, no positive signaling was detected on thymi). Scale bar = 0.1mm.
Supplementary Figure 4 | TEC-specific overexpression of Lin28a caused an increase in thymus size in postnatal adult mice. (A). Image of thymi from 6-7-week-old iLin28a+/+ Wt (+/+) and iLin28a OE transgenic (OE) mice. (B). Mouse body weights of +/+ and OE mice. (C). Thymus weights of +/+ and OE mice. (D) Ratio of thymus weight vs body weight of +/+ and OE mice. (E). Total number of MHCIIlo TECs, including MHCIIlo cTECs and mTECs. (F). Total number of MHCIIhi TECs, including MHCIIhi cTECs and mTECs. (G). Ratio of MHCIIlo TECs vs MHCIIhi TECs. (H). Percentage of CD4 and CD8 thymocytes in total cells. Student’s t test (B-D) results between +/+ and OE mice: *P <0.05, **P <0.01, ***P <0.001, ****P <0.0001. ns: not significant.
Supplementary Figure 5 | BrdU and Annexin V staining of cells from TEC-specific overexpression of Lin28a in postnatal adult mice. (A). Percentage of BrdU+ cells in CD4 and CD8 thymocytes in +/+ and OE mice. (B). Percentage of Ann-V+ cells in CD4 and CD8 thymocyte in +/+ and OE mice. (C). Total Ann-V+ CD4 and CD8 thymocytes in +/+ and OE mice. (D). Percentage of Ann-V+ cells in total TECs in +/+ and OE mice. Data are representative of two individual experiments, (+/+, n=3, OE, n=4). Student’s t test (B-D) results between +/+ and OE mice:. ns: not significant.
1. Ambros V. The functions of animal microRNAs. Nature (2004) 431(7006):350–5. doi: 10.1038/nature02871
2. Moss EG, Lee RC, Ambros V. The cold shock domain protein LIN-28 controls developmental timing in C. elegans and is regulated by the lin-4 RNA. Cell (1997) 88(5):637–46. doi: 10.1016/s0092-8674(00)81906-6
3. Reinhart BJ, Slack FJ, Basson M, Pasquinelli AE, Bettinger JC, Rougvie AE, et al. The 21-nucleotide let-7 RNA regulates developmental timing in Caenorhabditis elegans. Nature (2000) 403(6772):901–6. doi: 10.1038/35002607
4. Moss EG, Tang L. Conservation of the heterochronic regulator Lin-28, its developmental expression and microRNA complementary sites. Dev Biol (2003) 258(2):432–42. doi: 10.1016/S0012-1606(03)00126-X
5. Pasquinelli AE, Reinhart BJ, Slack F, Martindale MQ, Kuroda MI, Maller B, et al. Conservation of the sequence and temporal expression of let-7 heterochronic regulatory RNA. Nature (2000) 408(6808):86–9. doi: 10.1038/35040556
6. Viswanathan SR, Daley GQ, Gregory RI. Selective blockade of microRNA processing by Lin28. Science (2008) 320(5872):97–100. doi: 10.1126/science.1154040
7. Rybak A, Fuchs H, Smirnova L, Brandt C, Pohl EE, Nitsch R, et al. A feedback loop comprising lin-28 and let-7 controls pre-let-7 maturation during neural stem-cell commitment. Nat Cell Biol (2008) 10(8):987–93. doi: 10.1038/ncb1759
8. Zhu H, Shyh-Chang N, Segre AV, Shinoda G, Shah SP, Einhorn WS, et al. The Lin28/let-7 axis regulates glucose metabolism. Cell (2011) 147(1):81–94. doi: 10.1016/j.cell.2011.08.033
9. Thornton JE, Chang HM, Piskounova E, Gregory RI. Lin28-mediated control of let-7 microRNA expression by alternative TUTases Zcchc11 (TUT4) and Zcchc6 (TUT7). RNA (2012) 18(10):1875–85. doi: 10.1261/rna.034538.112
10. Darr H, Benvenisty N. Genetic analysis of the role of the reprogramming gene LIN-28 in human embryonic stem cells. Stem Cells (2009) 27(2):352–62. doi: 10.1634/stemcells.2008-0720
11. Richards M, Tan SP, Tan JH, Chan WK, Bongso A. The transcriptome profile of human embryonic stem cells as defined by SAGE. Stem Cells (2004) 22(1):51–64. doi: 10.1634/stemcells.22-1-51
12. Shyh-Chang N, Daley GQ, Cantley LC. Stem cell metabolism in tissue development and aging. Development (2013) 140(12):2535–47. doi: 10.1242/dev.091777
13. Yuan J, Nguyen CK, Liu X, Kanellopoulou C, Muljo SA. Lin28b reprograms adult bone marrow hematopoietic progenitors to mediate fetal-like lymphopoiesis. Science (2012) 335(6073):1195–200. doi: 10.1126/science.1216557
14. Zhou Y, Li YS, Bandi SR, Tang L, Shinton SA, Hayakawa K, et al. Lin28b promotes fetal B lymphopoiesis through the transcription factor Arid3a. J Exp Med (2015) 212(4):569–80. doi: 10.1084/jem.20141510
15. Rowe RG, Wang LD, Coma S, Han A, Mathieu R, Pearson DS, et al. Developmental regulation of myeloerythroid progenitor function by the Lin28b-let-7-Hmga2 axis. J Exp Med (2016) 213(8):1497–512. doi: 10.1084/jem.20151912
16. Iliopoulos D, Hirsch HA, Struhl K. An epigenetic switch involving NF-kappaB, Lin28, Let-7 MicroRNA, and IL6 links inflammation to cell transformation. Cell (2009) 139(4):693–706. doi: 10.1016/j.cell.2009.10.014
17. Thornton JE, Gregory RI. How does Lin28 let-7 control development and disease? Trends Cell Biol (2012) 22(9):474–82. doi: 10.1016/j.tcb.2012.06.001
18. Viswanathan SR, Powers JT, Einhorn W, Hoshida Y, Ng TL, Toffanin S, et al. Lin28 promotes transformation and is associated with advanced human Malignancies. Nat Genet (2009) 41(7):843–8. doi: 10.1038/ng.392
19. Park SM, Shell S, Radjabi AR, Schickel R, Feig C, Boyerinas B, et al. Let-7 prevents early cancer progression by suppressing expression of the embryonic gene HMGA2. Cell Cycle (2007) 6(21):2585–90. doi: 10.4161/cc.6.21.4845
20. Zhu H, Shah S, Shyh-Chang N, Shinoda G, Einhorn WS, Viswanathan SR, et al. Lin28a transgenic mice manifest size and puberty phenotypes identified in human genetic association studies. Nat Genet (2010) 42(7):626–30. doi: 10.1038/ng.593
21. Shinoda G, Shyh-Chang N, Soysa TY, Zhu H, Seligson MT, Shah SP, et al. Fetal deficiency of lin28 programs life-long aberrations in growth and glucose metabolism. Stem Cells (2013) 31(8):1563–73. doi: 10.1002/stem.1423
22. Roush S, Slack FJ. The let-7 family of microRNAs. Trends Cell Biol (2008) 18(10):505–16. doi: 10.1016/j.tcb.2008.07.007
23. Ruby JG, Jan C, Player C, Axtell MJ, Lee W, Nusbaum C, et al. Large-scale sequencing reveals 21U-RNAs and additional microRNAs and endogenous siRNAs in C. elegans Cell (2006) 127(6):1193–207. doi: 10.1016/j.cell.2006.10.040
24. Shyh-Chang N, Daley GQ. Lin28: primal regulator of growth and metabolism in stem cells. Cell Stem Cell (2013) 12(4):395–406. doi: 10.1016/j.stem.2013.03.005
25. Gaytan F, Sangiao-Alvarellos S, Manfredi-Lozano M, Garcia-Galiano D, Ruiz-Pino F, Romero-Ruiz A, et al. Distinct expression patterns predict differential roles of the miRNA-binding proteins, Lin28 and Lin28b, in the mouse testis: studies during postnatal development and in a model of hypogonadotropic hypogonadism. Endocrinology (2013) 154(3):1321–36. doi: 10.1210/en.2012-1745
26. Sangiao-Alvarellos S, Manfredi-Lozano M, Ruiz-Pino F, Leon S, Morales C, Cordido F, et al. Testicular expression of the Lin28/let-7 system: Hormonal regulation and changes during postnatal maturation and after manipulations of puberty. Sci Rep (2015) 5:15683. doi: 10.1038/srep15683
27. Ong KK, Elks CE, Li S, Zhao JH, Luan J, Andersen LB, et al. et al: Genetic variation in LIN28B is associated with the timing of puberty. Nat Genet (2009) 41(6):729–33. doi: 10.1038/ng.382
28. Xiao S, Zhang W, Manley NR. Thymic epithelial cell-derived signals control B progenitor formation and proliferation in the thymus by regulating Let-7 and Arid3a. PloS One (2018) 13(2):e0193188. doi: 10.1371/journal.pone.0193188
29. Johnson SM, Grosshans H, Shingara J, Byrom M, Jarvis R, Cheng A, et al. RAS is regulated by the let-7 microRNA family. Cell (2005) 120(5):635–47. doi: 10.1016/j.cell.2005.01.014
30. St-Pierre C, Brochu S, Vanegas JR, Dumont-Lagace M, Lemieux S, Perreault C. Transcriptome sequencing of neonatal thymic epithelial cells. Sci Rep (2013) 3:1860. doi: 10.1038/srep01860
31. Dweep H, Gretz N. miRWalk2.0: a comprehensive atlas of microRNA-target interactions. Nat Methods (2015) 12(8):697. doi: 10.1038/nmeth.3485
32. Dweep H, Sticht C, Pandey P, Gretz N. miRWalk–database: prediction of possible miRNA binding sites by “walking” the genes of three genomes. J Biomed Inf (2011) 44(5):839–47. doi: 10.1016/j.jbi.2011.05.002
33. Blackburn CC, Manley NR. Developing a new paradigm for thymus organogenesis. Nat Rev Immunol (2004) 4(4):278–89. doi: 10.1038/nri1331
34. Gordon J, Manley NR. Mechanisms of thymus organogenesis and morphogenesis. Development (2011) 138(18):3865–78. doi: 10.1242/dev.059998
35. Manley NR, Condie BG. Transcriptional regulation of thymus organogenesis and thymic epithelial cell differentiation. Prog Mol Biol Transl Sci (2010) 92:103–20. doi: 10.1016/S1877-1173(10)92005-X
36. Nehls M, Kyewski B, Messerle M, Waldschutz R, Schuddekopf K, Smith AJ, et al. Two genetically separable steps in the differentiation of thymic epithelium. Science (1996) 272(5263):886–9. doi: 10.1126/science.272.5263.886
37. Chen L, Xiao S, Manley NR. Foxn1 is required to maintain the postnatal thymic microenvironment in a dosage-sensitive manner. Blood (2009) 113(3):567–74. doi: 10.1182/blood-2008-05-156265
38. Gordon J, Xiao S, Hughes B 3rd, Su DM, Navarre SP, Condie BG, et al. Specific expression of lacZ and cre recombinase in fetal thymic epithelial cells by multiplex gene targeting at the Foxn1 locus. BMC Dev Biol (2007) 7:69. doi: 10.1186/1471-213X-7-69
39. de Boer J, Williams A, Skavdis G, Harker N, Coles M, Tolaini M, et al. Transgenic mice with hematopoietic and lymphoid specific expression of Cre. Eur J Immunol (2003) 33(2):314–25. doi: 10.1002/immu.200310005
40. Yang M, Yang SL, Herrlinger S, Liang C, Dzieciatkowska M, Hansen KC, et al. Lin28 promotes the proliferative capacity of neural progenitor cells in brain development. Development (2015) 142(9):1616–27. doi: 10.1242/dev.120543
41. Grieco A, Rzeczkowska P, Alm C, Palmert MR. Investigation of peripubertal expression of Lin28a and Lin28b in C57BL/6 female mice. Mol Cell Endocrinol (2013) 365(2):241–8. doi: 10.1016/j.mce.2012.10.025
42. Pantelouris EM. Athymic development in the mouse. Differentiation (1973) 1(6):437–50. doi: 10.1111/j.1432-0436.1973.tb00143.x
43. Balzer E, Heine C, Jiang Q, Lee VM, Moss EG. LIN28 alters cell fate succession and acts independently of the let-7 microRNA during neurogliogenesis. vitro Dev (2010) 137(6):891–900. doi: 10.1242/dev.042895
44. Nishikawa Y, Hirota F, Yano M, Kitajima H, Miyazaki J, Kawamoto H, et al. Biphasic Aire expression in early embryos and in medullary thymic epithelial cells before end-stage terminal differentiation. J Exp Med (2010) 207(5):963–71. doi: 10.1084/jem.20092144
45. Wang X, Laan M, Bichele R, Kisand K, Scott HS, Peterson P. Post-Aire maturation of thymic medullary epithelial cells involves selective expression of keratinocyte-specific autoantigens. Front Immunol (2012) 3(March):19. doi: 10.3389/fimmu.2012.00019
Keywords: thymic epithelial cells, proliferation, thymic involution, MHCII, Lin28a, Lin28b, Let-7g, Foxn1
Citation: Xiao S, Zhang W, Li J and Manley NR (2023) Lin28 regulates thymic growth and involution and correlates with MHCII expression in thymic epithelial cells. Front. Immunol. 14:1261081. doi: 10.3389/fimmu.2023.1261081
Received: 18 July 2023; Accepted: 07 September 2023;
Published: 06 October 2023.
Edited by:
Anil K. Bamezai, Villanova University, United StatesReviewed by:
Mark Pezzano, City College of New York (CUNY), United StatesCopyright © 2023 Xiao, Zhang, Li and Manley. This is an open-access article distributed under the terms of the Creative Commons Attribution License (CC BY). The use, distribution or reproduction in other forums is permitted, provided the original author(s) and the copyright owner(s) are credited and that the original publication in this journal is cited, in accordance with accepted academic practice. No use, distribution or reproduction is permitted which does not comply with these terms.
*Correspondence: Shiyun Xiao, c2hpeXVuQHVnYS5lZHU=
†Present address: Jie Li, Department of Experimental Immunology, National Institute of Health, Bethesda, MD, United States
Nancy R. Manley, School of Life Sciences, Arizona State University, Tempe, AZ, United States
Disclaimer: All claims expressed in this article are solely those of the authors and do not necessarily represent those of their affiliated organizations, or those of the publisher, the editors and the reviewers. Any product that may be evaluated in this article or claim that may be made by its manufacturer is not guaranteed or endorsed by the publisher.
Research integrity at Frontiers
Learn more about the work of our research integrity team to safeguard the quality of each article we publish.