 Emil Bach1
 Stephen F. Fitzgerald2
 Sarah E. Williams-MacDonald2Mairi Mitchell2
 William T. Golde2
 David Longbottom2
 Alasdair J. Nisbet2Annemieke Dinkla3Eric Sullivan4
 Richard S. Pinapati4John C. Tan4
 Leo A. B. Joosten5Hendrik-Jan Roest3,6,7
 Thomas Østerbye1
 Ad P. Koets3
 Søren Buus1
 Tom N. McNeilly2*
- 1Department of Immunology & Microbiology, University of Copenhagen, Copenhagen, Denmark
- 2Moredun Research Institute, Penicuik, United Kingdom
- 3Department of Bacteriology, Host-Pathogen Interaction and Diagnostic Development, Wageningen Bioveterinary Research, Lelystad, Netherlands
- 4Nimble Therapeutics, Inc., Madison, WI, United States
- 5Department of Internal Medicine, Radboud University Medical Center, Nijmegen, Netherlands
- 6Ministry of Agriculture, Nature and Food Quality, Den Haag, Netherlands
- 7Department of Infection and Immunology, Faculty of Veterinary Medicine, Utrecht University, Utrecht, Netherlands
Coxiella burnetii is an important zoonotic bacterial pathogen of global importance, causing the disease Q fever in a wide range of animal hosts. Ruminant livestock, in particular sheep and goats, are considered the main reservoir of human infection. Vaccination is a key control measure, and two commercial vaccines based on formalin-inactivated C. burnetii bacterins are currently available for use in livestock and humans. However, their deployment is limited due to significant reactogenicity in individuals previously sensitized to C. burnetii antigens. Furthermore, these vaccines interfere with available serodiagnostic tests which are also based on C. burnetii bacterin antigens. Defined subunit antigen vaccines offer significant advantages, as they can be engineered to reduce reactogenicity and co-designed with serodiagnostic tests to allow discrimination between vaccinated and infected individuals. This study aimed to investigate the diversity of antibody responses to C. burnetii vaccination and/or infection in cattle, goats, humans, and sheep through genome-wide linear epitope mapping to identify candidate vaccine and diagnostic antigens within the predicted bacterial proteome. Using high-density peptide microarrays, we analyzed the seroreactivity in 156 serum samples from vaccinated and infected individuals to peptides derived from 2,092 open-reading frames in the C. burnetii genome. We found significant diversity in the antibody responses within and between species and across different types of C. burnetii exposure. Through the implementation of three different vaccine candidate selection methods, we identified 493 candidate protein antigens for protein subunit vaccine design or serodiagnostic evaluation, of which 65 have been previously described. This is the first study to investigate multi-species seroreactivity against the entire C. burnetii proteome presented as overlapping linear peptides and provides the basis for the selection of antigen targets for next-generation Q fever vaccines and diagnostic tests.
1 Introduction
Q fever is a highly infectious zoonotic disease caused by the obligate intracellular gram-negative bacterium Coxiella burnetii. The disease is globally distributed apart from in New Zealand and Antarctica (1, 2). Humans can become infected following exposure to as few as 1–10 bacteria (3, 4), mainly through the inhalation of C. burnetii-containing dust particles and aerosols (5). Clinical manifestations of C. burnetii infection in humans range from common acute transient flu-like symptoms to persistent focalized infections resulting in endocarditis, hepatitis, and myocarditis, which can be life-threatening (6, 7). In pregnant women, its infection can provoke placentitis, leading to abnormal pregnancy outcomes, including miscarriage, pre-term delivery, and low birth weight (8).
Domestic ruminants, in particular dairy cows, sheep, and goats, are the main reservoir of human infections (9–11). In ruminants, C. burnetii can cause abortion, stillbirth, and delivery of weak offspring (12), with these clinical signs more commonly observed in small ruminants than in cattle (13). More recently, C. burnetii has been associated with metritis and infertility (14). During the peri-parturient period, ruminants can shed high numbers of bacteria via multiple routes, including milk, feces, vaginal secretions, and infected placental tissue, into the environment (15, 16).
Vaccination is regarded to be the most effective way to control the transmission of C. burnetii, with vaccination of ruminants considered important to reduce infections in both livestock and human populations (17). Currently, there are two commercially available Q fever vaccines: Q-VAX® (CSL Seqirus) licensed for use in humans in Australia only and Coxevac® (CEVA) for use in cattle and goats. Both vaccines are formalin-inactivated whole cell vaccines (WCVs) generated from the virulent phase I (PhI) form of the bacteria, which contains a full-length lipopolysaccharide (LPS) (18, 19). WCVs based on the avirulent phase II (PhII) form of the bacteria, which contains a truncated form of LPS, have previously been shown to be poorly effective in goats, guinea pigs, and mice (20–22), suggesting that LPS in the virulent PhI form is the major protective antigen in WCV PhI. However, immunization with a soluble extract from an avirulent phase II C. burnetii strain has been shown to confer protection against C. burnetii challenge in mice, guinea pigs, and Rhesus macaques (23). The protection elicited in this study may also have been related to the CpG adjuvant used, as similar studies of subunit C. burnetii vaccines in mice and guinea pigs have shown that adjuvant formulation can influence the levels of protection achieved (24, 25). We recently showed that a WCV prepared from a different PhII strain formulated with a saponin-based adjuvant was highly protective in a pregnant sheep model (26). This provides evidence that protection in this key target species is not exclusively LPS-based and involves additional antigens within the bacterial proteome.
A major issue with the current PhI WCVs is that they can induce potentially severe injection site reactions due to delayed-type hypersensitivity in individuals with pre-existing immunity to the bacteria, potentially involving responses to proteins of the Dot/Icm type IVB secretion system (27, 28). Consequently, deployment of the vaccine in humans is severely limited, with the Q-VAX® vaccine currently being used only in Australia for high-risk individuals such as abattoir workers and only after negative serological and intra-dermal skin test (27, 29). The situation is similar in ruminants, with PhI WCVs being associated with injection site reactions, pyrexia, and production losses (30). A further issue is that PhI WCVs are difficult to manufacture, requiring production at biosafety level 3 (BSL3).
Due to these safety and manufacturing issues, there have been considerable efforts to develop subunit vaccines to control Q fever, which avoid both the reactogenicity of current PhI WCV and BSL3 manufacture. Initial approaches included the use of subcellular fractions of C. burnetii, of which vaccines based on chloroform/methanol residue (CMR) preparations of the bacteria have held most promise. However, despite the initial development of CMR-based vaccines in the 1990s and the demonstration of protection and reduced reactogenicity in rodent and primate models (31–33), these vaccines have not yet reached the market. More recently, efforts have focused on the development of recombinant protein vaccines, but with limited success. The main issue with this approach is that knowledge of the most appropriate bacterial antigens to be incorporated into such vaccines is lacking.
Several approaches have been taken to identify protective vaccine antigens within the C. burnetii proteome to address this knowledge gap. These broadly fall into two categories based on the knowledge that protection induced by PhI WCV involves both antibody and cell-mediated immune responses (34, 35): firstly, an in silico prediction of major histocompatibility complex (MHC) class I and II epitopes within ORFs in the C. burnetii genome (36–41) and, secondly, an antibody-based screening method to identify C. burnetii proteins targeted by antibodies from vaccinated individuals. This latter approach has involved a wide array of methodologies including two-dimensional immunoblotting of whole-cell lysates of C. burnetii (42, 43), cDNA library screening (42), and the use of protein microarrays using recombinant proteins either expressed in Escherichia coli (44, 45) or in in vitro translation systems (46). These combined approaches have identified a range of different C. burnetii proteins targeted by WCV [reviewed in Hendrix (2012)] (47), although the results are highly variable between studies. This may reflect differences between individuals but may also reflect limitations with the technology deployed—for example, a lack of sensitivity for conventional immunoblotting techniques or an inherent bias against proteins that are more difficult to express in recombinant form in protein microarrays.
Antibody profiling using peptide arrays is becoming increasingly commonplace in the study of many diseases. Recent advances in technology allow the synthesis of high-density peptide microarrays with over 4 million pre-addressable peptides, meaning that whole organism proteomes, including the human proteome, can now be represented on arrays in overlapping peptides (48, 49). Such arrays, while only identifying linear B cell epitopes [i.e., those derived from conformations adopted by contiguous amino acids (50)] and not conformational epitopes, are particularly useful when interrogating the antibody response to complex antigen cocktails. Furthermore, the key advantages of this technology are the avoidance of technical issues relating to protein expression and the ability to interrogate arrays on multiple occasions with antibodies from many individuals, thus allowing the building of a high level of consensus in the B cell epitope repertoire within a population.
In this study, we developed high-density peptide microarrays representing the complete C. burnetii proteome using available C. burnetii genomic information. This was used to interrogate the antibody response to a commercial and protective PhI WCV, Coxevac®, in sheep and goats, and a protective PhII WCV in sheep (20, 26). In addition, the array was used to characterize the antibody response following C. burnetii infection in sheep, goats, cattle, and humans to understand species-specific differences in the antibody response to C. burnetii and identify potential antigen targets for pan-species serodiagnostic tests and protein subunit vaccines.
2 Materials and methods
2.1 Serum samples
A summary of the serum samples used for probing peptide arrays, including species of origin, Q fever vaccination status, and C. burnetii infection status, is provided in Table 1. The groups were defined as follows: NEG, unvaccinated and uninfected; POS, unvaccinated and naturally infected with C. burnetii; PC, post-experimental challenge with C. burnetii; PV1, vaccinated with PhI WCV; PV1+C, vaccinated with PhI WCV then experimentally challenged with C. burnetii; PV2, vaccinated with PhII WCV; PV2+C, vaccinated with PhII WCV then experimentally challenged with C. burnetii; and UV+C, unvaccinated and experimentally challenged with C. burnetii.

Table 1 Summary of the serum samples used for probing C. burnetii peptide microarrays.
Pre- and post-vaccination serum was obtained from goats vaccinated with PhI WCV Coxevac® and sheep vaccinated with either Coxevac® or a protective PhII WCV (26). For these species, the serum samples were also obtained from animals before and after experimental challenge with C. burnetii. Additionally, sheep serum samples were analyzed from vaccinated individuals post-C. burnetii challenge. Samples from humans and cattle were obtained from seropositive and seronegative individuals, as determined by ELISA (cattle) (52) or immunofluorescence assay (humans) (47), with positive humans diagnosed as having chronic Q fever according to the Dutch Consensus Guidelines (56, 57). Seropositive and seronegative cattle and human samples were therefore considered to originate from naturally C. burnetii-exposed/unexposed individuals, respectively. All serum samples were stored at ≤-20°C prior to use. In addition, the samples were re-evaluated for antibody reactivity to C. burnetii by ELISA, using an IDEXX Q-Fever antibody test (IDEXX, UK) for sheep, cattle, and goat samples and a SERION ELISA classic Coxiella burnetii Phase 2 IgG (Serion GmbH, Würzburg, Germany) for human samples, following the manufacturer’s instructions. This demonstrated that samples from vaccinated and/or C. burnetii-infected individuals had significantly increased C. burnetii-specific antibodies relative to the appropriate negative control samples. Details of the timing of serum sample analysis in sheep relative to vaccination and challenge and ELISA data from all samples used for probing peptide arrays are shown in Supplementary Figure S1.
2.2 Peptide array design
Peptide microarrays were designed based on predicted open-reading frames (ORFs) identified from the genome sequence of C. burnetii Nine-Mile strain RSA493 (accession no. NC_002971). Specifically, the RSA493 genome sequence was re-annotated on the Galaxy platform (http://usegalaxy.org) (58) using Prokka v1.14.5+galaxy0 (59), followed by manual curation to correct where possible for frame-shifts in genes through detailed comparative analyses with other close C. burnetii whole-genome sequences in public repositories. This also identified additional predicted ORFs unique to individual genomes. Following careful analyses of these predicted ORFs, a total of 2,092 protein sequences were identified to be included in the arrays. As internal controls, the arrays also included human herpes virus 5 with 170 proteins and the tetanus toxin protein from Clostridium tetani. These 2,263 protein sequences amounted to a total test set of 168,792 unique 15-amino-acid peptide sequences overlapping by four amino acids. The amino acid frequencies of the 2,263 protein sequences above generated 960 random 15-amino-acid peptide sequences with approximately the same amino acid frequencies to assess background control reactivity. Coxiella burnetii-derived, tetanus toxin protein, and control peptide sequences were synthesized in duplicate, totaling 328,984 peptide sequences to be synthesized on the peptide microarrays.
2.3 Peptide microarray manufacture and probing
Microarrays were synthesized with a Nimble Therapeutics Maskless Array Synthesizer (MAS) by light-directed solid-phase peptide synthesis using an amino-functionalized support (Greiner Bio-One) coupled with a 6-aminohexanoic acid linker and amino acid derivatives carrying a photosensitive 2-(2-nitrophenyl) propyloxycarbonyl (NPPOC) protection group (Orgentis Chemicals). Amino acids (final concentration, 20 mM) were pre-mixed for 10 min in N,N-dimethylformamide (Sigma Aldrich) with N,N,N′,N′-tetramethyl-O-(1H-benzotriazol-1-yl)uronium-hexafluorophosphate (Protein Technologies, Inc.; final concentration, 20 mM) as an activator, 6-chloro-1-hydroxybenzotriazole (Protein Technologies, Inc.; final concentration, 20 mM) to suppress racemization, and N,N-diisopropylethylamine (Sigma Aldrich; final concentration, 31 mM) as base. Activated amino acids were then coupled to the array surface for 3 min. Following each coupling step, the microarray was washed with N-methyl-2-pyrrolidone (VWR International), and the site-specific cleavage of the NPPOC protection group was accomplished by irradiation of an image created by a Digital Micro-Mirror Device (Texas Instruments), projecting 365-nm-wavelength light. Coupling cycles were repeated to synthesize the full in silico-generated peptide library.
Prior to sample binding, the final removal of sidechain-protecting groups was performed in 95% trifluoroacetic acid (Sigma Aldrich), 4.5% reagent-grade water (Ricca Chemical Co.), and 0.5% triisopropylsilane (TCI Chemicals) for 30 min. The arrays were incubated 2× in methanol for 30 s and rinsed 4× with reagent-grade water. The arrays were washed for 1 min in TBST (1× TBS, 0.05% Tween-20), washed 2× for 1 min in TBS, and exposed to a final wash for 30 s in reagent-grade water.
The samples were diluted (human/sheep, 1:100; goat, 1:250; and bovine, 1:50) in binding buffer (0.01 M Tris-Cl, pH 7.4, 1% alkali-soluble casein, 0.05% Tween-20) and bound to arrays overnight at 4°C. After sample binding, the arrays were washed 3× in wash buffer (1× TBS, 0.05% Tween-20) at 10 min per wash. Primary sample binding was detected via Alexa Fluor® 647 or cy5-conjugated anti-IgG secondary antibody (anti-human/goat/bovine IgG, Jackson ImmunoResearch; anti-sheep IgG, Sigma Aldrich). The secondary antibody was diluted (human, 1:10,000; goat/sheep, 1:20,000; bovine, 1:1,000) in secondary binding buffer (1× TBS, 1% alkali-soluble casein, 0.05% Tween-20). The arrays were incubated with secondary antibody for 3 h at room temperature, then washed 3× in wash buffer (10 min per wash), washed for 30 s in reagent-grade water, and then dried by spinning in a microcentrifuge equipped with an array holder. The fluorescent signal of the secondary antibody was detected by scanning with an Innopsys 910AL microarray scanner. The scanned array images were analyzed with proprietary Nimble Therapeutics software to extract the fluorescence intensity values for each peptide.
2.4 Prediction of protein localization and function
To identify transmembrane domains, full-length C. burnetii protein sequences were run through the TMHMM 2.0 algorithm (60). The output contained amino acid position intervals (domains) of predicted transmembrane helices (“TMhelix”), extracellular segments (“outer”), and intracellular segments (“inner”). The protein subcellular localizations of the full-length C. burnetii protein sequences were predicted using a standalone version of the bioinformatic tool PSORTb 3.0 (61) with organism type set to “-n” for gram-negative bacteria.
2.5 Determining antibody responses from peptide array data
Peptide antibody binding signals for each serum were loaded into the R statistical software (62) and normalized by subtracting the median signal of the 960 random peptides and then correcting the signal values less than 1 to 1. For each peptide synthesized in duplicate, the mean signal values were used. To evaluate the signal distribution of the random peptides, the empirical cumulative distribution function (ECDF) of their signals was estimated using equation [1]:
is the fraction of signal values less than or equal to a signal value . is the indicator function counting the number of signal values less than or equal to . The probability of each C. burnetii peptide having a signal in the distribution of the random peptides was estimated by transforming the ECDF as seen in Equation 2]:
where is the set of all the signal values measured for the random peptides and t is the measured signal of a C. burnetii bacterin vaccine strain peptide. The estimated probabilities (p-values) of the C. burnetii peptides equal to 0 were set to the smallest decimal value in R (2.225074e-308) (62).
The p-value of each individual peptide was adjusted by applying Fisher’s combined probability test on the p-value of the peptide and its neighboring peptides within the parent protein overlapping with a minimum of 11 amino acids. Overlapping peptides were determined by using the IRanges package (63). Since the position of the peptide within the parent protein affected the number of overlapping peptides, the degrees of freedom (two times n for Fisher’s combined probability test) also depended on the position of the peptide.
A critical value was estimated by taking the signal value of the peptide with an adjusted p-value closest to the significance level = 0.01. Peptides were grouped into response peaks within their parent proteins by using the findpeaks function in the pracma package (64) with the estimated critical value as the background threshold. Peptides outside of a response peak or within response peaks but with an adjusted p-value >0.01 were filtered from the final set of significant antibody responses.
To identify domain-level antibody responses, the amino acid positions of the protein domains predicted with TMHMM 2.0 (60) were compared to the amino acid positions of the antibody response peaks using the findOverlaps function in the IRanges package (63). An antibody response peak was determined to be overlapping a predicted domain if the top of the peak overlapped the domain with a minimum of six amino acids. The number of response peaks overlapping each domain were counted for each individual serum sample and used to calculate three different values for each species and treatment group: firstly, the response frequency of each domain was calculated as the proportion of individuals in a species and treatment group with at least one overlapping response peak; secondly, the median number of responses in each domain was calculated as the median of non-zero sums of response peaks from each individual in a species and treatment group overlapping the domain; finally, the coverage of each domain was calculated as the product of its response frequency and median number of responses in each species and treatment group.
The agreement in seroreactive protein domains between individual serum samples was calculated as the Jaccard similarity between all sample pairs with the following equation 3]:
where is the Jaccard similarity between serum samples A and B, is the number of identical seroreactive domains between A and B, and is the number of unique seroreactive domains determined in both serum samples.
The pairwise Jaccard similarities were calculated between all serum samples and grouped into categories depending on the treatment and species of the pairs compared. The 48 paired sheep serum samples taken from the same 18 individuals were analyzed separately from the other serum samples. Multiple-comparison groupings resulted in different numbers of comparisons. A generalized linear model with a gaussian error distribution [R statistical software (62)] was used to model the Jaccard similarity dependency on one more of the comparison groupings (i.e., the additive effects and the interactions of the comparison groupings). The results, degrees of freedom, and number of comparisons in each group are summarized in Supplementary Table S1.
2.6 Vaccine candidate identification
All TMHMM2.0-predicted domains with a response in any species or treatment grouping had their coverage values grouped by species and positive treatment (UV + C, POS, PV1, PV1 + C, PV2, PV2 + C, and UV + C; see Table 1). Within each species and positive treatment group, the coverage values for the matching species negative group were subtracted for each domain (termed the domain coverage difference). Three methods were used to identify candidate vaccine antigens, namely:
Method 1: For each species and positive treatment group, the percentiles of the domain coverage differences were calculated at 1% steps. The percentiles were plotted in a line plot in Supplementary Figure S2, and a cutoff value at the 75% percentile was chosen from visual inspection of where all coverage differences rose above 0. Domains passing the threshold were compared among all species and positive treatment groups, and any domains found in all the groups were determined to be vaccine candidates.
Method 2: Coverage differences across all species and treatment groups were summed for each individual domain. The percentiles of the summed coverage values were estimated at 1% steps (Supplementary Figure S3). A cutoff at the 95% percentile was chosen to maximize the number of targets while ensuring a significant coverage difference. Domains with summed coverage differences above the threshold were determined to be vaccine candidates.
Method 3: Coverage values of TMHMM2.0-predicted domains with responses in the paired vaccinated sheep serum samples (PV1, PV1 + C, PV2, and PV2 + C; n = 36) were compared from negative treatment (NEG), through post-vaccine (PV1/2) to post-challenge (PV1/2 + C). Domains with coverage values consecutively increasing over time across the three treatments, for either of the vaccines (PV1 and PV2), were determined to be vaccine candidates.
2.7 Pan-species diagnostic antigen identification
To identify potential antigens targeted by the antibody response in C. burnetii-challenged individuals, which could be useful for pan-species serodiagnostic tests, only groups which had not received any C. burnetii vaccine were considered. The domain coverage differences for protein domains identified as vaccine candidates (Section 2.6) for C. burnetii-exposed groups (bovine POS, human POS, goat UV+C, and sheep UV+C) were summed, and heat-maps for the 50 domains with the highest sum coverage differences were plotted using pheatmap (65). To evaluate the reactivities of these domains in vaccinated individuals, heat-maps for the same 50 domains were also generated for groups which had received either a PV1 or PV2 vaccine.
2.8 Functional classification of candidate vaccine and diagnostic antigens
Functional protein classification analysis was performed using PANTHER (66). Duplicates of genes with more than one peptide hit were removed from the vaccine candidate and diagnostic antigen lists, leaving 467 and 50 unique gene identifiers, respectively. The gene lists were uploaded to PANTHER for functional classification selecting C. burnetii as the reference organism. Panther protein class (UV + C) was selected as the output ontology for all analyses.
3 Results
3.1 Exposure to C. burnetii through vaccination and/or infection results in an increased number of C. burnetii-derived seroreactive peptides
Each peptide’s serum antibody binding degree was estimated by combining its background probability with the background probabilities of its closest overlapping neighbors, as described above. Figure 1 summarizes the numbers of peptides with antibody binding in each serum sample across species and treatment groups. All species and treatment groups showed high variance in the numbers of antibody binding peptides. Exposure to C. burnetii was defined as exposure to C. burnetii antigens through vaccination and/or infection. Apart from the C. burnetii challenged goats (UV + C), all species demonstrated an increased mean number of peptides with antibody binding after exposure to C. burnetii through vaccination (PV1/2), natural infection (POS), or experimental challenge (UV + C) compared to their respective negative control groups (NEG). It is noteworthy that the sheep challenged with C. burnetii following vaccination (PV1/2 + C) had higher mean numbers of peptides with antibody binding compared to only vaccination (PV1/2), indicating a possible priming and booster effect in the antibody binding repertoire.
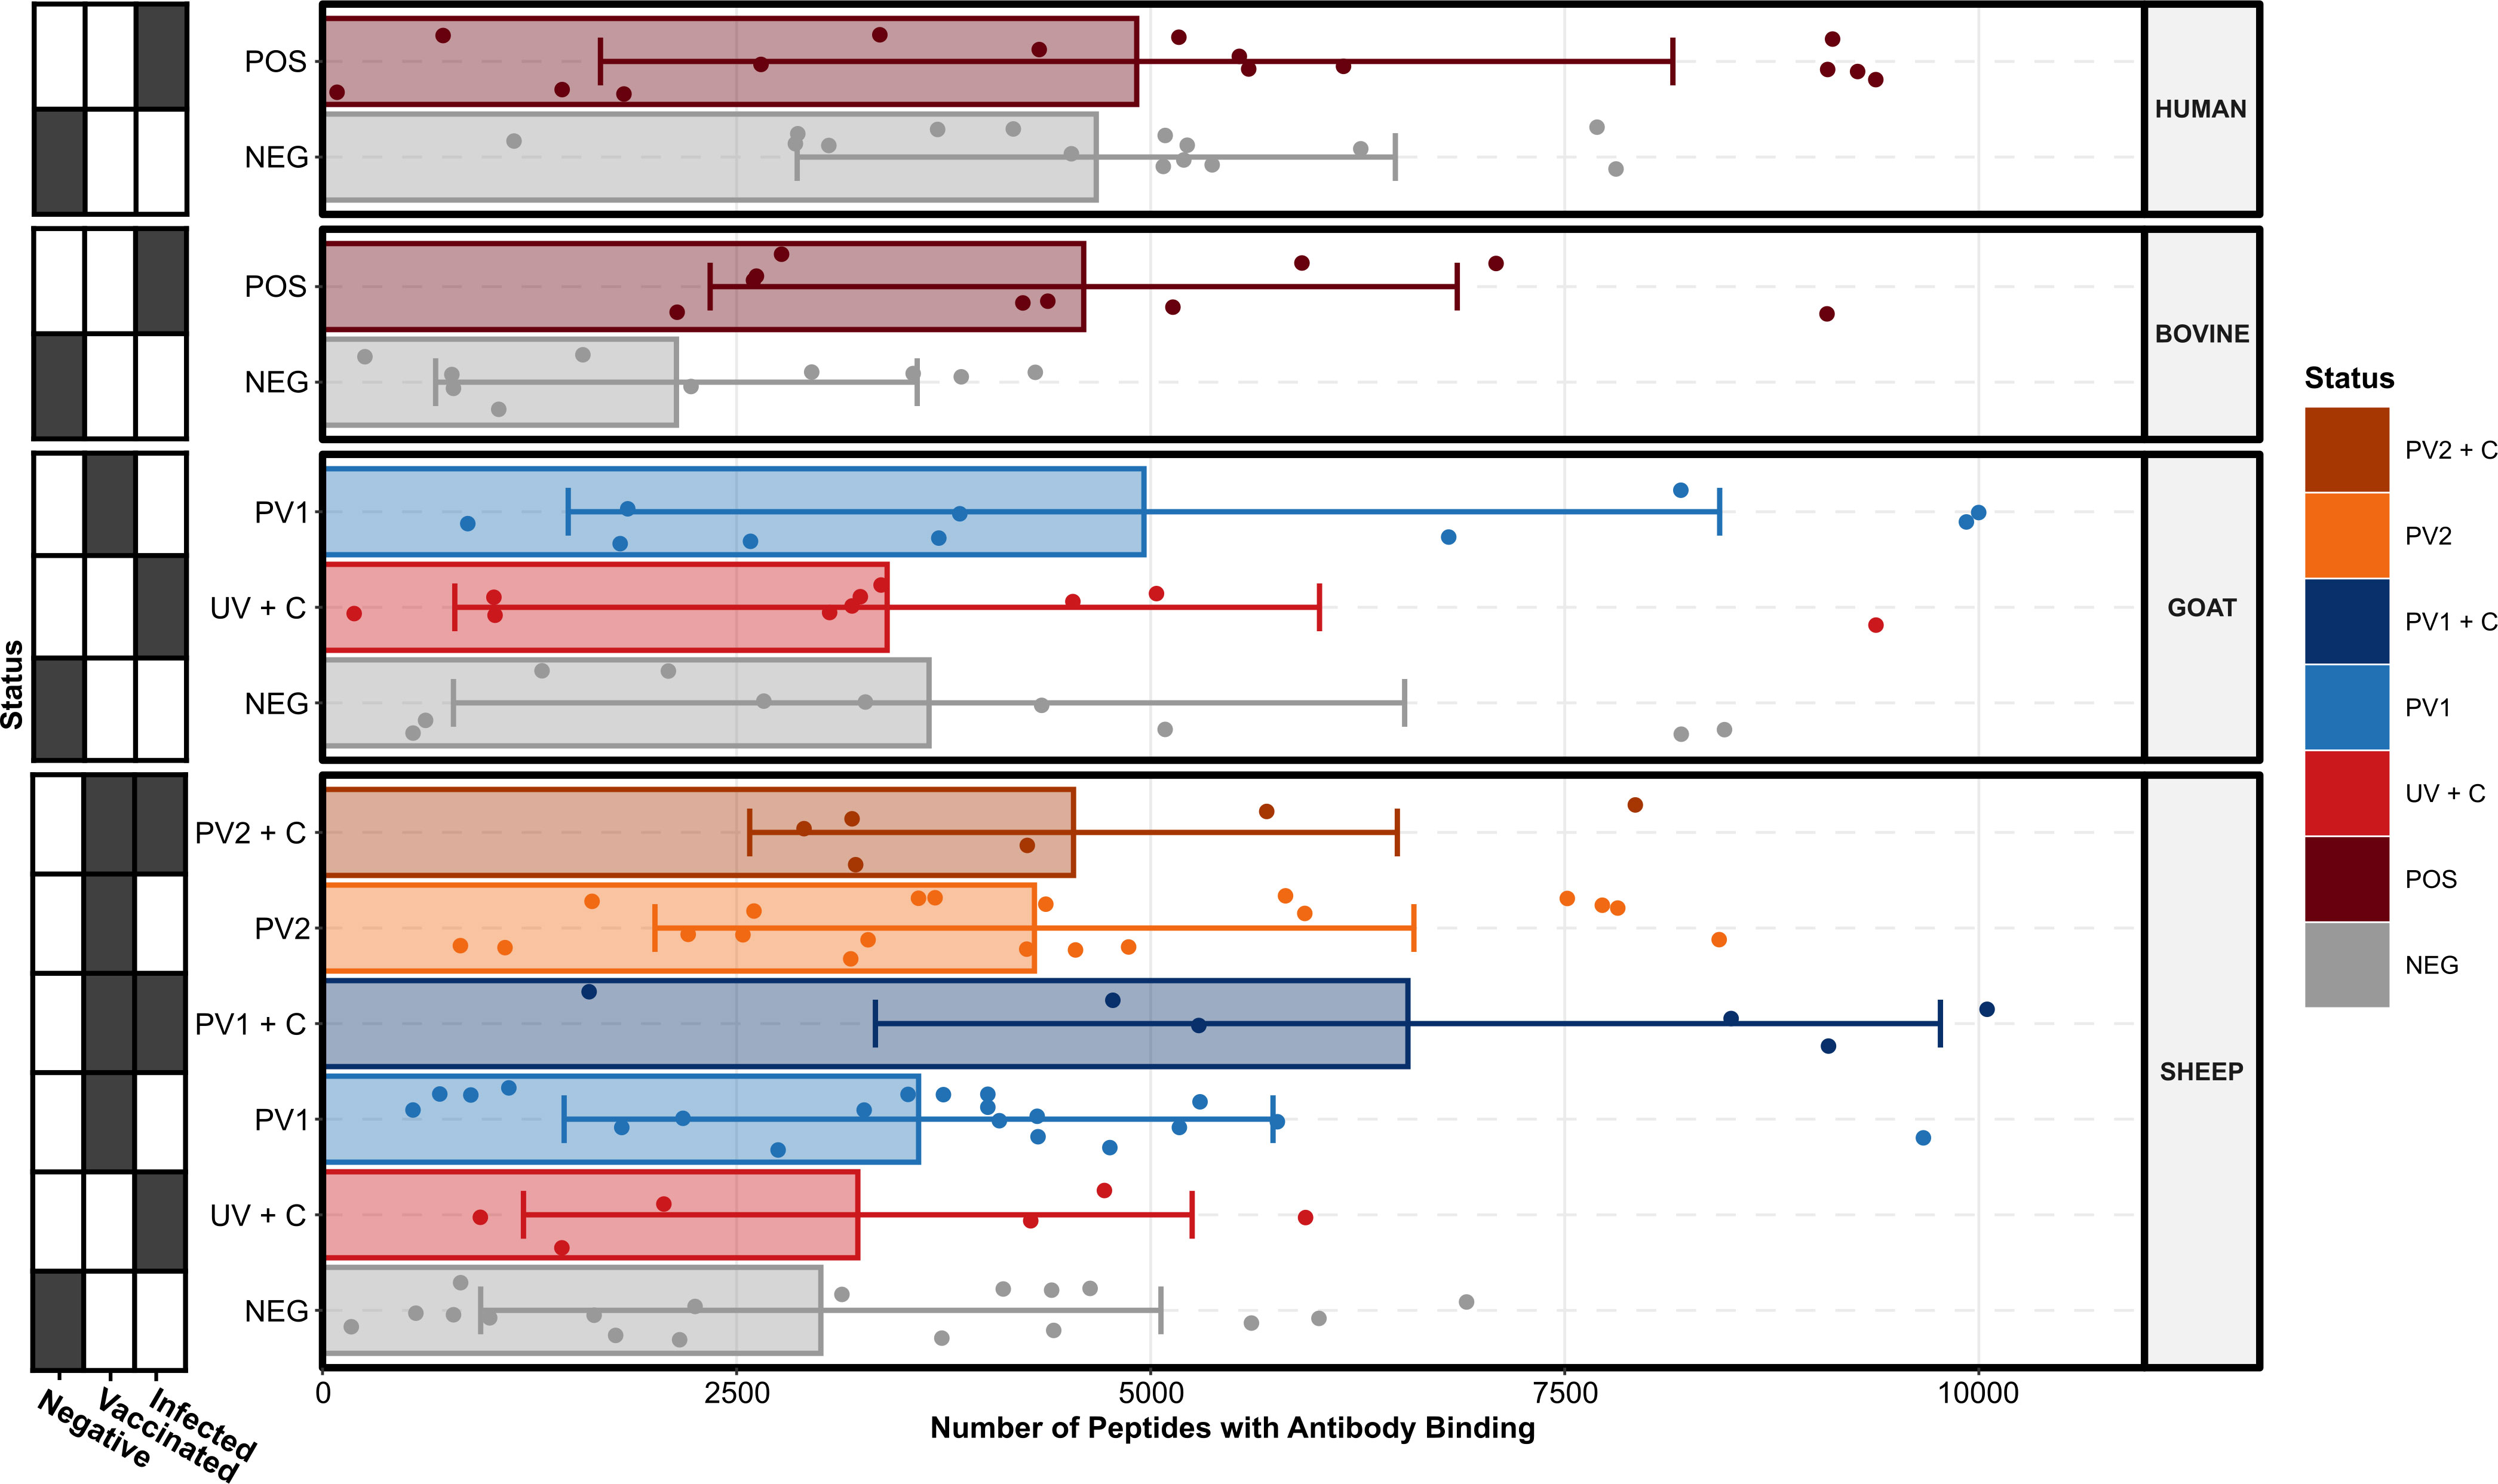
Figure 1 Number of C. burnetii peptides bound by serum antibodies stratified by species and treatment groups (N = 13, n = 156). Each point represents the peptide count in an individual serum sample, the bar heights signify the species and treatment group means, and the error bars encompass the standard deviations of each species and treatment group. The grid along the y-axis designates the exposure status of each treatment group as negative (C. burnetii unexposed), vaccinated (C. burnetii phase I/II), and/or infected (C. burnetii naturally infected or challenged). NEG, C. burnetii negative; POS, C. burnetii positive; PV1, post-C. burnetii phase I vaccination; PV2, post-C. burnetii phase II vaccination; UV, unvaccinated, +C, C. burnetii challenge.
3.2 Overall agreement in seroreactive protein domains depends on species and individual
The initial goal was to examine the agreement in seroreactivity against C. burnetii peptides between individuals, within and between species and treatment groups, to identify selective C. burnetii serodiagnostic markers and protein subunit vaccine candidates. However, due to the interindividual variability in the number of antibody-reactive peptides (Figure 1), it proved difficult to identify peptides suitable for serodiagnostic markers or vaccine candidates. Subsequently, focus shifted to investigating seroreactivity agreement by utilizing C. burnetii protein domains predicted by TMHMM 2.0 and mapping the seroreactive peptides onto these domains as illustrated in Figure 2. The examination of Jaccard similarity between the sets of protein domains with antibody reactivity from all individual sera (Figure 3A) showed that the agreement between most serum samples was in the range of 20%–50%, regardless of species or treatment. However, some samples, such as the sheep negative (NEG), post-phase 1 vaccine (PV1), and C. burnetii-challenged goats (UV + C), showed low agreement with all other serum samples, whereas some samples in the sheep treatment groups showed high agreement (up to 80% Jaccard similarity). Complete clustering was performed on all serum samples (excluding the paired sheep samples) using the Jaccard distances (1 – Jaccard Similarity) between the individual sera to construct a dendrogram (Figure 3B), which indicated that sera mostly clustered within the same species regardless of C. burnetii exposure. However, some serum samples did occur in clusters with mixed species, so we examined the overall clustering between the species and treatment groups (Figure 3C), which confirmed the tendency for within-species clustering.
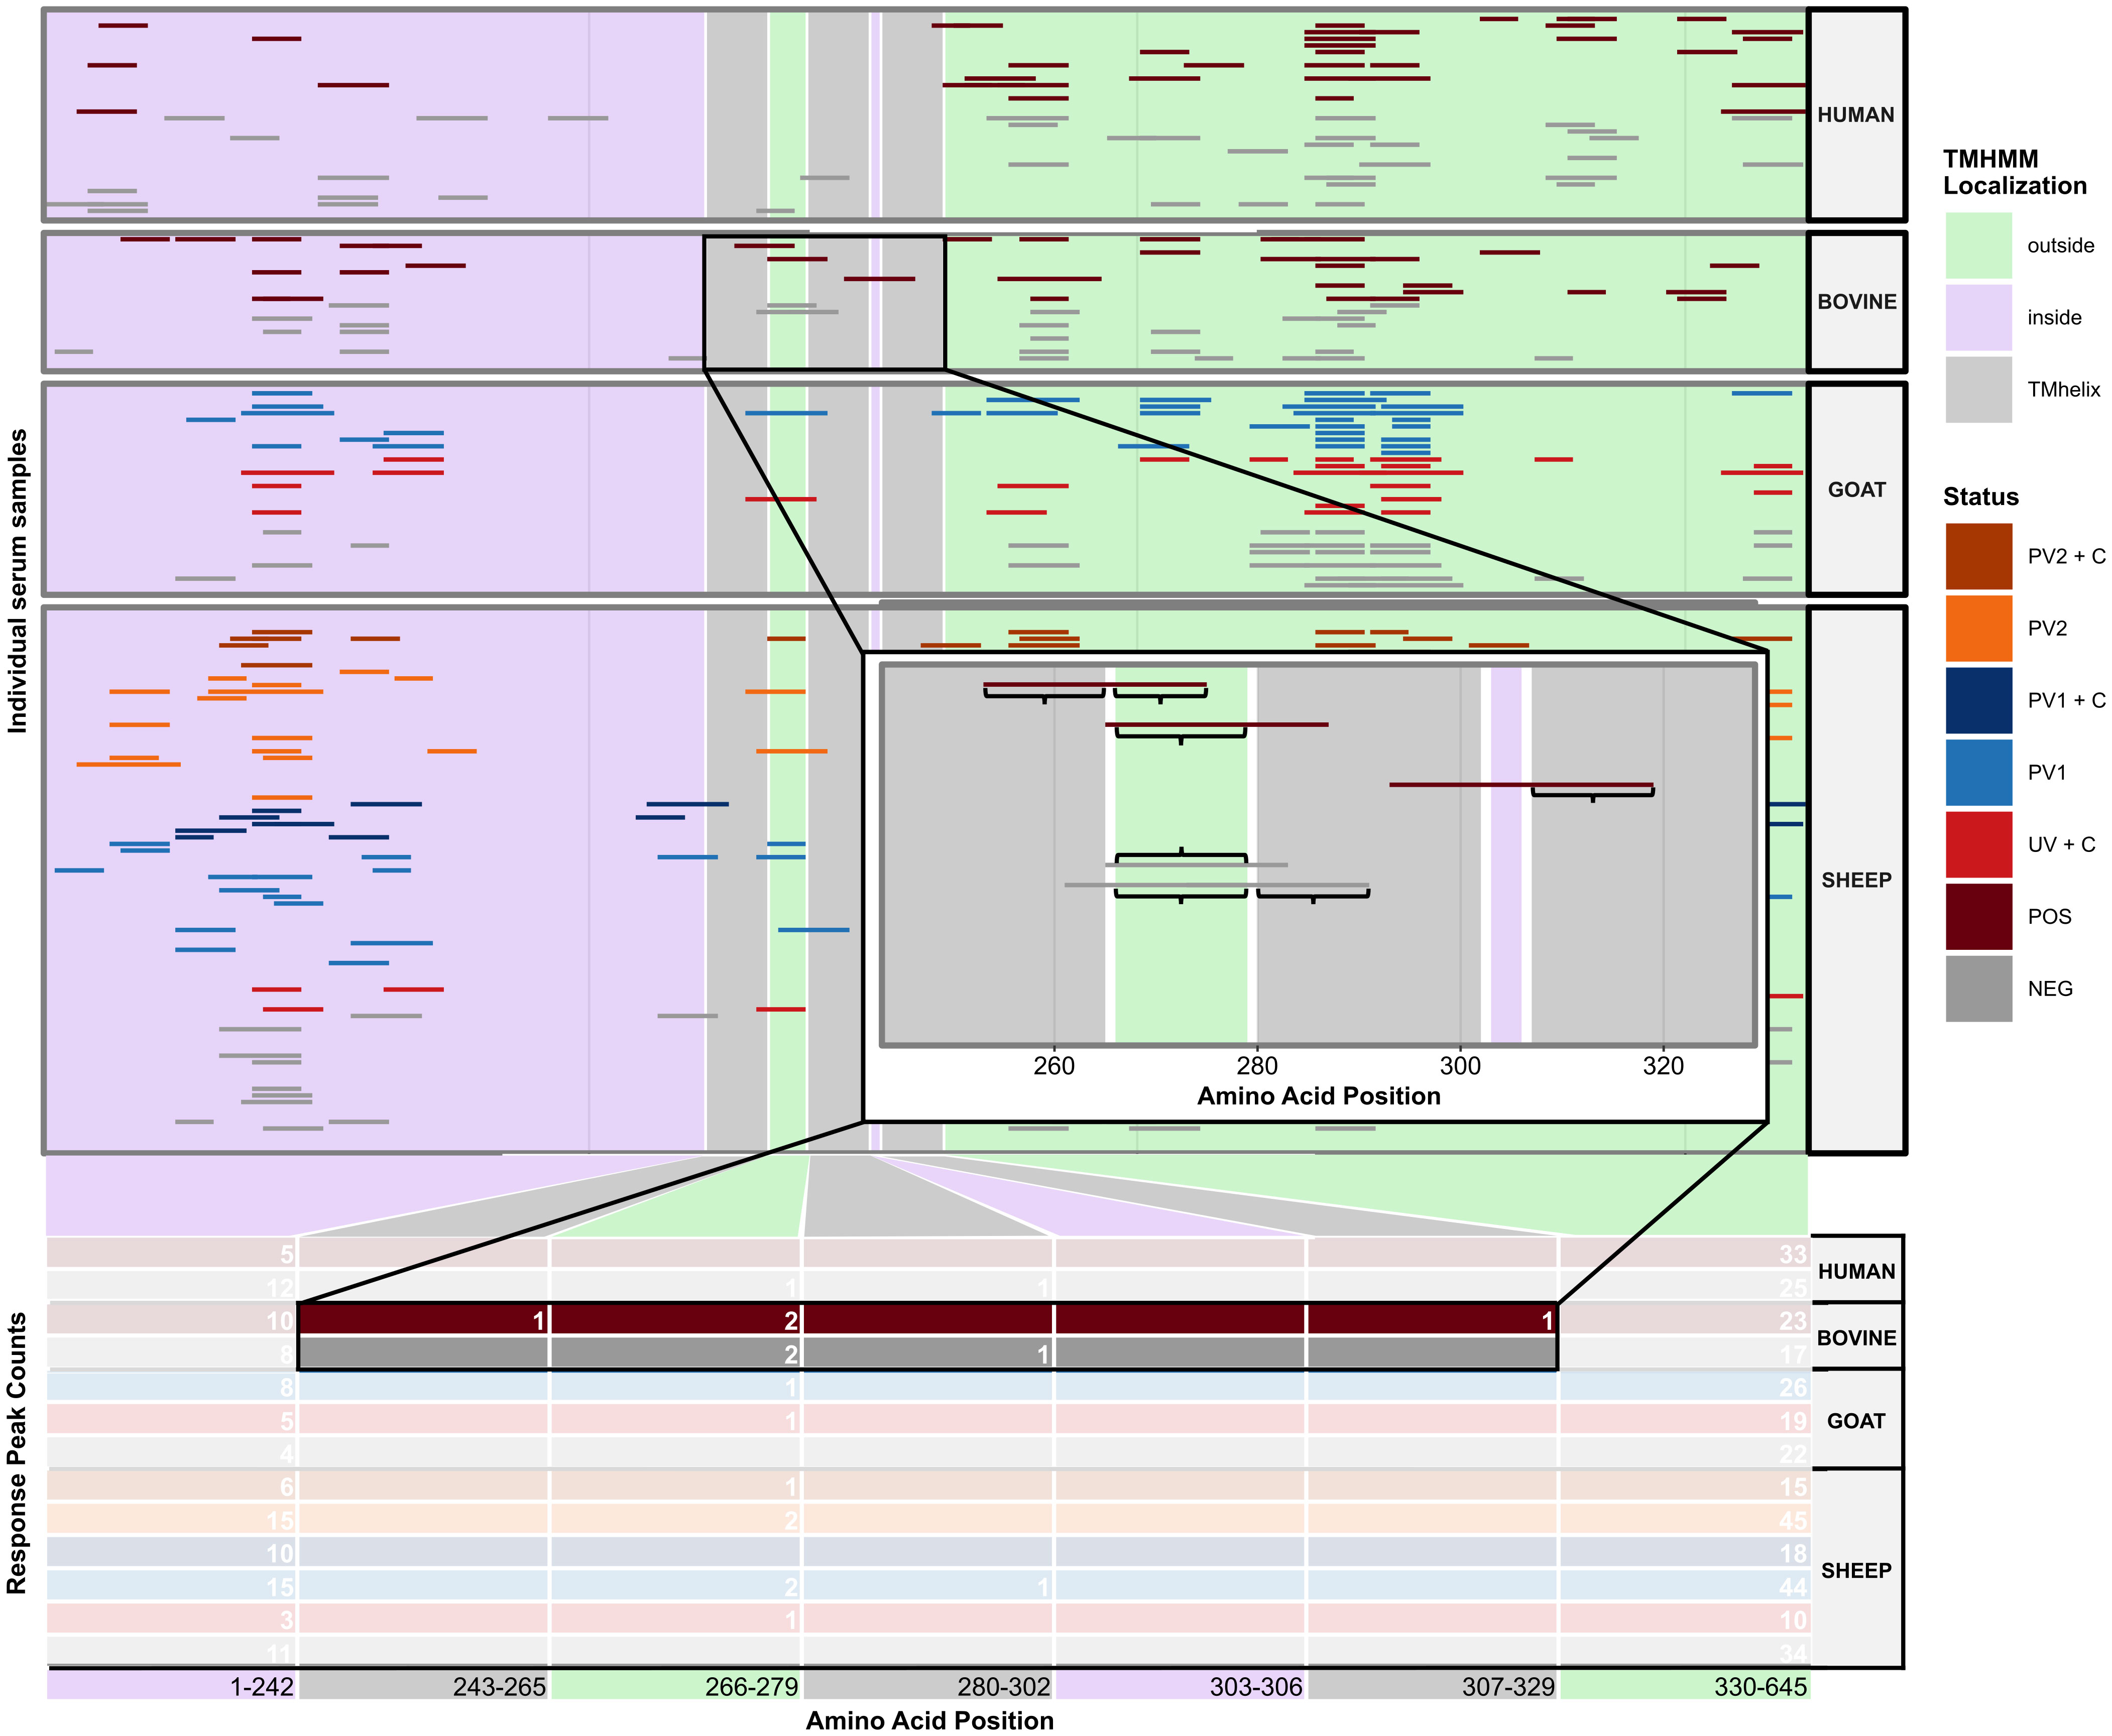
Figure 2 Illustration of the method used to identify domain-level antibody responses in the protein domains predicted with TMHMM2.0. The illustration uses the C. burnetii open reading frame CBU_1530 as an example. On the x-axis, the amino acid positions within the protein are represented. The y-axis delineates either the individual serum samples (upper panel) or the cumulative response peak counts observed within each predicted protein domain across various species and treatment groups (lower table). The green, purple, and gray rectangles denote the predicted localizations alongside their start and end amino acid positions. The colored horizontal bars mark the start and end of antibody response peaks in individual samples. The zoomed-in plot provides a closer look at the bovine response peaks detected between CBU_1530 amino acid positions 243–329. The zoomed-in plot shows segments of response peaks encompassed by curly brackets, which indicate an overlap of six or more amino acid positions. Notably, a single response peak may overlap with multiple protein domains. NEG, C. burnetii negative; POS, C. burnetii positive; PV1, post-C. burnetii phase I vaccination; PV2, post-C. burnetii phase II vaccination; UV, unvaccinated; +C, C. burnetii challenge.
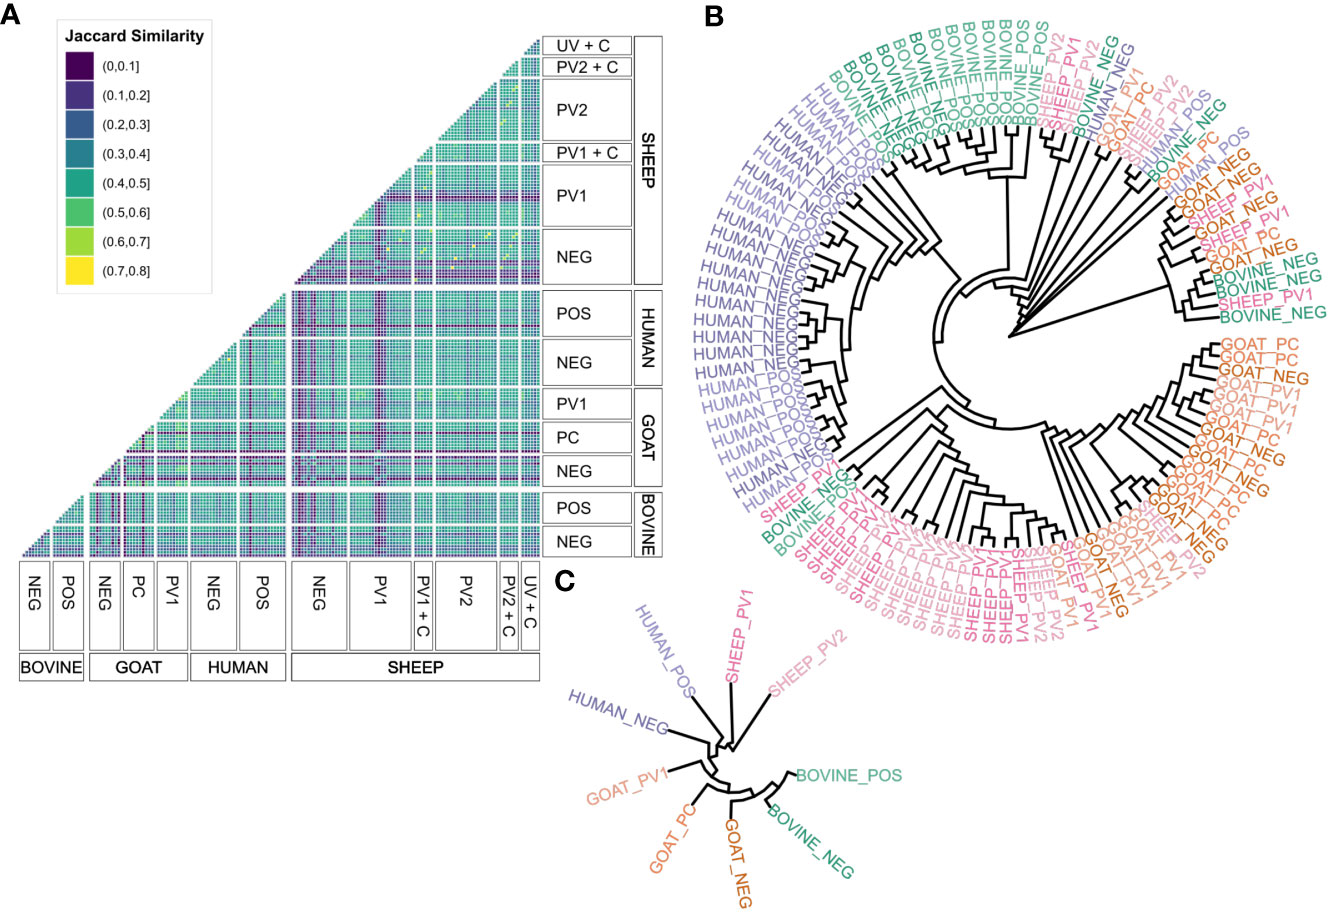
Figure 3 Agreement between antibody responses against TMHMM2.0-predicted domains in the C. burnetii proteins. (A) Faceted correlogram of left-open and right-closed intervals of the pairwise Jaccard similarities between the sets of domains with antibody responses in all serum samples (n = 156). (B) Circular dendrogram (tree) with complete-linkage clustering of the Jaccard distances (1 – Jaccard similarity) between the sets of domains with antibody responses in the unpaired serum samples (n = 108). The lengths of the branches are not proportional to the Jaccard distances between serum samples. (C) Circular dendrogram (tree) with complete-linkage clustering of the average Jaccard distances (1 – Jaccard similarity) between serum samples in the species and treatment groups with unpaired serum samples (n = 108, N = 9). The lengths of the branches are not proportional to the Jaccard distances between serum samples. NEG, C. burnetii negative; POS, C. burnetii positive; PV1, post-C. burnetii phase I vaccination; PV2, post-C. burnetii phase II vaccination; UV, unvaccinated; +C, C. burnetii challenge.
Clustering patterns in the unpaired serum samples (Figure 3) were quantified using a generalized linear model. This model compared the mean Jaccard similarities across various species and treatment categories (Supplementary Table S1) to evaluate their level of agreement. The model showed that all sera, on average, shared approximately 30% of their antibody-reactive protein domains, indicating a potential pan-species population of seroreactive protein domains, independent of the type of C. burnetii exposure. Across all species, the C. burnetii-exposed groups, through either vaccination or infection, had a significantly higher Jaccard similarity than the 30% intercept, whereas sera from the negative control groups had a significantly lower Jaccard similarity. As shown in Figure 3, sera from the same species had a significantly higher Jaccard similarity (Supplementary Table S1). However, within the same species, the agreement pattern reversed: Here the C. burnetii-exposed sera did not exhibit a significantly increased Jaccard similarity, whereas negative control sera did (Supplementary Table S1). Of note is that all the significant estimates were below 4%, indicating that any impact on the overall agreement was low (Supplementary Table S1), confirming the species-dependent agreement in seroreactivity observed in Figure 3. However, we did find a tendency for C. burnetii-exposed sera to agree on seroreactive antigens across species.
A similar generalized linear model for Jaccard similarities was used to analyze the paired sheep serum samples (Supplementary Table S1). Akin to the pan-species model, the intercept indicated a background of 30% Jaccard similarity, regardless of treatment or individual. Interestingly, sera from the same individuals showed the highest agreement, with 20% higher Jaccard similarity relative to the intercept. Sera from the same positive treatment groups had no increase in Jaccard similarity, but the C. burnetii-vaccinated and/or challenged sheep sera (PV1, PV2, PV1 + C, PV 2 + C, and UV + C) had the second highest agreement with a 10% significant increase in Jaccard similarity relative to the intercept. Conversely, the serum samples from the sheep negative control group had significantly lower Jaccard similarity than the intercept. Finally, sera from the same individuals post-C. burnetii vaccination and/or challenge had no increase in their Jaccard similarity. Thus, sera from the same individuals had the most antibody-reactive protein domains in common independent of the type of C. burnetii exposure, followed by sera from sheep with C. burnetii exposure through either vaccination and/or challenge.
Seroreactive protein domains in the unpaired sera agreed most within species, and for the sheep paired sera, seroreactive domains agreed most between sera sampled from the same individual. Modeling the agreement between individuals using their Jaccard similarities indicated a shared pan-species background population of seroreactive protein domains, independent of C. burnetii exposure status. However, agreement in seroreactivity between the positive treatment groups had a small but significant increase from this background population (Supplementary Table S1), indicating that some seroreactive protein domains were selective for individuals exposed to C. burnetii through either vaccination and/or infection.
3.3 Higher concordance in seroreactivity against selected protein domains in C. burnetii-exposed groups
To investigate the potential for seroreactive protein domains selective for C. burnetii vaccination and/or infection, domain seroresponse sensitivity (frequency of individuals with seroreactivity) was compared in the separate species and treatment groups (Supplementary Data 1). When comparing the seroreactive protein domain sensitivity distributions between species and treatment groups (Figure 4A), all groupings had at least one protein domain with an absolute sensitivity of 100%, regardless of C. burnetii exposure status. Apart from the sera from C. burnetii-exposed humans (HUMAN POS), a trend of higher median sensitivities in C. burnetii-exposed animals when compared to the species negative control groups was observed, indicating higher concordances in C. burnetii domain-directed seroreactivity in the sera from C. burnetii-exposed cattle (BOVINE), goats, and sheep (Figure 4A). However, upon examination (Figure 4B), this trend did not translate into the distributions of the numbers of antibody responses against these C. burnetii protein domains. Here the distributions of the median number of responses across the sera in each species and treatment group were found to be similarly distributed, sharing one median number of responses (Figure 4B). This indicated that most protein domains only had a single antibody-responsive region per individual with seroreactivity. Except for the unvaccinated sheep post-challenge sera (SHEEP UV + C), C. burnetii-exposed treatment groups exhibited higher maxima in the median number of responses compared to the species negative groups. (Figure 4B). Thus, sera from the C. burnetii-exposed positive treatment groups showed potential for more antibody epitopes against selected C. burnetii protein domains.
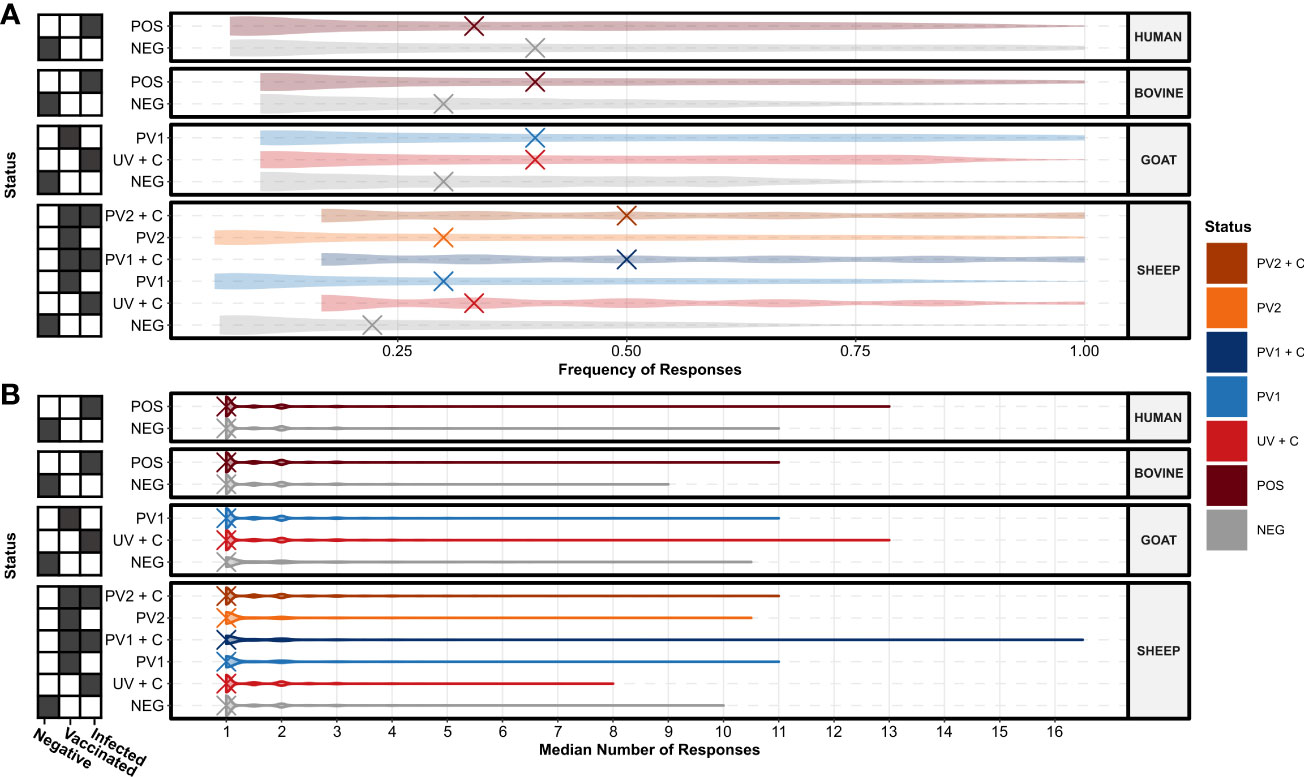
Figure 4 Species and treatment group antibody response levels against the TMHMM2.0-predicted domains in the C. burnetii proteins. (A) Violin plots showing the distributions of the species and treatment groups’ (N = 13, n = 156) response frequencies (fractions of individuals in a group with responses) against the predicted protein domains. The X’s denote the overall median response frequency in each species and treatment group. (B) Violin plots showing the distributions of the species and treatment groups’ (N = 13, n = 156) median number of responses against the predicted protein domains. The X’s denote the overall median of the median number of responses in each species and treatment group. The grids along the y-axes designate the exposure status of each treatment group as negative (C. burnetii unexposed), vaccinated (C. burnetii phase I/II), and/or infected (C. burnetii naturally infected or challenged). NEG, C. burnetii negative; POS, C. burnetii positive; PV1, post-C. burnetii phase I vaccination; PV2, post-C. burnetii phase II vaccination; UV, unvaccinated; +C, C. burnetii challenge.
To understand the sensitivity and specificity of the species’ seroreactivity against individual protein domains, the frequency of antibody responders against each domain was compared between the C. burnetii-exposed positive treatment groups representing domain sensitivity and negative groups representing domain false positive rate (1—specificity) for each species and exposure type (Figure 5). When examining the distributions around the blue identity lines in the sub-plots, cattle, goats, and sheep from the C. burnetii-exposed treatment groups had higher numbers of seroreactive domains above the identity line, indicating an overall higher specificity in these groups (Figure 5). The domains were more evenly distributed around the identity line for the human samples, indicating less specificity overall (Figure 5). Importantly, in all species, the C. burnetii-exposed groups had seroreactive protein domains with 100% specificity for C. burnetii exposure (Figure 5). Notably, the goat PhI WCV Coxevac® vaccination (PV1) and challenged (UV + C) treatment groups displayed selective (100% specificity) and highly sensitive seroreactivity against the same protein: CBU_0676, which was predicted as extracellular by TMHMM 2.0 (Supplementary Data 1). The sensitivity of this protein was 100% and 90% for the PV1 and UV + C groups, respectively (Figure 5; Supplementary Data 1). Similarly, the C. burnetii-exposed cattle demonstrated selective seroreactivity towards CBU_0751, another protein predicted to be extracellular by TMHMM 2.0, with a sensitivity of 80% (Supplementary Data 1). However, for the C. burnetii-exposed humans and sheep, the highest sensitivities of domains with selective seroreactivity were substantially reduced by 33% and 67%, respectively (four out of six sheep PV1 + C, Supplementary Data 1). Indeed the majority of the selectively seroreactive protein domains had low sensitivity, as seen in Figure 5. Additionally, the most sensitive protein domains were often species-specific (Supplementary Data 1), suggesting that different species may have distinct strategies for their humoral response against C. burnetii. Within species and treatment groups, we found selective seroreactivity against 703 predicted protein domains from 308 distinct C. burnetii proteins across the C. burnetii-exposed treatment groups (Supplementary Data 1).
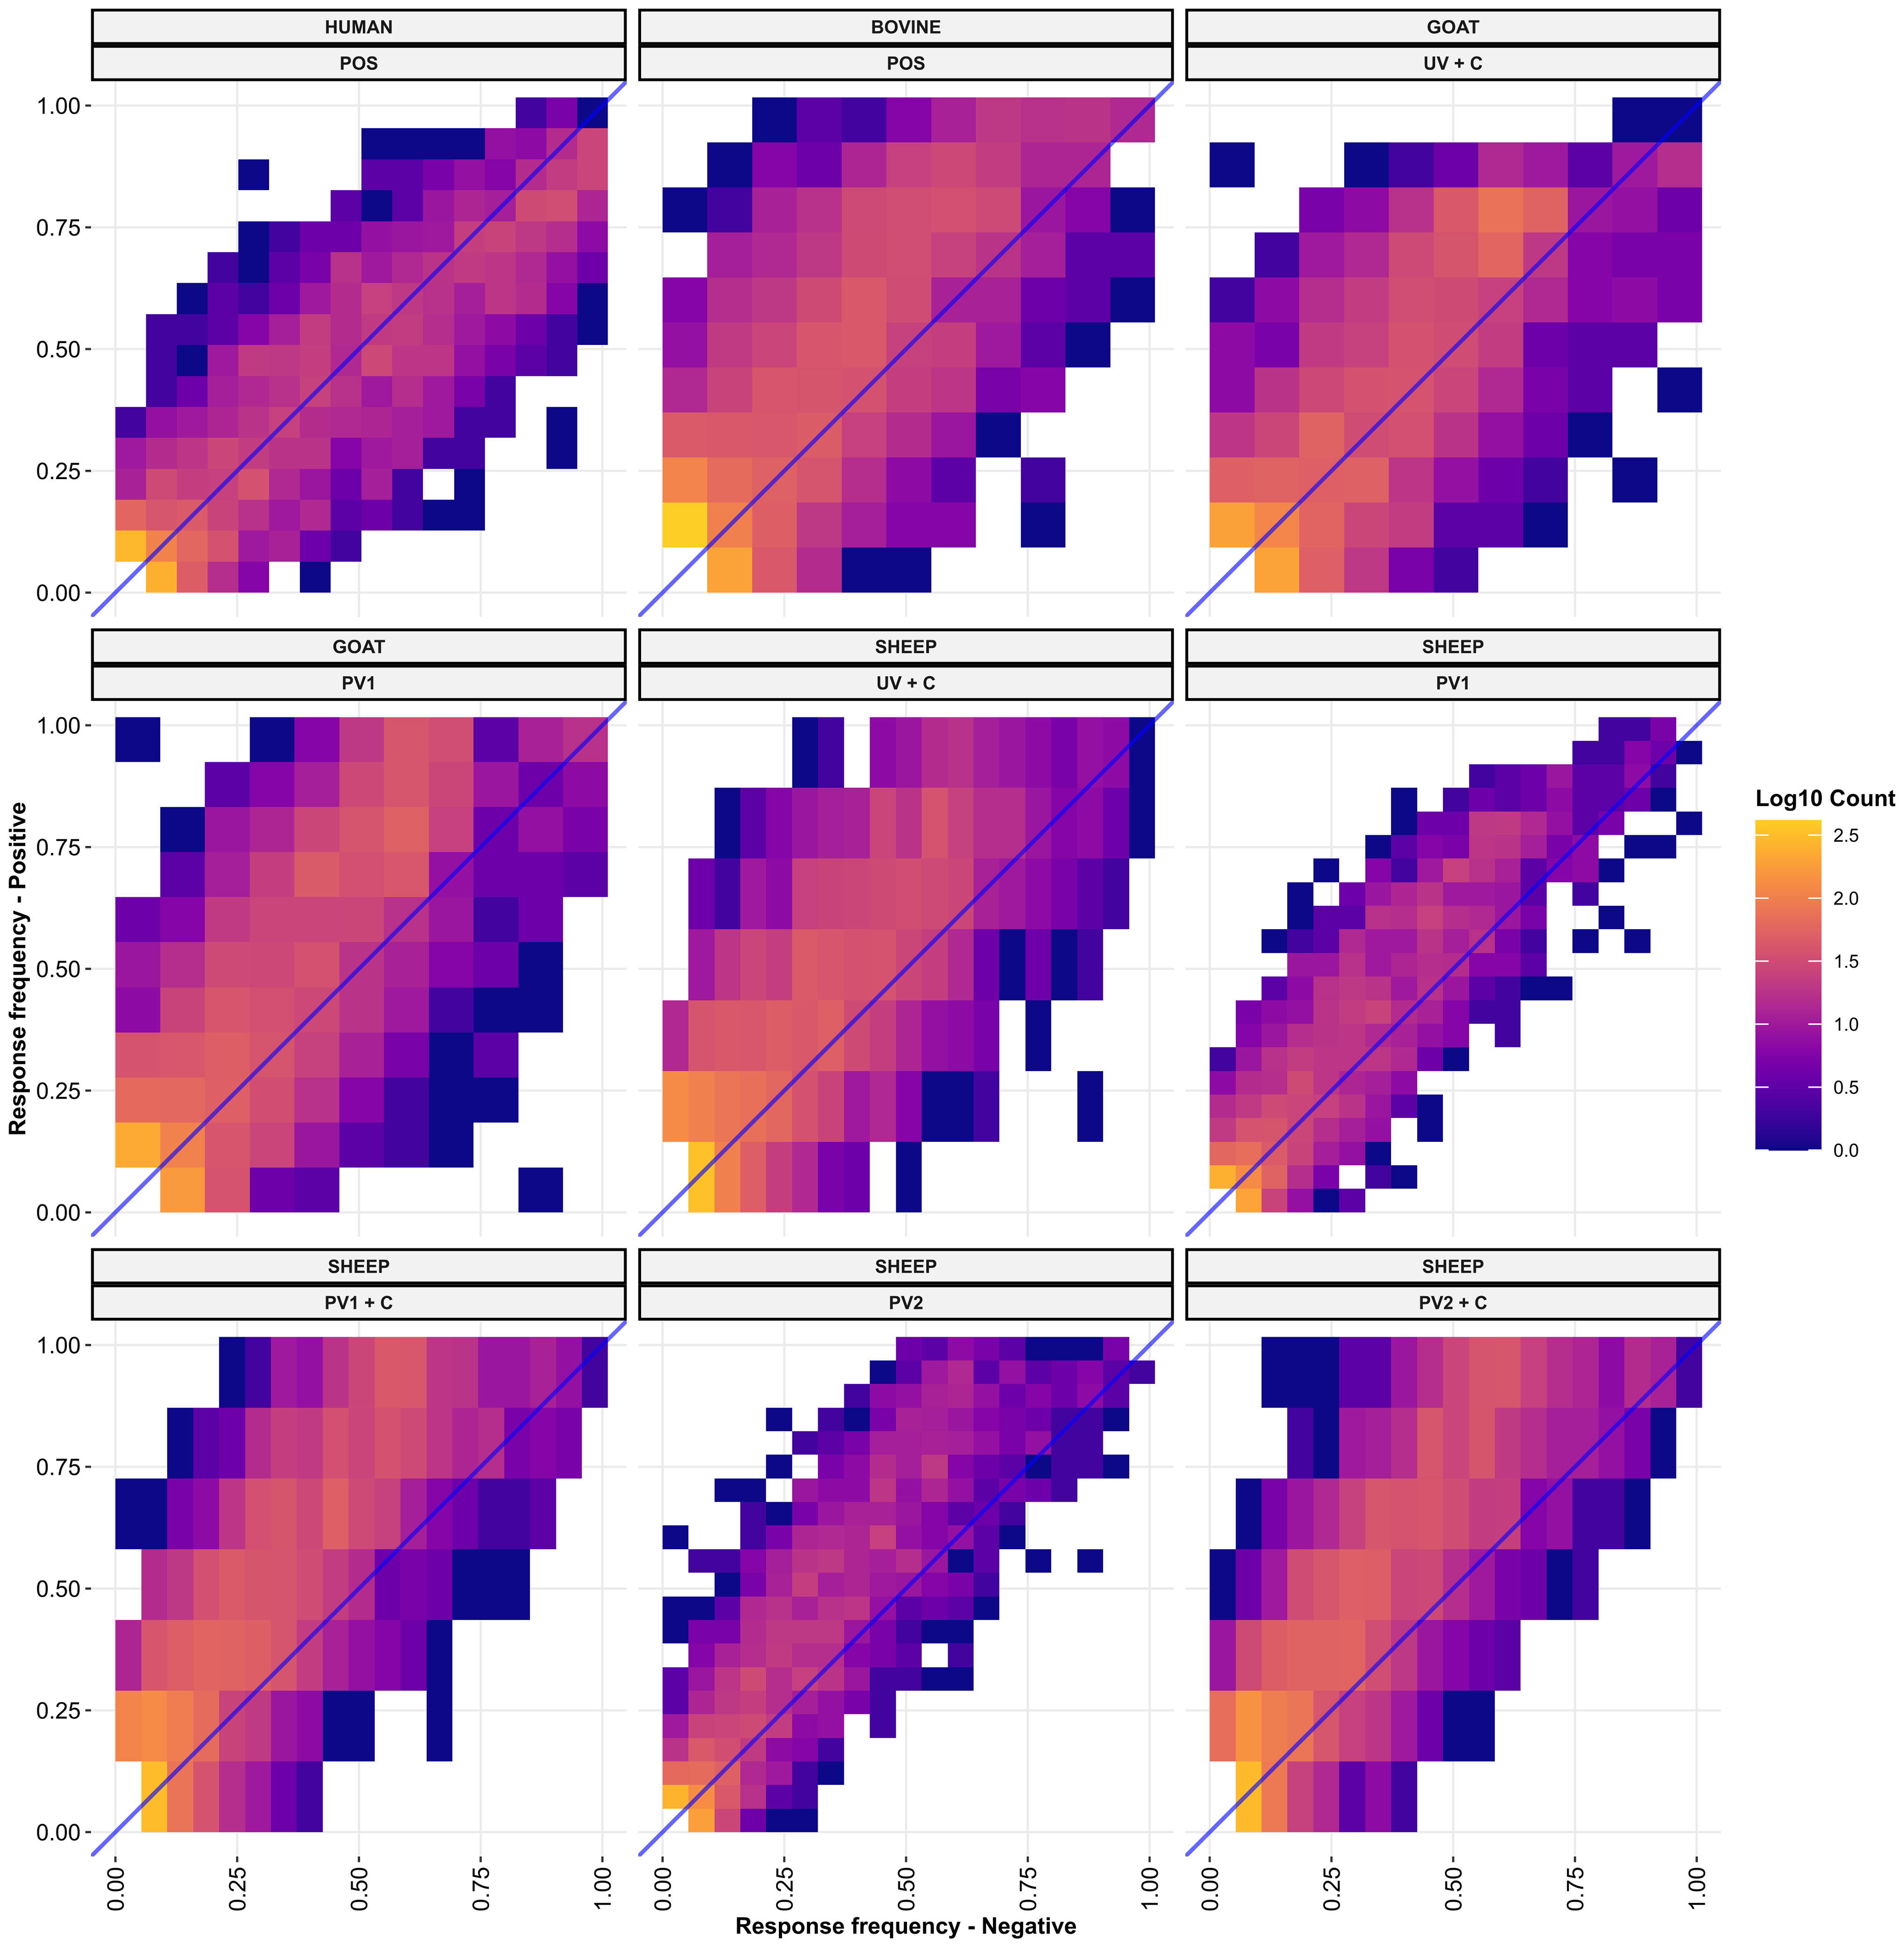
Figure 5 Response frequencies against each TMHMM2.0-predicted domain in the C. burnetii proteins compared between the positive (UV + C, POS, PV1, PV1 + C, PV2, PV2 + C, and UV + C; N = 9) group(s) and negative group (NEG; N = 4) of each species. Each panel shows a positive group (y-axis) of the indicated species versus the negative group of the indicated species (x-axis). The fill color of the points indicates the log base 10 to the number of predicted domains found at each point. The blue line is the diagonal identity line with a slope of 1 and an intercept at 0. NEG, C. burnetii negative; POS, C. burnetii positive; PV1, post-C. burnetii phase I vaccination; PV2, post-C. burnetii phase II vaccination; UV, unvaccinated; +C, C. burnetii challenge.
3.4 Seroreactivity predominates in protein domains predicted as extracellular
By using the TMHMM 2.0 algorithm, we identified the amino acid positions and cellular localizations of protein domains in C. burnetii proteins. The proportions of the three different predicted localizations across the entire proteome were ~34% transmembrane helices (TMHMM 2.0: “TMhelix”), ~42% extracellular segments (TMHMM 2.0: “outside”), and ~24% intracellular segments (TMHMM 2.0: “inside”). Calculations of the proportions of the predicted localizations for protein domains with serum antibody reactivity in the species and treatment groups revealed that seroreactive domains were enriched with extracellular protein domains, appearing almost twice as often as the background proportion in the entire proteome (Figure 6A). In contrast, the domains with serum antibody reactivity were depleted of intracellular or transmembrane domains compared to the entire proteome (Figure 6A). This suggests that the humoral responses from all species, regardless of treatment, preferred potentially extracellular protein domains in the C. burnetii proteome.
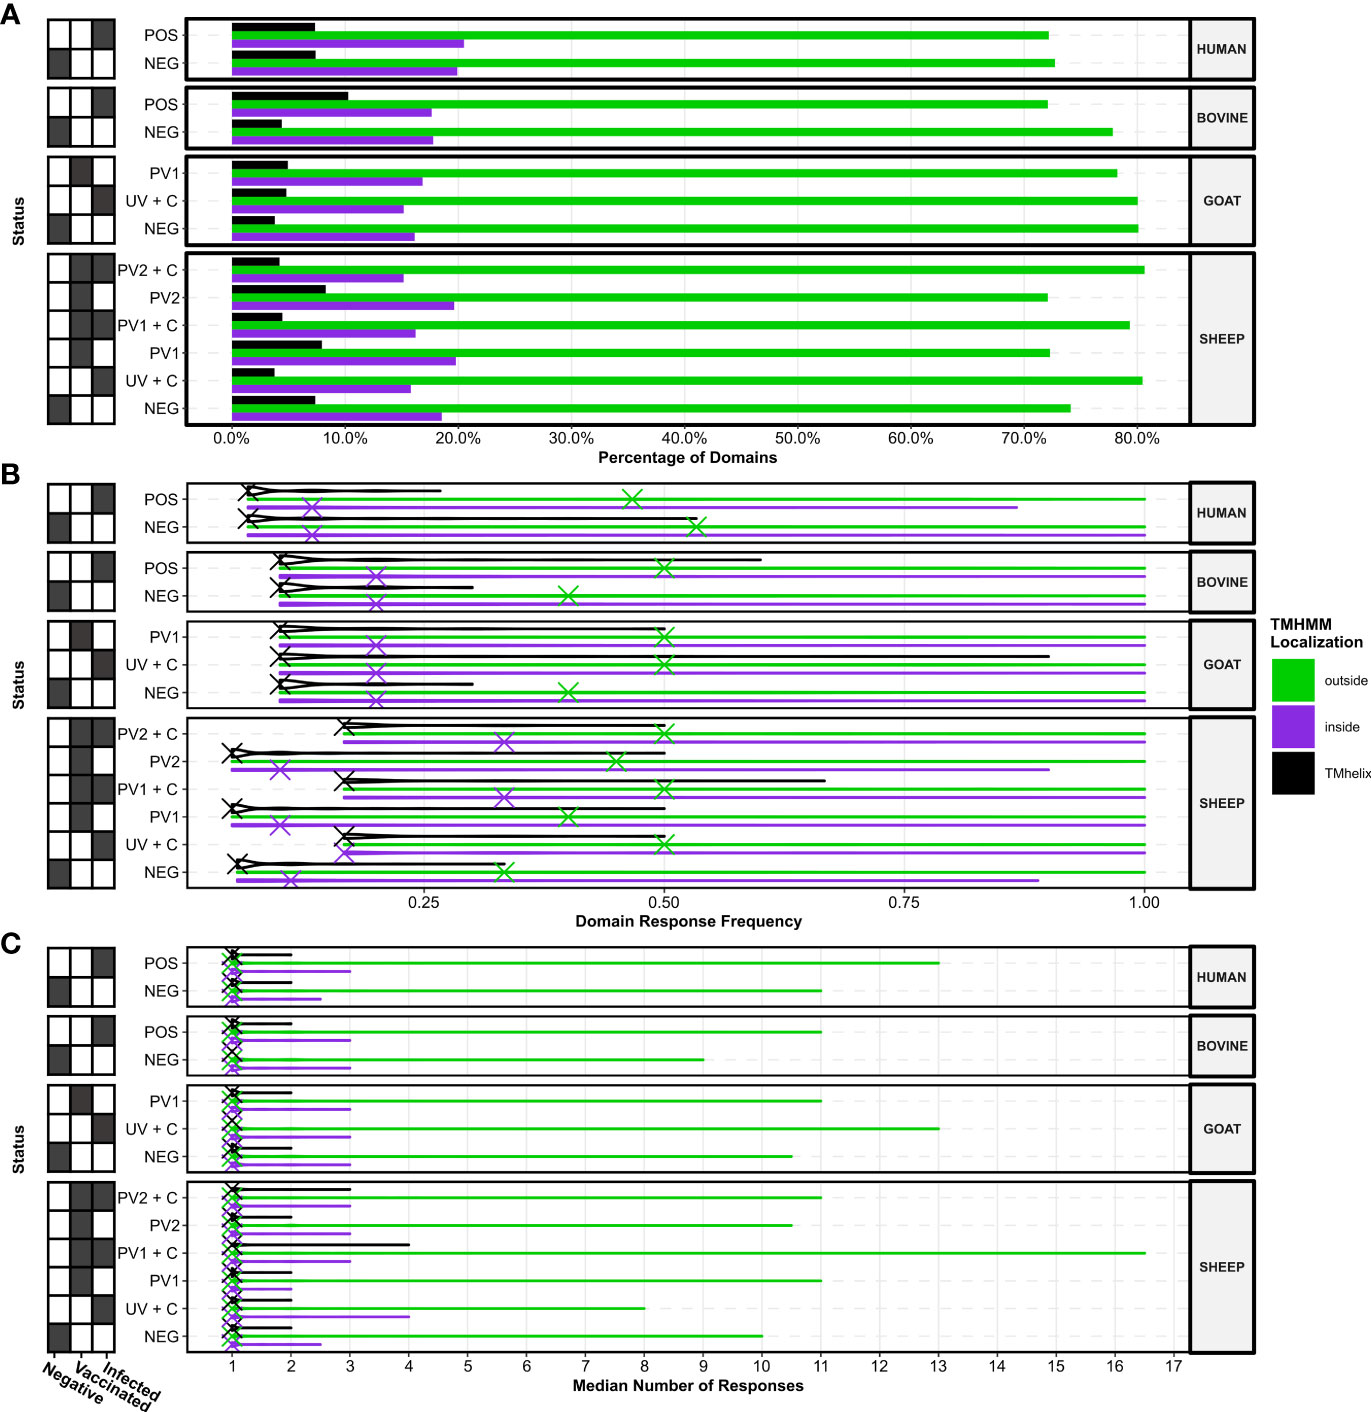
Figure 6 Localizations of TMHMM2.0-predicted domains in the C. burnetii proteins with responses. (A) Bar plots showing the percentage of domains with responses in the three different predicted localizations. (B) Violin plots showing the distributions of response frequencies for each species and treatment group stratified by the predicted localization of the domains. The X’s denote the overall median response frequency in each species, treatment, and localization grouping. (C) Violin plots showing the distributions of the median number of responses for each species and treatment group stratified by the predicted localization of the domains. The X’s denote the overall median of the median number of responses in each species, treatment, and localization grouping. The grids along the y-axes designate the exposure status of each treatment group as negative (C. burnetii unexposed), vaccinated (C. burnetii phase I/II), and/or infected (C. burnetii naturally infected or challenged). NEG, C. burnetii negative; POS, C. burnetii positive; PV1, post-C. burnetii phase I vaccination; PV2, post-C. burnetii phase II vaccination; UV, unvaccinated; +C, C. burnetii challenge.
When examining the consistency in the reactivity of protein domains between the predicted localizations across different species and treatments, the most consistently seroreactive domains were predicted as extracellular, regardless of C. burnetii exposure (Figure 6B). Furthermore, domains predicted as extracellular showed a greater overall consistency in their recognition by sera from cattle, goats, and sheep (but not humans) exposed to C. burnetii, as reflected in their median response frequencies, compared to their negative control groups (Figure 6B). The median response frequencies of protein domains predicted as intracellular were elevated in vaccinated and challenged sheep (PV1 + C and PV2 + C), and to a lesser extent in unvaccinated and challenged sheep (UV + C), compared to the sheep negative control (Figure 6B), but not in C. burnetii exposed cattle, goats, or humans (Figure 6B). Thus, C. burnetii-exposed individuals tend to display more consistency in their seroreactivity towards potentially extracellular protein domains.
The antibody response counts in protein domains between the different predicted localizations across species and treatments were analysed (Figure 6C). The median number of antibody responses showed no overall differences between localizations within or between species and treatments, as reflected in their median values (Figure 6C). However, upon examining the highest median response counts between treatments within species, we observed that the highest median response counts tended to occur in extracellular protein domains in the treatment groups exposed to C. burnetii. This indicates that extracellular protein domains likely harbor the largest number of potential antibody epitopes.
In conclusion, we found that extracellular protein domains were the most common target across all species, regardless of C. burnetii exposure. However, the concordance of seroreactivity and the quantity of potential antibody epitopes were heightened for those exposed to C. burnetii. This suggests that serum antibody reactivity against the linearly displayed C. burnetii proteome targets theoretically accessible vaccine antigens.
3.5 Determining potential subunit vaccine candidates across species
Our second aim was to identify antigens that could serve as effective components of a pan-species C. burnetii protein subunit vaccine. However, due to the absence of seroreactive protein domains with both high specificity and sensitivity across all species, we devised three alternative vaccine candidate methods: “method 1”, “method 2”, and “method 3”. These methods utilized a composite value, referred to as “coverage”, which was calculated as the product of the median antibody response count and the frequency of antibody responders (sensitivity) for each protein domain in each species and treatment group. This composite value was used to evaluate the combined seroreactivity across individuals within the same species and treatment group.
Method 1 was constructed using the difference in domain coverage between C. burnetii-exposed individuals (POS, PV1/2, PV1/2 + C, and UV + C) and each species’ negative control group. The vaccine candidates were selected if they had a coverage difference above the 75th percentile and were found in all species and treatment groups (Supplementary Figure S2). This resulted in 19 vaccine candidates (Supplementary Table S2).
Method 2 was based on the sum of coverage differences from all C. burnetii-exposed individuals across all species. The domains with coverage differences above the 95th percentile of the combined sum was chosen as vaccine candidates, resulting in 194 vaccine candidates (Supplementary Figure S3, Supplementary Table S2).
Method 3 focused on the paired sera from sheep that received either PhI or PhII of the vaccine, followed from before vaccination (NEG), after PhI/II vaccination (PV1/2), and after PhI/II vaccination and C. burnetii challenge (PV1/2 + C). Domain coverages were calculated for each group of six sheep at these three sample points. As potential vaccine candidates, domains that showed sequentially increasing coverage values across the three sample points were chosen (Figure 7A). The PhI vaccine group had more than three times the number of vaccine candidates compared to the PhII vaccine group. Additionally, the PhI vaccine candidates’ coverage values were higher than those of PhII. Figure 7A shows protein domains with increasing coverages in the six unvaccinated and challenged sheep (UV + C). Still these were not considered vaccine candidates since these individuals were only sampled twice, and the focus was identifying antigens targeted by the two protective vaccines. A total of 401 vaccine candidates were identified in both PhI and PhII vaccinated groups, with 22 shared between them (Figure 7B, Supplementary Table S2).
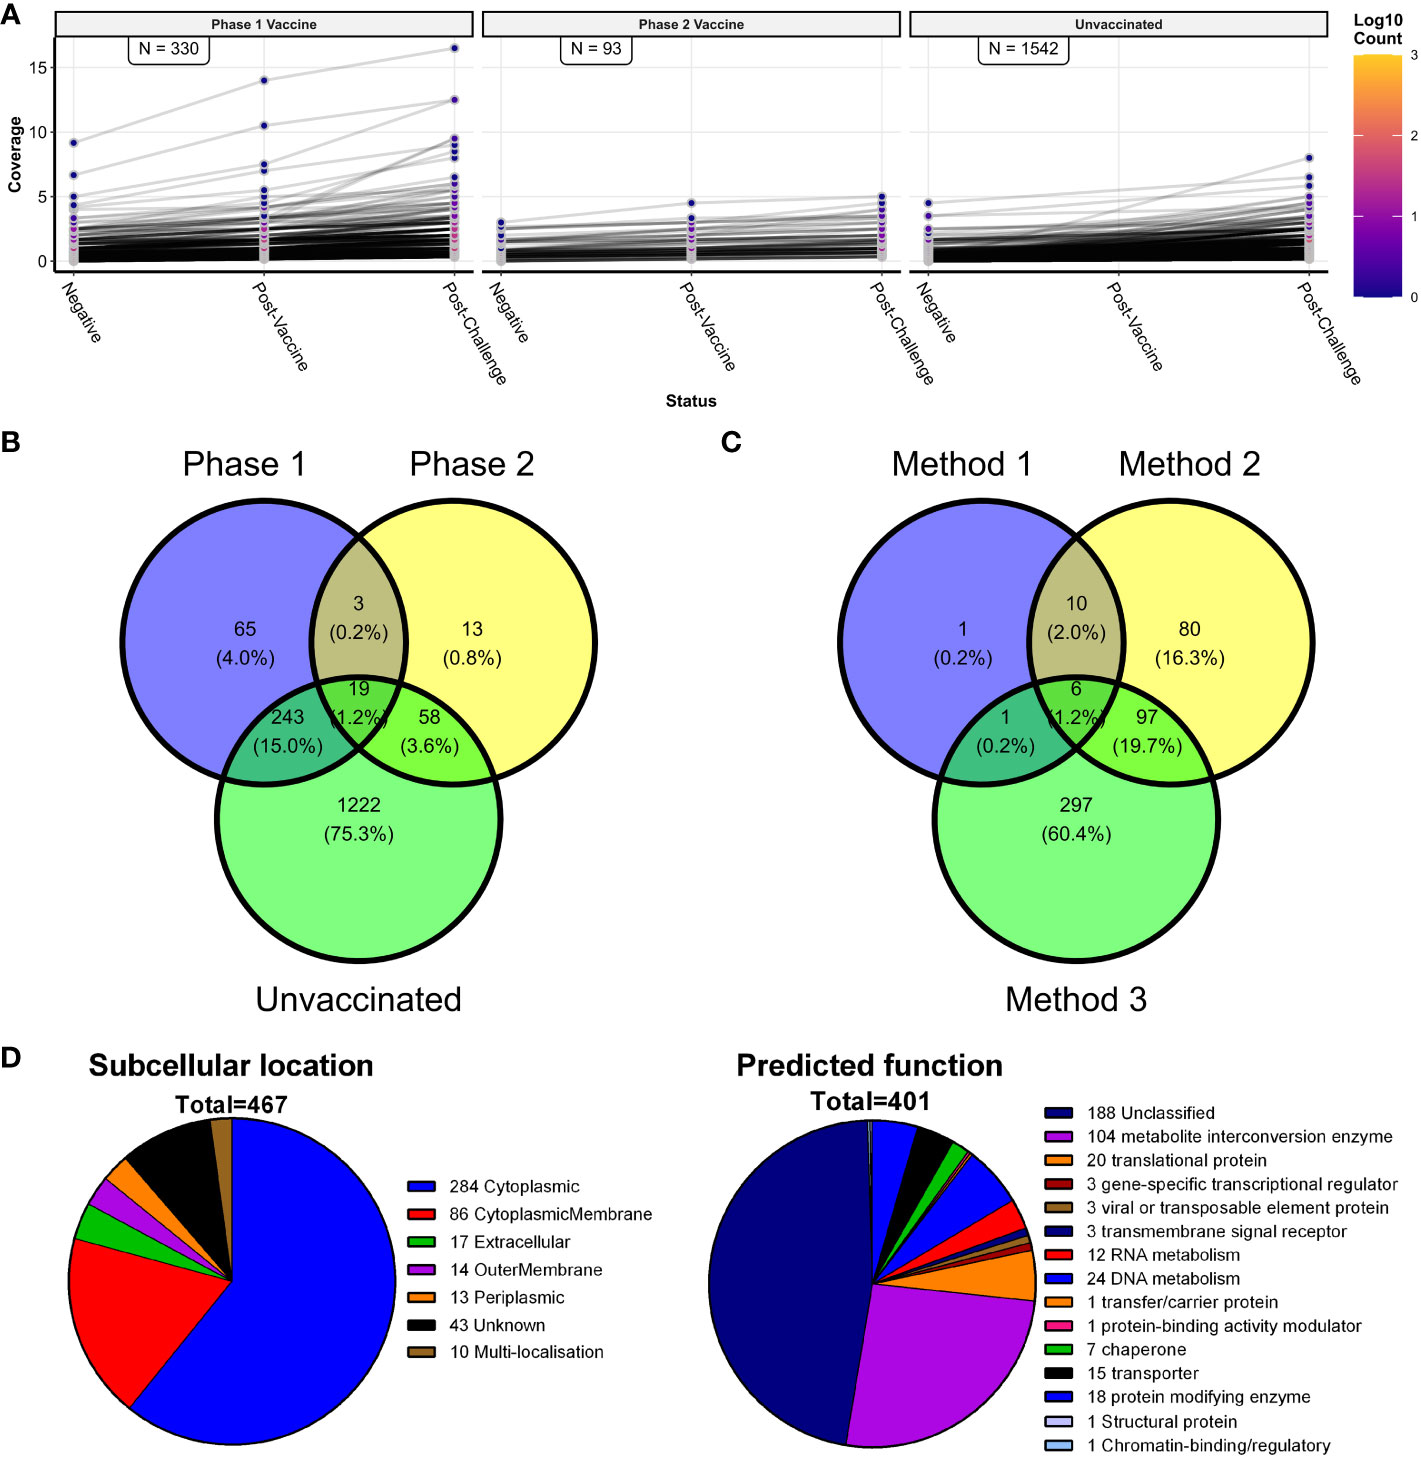
Figure 7 Vaccine candidate antigen identification, including the principle of method 3 and a comparison of all three vaccine methods. (A) Line plots of C. burnetii protein domains with consecutively increasing coverage values in the three sheep groups with paired serum samples (n = 48; N = 6). The number of domains with consecutively increasing coverage values is indicated in each facet. (B) Venn diagram showing the numbers and proportions of predicted domains with consecutively increasing coverage values shared between the phase 1 vaccine, phase 2 vaccine, and unvaccinated paired sheep serum samples—shown in (A). (C) Venn diagram of the predicted protein domains found with the three vaccine target methods (methods 1, 2, and 3). (D) Summary of the predicted subcellular location and predicted function of the 467 identified candidate vaccine proteins represented by the 493 candidate antigen domains.
Finally, the overlap in the vaccine candidates from all three methods was examined, resulting in 493 distinct protein domains as vaccine candidates. Six vaccine candidates were common to all three methods, and all were predicted to be cytoplasmic (Figure 7C, Supplementary Table S2). The largest number of vaccine candidates was shared by method 2 with one or more of the other two vaccine candidate methods. Although method 1 had the smallest number of vaccine candidates, it shared the largest fraction (18 out of 19) with one or more of the other two vaccine candidate methods.
3.6 Identified C. burnetii vaccine candidates are associated with diverse subcellular locations and functions
An annotated list of the 493 C. burnetii protein domains identified as vaccine candidates using methods 1–3 is shown in Supplementary Table S2. These domains represented 467 individual C. burnetii proteins, of which 65 (13.1%) had been identified in previous antibody screening studies in mice, guinea pigs, goats, and humans. Domain localizations predicted by TMHMM 2.0 were compared to the cellular localization of the whole proteins predicted by PSORTb 3.0 in a contingency table (Supplementary Table S3). High levels of agreement were found between the proteins predicted as localizing to the cytoplasmic membrane, extracellular space, outer membrane, or periplasmic space by PSORTb 3.0 and the vaccine candidate protein domain localizations predicted extracellular by TMHMM 2.0. However, PSORTb 3.0 and TMHMM 2.0 showed little agreement regarding proteins predicted as cytoplasmic by PSORTb 3.0 (277/493 as cytoplasmic in total), whereas TMHMM 2.0 predicted the majority as extracellular (442/493 as outside in total). Subsequent manual curation was performed on the 467 individual candidate proteins. This assigned cellular localization to several proteins previously designated “unknown”, giving final localization: cytoplasmic (284/467), cytoplasmic membrane (86/467), extracellular (17/467), outer membrane (14/467), periplasmic (13/467) and unknown (43/467) (Figure 7D). A functional analysis of the 467 C. burnetii proteins was performed using PANTHER. This assigned a diverse range of predicted protein classes for 401/467 proteins, with the most common function being metabolite interconversion enzymes (104/401) followed by proteins involved in nucleic acid metabolism (36/401) and translational proteins (20/401) (Figure 7D, Supplementary Table S2). In total, 188/401 proteins recognized by PANTHER could not be assigned to any protein class, and PANTHER did not recognize 66/467, corresponding to uncharacterized and/or hypothetical proteins in the C. burnetii genome.
3.7 Pan-species diagnostic antigens are enriched for intracellular domains
Protein domains identified by methods 1–3 with the highest summed coverage difference across all species were selected to identify antigens with pan-species serodiagnostic potential. To avoid the selection of antigens primarily recognized by vaccinated individuals, candidate antigens were considered from exposed and unvaccinated groups only (bovine POS, human POS, goat UV + C, sheep UV + C). The top 50 protein domains with the highest pan-species summed coverage difference (candidate diagnostic antigens) are shown in Figure 8A. Interestingly, the antibody reactivities of the 50 diagnostic candidates were highest in bovine POS samples compared to the other species. Diagnostic antigens were enriched for protein domains with a predicted intracellular localization (37/50). These were overrepresented compared to vaccine candidate antigens (74% vs. 60% predicted cytoplasmic proteins for diagnostic and vaccine antigen candidates, respectively). Protein functional analysis recognized 40/50 of the diagnostic antigens, with the majority (23/40) assigned as “unclassified” by PANTHER (Figure 8C). The remainder (17/40) were assigned to general metabolic protein classes. The coverage difference values of the 50 diagnostic antigens in groups receiving a vaccine showed that vaccinated sheep and goats recognized most of the candidate diagnostic antigens (Figure 8B).
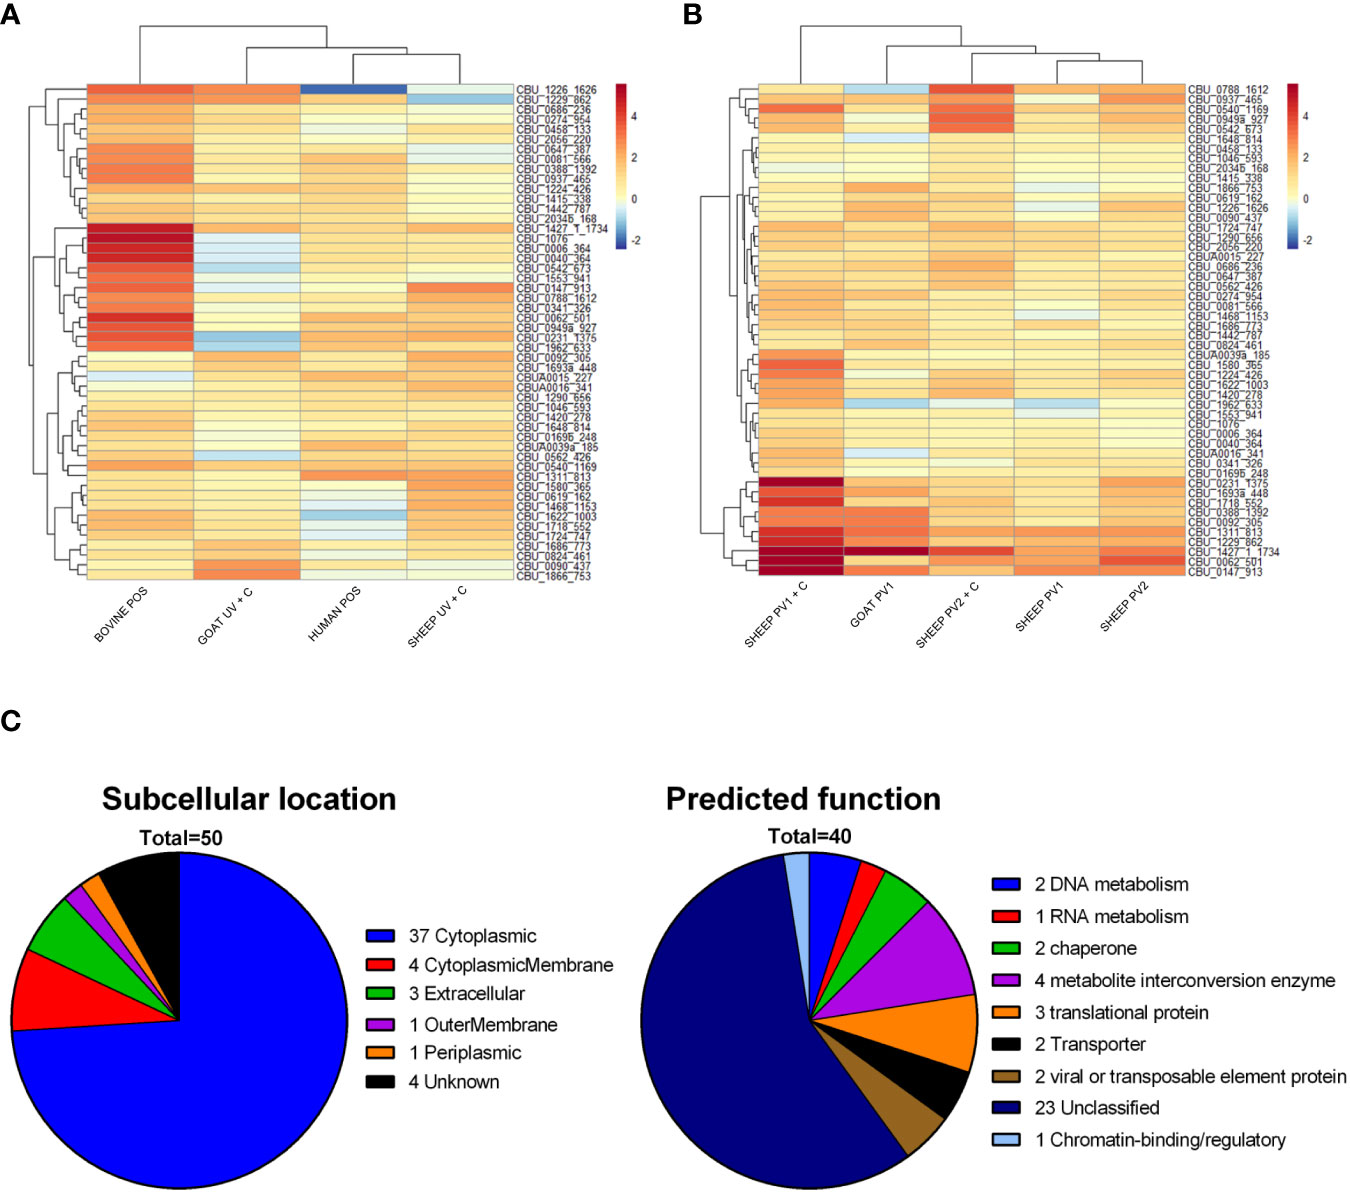
Figure 8 Diagnostic candidate antigen identification and predicted function and subcellular location. (A) Heat map of the top 50 protein domains with the highest sum coverage difference values following C. burnetii exposure across all species, excluding the vaccinated groups. (B) Heat map of the coverage difference values for the same top 50 proteins as in (A) for vaccinated groups. (C) Summary of the predicted subcellular location and predicted function of identified candidate diagnostic antigens. NEG, (C) burnetii negative; POS, C. burnetii positive; PV1, post-C. burnetii phase I vaccination; PV2, post-C. burnetii phase II vaccination; UV, unvaccinated; +C, C. burnetii challenge.
4 Discussion
In this study, we investigated the serum antibody reactivity in sera from cattle, goats, humans, and sheep towards the complete predicted proteome of C. burnetii (predicted as 2,092 ORFs). The proteome was represented as linear and contiguous 15-amino-acid peptide sequences that were synthesized on high-density peptide microarrays. The sera were sampled from individuals with or without prior exposure to C. burnetii through natural infection, laboratory challenge, or vaccination using either the Coxevac® PhI WCV (26, 55) or the PhII WCV (26). To our knowledge, this is the first study to perform antigen profiling of C. burnetii using high-density peptide microarrays. From the 156 serum samples analyzed, the antibody responses both within and between species and including C. burnetii exposure status were found to target diverse antigens; however, exposure to C. burnetii did generate a slightly more uniform seroreactivity across species. Using three separate vaccine candidate methods, 493 protein domains representing 467 potential protein subunit vaccine candidates were determined, which require further validation.
The initial examination of seroreactivity towards the C. burnetii-derived peptides showed that the sera from the C. burnetii-exposed treatment groups across all species, on average, had higher numbers of antibody-reactive peptides compared to the unexposed species-specific negative control sera, excluding the goats, which showed the opposite trend. However, antibody-reactive peptides in C. burnetii-negative individuals were not exclusive to the goats. Previous studies have demonstrated and confirmed that C. burnetii seronegative individuals could exhibit antibody reactivity towards C. burnetii soluble lysates (46) and/or recombinant C. burnetii protein antigens (44, 46, 67–70). These studies all used complete proteins as antigens. The peptide sequences used in this study, with their shorter lengths, could have greater likelihoods for sufficient homology to antigens from unrelated organisms to produce the observed cross-reactivity in the negative control groups. Furthermore, this study showed that the number of antibody-reactive peptides differed greatly between individuals within the same treatment group. The results revealed that those naturally exposed to C. burnetii (cattle and humans) or those challenged (goats and sheep) had the largest variation between the lowest and highest numbers of antibody-reactive peptides between individuals, with the greatest variation seen (256-fold difference) in the antibody-reactive peptides of humans naturally exposed to C. burnetii compared with humans who were unexposed. This variation in the number of antibody-reactive peptides could be attributed to differences in antibody titers between individuals, as reported by Beare et al. in 2008 (46) and Jeske et al. in 2021 (70), who found a difference of one to two or three orders of magnitude, respectively, between the lowest and highest titers in their human Q-fever patients. Finally, we represented C. burnetii protein antigens as 15 amino acid peptides based on their primary sequence, excluding both conformational epitopes and post-translationally modified epitopes found against whole antigens in vivo. Thus, the variations in the numbers of antibody-reactive peptides in the confirmed C. burnetii-exposed (i.e., vaccinated and infected) treatment groups could also be attributed to individual sera having seroreactivity targeting epitopes outside our 15-amino-acid linear peptide windows.
Due to the variable numbers of antibody-reactive peptides between individuals, the downstream analyses focused on seroreactivity at the protein antigen level. The antibody-reactive peptides were mapped to domains predicted by TMHMM2.0 (60) in their parent protein sequences. A pairwise agreement between individual sera was analysed by calculating the Jaccard similarity between their sets of seroreactive protein domains. The initial clustering based on the Jaccard distances (1—Jaccard similarity) indicated that sera from the same species had the most seroreactive protein domains in common. In quantifying the pairwise agreement with a generalized linear model, a baseline of 30% overlap in seroreactive protein domains between all individuals, independent of C. burnetii exposure, was observed. Individuals from the same species exhibited a slightly higher level of agreement (2%–4%); however, in the case of paired sheep samples, the sera from the same individuals shared over 50% of their seroreactive protein domains. Finally, C. burnetii exposure did result in significant increases in agreement (2% for unpaired sera and 10% for the paired sheep sera). Thus, the seroreactive peptides map to a background of C. burnetii protein domains across species and treatment groups, with some selected protein domains favored following C. burnetii exposure. This background of seroreactive proteins could stem from homology to other source organisms, as the study sera were taken from relatively outbred cohorts, possibly facilitating encounters with other gram-negative bacteria. Xiong et al. in 2012 (68) reported cross-reactivity against four C. burnetii recombinant proteins (CBU_1718, CBU_0229, CBU_1910, and CBU_0612) in 10%–30% of sera from patients with Legionella pneumophila infection, Streptococcal pneumonia, or Rickettsial spotted fever. Similarly, Jiao et al. in 2014 (71) observed cross-reactivity in 10%–20% of sera from mice infected with Rickettsia heilongjiangensis or R. typhi against 14 C. burnetii recombinant protein antigens. Furthermore, Keasey et al. in 2009 (72) found significant levels of antibody cross-reactivity among sera from rabbits inoculated with one of eight inactivated infectious gram-negative bacteria. The seroreactive antigens were classified into three categories based on their cross-reactivity levels: extensively cross-reactive, limited cross-reactive, and pathogen-selective antigens (72). Though Keasey et al. in 2009 (72) did not include C. burnetii in their list of pathogens, their results and the C. burnetii cross-reactivities reported by Xiong et al. in 2012 (68) and Jiao et al. in 2014 (71), together with observations from this study, suggest background seroreactivity against gram-negative bacteria in the negative control sera. In a recent study, Ricci et al. in 2023 used high-density peptide microarrays (produced by Nimble Therapeutics) to identify antibody epitopes against Trypanosoma cruzi in convalescent and healthy humans from the Americas (73). Unlike this study, their individual samples had limited shared seroreactive peptides (<30%) (73). They pooled convalescent sera based on geographical origin to screen for seroreactive peptides, subsequently analyzing targets with individual sera (73). The higher baseline at 30% overlap observed in this study may arise from testing individual sera, as pooling could dilute low-titer or low-affinity antibodies. Furthermore, Ricci et al. in 2023 employed a fixed antibody-binding signal threshold for specificity (73), while this study relied on signal distribution from randomized peptides to detect seroreactive peptides. This approach enhanced the detection sensitivity but sacrificed specificity.
Comparing the antibody reactivity between negative and exposed or vaccinated groups, a general increase in seroreactivity in C. burnetii-exposed or vaccinated cattle, goats, humans, and sheep, coupled with the potential for increased numbers of antibody-reactive regions within the same protein domains, was observed. Upon comparing the frequencies of antibody responses to individual protein domains between C. burnetii-exposed and negative controls, C. burnetii protein domains with selective seroreactivity for the separate C. burnetii-exposed treatment groups were observed. However, except for the selective and highly sensitive domain found in both the challenged and the Coxevac® PhI WCV-vaccinated goats, CBU_0676, and the similarly selective and sensitive domain found in the C. burnetii naturally infected cattle, CBU_0751, domains with selective seroreactivity for the other C. burnetii-exposed treatment groups were substantially lower—peaking at 33% and 67% for the naturally infected humans and the Coxevac® PhI WCV-vaccinated and C. burnetii-challenged sheep, respectively. Outside of the C. burnetii-exposed selective seroreactive domains, the sensitivities of C. burnetii-exposed treatment groups and species were negatively correlated, i.e., the most sensitive domains showed little specificity for the C. burnetii-exposed treatment groups. Thus, the seroreactive antigens of the C. burnetii-exposed treatment groups exhibited varying degrees of both sensitivity and specificity. A comparable observation was made by Vigil et al. in 2010 (44), who noted varying specificities and sensitivities of the seroreactivity against 64 protein antigens in their human Q-fever patients. Furthermore, the most widely reported C. burnetii antigen, CBU_1910 (Com1), has been found to have varying degrees of sensitivity (37.5%–55%) and specificity (71%–90%) in human Q-fever patients as summarized by Gerlach et al. in 2017 (74).
More recently, Jeske et al. in 2021 (70) determined 93% specificity and 64% sensitivity with recombinant CBU_1910 (Com1) in a human cohort of 76 C. burnetii seropositive and 91 negative control sera. Similarly, Stellfeld et al. in 2020 (75) found a good performance of recombinant CBU_1910 (Com1) in sera from 197 cattle, 104 goats, and 115 sheep with specificities of 70%, 77%, and 68% and sensitivities of 71%, 94%, and 85%, respectively. By comparison, this study found seroreactivity across species and treatment groups, independent of C. burnetii exposure, against CBU_1910, with sensitivities from 67% in the C. burnetii-challenged unvaccinated sheep to 100% in both the PII WCV-vaccinated and challenged sheep and the human negative control treatment groups. The results showed similar patterns for CBU_1718 (GroEL) and CBU_1290 (DnaK), which were both reported as highly performing diagnostic antigens by Jeske et al. in 2021 (70) with CBU_1718 (GroEL) and CBU_1290 (DnaK) exhibiting specificities of 69% and 77% and sensitivities of 72% and 47%, respectively. Similarly, Miller and Kersh 2020 (69) reported 90% specificity and 71.43% sensitivity for CBU_1718 (GroEL) with 24 human sera. Additionally, they found a 100% seroresponse rate in eight naturally C. burnetii-infected goats (69). Even though this study detected seroreactivity against these three highly rated C. burnetii antigens, we found limited or no selectivity compared to previous studies which used recombinant full-length antigens, highlighting how the selectivity of these antigens may depend on conformational epitopes or post-translational modifications. Of note, CBU_1718 (GroEL) and CBU_1290 (DnaK) were both selected as subunit vaccine candidates by vaccine candidate method 2 and both methods 1 and 2, respectively, indicative of higher reactivity (as measured by their coverage) compared to the negative control groups. However, the most selective antigens detected using the peptide microarrays presented low sensitivities, corresponding with the previously reported diversity in the humoral response to C. burnetii (44).
As noted by Gerlach et al. in 2017 (74) from the reports of seroreactivity focusing on outer membrane proteins by Hotta et al. in 2004 (76) and Papadioti et al. in 2011 (77), the theoretical best targets for an antibody-focused protein subunit vaccine should localize to the outer membrane of C. burnetii to neutralize cellular invasion and promote bacterial clearance. Indeed the initial analysis of protein domain localizations showed higher sensitivities (higher response frequencies in the treatment groups) and numbers of potential epitopes in domains predicted as extracellular by the TMHMM 2.0 algorithm (60). However, the assessment of the localizations of the protein antigens with PSORTb 3.0 (61) of the resulting 493 vaccine candidate domains from the three vaccine candidate methods found many discrepancies between PSORTb 3.0 and TMHMM 2.0, where PSORTb 3.0-predicted cytoplasmic proteins were predicted to have extracellular domains by TMHMM 2.0. When assessing the Gene Ontology (78, 79) molecular functions and identities of the proteins predicted cytoplasmic by PSORTb 3.0, a cytoplasmic localization was found to be the most likely. Indeed TMHMM 2.0 predicted both CBU_1718 (GroEL), a chaperonin, and CBU_1290 (DnaK), a chaperone, thus both involved in protein folding, which is expected to be associated with cytoplasmic localizations, to be localized extracellularly. Of note, CBU_1290 (DnaK) has also been predicted to be plasma-membrane-associated by UniProt (80). Furthermore, Flores-Ramirez et al. in 2014 (81) reported both CBU_1718 (GroEL) and CBU_1290 (DnaK) as having potential moonlighting activities, both involved in host cell adhesion and/or function as plasminogen receptors, thus directly aiding in host cell invasion. They reported six additional cytoplasmic proteins with potential moonlighting activities of which three, CBU_0221, CBU_0630, and CBU_1708 (81), were also detected as potential vaccine candidates by at least one of the three vaccine candidate methods used in this study. Moonlighting activities could, in part, explain the enrichment of cytoplasmic localized proteins in the vaccine candidate list produced in this study, as these would be exposed to the immune system by intact bacteria. However, cytoplasmic proteins released from lysed C. burnetii bacteria in vivo would also be exposed to the immune system and appear to be inherently immunogenic. Indeed Gerlach et al. in 2017 (74) noted an enrichment for cytoplasmic localized proteins as antigenic targets, which is consistent with our observations in this study.
Due to the observed diversity in the selective seroreactivity observed within the C. burnetii-exposed treatment groups (i.e., seroreactivity seen only in C. burnetii-exposed individuals), this study utilized the coverage as a composite value for the seroreactivity against the protein domains across individuals in the separate species and treatment groups. The rationale behind method 1 was to capture protein domains with increased antibody reactivity compared to the species negative control group shared across all C. burnetii-exposed treatment groups. Method 2 was a less selective approach with increased sensitivity compared to method 1, which identified protein domains with an overall increased seroreactivity across all C. burnetii-exposed treatment groups. Finally, method 3 utilized the uniformity in the paired sheep sera to identify protein domains that were subjected to a boost in antibody reactivity following C. burnetii after the challenge, thus identifying protein domains that were targeted by sheep memory B-cells activated following the C. burnetii challenge. Of note, the Coxevac® PhI WCV-vaccinated (26) sheep treatment group produced over three times the number of vaccine candidates than the PhII WCV-vaccinated (26) sheep. Combining all three methods as shown herein yielded six protein domains targeted across different species of C. burnetii-exposed treatment groups while being apparent target antigens for memory B-cells in the sera from the continuously sampled sheep. These proteins were all predicted to be cytoplasmic, consistent with previous observations that C. burnetii cytoplasmic proteins appear to be highly antigenic (68), and one protein, CBU_0388, had previously been identified as a target of the CD8+ T cell response in C. burnetii-challenged mice (82).
In total, 493 vaccine candidate antigen domains, representing a total of 467 individual C. burnetii proteins, were identified. These proteins were predicted to be primarily (61%) cytoplasmic and to have a diverse range of functions. From this subset of proteins, 65 had been identified in previous antigen screens. Of relevance to subunit vaccine development, 31 proteins were predicted to be outer membrane or extracellular proteins and thus potential targets for antibodies with neutralization or bacterial clearance functions, such as opsonization or complement activation. Furthermore, two antigens within our candidate list, CBU_0545 and CBU_0891, have previously been shown to induce a degree of protection when formulated into a recombinant subunit vaccine with three other antigens and tested in mice (25), and a further antigen within our candidate list, CBU_0630 (Mip), has also been shown to induce protection in mice immunized with bone marrow-derived dendritic cells (BMDCs) pulsed with recombinant Mip (83). This gives some confidence that, within the candidate list produced in this study, there are antigens with the potential to induce protective immune responses. Interestingly, CBU_1910 (Com1) was also tested in both mouse vaccination studies and contributed to the protective immune response, either in combination with other antigens or following immunization with Com1-pulsed BMDCs. This antigen was not present in the vaccine candidate list produced in this study. This was surprising as Com1 is one of the most frequently identified antibody targets within the C. burnetii proteome (74). However, Com1 antibody reactivity has previously been identified through immunoblotting of C. burnetii antigen preparations or protein microarray (42, 44, 67), which may capture also conformational B cell epitopes, whereas our peptide microarrays only identify linear epitopes. Therefore, the lack of an increase in Com1 antibody reactivity in C. burnetii-exposed groups in this investigation could be due to Com1 primarily harboring conformational epitopes.
In addition to interrogating the data for vaccine candidates, potential serodiagnostic antigen targets were evaluated by focusing on the top 50 proteins with the highest sum coverage difference values (coverage of exposed minus negative control groups) across all species within the antigens identified through methods 1–3 but excluding groups which had been vaccinated. This approach further enriched for cytoplasmic proteins, which was again consistent with previous immune-screening studies (74), and identified nine antigens which have been identified in previous serological screens. These included CBU_1290 (DnaK), which has shown significant promise as diagnostic antigens for humans (70), and both CBU_1718 (GroEL) and CBU_0092 (YbgF), which have shown promise as diagnostic antigens in humans, sheep, cattle, and goats (69, 70, 84). Of note was that, across the four species evaluated, antibodies from naturally exposed cattle were the most reactive. Host-species-specific differences in seroreactivity proteins have previously been reported (45, 68, 71), which may be due to inherent differences in B cell receptor diversity between species. However, the variation in response may also reflect the nature of the challenge (natural exposure in cattle and humans vs. experimental C. burnetii challenge in sheep and goats), the duration of infection, and the strain of C. burnetii involved. Intriguingly, recent genotyping studies suggest that cattle are infected with distinct strains of C. burnetii compared to humans, goats, and sheep, which may partly explain the different seroreactivity profile in cattle (85). Comparing the reactivity of these 50 candidate diagnostic antigens in groups which have received a vaccine failed to identify any diagnostic antigen which was not also recognized post-vaccination. This reflects the initial candidate antigen identification methodology employed in this study as 25/50 (50%) of the diagnostic antigens that were identified by method 3, which focused on antibody responses in vaccinated sheep. Therefore, to ensure differentiating infected from vaccinated animals, the capability of any serodiagnostic test with these candidate antigens, it would be necessary to ensure that the antigens used for serodiagnostic assays were different from those used in prototype subunit vaccines.
5 Conclusion
To our knowledge, this study reports the first use of high-density peptide microarrays to profile linear B-cell epitopes in the entire proteome of C. burnetii. The study findings suggest that the seroreactivity against a linearly displayed C. burnetii proteome has marked diversity and potential cross-reactivity in C. burnetii seronegative individuals. This study presents a list of 493 protein domains representing 467 individual proteins as potential candidates for a protein-subunit-based C. burnetii vaccine. Testing the vaccine efficacy of the entire candidate list would not be feasible. Thus, the list should be scrutinized, further utilizing both predicted cellular localizations and function in the virulence of C. burnetii together with the potential for recombinant expression. Finally, any recombinantly expressed vaccine candidates should be tested in relevant animal models alone or in combination to determine their efficacy against the C. burnetii challenge.
Data availability statement
The datasets presented in this study can be found in online repositories. The name of the repository/repositories and accession number(s) can be found below: https://datadryad.org/stash, https://doi.org/10.5061/dryad.63xsj3v44.
Ethics statement
The studies involving humans were approved by the Medical Ethics Committee Arnhem-Nijmegen (NL35784.091.11), Radboud University Medical Center, Nijmegen, the Netherlands. The studies were conducted in accordance with the local legislation and institutional requirements. The participants provided their written informed consent to participate in this study. The animal study was approved by the Moredun Animal Welfare and Ethical Review Body (E34/18), Moredun Research Institute, Pentlands Science Park, Midlothian, EH26 0PZ UK; Utrecht University Animal Experiments Committee (2014.II.11.058; DEC2014.II.11.085; 0202.0806), Utrecht, The Netherlands; and the Wageningen Bioveterinary Research Animal Experiments Committee (AVD401002016580; 299-47053-07/99-01; 821-47302-00/01-01; 2009082.c, 2009079.a; 2010098.d; 2011111.c), Lelystad, The Netherlands. The study was conducted in accordance with the local legislation and institutional requirements.
Author contributions
EB: Data curation, Formal Analysis, Investigation, Methodology, Writing – original draft. SF: Formal Analysis, Investigation, Methodology, Writing – original draft. SW-M: Investigation, Methodology, Writing – review & editing. MM: Investigation, Methodology, Writing – review & editing. WG: Conceptualization, Funding acquisition, Writing – review & editing. DL: Conceptualization, Funding acquisition, Methodology, Writing – review & editing. AN: Conceptualization, Funding acquisition, Writing – review & editing. AD: Writing – review & editing. ES: Formal Analysis, Methodology, Writing – review & editing. RP: Methodology, Writing – review & editing. JT: Conceptualization, Formal Analysis, Methodology, Writing – review & editing. LJ: Resources, Writing – review & editing. H-JR: Conceptualization, Funding acquisition, Writing – review & editing. TO: Formal Analysis, Writing – review & editing. AK: Conceptualization, Funding acquisition, Investigation, Resources, Writing – review & editing. SB: Conceptualization, Formal Analysis, Funding acquisition, Investigation, Writing – review & editing. TM: Conceptualization, Funding acquisition, Investigation, Methodology, Project administration, Supervision, Writing – original draft.
Funding
The author(s) declare financial support was received for the research, authorship, and/or publication of this article. This research was funded by the Department of Health and Social Care using UK Aid funding and is managed by the BBSRC (BB/R019975/1). The views expressed in this publication are those of the author(s) and not necessarily those of the Department of Health and Social Care. The funding bodies had no role in the study design, data collection, and interpretation or the decision to submit the work for publication.
Conflict of interest
Authors ES, RP, and JT were employed by the company Nimble Therapeutics, Inc.
The remaining authors declare that the research was conducted in the absence of any commercial or financial relationships that could be construed as a potential conflict of interest.
Publisher’s note
All claims expressed in this article are solely those of the authors and do not necessarily represent those of their affiliated organizations, or those of the publisher, the editors and the reviewers. Any product that may be evaluated in this article, or claim that may be made by its manufacturer, is not guaranteed or endorsed by the publisher.
Supplementary material
The Supplementary Material for this article can be found online at: https://www.frontiersin.org/articles/10.3389/fimmu.2023.1257722/full#supplementary-material
Supplementary FIGURE S1 | C. burnetii-specific antibody responses in serum samples used to probe peptide arrays. (A) Serological responses following vaccination and/or C. burnetii challenge in sheep, indicating the time-points selected for peptide array analysis (26). The sheep were either vaccinated twice with a phase I C. burnetii bacterin vaccine (Coxevac®, PV1) or a phase II C. burnetii bacterin vaccine (PV2) or left unvaccinated. The timing of the first and second vaccinations are indicated by “V1” and “V2”, respectively. The ewes were mated on day 49 (indicated by M) and subsequently challenged on day 151 with C. burnetii Nine-Mile strain RSA493 (indicated by “C”). The levels of C. burnetii-specific antibodies within serum samples collected throughout the study were quantified by ELISA (IDEXX Q-Fever antibody test; IDEXX, UK) and presented as mean percentage positive values (PP) ± standard error of the mean (SEM). Serum samples from day 0 (NEG time-point), day 35 (PV1/PV2 time-points), and day 175 (PV1+C/PV2+C/UV+C time-points) were selected for the peptide microarray analysis. L, lambing. (B) Levels of C. burnetii-specific antibodies in humans diagnosed with chronic Q fever and uninfected controls (56) as determined by ELISA (SERION ELISA classic Coxiella burnetii phase 2 IgG, Serion GmbH, Würzburg, Germany). Data is presented as activity units per milliliter of serum according to the manufacturer’s instructions and shows significantly higher C. burnetii-specific antibody levels in the infected group compared to the negative control group (P< 0.0001, Mann–Whitney U-test). Data is presented as median values ± interquartile range. (C) Levels of C. burnetii-specific antibodies in cattle naturally infected with C. burnetii and uninfected controls (51, 52) as determined by ELISA (IDEXX Q-Fever antibody test; IDEXX, UK). Data is presented as mean PP values ± SEM and shows significantly higher C. burnetii-specific antibody levels in the infected group compared to the negative control group (P< 0.0001, Mann–Whitney U-test). (D) Levels of C. burnetii-specific antibodies in goats either experimentally infected with C. burnetii, vaccinated with Coxevac®, or uninfected controls (53–55) as determined by ELISA (IDEXX Q-Fever antibody test; IDEXX, UK). Data is presented as mean PP values ± SEM and shows significantly higher C. burnetii-specific antibody levels in the infected group (P< 0.01) and the vaccinated group (P< 0.0001) compared to the negative control group (one-way ANOVA followed by Tukey’s multiple-comparisons test). NEG, C. burnetii negative; POS, naturally infected with C. burnetii; PV1, post-C. burnetii phase I vaccination; PV2, post-C. burnetii phase II vaccination; UV, unvaccinated; +C, experimental C. burnetii challenge.
Supplementary FIGURE S2 | Method 1 percentiles. Line plots showing the percentiles of differences in coverage values between the positive and negative groups within each species. The percentile values were calculated from 0% to 100% at 1% steps. Coverage is the product between a domain’s response frequency and median response count. POS, C. burnetii positive; PV1, post-C. burnetii phase I vaccination; PV2, post-C. burnetii phase II vaccination; UV, unvaccinated; +C, C. burnetii challenge.
Supplementary FIGURE S3 | Method 2 percentiles. Line plot showing the percentiles of the summed differences in coverage values between the positive and negative groups within each species. The percentile values were calculated from 0% to 100% at 1% steps. Coverage is the product between a domain’s response frequency and the median response count.
References
1. Eibach R, Bothe F, Runge M, Fischer SF, Philipp W, Ganter M. Q fever: baseline monitoring of a sheep and a goat flock associated with human infections. Epidemiol Infect (2012) 140(11):1939–49. doi: 10.1017/S0950268811002846
2. Hilbink F, Penrose M, Kovacova E, Kazar J. Q fever is absent from New Zealand. Int J Epidemiol (1993) 22(5):945–9. doi: 10.1093/ije/22.5.945
3. Tigertt WD, Benenson AS, Gochenour WS. Airborne Q fever. Bacteriol Rev (1961) 25(3):285–93. doi: 10.1128/br.25.3.285-293.1961
4. Q-fever Transmission: Centers for Disease Control and Prevention (2019). Available at: https://www.cdc.gov/qfever/transmission/index.html.
6. Morroy G, Peters JB, van Nieuwenhof M, Bor HH, Hautvast JL, van der Hoek W, et al. The health status of Q-fever patients after long-term follow-up. BMC Infect Dis (2011) 11:97. doi: 10.1186/1471-2334-11-97
7. Million M, Raoult D. No such thing as chronic Q fever. Emerg Infect Dis (2017) 23(5):856–7. doi: 10.3201/eid2305.151159
8. Langley JM, Marrie TJ, Leblanc JC, Almudevar A, Resch L, Raoult D. Coxiella burnetii seropositivity in parturient women is associated with adverse pregnancy outcomes. Am J Obstet Gynecol (2003) 189(1):228–32. doi: 10.1067/mob.2003.448
9. Avberšek J, Pate M, Škibin A, Ocepek M, Krt B. Management of a Coxiella burnetii-infected sheep flock after an outbreak of Q fever in humans. Turkish J Of Veterinary And Anim Sci (2019) 43:264–70. doi: 10.3906/vet-1806-31
10. Bontje DM, Backer JA, Hogerwerf L, Roest HIJ, van Roermund HJW. Analysis of Q fever in Dutch dairy goat herds and assessment of control measures by means of a transmission model. Prev Vet Med (2016) 123:71–89. doi: 10.1016/j.prevetmed.2015.11.004
11. Meiklejohn G, Reimer LG, Graves PS, Helmick C. Cryptic epidemic of Q fever in a medical school. J Infect Dis (1981) 144(2):107–13. doi: 10.1093/infdis/144.2.107
12. Van den Brom R, van Engelen E, Roest HI, van der Hoek W, Vellema P. Coxiella burnetii infections in sheep or goats: an opinionated review. Vet Microbiol (2015) 181(1-2):119–29. doi: 10.1016/j.vetmic.2015.07.011
13. Plummer PJ, McClure JT, Menzies P, Morley PS, Van den Brom R, Van Metre DC. Management of Coxiella burnetii infection in livestock populations and the associated zoonotic risk: A consensus statement. J Vet Intern Med (2018) 32(5):1481–94. doi: 10.1111/jvim.15229
14. De Biase D, Costagliola A, Del Piero F, Di Palo R, Coronati D, Galiero G, et al. Coxiella burnetii in infertile dairy cattle with chronic endometritis. Vet Pathol (2018) 55(4):539–42. doi: 10.1177/0300985818760376
15. Arricau Bouvery N, Souriau A, Lechopier P, Rodolakis A. Experimental Coxiella burnetii infection in pregnant goats: excretion routes. Vet Res (2003) 34(4):423–33. doi: 10.1051/vetres:2003017
16. Rodolakis A, Berri M, Hechard C, Caudron C, Souriau A, Bodier CC, et al. Comparison of Coxiella burnetii shedding in milk of dairy bovine, caprine, and ovine herds. J Dairy Sci (2007) 90(12):5352–60. doi: 10.3168/jds.2006-815
17. Hogerwerf L, van den Brom R, Roest HI, Bouma A, Vellema P, Pieterse M, et al. Reduction of Coxiella burnetii prevalence by vaccination of goats and sheep, The Netherlands. Emerg Infect Dis (2011) 17(3):379–86. doi: 10.3201/eid1703.101157
18. European Medicines Agency. Coxevac, Inactivated Coxiella burnetii vaccine. (2014). Available at: https://www.ema.europa.eu/en/medicines/veterinary/EPAR/coxevac.
19. Reeves PM, Paul SR, Sluder AE, Brauns TA, Poznansky MC. Q-vaxcelerate: A distributed development approach for a new Coxiella burnetii vaccine. Hum Vaccin Immunother (2017) 13(12):2977–81. doi: 10.1080/21645515.2017.1371377
20. Arricau-Bouvery N, Souriau A, Bodier C, Dufour P, Rousset E, Rodolakis A. Effect of vaccination with phase I and phase II Coxiella burnetii vaccines in pregnant goats. Vaccine (2005) 23(35):4392–402. doi: 10.1016/j.vaccine.2005.04.010
21. Ormsbee RA, Bell EJ, Lackman DB, Tallent G. The influence of phase on the protective potency of Q fever vaccine. J Immunol (1964) 92:404–12. doi: 10.4049/jimmunol.92.3.404
22. Kumaresan V, Alam S, Zhang Y, Zhang G. The Feasibility of Using Coxiella burnetii Avirulent Nine Mile Phase II Viable Bacteria as a Live Attenuated Vaccine Against Q fever. Front Immunol (2021) 12:754690. doi: 10.3389/fimmu.2021.754690
23. Gregory AE, van Schaik EJ, Fratzke AP, Russell-Lodrigue KE, Farris CM, Samuel JE. Soluble antigens derived from Coxiella burnetii elicit protective immunity in three animal models without inducing hypersensitivity. Cell Rep Med (2021) 2(12):100461. doi: 10.1016/j.xcrm.2021.100461
24. Fratzke AP, Jan S, Felgner J, Liang L, Nakajima R, Jasinskas A, et al. Subunit vaccines using TLR triagonist combination adjuvants provide protection against Coxiella burnetii while minimizing reactogenic responses. Front Immunol (2021) 12:653092. doi: 10.3389/fimmu.2021.653092
25. Gilkes AP, Albin TJ, Manna S, Supnet M, Ruiz S, Tom J, et al. Tuning Subunit Vaccines with Novel TLR Triagonist Adjuvants to Generate Protective Immune Responses against Coxiella burnetii. J Immunol (2020) 204(3):611–21. doi: 10.4049/jimmunol.1900991
26. Williams-Macdonald SE, Mitchell M, Frew D, Palarea-Albaladejo J, Ewing D, Golde WT, et al. Efficacy of phase I and phase II Coxiella burnetii bacterin vaccines in a pregnant ewe challenge model. Vaccines (2023) 11(3):511. doi: 10.3390/vaccines11030511
27. Kermode M, Yong K, Hurley S, Marmion B. An economic evaluation of increased uptake in Q fever vaccination among meat and agricultural industry workers following implementation of the National Q Fever Management Program. Aust N Z J Public Health (2003) 27(4):390–8. doi: 10.1111/j.1467-842X.2003.tb00415.x
28. Long CM, Beare PA, Cockrell DC, Fintzi J, Tesfamariam M, Shaia CI, et al. Contributions of lipopolysaccharide and the type IVB secretion system to Coxiella burnetii vaccine efficacy and reactogenicity. NPJ Vaccines (2021) 6(1):38. doi: 10.1038/s41541-021-00296-6
29. Ruiz S, Wolfe DN. Vaccination against Q fever for biodefense and public health indications. Front Microbiol (2014) 5:726. doi: 10.3389/fmicb.2014.00726
30. Schulze LS, Borchardt S, Ouellet V, Heuwieser W. Effect of a phase I Coxiella burnetii inactivated vaccine on body temperature and milk yield in dairy cows. J Dairy Sci (2016) 99(1):541–50. doi: 10.3168/jds.2015-9628
31. Williams JC, Peacock MG, Waag DM, Kent G, England MJ, Nelson G, et al. Vaccines against coxiellosis and Q fever. Development of a chloroform:methanol residue subunit of phase I Coxiella burnetti for the immunization of animals. Ann N Y Acad Sci (1992) 653:88–111. doi: 10.1111/j.1749-6632.1992.tb19633.x
32. Waag DM, England MJ, Pitt ML. Comparative efficacy of a Coxiella burnetii chloroform:methanol residue (CMR) vaccine and a licensed cellular vaccine (Q-Vax) in rodents challenged by aerosol. Vaccine (1997) 15(16):1779–83. doi: 10.1016/S0264-410X(97)00107-2
33. Waag DM, England MJ, Tammariello RF, Byrne WR, Gibbs P, Banfield CM, et al. Comparative efficacy and immunogenicity of Q fever chloroform:methanol residue (CMR) and phase I cellular (Q-Vax) vaccines in cynomolgus monkeys challenged by aerosol. Vaccine (2002) 20(19-20):2623–34. doi: 10.1016/s0264-410x(02)00176-7
34. Zhang G, Peng Y, Schoenlaub L, Elliott A, Mitchell W, Zhang Y. Formalin-inactivated Coxiella burnetii phase I vaccine-induced protection depends on B cells to produce protective IgM and IgG. Infect Immun (2013) 81(6):2112–22. doi: 10.1128/IAI.00297-13
35. Zhang G, Russell-Lodrigue KE, Andoh M, Zhang Y, Hendrix LR, Samuel JE. Mechanisms of vaccine-induced protective immunity against Coxiella burnetii infection in BALB/c mice. J Immunol (2007) 179(12):8372–80. doi: 10.4049/jimmunol.179.12.8372
36. Chen C, Dow C, Wang P, Sidney J, Read A, Harmsen A, et al. Identification of CD4+ T cell epitopes in C. burnetii antigens targeted by antibody responses. PloS One (2011) 6(3):e17712. doi: 10.1371/journal.pone.0017712
37. Xiong X, Qi Y, Jiao J, Gong W, Duan C, Wen B. Exploratory study on Th1 epitope-induced protective immunity against Coxiella burnetii infection. PloS One (2014) 9(1):e87206. doi: 10.1371/journal.pone.0087206
38. Scholzen A, Richard G, Moise L, Baeten LA, Reeves PM, Martin WD, et al. Promiscuous Coxiella burnetii CD4 epitope clusters associated with human recall responses are candidates for a novel T-cell targeted multi-epitope Q fever vaccine. Front Immunol (2019) 10:207. doi: 10.3389/fimmu.2019.00207
39. Scholzen A, Richard G, Moise L, Hartman E, Bleeker-Rovers CP, Reeves PM, et al. Coxiella burnetii epitope-specific T-cell responses in patients with chronic Q fever. Infect Immun (2019) 87(10):e00213-19. doi: 10.1128/IAI.00213-19
40. Piel LMW, Durfee CJ, White SN. Proteome-wide analysis of Coxiella burnetii for conserved T-cell epitopes with presentation across multiple host species. BMC Bioinf (2021) 22(1):296. doi: 10.1186/s12859-021-04181-w
41. Jaydari A, Nazifi N, Forouharmehr A. Computational design of a novel multi-epitope vaccine against Coxiella burnetii. Hum Immunol (2020) 81(10-11):596–605. doi: 10.1016/j.humimm.2020.05.010
42. Zhang G, Kiss K, Seshadri R, Hendrix LR, Samuel JE. Identification and cloning of immunodominant antigens of Coxiella burnetii. Infect Immun (2004) 72(2):844–52. doi: 10.1128/IAI.72.2.844-852.2004
43. Deringer JR, Chen C, Samuel JE, Brown WC. Immunoreactive Coxiella burnetii Nine Mile proteins separated by 2D electrophoresis and identified by tandem mass spectrometry. Microbiol (Reading) (2011) 157(Pt 2):526–42. doi: 10.1099/mic.0.043513-0
44. Vigil A, Ortega R, Nakajima-Sasaki R, Pablo J, Molina DM, Chao CC, et al. Genome-wide profiling of humoral immune response to Coxiella burnetii infection by protein microarray. Proteomics (2010) 10(12):2259–69. doi: 10.1002/pmic.201000064
45. Wang X, Xiong X, Graves S, Stenos J, Wen B. Protein array of Coxiella burnetii probed with Q fever sera. Sci China Life Sci (2013) 56(5):453–9. doi: 10.1007/s11427-013-4472-6
46. Beare PA, Chen C, Bouman T, Pablo J, Unal B, Cockrell DC, et al. Candidate antigens for Q fever serodiagnosis revealed by immunoscreening of a Coxiella burnetii protein microarray. Clin Vaccine Immunol (2008) 15(12):1771–9. doi: 10.1128/CVI.00300-08
47. Hendrix LR, Chen C. Antigenic analysis for vaccines and diagnostics. Adv Exp Med Biol (2012) 984:299–328. doi: 10.1007/978-94-007-4315-1_16
48. Hansen CS, Osterbye T, Marcatili P, Lund O, Buus S, Nielsen M. ArrayPitope: automated analysis of amino acid substitutions for peptide microarray-based antibody epitope mapping. PloS One (2017) 12(1):e0168453. doi: 10.1371/journal.pone.0168453
49. Lo KC, Sullivan E, Bannen RM, Jin H, Rowe M, Li H, et al. Comprehensive profiling of the rheumatoid arthritis antibody repertoire. Arthritis Rheumatol (2020) 72(2):242–50. doi: 10.1002/art.41089
50. Buus S, Rockberg J, Forsstrom B, Nilsson P, Uhlen M, Schafer-Nielsen C. High-resolution mapping of linear antibody epitopes using ultrahigh-density peptide microarrays. Mol Cell Proteomics (2012) 11(12):1790–800. doi: 10.1074/mcp.M112.020800
51. Koets AP, van den Esker MH, Riepema K, Bakker D. The role of phosphatidylinositol mannosides in the serological diagnosis of mycobacterial infections. Vet Sci (2019) 6(4):91. doi: 10.3390/vetsci6040091
52. Agerholm JS, Jensen TK, Agger JF, Engelsma MY, Roest HI. Presence of Coxiella burnetii DNA in inflamed bovine cardiac valves. BMC Vet Res (2017) 13(1):69. doi: 10.1186/s12917-017-0988-5
53. Roest H-J, van Gelderen B, Dinkla A, Frangoulidis D, van Zijderveld F, Rebel J, et al. Q fever in pregnant goats: pathogenesis and excretion of Coxiella burnetii. PloS One (2012) 7(11):e48949. doi: 10.1371/journal.pone.0048949
54. Baliu-Pique M, Kurniawan H, Ravesloot L, Verheij MW, Drylewicz J, Lievaart-Peterson K, et al. Age-related distribution and dynamics of T-cells in blood and lymphoid tissues of goats. Dev Comp Immunol (2019) 93:1–10. doi: 10.1016/j.dci.2018.12.004
55. Koets A, Ravesloot L, Ruuls R, Dinkla A, Eisenberg S, Lievaart-Peterson K. Effects of Age and Environment on Adaptive Immune Responses to Mycobacterium avium subsp. paratuberculosis (MAP) Vaccination in Dairy Goats in Relation to Paratuberculosis Control Strategies. Vet Sci (2019) 6(3):62. doi: 10.3390/vetsci6030062
56. Schoffelen T, Ammerdorffer A, Hagenaars JC, Bleeker-Rovers CP, Wegdam-Blans MC, Wever PC, et al. Genetic variation in pattern recognition receptors and adaptor proteins associated with development of chronic Q fever. J Infect Dis (2015) 212(5):818–29. doi: 10.1093/infdis/jiv113
57. Wegdam-Blans MC, Kampschreur LM, Delsing CE, Bleeker-Rovers CP, Sprong T, van Kasteren ME, et al. Chronic Q fever: review of the literature and a proposal of new diagnostic criteria. J Infect (2012) 64(3):247–59. doi: 10.1016/j.jinf.2011.12.014
58. Afgan E, Baker D, van den Beek M, Blankenberg D, Bouvier D, Cech M, et al. The Galaxy platform for accessible, reproducible and collaborative biomedical analyses: 2016 update. Nucleic Acids Res (2016) 44(W1):W3–W10. doi: 10.1093/nar/gkw343
59. Seemann T. Prokka: rapid prokaryotic genome annotation. Bioinformatics (2014) 30(14):2068–9. doi: 10.1093/bioinformatics/btu153
60. Sonnhammer EL, von Heijne G, Krogh A. A hidden Markov model for predicting transmembrane helices in protein sequences. Proc Int Conf Intell Syst Mol Biol (1998) 6(1553-0833(1553-0833 (Print):175–82.
61. Yu NY, Wagner JR, Laird MR, Melli G, Rey S, Lo R, et al. PSORTb 3.0: improved protein subcellular localization prediction with refined localization subcategories and predictive capabilities for all prokaryotes. Bioinformatics (2010) 26(13):1608–15. doi: 10.1093/bioinformatics/btq249
63. Lawrence M, Huber W, Pagès H, Aboyoun P, Carlson M, Gentleman R, et al. Software for computing and annotating genomic ranges. PLoS Comput Biol (2013) 9(8):e1003118. doi: 10.1371/journal.pcbi.1003118
66. Thomas PD, Ebert D, Muruganujan A, Mushayahama T, Albou LP, Mi H. PANTHER: Making genome-scale phylogenetics accessible to all. Protein Sci (2022) 31(1):8–22. doi: 10.1002/pro.4218
67. Sekeyova Z, Kowalczewska M, Vincentelli R, Decloquement P, Flores-Ramirez G, Skultety L, et al. Characterization of antigens for Q fever serodiagnostics. Acta Virol (2010) 54(3):173–80. doi: 10.4149/av_2010_03_173
68. Xiong X, Wang X, Wen B, Graves S, Stenos J. Potential serodiagnostic markers for Q fever identified in Coxiella burnetii by immunoproteomic and protein microarray approaches. BMC Microbiol (2012) 12:35. doi: 10.1186/1471-2180-12-35
69. Miller HK, Kersh GJ. Analysis of recombinant proteins for Q fever diagnostics. Sci Rep (2020) 10(1):20934. doi: 10.1038/s41598-020-77343-0
70. Jeske R, Dangel L, Sauerbrey L, Frangoulidis D, Teras LR, Fischer SF, et al. Development of High-Throughput Multiplex Serology to Detect Serum Antibodies against Coxiella burnetii. Microorganisms (2021) 9(11):2373. doi: 10.3390/microorganisms9112373
71. Jiao J, Xiong X, Qi Y, Gong W, Duan C, Yang X, et al. Serological characterization of surface-exposed proteins of Coxiella burnetii. Microbiol (Reading) (2014) 160(Pt 12):2718–31. doi: 10.1099/mic.0.082131-0
72. Keasey SL, Schmid KE, Lee MS, Meegan J, Tomas P, Minto M, et al. Extensive antibody cross-reactivity among infectious gram-negative bacteria revealed by proteome microarray analysis. Mol Cell Proteomics (2009) 8(5):924–35. doi: 10.1074/mcp.M800213-MCP200
73. Ricci AD, Bracco L, Salas-Sarduy E, Ramsey JM, Nolan MS, Lynn MK, et al. The Trypanosoma cruzi Antigen and Epitope Atlas: antibody specificities in Chagas disease patients across the Americas. Nat Commun (2023) 14(1):1850. doi: 10.1038/s41467-023-37522-9
74. Gerlach C, Skultety L, Henning K, Neubauer H, Mertens K. Coxiella burnetii immunogenic proteins as a basis for new Q fever diagnostic and vaccine development. Acta Virol (2017) 61(3):377–90. doi: 10.4149/av_2017_320
75. Stellfeld M, Gerlach C, Richter IG, Miethe P, Fahlbusch D, Polley B, et al. Evaluation of the diagnostic potential of recombinant Coxiella burnetii com1 in an ELISA for the diagnosis of Q fever in sheep, goats and cattle. Microorganisms (2020) 8(8). doi: 10.3390/microorganisms8081235
76. Hotta A, Zhang GQ, Andoh M, Yamaguchi T, Fukushi H, Hirai K. Use of monoclonal antibodies for analyses of Coxiella burnetii major antigens. J Vet Med Sci (2004) 66(10):1289–91. doi: 10.1292/jvms.66.1289
77. Papadioti A, Markoutsa S, Vranakis I, Tselentis Y, Karas M, Psaroulaki A, et al. A proteomic approach to investigate the differential antigenic profile of two Coxiella burnetii strains. J Proteomics (2011) 74(7):1150–9. doi: 10.1016/j.jprot.2011.04.016
78. Ashburner M, Ball CA, Blake JA, Botstein D, Butler H, Cherry JM, et al. Gene ontology: tool for the unification of biology. Gene Ontology Consortium Nat Genet (2000) 25(1):25–9. doi: 10.1038/75556
79. Gene Ontology C. The Gene Ontology resource: enriching a GOld mine. Nucleic Acids Res (2021) 49(D1):D325–D34. doi: 10.1093/nar/gkaa1113
80. UniProt C. UniProt: the universal protein knowledgebase in 2021. Nucleic Acids Res (2021) 49(D1):D480–D9. doi: 10.1093/nar/gkaa1100
81. Flores-Ramirez G, Jankovicova B, Bilkova Z, Miernyk JA, Skultety L. Identification of Coxiella burnetii surface-exposed and cell envelope associated proteins using a combined bioinformatics plus proteomics strategy. Proteomics (2014) 14(16):1868–81. doi: 10.1002/pmic.201300338
82. Xiong X, Jiao J, Gregory AE, Wang P, Bi Y, Wang X, et al. Identification of Coxiella burnetii CD8+ T-Cell Epitopes and Delivery by Attenuated Listeria monocytogenes as a Vaccine Vector in a C57BL/6 Mouse Model. J Infect Dis (2017) 215(10):1580–9. doi: 10.1093/infdis/jiw470
83. Xiong X, Meng Y, Wang X, Qi Y, Li J, Duan C, et al. Mice immunized with bone marrow-derived dendritic cells stimulated with recombinant Coxiella burnetii Com1 and Mip demonstrate enhanced bacterial clearance in association with a Th1 immune response. Vaccine (2012) 30(48):6809–15. doi: 10.1016/j.vaccine.2012.09.017
84. Ferrara G, Colitti B, Pagnini U, Iovane G, Rosati S, Montagnaro S. Characterization of recombinant Ybgf protein for the detection of Coxiella antibodies in ruminants. J Vet Diagn Invest (2022) 34(4):646–53. doi: 10.1177/10406387221093581
Keywords: Coxiella burnetii, Q fever, peptide microarray, B cell epitope mapping, vaccination, serodiagnostic
Citation: Bach E, Fitzgerald SF, Williams-MacDonald SE, Mitchell M, Golde WT, Longbottom D, Nisbet AJ, Dinkla A, Sullivan E, Pinapati RS, Tan JC, Joosten LAB, Roest H-J, Østerbye T, Koets AP, Buus S and McNeilly TN (2023) Genome-wide epitope mapping across multiple host species reveals significant diversity in antibody responses to Coxiella burnetii vaccination and infection. Front. Immunol. 14:1257722. doi: 10.3389/fimmu.2023.1257722
Received: 12 July 2023; Accepted: 19 September 2023;
Published: 26 October 2023.
Edited by:
Jochen Mattner, University of Erlangen Nuremberg, GermanyReviewed by:
Muhammad Suleman, University of Veterinary and Animal Sciences, PakistanErin J. Van Schaik, Texas A and M University, United States
Susan Noh, United States Department of Agriculture, United States
Carrie Mae Long, National Institute of Allergy and Infectious Diseases (NIH), United States
Copyright © 2023 Bach, Fitzgerald, Williams-MacDonald, Mitchell, Golde, Longbottom, Nisbet, Dinkla, Sullivan, Pinapati, Tan, Joosten, Roest, Østerbye, Koets, Buus and McNeilly. This is an open-access article distributed under the terms of the Creative Commons Attribution License (CC BY). The use, distribution or reproduction in other forums is permitted, provided the original author(s) and the copyright owner(s) are credited and that the original publication in this journal is cited, in accordance with accepted academic practice. No use, distribution or reproduction is permitted which does not comply with these terms.
*Correspondence: Tom N. McNeilly, dG9tLm1jbmVpbGx5QG1vcmVkdW4uYWMudWs=