 Arduino A. Mangoni
 Angelo Zinellu
- 1Discipline of Clinical Pharmacology, College of Medicine and Public Health, Flinders University, Adelaide, SA, Australia
- 2Department of Clinical Pharmacology, Flinders Medical Centre, Southern Adelaide Local Health Network, Adelaide, SA, Australia
- 3Department of Biomedical Sciences, University of Sassari, Sassari, Italy
There is an increasing interest in the pathophysiological role of the kynurenine pathway of tryptophan metabolism in the regulation of immune function and inflammation. We sought to address the link between this pathway and the presence rheumatic diseases (RD) by conducting a systematic review and meta-analysis of studies reporting the plasma or serum concentrations of tryptophan, kynurenine, and other relevant metabolites in RD patients and healthy controls. We searched electronic databases for relevant articles published between inception and the 30th of June 2023. Risk of bias and certainty of evidence were assessed using the Joanna Briggs Institute Critical Appraisal Checklist and the Grades of Recommendation, Assessment, Development and Evaluation Working Group system. In 24 studies selected for analysis, compared to controls, RD patients had significantly lower tryptophan (standard mean difference, SMD= -0.71, 95% CI -1.03 to -0.39, p<0.001; I2 = 93.6%, p<0.001; low certainty of evidence), and higher kynurenine (SMD=0.69, 95% CI 0.35 to 1.02, p<0.001; I2 = 93.2%, p<0.001; low certainty), kynurenine to tryptophan ratios (SMD=0.88, 95% CI 0.55 to 1.21, p<0.001; I2 = 92.9%, p<0.001; moderate certainty), 3-hydroxykynurenine (SMD=0.74, 95% CI 0.30 to 1.18, p=0.001; I2 = 87.7%, p<0.001; extremely low certainty), and quinolinic acid concentrations (SMD=0.71, 95% CI 0.31 to 1.11, p<0.001; I2 = 88.1%, p<0.001; extremely low certainty). By contrast, there were non-significant between-group differences in kynurenic acid, 3-hydroxyanthranilic acid, kynurenic acid to kynurenine ratio, or quinolinic acid to kynurenine acid ratio. In meta-regression, the SMD of tryptophan, kynurenine, and kynurenine to tryptophan ratio were not associated with age, publication year, sample size, RD duration, C-reactive protein, or use of anti-rheumatic drugs and corticosteroids. In subgroup analysis, the SMD of tryptophan, kynurenine, and kynurenine to tryptophan ratio was significant across different types of RD, barring rheumatoid arthritis. Therefore, we have observed significant alterations in tryptophan, kynurenine, 3-hydroxykynurenine, and quinolinic acid concentrations in RD patients. Further research is warranted to determine whether these biomarkers can be useful for diagnosis and management in this patient group. (PROSPERO registration number: CRD CRD42023443718).
Systematic review registration: https://www.crd.york.ac.uk/prospero, identifier CRD CRD42023443718.
Introduction
The kynurenine pathway is responsible for approximately 95% of the metabolism of the essential amino acid tryptophan (Figure 1) (1). While the majority (90%) of physiological tryptophan degradation through this pathway occurs in the liver, the extra-hepatic kynurenine pathway plays a relatively greater role in states of immune activation (2). The main roles of the kynurenine pathway include the regulation of tryptophan availability for the synthesis of serotonin in the central nervous system, and the synthesis of heme, nicotinic acid, oxidized nicotinamide adenine dinucleotide (phosphate), NAD+(P+), and its reduced form NAD(P)H (3). There has been an increasing interest, particularly over the last three decades, in the biological and pathophysiological role of the kynurenine pathway. Several studies have reported that a) local and systemic alterations in kynurenine metabolites, e.g., tryptophan and kynurenine, resulting from changes in enzyme expression and/or activity suggest the presence of conditions such as cancer, immune diseases, and neuropsychiatric disorders, and b) individual kynurenine metabolites, e.g., kynurenic acid, 3-hydroxyanthranilic acid, 3-hydroxykynurenine, and quinolinic acid, can directly influence various processes, including the redox state, immune function, glutamate neurotransmission in the central nervous system, and carbohydrate metabolism (3–8).
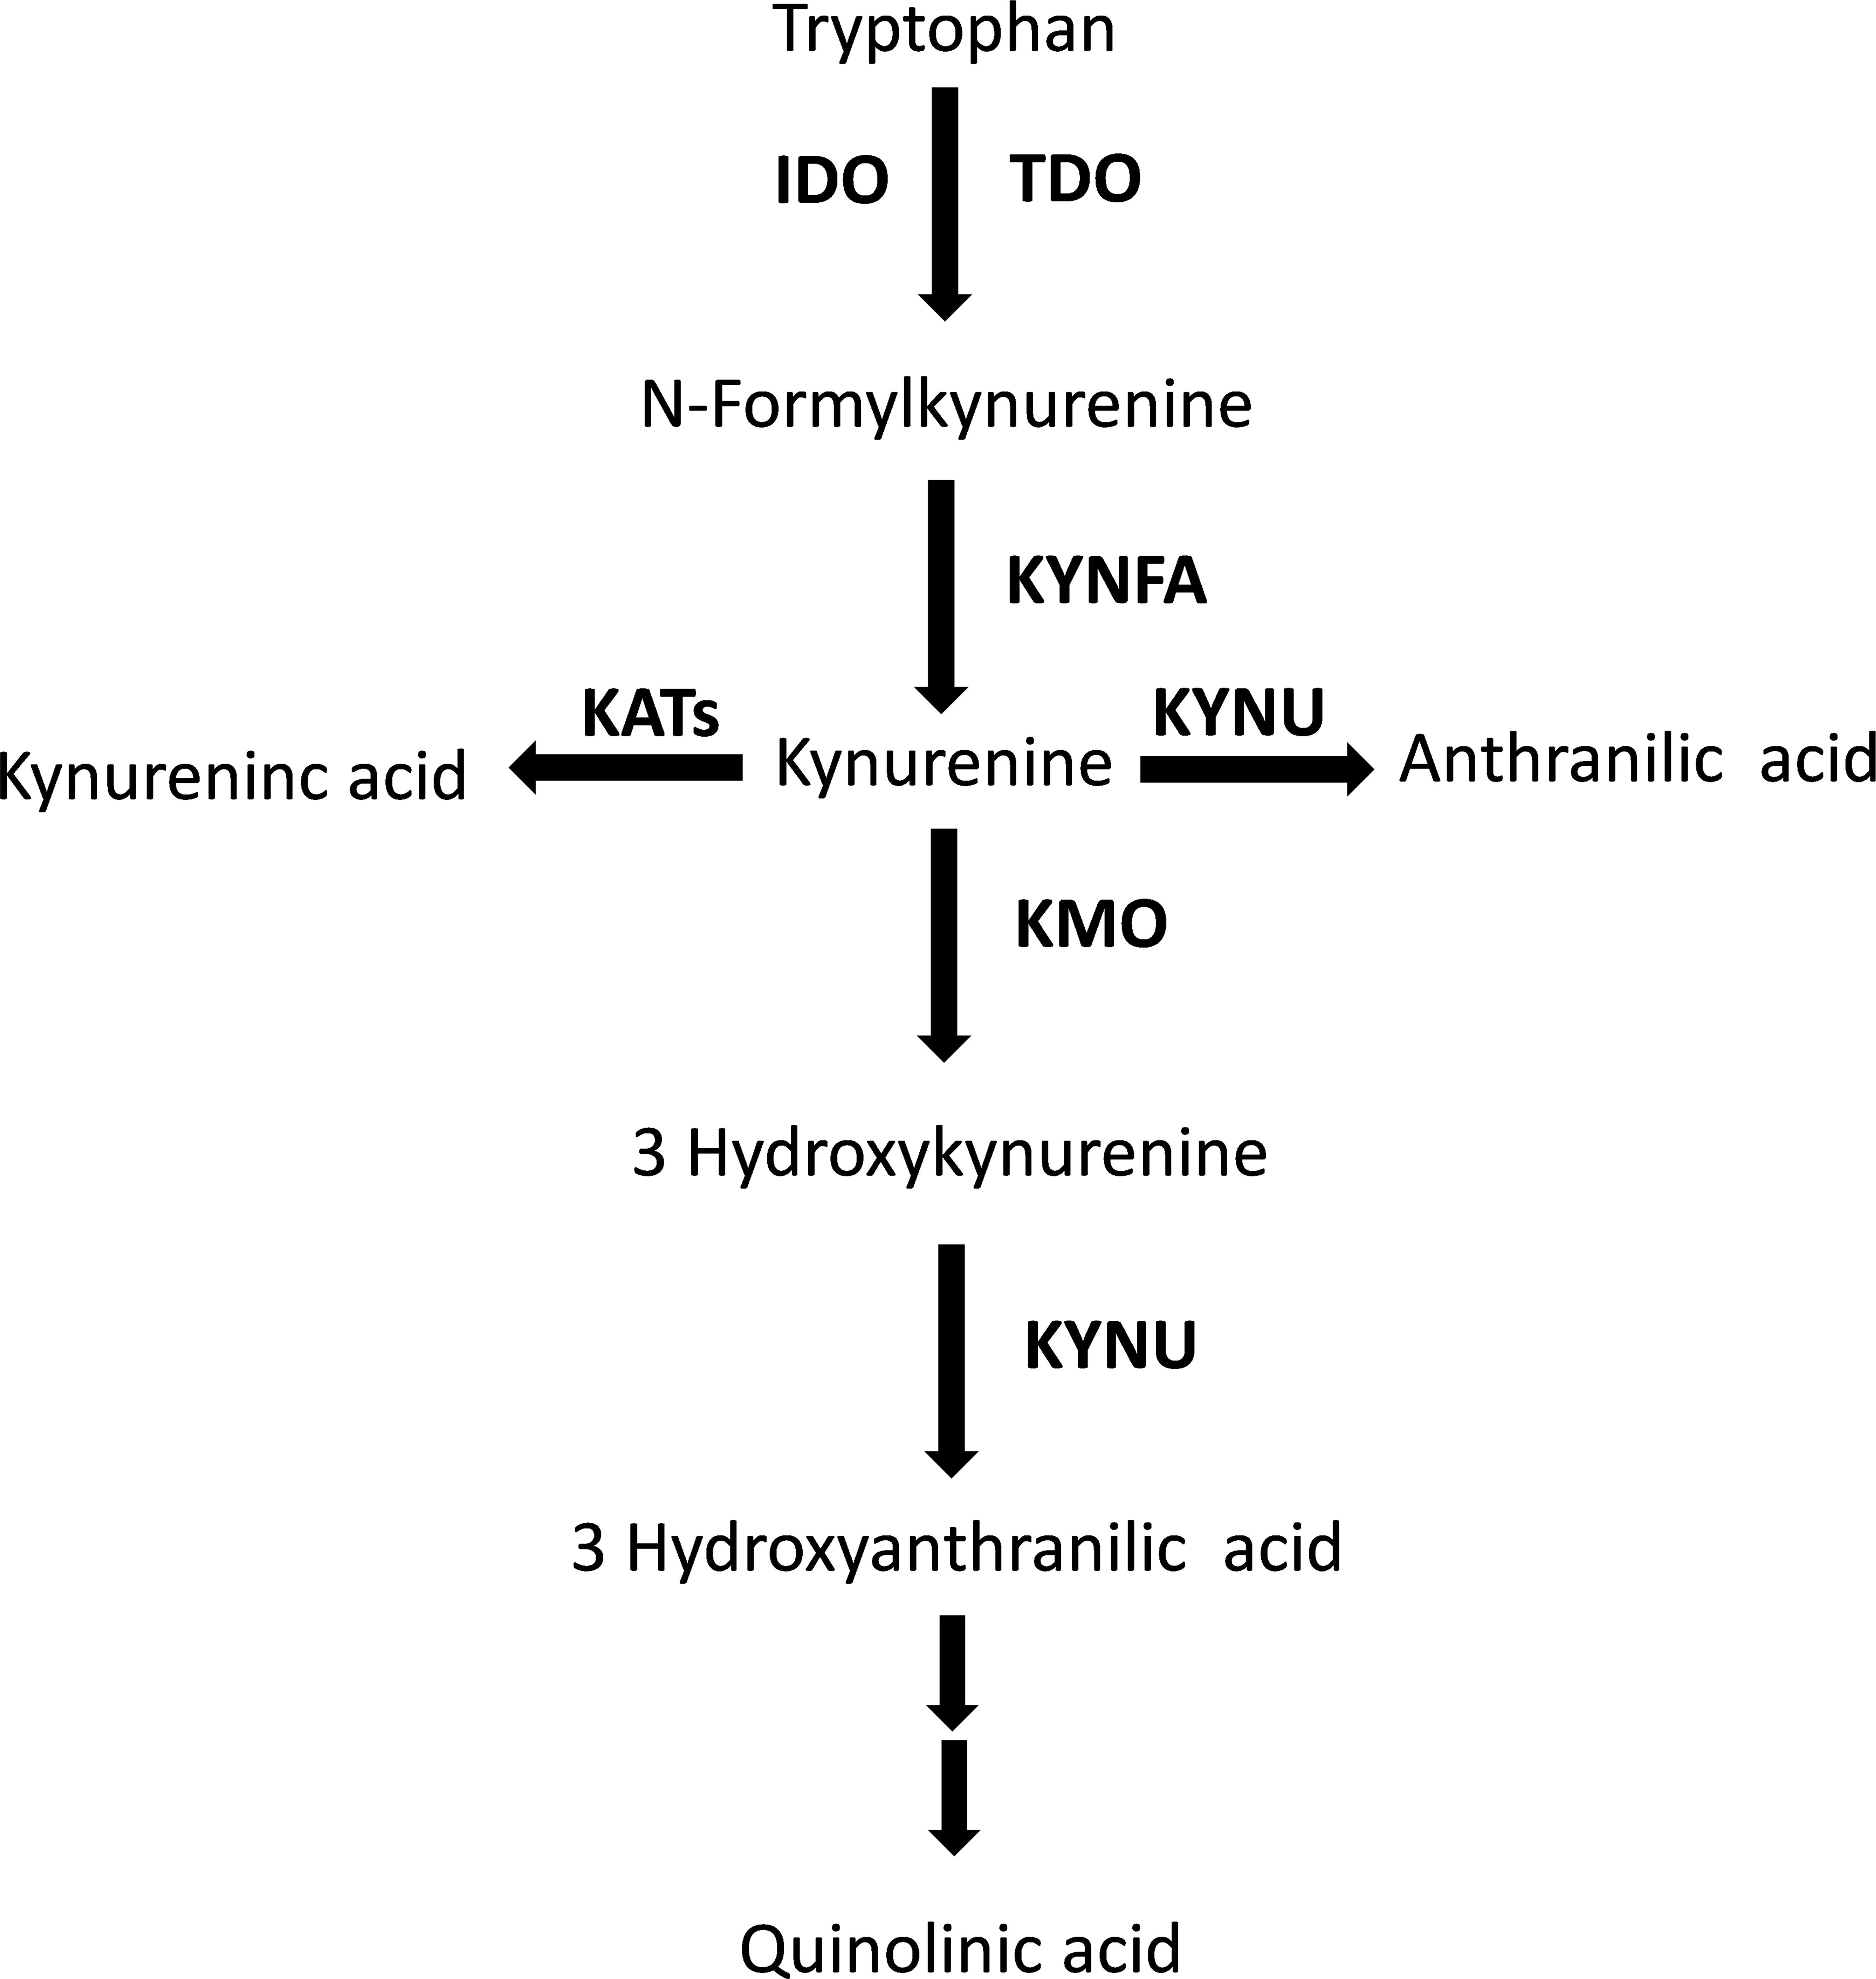
Figure 1 The tryptophan/kynurenine pathway. TDO, tryptophan 2,3-dioxygenase; IDO, indoleamine 2,3-dioxygenase; KYNFA, kynurenine formamidase; KATs, kynurenine aminotransferases; KMO, kynurenine 3-monooxygenase; KYNU, kynureninase.
The interplay between the kynurenine pathway, inflammation, and immunity has also stimulated research on the pathophysiological and clinical role of kynurenine metabolites in patients with rheumatic diseases (RD). RD is an umbrella term that includes various chronic systemic conditions affecting the musculoskeletal system with a predominantly autoimmune (e.g., systemic lupus erythematosus, SLE, rheumatoid arthritis, RA, Sjogren’s syndrome, SSj, systemic sclerosis, SSc, and progressive systemic sclerosis, pSS), mixed-autoimmune-autoinflammatory (e.g., psoriatic arthritis, PsA, ankylosing spondylitis, AS, axial spondylarthritis, axSpA, and Behcet’s disease, BD), or autoinflammatory component (e.g., familial Mediterranean fever, FMF) (9–11). Whilst significant progress has been made in the diagnosis and treatment of clinically overt RD, significant challenges remain with the identification of early forms of disease, which supports the search for novel RD biomarkers (12–14).
We sought to address these issues by conducting a systematic review and meta-analysis of published studies investigating the plasma or serum concentrations of metabolites within the kynurenine pathway (Figure 1) in patients with RD and healthy controls. We further investigated the presence of associations between the effect size of between-group differences in individual metabolites and a range of study and patient characteristics, particularly C-reactive protein, type of RD (autoimmune, mixed autoimmune-autoinflammatory, or autoinflammatory disease), and use of disease-modifying anti-rheumatic drugs (DMARDs) and corticosteroids.
Materials and methods
Search strategy and study selection
We systematically searched the electronic databases PubMed, Web of Science, and Scopus for relevant articles published from inception to the 30th of June 2023 using the following terms and their combination: “rheumatic diseases” OR “rheumatoid arthritis” OR “psoriatic arthritis” OR “ankylosing spondylitis” OR “systemic lupus erythematosus” OR “systemic sclerosis” OR “Sjogren’s syndrome” OR “connective tissue diseases” OR “vasculitis” OR “Behçet’s disease” AND “tryptophan” OR “kynuren*” OR “anthranil*” OR “xanthurenic” OR “cinnabar*” OR “picolinic” OR “quinolinic”. Two investigators independently screened each abstract and, if relevant, the full-text articles according to the following inclusion criteria: (i) assessment of tryptophan catabolites and/or their ratio in plasma or serum, (ii) comparison of participants with RD and healthy controls aged ≥18 years in case-control studies, and (iii) full-text articles available in English language. The references of each article were also searched for additional studies. A third investigator was involved in case of disagreement.
Two investigators independently extracted the following information from the selected manuscripts and transferred them to an electronic spreadsheet for further analysis: first author, year of publication, continent where the study was conducted, number of participants, male to female ratio, tryptophan, kynurenine, kynurenine to tryptophan ratio, kynurenic acid, 3-hydroxyanthranilic acid, 3-hydroxykynurenine, quinolinic acid, kynurenine acid to kynurenine ratio, quinolinic acid to kynurenine acid ratio, C-reactive protein (CRP), disease duration, type of RD (autoimmune: SLE, RA, SSj, SSc, pSS; mixed autoimmune-autoinflammatory: PsA, AS, axSpA, and BD; autoinflammatory: FMF), use of DMARDs and corticosteroids, matrix used for analysis (serum or plasma), and analytic method used for the measurement of individual metabolites.
We assessed the risk of bias with the Joanna Briggs Institute Critical Appraisal Checklist for analytical studies (15). Studies addressing ≥75%, ≥50% and <75%, and <50% of checklist items were considered as having low, moderate, and high risk, respectively. We also assessed the certainty of evidence using the Grades of Recommendation, Assessment, Development and Evaluation (GRADE) Working Group system (16). We complied with the Preferred Reporting Items for Systematic reviews and Meta-Analyses (PRISMA) 2020 statement (17), and registered our study in the International Prospective Register of Systematic Reviews (PROSPERO registration number: CRD CRD42023443718).
Statistical analysis
We generated forest plots of standardized mean differences (SMDs) and 95% confidence intervals (CIs) to assess for differences in serum or plasma concentrations of individual metabolites between RD patients and healthy controls (a p-value of less than 0.05 was considered statistically significant). Where necessary, means and standard deviations were extrapolated from medians and interquartile ranges or ranges, as previously reported (18, 19), or from graphs using the Graph Data Extractor software (San Diego, CA, USA). Heterogeneity of SMD across studies was assessed using the Q statistic (20, 21). The stability of the results of the meta-analysis was assessed in sensitivity analysis (22). The Begg’s and Egger’s tests and the “trim-and-fill” procedure were used to assess and eventually correct publication bias (23–25). Univariate meta-regression and subgroup analyses were conducted to investigate associations between the effect size and the following parameters: year of publication, study continent, number of participants, age, male to female ratio, CRP, disease duration, type of RD, use of DMARDs and corticosteroids, sample matrix (serum or plasma) and assay method used to measure analytes. Statistical analyses were performed using Stata 14 (Stata Corp., College Station, TX, USA).
Results
Screening process
A flow chart of the screening process is described in Figure 2. We initially identified 2,156 studies, of which 2,128 were excluded after the first screening because they were either duplicates or irrelevant. After full-text revision of the remaining 28 articles, two were further excluded because of missing data, one because it was not a case-control study, and one because it was conducted in participants <18 years of age. Thus, 24 studies were selected for analysis (Table 1) (26–49). The risk of bias, presented in Supplementary Table 3, was moderate in 14 studies (26–35, 37, 41, 44, 45, 47), and low in the remaining 10 (34, 36, 38–40, 42, 43, 46, 48, 49). The initial certainty of evidence was low for all studies (rating 2, ⊕⊕⊝⊝) given their cross-sectional design.
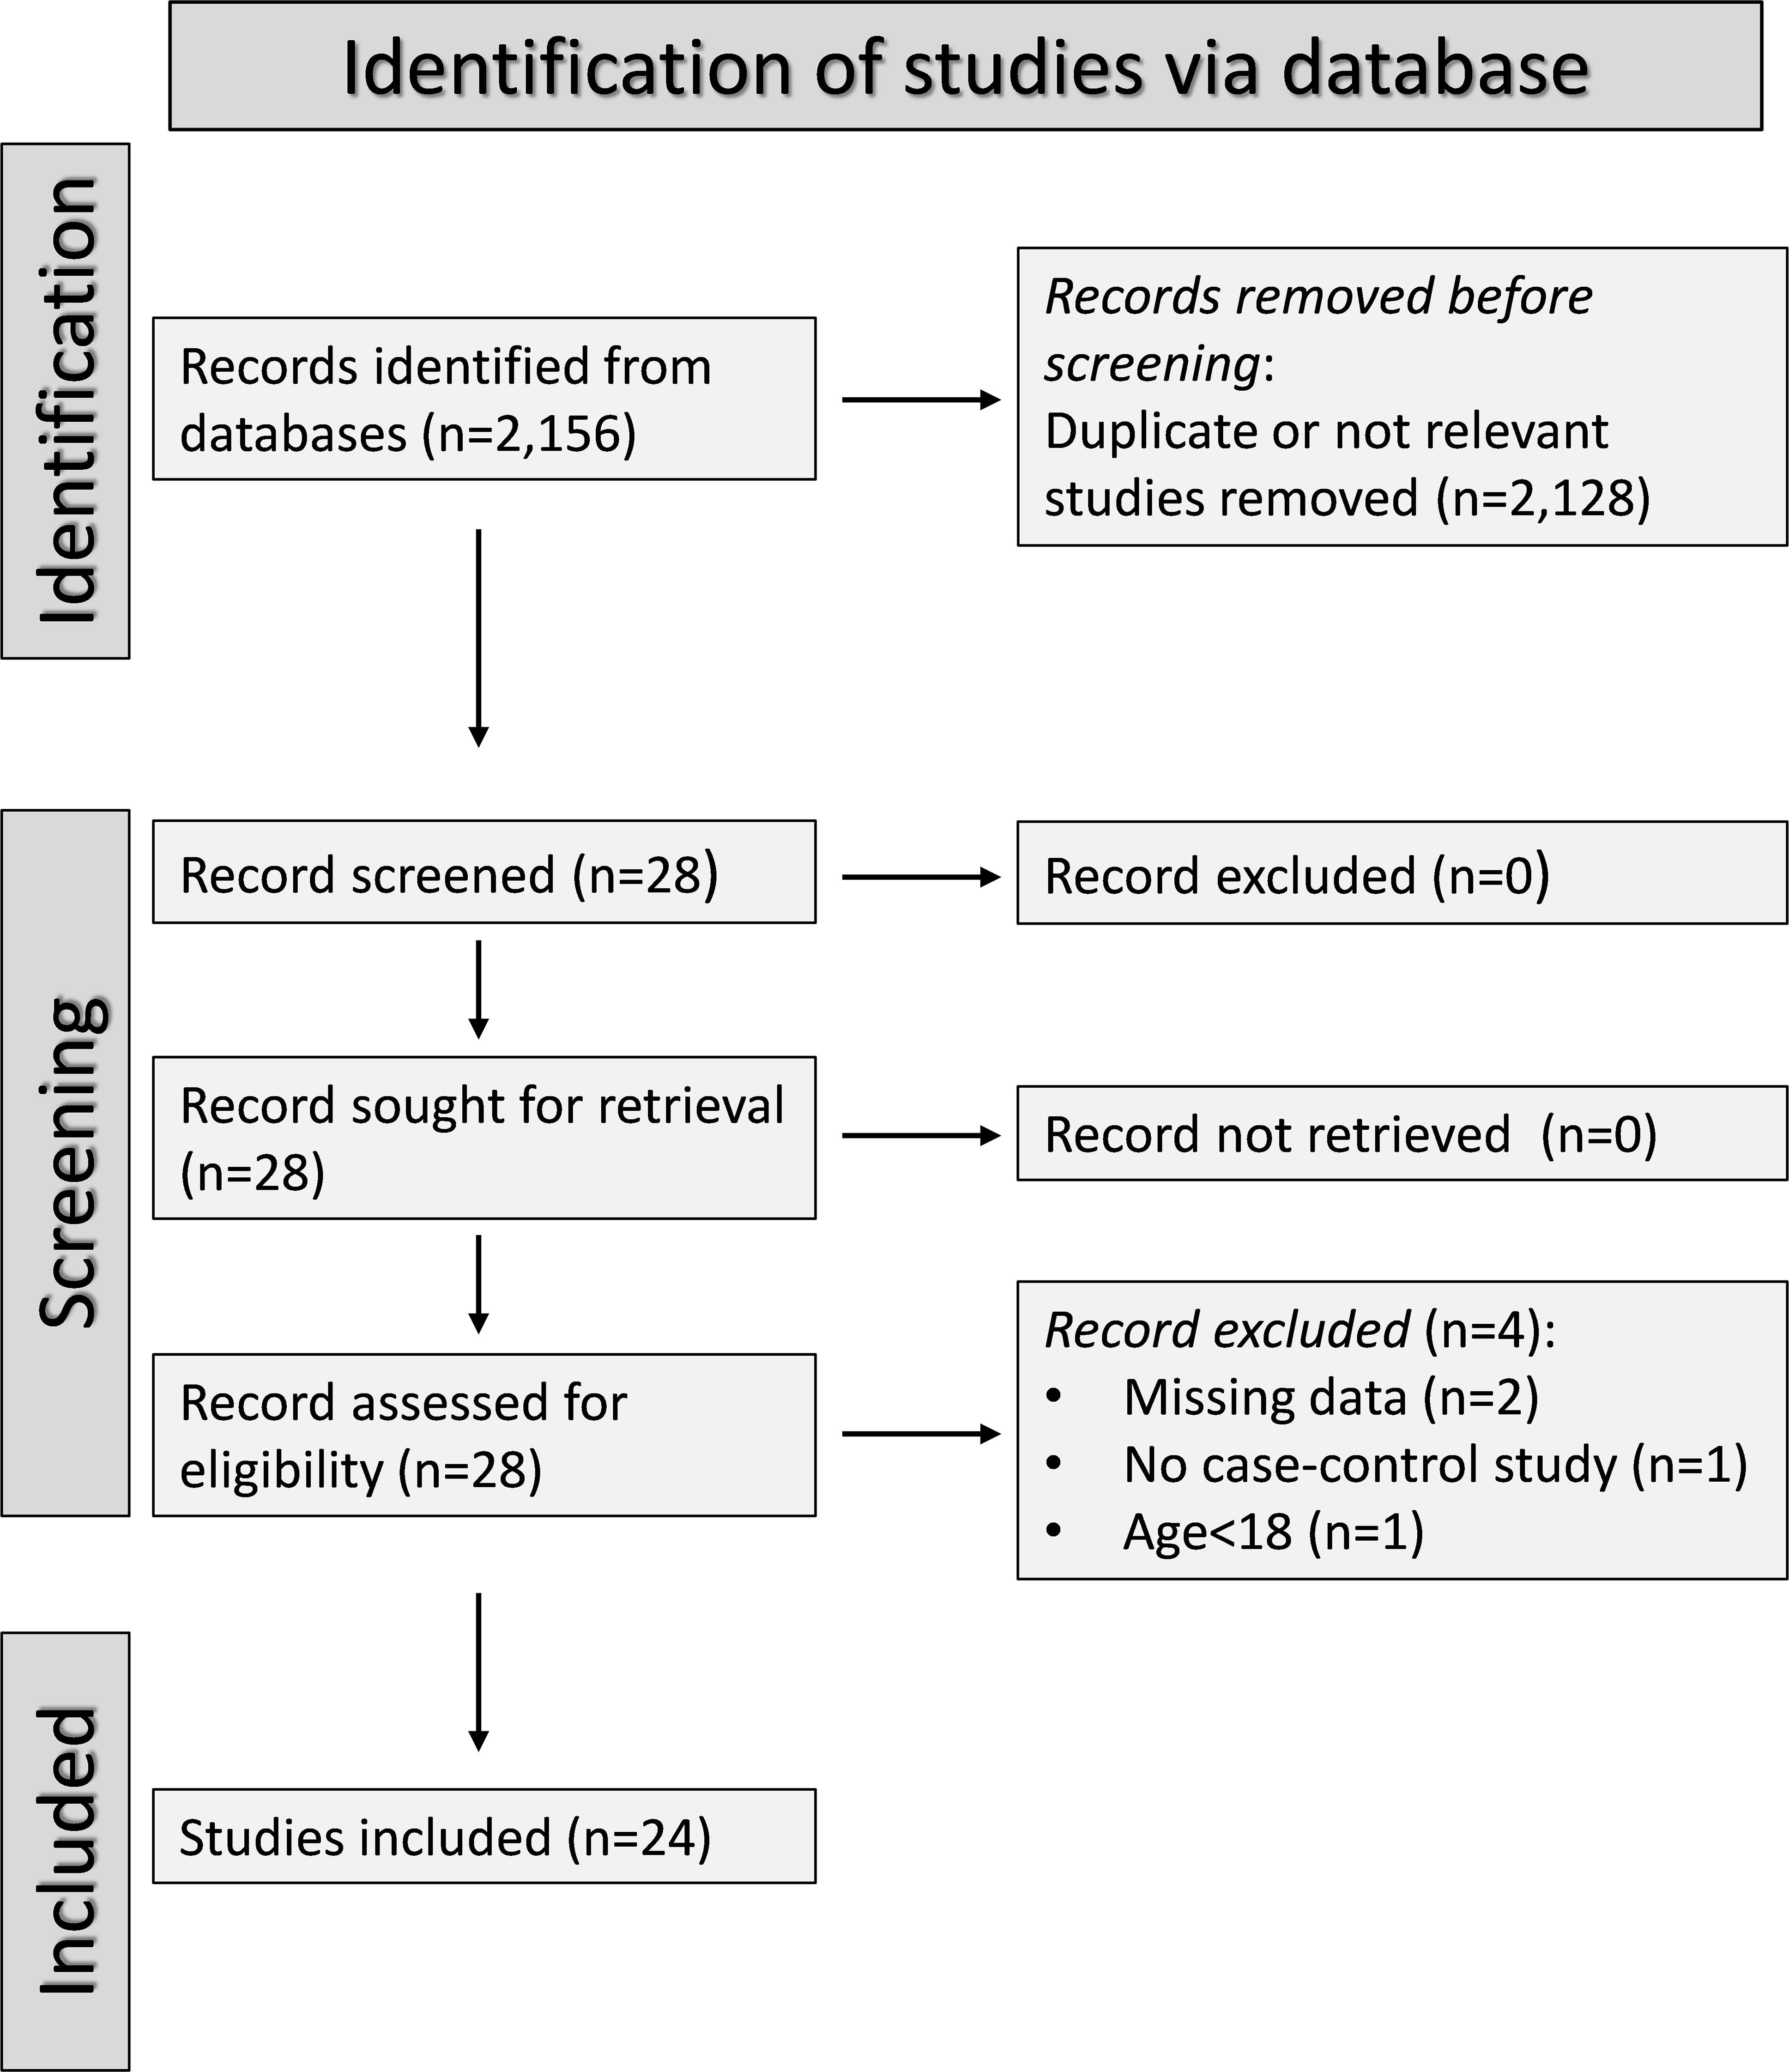
Figure 2 PRISMA 2020 flow chart of study selection.
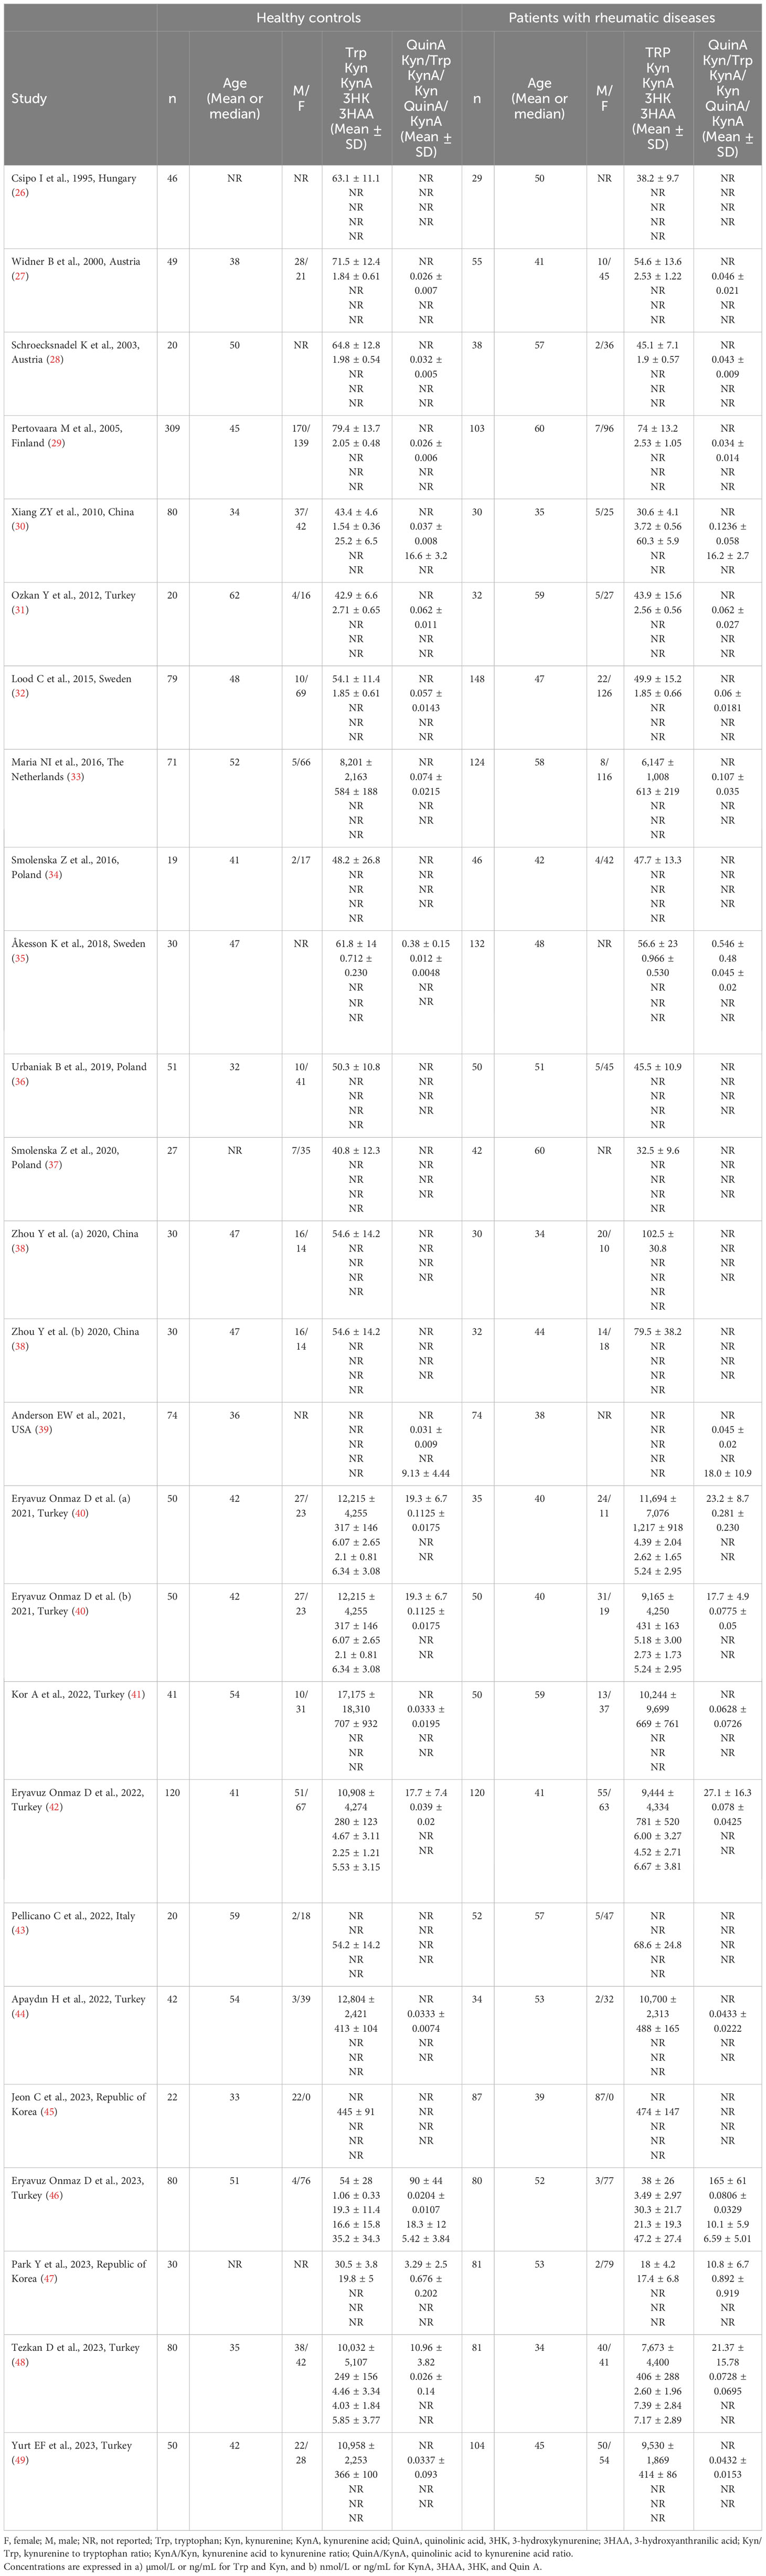
Table 1 Characteristics of the selected studies.
Tryptophan
We identified 21 studies (23 comparator groups) reporting tryptophan concentrations in a total of 1,526 RD patients (mean age 48 years, 24% males) and 1,404 healthy controls (mean age 43 years, 38% males; Table 1) (26–38, 40–42, 44, 46–49). Ten were conducted in Europe (26–29, 32–37), and 11 in Asia (30, 31, 38, 40–42, 44, 46–49). Six study groups included patients with RA (28, 31, 34, 36, 38, 41), five with pSS (29, 33, 44, 46, 47), four with SLE (27, 30, 32, 35), three with AS (38, 40), two with SSc (26, 37), and one with BD (42), FMF (48), and axSpA (49), respectively. Liquid chromatography was used in 21 study groups (27–38, 40–42, 44, 46, 48, 49), a spectrofluorimetric assay in one (26), and an enzyme-linked immunosorbent assay (ELISA) in the remaining one (47). Among the liquid chromatography-based assays, seven used fluorimetric detection (27–33), and the remaining 14 mass spectrometry (34–38, 40–42, 44, 46, 48, 49). Measurements were conducted in serum in 17 study groups (26–33, 36, 38, 40, 42, 46–48), and plasma in the remaining six (34, 35, 37, 41, 44, 49). The risk of bias (Supplementary Table 3) was moderate in 13 studies (26–33, 35, 37, 41, 44, 47), and low in the remaining eight (34, 36, 38, 40, 42, 46, 48, 49).
The forest plot showed that tryptophan concentrations were significantly lower in RD patients compared to controls (SMD=-0.71, 95% CI -1.03 to -0.39, p<0.001; I2 = 93.6%, p<0.001; Figure 3). The pooled SMD values were not influenced by individual studies (range between -0.82 and -0.61; Supplementary Figure 1). There was no publication bias (Begg’s test, p=0.32; Egger’s test, p=0.30). The “trim-and-fill” method did not identify any missing study to be added to the funnel plot to ensure symmetry (Supplementary Figure 2).
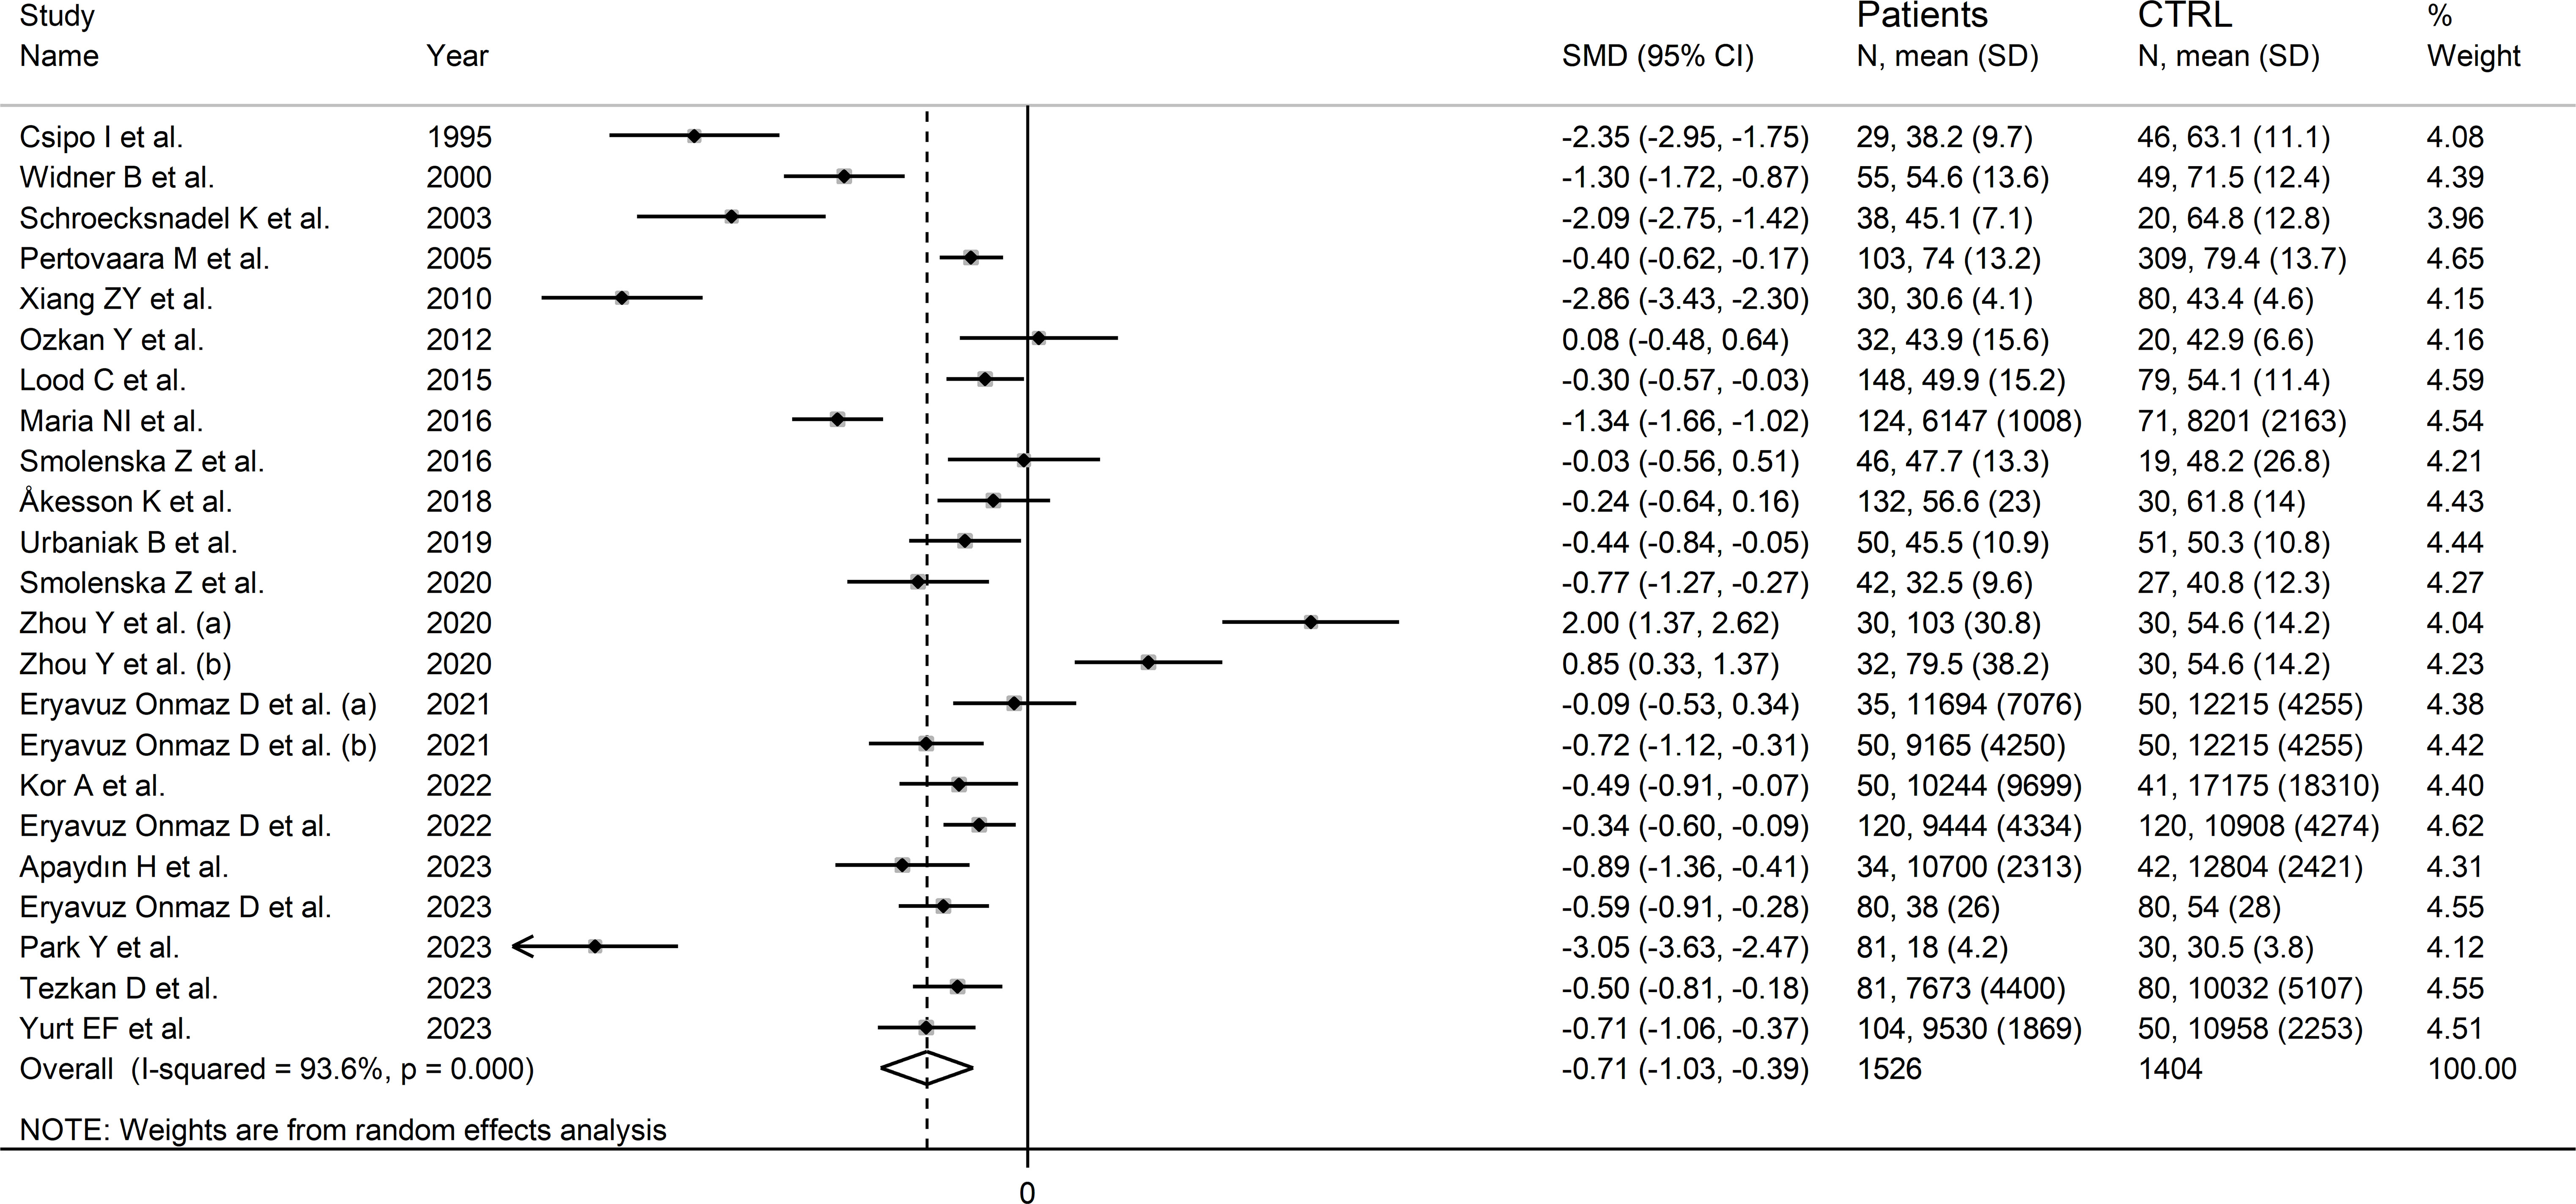
Figure 3 Forest plot of the standard mean differences in tryptophan concentrations between patients with rheumatic disease and healthy controls.
In meta-regression, there were non-significant associations between effect size and age (t=-1.60, p=0.13), publication year (t=1.89, p=0.07), sample size (t=0.04, p=0.97), RD duration (t=1.68, p=0.12), CRP (t=1.96, p=0.08), or use of DMARDs (t=0.72, p=0.49) and corticosteroids (t=-0.05, p=0.97). By contrast, the effect size was significantly associated with the (male/female RD patients)/(male/female controls) ratio (t=2.25, p=0.04).
In subgroup analysis, the pooled SMD was statistically significant in studies investigating pSS (SMD=-1.22, 95% CI -1.92 to -0.52, p<0.001; I2 = 95.1%, p<0.001), SLE (SMD=-1.15, 95% CI -2.15 to -0.15, p=0.02; I2 = 96.1%, p<0.001), and SSc patients (SMD=1.55, 95% CI -3.10 to -0.01, p=0.049; I2 = 93.6%, p<0.001), but not RA (SMD=-0.34, 95% CI -0.99 to 0.31, p=0.31; I2 = 90.1%, p<0.001), or AS patients (SMD=0.38, 95% CI -1.02 to 1.77, p=0.60; I2 = 96.1%, p<0.001; Figure 4). In addition, the pooled SMD was statistically significant in studies of patients with autoimmune disease (SMD=-0.93, 95% CI -1.92 to -0.52, p<0.001; I2 = 93.8%, p<0.001), but not mixed autoimmune-autoinflammatory disease (SMD=-0.01, 95% CI -0.69 to 0.66, p=0.97; I2 = 93.6%, p<0.001; Supplementary Figure 3). There were non-significant differences (p=0.46) in pooled SMD between European (SMD=-0.89, 95% CI -1.29 to -0.49, p<0.001; I2 = 90.7%, p<0.001) and Asian studies (SMD=-0.56, 95% CI -1.07 to -0.05, p=0.03; I2 = 95.0%, p<0.001). By contrast, there was a significant difference (p=0.006) between the pooled SMD of studies using liquid chromatography (SMD=-0.53, 95% CI -0.82 to -0.24, p<0.001; I2 = 91.6%, p<0.001) and other assays (SMD=-2.71, 95% CI -3.39 to -2.02, p<0.001; I2 = 62.6%, p=0.10) with a relatively lower heterogeneity in the latter subgroup. In addition, in studies using liquid chromatography the pooled SMD was statistically significant in those using fluorimetric detection (SMD=-1.15, 95% CI -1.77 to -0.53, p<0.001; I2 = 94.8%, p<0.001) but not in those using mass spectrometry detection (SMD=-0.24, 95% CI -0.54 to 0.05, p=0.10; I2 = 86.6%, p<0.001), and the difference between the effect sizes was also statistically significant (p=0.03). Finally, there were non-significant differences (p=0.63) in pooled SMD between studies investigating plasma (SMD=-0.53, 95% CI -0.78 to -0.28, p<0.001; I2 = 48.1%, p=0.09) and those investigating serum (SMD=-0.78, 95% CI -1.20 to -0.36, p<0.001; I2 = 93.6%, p<0.001), with a lower between-study variance in the former subgroup.
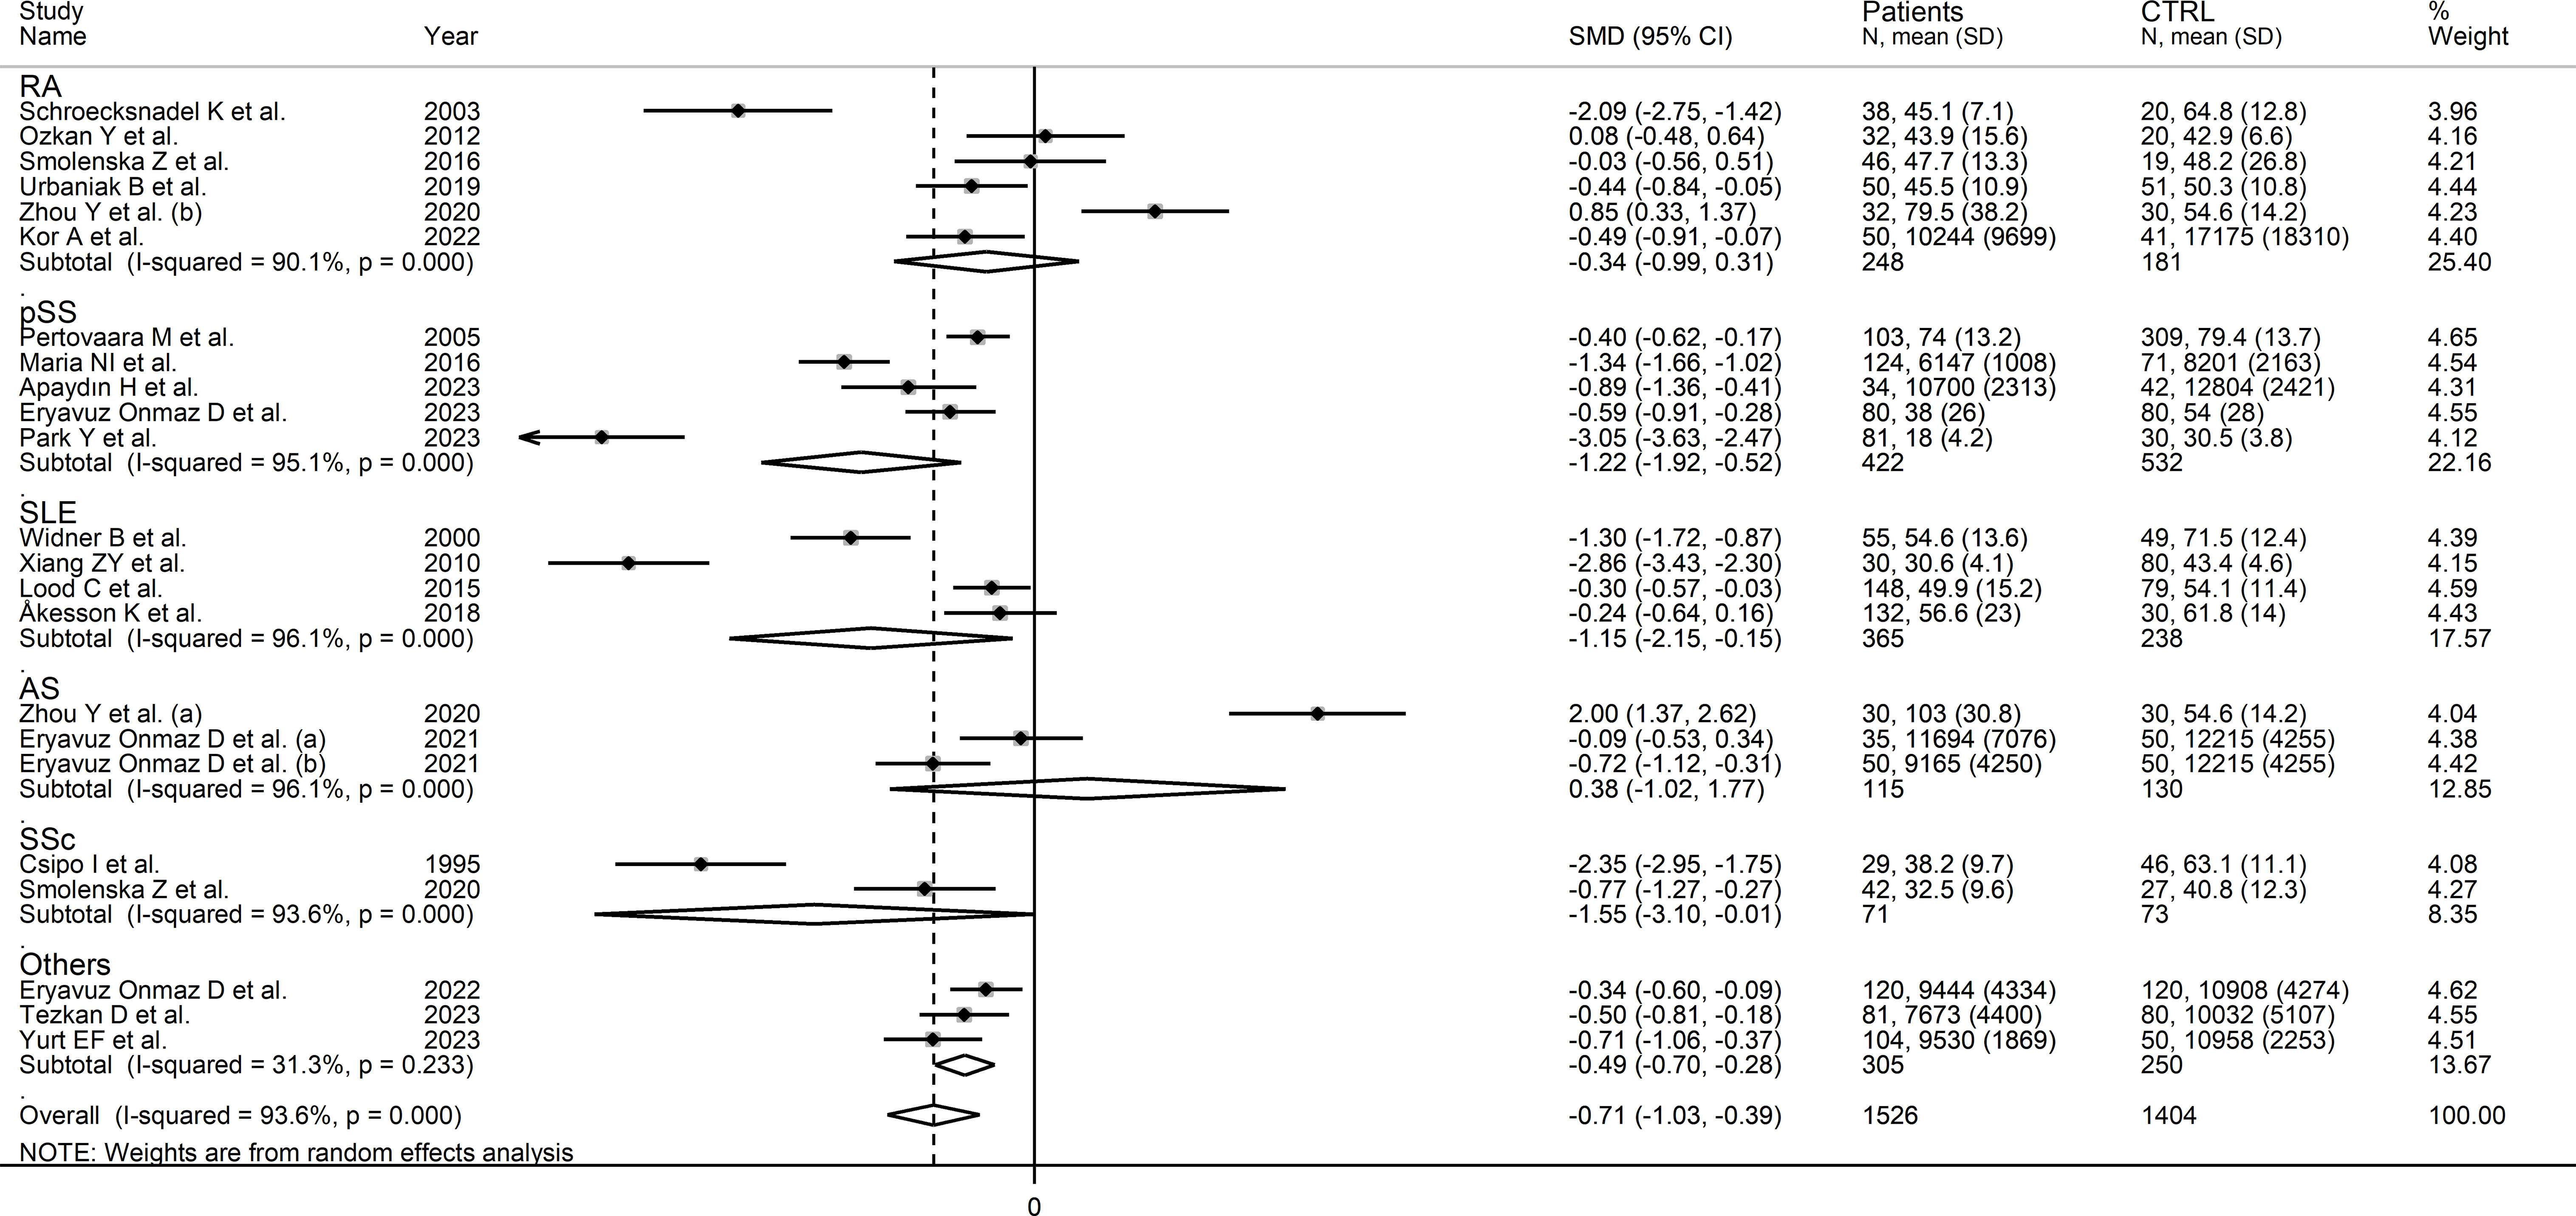
Figure 4 Forest plot of studies investigating tryptophan concentrations in patients and controls according to the type of rheumatic disease.
The certainty of evidence remained low (rating 2, ⊕⊕⊝⊝) after considering the low-moderate risk of bias in all studies (no rating change), the high but partly explainable heterogeneity (no rating change), the lack of indirectness (no rating change), the relatively low imprecision (confidence intervals not crossing the threshold, no rating change), the moderate effect size (SMD=-0.71, no rating change) (50), and the absence of publication bias (no rating change).
Kynurenine
Seventeen studies (18 comparator groups) investigated kynurenine concentrations in a total of 1,384 RD patients (mean age 48 years, 29% males) and 1,223 healthy controls (mean age 44 years, 40% males; Table 1) (27–33, 35, 40–42, 44–49). Eleven studies were conducted in Asia (30, 31, 40–42, 44–49), and six in Europe (27–29, 32, 33, 35). Five study groups included patients with pSS (29, 33, 44, 46, 47), four with SLE (27, 30, 32, 35), three with AS (40, 45), three with RA (28, 31, 41), and one with BD (42), FMF (48), and axSpA (49), respectively. Liquid chromatography was used in 15 study groups (27–33, 40–42, 44, 46, 48, 49), ELISA in two (45, 47), and gas chromatography in one (35). In liquid chromatography studies, seven used mass spectrometry (40–42, 44, 46, 48, 49), six ultraviolet (27–29, 31–33), and one fluorimetric detection (30). Kynurenine was measured in serum in 14 study groups (27–33, 40, 42, 45–48), and plasma in the remaining four (35, 41, 44, 49). The risk of bias (Supplementary Table 3) was moderate in 12 studies (27–33, 35, 41, 44, 45, 47), and low in the remaining five (40, 42, 46, 48, 49).
The forest plot showed that kynurenine concentrations were significantly higher in RD patients compared to healthy controls (SMD=0.69, 95% CI 0.35 to 1.02, p<0.001; I2 = 93.2%, p<0.001; Figure 5). Sensitivity analysis showed stability of the results as the effect size ranged between 0.48 and 0.75 (Supplementary Figure 4). There was no publication bias (Begg’s test, p=0.88; Egger’s test, p=0.46). Although the “trim-and-fill” method failed to identify missing studies to be added to the funnel plot to ensure symmetry (Supplementary Figure 5), it highlighted the distortive effects of the study of Xiang et al. (30). The removal of this study from the analysis attenuated the effect size (SMD=0.48, 95% CI 0.23 to 0.73, p=0.001; I2 = 87.3%, p<0.001).
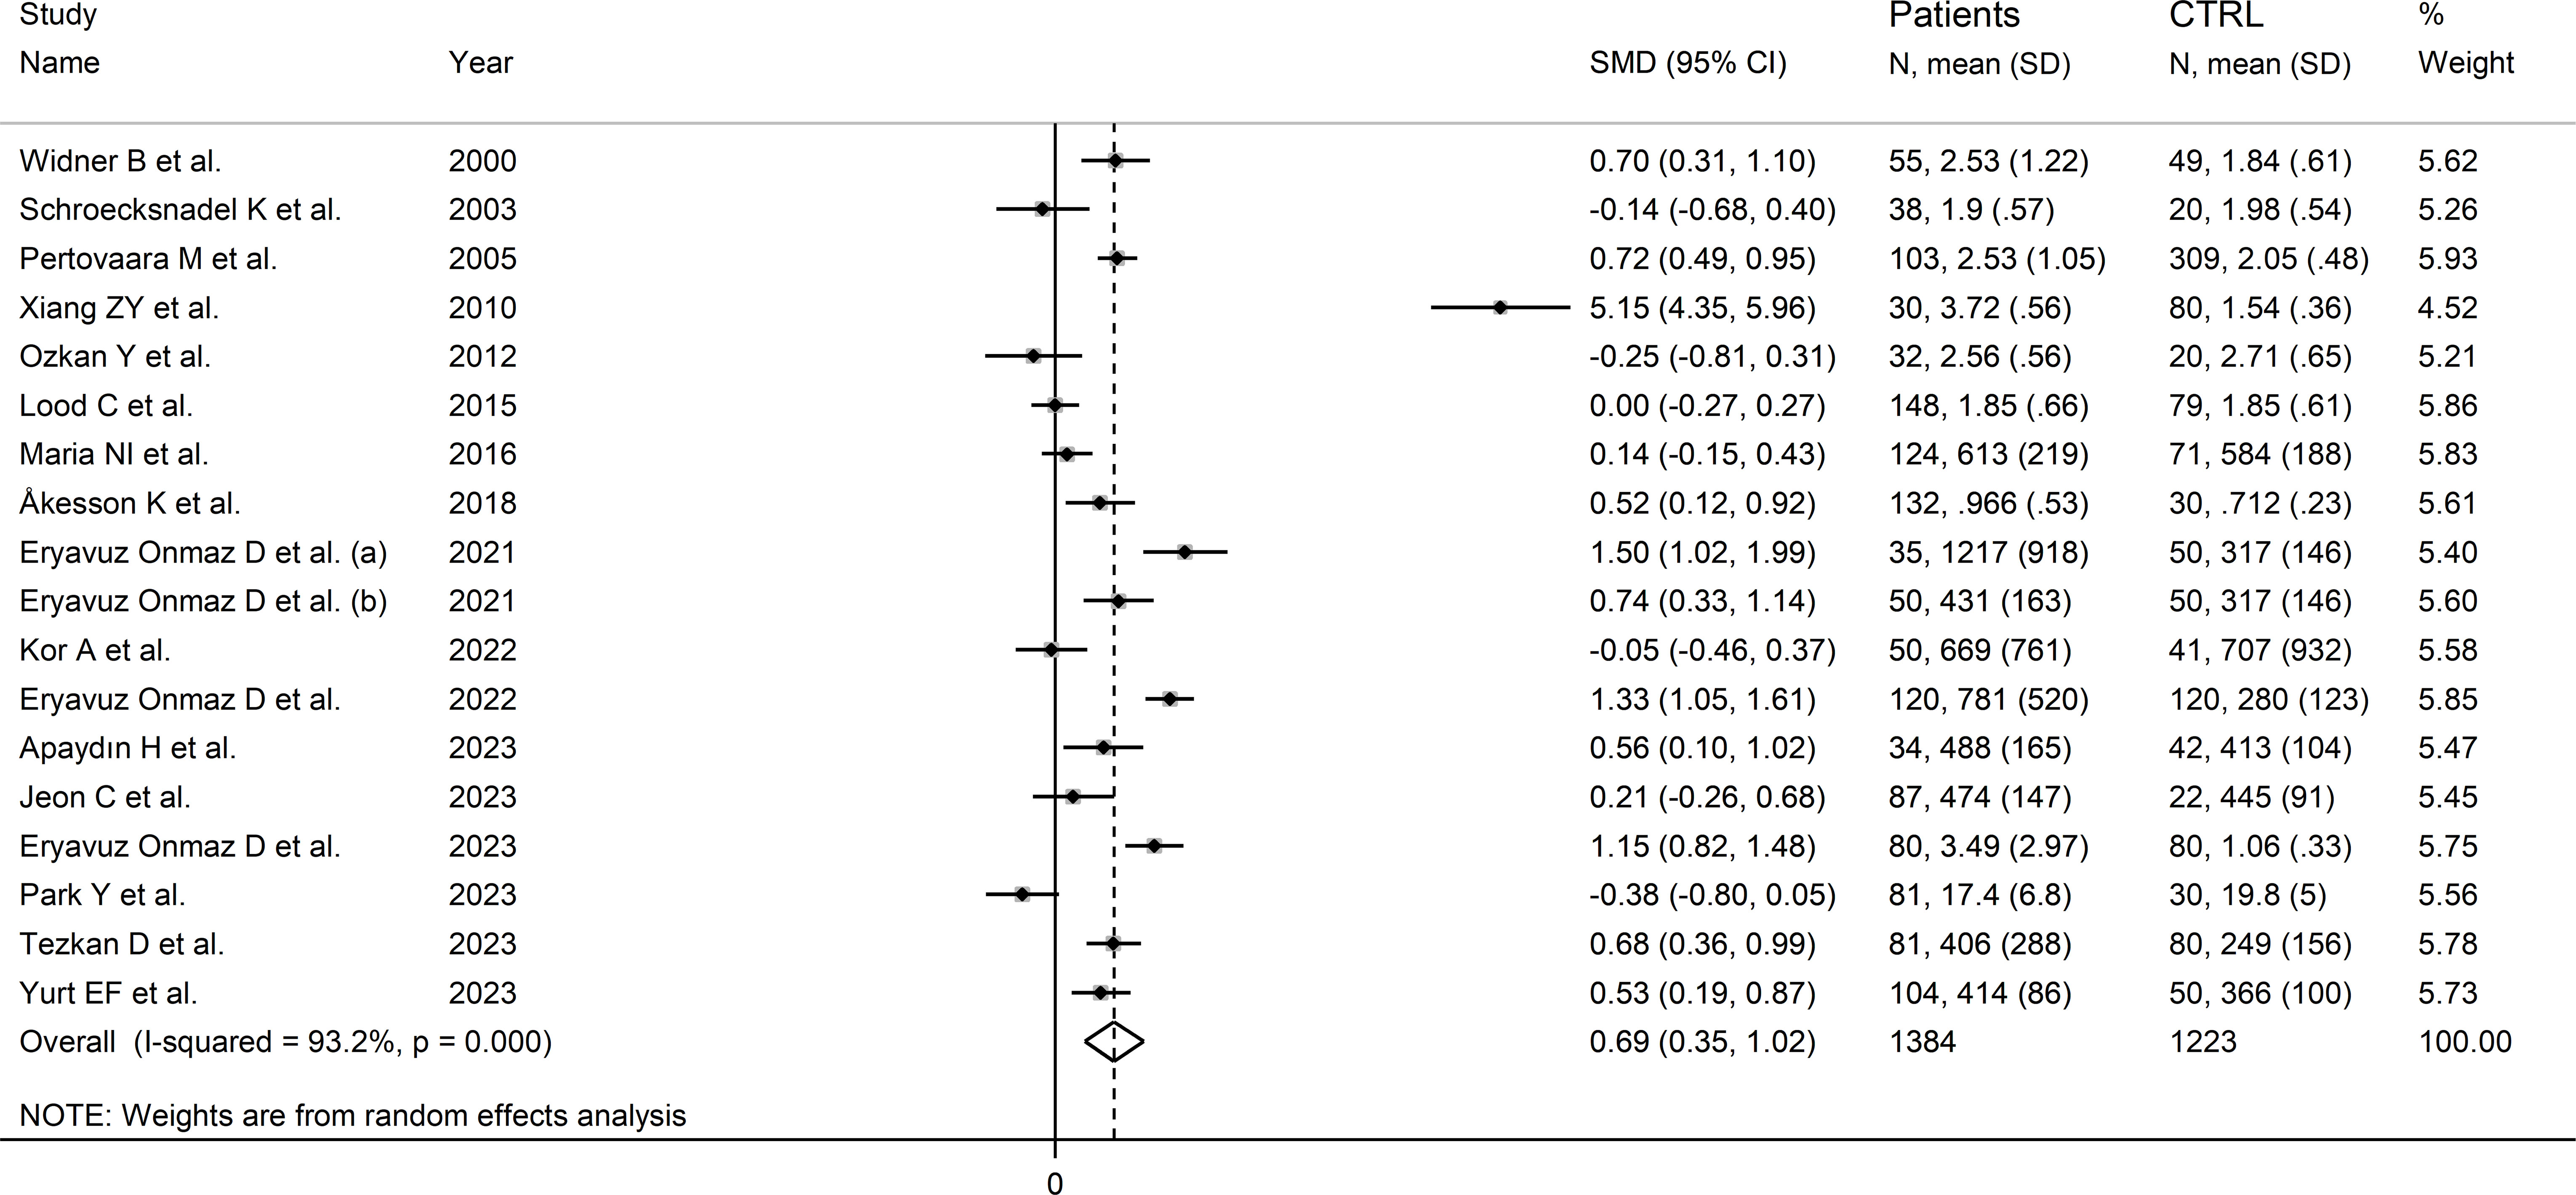
Figure 5 Forest plot of the standard mean differences in kynurenine concentrations between patients with rheumatic disease and healthy controls.
In meta-regression, there were non-significant associations between effect size and age (t=-0.53, p=0.61), sex (t=-0.95, p=0.36), publication year (t=-0.44, p=0.67), sample size (t=0.11, p=0.91), CRP (t=-1.68, p=0.14), RD duration (t=0.23, p=0.82), or use of DMARDs (t=-1.17, p=0.27) and corticosteroids (t=0.23, p=0.82).
In subgroup analysis, the pooled SMD was statistically significant in studies of SLE (SMD=1.54, 95% CI 0.13 to 2.95, p=0.03; I2 = 97.9%, p<0.001), and AS (SMD=0.81, 95% CI 0.12 to 1.51, p=0.02; I2 = 85.9%, p<0.001), but not RA (SMD=-0.12, 95% CI -0.41 to 0.16, p=0.39; I2 = 0.0%, p=0.84), or pSS (SMD=0.45, 95% CI -0.02 to 0.92, p=0.06; I2 = 90.1%, p<0.001; Figure 6), with a virtually absent heterogeneity in the RA subgroup. There were non-significant differences (p=0.82) in pooled SMD between studies in patients with autoimmune disease (SMD=0.62, 95% CI 0.16 to 1.09, p=0.009; I2 = 94.5%, p<0.001) and mixed autoimmune-autoinflammatory disease (SMD=0.86, 95% CI 0.41 to 1.32, p<0.001; I2 = 85.8%, p<0.001; Supplementary Figure 6). Furthermore, there were non-significant differences (p=0.34) in pooled SMD between Asian (SMD=0.89, 95% CI 0.38 to 1.40, p=0.001; I2 = 94.7%, p<0.001) and European studies (SMD=0.34, 95% CI 0.04 to 0.64, p=0.03; I2 = 80.0%, p<0.001). By contrast, the pooled SMD was statistically significant in studies using liquid chromatography (SMD=0.80, 95% CI 0.42 to 1.18, p<0.001; I2 = 93.8%, p<0.001) but not in those using other methods (SMD=0.12, 95% CI -0.42 to 0.65, p=0.66; I2 = 78.4%, p=0.010). In studies using liquid chromatography, the pooled SMD was significantly different with mass spectrometry (SMD=0.81, 95% CI 0.47 to 1.14, p<0.001; I2 = 84.6%, p<0.001) but not ultraviolet detection (SMD=0.23, 95% CI -0.11 to 0.56, p=0.19; I2 = 82.6%, p<0.001), and the difference between the effect sizes was statistically significant (p=0.038). Finally, there were non-significant differences (p=0.56) in pooled SMD between studies in plasma (SMD=0.39, 95% CI 0.11 to 0.67, p=0.006; I2 = 48.2%, p=0.12) and serum (SMD=0.78, 95% CI 0.36 to 1.20, p<0.001; I2 = 94.6%, p<0.001), with a lower between-study variance in the plasma subgroup.
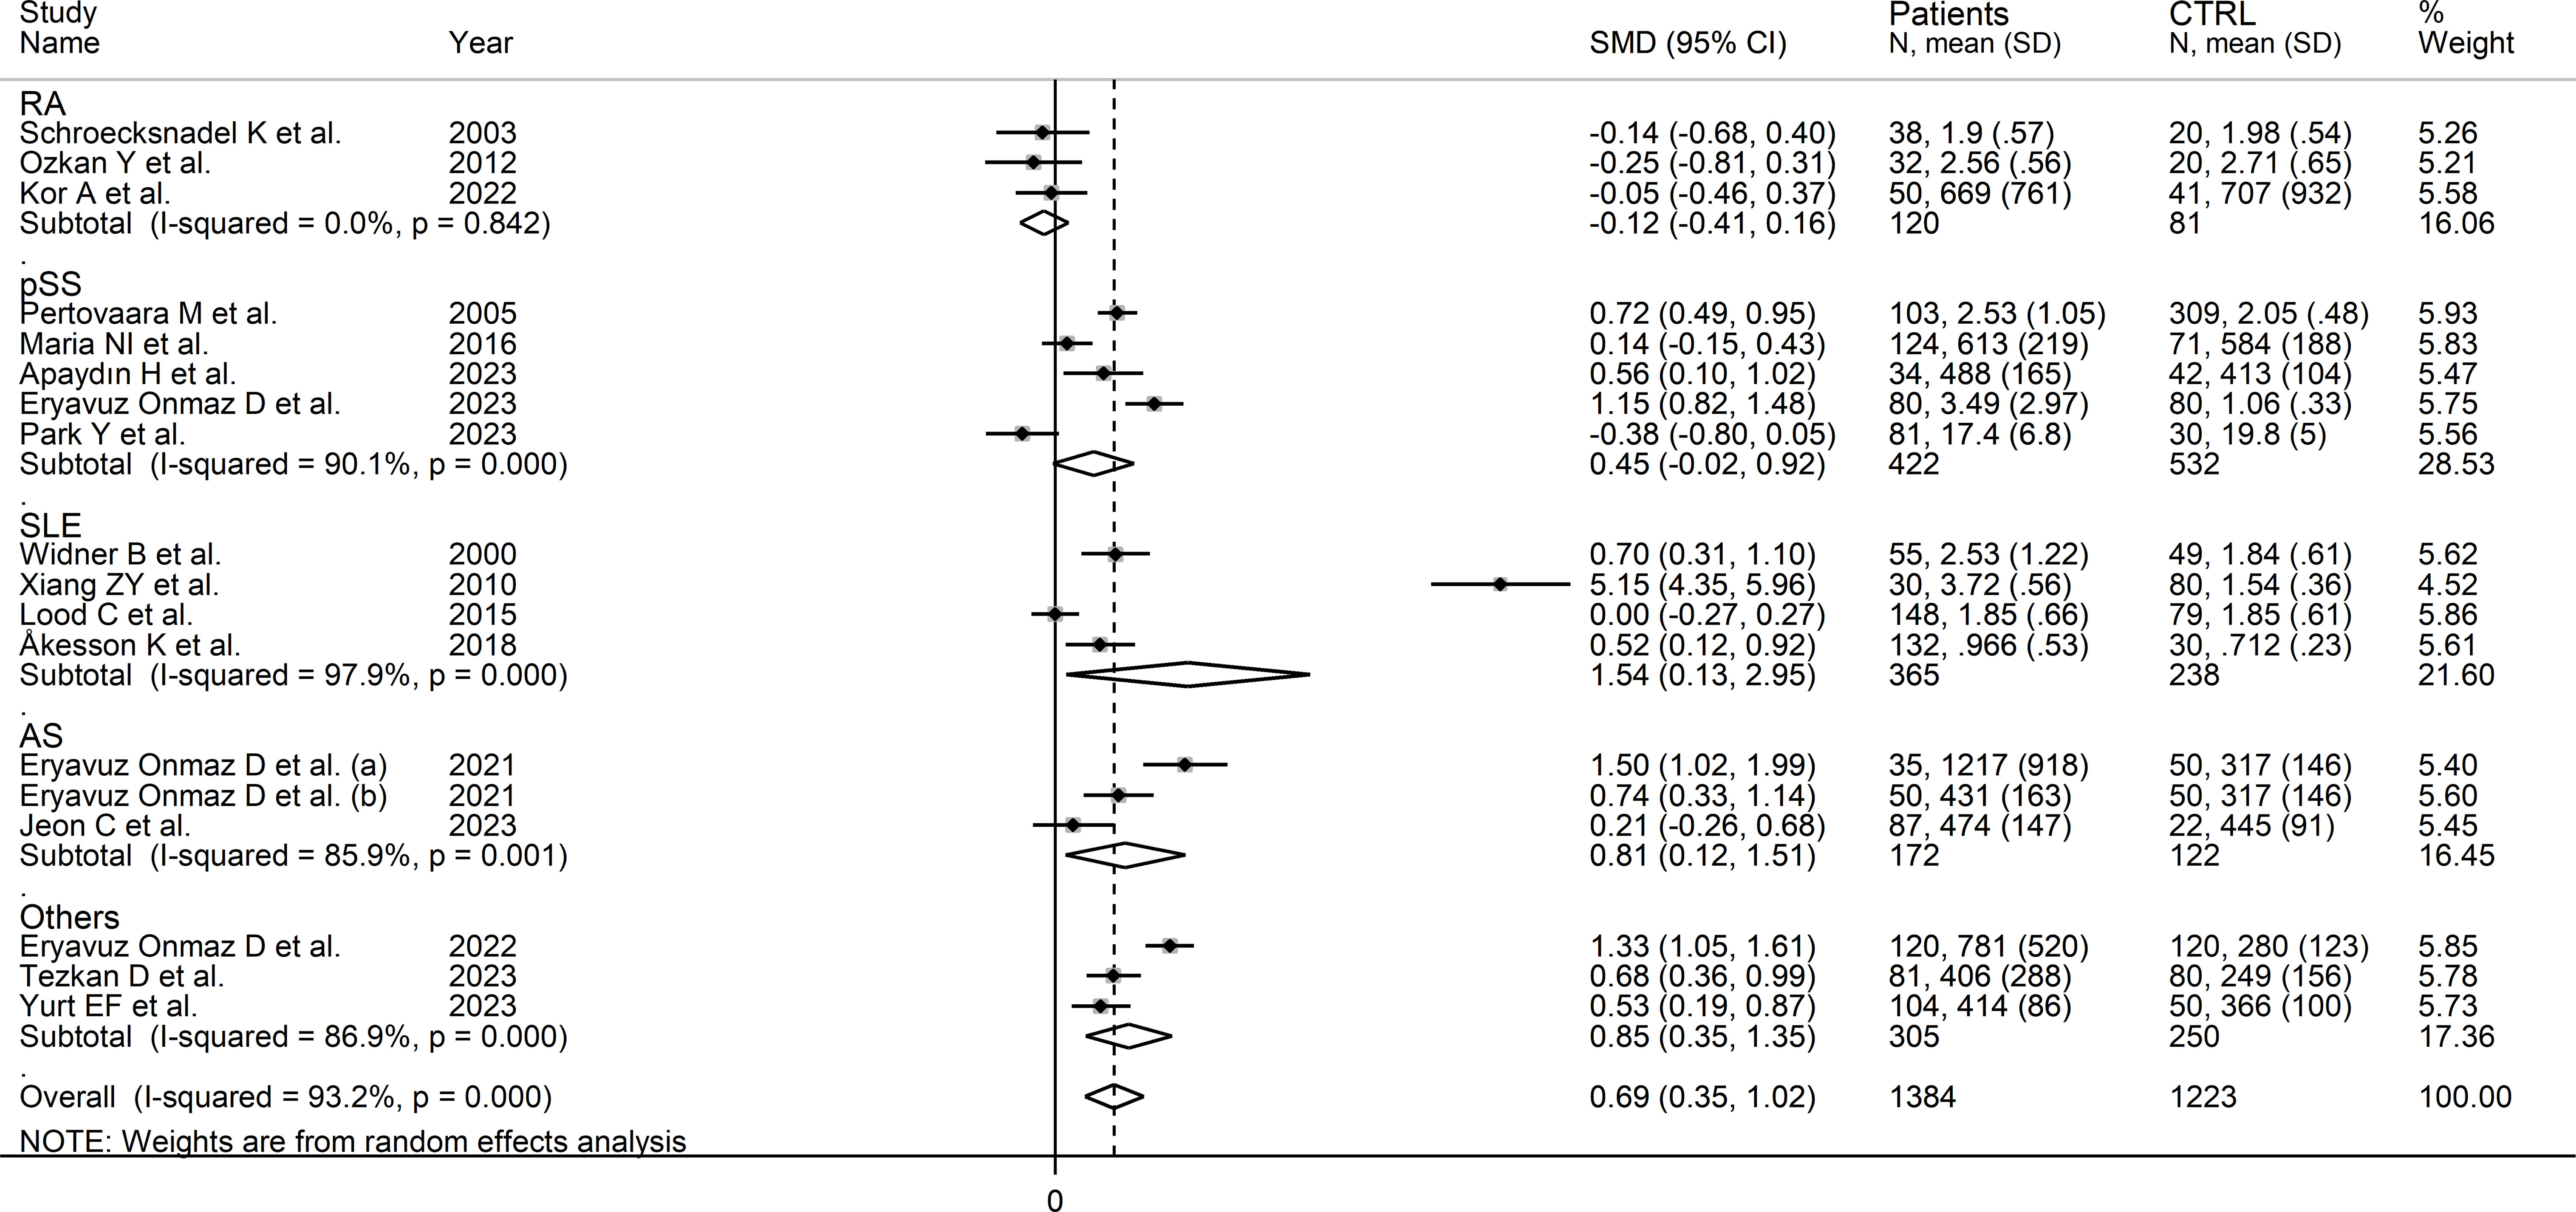
Figure 6 Forest plot of studies investigating kynurenine concentrations in patients and controls according to type of rheumatic disease.
The certainty of evidence remained low (rating 2, ⊕⊕⊝⊝) after considering the low-moderate risk of bias in all studies (no rating change), the high but partly explainable heterogeneity (no rating change), the lack of indirectness (no rating change), the relatively low imprecision (confidence intervals not crossing the threshold, no rating change), the moderate effect size (SMD=0.69, no rating change) (50), and the absence of publication bias (no rating change).
Kynurenine to tryptophan ratio
Seventeen studies (18 comparator groups) investigated the kynurenine to tryptophan ratio in a total of 1,371 RD patients (mean age 48 years, 24% males; Table 1) and 1,275 healthy controls (mean age 44 years, 39% males) (27–33, 35, 39–42, 44, 46–49). Ten studies were conducted in Asia (30, 31, 40–42, 44, 46–49), six in Europe (27–29, 32, 33, 35), and one in America (39). Five study groups included participants with pSS (29, 33, 44, 46, 47), five with SLE (27, 30, 32, 35, 39), three with RA (28, 31, 41), two with AS (40), and one with BD (42), FMF (48), and axSpA (49), respectively. Liquid chromatography was used in 16 study groups (27–33, 39–42, 44, 46, 48, 49), whereas ELISA (47) and gas chromatography (35) were used in the remaining two. Among the studies using liquid chromatography, the detection method included mass spectrometry in nine (39–42, 44, 46, 48, 49), ultraviolet in four (27–29, 32), and fluorimetric detection in the remaining three (30, 31, 33). Serum was the biological matrix in 14 study groups (27–33, 39, 40, 42, 46–48), and plasma in the remaining four (35, 41, 44, 49). The risk of bias was moderate in 11 studies (27–33, 35, 41, 44, 47) and low in the remaining six (39, 40, 42, 46, 48, 49) (Supplementary Table 3).
The forest plot showed that the kynurenine to tryptophan ratio was significantly higher in RD patients compared to controls (SMD=0.88, 95% CI 0.55 to 1.21, p<0.001; I2 = 92.9%, p<0.001; Figure 7). The effect size ranged between 0.77 and 0.98 in sensitivity analysis, highlighting the stability of the results (Supplementary Figure 7). There was no publication bias (Begg’s test, p=1.0; Egger’s test, p=0.68). Accordingly, the “trim-and-fill” method did not identify any missing study to be added to the funnel plot to ensure symmetry (Supplementary Figure 8).
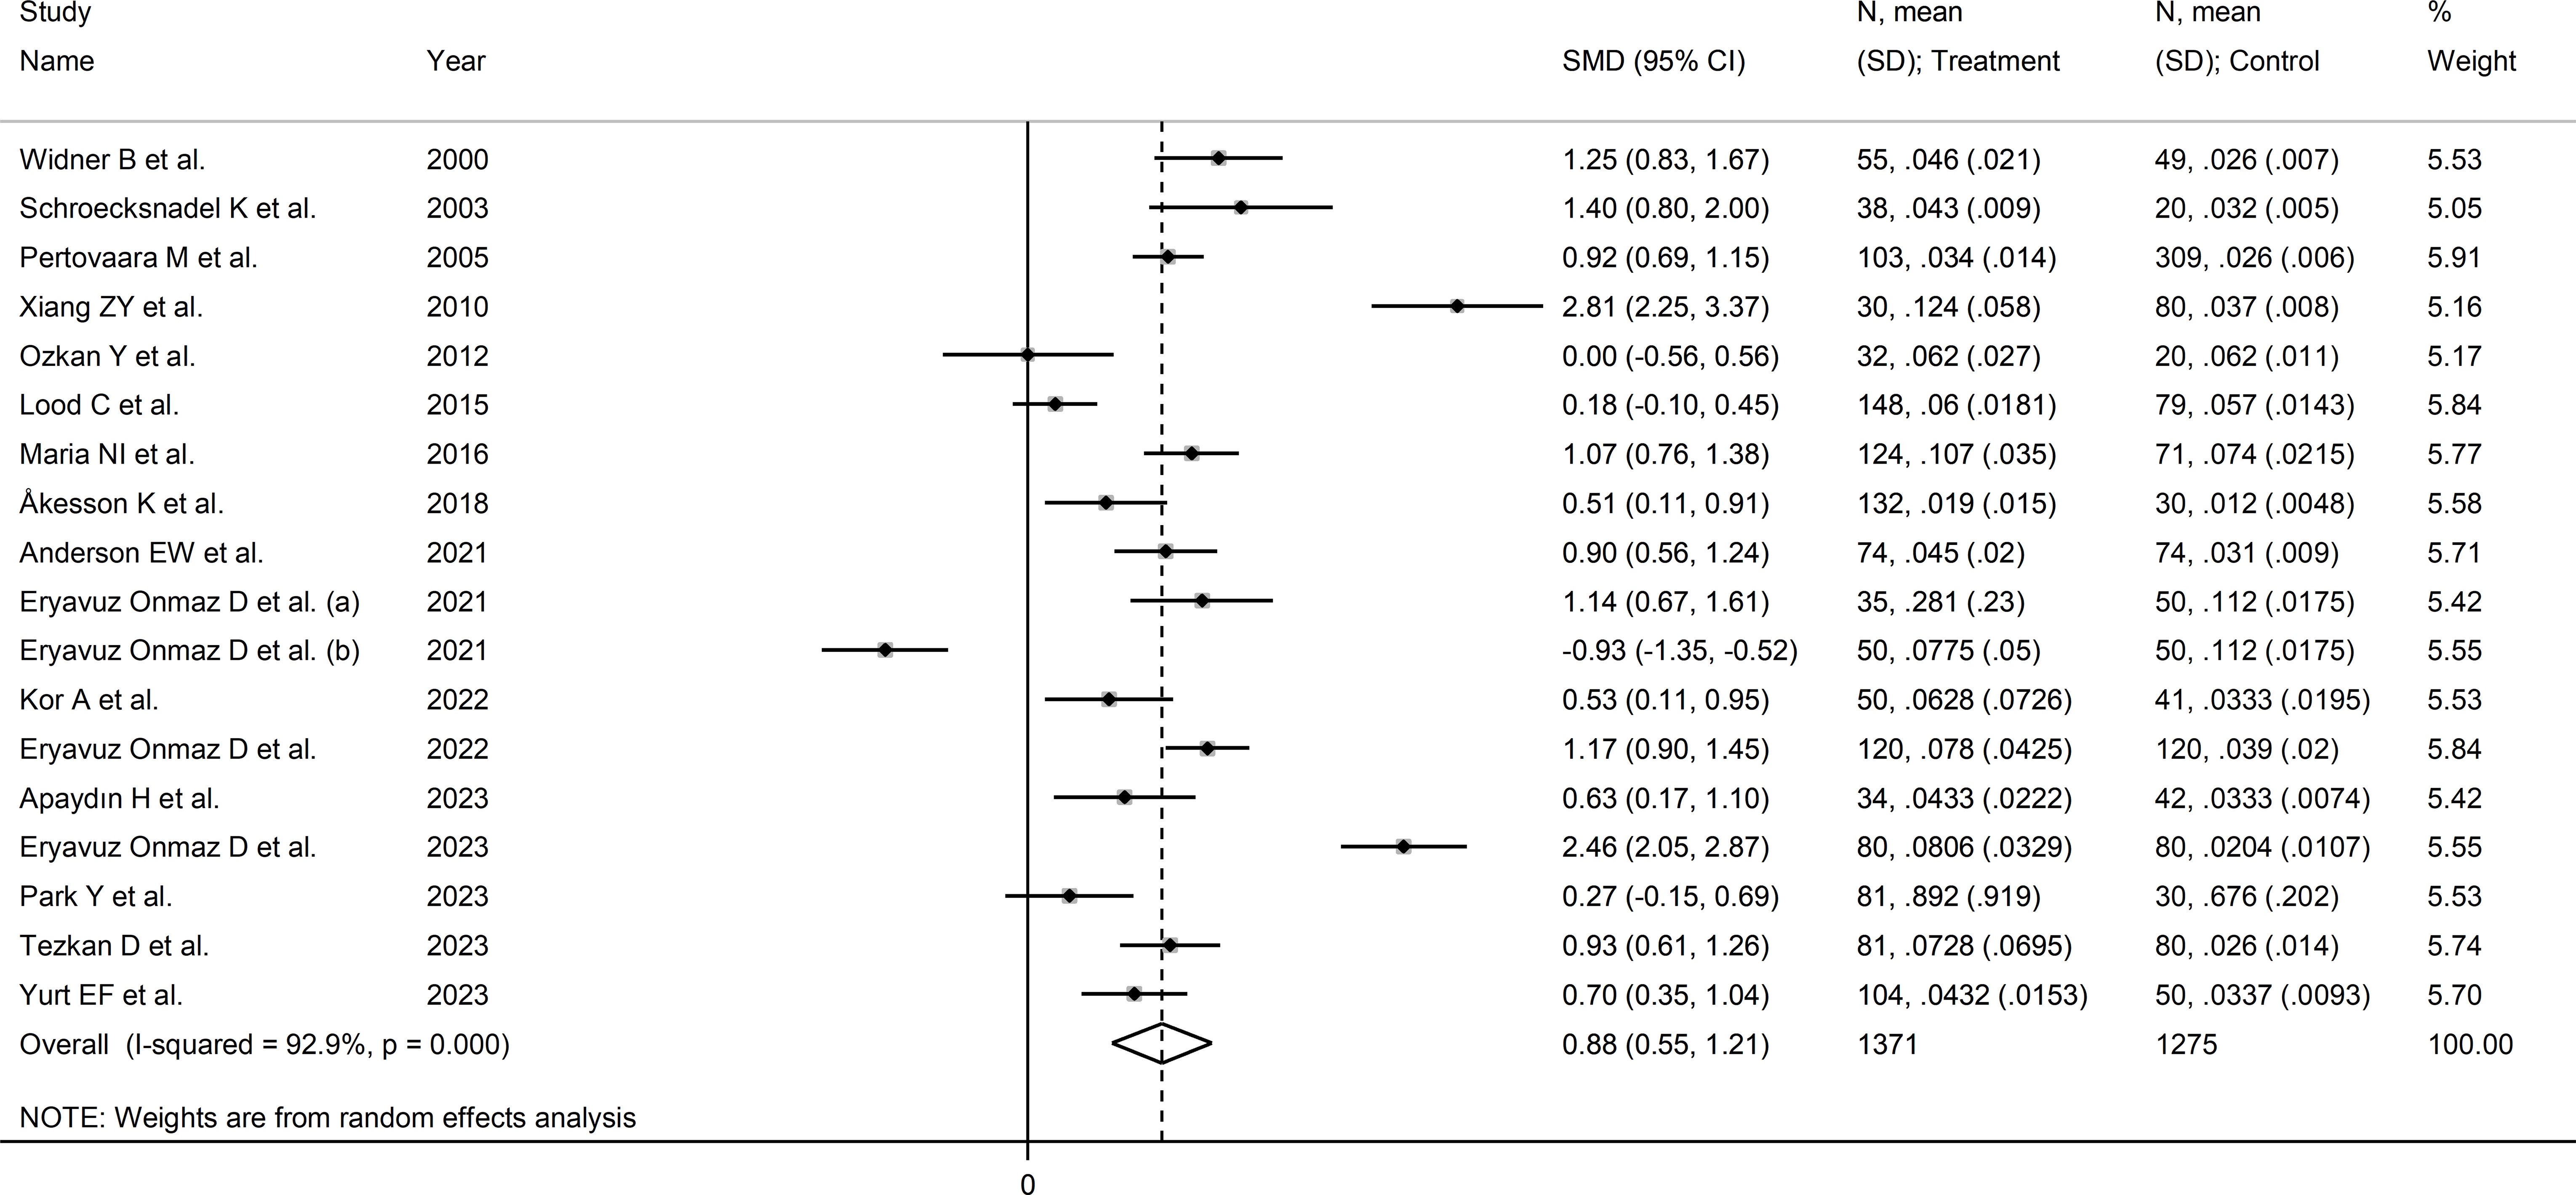
Figure 7 Forest plot of studies reporting the kynurenine/tryptophan ratio in patients with rheumatic disease and healthy controls.
No significant associations were observed in meta-regression between effect size and age (t=0.83, p=0.42), sex (t=-1.62, p=0.13), publication year (t=-0.91, p=0.37), sample size (t=0.28, p=0.78), RD duration (t=-0.10, p=0.93), CRP (t=-1.49, p=0.18), or use of DMARDs (t=0.70, p=0.51) and corticosteroids (t=0.19, p=0.85).
In subgroup analysis, the pooled SMD was statistically significant in studies of SLE (SMD=1.10, 95% CI 0.37 to 1.84, p=0.003; I2 = 94.7%, p<0.001) and pSS (SMD=1.07, 95% CI 0.45 to 1.69, p=0.001; I2 = 93.6%, p<0.001), but not RA (SMD=-0.63, 95% CI -0.09 to 1.35, p=0.08; I2 = 82.3%, p<0.001) or AS (SMD=0.10, 95% CI -0.93 to 2.13, p=0.92; I2 = 97.7%, p<0.001, Figure 8). In addition, the pooled SMD was statistically significant in studies of patients with autoimmune disease (SMD=0.98, 95% CI 0.60 to 1.37, p<0.001; I2 = 92.5%, p<0.001) but not of patients with autoimmune-autoinflammatory diseases (SMD=0.52, 95% CI -0.39 to 1.43, p=0.26; I2 = 96.0%, p<0.001; Supplementary Figure 9). There were non-significant differences (p=0.99) in pooled SMD between European (SMD=0.86, 95% CI 0.50 to 1.22, p<0.001; I2 = 85.3%, p<0.001) and Asian studies (SMD=0.88, 95% CI 0.33 to 1.43, p=0.002; I2 = 95.1%, p<0.001). Similarly, the pooled SMD was non-significantly different (0.40) between studies using liquid chromatography (SMD=0.94, 95% CI 0.58 to 1.30, p<0.001; I2 = 93.4%, p<0.001) and other methods (SMD=0.40, 95% CI 0.11 to 0.69, p=0.007; I2 = 0.0%, p=0.42), with a virtually absent heterogeneity in the latter subgroup. In liquid chromatography studies, the pooled SMD was statistically significant in studies using mass spectrometry (SMD=0.84, 95% CI 0.32 to 1.36, p=0.002; I2 = 94.3%, p<0.001) and ultraviolet detection (SMD=0.90, 95% CI 0.37 to 1.43, p=0.001; I2 = 89.5%, p<0.001), but not in those using fluorimetric detection (SMD=1.29, 95% CI -0.06 to 2.64, p=0.06; I2 = 96.0%, p<0.001). Finally, there were non-significant differences (p=0.45) in pooled SMD between studies analysing plasma (SMD=0.96, 95% CI 0.55 to 1.37, p<0.001; I2 = 94.4%, p<0.001) and those on serum (SMD=0.60, 95% CI 0.40 to 0.80, p<0.001; I2 = 0.0%, p=0.90), with a virtually absent between study-variance in the serum subgroup.
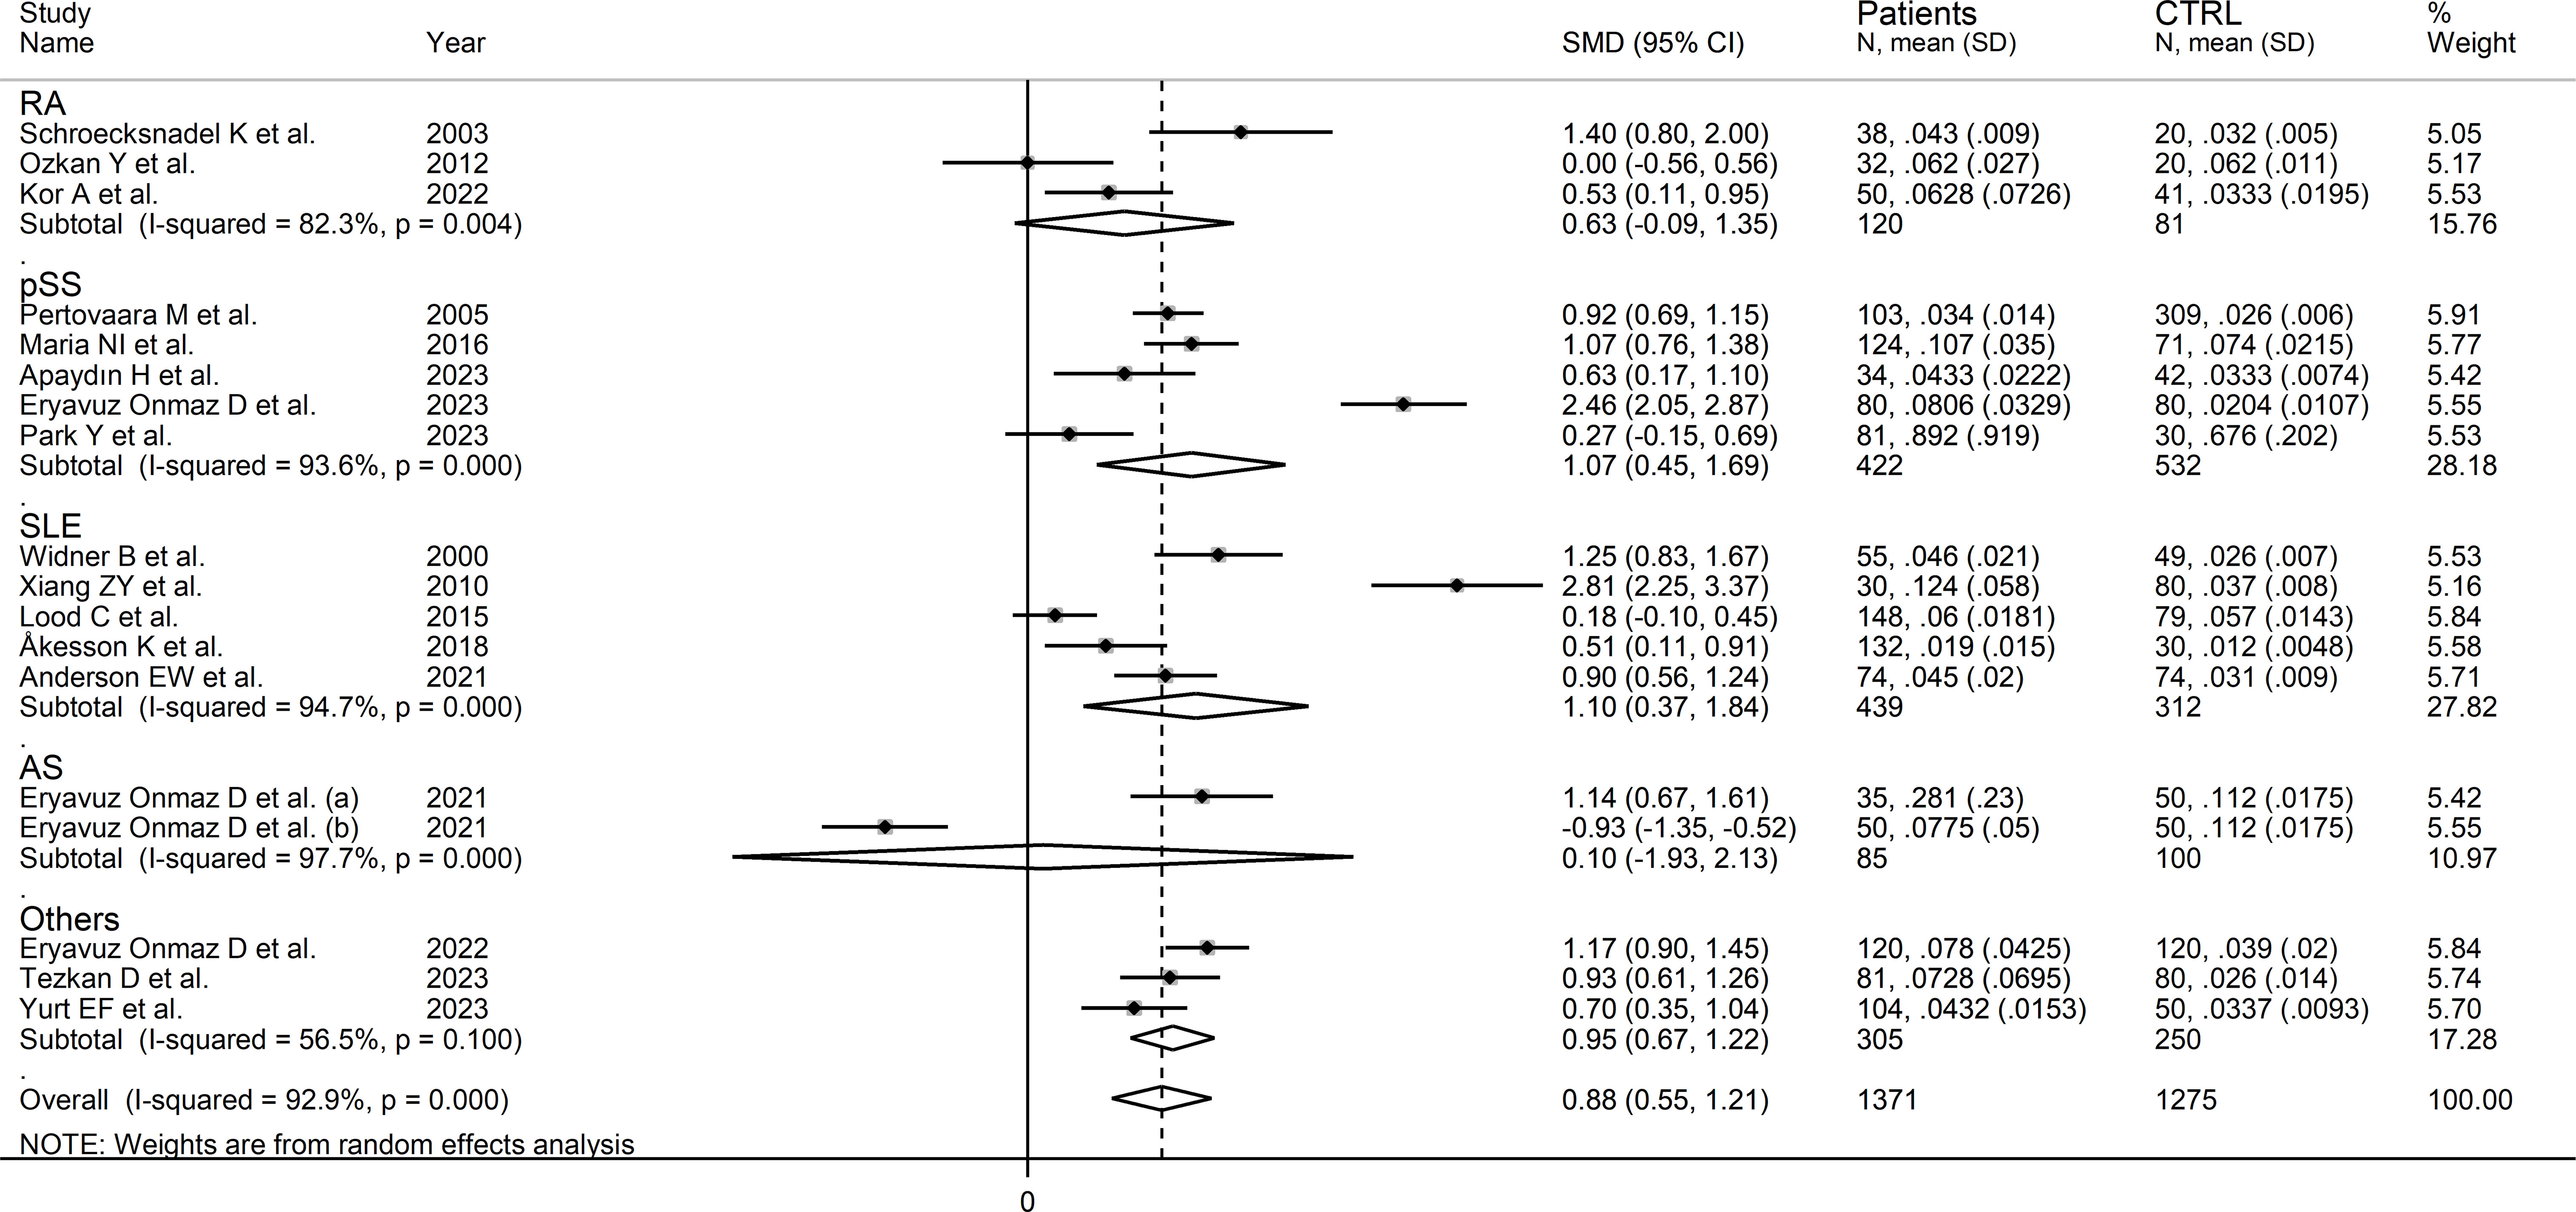
Figure 8 Forest plot of studies reporting the kynurenine/tryptophan ratio in patients and controls according to the type of rheumatic disease.
The certainty of evidence was upgraded to moderate (rating 3, ⊕⊕⊕⊝) after considering the low-moderate risk of bias in all studies (no rating change), the high but partly explainable heterogeneity (no rating change), the lack of indirectness (no rating change), the relatively low imprecision (confidence intervals not crossing the threshold, no rating change), the large effect size (SMD=0.88, upgrade one level) (50), and the absence of publication bias (no rating change).
Kynurenic acid
Six studies (seven comparator groups) reported kynurenic acid concentrations in a total of 448 RD patients (mean age 43 years, 37% males) and 480 healthy controls (mean age 41 years, 39% males; Table 1) (30, 40, 42, 43, 46, 48). Five studies were conducted in Asia (30, 40, 42, 46, 48), and the remaining one in Europe (43). Two study groups included individuals with AS (40), and one with SLE (30), SSc (43), pSS (46), BD (42), and FMF (48), respectively. Liquid chromatography was used in six study groups (30, 40, 42, 46, 48), and ELISA in the remaining one (43). In liquid chromatography studies, five study groups using mass spectrometry for detection (40, 42, 46, 48), and the remaining one fluorimetry (30). All studies investigated serum. The risk of bias (Supplementary Table 3)was moderate in one study (30), and low in the remaining five (40, 42, 43, 46, 48).
The forest plot showed that kynurenic acid concentrations were not significantly different between RD patients and controls (SMD=0.72, 95% CI -0.14 to 1.59, p=0.10; I2 = 96.7%, p<0.001; Figure 9). Sensitivity analysis showed that the study of Xian et al. had a significant effect on the corresponding pooled SMD direction (30) (Supplementary Figure 10). Its removal reduced the effect size (SMD=0.00, 95% CI -0.50 to 0.50, p=1.00).
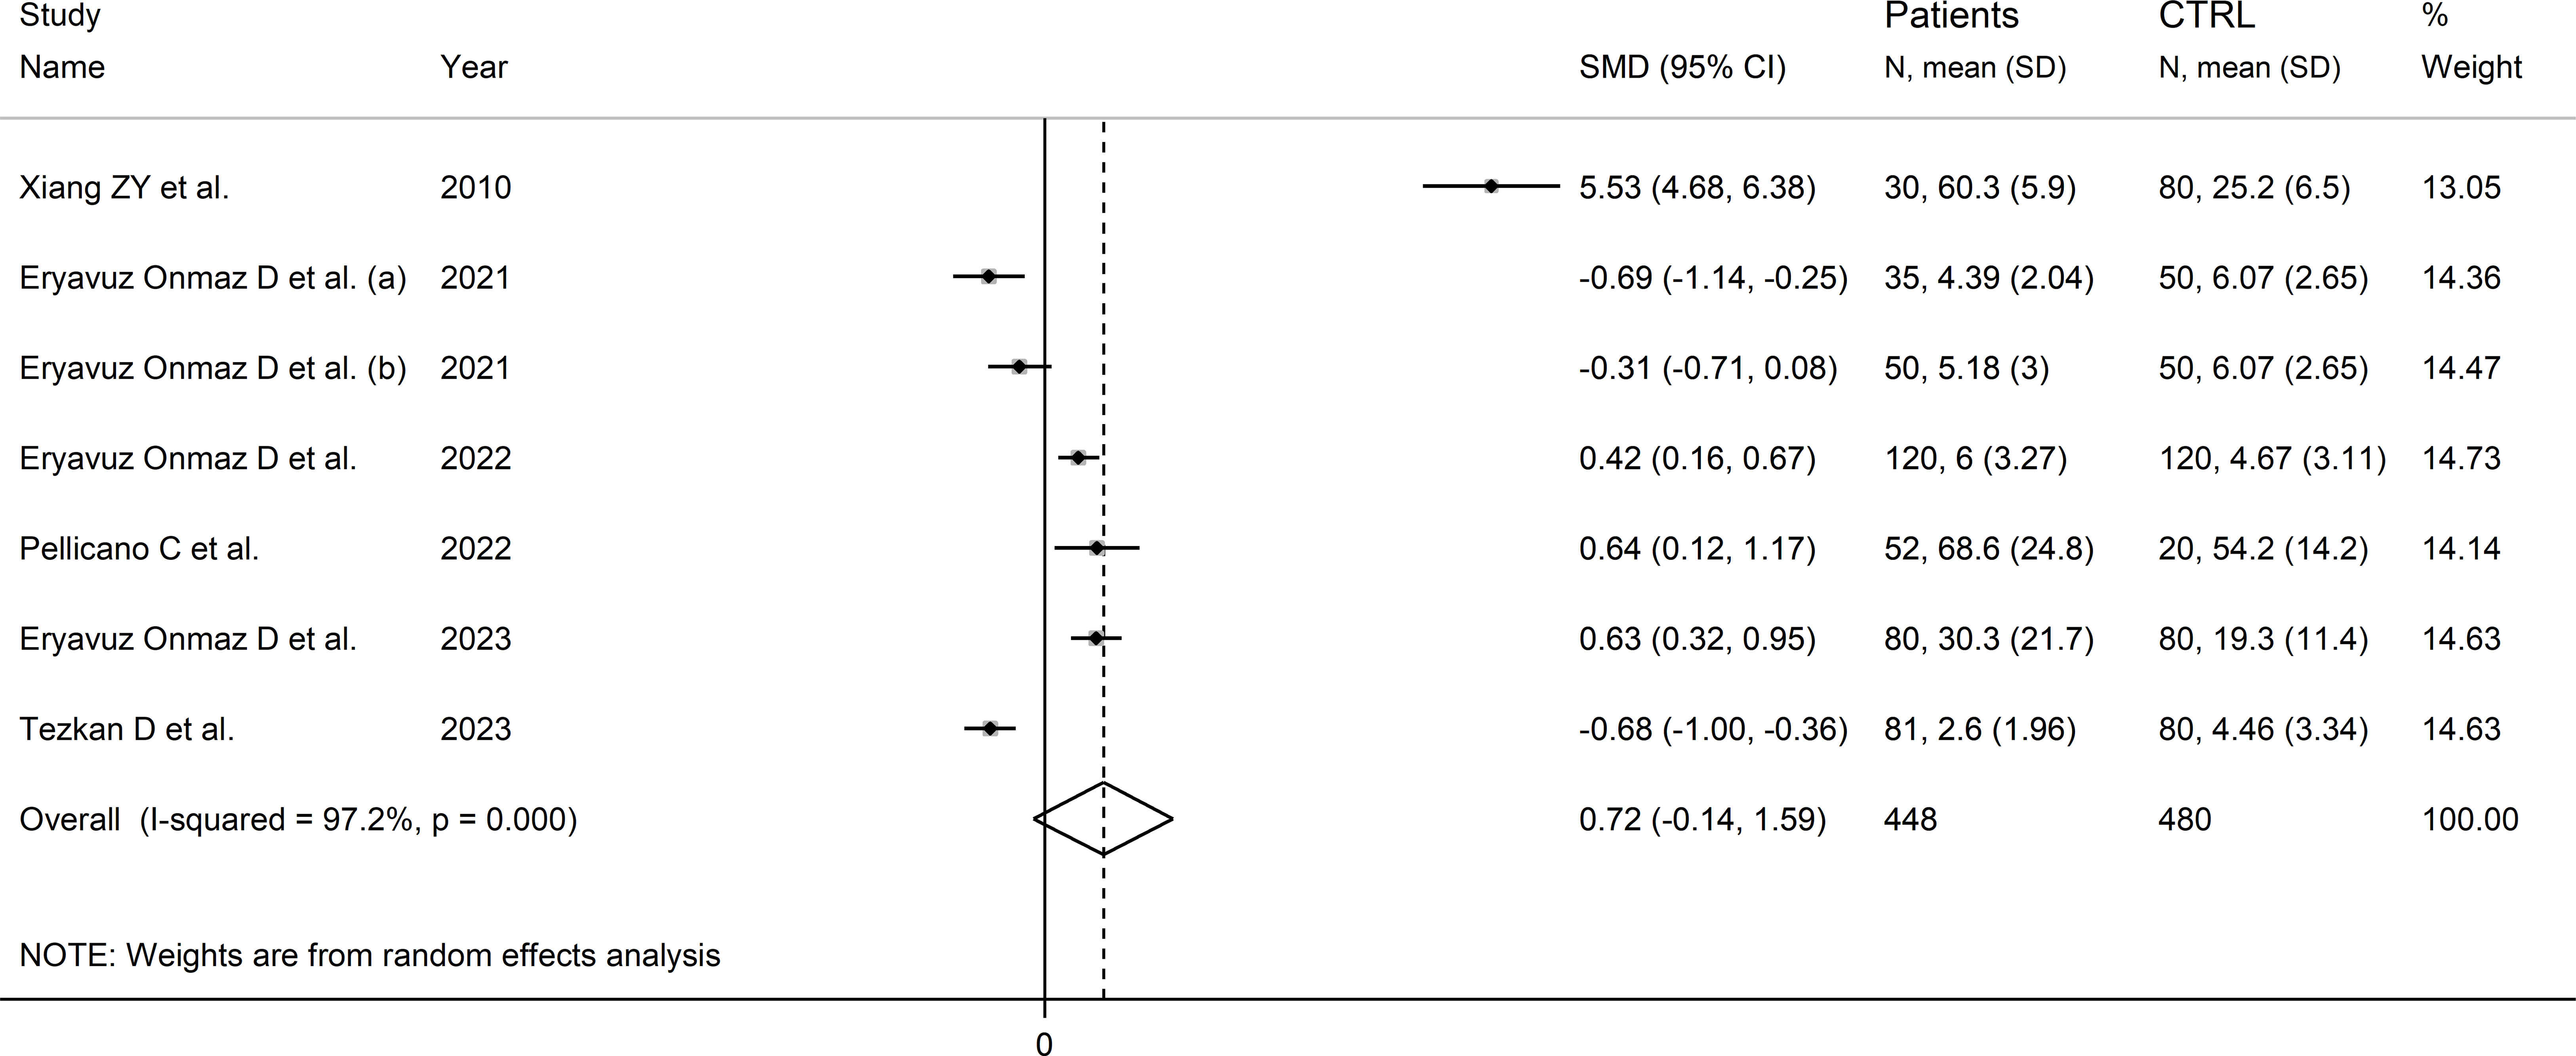
Figure 9 Forest plot of studies reporting kynurenic acid concentrations in patients with rheumatic disease and healthy controls.
The limited number of studies prevented the assessment of publication bias and the conduct of meta-regression and subgroup analyses.
The certainty of evidence was downgraded to extremely low (rating 0, ⊝⊝⊝⊝) after considering the low-moderate risk of bias in all studies (no rating change), the high and unexplainable heterogeneity (downgrade one level), the lack of indirectness (no rating change), and the lack of assessment of publication bias (downgrade one level).
3-hydroxyanthranilic acid
Four studies (five comparator groups), all conducted in Asia, reported 3-hydroxyanthranilic acid concentrations in a total of 366 patients with RD (mean age 42 years, 51% males) and 380 healthy controls (mean age 42 years, 39% males; Table 1) (40, 42, 46, 48). Two study groups included individuals with AS (40), and one with pSS (46), BD (42), and FMF (48), respectively. In all studies, measurements were conducted in serum using liquid chromatography with mass spectrometry detection. The risk of bias (Supplementary Figure 3) was low in all studies (40, 42, 46, 48).
The forest plot showed the absence of significant between-group differences in 3-hydroxyanthranilic acid concentrations (SMD=0.06, 95% CI -0.30 to 0.42, p=0.73; I2 = 83.0%, p<0.001; Figure 10). The corresponding SMD values were stable in sensitivity analysis (range between -0.03 and 0.22; Supplementary Figure 11).
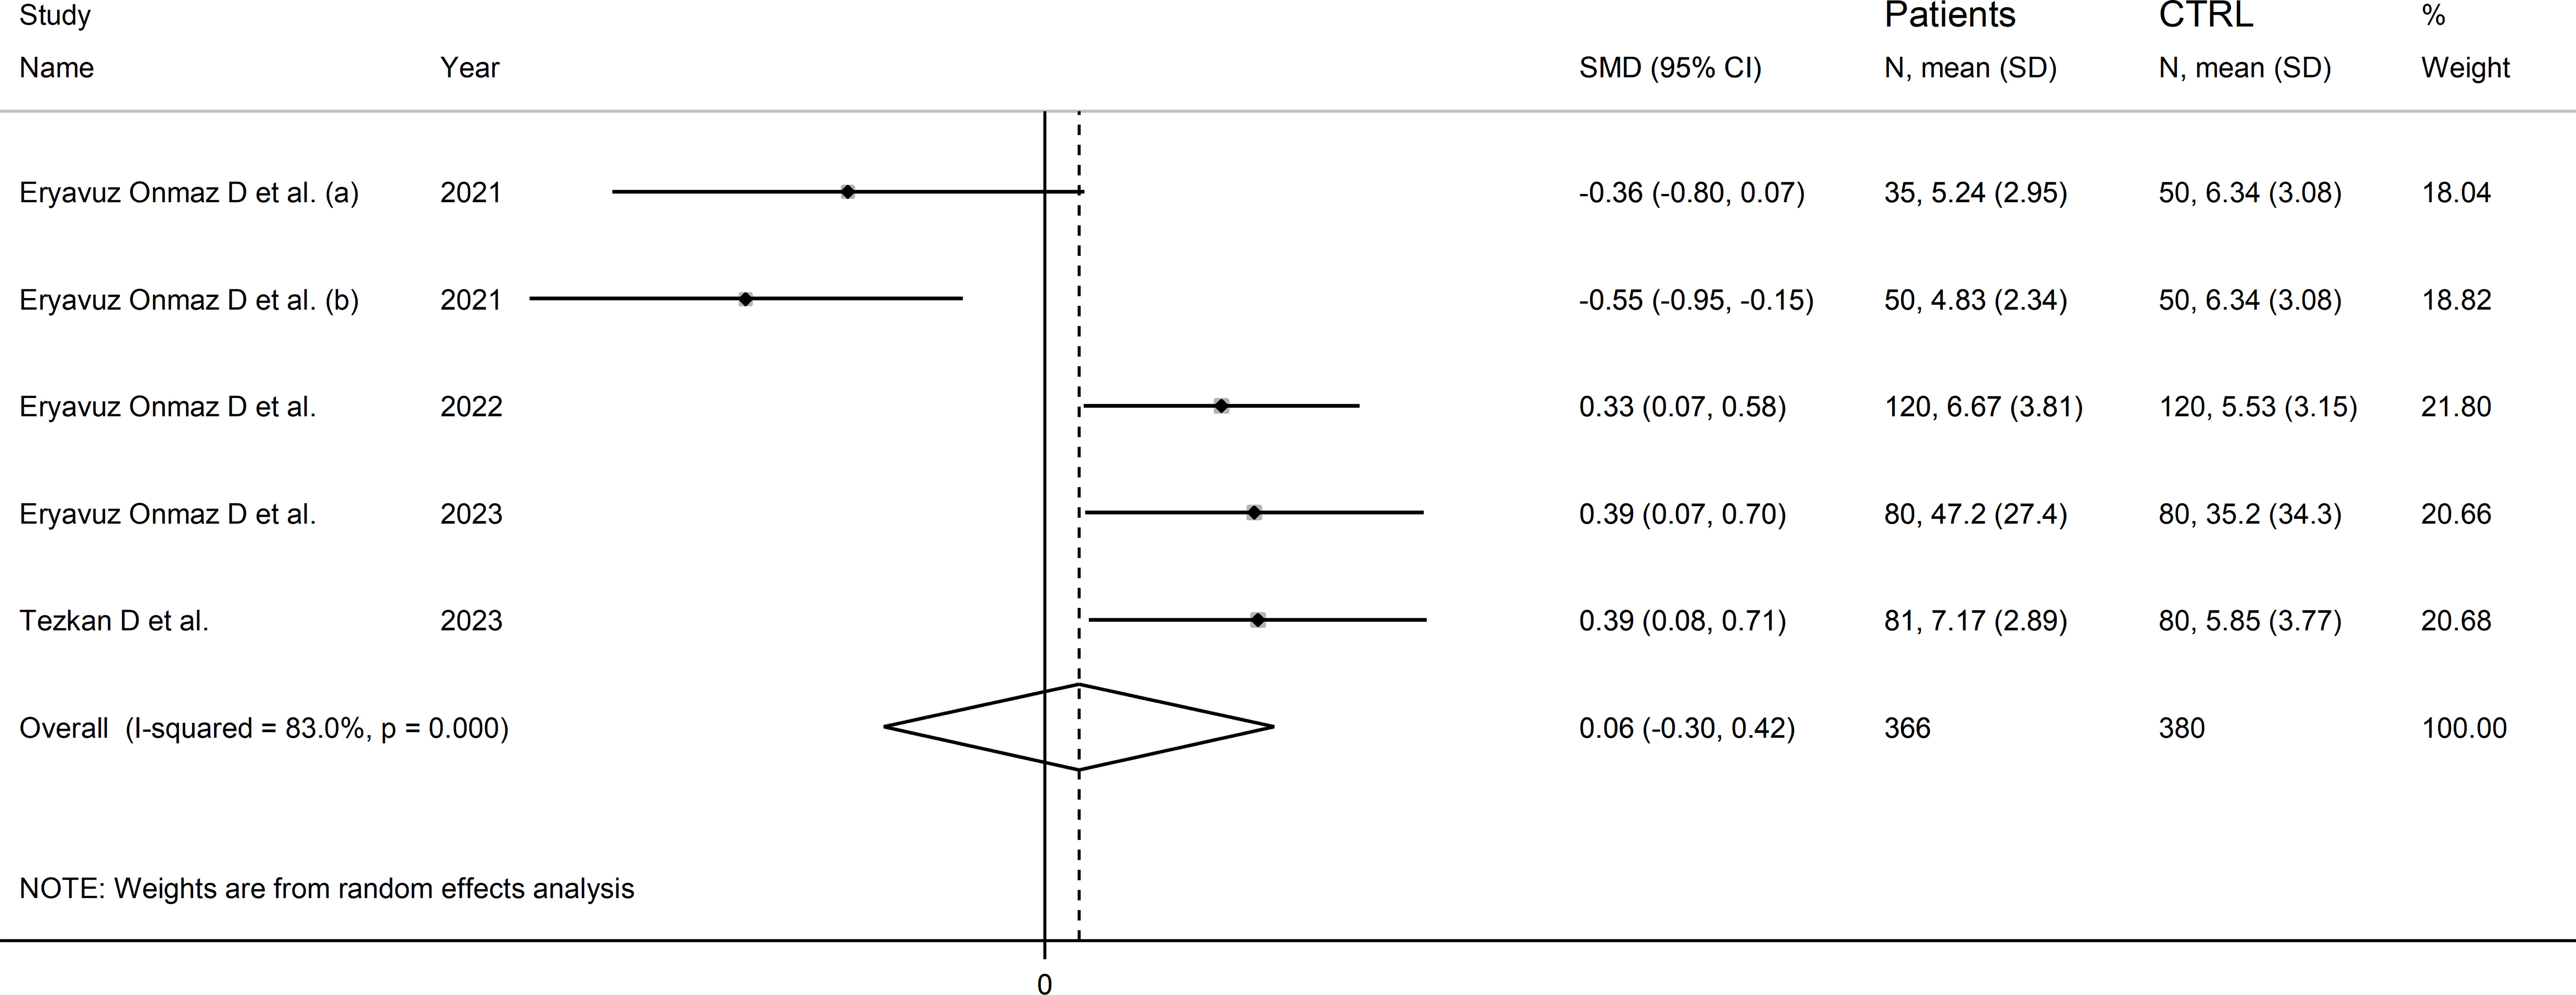
Figure 10 Forest plot of studies reporting 3-hydroxyanthranilic acid concentrations in patients with rheumatic disease and healthy controls.
The limited number of studies prevented the assessment of publication bias and the conduct of meta-regression and subgroup analyses.
The certainty of evidence was downgraded to extremely low (rating 0, ⊝⊝⊝⊝) after considering the low-moderate risk of bias in all studies (no rating change), the high and unexplainable heterogeneity (downgrade one level), the lack of indirectness (no rating change), and the lack of assessment of publication bias (downgrade one level).
3-hydroxykynurenine
Four studies (five comparator groups) reported 3-hydroxykynurenine concentrations in a total of 366 RD patients (mean age 42 years, 51% males) and 380 healthy controls (mean age 42 years, 39% males; Table 1) (40, 42, 46, 48). Two study groups included individuals with AS (40), and one with pSS (46), BD (42), and FMF (48), respectively. In all studies, measurements were conducted in serum using liquid chromatography with mass spectrometry detection. The risk of bias (Supplementary Table 3) was low in all studies (40, 42, 46, 48).
The forest plot showed that RD patients had significantly higher 3-hydroxykynurenine concentrations compared to healthy controls (SMD=0.74, 95% CI 0.30 to 1.18, p=0.001; I2 = 87.7%, p<0.001; Figure 11). The effect size was stable in sensitivity analysis, with a range between 0.57 and 0.86 (Supplementary Figure 12).
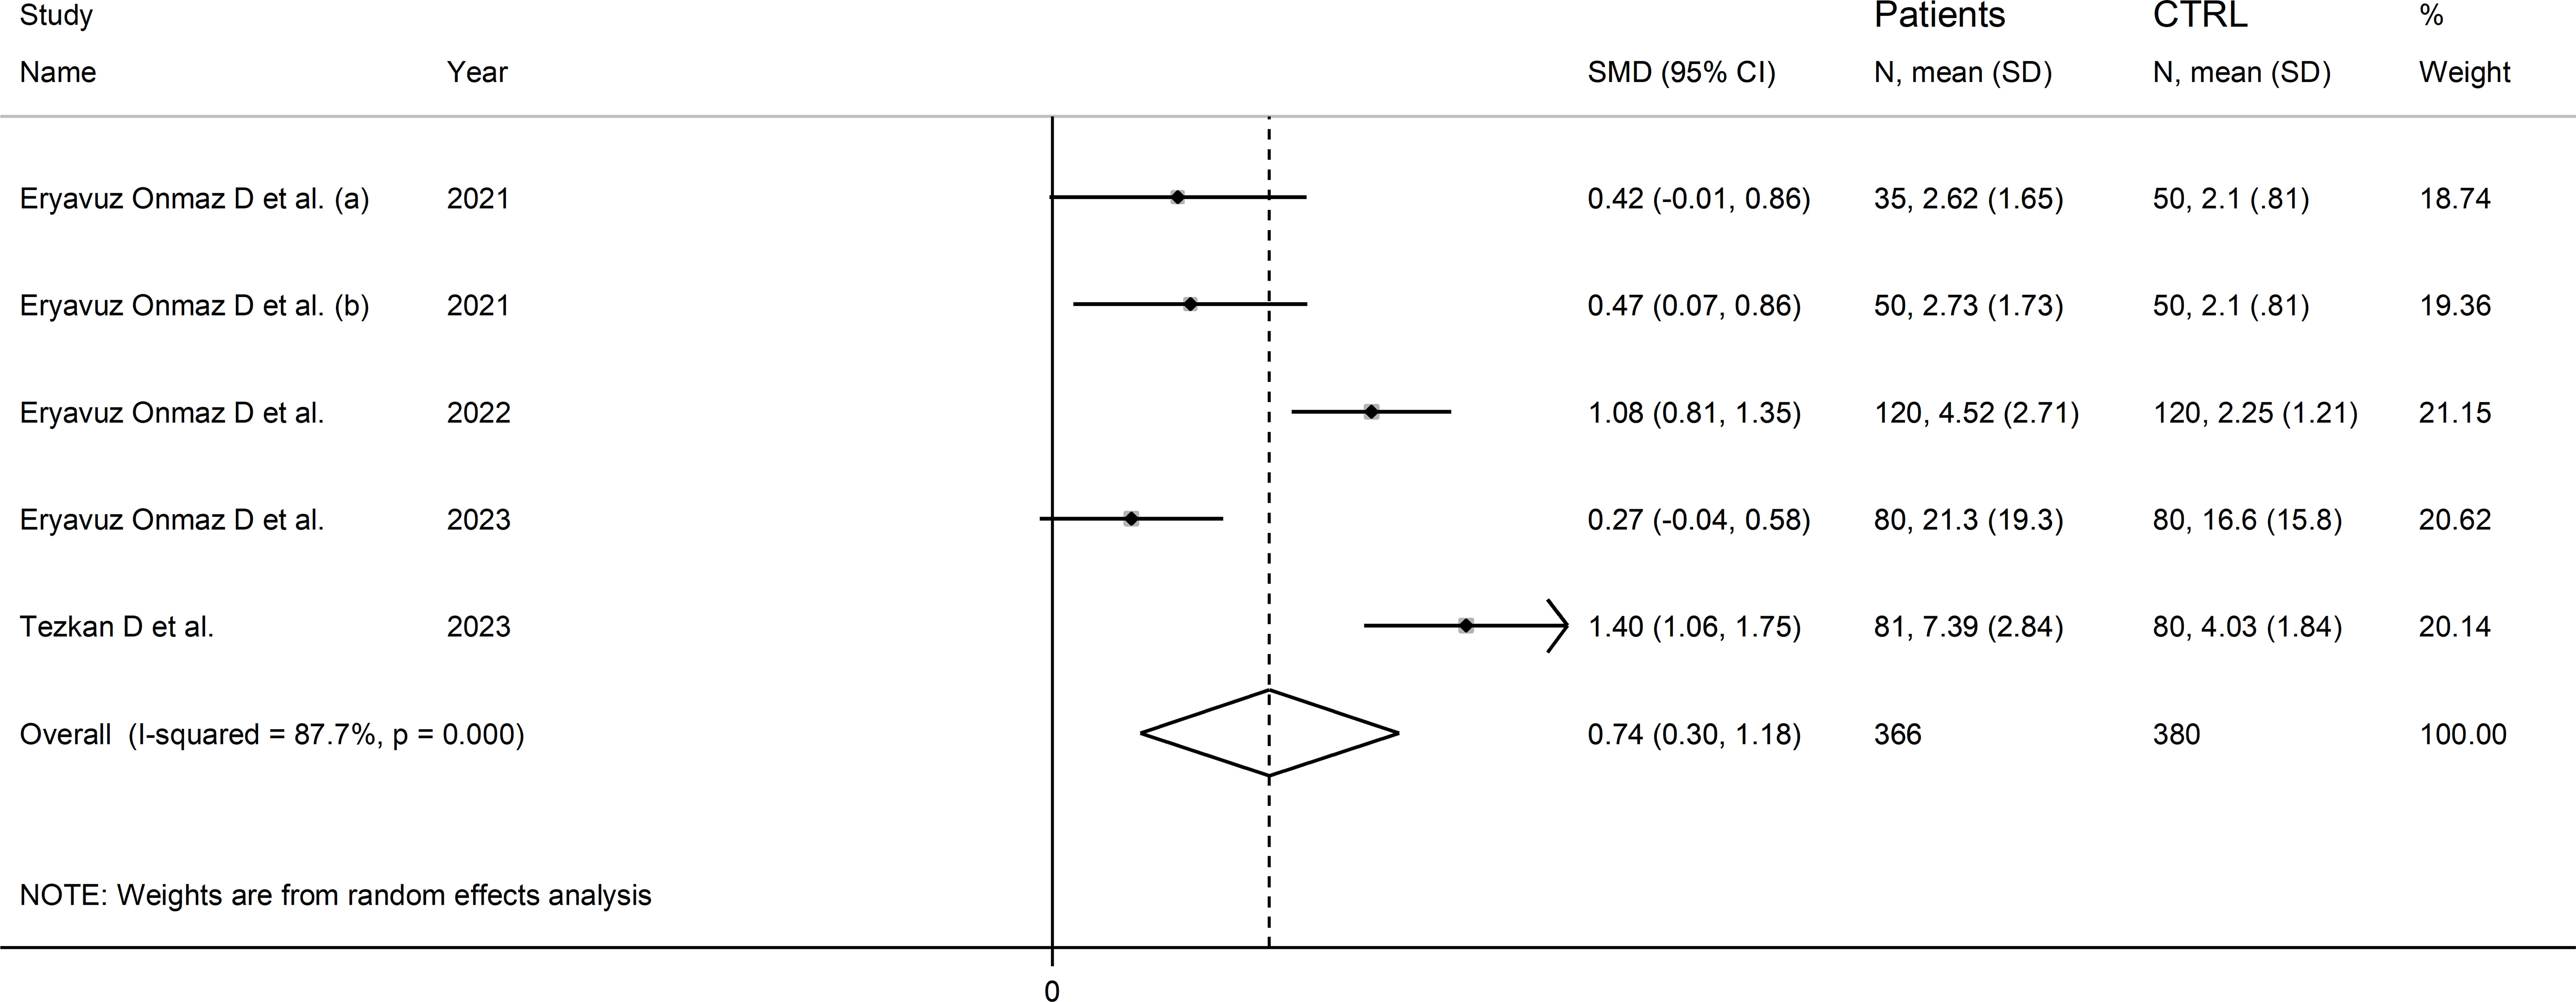
Figure 11 Forest plot of studies reporting 3-hydroxykynurenine concentrations in patients with rheumatic disease and healthy controls.
The limited number of studies prevented the assessment of publication bias and the conduct of meta-regression and subgroup analyses.
The certainty of evidence was downgraded to extremely low (rating 0, ⊝⊝⊝⊝) after considering the low-moderate risk of bias in all studies (no rating change), the high and unexplainable heterogeneity (downgrade one level), the lack of indirectness (no rating change), and the lack of assessment of publication bias (downgrade one level).
Quinolinic acid
Six studies (seven comparator groups) reported the concentrations of quinolinic acid in a total of 579 RD patients (mean age 45 years, 35% males) and 440 controls (mean age 42 years, 39% males; Table 1) (35, 40, 42, 46–48). Five studies were conducted in Asia (40, 42, 46–48), and the remaining one in Europe (35). Two study groups included individuals with AS (40), two with pSS (46, 47), and one with SLE (35), one BD (42), and FMF (48), respectively. The method used was liquid chromatography with mass spectrometry in five study groups (40, 42, 46, 48), gas chromatography with mass spectrometry in one (35), and ELISA in the remaining one (47). All studies assessed serum, barring one which assessed plasma (35). The risk of bias (Supplementary Table 3) was moderate in two studies (35, 47), and low in the remaining four (40, 42, 46, 48).
The forest plot showed that the concentrations of quinolinic acid were significantly higher in RD patients compared to healthy controls (SMD=0.71, 95% CI 0.31 to 1.11, p<0.001; I2 = 88.1%, p<0.001; Figure 12). Sensitivity analysis showed that the corresponding pooled SMD values were not influenced by sequentially removing individual studies (effect size range between 0.59 and 0.87; Supplementary Figure 13).
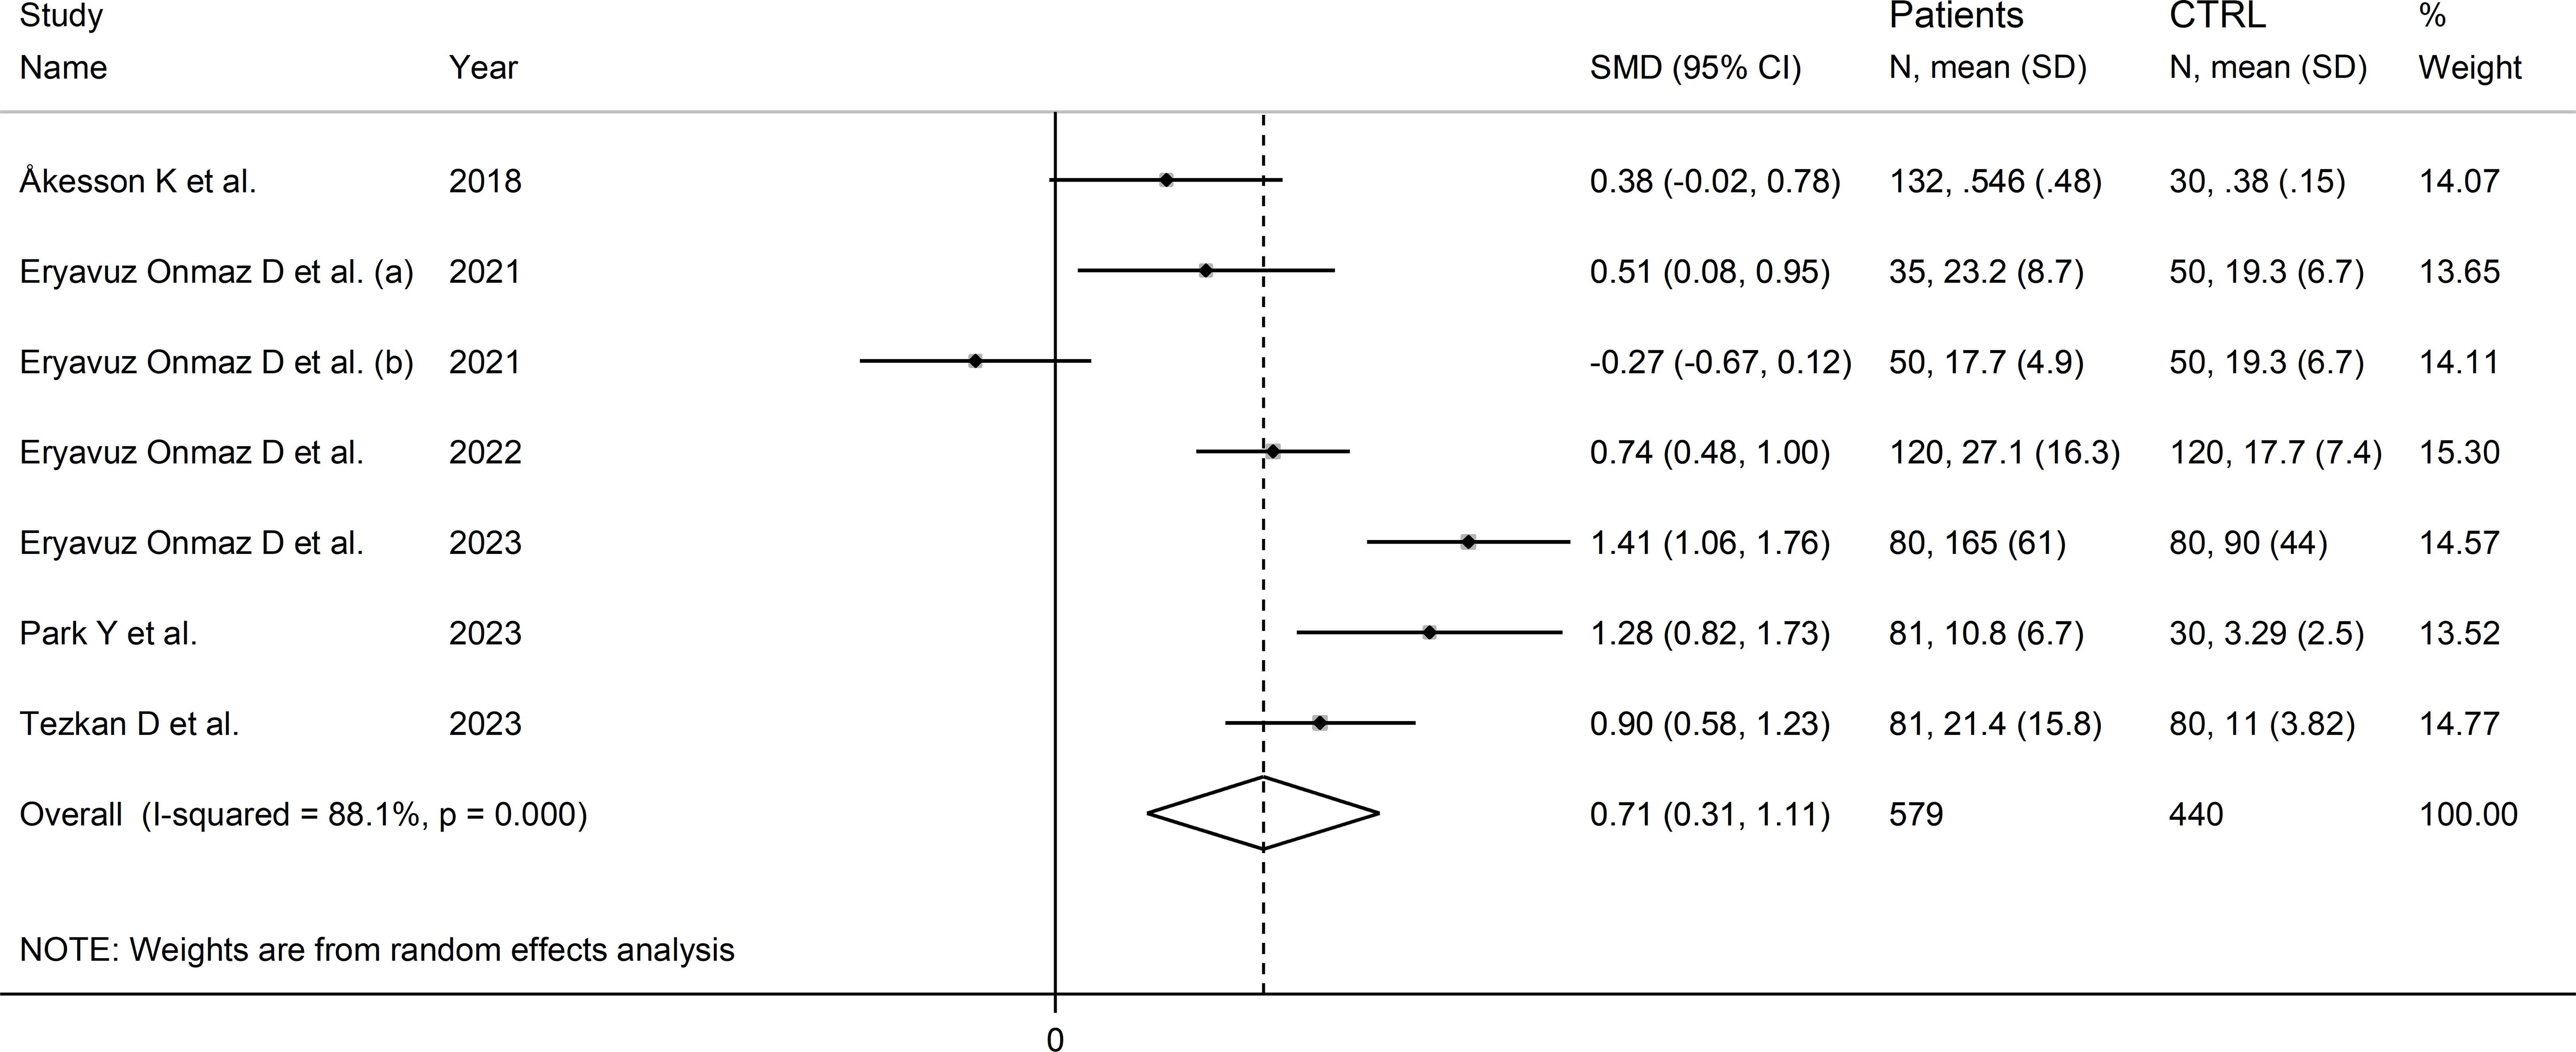
Figure 12 Forest plot of studies reporting the concentrations of quinolinic acid in patients with rheumatic disease and healthy controls.
The limited number of studies prevented the assessment of publication bias and the conduct of meta-regression and subgroup analyses.
The certainty of evidence was downgraded to extremely low (rating 0, ⊝⊝⊝⊝) after considering the low-moderate risk of bias in all studies (no rating change), the high and unexplainable heterogeneity (downgrade one level), the lack of indirectness (no rating change), and the lack of assessment of publication bias (downgrade one level).
Kynurenic acid to kynurenine ratio
Two Asian studies reported the kynurenine acid to kynurenine ratio in a total of 110 RD patients (mean age 43 years, 7% males) and 160 healthy controls (mean age 47 years, 26% males; Table 1) (30, 46). One study included individuals with SLE (30), and one with pSS (46). Liquid chromatography was used in both studies, one with mass spectrometry detection (46), and the other with fluorimetric detection (30). Serum was analysed in both studies. The risk of bias (Supplementary Table 3) was moderate in one study (30) and low in the other (46).
The forest plot showed that the kynurenine acid to kynurenine ratio was non-significantly different between RD patients and controls (SMD=-0.51, 95% CI -1.23 to 0.21, p=0.17; I2 = 86.5%, p=0.006; Figure 13).
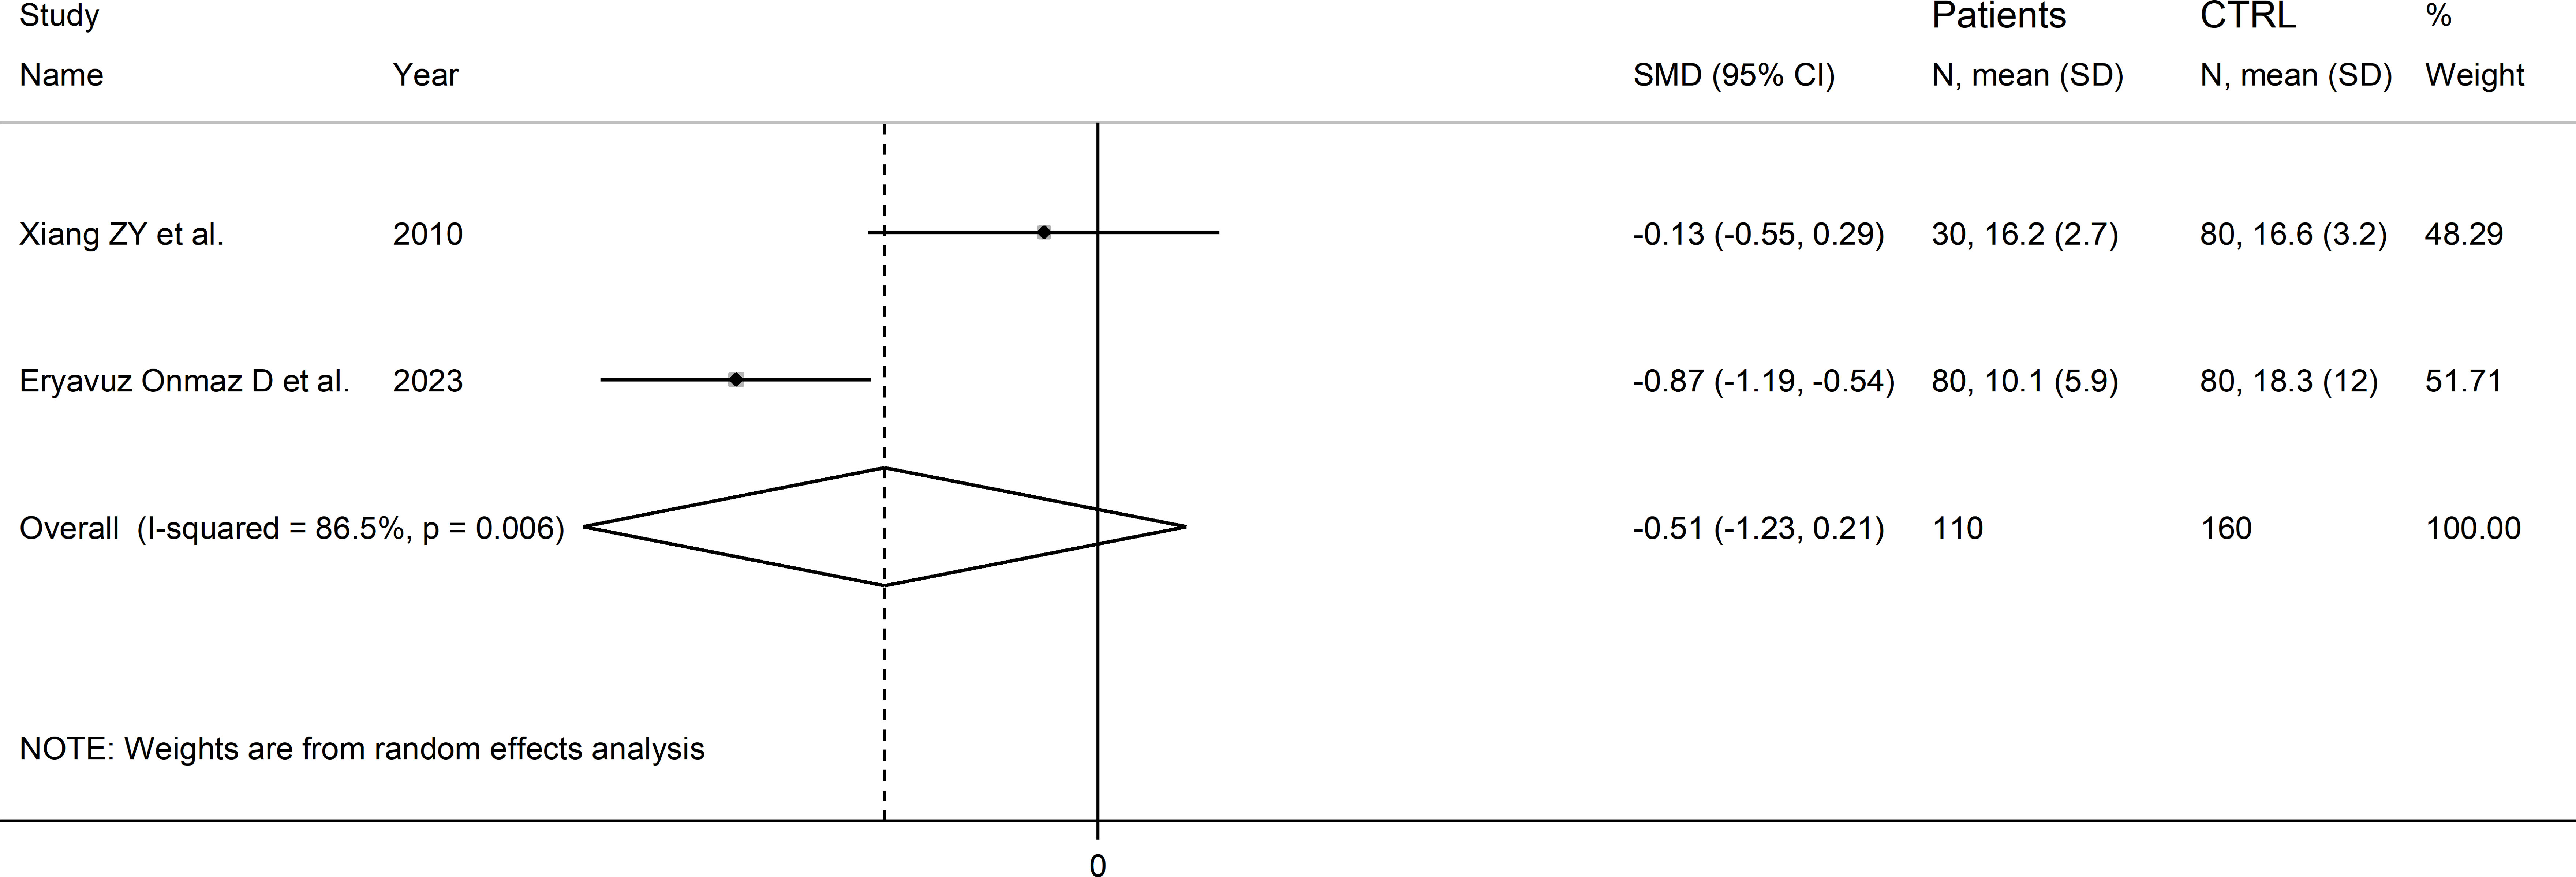
Figure 13 Forest plot of studies reporting the kynurenine acid to kynurenine ratio in patients with rheumatic disease and healthy controls.
The limited number of studies prevented sensitivity analysis, the assessment of publication bias, and the conduct of meta-regression and subgroup analyses.
The certainty of evidence was downgraded to extremely low (rating 0, ⊝⊝⊝⊝) after considering the low-moderate risk of bias in all studies (no rating change), the high and unexplainable heterogeneity (downgrade one level), the lack of indirectness (no rating change), and the lack of assessment of publication bias (downgrade one level).
Quinolinic acid to kynurenine acid ratio
Two studies reported the quinolinic acid to kynurenine acid ratio in a total of 154 RD patients (mean age 45 years) and 154 healthy controls (mean age 44 years; Table 1) (39, 46). One study was conducted in Asia (46), and the other in America (39). One study included individuals with SLE (39), and the other with pSS (46). In both studies, serum was assessed using liquid chromatography with mass spectrometry detection and the risk of bias was low (Supplementary Figure 3) (39, 46).
The forest plot showed the absence of significant between-group differences in the quinolinic acid to kynurenine acid ratio (SMD=0.66, 95% CI -0.13 to 1.45, p=0.10, I2 = 91.3%, p=0.001; Figure 14).
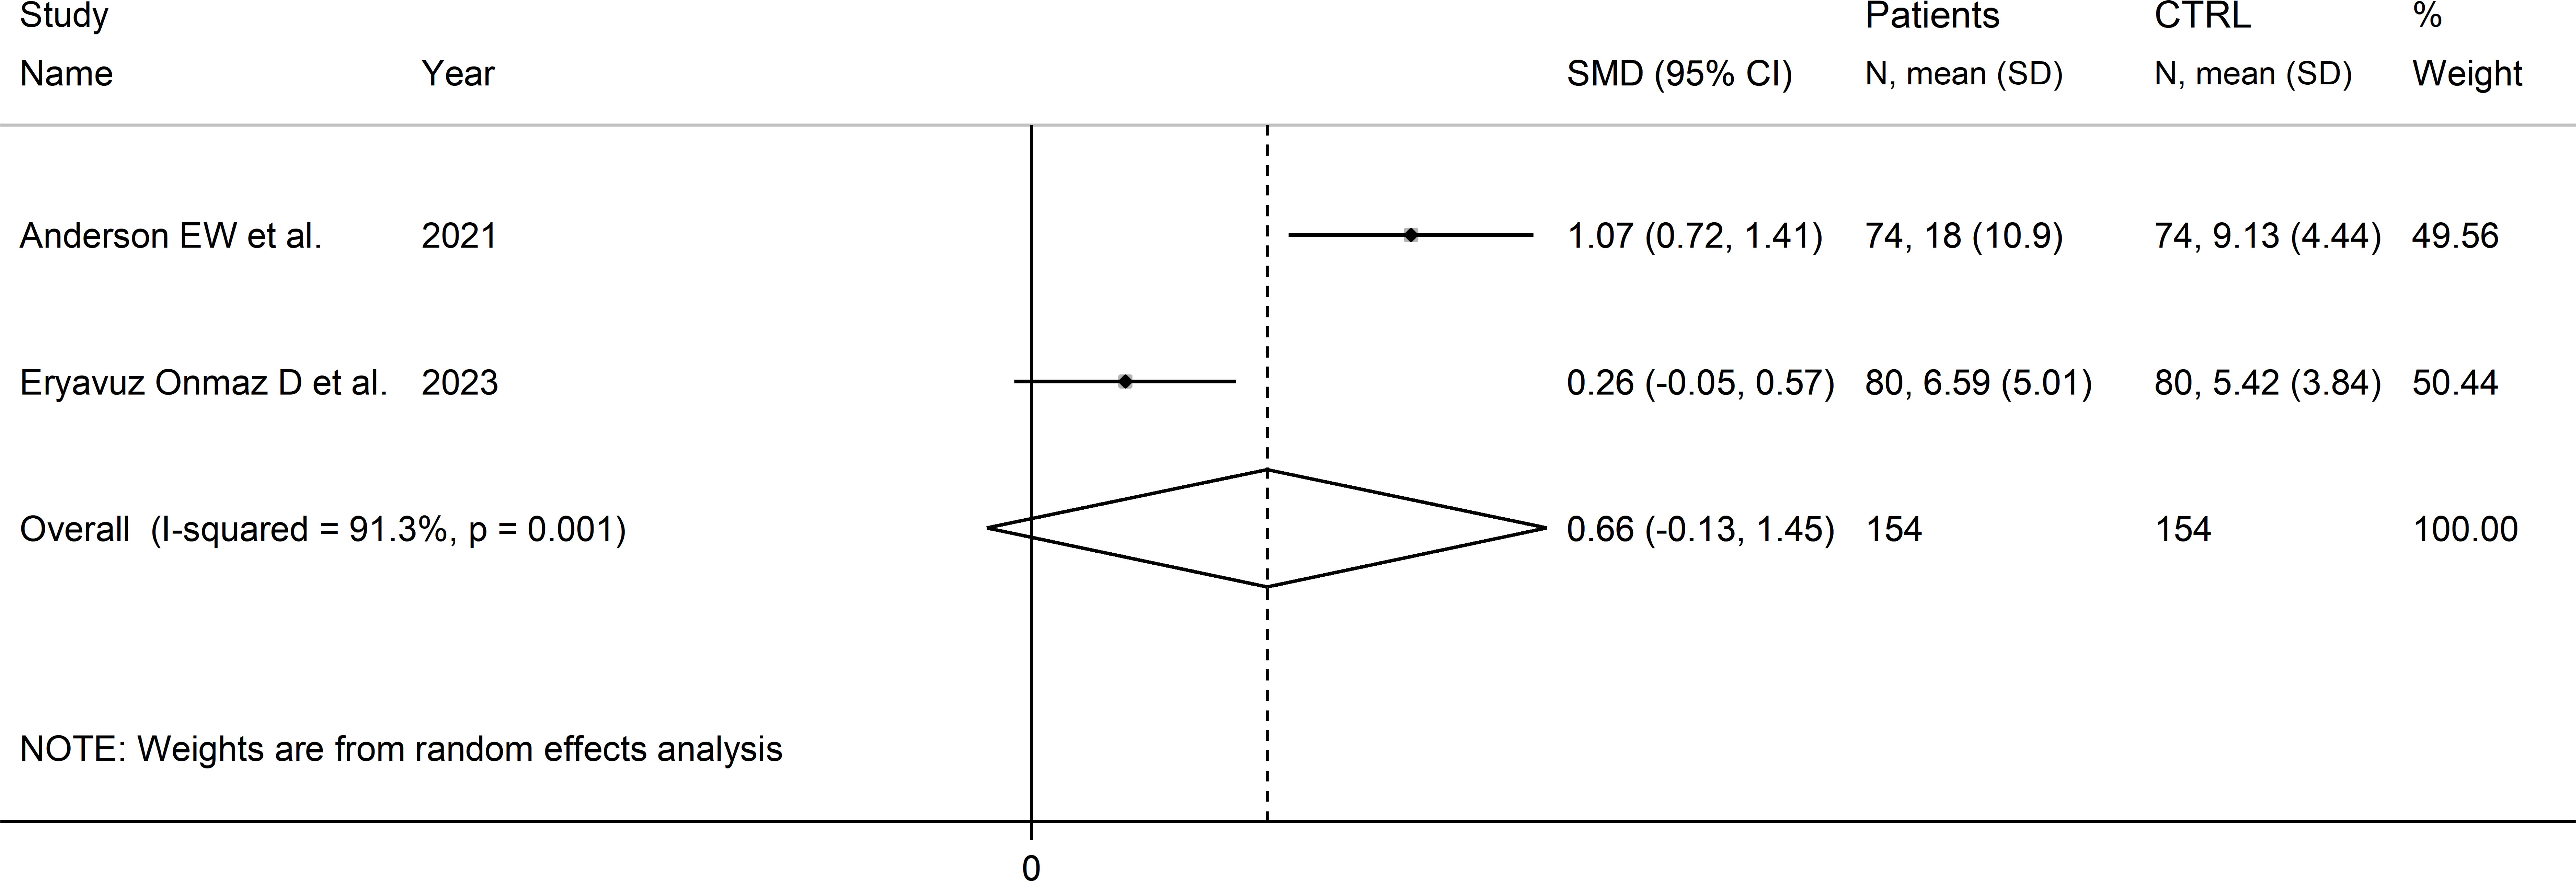
Figure 14 Forest plot of studies reporting the quinolinic acid to kynurenine acid ratio in patients with rheumatic disease and healthy controls.
The limited number of studies prevented sensitivity analysis, the assessment of publication, and the conduct of meta-regression and subgroup analyses.
The certainty of evidence was downgraded to extremely low (rating 0, ⊝⊝⊝⊝) after considering the low-moderate risk of bias in all studies (no rating change), the high and unexplainable heterogeneity (downgrade one level), the lack of indirectness (no rating change), and the lack of assessment of publication bias (downgrade one level).
Discussion
In this systematic review and meta-analysis, we have observed significant alterations in metabolites within the kynurenine pathway of tryptophan metabolism in patients with RD. Specifically, RD was associated with significantly lower tryptophan concentrations and higher kynurenine, kynurenine to tryptophan ratios, 3-hydroxykynurenine, and quinolinic acid concentrations. By contrast, there were non-significant between-group differences in kynurenic acid, 3-hydroxyanthranilic acid, kynurenic acid to kynurenine ratio, or quinolinic acid to kynurenine acid ratio. In meta-regression, the SMD of tryptophan, kynurenine, and kynurenine to tryptophan ratio were not associated with age, publication year, sample size, RD duration, C-reactive protein, or use of anti-rheumatic drugs and corticosteroids. In subgroup analysis, the SMD of tryptophan, kynurenine, and kynurenine to tryptophan ratio were statistically significant in different types of RD, barring rheumatoid arthritis. Whilst our meta-analysis on tryptophan, kynurenine, and kynurenine to tryptophan ratio included a substantial number of studies, between 17 and 21, caution is required with data interpretation in view of the relatively low certainty of evidence in our analysis, particularly when investigating other metabolites, suggesting the need for additional research to confirm or refute our findings.
The biotransformation of tryptophan to kynurenine via the intermediate N′-formylkynurenine, a critical step within the kynurenine pathway, is regulated by the enzymes tryptophan 2,3-dioixygenase (TDO) in the liver and indoleamine 2,3-dioxygenase (IDO) extra-hepatically (Figure 1) (2, 3). A substantial number of studies have demonstrated a distinct regulation of these enzymes. TDO is upregulated by the substrate tryptophan, the cofactor heme, and glucocorticoids, and downregulated by the end-product NAD(P)H (2, 3, 51). By contrast, IDO can be inhibited by excess tryptophan, the endogenous messenger, nitric oxide, and anti-inflammatory cytokines, e.g., interleukin-4, interleukin-10, and transforming growth factor beta, and upregulated either directly or indirectly by pro-inflammatory cytokines such as interferon gamma, interferon alpha, interleukin-1β, tumour necrosis factor alpha, and interleukin-2 (2, 3, 51–53). Therefore, the observation of a relative deficiency of tryptophan and excess of kynurenine, with a consequent increase in the kynurenine to tryptophan ratio, suggests the increased contribution of extra-hepatic IDO in tryptophan metabolism in RD, possibly mediated by IDO upregulation by pro-inflammatory cytokines, a common finding in these patients (54–56). However, the putative activation of extra-hepatic IDO could also be secondary to a relative deficiency in systemic nitric oxide, a key endogenous regulator of several biological processes such as vascular homeostasis, immune function, and neuroplasticity (57, 58). This mechanism could be relevant given the evidence of a dysregulation in nitric oxide pathways in several types of RD, and the consequent increased risk of endothelial dysfunction, atherosclerosis, and cardiovascular disease in these patients (59–66). However, it is important to emphasise that the lack of information regarding the measurement of specific cytokines and nitric oxide metabolites in the studies selected in our literature search prevented the conduct of further analyses to investigate possible associations between these molecules and the observed between-group differences in tryptophan, kynurenine, and kynurenine to tryptophan ratio. Therefore, further research is warranted to investigate this important issue.
Interestingly, in meta-regression the SMD values of tryptophan, kynurenine, and kynurenine to tryptophan ratios were not significantly associated with CRP, a conventional biomarker of systemic inflammation that is routinely used for the diagnosis and management of patients with RD (67–69). Whilst this observation suggests that alterations in tryptophan and kynurenine are not necessarily correlated with CRP elevations, further research is required to determine whether the measurement of these metabolites significantly enhances diagnostic capacity, particularly in early disease, over and above available criteria for RD (70–74). Another interesting observation, in subgroup analysis, was the different association between the reported alterations in tryptophan and kynurenine concentrations in specific types of RD. For example, the SMD of the kynurenine to tryptophan ratio was statistically significant in SLE, pSS, and autoimmune RD type, but not RA, AS, or mixed autoimmune-autoinflammatory RD type. Once again, future studies should investigate whether kynurenine metabolites are useful for the diagnosis and management of specific types of RD. This proposition is supported by the results of an elegant study reporting the utility of kynurenine pathway metabolomics in discriminating clinical subtypes in patients with multiple sclerosis and identifying those at risk of progression (75). Importantly, the absence of significant differences in the effect size between Asian and European studies downplays the potential role of ethnicity as a factor influencing the link between the kynurenine pathway and RD and confirms the results of previous studies investigating this issue (76).
Other significant RD-associated alterations in the kynurenine pathway observed in our study involved the metabolites 3-hydroxykynurenine and quinolinic acid. 3-hydroxykynurenine, derived from kynurenine by kynurenine hydroxylase, has been shown to exert a bi-modal pro-oxidant and antioxidant effect in the central nervous system (77). Further studies have also highlighted the potential for this molecule to bind to α-synuclein and amyloid-beta peptides, with the potential of triggering neuro-inflammatory and neurotoxic processes (78). Quinolinic acid has been extensively investigated as an N-methyl-D-aspartate receptor agonist with pro-oxidant and neurotoxic effects and as a biomarker of neurodegenerative and depressive disorders and inflammatory states (79–83). The results of our systematic review and meta-analysis extend the potential role of 3-hydroxykynurenine and quinolinic acid to the pathophysiology of RD and warrant further research to investigate their local and systemic effects in autoimmune and autoinflammatory conditions, and their role in the reported associations between RD and neuropsychiatric disorders (84–86).
An important additional issue, not investigated in our study, is related to the potential role of dietary factors as well as physical activity in modulating the complex interplay between the kynurenine pathway of tryptophan metabolism and RD. Emerging evidence underscores the role of diet in shaping the kynurenine pathway, thereby affecting the metabolism of tryptophan (87–89). A high-fat diet, for instance, has been shown to modify the flux of metabolites along the kynurenine pathway, suggesting that diet could potentially introduce a confounding element in studies comparing metabolite profiles between RD patients and healthy individuals. Additionally, recent studies have reported that downstream metabolites of kynurenine, particularly kynurenic acid, are increased in muscle biopsies of physically active adults, including after an acute endurance exercise, and associated with cardiorespiratory fitness (90–92). Therefore, future studies should also consider dietary habits and patterns of physical activity as potential factors contributing to the observed variations in the concentrations of tryptophan metabolites. Furthermore, the concept of a comorbidome, referring to the collective presence of multiple comorbid conditions in a patient, introduces another layer of complexity. For example, recent studies have reported that comorbid conditions can interact with the kynurenine pathway and potentially alter the concentrations of tryptophan metabolites (93). Considering the intricate interplay between various medical conditions and metabolic pathways, it is plausible that the presence of a distinct comorbidome might confound the association between RD and tryptophan metabolites in individual patients.
Our systematic review and meta-analysis have several strengths, including the comprehensive assessment of the kynurenine pathway in a wide range of RD types, the study of possible associations between the effect size of between-group differences and clinical and demographic characteristics and analytical methods used, and a rigorous assessment of the risk of bias and the certainty of evidence. A significant limitation is represented by the high between-study heterogeneity observed. However, we were able to identify specific sources of heterogeneity in subgroup analyses for tryptophan (analytical method and matrix used), kynurenine (type of RD and matrix used), kynurenine to tryptophan ratio (analytical method and matrix used). Furthermore, sensitivity analysis ruled out the effect of individual studies on the overall effect size.
In conclusion, this systematic review and meta-analysis has demonstrated the presence of significant alterations in metabolites within the kynurenine pathway of tryptophan metabolism in patients with RD, particularly tryptophan, kynurenine, 3-hydroxykynureine, and quinolinic acid. Further studies, particularly in view of the relatively low certainty of evidence in our analysis, are required to determine the capacity of kynurenine metabolites to identify early and overt types of RD over and above existing clinical criteria and biomarkers with a view to improve the management and quality of life in this complex patient population.
Data availability statement
The original contributions presented in the study are included in the article/Supplementary Material. Further inquiries can be directed to the corresponding author.
Author contributions
AM: Conceptualization, Methodology, Validation, Visualization, Writing – original draft, Writing – review & editing. AZ: Conceptualization, Data curation, Investigation, Methodology, Validation, Writing – review & editing.
Funding
The author(s) declare that no financial support was received for the research, authorship, and/or publication of this article.
Conflict of interest
The authors declare that the research was conducted in the absence of any commercial or financial relationships that could be construed as a potential conflict of interest.
The author(s) declared that they were an editorial board member of Frontiers, at the time of submission. This had no impact on the peer review process and the final decision.
Publisher’s note
All claims expressed in this article are solely those of the authors and do not necessarily represent those of their affiliated organizations, or those of the publisher, the editors and the reviewers. Any product that may be evaluated in this article, or claim that may be made by its manufacturer, is not guaranteed or endorsed by the publisher.
Supplementary material
The Supplementary Material for this article can be found online at: https://www.frontiersin.org/articles/10.3389/fimmu.2023.1257159/full#supplementary-material
Supplementary Figure 1 | Sensitivity analysis of the association between tryptophan concentrations and rheumatic disease.
Supplementary Figure 2 | Funnel plot of studies investigating associations between tryptophan and rheumatic disease after “trimming-and-filling”.
Supplementary Figure 3 | Forest plot of studies investigating tryptophan concentrations in patients and controls according to the presence of autoimmune, mixed autoimmune-autoinflammatory, or autoinflammatory disease.
Supplementary Figure 4 | Sensitivity analysis of the association between kynurenine concentrations and rheumatic disease.
Supplementary Figure 5 | Funnel plot of studies investigating the association between kynurenine and rheumatic disease after “trimming-and-filling”.
Supplementary Figure 6 | Forest plot of studies investigating kynurenine concentrations in patients and controls according to the presence of autoimmune, mixed autoimmune-autoinflammatory, or autoinflammatory disease.
Supplementary Figure 7 | Sensitivity analysis of the association between the kynurenine/tryptophan ratio and rheumatic disease.
Supplementary Figure 8 | Funnel plot of studies investigating the association between the kynurenine/tryptophan ratio and rheumatic disease after “trimming-and-filling”.
Supplementary Figure 9 | Forest plot of studies reporting the kynurenine/tryptophan ratio in patients and controls according to the presence of autoimmune, mixed autoimmune-autoinflammatory, or autoinflammatory diseases.
Supplementary Figure 10 | Sensitivity analysis of the association between kynurenic acid concentrations and rheumatic disease.
Supplementary Figure 11 | Sensitivity analysis of the association between 3-hydroxyanthranilic acid concentrations and rheumatic disease.
Supplementary Figure 12 | Sensitivity analysis of the association between 3-hydroxykynurenine concentrations and rheumatic disease.
Supplementary Figure 13 | Sensitivity analysis of the association between quinolinic acid concentrations and rheumatic disease.
References
1. Bender DA. Biochemistry of tryptophan in health and disease. Mol Aspects Med (1983) 6(2):101–97. doi: 10.1016/0098-2997(83)90005-5
2. Badawy AA. Tryptophan metabolism, disposition and utilization in pregnancy. Biosci Rep (2015) 35(5):e00261. doi: 10.1042/BSR20150197
3. Badawy AA. Kynurenine pathway of tryptophan metabolism: regulatory and functional aspects. Int J Tryptophan Res (2017) 10:1178646917691938. doi: 10.1177/1178646917691938
4. Athnaiel O, Ong C, Knezevic NN. The role of kynurenine and its metabolites in comorbid chronic pain and depression. Metabolites (2022) 12(10):950. doi: 10.3390/metabo12100950
5. Huang YS, Ogbechi J, Clanchy FI, Williams RO, Stone TW. IDO and kynurenine metabolites in peripheral and CNS disorders. Front Immunol (2020) 11:388. doi: 10.3389/fimmu.2020.00388
6. Chen LM, Bao CH, Wu Y, Liang SH, Wang D, Wu LY, et al. Tryptophan-kynurenine metabolism: a link between the gut and brain for depression in inflammatory bowel disease. J Neuroinflamm (2021) 18(1):135. doi: 10.1186/s12974-021-02175-2
7. Comai S, Bertazzo A, Brughera M, Crotti S. Tryptophan in health and disease. Adv Clin Chem (2020) 95:165–218. doi: 10.1016/bs.acc.2019.08.005
8. Wang Q, Liu D, Song P, Zou MH. Tryptophan-kynurenine pathway is dysregulated in inflammation, and immune activation. Front Biosci (Landmark Ed) (2015) 20(7):1116–43. doi: 10.2741/4363
9. Calle E, Gómez-Puerta JA. The spectrum of rheumatic diseases. Surgery in rheumatic and musculoskeletal disease. Handb Syst Autoimmune Dis (2018) 15:1–13. doi: 10.1016/B978-0-444-63887-8.00001-3
10. McGonagle D, McDermott MF. A proposed classification of the immunological diseases. PloS Med (2006) 3(8):e297. doi: 10.1371/journal.pmed.0030297
11. Moutsopoulos HM. Autoimmune rheumatic diseases: One or many diseases? J Transl Autoimmun (2021) 4:100129. doi: 10.1016/j.jtauto.2021.100129
12. Mallen CD, Helliwell T, Scott IC. How can primary care physicians enhance the early diagnosis of rheumatic diseases? Expert Rev Clin Immunol (2018) 14(3):171–3. doi: 10.1080/1744666X.2018.1429919
13. Mohan C, Assassi S. Biomarkers in rheumatic diseases: how can they facilitate diagnosis and assessment of disease activity? BMJ (2015) 351:h5079. doi: 10.1136/bmj.h5079
14. Guma M, Tiziani S, Firestein GS. Metabolomics in rheumatic diseases: desperately seeking biomarkers. Nat Rev Rheumatol (2016) 12(5):269–81. doi: 10.1038/nrrheum.2016.1
15. Moola S, Munn Z, Tufanaru C, Aromataris E, Sears K, Sfetcu R, et al. Systematic reviews of etiology and risk. In: Aromataris E, Munn Z, editors. Joanna Briggs Institute Reviewer’s Manual. Adelaide, Australia: Johanna Briggs Institute (2017).
16. Balshem H, Helfand M, Schunemann HJ, Oxman AD, Kunz R, Brozek J, et al. GRADE guidelines: 3. Rating the quality of evidence. J Clin Epidemiol (2011) 64(4):401–6. doi: 10.1016/j.jclinepi.2010.07.015
17. Page MJ, McKenzie JE, Bossuyt PM, Boutron I, Hoffmann TC, Mulrow CD, et al. The PRISMA 2020 statement: an updated guideline for reporting systematic reviews. BMJ (2021) 372:n71. doi: 10.1136/bmj.n71
18. Wan X, Wang W, Liu J, Tong T. Estimating the sample mean and standard deviation from the sample size, median, range and/or interquartile range. BMC Med Res Methodol (2014) 14:135. doi: 10.1186/1471-2288-14-135
19. Hozo SP, Djulbegovic B, Hozo I. Estimating the mean and variance from the median, range, and the size of a sample. BMC Med Res Methodol (2005) 5:13. doi: 10.1186/1471-2288-5-13
20. Higgins JP, Thompson SG. Quantifying heterogeneity in a meta-analysis. Stat Med (2002) 21(11):1539–58. doi: 10.1002/sim.1186
21. Higgins JP, Thompson SG, Deeks JJ, Altman DG. Measuring inconsistency in meta-analyses. BMJ (2003) 327(7414):557–60. doi: 10.1136/bmj.327.7414.557
22. Tobias A. Assessing the influence of a single study in the meta-analysis estimate. Stata Tech Bull (1999) 47:15–7.
23. Begg CB, Mazumdar M. Operating characteristics of a rank correlation test for publication bias. Biometrics (1994) 50(4):1088–101. doi: 10.2307/2533446
24. Sterne JA, Egger M. Funnel plots for detecting bias in meta-analysis: guidelines on choice of axis. J Clin Epidemiol (2001) 54(10):1046–55. doi: 10.1016/s0895-4356(01)00377-8
25. Duval S, Tweedie R. Trim and fill: A simple funnel-plot-based method of testing and adjusting for publication bias in meta-analysis. Biometrics (2000) 56(2):455–63. doi: 10.1111/j.0006-341x.2000.00455.x
26. Csipo I, Czirjak L, Szanto S, Szerafin L, Sipka S, Szegedi G. Decreased serum tryptophan and elevated neopterin levels in systemic sclerosis. Clin Exp Rheumatol (1995) 13(2):269–70.
27. Widner B, Sepp N, Kowald E, Ortner U, Wirleitner B, Fritsch P, et al. Enhanced tryptophan degradation in systemic lupus erythematosus. Immunobiology (2000) 201(5):621–30. doi: 10.1016/S0171-2985(00)80079-0
28. Schroecksnadel K, Kaser S, Ledochowski M, Neurauter G, Mur E, Herold M, et al. Increased degradation of tryptophan in blood of patients with rheumatoid arthritis. J Rheumatol (2003) 30(9):1935–9.
29. Pertovaara M, Raitala A, Uusitalo H, Pukander J, Helin H, Oja SS, et al. Mechanisms dependent on tryptophan catabolism regulate immune responses in primary Sjogren's syndrome. Clin Exp Immunol (2005) 142(1):155–61. doi: 10.1111/j.1365-2249.2005.02889.x
30. Xiang ZY, Tang AG, Ren YP, Zhou QX, Luo XB. Simultaneous determination of serum tryptophan metabolites in patients with systemic lupus erythematosus by high performance liquid chromatography with fluorescence detection. Clin Chem Lab Med (2010) 48(4):513–7. doi: 10.1515/CCLM.2010.105
31. Ozkan Y, Mete G, Sepici-Dincel A, Sepici V, Simsek B. Tryptophan degradation and neopterin levels in treated rheumatoid arthritis patients. Clin Rheumatol (2012) 31(1):29–34. doi: 10.1007/s10067-011-1767-5
32. Lood C, Tyden H, Gullstrand B, Klint C, Wenglen C, Nielsen CT, et al. Type I interferon-mediated skewing of the serotonin synthesis is associated with severe disease in systemic lupus erythematosus. PloS One (2015) 10(4):e0125109. doi: 10.1371/journal.pone.0125109
33. Maria NI, van Helden-Meeuwsen CG, Brkic Z, Paulissen SM, Steenwijk EC, Dalm VA, et al. Association of increased treg cell levels with elevated indoleamine 2,3-dioxygenase activity and an imbalanced kynurenine pathway in interferon-positive primary Sjogren's syndrome. Arthritis Rheumatol (2016) 68(7):1688–99. doi: 10.1002/art.39629
34. Smolenska Z, Smolenski RT, Zdrojewski Z. Plasma concentrations of amino acid and nicotinamide metabolites in rheumatoid arthritis–potential biomarkers of disease activity and drug treatment. Biomarkers (2016) 21(3):218–24. doi: 10.3109/1354750X.2015.1130746
35. Akesson K, Pettersson S, Stahl S, Surowiec I, Hedenstrom M, Eketjall S, et al. Kynurenine pathway is altered in patients with SLE and associated with severe fatigue. Lupus Sci Med (2018) 5(1):e000254. doi: 10.1136/lupus-2017-000254
36. Urbaniak B, Plewa S, Klupczynska A, Sikorska D, Samborski W, Kokot ZJ. Serum free amino acid levels in rheumatoid arthritis according to therapy and physical disability. Cytokine (2019) 113:332–9. doi: 10.1016/j.cyto.2018.10.002
37. Smolenska Z, Zabielska-Kaczorowska M, Wojteczek A, Kutryb-Zajac B, Zdrojewski Z. Metabolic pattern of systemic sclerosis: association of changes in plasma concentrations of amino acid-related compounds with disease presentation. Front Mol Biosci (2020) 7:585161. doi: 10.3389/fmolb.2020.585161
38. Zhou Y, Zhang X, Chen R, Han S, Liu Y, Liu X, et al. Serum amino acid metabolic profiles of ankylosing spondylitis by targeted metabolomics analysis. Clin Rheumatol (2020) 39(8):2325–36. doi: 10.1007/s10067-020-04974-z
39. Anderson EW, Fishbein J, Hong J, Roeser J, Furie RA, Aranow C, et al. Quinolinic acid, a kynurenine/tryptophan pathway metabolite, associates with impaired cognitive test performance in systemic lupus erythematosus. Lupus Sci Med (2021) 8(1):e000559. doi: 10.1136/lupus-2021-000559
40. Eryavuz Onmaz D, Sivrikaya A, Isik K, Abusoglu S, Albayrak Gezer I, Humeyra Yerlikaya F, et al. Altered kynurenine pathway metabolism in patients with ankylosing spondylitis. Int Immunopharmacol (2021) 99:108018. doi: 10.1016/j.intimp.2021.108018
41. Kor A, Erten Ş, Yurt EF, Dogan İ, Apaydin H, Aserdar M, et al. Clinical significance of plasma tryptophan, kynurenine, and kynurenine/tryptophan ratio in rheumatoid arthritis patients. Egypt Rheumatol (2022) 44(4):367–71. doi: 10.1016/j.ejr.2022.07.005
42. Eryavuz Onmaz D, Tezcan D, Abusoglu S, Sivrikaya A, Kuzu M, Yerlikaya FH, et al. Elevated serum levels of kynurenine pathway metabolites in patients with Behcet disease. Amino Acids (2022) 54(6):877–87. doi: 10.1007/s00726-022-03170-4
43. Pellicano C, Vaiarello V, Colalillo A, Gigante A, Iannazzo F, Rosato E. Role of kinurenic acid in the systemic sclerosis renal involvement. Clin Exp Med (2022) (5):1713–9. doi: 10.1007/s10238-022-00962-6
44. Apaydin H, Koca Bicer C, Feyza Yurt E, Abdulkadir Serdar M, Dogan I, Erten S. Elevated kynurenine levels in patients with primary Sjogren's syndrome. Lab Med (2023) 54(2):166–72. doi: 10.1093/labmed/lmac084
45. Jeon C, Jang Y, Lee SH, Weon S, Park H, Lee S, et al. Abnormal kynurenine level contributes to the pathological bone features of ankylosing spondylitis. Int Immunopharmacol (2023) 118:110132. doi: 10.1016/j.intimp.2023.110132
46. Eryavuz Onmaz D, Tezcan D, Abusoglu S, Sak F, Humeyra Yerlikaya F, Yilmaz S, et al. Impaired kynurenine metabolism in patients with primary Sjogren's syndrome. Clin Biochem (2023) 114:1–10. doi: 10.1016/j.clinbiochem.2023.01.007
47. Park Y, Lee JJ, Koh JH, Kim MJ, Park SH, Kwok SK. Kynurenine pathway can be a potential biomarker of fatigue in primary Sjogren's syndrome. Clin Exp Rheumatol (2023). doi: 10.55563/clinexprheumatol/cp4st9 (In press).
48. Tezcan D, Onmaz DE, Sivrikaya A, Korez MK, Hakbilen S, Gulcemal S, et al. Kynurenine pathway of tryptophan metabolism in patients with familial Mediterranean fever. Mod Rheumatol (2023) 33(2):398–407. doi: 10.1093/mr/roac016
49. Yurt EF, Bicer C, Serdar MA, Akan S, Erten S. Accelerated kynurenine pathway downregulates immune activation in patients with axial spondyloarthritis. Cytokine (2023) 169:156247. doi: 10.1016/j.cyto.2023.156247
50. Cohen J. Statistical power analysis. Curr Dir Psychol Sci (1992) 1(3):98–101. doi: 10.1111/1467-8721.ep10768783
51. Newton A, McCann L, Huo L, Liu A. Kynurenine pathway regulation at its critical junctions with fluctuation of tryptophan. Metabolites (2023) 13(4):500. doi: 10.3390/metabo13040500
52. Pfefferkorn ER, Rebhun S, Eckel M. Characterization of an indoleamine 2,3-dioxygenase induced by gamma-interferon in cultured human fibroblasts. J Interferon Res (1986) 6(3):267–79. doi: 10.1089/jir.1986.6.267
53. Ozaki Y, Edelstein MP, Duch DS. The actions of interferon and antiinflammatory agents of induction of indoleamine 2,3-dioxygenase in human peripheral blood monocytes. Biochem Biophys Res Commun (1987) 144(3):1147–53. doi: 10.1016/0006-291x(87)91431-8
54. Chizzolini C, Dayer JM, Miossec P. Cytokines in chronic rheumatic diseases: is everything lack of homeostatic balance? Arthritis Res Ther (2009) 11(5):246. doi: 10.1186/ar2767
55. Isomaki P, Punnonen J. Pro- and anti-inflammatory cytokines in rheumatoid arthritis. Ann Med (1997) 29(6):499–507. doi: 10.3109/07853899709007474
56. Markovics A, Rosenthal KS, Mikecz K, Carambula RE, Ciemielewski JC, Zimmerman DH. Restoring the balance between pro-inflammatory and anti-inflammatory cytokines in the treatment of rheumatoid arthritis: new insights from animal models. Biomedicines (2021) 10(1):44. doi: 10.3390/biomedicines10010044
57. Forstermann U, Sessa WC. Nitric oxide synthases: regulation and function. Eur Heart J (2012) 33(7):829–37. doi: 10.1093/eurheartj/ehr304
58. Bian K, Murad F. Nitric oxide (NO)–biogeneration, regulation, and relevance to human diseases. Front Biosci (2003) 8:d264–78. doi: 10.2741/997
59. Mangoni AA, Tommasi S, Sotgia S, Zinellu A, Paliogiannis P, Piga M, et al. Asymmetric dimethylarginine: a key player in the pathophysiology of endothelial dysfunction, vascular inflammation and atherosclerosis in rheumatoid arthritis? Curr Pharm Des (2021) 27(18):2131–40. doi: 10.2174/1381612827666210106144247
60. Erre GL, Buscetta G, Paliogiannis P, Mangoni AA, Carru C, Passiu G, et al. Coronary flow reserve in systemic rheumatic diseases: a systematic review and meta-analysis. Rheumatol Int (2018) 38(7):1179–90. doi: 10.1007/s00296-018-4039-8
61. Erre GL, Piga M, Fedele AL, Mura S, Piras A, Cadoni ML, et al. Prevalence and determinants of peripheral microvascular endothelial dysfunction in rheumatoid arthritis patients: A multicenter cross-sectional study. Mediators Inflamm (2018) 2018:6548715. doi: 10.1155/2018/6548715
62. Erre GL, Mangoni AA, Castagna F, Paliogiannis P, Carru C, Passiu G, et al. Meta-analysis of asymmetric dimethylarginine concentrations in rheumatic diseases. Sci Rep (2019) 9(1):5426. doi: 10.1038/s41598-019-41994-5
63. Luczak A, Madej M, Kasprzyk A, Doroszko A. Role of the eNOS uncoupling and the nitric oxide metabolic pathway in the pathogenesis of autoimmune rheumatic diseases. Oxid Med Cell Longev (2020) 2020:1417981. doi: 10.1155/2020/1417981
64. Hedar AM, Stradner MH, Roessler A, Goswami N. Autoimmune rheumatic diseases and vascular function: the concept of autoimmune atherosclerosis. J Clin Med (2021) 10(19):4427. doi: 10.3390/jcm10194427
65. Drosos GC, Vedder D, Houben E, Boekel L, Atzeni F, Badreh S, et al. EULAR recommendations for cardiovascular risk management in rheumatic and musculoskeletal diseases, including systemic lupus erythematosus and antiphospholipid syndrome. Ann Rheum Dis (2022) 81(6):768–79. doi: 10.1136/annrheumdis-2021-221733
66. Mackey RH, Kuller LH, Moreland LW. Update on cardiovascular disease risk in patients with rheumatic diseases. Rheum Dis Clin North Am (2018) 44(3):475–87. doi: 10.1016/j.rdc.2018.03.006
67. Szalai AJ. C-reactive protein (CRP) and autoimmune disease: facts and conjectures. Clin Dev Immunol (2004) 11(3-4):221–6. doi: 10.1080/17402520400001751
68. Pope JE, Choy EH. C-reactive protein and implications in rheumatoid arthritis and associated comorbidities. Semin Arthritis Rheumatol (2021) 51(1):219–29. doi: 10.1016/j.semarthrit.2020.11.005
69. Hilliquin P. Biological markers in inflammatory rheumatic diseases. Cell Mol Biol (Noisy-le-grand) (1995) 41(8):993–1006.
70. Shmerling RH. Diagnostic tests for rheumatic disease: clinical utility revisited. South Med J (2005) 98(7):704–11; quiz 12-3, 28. doi: 10.1097/01.smj.0000171073.07875.c5
71. Allen A, Carville S, McKenna F, Guideline Development G. Diagnosis and management of rheumatoid arthritis in adults: summary of updated NICE guidance. BMJ (2018) 362:k3015. doi: 10.1136/bmj.k3015
72. Aggarwal R, Ringold S, Khanna D, Neogi T, Johnson SR, Miller A, et al. Distinctions between diagnostic and classification criteria? Arthritis Care Res (Hoboken) (2015) 67(7):891–7. doi: 10.1002/acr.22583
73. Kwiatkowska B, Raciborski F, Klak A, Maslinska M, Gryglewicz J. Early diagnosis of rheumatic diseases: an evaluation of the present situation and proposed changes. Reumatologia (2015) 53(1):3–8. doi: 10.5114/reum.2015.50550
74. Aringer M, Johnson SR. Classifying and diagnosing systemic lupus erythematosus in the 21st century. Rheumatol (Oxford) (2020) 59(Suppl5):v4–v11. doi: 10.1093/rheumatology/keaa379
75. Lim CK, Bilgin A, Lovejoy DB, Tan V, Bustamante S, Taylor BV, et al. Kynurenine pathway metabolomics predicts and provides mechanistic insight into multiple sclerosis progression. Sci Rep (2017) 7:41473. doi: 10.1038/srep41473
76. Badawy AA, Dougherty DM. Assessment of the human kynurenine pathway: comparisons and clinical implications of ethnic and gender differences in plasma tryptophan, kynurenine metabolites, and enzyme expressions at baseline and after acute tryptophan loading and depletion. Int J Tryptophan Res (2016) 9:31–49. doi: 10.4137/IJTR.S38189
77. Colin-Gonzalez AL, Maldonado PD, Santamaria A. 3-Hydroxykynurenine: an intriguing molecule exerting dual actions in the central nervous system. Neurotoxicology (2013) 34:189–204. doi: 10.1016/j.neuro.2012.11.007
78. Capucciati A, Galliano M, Bubacco L, Zecca L, Casella L, Monzani E, et al. Neuronal proteins as targets of 3-hydroxykynurenine: implications in neurodegenerative diseases. ACS Chem Neurosci (2019) 10(8):3731–9. doi: 10.1021/acschemneuro.9b00265
79. Hestad K, Alexander J, Rootwelt H, Aaseth JO. The role of tryptophan dysmetabolism and quinolinic acid in depressive and neurodegenerative diseases. Biomolecules (2022) 12(7):998. doi: 10.3390/biom12070998
80. Parasram K. Phytochemical treatments target kynurenine pathway induced oxidative stress. Redox Rep (2018) 23(1):25–8. doi: 10.1080/13510002.2017.1343223
81. Geronimo-Olvera C, Tristan-Lopez L, Martinez-Lazcano JC, Garcia-Lara L, Sanchez-Mendoza A, Morales-Martinez A, et al. Striatal protection in nNOS knock-out mice after quinolinic acid-induced oxidative damage. Neurochem Res (2019) 44(2):421–7. doi: 10.1007/s11064-018-2688-3
82. Behan WM, McDonald M, Darlington LG, Stone TW. Oxidative stress as a mechanism for quinolinic acid-induced hippocampal damage: protection by melatonin and deprenyl. Br J Pharmacol (1999) 128(8):1754–60. doi: 10.1038/sj.bjp.0702940
83. Saade MC, Clark AJ, Parikh SM. States of quinolinic acid excess in urine: A systematic review of human studies. Front Nutr (2022) 9:1070435. doi: 10.3389/fnut.2022.1070435
84. Olah C, Schwartz N, Denton C, Kardos Z, Putterman C, Szekanecz Z. Cognitive dysfunction in autoimmune rheumatic diseases. Arthritis Res Ther (2020) 22(1):78. doi: 10.1186/s13075-020-02180-5
85. Sundquist K, Li X, Hemminki K, Sundquist J. Subsequent risk of hospitalization for neuropsychiatric disorders in patients with rheumatic diseases: a nationwide study from Sweden. Arch Gen Psychiatry (2008) 65(5):501–7. doi: 10.1001/archpsyc.65.5.501
86. Marrie RA, Hitchon CA, Walld R, Patten SB, Bolton JM, Sareen J, et al. Increased burden of psychiatric disorders in rheumatoid arthritis. Arthritis Care Res (Hoboken) (2018) 70(7):970–8. doi: 10.1002/acr.23539
87. Francis HM, Stevenson RJ, Tan LSY, Ehrenfeld L, Byeon S, Attuquayefio T, et al. Kynurenic acid as a biochemical factor underlying the association between Western-style diet and depression: A cross-sectional study. Front Nutr (2022) 9:945538. doi: 10.3389/fnut.2022.945538
88. Sun P, Wang M, Liu YX, Li L, Chai X, Zheng W, et al. High-fat diet-disturbed gut microbiota-colonocyte interactions contribute to dysregulating peripheral tryptophan-kynurenine metabolism. Microbiome (2023) 11(1):154. doi: 10.1186/s40168-023-01606-x
89. Damiani G, Pacifico A, Scoditti E, di Gregorio S, Del Fabbro M, Cozzolino C, et al. Circadian oscillations of minimal erythema dose (MED) are also influenced by diet in patients with psoriasis: A chronomedical study. Dermatol Ther (Heidelb) (2023) 13(10):2229–46. doi: 10.1007/s13555-023-00987-z
90. Joisten N, Kummerhoff F, Koliamitra C, Schenk A, Walzik D, Hardt L, et al. Exercise and the Kynurenine pathway: Current state of knowledge and results from a randomized cross-over study comparing acute effects of endurance and resistance training. Exerc Immunol Rev (2020) 26:24–42.
91. Saran T, Turska M, Kocki T, Zawadka M, Zielinski G, Turski WA, et al. Effect of 4-week physical exercises on tryptophan, kynurenine and kynurenic acid content in human sweat. Sci Rep (2021) 11(1):11092. doi: 10.1038/s41598-021-90616-6
92. Hinkley JM, Yu GX, Standley RA, Distefano G, Tolstikov V, Narain NR, et al. Exercise and ageing impact the kynurenine/tryptophan pathway and acylcarnitine metabolite pools in skeletal muscle of older adults. J Physiol (2023) 601(11):2165–88. doi: 10.1113/JP284142
Keywords: tryptophan, kynurenine, kynurenine to tryptophan ratio, 3-hydroxykynurenine, quinolinic acid, rheumatic diseases, inflammation, biomarkers
Citation: Mangoni AA and Zinellu A (2023) A systematic review and meta-analysis of the kynurenine pathway of tryptophan metabolism in rheumatic diseases. Front. Immunol. 14:1257159. doi: 10.3389/fimmu.2023.1257159
Received: 12 July 2023; Accepted: 11 October 2023;
Published: 23 October 2023.
Edited by:
Lu Liangjing, Shanghai Jiao Tong University, ChinaReviewed by:
Francesca Fallarino, University of Perugia, ItalyGiovanni Damiani, University of Milan, Italy
Chai K. Lim, Macquarie University, Australia
Copyright © 2023 Mangoni and Zinellu. This is an open-access article distributed under the terms of the Creative Commons Attribution License (CC BY). The use, distribution or reproduction in other forums is permitted, provided the original author(s) and the copyright owner(s) are credited and that the original publication in this journal is cited, in accordance with accepted academic practice. No use, distribution or reproduction is permitted which does not comply with these terms.
*Correspondence: Arduino A. Mangoni, YXJkdWluby5tYW5nb25pQGZsaW5kZXJzLmVkdS5hdQ==