 Susan Raju Paul1‡
 Anja Scholzen2†‡
 Patrick M. Reeves1‡
 Robert Shepard1†
 Joshua M. Hess1†Richard K. Dzeng1Skylar Korek1†
 Anja Garritsen2Mark C. Poznansky1*
 Ann E. Sluder1*
- 1Vaccine and Immunotherapy Center, Massachusetts General Hospital, Boston, MA, United States
- 2InnatOss Laboratories B.V., Oss, Netherlands
Introduction: Q fever, caused by the intracellular bacterium Coxiella burnetii, is considered an occupational and biodefense hazard and can result in debilitating long-term complications. While natural infection and vaccination induce humoral and cellular immune responses, the exact nature of cellular immune responses to C. burnetii is incompletely understood. The current study seeks to investigate more deeply the nature of long-term cellular recall responses in naturally exposed individuals by both cytokine release assessment and cytometry profiling.
Methods: Individuals exposed during the 2007-2010 Dutch Q fever outbreak were grouped in 2015, based on a C. burnetii-specific IFNγ release assay (IGRA), serological status, and self-reported clinical symptoms during initial infection, into asymptomatic IGRA-negative/seronegative controls, and three IGRA-positive groups (seronegative/asymptomatic; seropositive/asymptomatic and seropositive/symptomatic). Recall responses following in vitro re-stimulation with heat-inactivated C. burnetii in whole blood, were assessed in 2016/2017 by cytokine release assays (n=55) and flow cytometry (n=36), and in blood mononuclear cells by mass cytometry (n=36).
Results: Cytokine release analysis showed significantly elevated IL-2 responses in all seropositive individuals and elevated IL-1β responses in those recovered from symptomatic infection. Comparative flow cytometry analysis revealed significantly increased IFNγ, TNFα and IL-2 recall responses by CD4 T cells and higher IL-6 production by monocytes from symptomatic, IGRA-positive/seropositive individuals compared to controls. Mass cytometry profiling and unsupervised clustering analysis confirmed recall responses in seropositive individuals by two activated CD4 T cell subsets, one characterized by a strong Th1 cytokine profile (IFNγ+IL-2+TNFα+), and identified C. burnetii-specific activation of CD8 T cells in all IGRA-positive groups. Remarkably, increased C. burnetii-specific responses in IGRA-positive individuals were also observed in three innate cell subpopulations: one characterized by an IFNγ+IL-2+TNFα+ Th1 cytokine profile and lack of canonical marker expression, and two IL-1β-, IL-6- and IL-8-producing CD14+ monocyte subsets that could be the drivers of elevated secretion of innate cytokines in pre-exposed individuals.
Discussion: These data highlight that there are long-term increased responses to C. burnetii in both adaptive and innate cellular compartments, the latter being indicative of trained immunity. These findings warrant future studies into the protective role of these innate responses and may inform future Q fever vaccine design.
Introduction
Q fever is a zoonotic disease caused by the obligate intracellular gram-negative coccobacillus, Coxiella burnetii, and transmitted to humans through aerosols from infected ruminants such as goats, sheep, and cattle (1). C. burnetii exhibits significant resilience even in harsh environments (2) and is highly infectious with an ID50 of one bacterium (3). Consequently, C. burnetii is classified as a category B bioterrorism agent (4). Acute Q fever is asymptomatic in most infected individuals and, when symptomatic, presents largely with flu-like symptoms (1). Therefore, infection with C. burnetii is likely significantly underreported as observed in the largest reported outbreak of Q fever, which occurred in the Netherlands from 2007-2010. Although only 3500 infections were officially reported (5, 6), a survey of serological data suggested that there were an estimated 40,000 infections in the region at the center of the epidemic alone (7). While acute infection is often self-limiting and readily treatable with antibiotics such as tetracyclines, long-term complications of infection are common; 10-20% of patients with acute Q fever later develop Q fever fatigue syndrome, and 1-5% of infected individuals (often with other comorbidities) progress to chronic Q fever, which manifests as endocarditis, aneurysms, or vascular infections (1, 8). The single Q fever vaccine approved for use in humans, Q-VAX®, is an inactivated whole cell vaccine based on phase I C. burnetii licensed for use only in Australia amongst high-risk individuals. The vaccine is protective against Q fever (9) but has been reported to cause side effects in previously exposed individuals, particularly at the site of injection (10, 11). Therefore, only unexposed individuals can be vaccinated, and pre-screening is required prior to vaccination using an intradermal skin test and serology to assess for any prior immunity against C. burnetii. To eliminate this requirement for pre-screening and the associated cost and time, a number of efforts seek to develop novel vaccines that protect against Q fever whilst having minimal side effects and thus eliminate the need for pre-screening (12–14). These efforts would benefit from a more complete understanding of the cellular components contributing to immune responses to C. burnetii (15).
Previous studies characterizing human cellular recall responses in the context of C. burnetii exposure have largely focused on cytokine release in response to inactivated or viable C. burnetii antigen preparations using whole blood, PBMCs or isolated dendritic cell populations from healthy and exposed, convalescent individuals, patients with chronic C. burnetii infection, and those suffering from Q fever fatigue syndrome (16–23). Flow cytometric analysis in humans has been restricted to ex vivo phenotypic analysis of circulating innate and adaptive immune cells in individuals with Q fever endocarditis (18, 19, 24, 25). The only studies that have analyzed ex vivo recall responses by individual peripheral immune cell populations to C. burnetii by cytometry have been conducted in mice pre-sensitized by infection or through vaccination (26, 27).
The goal of the current study was therefore to develop an expanded description of the cell populations contributing to long-term recall responses years after natural exposure to C. burnetii. To this end, we performed a comprehensive characterization of innate and adaptive in vitro recall responses six to ten years after initial infection in individuals naturally exposed to and convalescent from C. burnetii infection during the 2007-2010 Dutch Q fever outbreak. This cohort included four subgroups of individuals based on differing C. burnetii-specific IFNγ responses, serological status, and self-reported clinical symptoms during their initial infections. We assessed in vitro recall responses to heat-inactivated C. burnetii using a combination of bulk cytokine secretion as well as single cell phenotypic analysis by flow cytometry and mass cytometry. Both bulk cytokine release and single cell data showed that both adaptive and innate cellular compartments exhibit long-term increased responses following natural exposure to C. burnetii, which should prompt future studies to determine whether these innate responses also contribute to protection from infection by the pathogen.
Materials and methods
Ethics statement
The human study was reviewed and approved by the Medical Ethical Committee Brabant (Tilburg, Netherlands, NL51305.028.15) and all donors provided written informed consent.
Human study cohort
The human study cohort has been previously described (28). In brief, Q-fever exposed individuals were recruited from a cohort characterized in a previous large Q fever study conducted in the village of Herpen, the Netherlands (29), which experienced a high incidence of C. burnetii infection during the 2007-2010 Q fever outbreak (30). In this previous study, 80% of the adult village population was screened in 2014 for evidence of adaptive immunity towards C. burnetii. Individuals were invited to participate in this current study following pre-selection based on clinical history and adaptive C. burnetii-specific immune responses determined in 2014. All study participants, including immunologically C. burnetii-naive controls, resided during and following the Q fever outbreak in the same area and were assigned to study groups based on clinical history and immunological assays performed at the time of study enrollment in 2015. Cellular immunity to C. burnetii was assessed with the CE-marked Q-Detect interferon-γ release assay (31) as described previously (28). To maximize the potential to detect C. burnetii-specific T cells in this cohort who were predominantly enrolled for epitope-screening (28), preference was given to donors with strong responses to whole heat-killed C. burnetii in the IGRA and without potentially confounding immune disorders. In total, 143 participants provided written informed consent. IGRA responses were re-assessed upon enrollment in October 2015, and serological status was additionally assessed by immunoblot. Volunteers were allocated to control Group 1 if they had no history of Q fever disease (29), were negative (32) by IGRA and by immunofluorescence assay (IFA) in spring 2014, and were again negative by IFA and immunoblot when enrolled in the previous study (28) in autumn 2015. The remaining volunteers that were positive by IGRA in spring 2014 were subdivided based on their serostatus (IFA in spring 2014 and immunoblot analysis in autumn 2015) and past Q fever disease (either registered (notified) in the national surveillance system, or self-reported) into Group 2 (seronegative, asymptomatic), Group 3 (seropositive, asymptomatic) and Group 5 (seropositive, symptomatic). A single volunteer fell into Group 4 (seronegative, symptomatic) and was not included in further analysis. At the time of enrolment, all volunteers were convalescent from their original exposure to C. burnetii, and none of the volunteers included in this study had known active C. burnetii infection or were diagnosed as suffering from acute or chronic Q fever.
All peripheral blood samples for this study were obtained between July 2016 and May 2017, i.e., six to ten years after initial exposure during the 2007-2010 Q fever outbreak in the Netherlands. A total of n=64 individuals contributed to one or more aspects of this immune profiling study (Tables 1, 2).
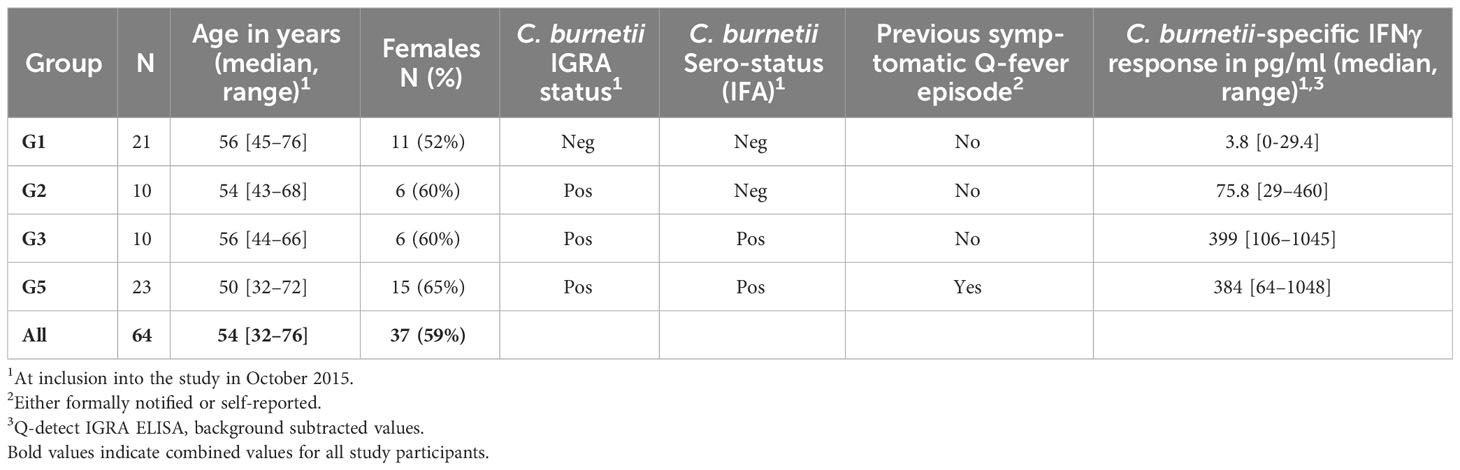
Table 1 Human study subjects.
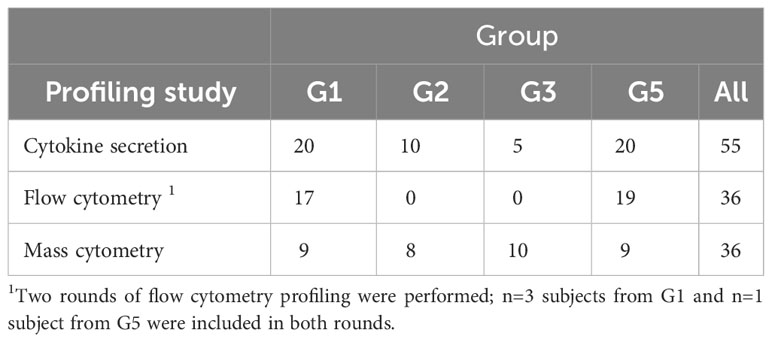
Table 2 Subject numbers included in each immune profiling assessment.
Whole blood IFNγ release assay (Q-Detect™ IGRA)
The Q-Detect™ assay has previously been described in detail (31). In brief, whole lithium-heparin anti-coagulated blood was stimulated with C. burnetii antigen (heat killed Cb02629, a strain isolated during the Dutch Q fever outbreak, lot 14VRIM014 prepared by Wageningen Bioveterinary Research from a master cell bank using a cell-free culture method and quality controlled for protein concentration, functional TLR stimulation, and stimulation of IFNγ in samples from known Q fever-exposed individuals). Assays were performed in 96-well polypropylene plates (Greiner BioOne) by adding 180 µl blood to 20 µl C. burnetii antigen diluted in phenol red-free RPMI supplemented with Glutamax (2 mM), Gentamycin (5 µg/ml) and sodium pyruvate (1 mM, all ThermoFisher Scientific). A 1.5% (v/v, final concentration) solution of PHA-M (ThermoFisher Scientific) was added to separate wells for each sample as a positive control. Medium only was added to the negative control wells for each sample, results from which were used to correct for any background levels of IFNγ in the sample. All stimulations were performed in duplicate. After 22 ± 1 hours whole blood cultures were re-suspended. IFNγ concentrations were assessed in whole blood by ELISA using the IFNγ Pelipair protocol (Sanquin) with minor modifications. The upper detection limit of IGRA under these conditions is 1050 pg/ml. A subject was scored positive by IGRA if the C. burnetii antigen induced IFNγ production was ≥16 pg/ml above background and the ratio of the logarithmic value of background-subtracted C. burnetii antigen and PHA responses ((log[C. burnetii]-log[neg control])/(log[PHA]-log[neg control])) was ≥0.4.
Multiplex cytokine secretion analysis following whole blood stimulation
Whole lithium-heparin anti-coagulated blood was stimulated with C. burnetii antigen in 1.5 mL microtubes (Eppendorf) by adding 500 µL blood to 55 µL diluted C. burnetii antigen or medium only. After 21-23 hours, plasma supernatants from whole blood cultures were collected and frozen for later multiplex cytokineanalysis. Quantification of secreted IFNγ, IL-1β, IL-2, IL-10 and TNFα was conducted using a sandwich ELISA-based multi-spot electrochemiluminescence detection system (human Proinflammatory Panel 1 V-PLEX kit, Meso-Scale Discovery), following the manufacturer’s recommendations. Cytokine levels in plasma supernatants measured following C. burnetii antigen stimulation were background corrected before data analysis by subtraction of levels detected in parallel medium-only assays for each sample. Notably, IFNγ levels measured using this V-PLEX assay are approximately 20 times higher than by the Q-Detect clinical IGRA used to assess the cellular immune status for enrolment and group allocation (28). This is because calibrators were differently dose-assigned by the two assay manufacturers. Despite this difference, IFNγ levels measured in the same set of samples by V-PLEX and Q-Detect IGRA directly correlate (R = 0.87, p = 1.44x10⁻⁹).
Flow cytometry analysis following whole blood stimulation
Lithium-heparin anti-coagulated whole blood was stimulated for 24-25 hours with C. burnetii antigen in 1.5 mL microtubes (Eppendorf) by adding 500 µL blood to 55 µL diluted C. burnetii antigen or medium only. For the final 20 hours of stimulation, Brefeldin A (Sigma) was added to a final concentration of 5 µg/mL. Two tubes were stimulated per donor and condition. Following stimulation, the two replicates of whole blood cultures were pooled, lysed using 10 mL 1x red blood cell (RBC) lysis buffer (eBioscience) and washed prior to staining and flow cytometry analysis. Each sample was evenly divided into three wells of a 96-well v-bottom plate (Sarstedt), washed with PBS and incubated for 30 min at 4°C with 50 µL fixable viability dye eF780 (eBioscience) diluted in PBS. Cells were washed twice with staining buffer (PBS/0.5% BSA), and stained with 25 µL antibody cocktail diluted in staining buffer for 20 min at 4°C. All antibodies used for surface and intracellular labelling are listed in Tables 3, 4. Cells were washed and re-suspended in 50 µL fixation/permeabilization buffer (eBioscience), incubated for 45 min at room temperature, and washed with 150 µL permeabilization buffer (eBioscience). For intracellular staining, cells were incubated for 45 min at room temperature with 25 µL antibody cocktail diluted in permeabilization buffer (eBioscience).
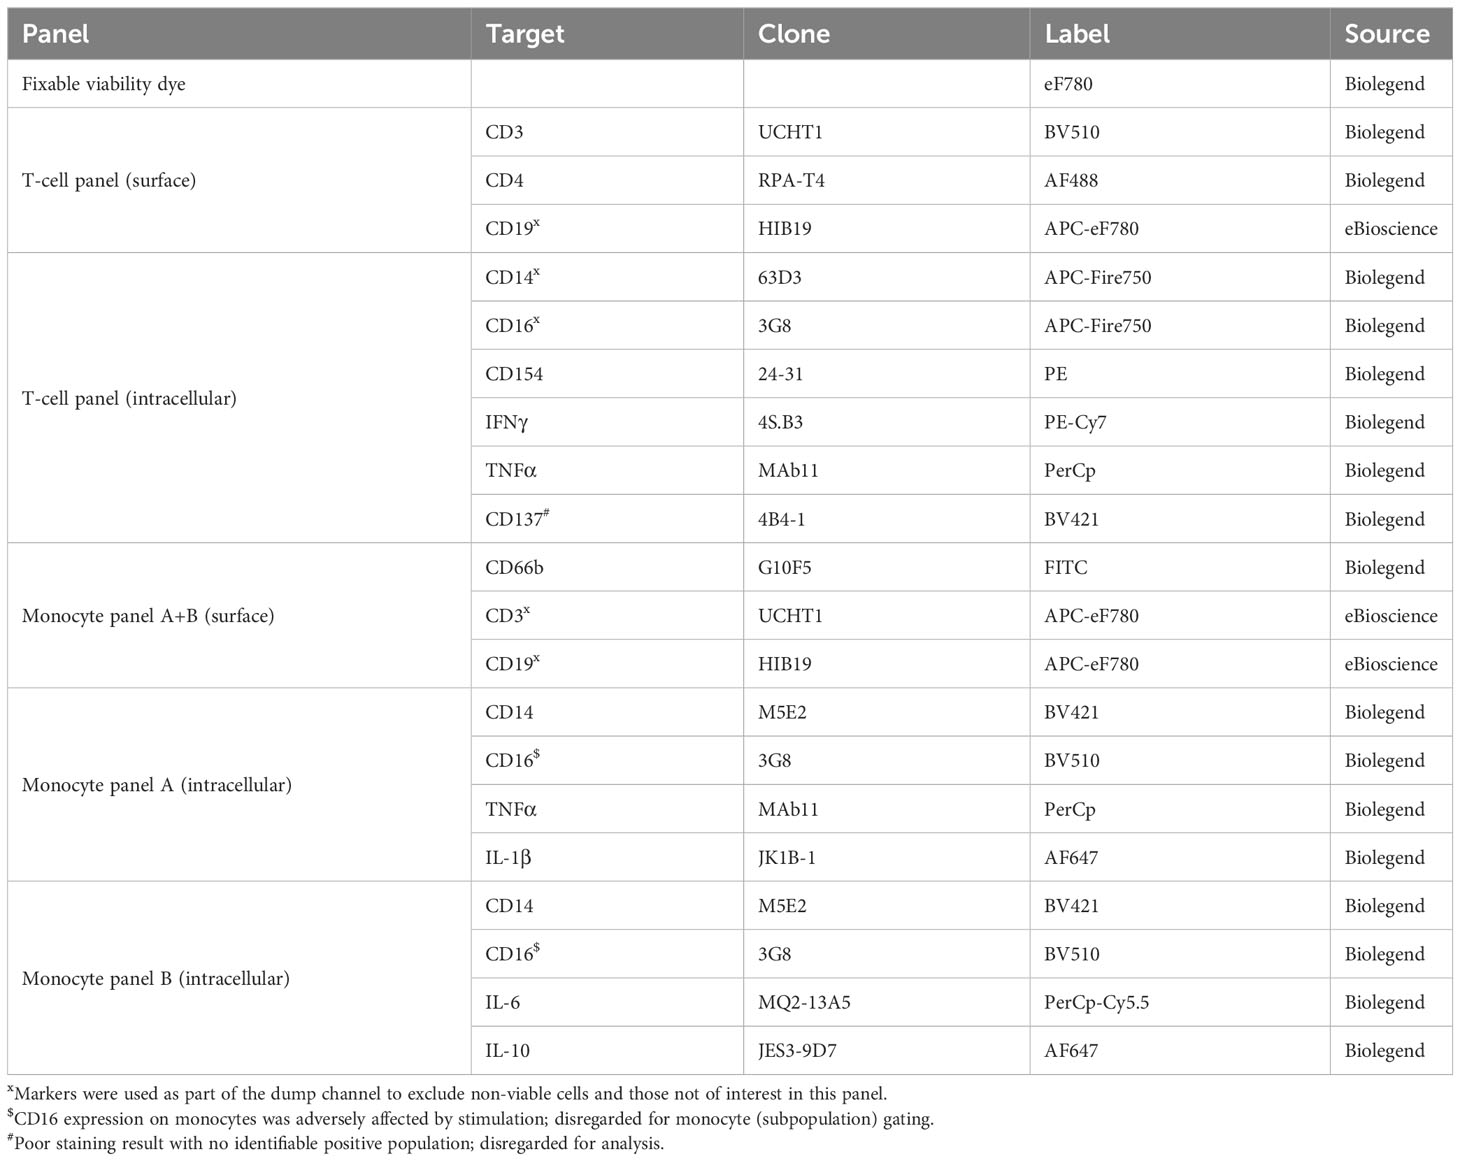
Table 3 Flow cytometry staining panels Round 1.
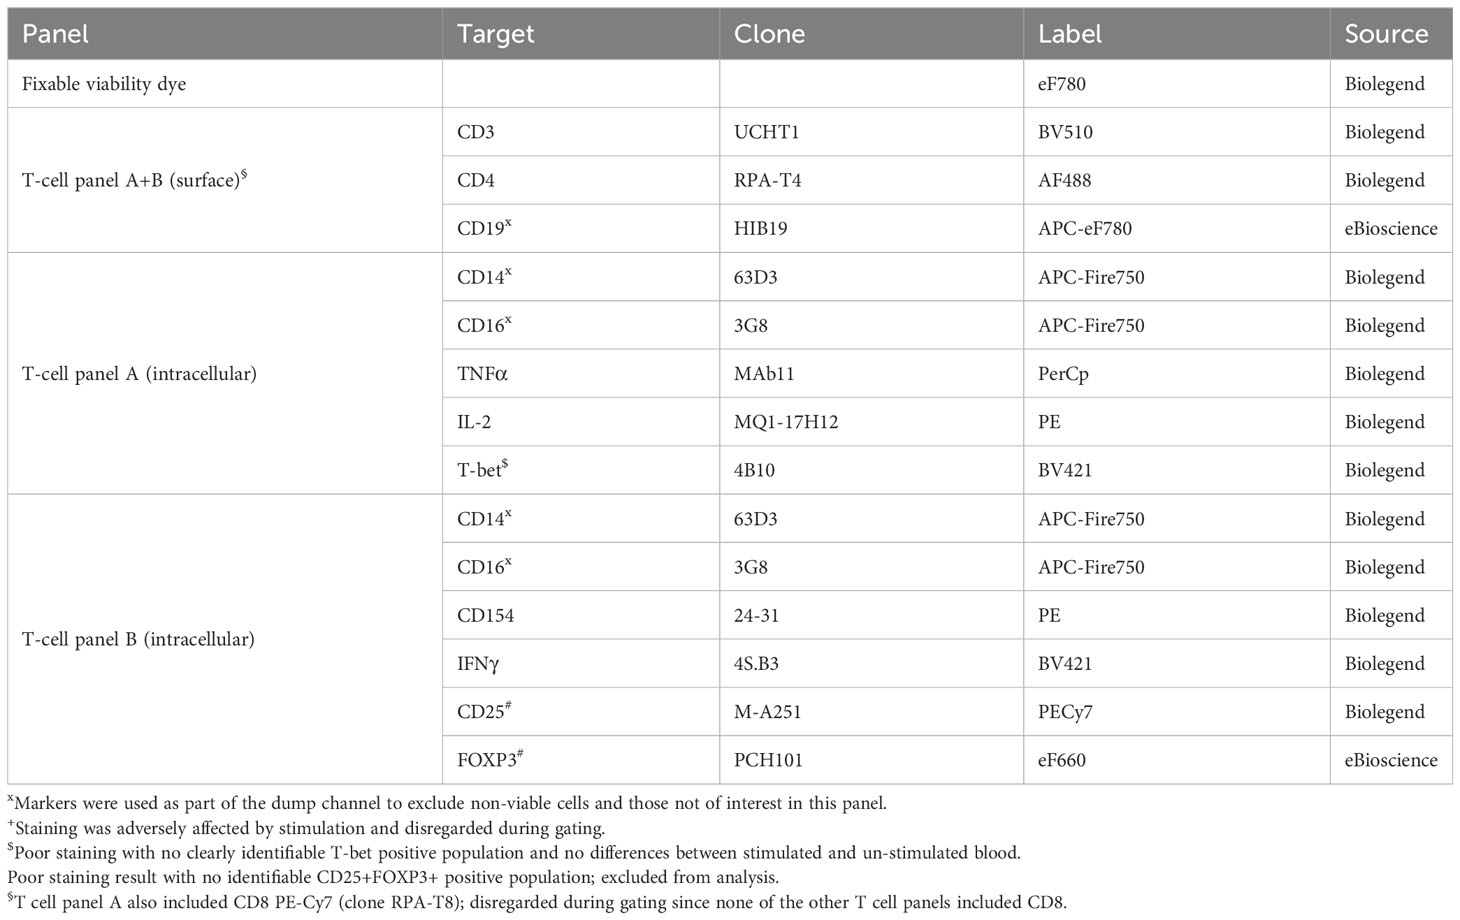
Table 4 Flow cytometry staining panels Round 2.
Single stains for compensation were prepared using lysed unstimulated and stimulated whole blood cultures as appropriate. Cells were washed with permeabilization buffer and re-suspended in 200 µL PBS/1% paraformaldehyde. Samples were acquired on a Gallios flow cytometer (BeckmanCoulter) and a FACSCanto II (BD Biosciences). A minimum of 100,000 events per sample was acquired. Data analysis was performed with FlowJo v10 software, using a combination of manual, magnetic and tethered gating (Supplementary Figures S1, S2). Four intracellular markers (CD137, T-bet, FOXP3 and IL-10) had no clearly identifiable positive population and were hence excluded from analysis.
Mass cytometry analysis following PBMC stimulation
Mass cytometry analysis was conducted using stimulated PBMCs rather than whole blood, since initial experiments showed that processing of stimulated whole blood for mass cytometry resulted in cell clumping and massive cell loss during the multiple wash steps required to remove debris after RBC lysis, thereby compromising CyTOF analysis.
PBMCs were isolated from lithium-heparin anti-coagulated blood using Leukosep tubes prefilled with Ficoll (Greiner BioOne) according to the manufacturer’s recommendations. Prior to the final wash and counting, erythrocytes were lysed using 1X RBC lysis buffer (eBioscience). Freshly isolated PBMCs were stimulated for 18-20 h at 1x10⁶ cells per well in 96-well U-bottom plates (Corning) in a final volume of 100 µL complete RPMI (phenol red-free RPMI supplemented with 2 mM Glutamax, 5 µg/mL gentamycin, and 1 mM sodium pyruvate; all Thermo Fisher Scientific) with 10% fetal bovine serum (HyClone). For the final 14 hours of stimulation, Brefeldin A (Sigma) was added at a final concentration of 5 µg/mL. Stimulations for each donor were carried out with C. burnetii antigen or medium only in five replicate wells each. To accommodate the logistics of sample collection and processing, antigen stimulation and initial staining were performed in four separate runs of nine donors from different combination of two to three groups, for a total of thirty-six donors (Run 1: n=5 Group 3, n=4 Group 5; Run 2: n=3 Group 1, n=1 Group 2, n=5 Group 3; Run 3: n=6 Group 1, n=3 Group 2; Run 4: n=4 Group 2, n=5 Group 5).
Cisplatin staining, surface marker staining and barcoding of freshly isolated and stimulated PBMC samples were conducted at Innatoss in the Netherlands, while intracellular staining and mass cytometry analysis were conducted at MGH in the United States. Cryopreserved PBMCs from two donors with no history of Q fever disease were included as reference samples in each stimulation and staining run. Unstimulated cells from one donor were included in each staining run served as a control sample for surface antibody labelling. To establish a control sample for intracellular staining, freshly isolated PBMCs from a second donor were stimulated with a combination of Staphylococcus aureus enterotoxin B (final concentration 1 µg/mL, Sigma) and LPS (final concentration 100 ng/mL, eBioscience), cisplatin- and surface-labelled, barcoded, fixed, aliquoted and frozen. A single aliquot of this stimulated sample was included in each run as a control for intracellular staining.
Following stimulation, cells from the five replicate wells per donor and stimulation condition were pooled and washed four times with staining buffer (PBS/0.5% BSA) prior to surface and cisplatin staining. All washes and staining procedures were carried out in 1.5 mL microtubes (Eppendorf). For surface staining of markers sensitive to fixation during the barcoding procedure, cell pellets were resuspended in surface antibody cocktail 1 (anti-CD56 and anti-CD16, Table 5) diluted in staining buffer and cells were incubated for 60 min at 4°C. For the final 10 min of incubation, Cell-ID™ Cisplatin (Fluidigm; final concentration 2.5 μM) was added. Following staining, each sample was washed three times and counted. Up to 3x10⁶ cells per sample were used for barcoding using the Cell-ID™ 20-Plex Pd Barcoding Kit (Fluidigm). For barcoding, samples were first incubated in 400 μL Fix buffer and incubated for 10 min at room temperature, followed by two washes with Barcode Perm buffer (Fluidigm). Each sample was individually barcoded in a final volume of 120 μL barcode in Barcode Perm buffer for 30 min at room temperature. Following two washes with MaxPar cell staining buffer, each cell pellet was resuspended in 100 μL MaxPar cell staining buffer. All unstimulated and C. burnetii antigen-stimulated samples from n=9 donors and the unstimulated reference sample were then combined, pelleted and resuspended in 1 μL surface antibody cocktail 2 (Table 5) diluted in cell staining buffer, and incubated for 60 min at 4°C. Cells were then washed once more with cell staining buffer, resuspended in 150 μL 4% paraformaldehyde and incubated for 2 hours at room temperature to inactivate any potential live C. burnetii per requirements of the MGH Biosafety Committee (27). Samples were then frozen in a bulk-freezing container (CoolCell) and shipped on dry ice to MGH for intracellular staining and mass cytometry analysis.
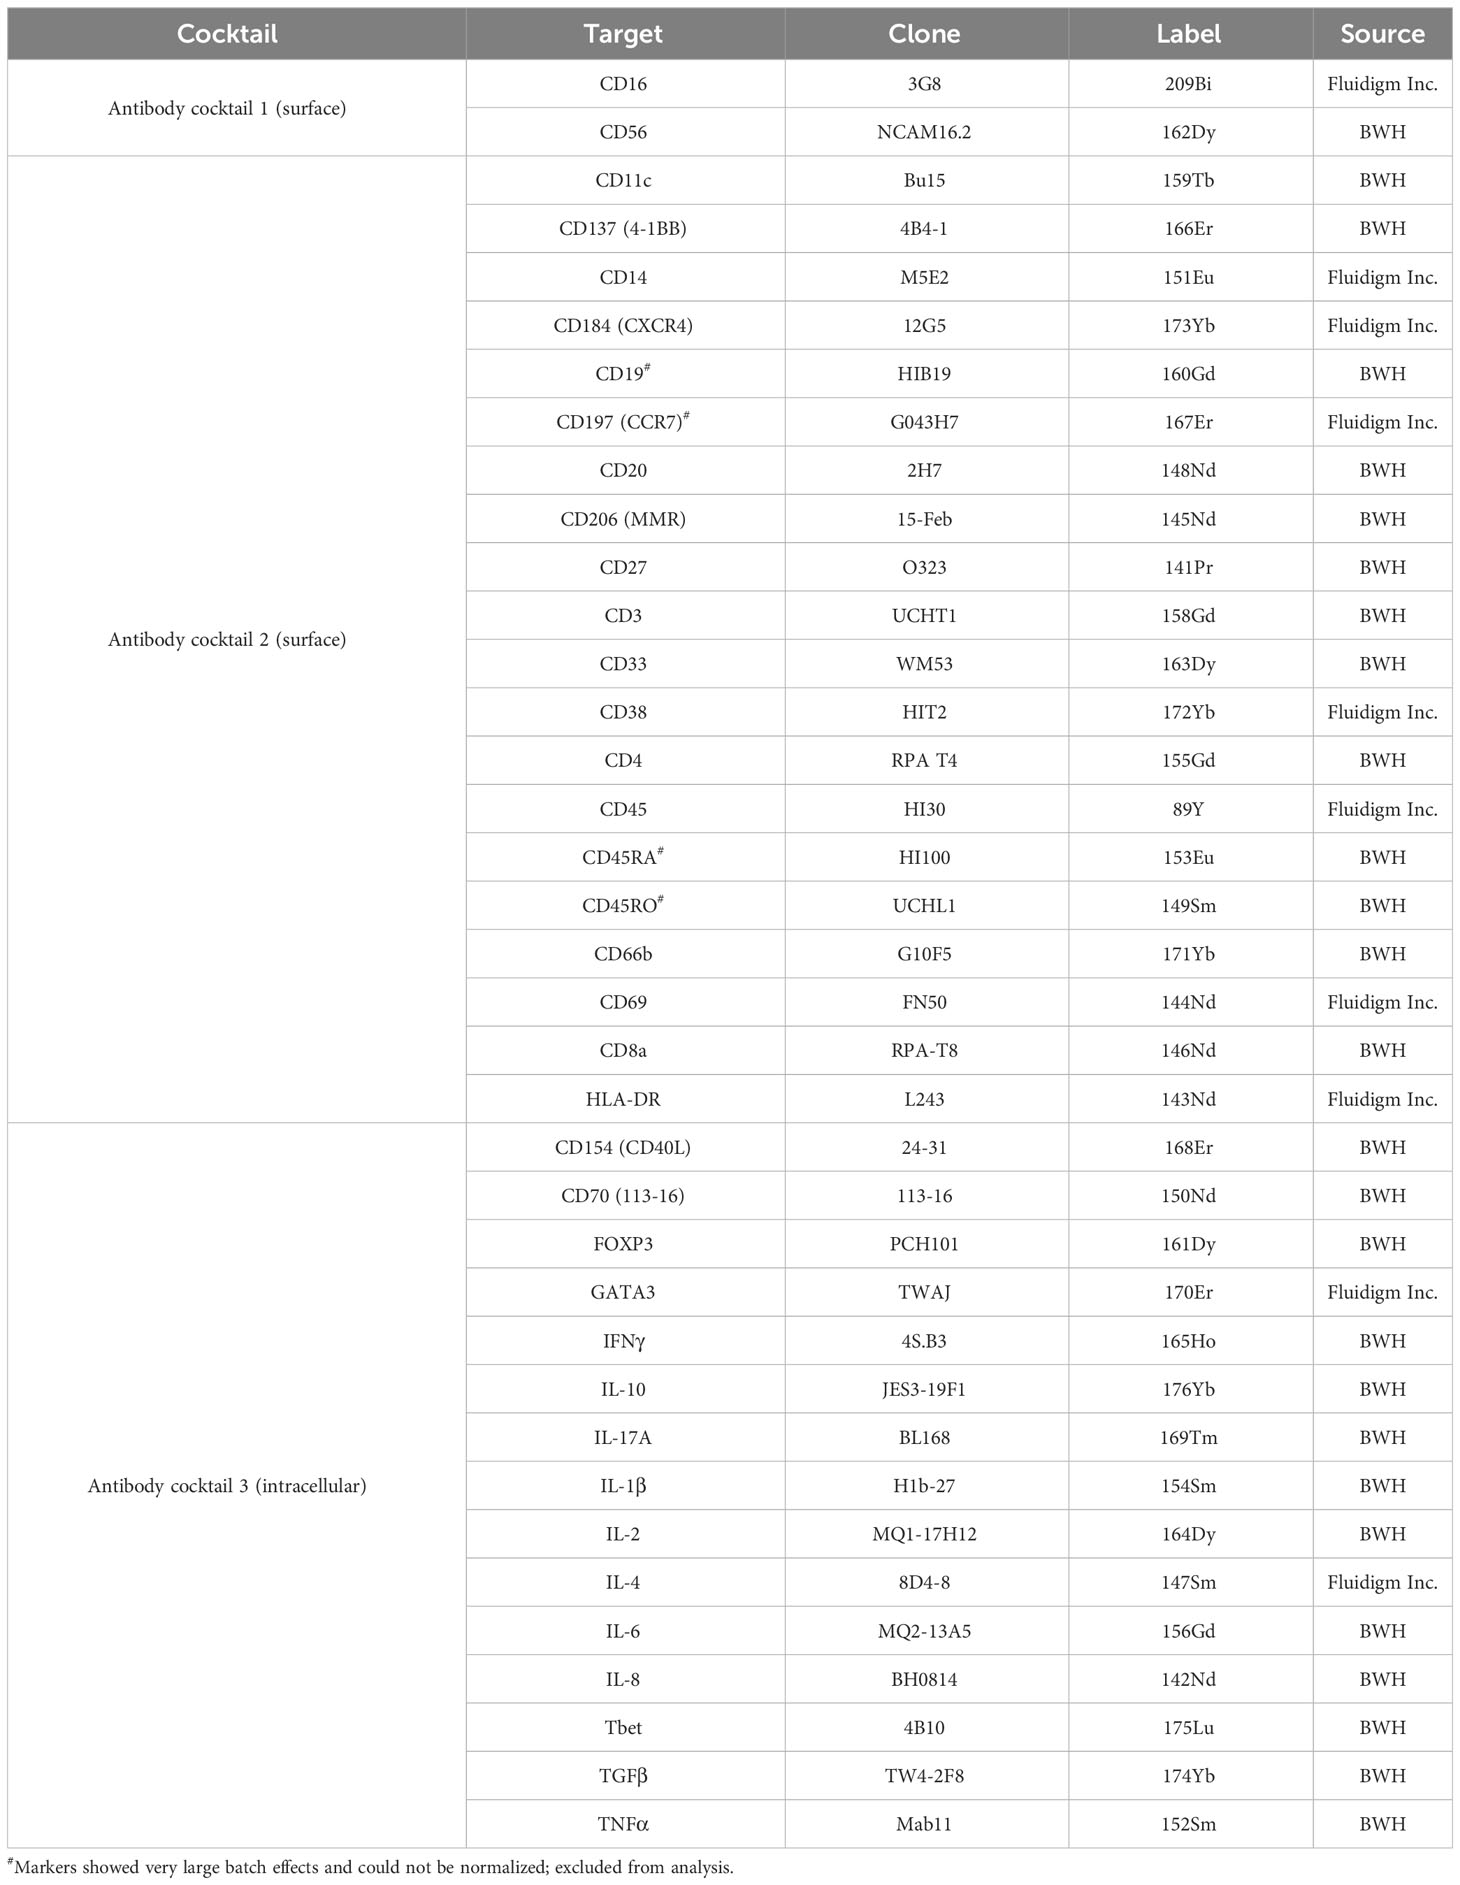
Table 5 Mass cytometry staining panel.
At MGH, frozen samples were thawed and labelled with intracellular antibodies for CyTOF; each run was processed on a separate day. One frozen vial of barcoded sample pool and one frozen vial of the stimulated barcoded reference sample were thawed in a 37°C water bath, pelleted and resuspended in 1 mL of 1X eBioscience Fix/Perm buffer for 30 minutes. Cells were then washed twice in 1X perm buffer, resuspended in 500 µL of intracellular antibody cocktail (Table 5) and incubated for 30 minutes at 4°C. Stained cells were washed twice with 1X Perm buffer, resuspended in 150 μL of 4% paraformaldehyde and incubated for 10 minutes at room temperature. Post incubation, cells were pelleted, resuspended in cell staining buffer, and stored at 4°C overnight. The next day the cells were pelleted, resuspended in Cell-ID™ Intercalator Iridium (Fluidigm; final concentration 0.125 μM) and incubated at room temperature for 20 minutes. Cells were then washed twice in cell staining buffer, twice in nanopure water (purified using a Millipore Milli-Q system) and resuspended at 1 million cells per mL in nanopure water containing EQ calibration beads (Fluidigm). The data were acquired on a Helios Mass Cytometer (Fluidigm) at 400-500 events per second.
Mass cytometry data analysis
Data were retrieved from the Helios Mass Cytometer into FCS files. EQ calibration beads were used to normalize all FCS files, to minimize any variation that occurred during data acquisition on the Helios Mass Cytometer. This normalization was performed using the Fluidigm software and sample data were debarcoded using the Fluidigm Debarcoding software. Post-processing, following identification of viable singlet CD45+CD66b- mononuclear cells, four major immune populations (CD4 T cells, CD8 T cells, B cells and innate immune cells) were manually gated using FlowJo 10 (Supplementary Figure S3).
Several markers showed strong run-to-run or day-to-day staining variation. For manual gating of CD14+ monocytes and cytokine producing cells, gates were therefore set per run based on the run-specific staining control sample. Prior to unsupervised clustering analysis, marker expression levels had to be additionally normalized across the four runs. This normalization, based on representative concatenate samples (see below), was performed separately for each immune subpopulation using CytoNorm (33) to remove batch-specific variations. Of the 37 antibodies included in the CyTOF panel, four markers (CD45RO, CD45RA, CD197/CCR7, CD19) showed very large batch-to-batch variation outside the range for effective normalization and were excluded from unsupervised clustering analysis. The canonical markers used to identify the four main cell populations (CD45, CD66b, CD3, CD4, CD8, CD20) were not included into the normalization process. The following mass cytometry markers were normalized using CytoNorm: CD16, FOXP3, CD56, CD33, IL-2, CD137, CD154, CD14, IL-6, IFNγ, T-bet, IL-8, HLA-DR, CD69, CD206, CD70, CD27, IL-4, TNFα, IL-1β, CD11c, IL-17, GATA3, CD38, CXCR4, TGFβ, and IL-10. A representative normalization sample was created for each of the four runs by down-sampling each debarcoded sample and concatenating the data. The four representative concatenate samples created in this manner were then used as the normalization reference samples in CytoNorm, to aid normalization of the data across all 4 runs. Since normalization was performed separately for each immune subpopulation, normalized expression levels for a given marker cannot be compared across the major immune populations. To assess if the normalization was accurate, we compared the control unstimulated PBMC sample included in all four runs as a staining control, before and after normalization (Supplementary Figures S4–S11). UMAP dimension reduction was performed on the four control samples prior to normalization, and separately after normalization. Before normalization, the surface and intracellular marker data for this control sample from different runs behaved like different samples. Post-normalization the control sample from each run overlaid the others, indicating that they were properly normalized.
Following normalization, data for all samples from all runs were clustered for each major cell population separately. Clustering was performed using FlowSOM (34), which employs self-organizing maps to identify immune cell clusters. Four major parental cell populations were defined as follows: CD4 T cells (CD3+CD4+CD8-CD20-); CD8 T cells (CD3+CD4-CD8+CD20-); B cells (CD3-CD20+); innate cells (CD3-CD20-). The mass cytometry markers used to cluster CD4 T cells, CD8 T cells, B cells and innate cells are listed in Table 6. FlowSOM parameters were initially set to identify 900 clusters for each major cell population. These 900 were subsequently meta-clustered to identify 20 meta-clusters from each major cell population (C1-C20). Using the SpadVizR R package, the median intensity of each marker was plotted in each meta-cluster to enable the phenotypic definition of the cell population via parallel coordinate plots. For each donor, the frequencies of each meta-cluster within each parental population in both control and C. burnetii antigen-stimulated conditions were calculated as a percent of the total number of cells clustered from that donor for that cell population. Subsequently, background corrected frequencies for each meta-cluster were calculated to identify whether the respective meta-cluster increased or decreased upon stimulation with C. burnetii antigen.
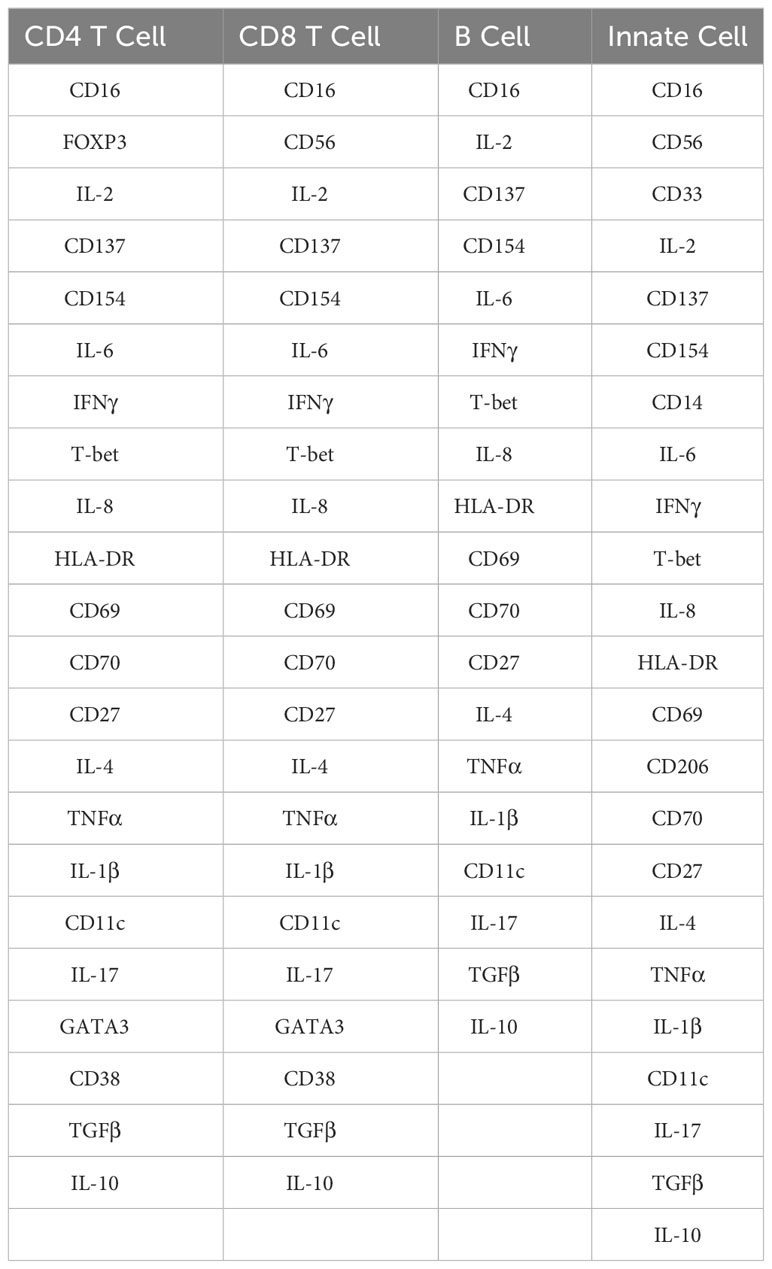
Table 6 CyTOF markers used in FlowSOM clustering.
Statistical analysis
Statistical analysis was conducted based on the original group assignments (Groups 1, 2, 3, and 5), as well as combined group assignments, such as Group 2 + 3 + 5 (IGRA-positive). Statistical analysis was performed using GraphPad Prism 9. Spearman’s correlation analysis was conducted for all clusters and plasma cytokine secretion levels using R 4.1 and Hmisc. Heatmaps and dendrograms were created using Python 3.10 using Pandas, Pyplot and Seaborn. tSNEs were generated using Python 3.10 and Scikit-Learn.
Results
In vitro C. burnetii-specific whole blood cytokine release patterns reflect the serological and prior disease status of previously exposed individuals
The individuals included in this study were divided into four groups: Those with no apparent prior exposure based on the absence of humoral and cellular adaptive response (negative IFA and IGRA) and lack of clinical history (Group 1), and previously exposed individuals based on a measurable cellular response by IGRA. The presence of a cellular immune response to C. burnetii antigen suggests that the IGRA-positive individuals had experienced prior infection with C. burnetii even if the infection did not result in a clinical history of symptomatic Q fever. These IGRA-positive individuals were further subdivided based on serological and prior disease status into Group 2 (seronegative, asymptomatic), Group 3 (seropositive, asymptomatic) and Group 5 (seropositive, symptomatic). No individuals with known active C. burnetii infection, as either current acute or chronic Q fever, were included in the study.
We first assessed whether the exposure status of individuals was associated with differential release of cytokines previously reported to be associated with re-stimulation responses to whole-cell C. burnetii antigen. We compared bulk cytokine responses as determined by multiplex V-PLEX assay following whole blood stimulation with heat-killed C. burnetii antigen in individuals with different states of prior exposure, clinical history, and serological status. Prior exposure (Groups 2, 3 and 5) was associated with significantly elevated release of IFNγ quantified by V-PLEX (p<0.0001; Figure 1A), consistent with the positive IGRA results used to define groups at study enrollment. IGRA responses (at enrollment) and IL-2 responses showed a strong correlation (Spearman Rho = 0.86, p= 4.5535E-09), and IGRA positivity was associated with significantly increased release of IL-2 (p>0.0001) compared to that observed in cells from unexposed individuals from group 1 (Figure 1A). In contrast, the innate cytokines IL-10, IL-1β and TNFα were released in response to C. burnetii antigen-stimulation by cells from both control (Group 1) and pre-exposed individuals (Groups 2, 3 and 5). Median levels of the three innate cytokines were elevated in pre-exposed individuals, although statistical analysis supported a trend toward differential levels only for IL-1β (p=0.062) (Figure 1A). No significant correlation was found between innate and adaptive cytokine responses, or amongst innate cytokines.
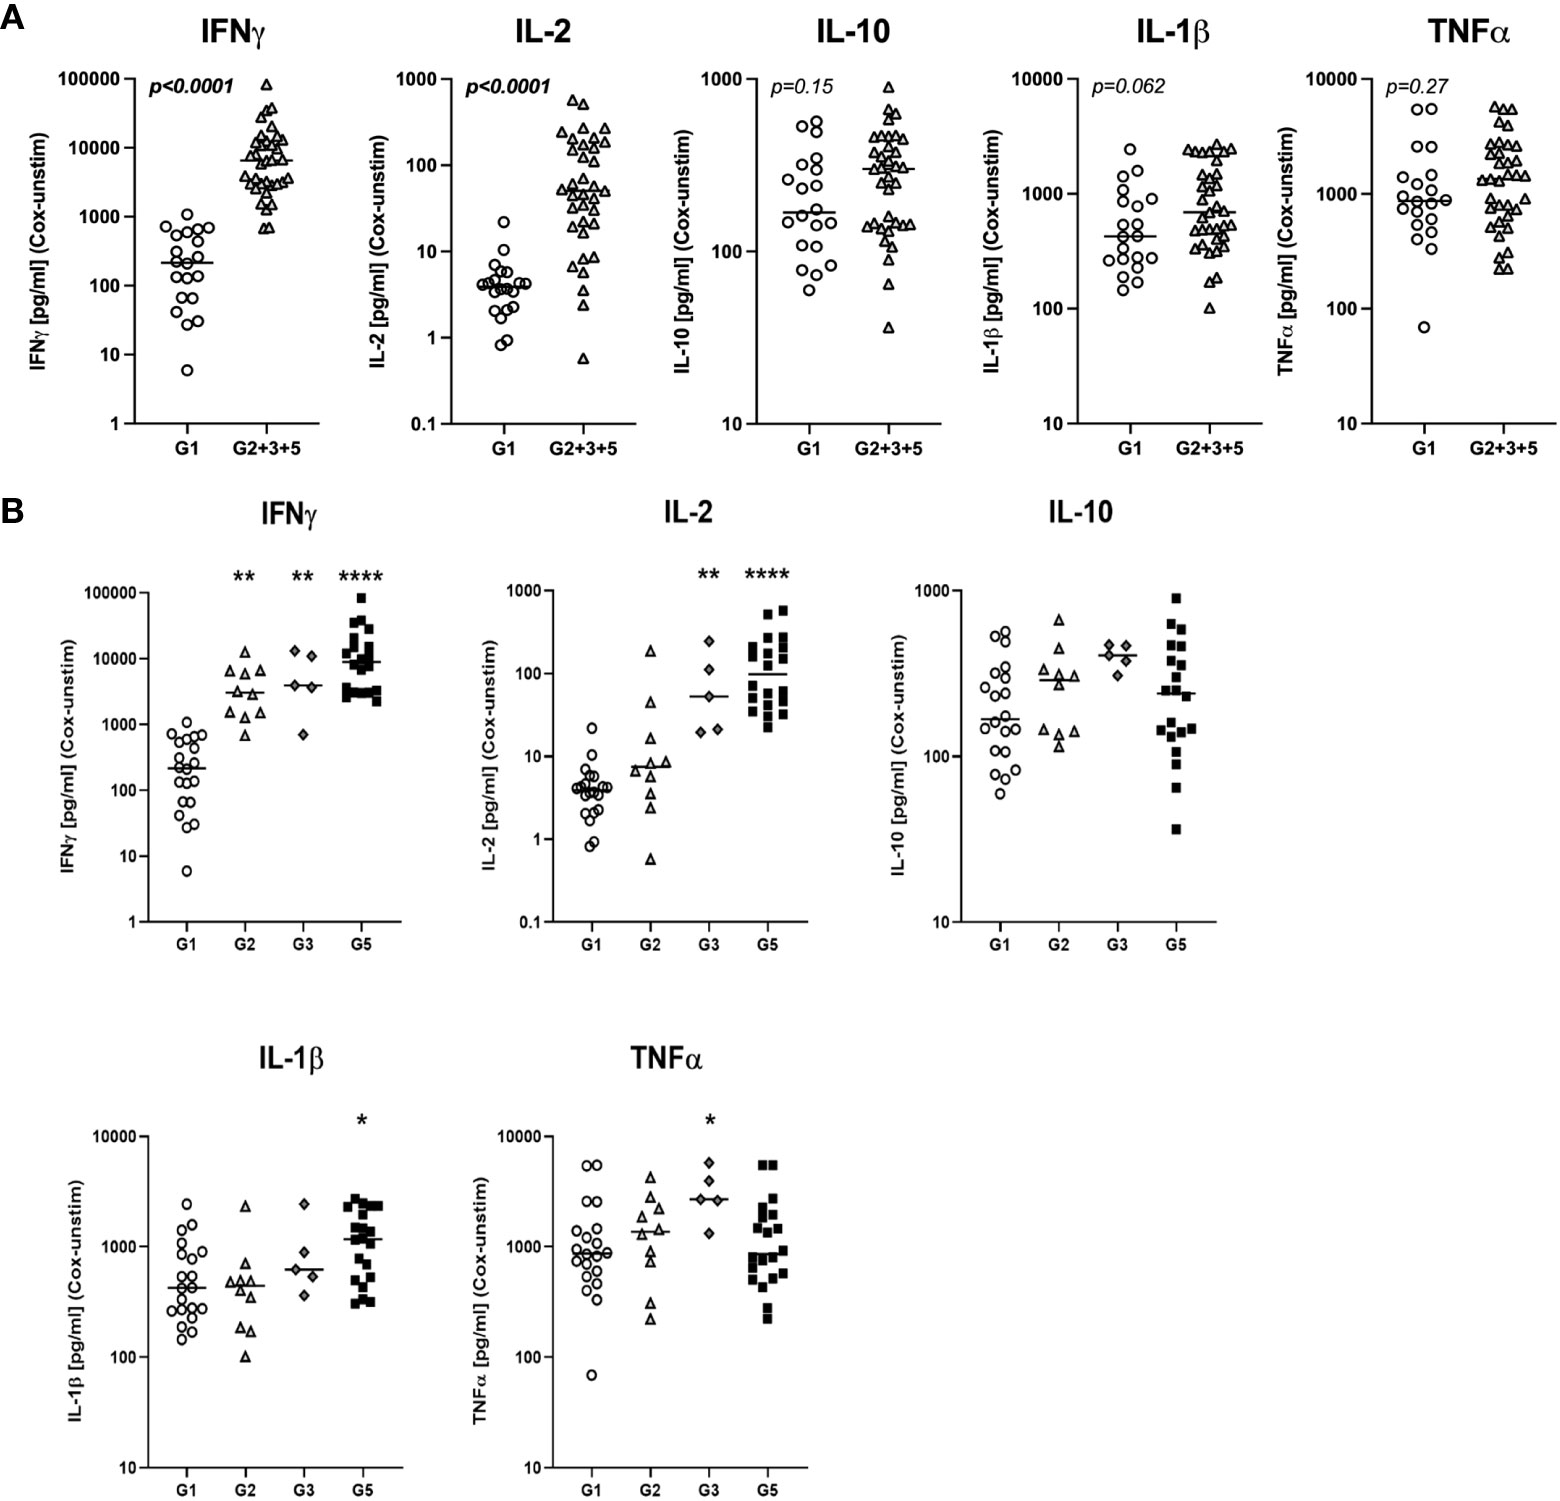
Figure 1 C. burnetii-specific whole blood cytokine release patterns. Multiplex cytokine secretion analysis was conducted on supernatants from whole blood stimulations for individuals without immunological evidence of prior exposure to C. burnetii (unexposed Group 1; n=20) and those with pre-existing humoral and/or cellular immunity (pre-exposed Groups 2, 3 and 5; n=10, n=5 and n=20, respectively). Background-corrected C. burnetii-specific cytokine data are shown for each individual. Data from Groups 2, 3 and 5 are combined in (A) and plotted separately in (B). Lines indicate the median. Cytokine responses were compared using the Mann-Whitney U test in (A) and Kruskal-Wallis test followed by Dunn’s post-hoc multiple comparison test for nonparametric data in (B). Asterisks are defined as follows: p > 0.05 (ns), p ≤ 0.05 (*), p ≤ 0.01 (**) and p ≤ 0.0001 (****). Background cytokine production levels in unstimulated samples across all groups were as follows (Median with interquartile range (IQR)): IFNγ 6.8 pg/mL (4.6-12.3), IL-2 0.20 pg/mL (0.20-0.20), IL-10 0.27 pg/mL (0.13-0.44), IL-1β 0.33 pg/mL (0.14-0.83), TNFα 2.4 pg/mL (1.7-3.6).
Dimensional reduction of whole blood cytokine release data from n=55 individuals by t-SNE followed by k means clustering of t-SNE embeddings identified two main clusters of study participants (Supplementary Figure S12). Cluster 1 comprised all control Group 1 individuals, a majority of Group 2 and n=1 donor from Group 3 who showed low IFNγ and IL-2 responses to stimulation with C. burnetii. Cluster 2 contained all remaining IGRA-positive individuals showing predominantly high IFNγ and IL-2 responses. TNFα, IL-1β and IL-10 responses to C. burnetii antigen did not correlate with the cluster groupings.
Further analysis of the clinical subgroups defined by clinical and immunological status showed that in contrast to the IFNγ responses used to define prior exposure, IL-2 responses were significantly elevated only in seropositive individuals (Group 3 and 5) regardless of symptoms during infection, while IL-1β release was elevated specifically in seropositive individuals who had convalesced from symptomatic infection (Group 5) (Figure 1B). Finally, TNFα release was significantly elevated only in the small group of pre-exposed individuals with past asymptomatic infection who were analyzed (n=5, Group 3).
Except for IFNγ, released cytokine levels in seronegative Group 2 individuals were indistinguishable from those in the control Group 1 (Figure 1B), and median IGRA responses in Group 2 were lower than in seropositive Group 3 and 5 individuals (Table 1). These lower cellular responses in individuals that fail to show sero-conversion has previously already been described in a much larger cohort study in C. burnetii-exposed individuals (31) as well as in individuals exposed to HIV (35–37), HBV (38), HCV (39), HSV-2 (40) and SARS-CoV-2 (41, 42).
Overall, of the bulk cytokine responses evaluated, IFNγ and IL-2 were the most informative for inferring prior exposure. Innate cytokines TNFα and IL-1β also showed some association with prior exposure by natural infection, consistent with previous results (43), but elevation was more marginal and restricted to specific subgroups of pre-exposed individuals.
Flow cytometry analysis reveals stronger C. burnetii-specific in vitro recall responses by both T cells and monocytes from seropositive individuals convalescent from prior symptomatic infection
To explore the cellular source of these cytokines in C. burnetii antigen-stimulated whole blood cultures, we first performed flow cytometry analysis for a randomly selected set of n=36 donors from the two groups with the greatest difference in clinical and immunological status: IGRA-negative and IFA-negative individuals with no clinical history of Q fever (Group 1), and IGRA-positive and IFA-positive individuals with past symptomatic infection (Group 5). We focused on the assessment of C. burnetii-induced intracellular cytokine production by monocytes and CD4 T cells, effector cells that are known to promote killing of C. burnetii and clearance of infection (44, 45).
In C. burnetii antigen-stimulated whole blood, a high proportion of monocytes from both controls (Group 1) and IGRA-positive donors with a clinical history of Q Fever (Group 5) produced TNFα (median 10.8% and 17.6%), IL-1β (median 55.8% and 66.6%) and IL-6 (median 43.3% and 55.5%). Only the difference in IL-6+ monocytes between Groups 1 and 5 reached statistical significance (p = ≤0.05) (Figure 2A). However, there was a modest trend toward higher proportions of TNFα, IL-1β and IL-6 producing monocytes in pre-exposed Group 5 individuals.
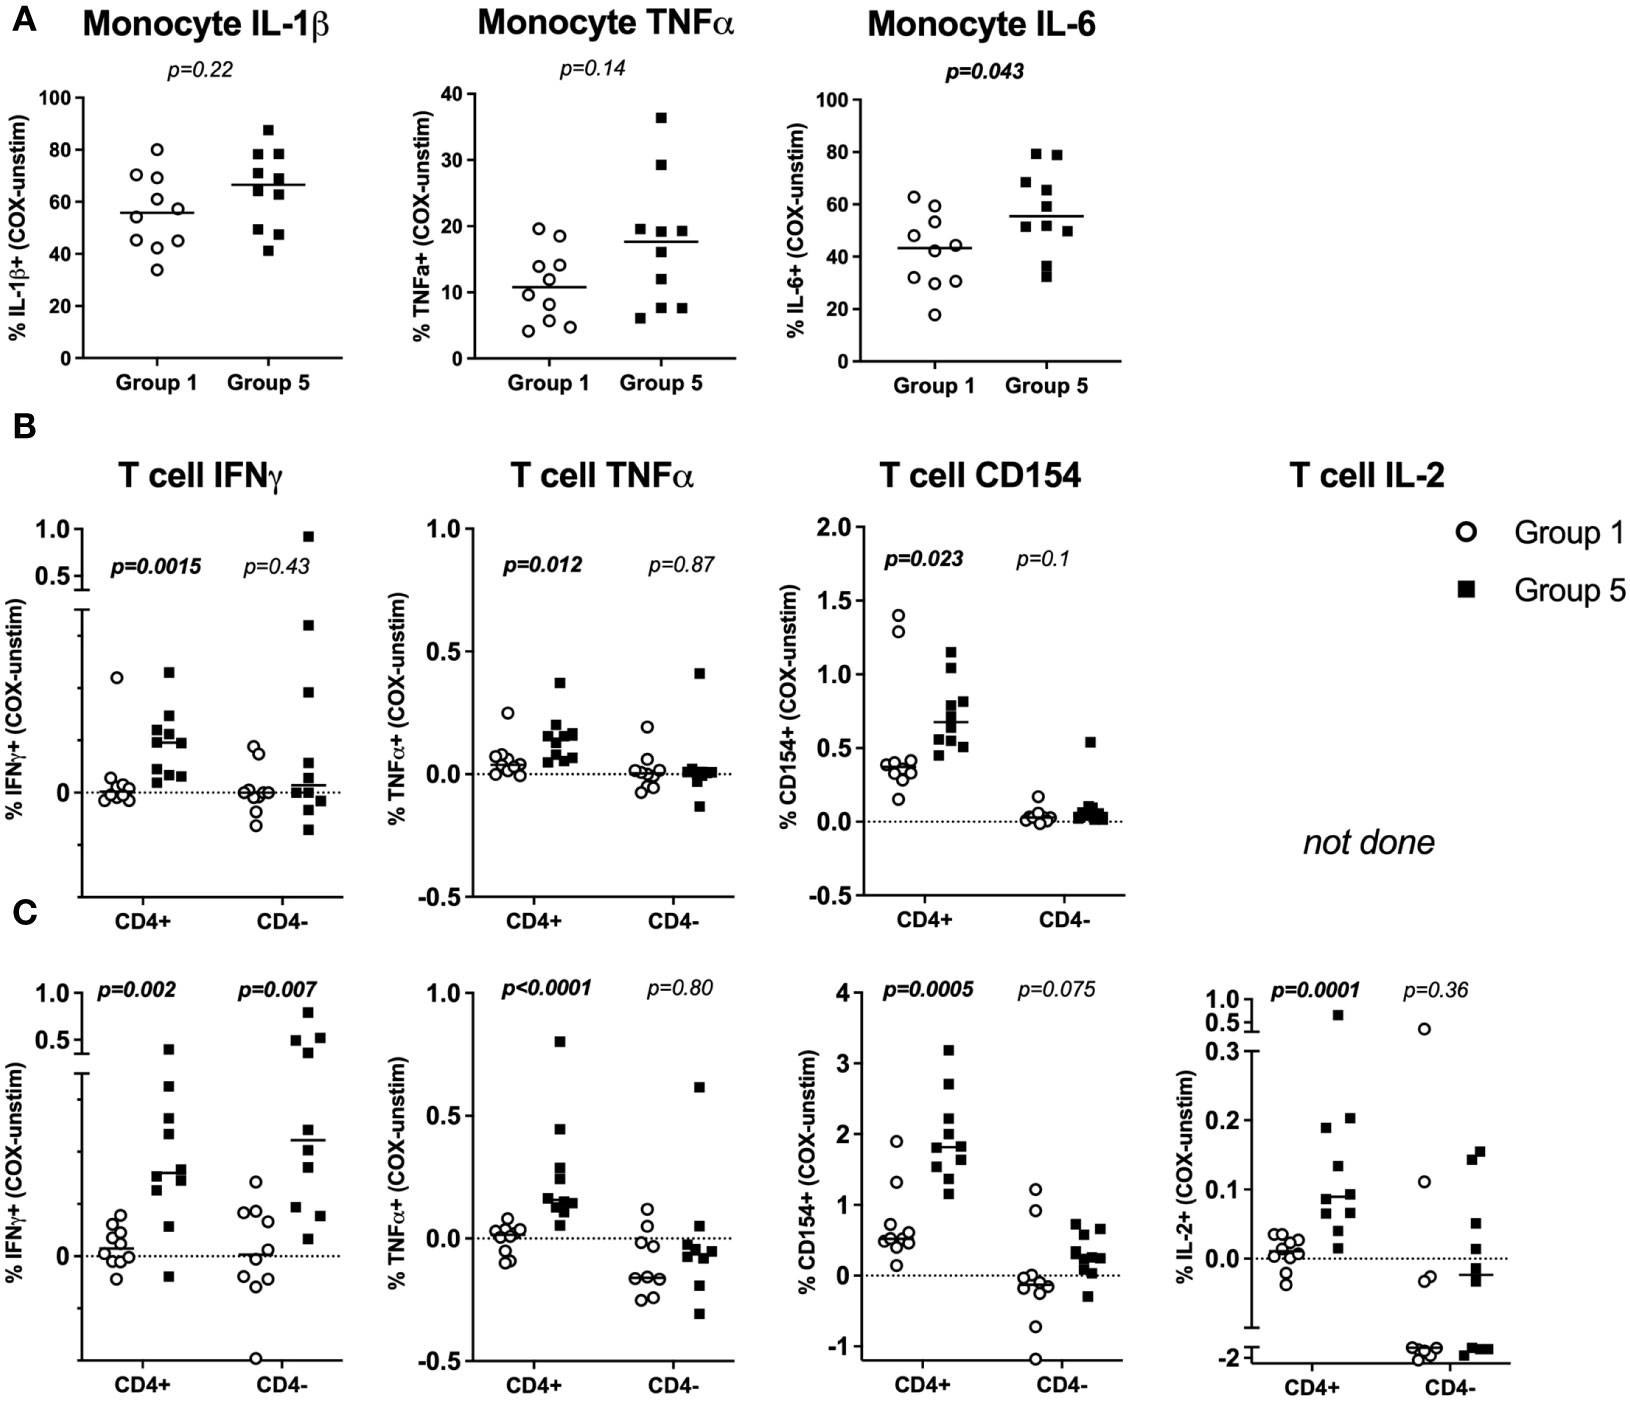
Figure 2 Flow cytometry profiles of C. burnetii-specific monocyte and T-cell cytokine production in stimulated whole blood. Cytokine production in whole blood following stimulation with C. burnetii was compared by flow cytometry between individuals without immunological evidence of prior exposure to C. burnetii (unexposed Group 1) and those with pre-existing humoral and cellular immunity as well as past symptomatic infection (exposed Group 5). (A) C. burnetii-specific cytokine responses by monocytes are depicted as the background corrected percentage of cytokine positive monocytes in unexposed Group 1 (n=10) and pre-exposed Group 5 (n=10) donors. Background proportions of cytokine-positive monocytes in unstimulated samples across the two groups were as follows (Median with IQR): IL-1β 0.53% (0.35-0.86), TNFα 0.14% (0.04-0.25), IL-6 0.43% (0.13-0.52). (B, C) C. burnetii-specific cytokine responses by T cells were assessed in two independent experimental rounds and using different T cell panels in a total of n=17 Group 1 and n=19 Group 5 donors. In each round, unexposed Group 1 (n=10) and exposed Group 5 (n=10) donors were included. Four donors were analyzed in both rounds. T cell cytokine responses are depicted as background corrected percentage of cytokine positive cells amongst CD4+ or CD4- T cells. Background proportions of cytokine/activation marker positive T cells in unstimulated samples across the two groups was as follows in round 1 (B) (Median with IQR): CD4+ T cells IFNγ 0.01% (0.01-0.02), TNFα 0.04% (0.02-0.05), CD154 0.05% (0.03-0.07). CD4- T cells IFNγ 0.02% (0-0.03), TNFα 0.03% (0.02-0.07), CD154 0.01% (0-0.02). In round 2 (C) the background values were (Median with IQR): CD4+ T cells IFNγ 0.07% (0.06-0.10), TNFα 0.09% (0.03-0.14), CD154 0.12% (0.06-0.17), IL-2 0.01% (0.01-0.03). CD4- T cells IFNγ 0.11% (0.07-0.16), TNFα 0.45% (0.3-0.6), CD154 1.24% (0.30-3.44), IL-2 0.26% (0.09-0.99). Lines indicate the median. Cytokine responses between Groups 1 and 5 were compared using the Mann-Whitney U test for nonparametric data.
T cell responses were assessed in two flow cytometry experiments, each including n=10 donors from each of Groups 1 and 5. Initially, a single T cell panel was used to assess IFNγ and TNFα production and the activation marker CD154 (Figure 2B). In a second round IL-2 production was also interrogated using a second T cell panel (Figure 2C). CD4 T cells consistently showed significantly higher proportions of IFNγ+, TNFα+ and CD154+ cells (Figures 2B, C) as well as IL-2+ cells (Figure 2C) in Group 5 individuals with clinical history of the disease compared to Group 1 controls. CD3+ CD4- T cells, inferred as CD8 T cells, showed no significant difference in C. burnetii-induced TNFα or IL-2 production or CD154 expression between control (Group 1) and convalescent (Group 5) individuals (Figures 2B, C). However, amongst the Group 5 individuals assessed in round 1, a small number did show CD4- IFNγ T cell responses of a similar magnitude as CD4 T cells (Figure 2B). Amongst the individuals in Group 5 assessed in round 2, this IFNγ response in CD4- T cells was statistically significant and comparable to the response of CD4 T cells (Figure 2C). This suggests that CD8 T cells also contribute to recall IFNγ responses.
Mass cytometry analysis identifies both adaptive and innate cell populations showing in vitro recall responses in individuals who were previously naturally exposed
The flow cytometry panels focused on assessing responses by monocytes and CD4 T cells. To characterize the immune cell subsets involved in recall responses to C. burnetii antigen more deeply and broadly, we utilized a highly multiplexed CyTOF panel in combination with manual gating and unsupervised clustering analysis. The CyTOF panel included additional lineage markers to investigate responses by CD8 T cells, B cells and innate immune cells, as well as a wider variety of activation markers and cytokines. For this CyTOF analysis we further expanded the selection of subjects: in addition to individuals from Group 1 (controls) and Group 5 (seropositive, symptomatic), we also included Group 2 (seronegative, asymptomatic) and Group 3 (seropositive, asymptomatic) individuals.
Cytokine responses were initially quantified in total CD45+CD66b- mononuclear cells by manual gating. In C. burnetii antigen-stimulated PBMCs, the proportions of cells showing C. burnetii-specific production of IFNγ, IL-6, IL-10 and TNFα were significantly higher in pre-exposed IGRA-positive individuals compared to Group 1 controls (Figure 3A), consistent with IGRA responses at study enrollment (Table 1). The median increase with pre-exposure in cells producing these cytokines was two-fold or less, except for the proportion of IL-6+ cells which increased nearly six-fold. In contrast, the proportion of cells producing the innate cytokines IL-1β and IL-8 in response to C. burnetii-stimulation was comparable across the two groups and thus independent of prior exposure status. IFNγ levels were specifically elevated in seropositive Group 3 and 5 individuals, and the same was true for IL-10 and TNFα (Figure 3B). Although the proportion of IL-2-producing cells was not significantly different between IGRA-negative Group 1 controls and all IGRA-positive donors (Group 2 + 3 + 5) (Figure 3A), seropositive Group 3 and 5 individuals showed clearly higher IL-2 responses compared to Groups 1 and 2 (Figure 3B), with the difference between Group 2 and 3 individuals reaching statistical significance. C. burnetii-specific IL-4 responses were not detectable, and IL-17 responses were only detectable in a very minor proportion of cells (<0.05%) and showed no differences between IGRA-negative and IGRA-positive groups (data not shown).
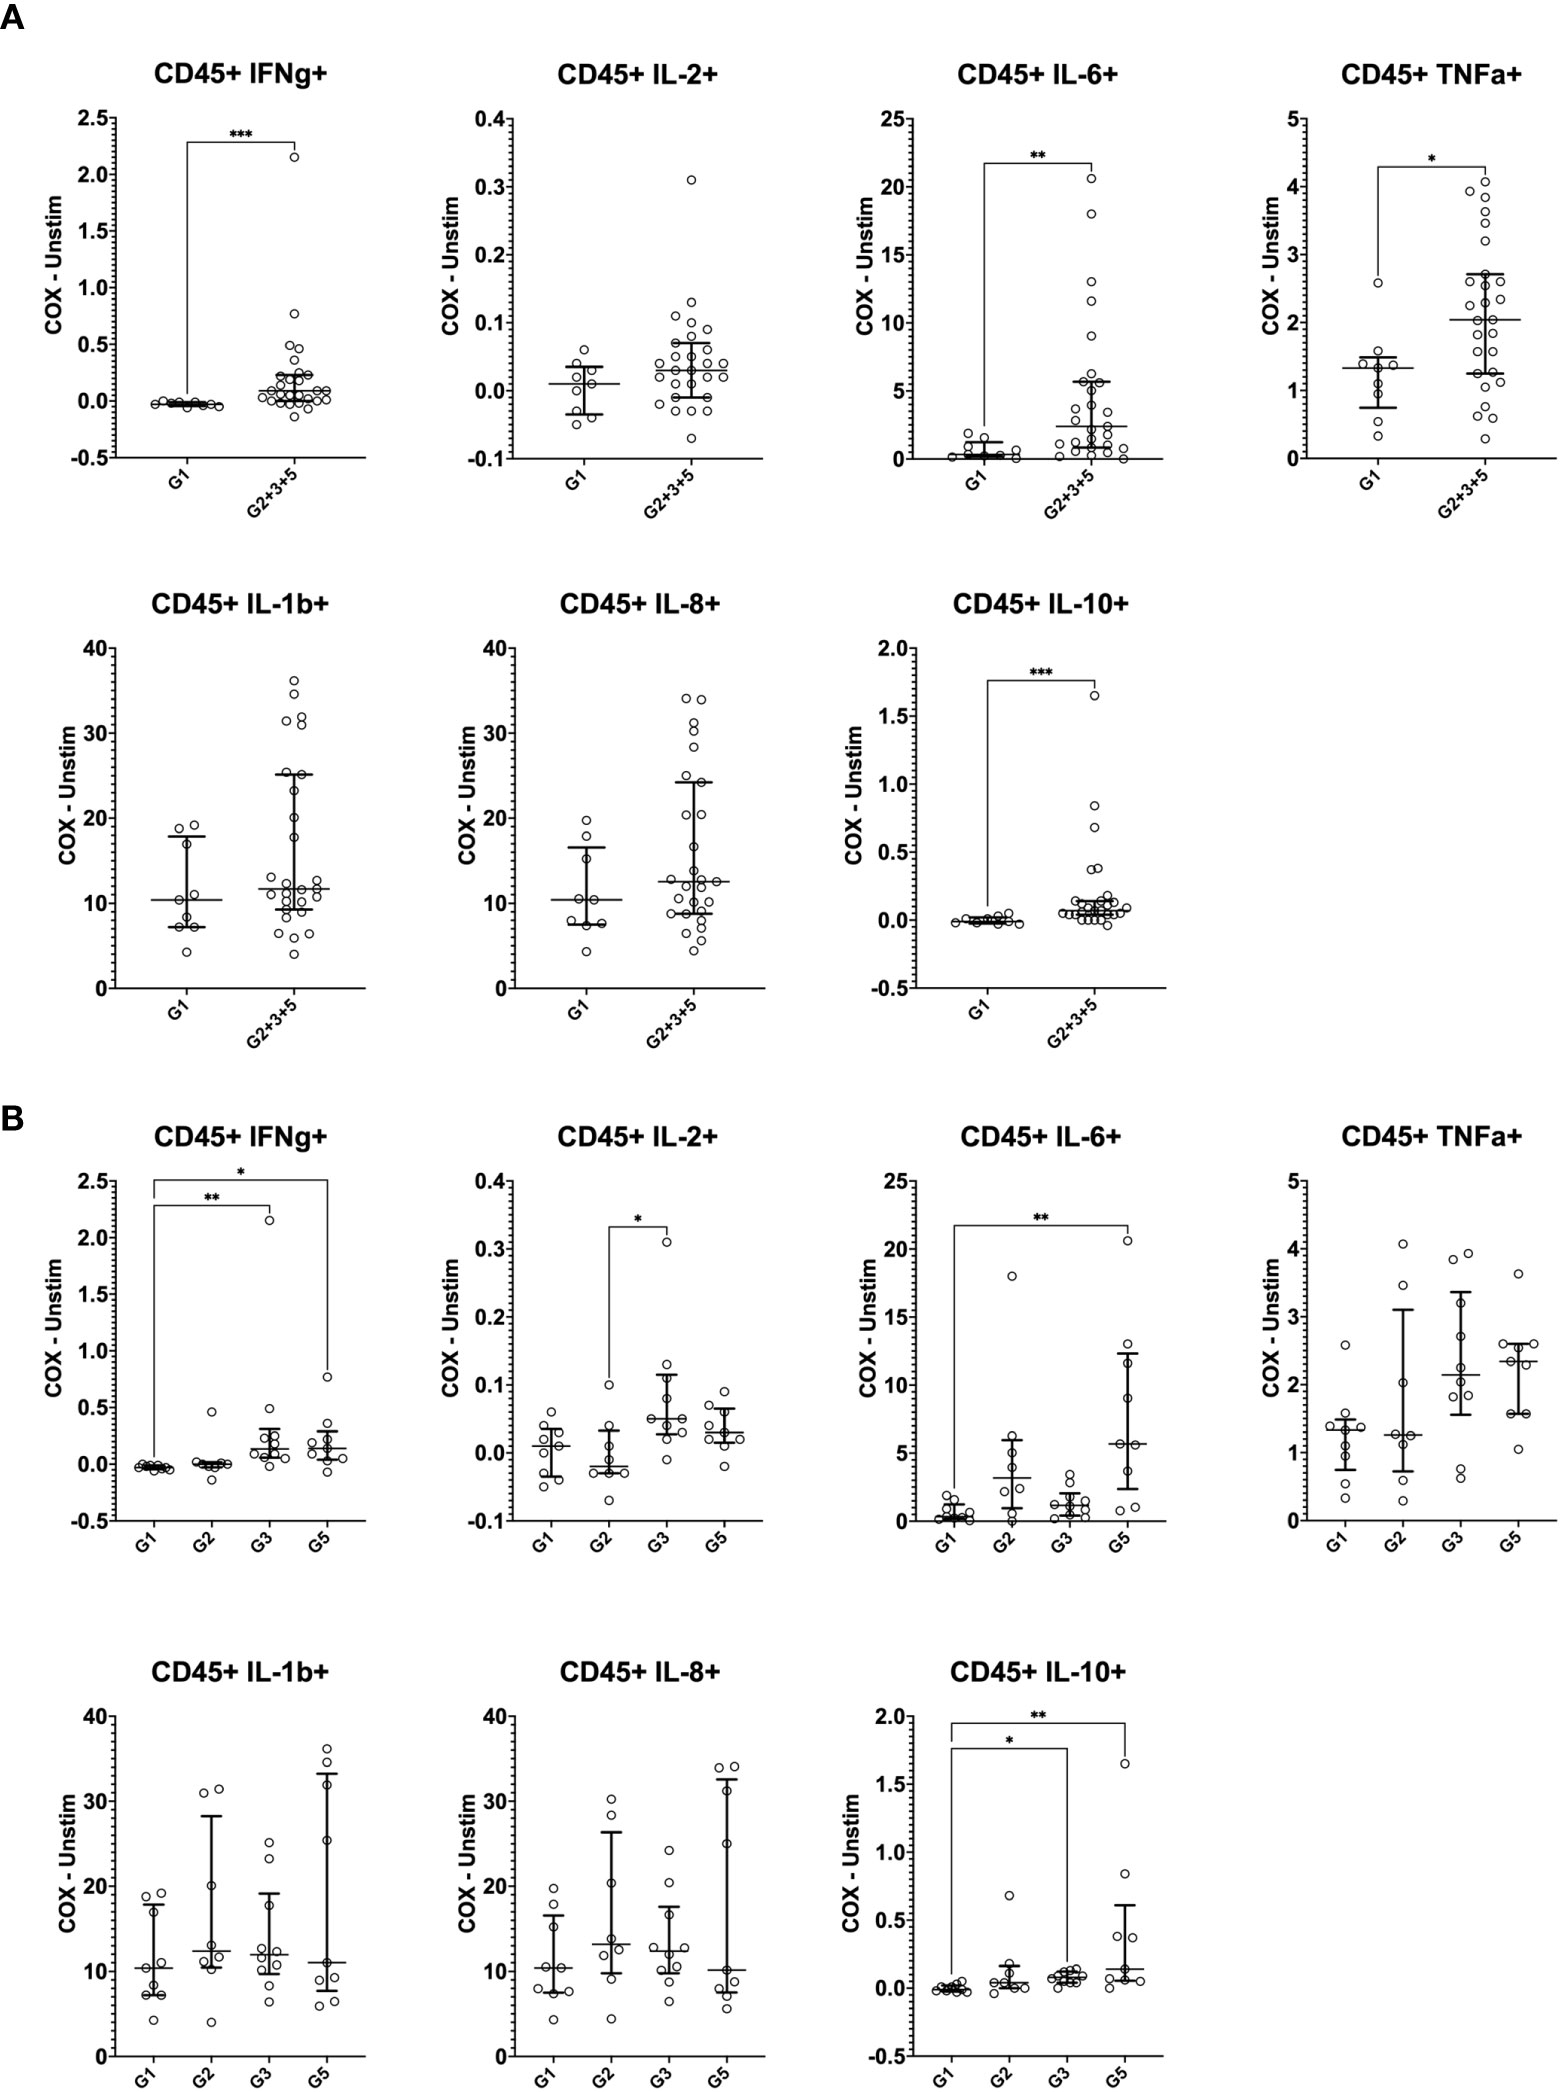
Figure 3 Mass cytometry profiles of C. burnetii-specific cytokine production in peripheral blood mononuclear cells. Cytokine production in PBMCs following stimulation with C. burnetii was assessed by mass cytometry. Scatterplots depict the background corrected percentage of each cytokine (IFNγ, IL-2, IL-6, TNFα, IL-1β, IL-8 and IL-10) in all CD45+CD66b- mononuclear cells in: (A) unexposed Group 1 (n=9) and all pre-exposed individuals (n=27) donors (Group 2 + 3 + 5), (B) unexposed Group 1 (n=9), seronegative, asymptomatic Group 2 (n=8), seropositive, asymptomatic Group 3 (n=10) and seropositive, symptomatic Group 5 (n=9). Lines indicate the median with interquartile range. Cytokine responses were compared using Mann-Whitney U test in (A) and Kruskal-Wallis test followed by Dunn’s post-hoc multiple comparison test for nonparametric data in (B). Asterisks are defined as follows: p > 0.05 (ns), p ≤ 0.05 (*), p ≤ 0.01 (**) and p ≤ 0.001 (***).
To assess the cellular source of these cytokines, we separately analyzed CD45+ mononuclear cells positive for each cytokine for individuals who were either IGRA-negative (Group 1) to IGRA-positive (Group 2 + 3 + 5) (Figure 4). IFNγ was broadly produced by all immune cell types evaluated, not solely by CD4 and CD8 T cells, regardless of the status of prior exposure. However, IFNγ expression by CD4 T cells (p = 0.029) and CD56- innate cells (presumably monocytes and dendritic cells, p = 0.005) increased with prior exposure (higher proportion in Group 2 + 3 + 5 compared to Group 1). The primary sources of IL-2 were CD4 T cells and B cells. While the contribution of CD4 T cells to IL-2 production was slightly increased with prior exposure though this did not reach statistical significance. IL-6, TNFα, IL-1β and IL-8 were produced largely by CD56- innate cells (presumably monocytes and dendritic cells), consistent with the canonical innate functions of these cytokines, with no difference in this pattern regardless of pre-exposure. CD4 T cells had the greatest contribution to IL-10 production in unexposed individuals (Group 1), but CD56- innate cells became the predominant source in individuals with prior exposure (higher proportion in Group 2 + 3 + 5 compared to Group 1, p = 0.005).
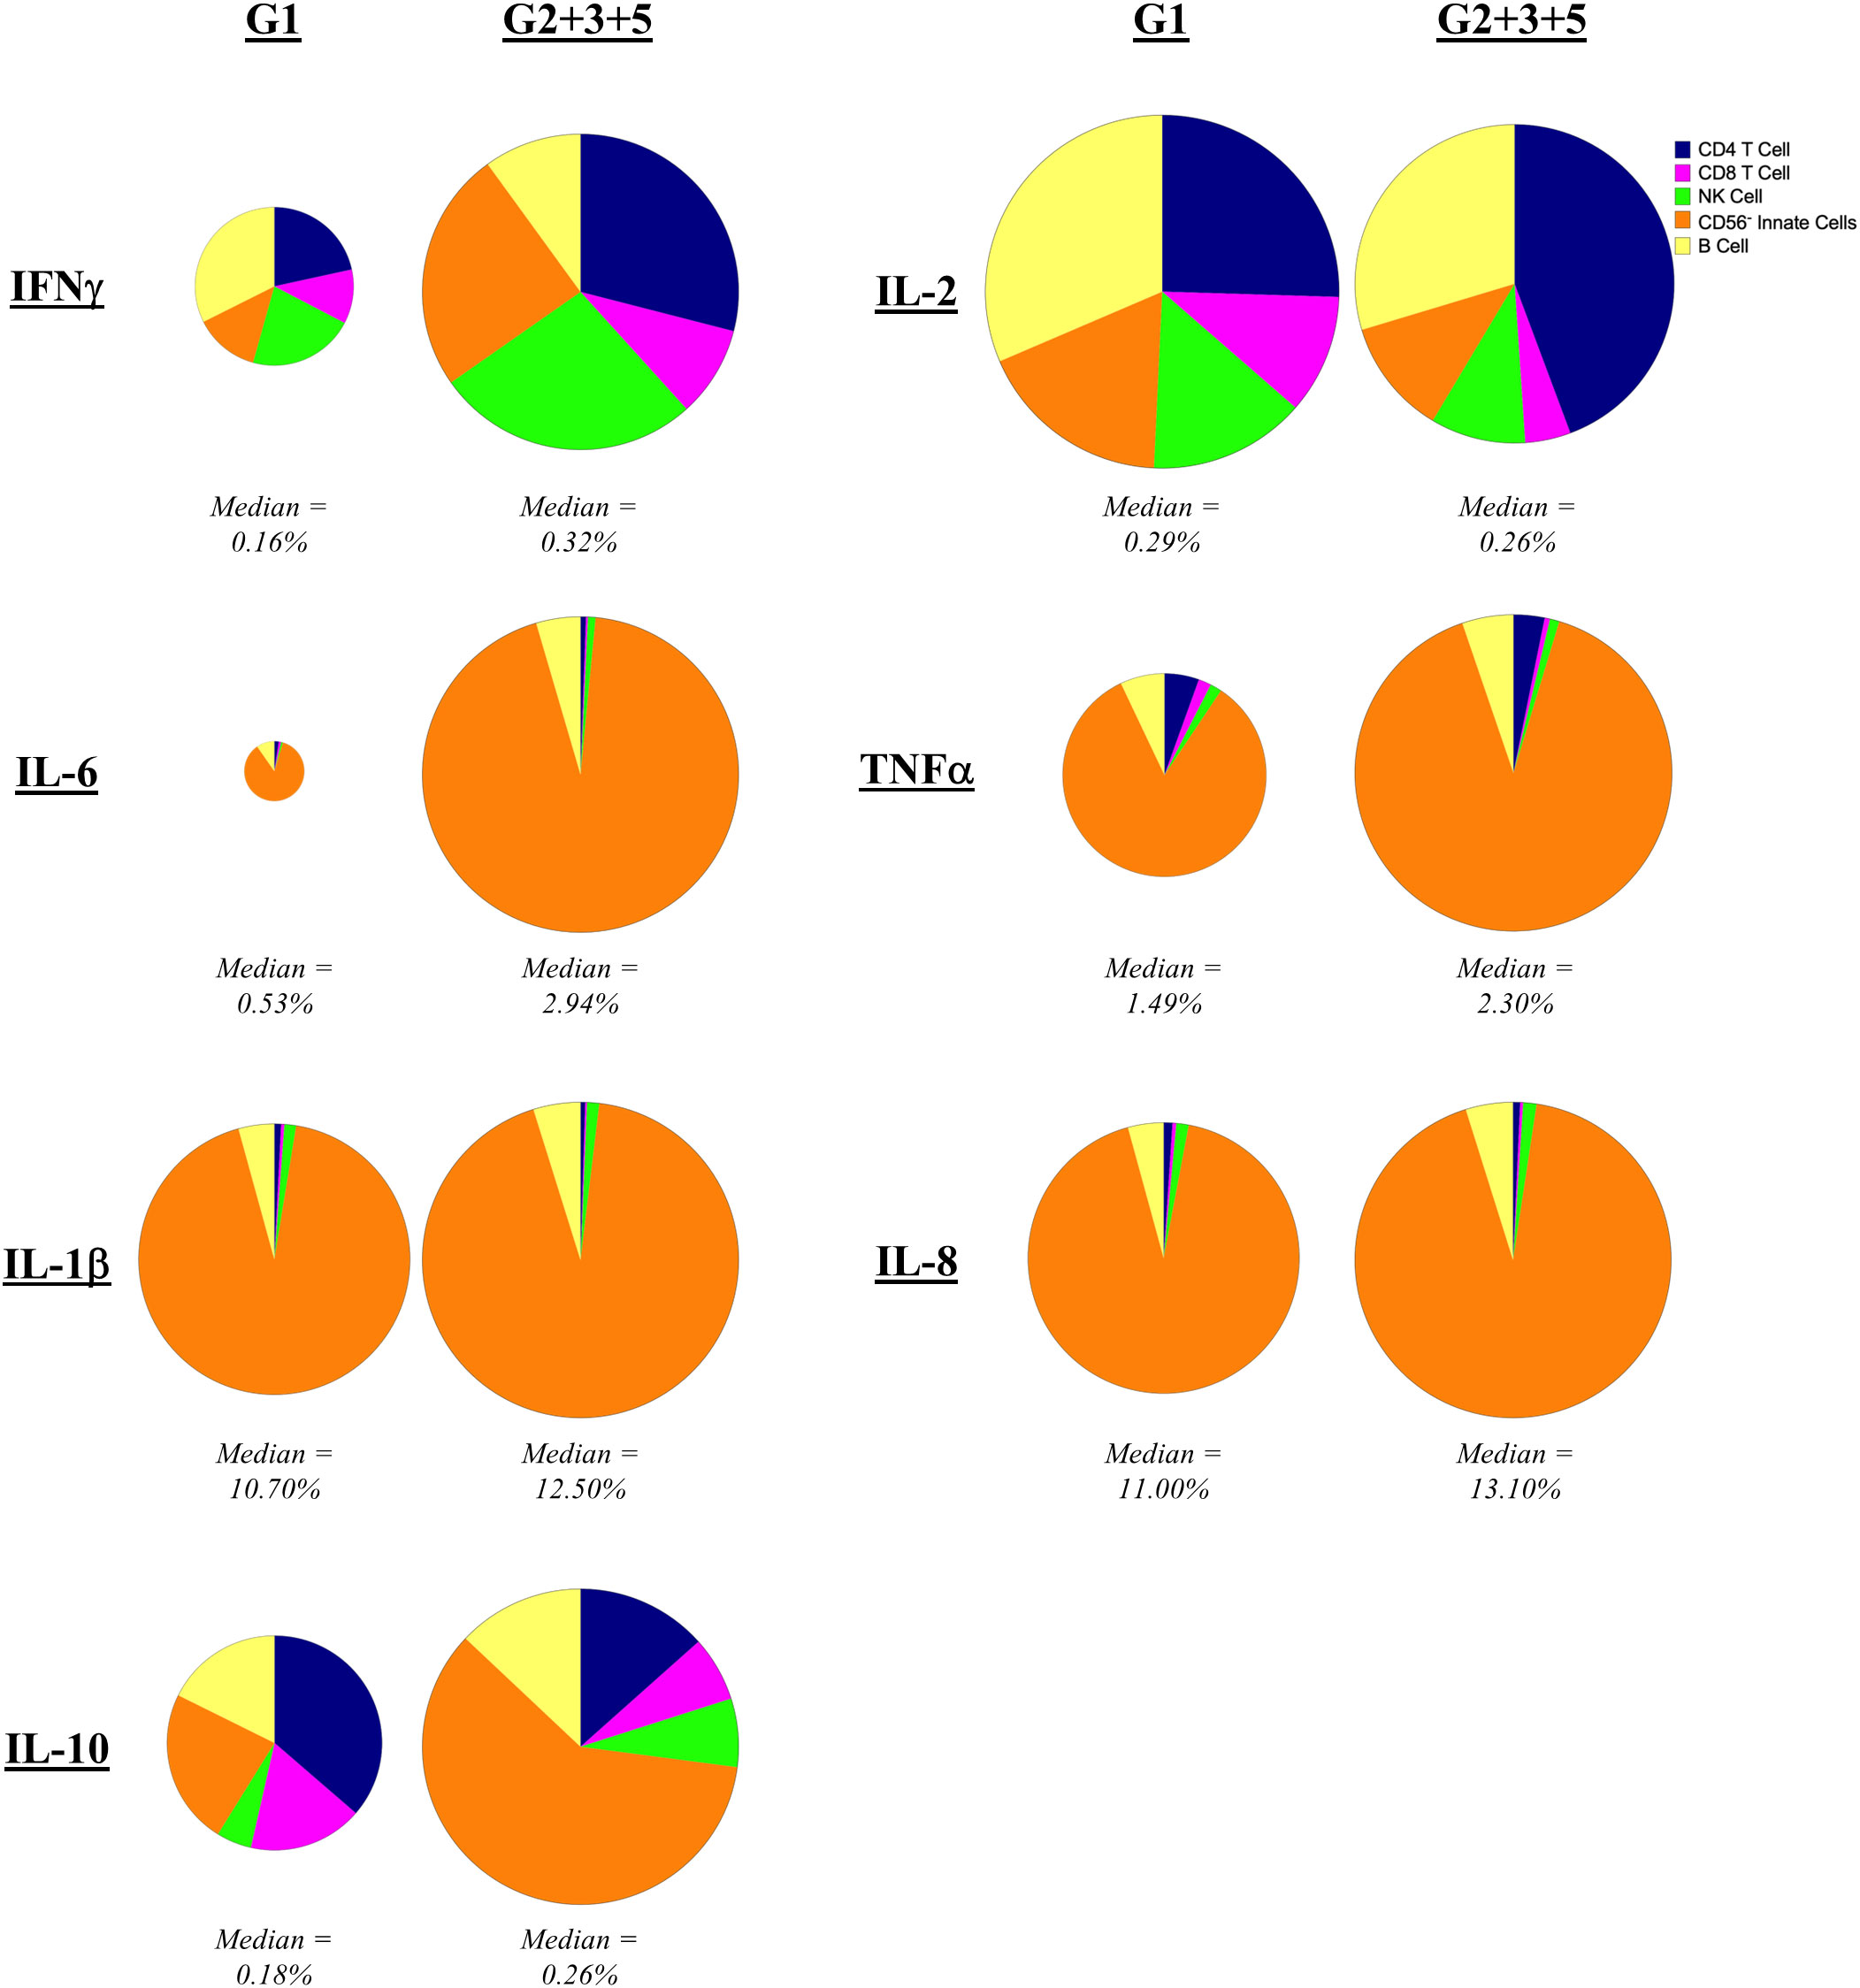
Figure 4 Contribution of mononuclear cell populations to C. burnetii-specific cytokine production. The contribution of CD45+CD66b- cell populations in PBMCs to cytokine production following stimulation with C. burnetii was assessed by mass cytometry. Pie charts indicate the median percent contribution of each cell type (CD4 T cells, CD8 T cells, B cells, NK cells and CD56- innate cells, to the frequency of cytokine-positive (IFNγ, IL-2, IL-6, TNFα, IL-1β, IL-8 or IL-10) cells in C. burnetii-stimulated samples (no background correction) in unexposed Group 1 (n=9) and all pre-exposed individuals (n=27) donors. The size of the pie chart for the pre-exposed donors (Group 2 + 3 + 5) is kept constant across panels. The pie chart of the unexposed group is scaled separately for each cytokine relative to the pre-exposed group, to reflect the difference in median frequency of cytokine positive CD45+ mononuclear cells. The median frequency of cytokine positive CD45+ mononuclear cells in C. burnetii stimulated samples for each group is displayed below each pie chart.
In addition to cytokine production, IGRA-positive individuals also showed enhanced levels of activation markers expression in response to C. burnetii antigen stimulation of PBMCs, which was significant for CD69 and CD137 (Figure 5A). A more granular analysis of the different exposure groups showed that relative to the control Group 1, C. burnetii-induced CD69 and CD154 expression were significantly elevated in seropositive Group 3 individuals only, while the proportion of cells expressing the activation marker CD137 was significantly increased in both seropositive Groups 3 and 5 (Figure 5B).
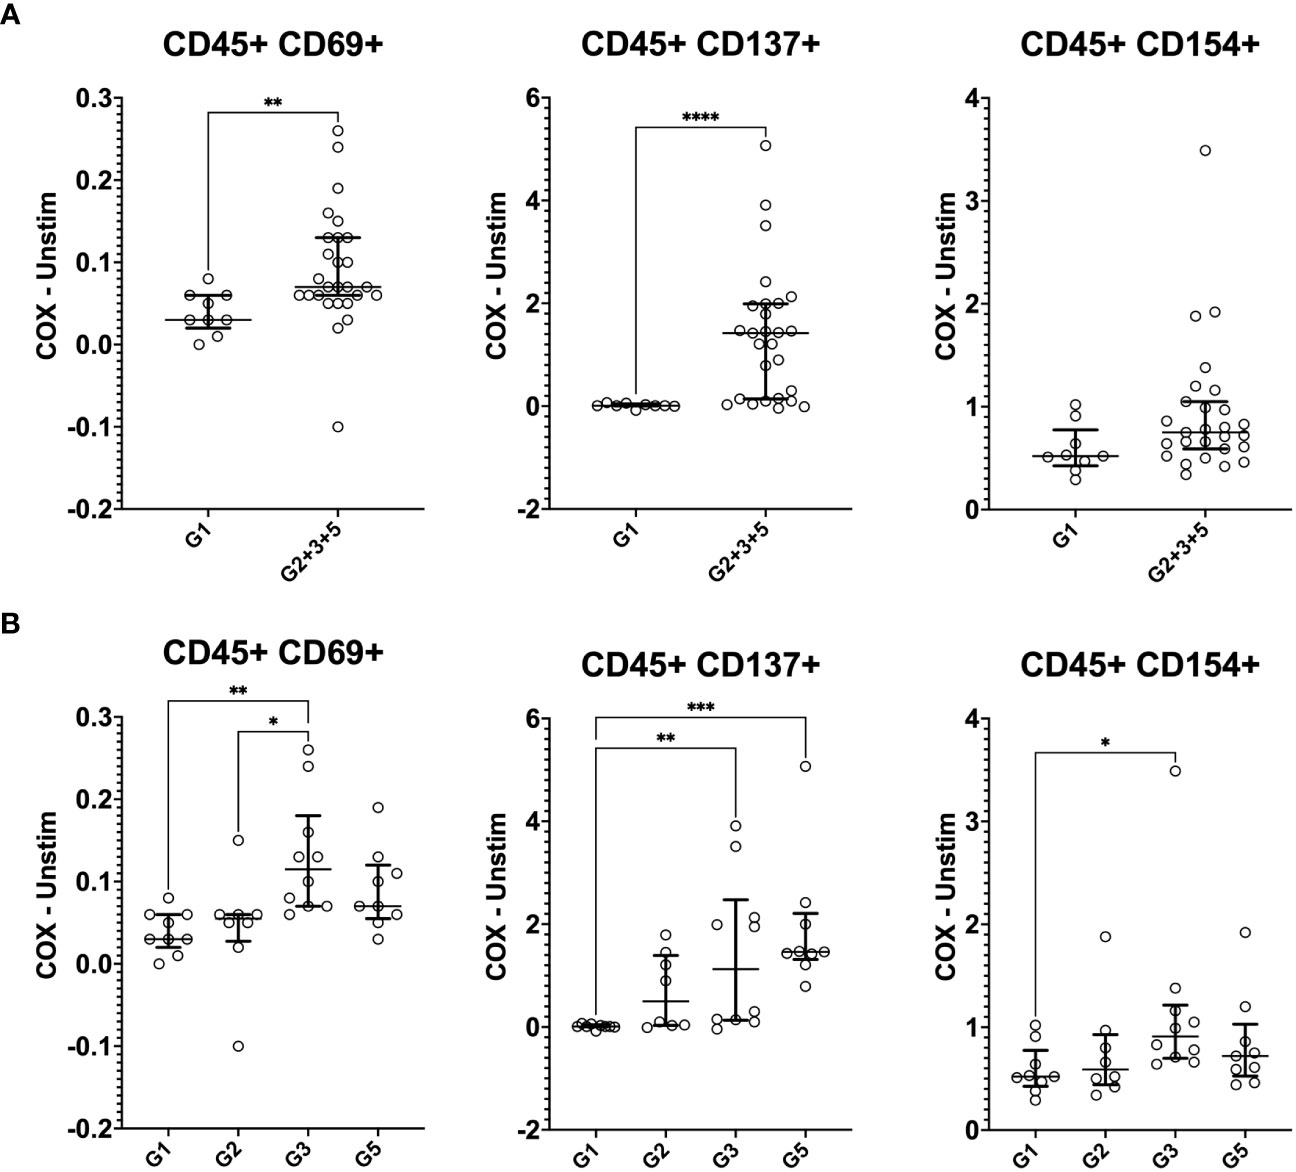
Figure 5 Mass cytometry profiles of C. burnetii-specific activation in stimulated peripheral blood mononuclear cells. Activation of CD45+CD66b- cells following PBMC stimulation with C. burnetii was assessed by mass cytometry. Scatterplots depict the background corrected percentage for each activation marker (CD69, CD137 and CD154) in: (A) unexposed Group 1 (n=9) and all exposed individuals (n=27) donors (Group 2 + 3 + 5), (B) unexposed Group 1 (n=9), seronegative, asymptomatic Group 2 (n=8), seropositive, asymptomatic Group 3 (n=10) and seropositive, symptomatic Group 5 (n=9). Lines indicate the median with interquartile range. Activation responses were compared using the Mann-Whitney U test in (A) and Kruskal-Wallis test followed by Dunn’s post-hoc multiple comparison test for nonparametric data in (B). Asterisks are defined as follows: p > 0.05 (ns), p ≤ 0.05 (*), p ≤ 0.01 (**), p ≤ 0.001 (***) and p ≤ 0.0001 (****).
Finally, we addressed the question of which specific cellular phenotypes characterize the innate and adaptive recall responses induced by C. burnetii antigen stimulation of PBMCs from pre-exposed individuals. To this end, FlowSOM clustering (34) identified 20 sub-populations (meta-clusters C1-C20) within each of the four major populations (CD4 T cells, CD8 T cells, B cells and Innate cells) amongst CD45+CD66b- cells (Figures 6A, C, 7A, C). We then assessed whether meta-cluster abundance was increased upon stimulation with C. burnetii antigen (indicating C. burnetii-specific responses, Figures 6B, D, 7B, C) and whether the specific responses (assessed as background-corrected abundances) were higher in IGRA-positive (Group 2 + 3 + 5) individuals compared to Group 1 controls, and thus linked to prior exposure (Figure 8).
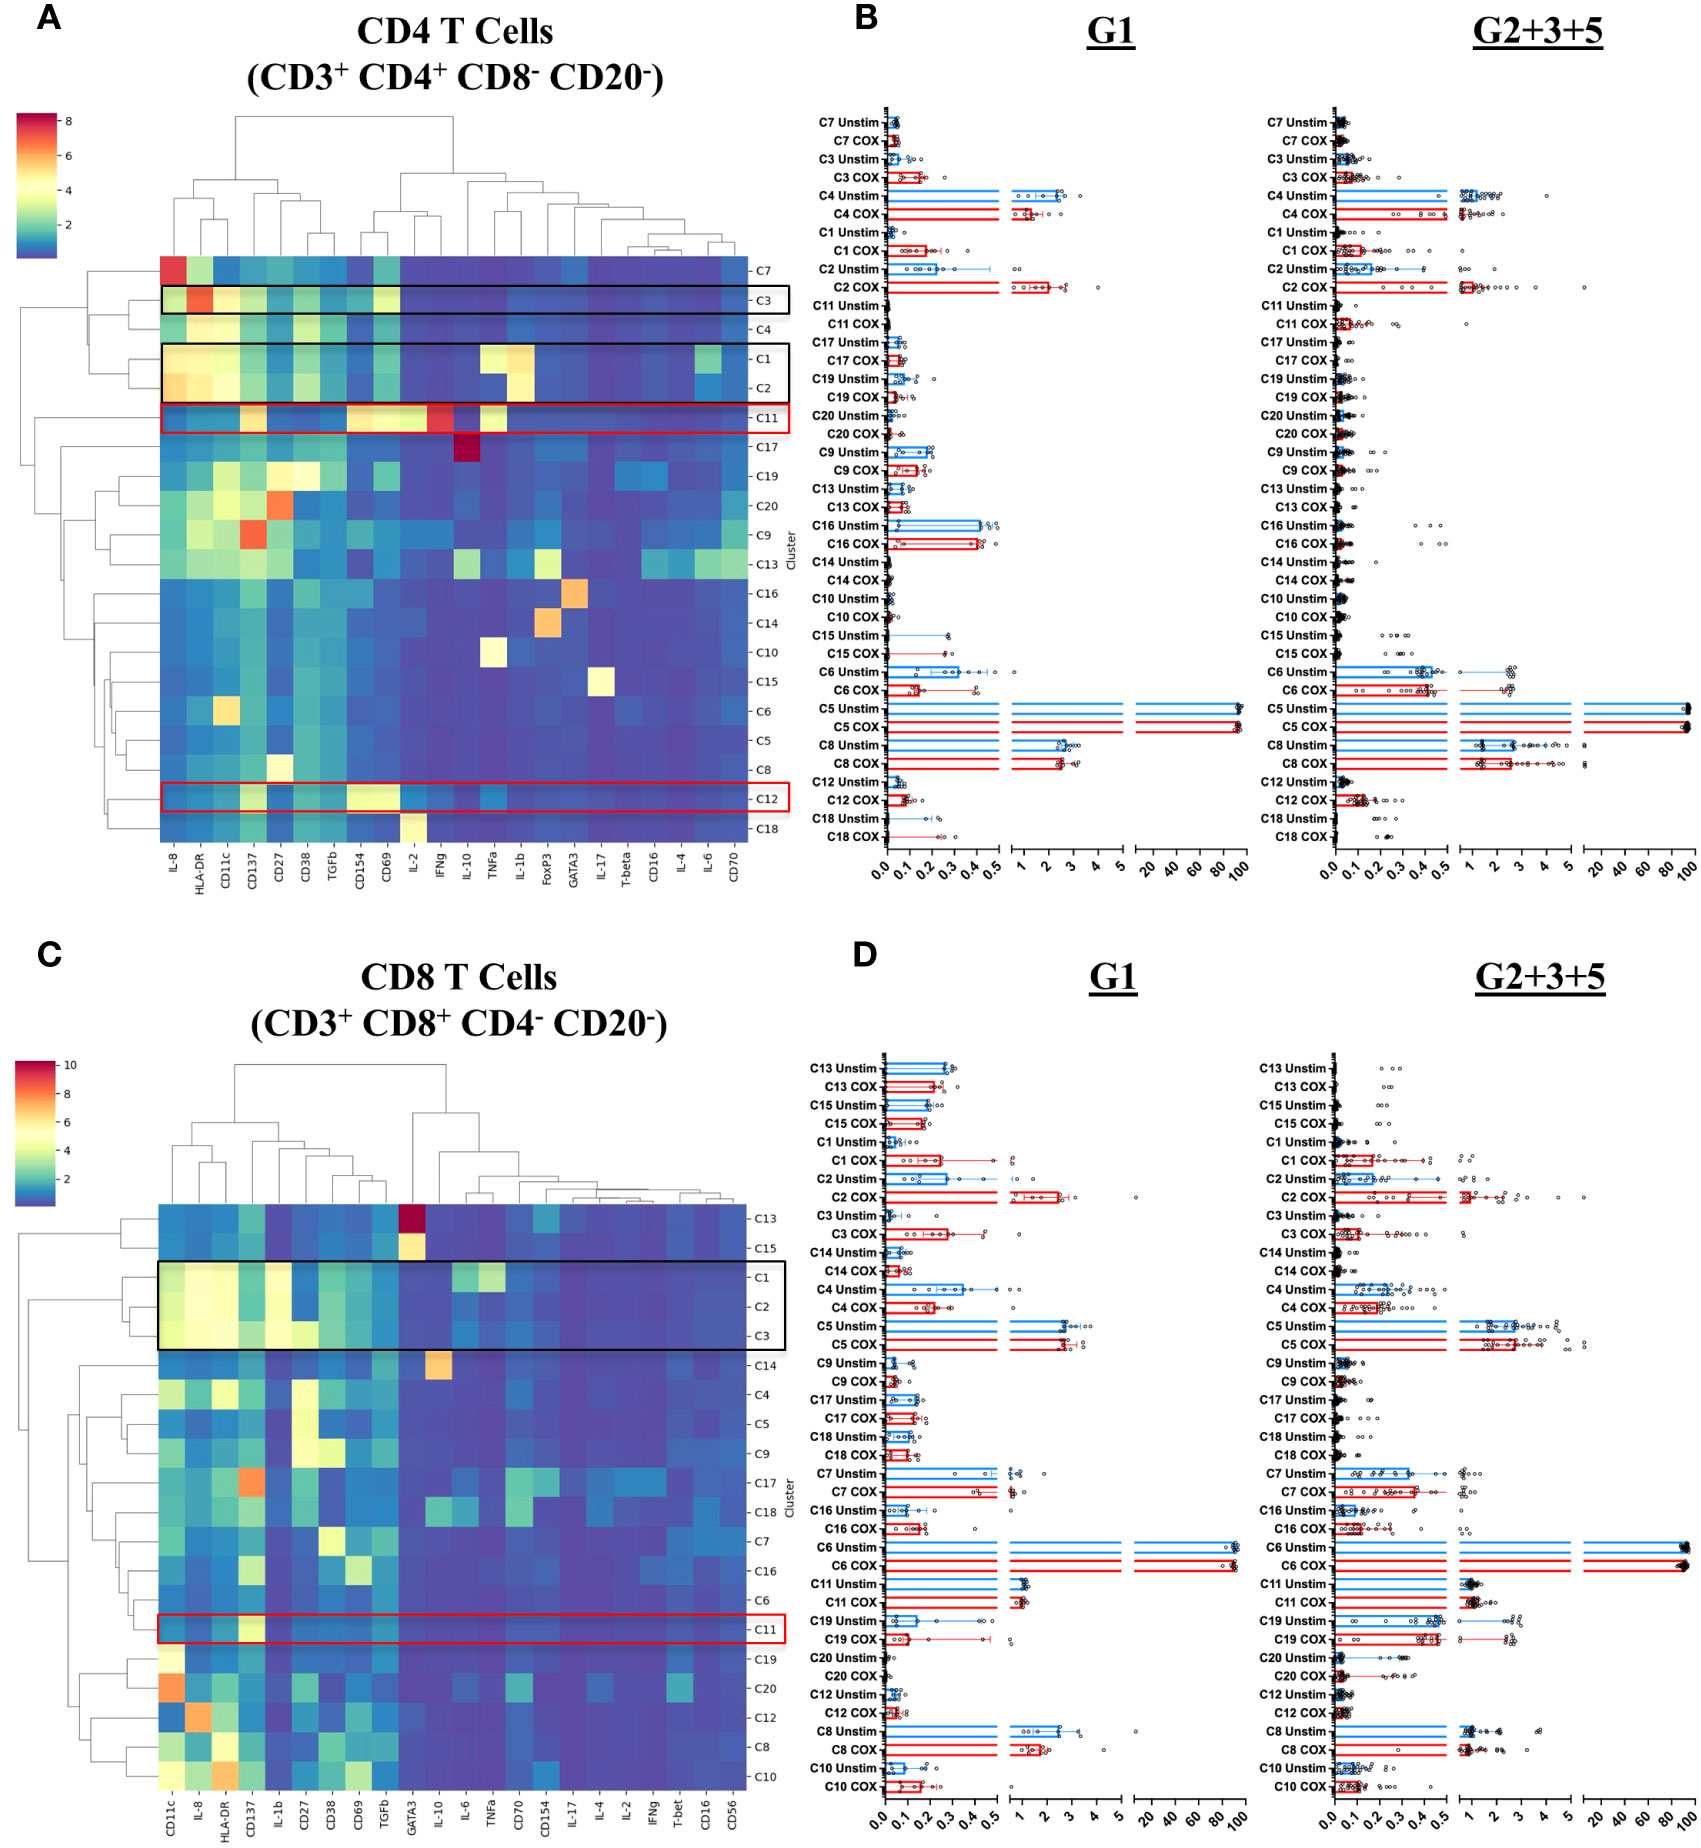
Figure 6 T cell subpopulations characterized by mass cytometry in peripheral blood mononuclear cells. Immune cell meta-clusters were identified through FlowSOM-based clustering of mass cytometry labeled samples. The phenotypic profile of each meta-cluster, in (A) CD4 T cells and (C) CD8 T cells, is depicted in heatmaps. The color gradient on the heatmaps indicates the mean metal intensity for each marker. Dendrograms were generated through hierarchical clustering using Ward linkages. The scatterplots on the right of each heatmap indicate the frequency (abundance) each meta cluster in (B) CD4 T cells and (D) CD8 T cells in each donor in unstimulated (blue) and C. burnetii-stimulated (red) samples. Lines indicate the median with interquartile range. Black boxes in heatmaps (A) and (C) highlight meta-clusters showing increased absolute abundance upon C. burnetii stimulation; red boxes highlight meta-clusters showing higher C. burnetii-specific relative abundance (background-corrected) in all pre-exposed individuals (Group 2 + 3 + 5) compared to Group 1.
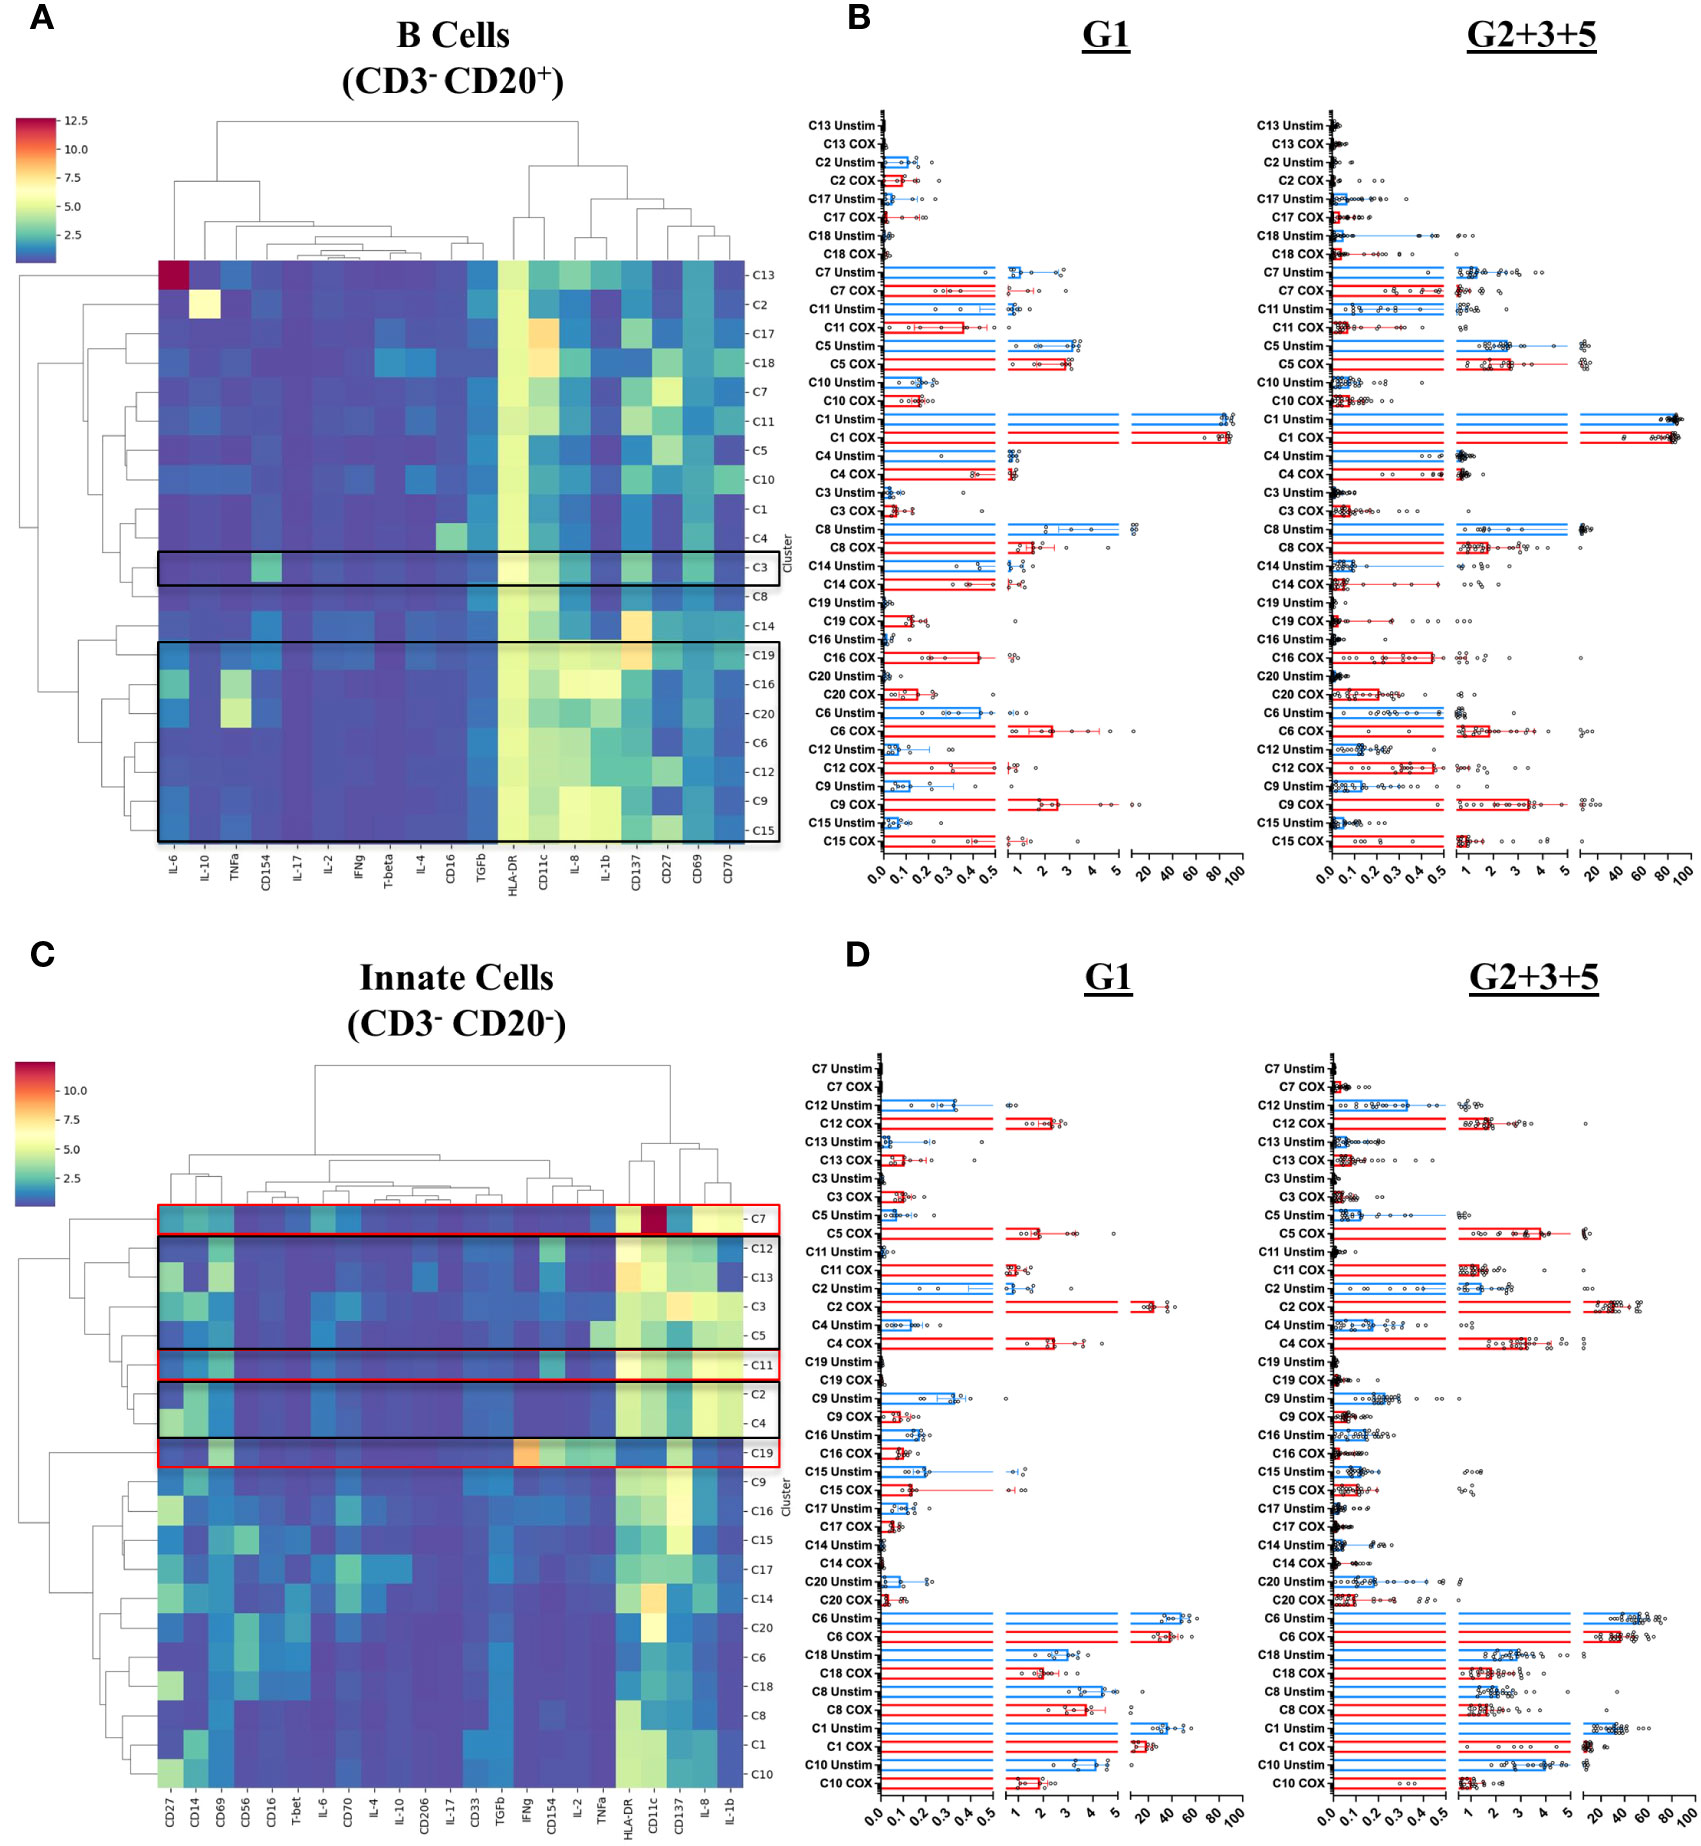
Figure 7 B cell and innate cell subpopulations characterized by mass cytometry in peripheral blood mononuclear cells. Immune cell meta-clusters were identified through FlowSOM based clustering of mass cytometry labeled samples. The phenotypic profile of each meta-cluster, in (A) CD3-CD20+ B cells and (C) CD3-CD20- innate cells, is depicted in heatmaps. The color gradient on the heatmaps indicates the mean metal intensity for each marker. Dendrograms were generated through hierarchical clustering using Ward linkages. The scatterplots on the right of each heatmap indicate the frequency (abundance) each meta cluster in (B) B Cells and (D) Innate cells in each donor in unstimulated (blue) and C. burnetii-stimulated (red) samples. Lines indicate the median with interquartile range. Black boxes in heatmaps (A) and (C) highlight meta-clusters showing increased absolute abundance upon C. burnetii stimulation; red boxes highlight meta-clusters showing higher C. burnetii-specific relative abundance (background-corrected) in all pre-exposed individuals (Group 2 + 3 + 5) compared to Group 1.
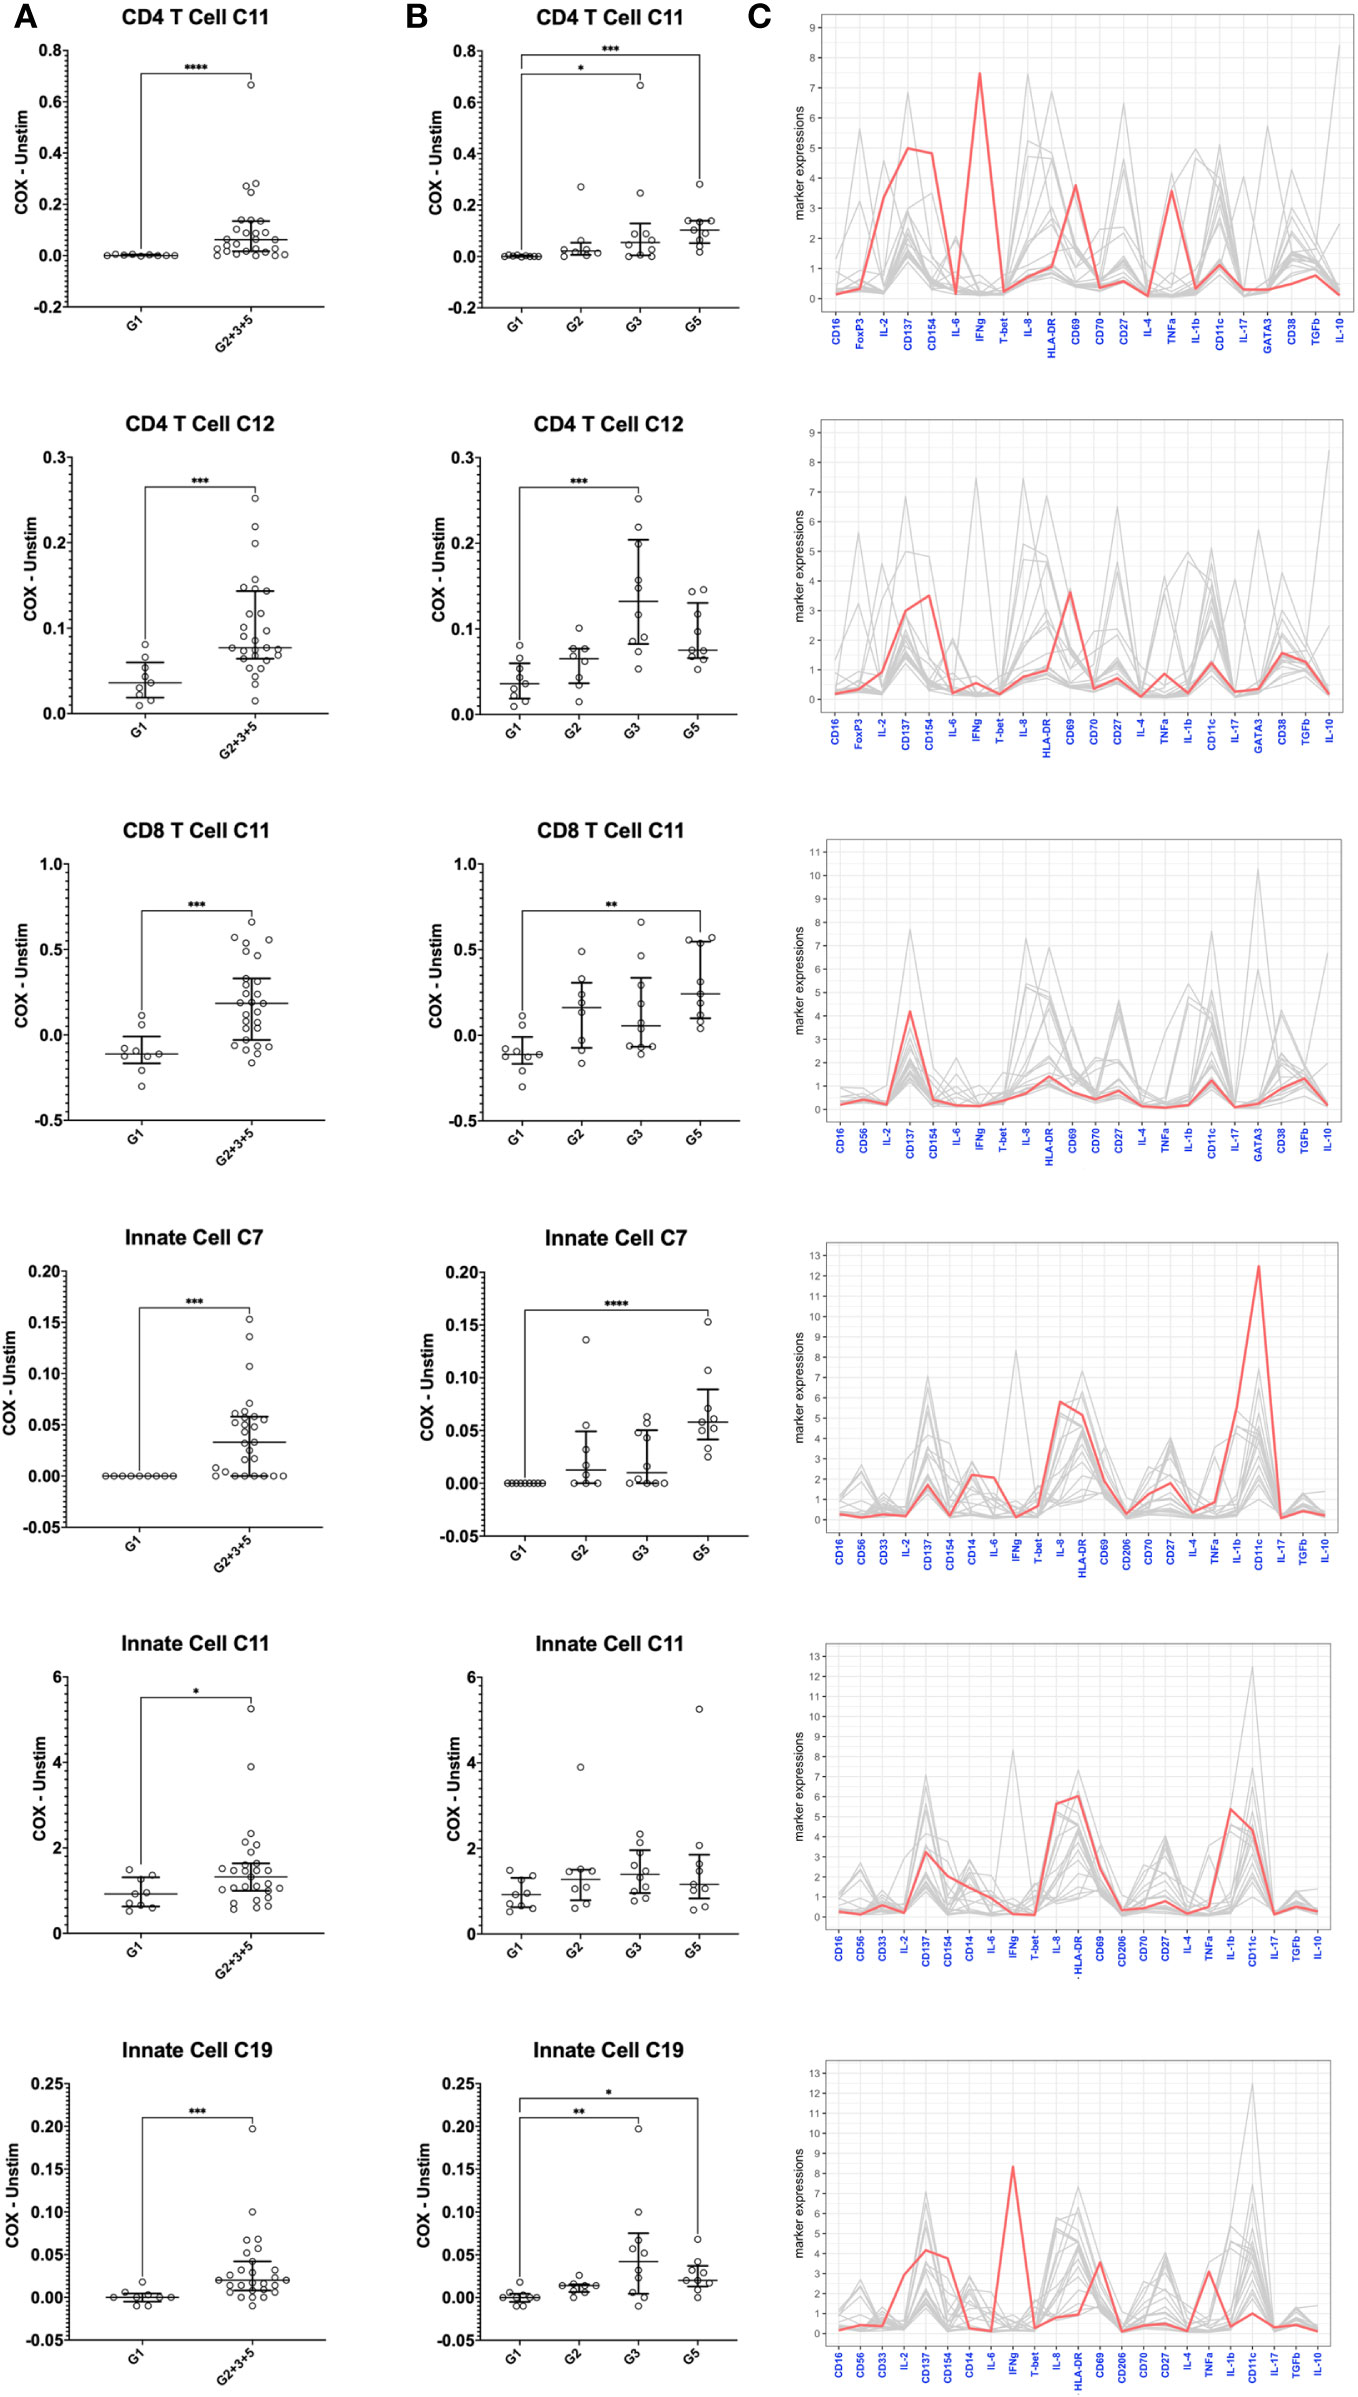
Figure 8 Mass cytometry profiles of C. burnetii-specific cellular responses in peripheral blood mononuclear cells. Cellular responses following stimulation with C. burnetii were assessed by mass cytometry. Scatterplots depict the background corrected percentage of relevant immune cell subpopulations (meta-clusters) in: (A) unexposed Group 1 (n=9) and all exposed individuals (n=27) donors (Group 2 + 3 + 5), (B) unexposed Group 1 (n=9), seronegative, asymptomatic Group 2 (n=8), seropositive, asymptomatic Group 3 (n=10) and seropositive, symptomatic Group 5 (n=9). Lines indicate the median with interquartile range. Activation responses were compared using the Mann-Whitney U test in (A) and Kruskal-Wallis test followed by Dunn’s post-hoc multiple comparison test for nonparametric data in (B). Asterisks are defined as follows: p > 0.05 (ns), p ≤ 0.05 (*), p ≤ 0.01 (**), p ≤ 0.001 (***) and p ≤ 0.0001 (****). (C) Parallel coordinate plots depicting the mean intensity of each marker in the different clusters. Y axis indicates mean metal intensity. Line colored in red depicts the mean metal intensity of markers in that cluster, while lines in gray are depicting the mean metal intensity of markers in all other clusters.
Several meta-clusters amongst both CD4 and CD8 T cells showed enhanced abundance upon stimulation with C. burnetii antigen. CD4 and CD8 meta-clusters exhibiting C. burnetii-specific production of the innate cytokines IL-1β and IL-8 alone (CD4 C2, CD8 C2 and CD8 C3) or in combination with IL-6 and TNFα (CD4 C1 and CD8 C1) did not increase with prior exposure status, or were only found in unexposed individuals (CD4 C3 IL-8+) (Figure 6). In contrast, the relative abundances of two CD4 T cell meta-clusters producing adaptive cytokines were significantly higher in pre-exposed individuals: CD4 C11 (CD137+CD154+CD69+IFNγ+IL-2+TNFα+) and C12 (CD137+CD154+CD69+) (Figure 8), consistent with the elevated production of these cytokines by CD4 T cells in Group 5 individuals, as determined by flow cytometry (Figure 2). Amongst CD8 T cells, only C11 (CD137+) showed a higher relative abundance in pre-exposed individuals. However, this CD8 meta-cluster showed no effector cytokine production, and the difference in abundance between C. burnetii antigen-stimulated versus unstimulated samples was very minimal, especially in view of the abundance of this meta-cluster in unstimulated PBMCs (Figure 6B).
In B cells, eight of the 20 meta-clusters (C3, C19, C16, C20, C6, C12, C9 and C15) showed an increased abundance upon stimulation with C. burnetii antigen in all individuals. The majority of these C. burnetii antigen-stimulation associated B cell meta-clusters was again characterized by production of the innate cytokines IL-1β and IL-8 alone (C19, C6, C12, C9, C15) or in combination with TNFα (C20) or TNFα and IL-6 (C16), and for all relative abundance was unrelated to prior exposure. The same was true for the rare B cell meta-cluster C3 with an activated phenotype but lacking cytokine production (Figures 7A, B). No B cell cluster showed evidence for pre-exposure related C. burnetii-specific responses.
Amongst innate cells, there was again an increased abundance upon stimulation with C. burnetii antigen in all individuals, regardless of prior exposure, of meta-clusters showing production of IL-8 only (C12 and C13; likely dendritic cells that lack CD14 and CD56 expression and express high levels of HLA-DR and CD11c) or IL-1β and IL-8 (C3, C5, C2 and C4; CD14+ monocytes) (Figures 7C, D). Three populations of innate cells, however, showed a significantly higher relative abundance in pre-exposed individuals: the innate meta-clusters C7 (CD11chighCD14+HLA-DR+IL-1β+IL-6+IL-8+) and C11 (CD11cintCD14+HLA-DR+CD69+CD137intCD154intIL-1β+IL-6lowIL-8+), both likely representing monocytes, and a meta-cluster lacking expression of any canonical markers, C19 (CD69+CD137intCD154+IFNγ+IL-2+TNFα+) (Figure 8).
When we further focused on the separate subgroups of IGRA-positive individuals, CD4 and CD8 T cell clusters C11 and innate cell cluster C7 all were significantly increased in Group 5 (seropositive, convalescent from symptomatic infection), while CD4 T cell cluster C12 and innate cell cluster C19 were highest in Group 3 individuals (seropositive, asymptomatic) (Figure 8). Background-corrected frequencies for all T cell and innate cell meta-clusters correlated with IFNγ levels released following stimulation of whole blood, and CD4 T cell cluster C11 and C12 frequencies additionally correlated with IL-2 levels (Supplementary Table 1).
Discussion
In this study we examined the immune cell subpopulations contributing to long-term C. burnetii-specific recall responses approximately ten years post exposure in individuals who contracted Q fever during the Dutch Q fever outbreak of 2007 to 2010. These responses were quantified using IGRA, multiplex cytokine secretion assay, flow cytometry analysis of CD4 T cell and monocyte responses, and mass cytometry profiling of diverse cell populations. In general, we found that prior exposure to C. burnetii was associated with long-term increased recall responses in not only adaptive but also innate immune cell compartments.
Recall responses in humans have previously been analyzed solely by means of bulk cytokine secretion from peripheral immune cells (16, 17, 19, 21–23). To perform a broader and more in-depth analysis of the peripheral immune system we utilized both classical flow cytometry and mass cytometry (CyTOF), which uses heavy metal ion-labeled antibodies and time-of-flight mass spectrometry. This technology permits a much greater number of markers to be probed in parallel in the same sample and in combination with unsupervised clustering analysis facilitates the identification of novel immune subsets and signatures (46). For instance, CyTOF has been applied to analyses following influenza vaccination (47), during acute Zika virus (48) or SARS-CoV2 infection (49, 50) as well as following experimental human Streptococcus pneumoniae challenge (51).
Our study had several limitations. These included the relatively small number of individuals enrolled for the different subgroups in CyTOF analysis, resulting in limited power to detect statistically significant differences. The division of seropositive individuals into past symptomatic and asymptomatic infection was further based on self-reported data collected in 2015, i.e. five to eight years after the epidemic and may therefore not be fully accurate. Finally, we faced a few technical challenges. In the flow cytometry T cell panels, several markers performed poorly with no clearly identifiable populations (CD137, FOXP3, T-bet, IL-10). CyTOF analysis had to be conducted on PBMCs rather than whole blood, and the limitation of barcoding to 20 samples per CyTOF run made it necessary to assess individuals in four different runs on different days. The batch-to-batch variation between the four rounds precluded normalization of some markers which hence were not carried forward for downstream analysis. As these included the markers to distinguish memory and naïve T cells (CD45RO, CD45RA and CCR7), this precluded analysis of these subsets. Despite these limitations, the results of this study both confirm prior observations and highlight novel aspects of the immune responses to C. burnetii that merit future investigation.
The innate and adaptive immune response to C. burnetii infection is multi-faceted (52–55). Innate immune responses are the first line of defense during acute infection and direct the induction of adaptive immune responses. However, C. burnetii invades and replicates in monocytes and macrophages - key cellular components at the interface of the innate and adaptive immune response - and deploys a range of immune evasion mechanisms to avoid intracellular killing in these innate immune cells (56). Being an intracellular pathogen, the clearance of C. burnetii infection largely relies on cellular adaptive immune responses. While antibodies are required to control tissue damage in murine models, they are not sufficient to control infection. Instead, in these animal models T cell responses are critical to controlling early infection, mediating bacterial clearance and conveying vaccination-induced protection (52–55, 57, 58). In addition, there appears to be a greater role for major histocompatibility complex (MHC) class I-restricted CD8 T cell responses during primary infection in murine models (52, 57). For protection from secondary infection, in contrast, there is a greater role for MHC class II-restricted CD4 T cells as well as MHC II-restricted but CD4-independent mechanisms (58). Notably, IFNγ is required for the clearance of primary C. burnetii infection (52), but appears to be less critical for clearance during secondary infection in mice (58).
T cells elicit recall responses through IFNγ production (59), which results in C. burnetii killing in infected monocytes in a TNFα-dependent manner (44, 45). IFNγ secretion in response to stimulation with C. burnetii antigen is known to be enhanced in those having experienced prior infection (31, 59). We detected increased production not only of IFNγ but also of IL-2, IL-6, IL-10 and TNFα following C. burnetii antigen stimulation of peripheral immune cells isolated from individuals with prior exposure to C. burnetii. Flow cytometry and CyTOF both revealed that CD4 T cells were the most consistent contributors to IFNγ and IL-2 recall responses, while monocytes were the predominant source of IL-6, IL-8, IL-10 and TNFα. Additionally, there were some previously exposed donors who also showed elevated IFNγ response by flow cytometry in CD4-negative T cells (i.e. likely CD8 T cells). In our study, using CyTOF we also identified a population of C. burnetii-specific CD4 T cells (CD137+CD154+CD69+IFNγ+IL-2+TNFα+) that was significantly increased in IGRA-positive individuals, particularly those who had exhibited clinical symptoms and remained seropositive. Co-production of these cytokines by specific cell subsets is consistent with data from a prior study looking at bulk cytokine responses to C. burnetii in individuals with prior exposure to C. burnetii (43), which showed that individuals with prior exposure and high IFNγ production also produce high amounts of IL-2. Notably, the CD137+CD154+ CD69+IFNγ+IL2+TNFα+ CD4 T cell cluster C11 and the corresponding lineage-negative innate cell cluster C19 were the only two cell populations showing clear IFNγ production based on the expression-normalized CyTOF data used for unsupervised clustering. The data normalization likely reduced the ability to detect cell populations with lower IFNγ production, such as NK cells and CD8 T cells, which were clearly identifiable by manual gating of CyTOF data or flow cytometry data (for CD4- T cells). Additionally, at least part of the IFNγ responses observed by flow cytometry in the CD4- T cell compartment might originate from unconventional γδ T cells, which largely lack CD4 and CD8 expression. Vγ9 Vδ2 T cells have been shown to be activated and expanded during acute human C. burnetii infection (60), likely by C. burnetii-derived phosphoantigens since Vγ9 Vδ2 T cell activation requires expression of butyrophilin molecules BTN2A and BTN3A on monocytes (61). Since IFNγ is a key cytokine produced by Vγ9 Vδ2 T cells, and these cells have been shown also display the same hallmark ability as adaptive T cells to respond more strongly upon re-exposure (62), it is conceivable that they also contribute to recall responses against C. burnetii.
A key finding of our study is that beyond recall responses by adaptive T cells, we also found several cell populations within the innate compartment that showed increased responses to C. burnetii antigen in pre-exposed (IGRA-positive and seropositive) individuals compared to controls with no evidence of adaptive immunity to C. burnetii (Figures 7C, D, 8). This was particularly evident in individuals with past symptomatic infection (designated Group 5): C. burnetii antigen-stimulated whole blood from these individuals showed elevated bulk release of IL-1β as well as increased IL-6 production by monocytes as detected by flow cytometry. We also observed a trend for increased whole blood release of IL-6 and TNFα, which did not reach significance. This is likely due to the small number of individuals assessed in this analysis, since in a previously published study with considerable larger groups from the same village cohort, release of both IL-6 and TNFα from C. burnetii antigen-stimulated whole blood was significantly higher in IGRA-positive individuals compared to controls (43). CyTOF analysis of C. burnetii antigen-stimulated PBMCs revealed an increased proportion of two innate (CD3-CD20-) clusters in individuals with prior exposure. Innate cluster C7 with the phenotype CD11chighCD14+HLA-DR+IL-1β+IL-6+IL-8+ was particularly strongly increased in a subgroup of pre-exposed, past symptomatic individuals (Group 5), while C11 (CD11cintCD14+HLA-DR+CD69+CD137intCD154intIL-1β+IL-6lowIL-8+) was increased in IGRA-positive (combined Group 2 + 3 + 5) donors.
Both innate clusters associated with prior exposure likely represent CD14+ monocytes, and we have previously already hypothesized, based solely on cytokine release data, that increased innate cytokine responses after in vivo exposure to viable C. burnetii might be due to trained immunity of myeloid cells such as has been described for other pathogens (63). This new cytometry dataset underscores this hypothesis, although it clearly requires further investigation, including experiments evaluating the epigenetic status of monocytes in C. burnetii-exposed individuals. Remarkably, these increased monocyte responses were evident six to ten years after primary exposure to C. burnetii, a much longer timeframe than the up to one year typically attributed to trained immunity based on the short lifespan of innate immune cells (64). On the other hand, trained immunity following BCG vaccination has been shown to last for up to five years, which may be partially attributed to the reprograming of hematopoietic progenitor cells (65, 66). Conceivably the long duration of enhanced innate re-call responses in our study might have also been facilitated by (asymptomatic) re-exposure. Indeed, elevated innate responses were most evident in Group 3 and 5 individuals, also showing the strongest adaptive responses. This also raises the question whether these stronger adaptive immune responses in seropositive individuals might have positively influenced training of innate responses. However, the contribution of adaptive responses to trained immunity is controversial, since IFNγ has been shown to both support and hamper the induction of trained immunity (64). Moreover, while stronger adaptive responses in Groups 3 and 5 could theoretically be a result of re-exposure, this in unlikely the case for all individuals in these cohorts since no large outbreaks have been reported after 2010. Of note, trained innate immunity is generally a property of live attenuated whole cell vaccines (67) and indeed we found no evidence for enhanced innate responses following vaccination with the killed whole cell vaccine Q-VAX (43). If such responses indeed are relevant to protection from or resolving future infection, approaches should be considered to combine future C. burnetii vaccines with amplifiers of trained immunity, such as BCG (67).
Another cell population that showed an increased abundance in C. burnetii antigen-stimulated cultures specifically for IGRA-positive previously exposed individuals was the presumed innate cluster C19 (CD69+CD137midCD154+IFNγ+IL-2+TNFα+). Given the complete lack of lineage marker expression, one possible interpretation of this phenotype is that these cells constitute innate lymphoid cells (ILCs) of ILC1 or ILC3 polarization. IFNγ and TNFα production by these two ILC subsets has been shown to play an important role for the early host defense against a wide range of intracellular pathogens, as reviewed recently (68). Moreover, akin to adaptive lymphocytes, there is accumulating evidence that immunological memory is also a property of innate lymphoid cells and contributes to long-term protection also after vaccination (69). This is likely due to epigenetic modifications, as originally shown for ‘trained immunity’ in monocytes and recently demonstrated for ILC2 cells in asthma (70). Whether or not ILC1 or ILC3 cells indeed contribute to recall responses to C. burnetii requires further work beyond this study, using dedicated flow cytometry or mass cytometry panels (71, 72).
In conclusion, our cytometry data set profiling cellular recall responses in a cohort of individuals up to a decade after natural exposure to C. burnetii shows that CD4 T cells are the major driver of previously reported C. burnetii-specific production of IFNγ and IL-2. In addition, we find evidence that an innate population possibly resembling ILCs also contributes to this Th1-type re-call response. Finally, our data show that although numerous cell populations in the innate and adaptive compartments produce innate cytokines upon C. burnetii antigen stimulation regardless of prior exposure, the release of innate cytokines IL-1β, IL-6 and IL-8 and the proportion of two distinct monocyte populations expressing these cytokines in response to C. burnetii was specifically elevated in previously exposed individuals, indicative of trained innate immunity. These findings provide important new insights into the nature of recall responses to C. burnetii, warrant future studies to determine whether innate responses contribute to protection from C. burnetii infection and have the potential to inform the design of novel vaccines for Q fever.
Data availability statement
The raw data supporting the conclusions of this article will be made available by the authors, without undue reservation.
Ethics statement
The studies involving humans were approved by Medical Ethical Committee Brabant (Tilburg, Netherlands, NL51305.028.15). The studies were conducted in accordance with the local legislation and institutional requirements. The participants provided their written informed consent to participate in this study.
Author contributions
SRP, AS, PR, AG, AES and MP conceptualized and designed the study and experiments. Experiments were performed by SRP and AS. Data were analyzed by SP, AS, SK, RS, JH, and RD, and interpreted by SRP and AS. AG, AES and MP acquired funding and supervised research activities. SRP and AS wrote the manuscript and PR, AES, AG and MP critically reviewed and approved the manuscript. All authors contributed to the article and approved the submitted version.
Funding
This study was supported by contract HDTRA1-15-C-0020 from the US Defense Threat Reduction Agency (www.dtra.mil), awarded to Massachusetts General Hospital, with MP as Lead Principal Investigator. Additional support for data analysis was provided by the Vaccine & Immunotherapy Innovation Fund of Massachusetts General Hospital.
Acknowledgments
We would like to thank the volunteers from the village of Herpen, The Netherlands, for their participation in this study. This study utilized the results of the Q-Herpen-II database (described in (32)). The Q-Herpen-II database was established by the GGD Hart voor Brabant (‘s-Hertogenbosch, NL) in collaboration with the Jeroen Bosch Hospital (‘s-Hertogenbosch, NL) and Innatoss Laboratories (Oss, NL). We thank the GGD Hart voor Brabant for making parts of the Herpen-II database available for analysis as the basis for subject selection and for help with the recruitment of volunteers. Dr. Thomas Luijkx is acknowledged for his contribution to volunteer inclusion at the start of the project, Katinka Mulder for technical assistance with stimulation and flow cytometry staining, and Lester Tsai for assistance in preparing CyTOF data visualizations. We would like to thank Nicole Paul from the mass cytometry core at the Dana Farber Cancer Institute for all her assistance with acquiring the data.
Conflict of interest
AG is CEO and AS was a senior scientist at Innatoss Laboratories B.V., which provides diagnostic screening for Q fever.
The remaining authors declare that the research was conducted in the absence of any commercial or financial relationships that could be construed as a potential conflict of interest.
Publisher’s note
All claims expressed in this article are solely those of the authors and do not necessarily represent those of their affiliated organizations, or those of the publisher, the editors and the reviewers. Any product that may be evaluated in this article, or claim that may be made by its manufacturer, is not guaranteed or endorsed by the publisher.
Supplementary material
The Supplementary Material for this article can be found online at: https://www.frontiersin.org/articles/10.3389/fimmu.2023.1249581/full#supplementary-material
References
1. Eldin C, Melenotte C, Mediannikov O, Ghigo E, Million M, Edouard S, et al. From Q fever to coxiella burnetii infection: a paradigm change. Clin Microbiol Rev (2017) 30(1):115–90. doi: 10.1128/CMR.00045-16
2. Tigertt WD, Benenson AS, Gochenour WS. Airborne Q fever. Bacteriol Rev (1961) 25(3):285–93. doi: 10.1128/br.25.3.285-293.1961
3. Brooke RJ, Kretzschmar ME, Mutters NT, Teunis PF. Human dose response relation for airborne exposure to Coxiella burnetii. BMC Infect Dis (2013) 13:488. doi: 10.1186/1471-2334-13-488
4. Madariaga MG, Rezai K, Trenholme GM, Weinstein RA. Q fever: a biological weapon in your backyard. Lancet Infect Dis (2003) 3(11):709–21. doi: 10.1016/s1473-3099(03)00804-1
5. Dijkstra F, van der Hoek W, Wijers N, Schimmer B, Rietveld A, Wijkmans CJ, et al. The 2007-2010 Q fever epidemic in The Netherlands: characteristics of notified acute Q fever patients and the association with dairy goat farming. FEMS Immunol Med Microbiol (2012) 64(1):3–12. doi: 10.1111/j.1574-695X.2011.00876.x
6. van der Hoek W, Hogema BM, Dijkstra F, Rietveld A, Wijkmans CJ, Schneeberger PM, et al. Relation between Q fever notifications and Coxiella burnetii infections during the 2009 outbreak in The Netherlands. Euro Surveill (2012) 17(3):20058. doi: 10.2807/ese.17.03.20058-en
7. Kampschreur LM, Hagenaars JC, Wielders CC, Elsman P, Lestrade PJ, Koning OH, et al. Screening for Coxiella burnetii seroprevalence in chronic Q fever high-risk groups reveals the magnitude of the Dutch Q fever outbreak. Epidemiol Infect (2013) 141(4):847–51. doi: 10.1017/S0950268812001203
8. Kampschreur LM, Oosterheert JJ, Hoepelman AI, Lestrade PJ, Renders NH, Elsman P, et al. Prevalence of chronic Q fever in patients with a history of cardiac valve surgery in an area where Coxiella burnetii is epidemic. Clin Vaccine Immunol (2012) 19(8):1165–9. doi: 10.1128/CVI.00185-12
9. Woldeyohannes SM, Perkins NR, Baker P, Gilks CF, Knibbs LD, Reid SA. Q fever vaccine efficacy and occupational exposure risk in Queensland, Australia: A retrospective cohort study. Vaccine (2020) 38(42):6578–84. doi: 10.1016/j.vaccine.2020.08.006
10. Marmion BP, Ormsbee RA, Kyrkou M, Wright J, Worswick DA, Izzo AA, et al. Vaccine prophylaxis of abattoir-associated Q fever: eight years’ experience in Australian abattoirs. Epidemiol Infect (1990) 104(2):275–87. doi: 10.1017/s0950268800059458
11. Ruiz S, Wolfe DN. Vaccination against Q fever for biodefense and public health indications. Front Microbiol (2014) 5:726. doi: 10.3389/fmicb.2014.00726
12. Graves SR, Islam A, Webb LD, Marsh I, Plain K, Westman M, et al. An o-specific polysaccharide/tetanus toxoid conjugate vaccine induces protection in guinea pigs against virulent challenge with coxiella burnetii. Vaccines (Basel) (2022) 10(9):1393. doi: 10.3390/vaccines10091393
13. Gregory AE, van Schaik EJ, Fratzke AP, Russell-Lodrigue KE, Farris CM, Samuel JE. Soluble antigens derived from Coxiella burnetii elicit protective immunity in three animal models without inducing hypersensitivity. Cell Rep Med (2021) 2(12):100461. doi: 10.1016/j.xcrm.2021.100461
14. Sluder AE, Raju Paul S, Moise L, Dold C, Richard G, Silva-Reyes L, et al. Evaluation of a human T cell-targeted multi-epitope vaccine for Q fever in animal models of coxiella burnetii immunity. Front Immunol (2022) 13:901372. doi: 10.3389/fimmu.2022.901372
15. Fratzke AP, van Schaik EJ, Samuel JE. Immunogenicity and reactogenicity in Q fever vaccine development. Front Immunol (2022) 13:886810. doi: 10.3389/fimmu.2022.886810
16. Jansen AFM, Dinkla A, Roest HJ, Bleeker-Rovers CP, Schoffelen T, Joosten LAB, et al. Viable Coxiella burnetii induces differential cytokine responses in chronic Q fever patients compared to heat-killed Coxiella burnetii. Infect Immun (2018) 86(10):e00333-18. doi: 10.1128/IAI.00333-18
17. Jansen AFM, Schoffelen T, Textoris J, Mege JL, Nabuurs-Franssen M, Raijmakers RPH, et al. CXCL9, a promising biomarker in the diagnosis of chronic Q fever. BMC Infect Dis (2017) 17(1):556. doi: 10.1186/s12879-017-2656-6
18. Ka MB, Gondois-Rey F, Capo C, Textoris J, Million M, Raoult D, et al. Imbalance of circulating monocyte subsets and PD-1 dysregulation in Q fever endocarditis: the role of IL-10 in PD-1 modulation. PloS One (2014) 9(9):e107533. doi: 10.1371/journal.pone.0107533
19. Ka MB, Mezouar S, Ben Amara A, Raoult D, Ghigo E, Olive D, et al. Coxiella burnetii induces inflammatory interferon-like signature in plasmacytoid dendritic cells: A new feature of immune response in Q fever. Front Cell Infect Microbiol (2016) 6:70. doi: 10.3389/fcimb.2016.00070
20. Raijmakers RPH, Jansen AFM, Keijmel SP, Schoffelen T, Scholzen A, van der Meer JWM, et al. Interferon-gamma and CXCL10 responses related to complaints in patients with Q fever fatigue syndrome. Eur J Clin Microbiol Infect Dis (2018) 37(7):1385–91. doi: 10.1007/s10096-018-3265-z
21. Schoffelen T, Joosten LA, Herremans T, de Haan AF, Ammerdorffer A, Rumke HC, et al. Specific interferon gamma detection for the diagnosis of previous Q fever. Clin Infect Dis (2013) 56(12):1742–51. doi: 10.1093/cid/cit129
22. Schoffelen T, Sprong T, Bleeker-Rovers CP, Wegdam-Blans MC, Ammerdorffer A, Pronk MJ, et al. A combination of interferon-gamma and interleukin-2 production by Coxiella burnetii-stimulated circulating cells discriminates between chronic Q fever and past Q fever. Clin Microbiol Infect (2014) 20(7):642–50. doi: 10.1111/1469-0691.12423
23. Schoffelen T, Wegdam-Blans MC, Ammerdorffer A, Pronk MJ, Soethoudt YE, Netea MG, et al. Specific in vitro interferon-gamma and IL-2 production as biomarkers during treatment of chronic Q fever. Front Microbiol (2015) 6:93. doi: 10.3389/fmicb.2015.00093
24. Ka MB, Bechah Y, Olive D, Mege JL. Programmed death ligand-1 expression and memory T-cell generation in Coxiella burnetii infection. Microb Pathog (2015) 80:1–6. doi: 10.1016/j.micpath.2015.02.002
25. Layez C, Brunet C, Lepolard C, Ghigo E, Capo C, Raoult D, et al. Foxp3(+)CD4(+)CD25(+) regulatory T cells are increased in patients with Coxiella burnetii endocarditis. FEMS Immunol Med Microbiol (2012) 64(1):137–9. doi: 10.1111/j.1574-695X.2011.00902.x
26. Fratzke AP, Gregory AE, van Schaik EJ, Samuel JE. Coxiella burnetii whole cell vaccine produces a th1 delayed-type hypersensitivity response in a novel sensitized mouse model. Front Immunol (2021) 12:754712. doi: 10.3389/fimmu.2021.754712
27. Reeves PM, Raju Paul S, Baeten L, Korek SE, Yi Y, Hess J, et al. Novel multiparameter correlates of Coxiella burnetii infection and vaccination identified by longitudinal deep immune profiling. Sci Rep (2020) 10(1):13311. doi: 10.1038/s41598-020-69327-x
28. Scholzen A, Richard G, Moise L, Baeten LA, Reeves PM, Martin WD, et al. Promiscuous Coxiella burnetii CD4 epitope clusters associated with human recall responses are candidates for a novel T-cell targeted multi-epitope Q fever vaccine. Front Immunol (2019) 10:207. doi: 10.3389/fimmu.2019.00207
29. Morroy G, van der Hoek W, Nanver ZD, Schneeberger PM, Bleeker-Rovers CP, van der Velden J, et al. The health status of a village population, 7 years after a major Q fever outbreak. Epidemiol Infect (2016) 144(6):1153–62. doi: 10.1017/S0950268815002472
30. Karagiannis I, Schimmer B, Van Lier A, Timen A, Schneeberger P, Van Rotterdam B, et al. Investigation of a Q fever outbreak in a rural area of The Netherlands. Epidemiol Infect (2009) 137(9):1283–94. doi: 10.1017/S0950268808001908
31. Scholzen A, de Vries M, Duerr HP, Roest HJ, Sluder AE, Poznansky MC, et al. Whole Blood Interferon gamma Release Is a More Sensitive Marker of Prior Exposure to Coxiella burnetii Than Are Antibody Responses. Front Immunol (2021) 12:701811. doi: 10.3389/fimmu.2021.701811
32. Morroy G, van der Hoek W, Albers J, Coutinho RA, Bleeker-Rovers CP, Schneeberger PM. Population screening for chronic Q-fever seven years after a major outbreak. PloS One (2015) 10(7):e0131777. doi: 10.1371/journal.pone.0131777
33. Van Gassen S, Gaudilliere B, Angst MS, Saeys Y, Aghaeepour N. CytoNorm: A normalization algorithm for cytometry data. Cytometry A (2020) 97(3):268–78. doi: 10.1002/cyto.a.23904
34. Van Gassen S, Callebaut B, Van Helden MJ, Lambrecht BN, Demeester P, Dhaene T, et al. FlowSOM: Using self-organizing maps for visualization and interpretation of cytometry data. Cytometry A (2015) 87(7):636–45. doi: 10.1002/cyto.a.22625
35. Clerici M, Giorgi JV, Chou CC, Gudeman VK, Zack JA, Gupta P, et al. Cell-mediated immune response to human immunodeficiency virus (HIV) type 1 in seronegative homosexual men with recent sexual exposure to HIV-1. J Infect Dis (1992) 165(6):1012–9. doi: 10.1093/infdis/165.6.1012
36. Kelker HC, Seidlin M, Vogler M, Valentine FT. Lymphocytes from some long-term seronegative heterosexual partners of HIV-infected individuals proliferate in response to HIV antigens. AIDS Res Hum Retroviruses (1992) 8(8):1355–9. doi: 10.1089/aid.1992.8.1355
37. Rowland-Jones SL, Nixon DF, Aldhous MC, Gotch F, Ariyoshi K, Hallam N, et al. HIV-specific cytotoxic T-cell activity in an HIV-exposed but uninfected infant. Lancet (8849) 1993:341. doi: 10.1016/0140-6736(93)93063-7
38. Wiegand J, Meya S, Schlaphoff V, Manns MP, Mossner J, Wedemeyer H, et al. HBV-specific T-cell responses in healthy seronegative sexual partners of patients with chronic HBV infection. J Viral Hepat (2010) 17(9):631–9. doi: 10.1111/j.1365-2893.2009.01220.x
39. Scognamiglio P, Accapezzato D, Casciaro MA, Cacciani A, Artini M, Bruno G, et al. Presence of effector CD8+ T cells in hepatitis C virus-exposed healthy seronegative donors. J Immunol (1999) 162(11):6681–9. doi: 10.4049/jimmunol.162.11.6681
40. Posavad CM, Remington M, Mueller DE, Zhao L, Magaret AS, Wald A, et al. Detailed characterization of T cell responses to herpes simplex virus-2 in immune seronegative persons. J Immunol (2010) 184(6):3250–9. doi: 10.4049/jimmunol.0900722
41. Gallais F, Velay A, Nazon C, Wendling MJ, Partisani M, Sibilia J, et al. Intrafamilial exposure to SARS-coV-2 associated with cellular immune response without seroconversion, France. Emerg Infect Dis (2021) 27(1):113–21. doi: 10.3201/eid2701.203611
42. Jay C, Ratcliff J, Turtle L, Goulder P, Klenerman P. Exposed seronegative: Cellular immune responses to SARS-CoV-2 in the absence of seroconversion. Front Immunol (2023) 14:1092910. doi: 10.3389/fimmu.2023.1092910
43. Raju Paul S, Scholzen A, Mukhtar G, Wilkinson S, Hobson P, Dzeng RK, et al. Natural exposure- and vaccination-induced profiles of ex vivo whole blood cytokine responses to Coxiella burnetii. Front Immunol (2022) 13:886698. doi: 10.3389/fimmu.2022.886698
44. Dellacasagrande J, Capo C, Raoult D, Mege JL. IFN-gamma-mediated control of Coxiella burnetii survival in monocytes: the role of cell apoptosis and TNF. J Immunol (1999) 162(4):2259–65. doi: 10.4049/jimmunol.162.4.2259
45. Dellacasagrande J, Ghigo E, Raoult D, Capo C, Mege JL. IFN-gamma-induced apoptosis and microbicidal activity in monocytes harboring the intracellular bacterium Coxiella burnetii require membrane TNF and homotypic cell adherence. J Immunol (2002) 169(11):6309–15. doi: 10.4049/jimmunol.169.11.6309
46. Reeves PM, Sluder AE, Paul SR, Scholzen A, Kashiwagi S, Poznansky MC. Application and utility of mass cytometry in vaccine development. FASEB J (2018) 32(1):5–15. doi: 10.1096/fj.201700325R
47. Subrahmanyam PB, Holmes TH, Lin D, Su LF, Obermoser G, Banchereau J, et al. Mass cytometry defines virus-specific CD4(+) T cells in influenza vaccination. Immunohorizons (2020) 4(12):774–88. doi: 10.4049/immunohorizons.1900097
48. Zhao Y, Amodio M, Vander Wyk B, Gerritsen B, Kumar MM, van Dijk D, et al. Single cell immune profiling of dengue virus patients reveals intact immune responses to Zika virus with enrichment of innate immune signatures. PloS Negl Trop Dis (2020) 14(3):e0008112. doi: 10.1371/journal.pntd.0008112
49. Chevrier S, Zurbuchen Y, Cervia C, Adamo S, Raeber ME, de Souza N, et al. A distinct innate immune signature marks progression from mild to severe COVID-19. Cell Rep Med (2021) 2(1):100166. doi: 10.1016/j.xcrm.2020.100166
50. Morrissey SM, Geller AE, Hu X, Tieri D, Ding C, Klaes CK, et al. A specific low-density neutrophil population correlates with hypercoagulation and disease severity in hospitalized COVID-19 patients. JCI Insight (2021) 6(9):e148435. doi: 10.1172/jci.insight.148435
51. Jochems SP, de Ruiter K, Solorzano C, Voskamp A, Mitsi E, Nikolaou E, et al. Innate and adaptive nasal mucosal immune responses following experimental human pneumococcal colonization. J Clin Invest (2019) 129(10):4523–38. doi: 10.1172/JCI128865
52. Andoh M, Zhang G, Russell-Lodrigue KE, Shive HR, Weeks BR, Samuel JE. T cells are essential for bacterial clearance, and gamma interferon, tumor necrosis factor alpha, and B cells are crucial for disease development in Coxiella burnetii infection in mice. Infect Immun (2007) 75(7):3245–55. doi: 10.1128/IAI.01767-06
53. Humphres RC, Hinrichs DJ. Role of antibody in Coxiella burnetii infection. Infect Immun (1981) 31(2):641–5. doi: 10.1128/iai.31.2.641-645.1981
54. Read AJ, Erickson S, Harmsen AG. Role of CD4+ and CD8+ T cells in clearance of primary pulmonary infection with Coxiella burnetii. Infect Immun (2010) 78(7):3019–26. doi: 10.1128/IAI.00101-10
55. Zhang G, Russell-Lodrigue KE, Andoh M, Zhang Y, Hendrix LR, Samuel JE. Mechanisms of vaccine-induced protective immunity against Coxiella burnetii infection in BALB/c mice. J Immunol (2007) 179(12):8372–80. doi: 10.4049/jimmunol.179.12.8372
56. Sireci G, Badami GD, Di Liberto D, Blanda V, Grippi F, Di Paola L, et al. Recent advances on the innate immune response to coxiella burnetii. Front Cell Infect Microbiol (2021) 11:754455. doi: 10.3389/fcimb.2021.754455
57. Buttrum L, Ledbetter L, Cherla R, Zhang Y, Mitchell WJ, Zhang G. Both major histocompatibility complex class i (mhc-i) and mhc-ii molecules are required, while mhc-i appears to play a critical role in host defense against primary Coxiella burnetii infection. Infect Immun (2018) 86(4):e00602-17. doi: 10.1128/IAI.00602-17
58. Ledbetter L, Cherla R, Chambers C, Zhang Y, Mitchell WJ, Zhang G. Major histocompatibility complex class ii-restricted, CD4(+) t cell-dependent and -independent mechanisms are required for vaccine-induced protective immunity against Coxiella burnetii. Infect Immun (2020) 88(3):e00824-19. doi: 10.1128/IAI.00824-19
59. Schoffelen T, Limonard GJ, Bleeker-Rovers CP, Bouwman JJ, van der Meer JW, Nabuurs-Franssen M, et al. Diagnosis of Coxiella burnetii infection: comparison of a whole blood interferon-gamma production assay and a Coxiella ELISPOT. PloS One (2014) 9(8):e103749. doi: 10.1371/journal.pone.0103749
60. Schneider T, Jahn HU, Liesenfeld O, Steinhoff D, Riecken EO, Zeitz M, et al. The number and proportion of Vgamma9 Vdelta2 T cells rise significantly in the peripheral blood of patients after the onset of acute Coxiella burnetii infection. Clin Infect Dis (1997) 24(2):261–4. doi: 10.1093/clinids/24.2.261
61. Gay L, Mezouar S, Cano C, Foucher E, Gabriac M, Fullana M, et al. BTN3A targeting vgamma9Vdelta2 T cells antimicrobial activity against coxiella burnetii-infected cells. Front Immunol (2022) 13:915244. doi: 10.3389/fimmu.2022.915244
62. Comeau K, Paradis P, Schiffrin EL. Human and murine memory gammadelta T cells: Evidence for acquired immune memory in bacterial and viral infections and autoimmunity. Cell Immunol (2020) 357:104217. doi: 10.1016/j.cellimm.2020.104217
63. Netea MG, Dominguez-Andres J, Barreiro LB, Chavakis T, Divangahi M, Fuchs E, et al. Defining trained immunity and its role in health and disease. Nat Rev Immunol (2020) 20(6):375–88. doi: 10.1038/s41577-020-0285-6
64. Murphy DM, Mills KHG, Basdeo SA. The effects of trained innate immunity on T cell responses; clinical implications and knowledge gaps for future research. Front Immunol (2021) 12:706583. doi: 10.3389/fimmu.2021.706583
65. Bekkering S, Dominguez-Andres J, Joosten LAB, Riksen NP, Netea MG. Trained immunity: reprogramming innate immunity in health and disease. Annu Rev Immunol (2021) 39:667–93. doi: 10.1146/annurev-immunol-102119-073855
66. Kaufmann E, Sanz J, Dunn JL, Khan N, Mendonca LE, Pacis A, et al. BCG educates hematopoietic stem cells to generate protective innate immunity against tuberculosis. Cell (2018) 172(1-2):176–90.e19. doi: 10.1016/j.cell.2017.12.031
67. Geckin B, Konstantin Fohse F, Dominguez-Andres J, Netea MG. Trained immunity: implications for vaccination. Curr Opin Immunol (2022) 77:102190. doi: 10.1016/j.coi.2022.102190
68. Korchagina AA, Koroleva E, Tumanov AV. Innate lymphoid cells in response to intracellular pathogens: protection versus immunopathology. Front Cell Infect Microbiol (2021) 11:775554. doi: 10.3389/fcimb.2021.775554
69. Wang X, Peng H, Tian Z. Innate lymphoid cell memory. Cell Mol Immunol (2019) 16(5):423–9. doi: 10.1038/s41423-019-0212-6
70. Verma M, Michalec L, Sripada A, McKay J, Sirohi K, Verma D, et al. The molecular and epigenetic mechanisms of innate lymphoid cell (ILC) memory and its relevance for asthma. J Exp Med (2021) 218(7):e20201354. doi: 10.1084/jem.20201354
71. Tait Wojno ED, Beamer CA. Isolation and identification of innate lymphoid cells (ILCs) for immunotoxicity testing. Methods Mol Biol (2018) 1803:353–70. doi: 10.1007/978-1-4939-8549-4_21
Keywords: Coxiella burnetii, Q fever, mass cytometry, cytokines, immune profiling, human, innate, cellular immunity
Citation: Raju Paul S, Scholzen A, Reeves PM, Shepard R, Hess JM, Dzeng RK, Korek S, Garritsen A, Poznansky MC and Sluder AE (2023) Cytometry profiling of ex vivo recall responses to Coxiella burnetii in previously naturally exposed individuals reveals long-term changes in both adaptive and innate immune cellular compartments. Front. Immunol. 14:1249581. doi: 10.3389/fimmu.2023.1249581
Received: 28 June 2023; Accepted: 26 September 2023;
Published: 11 October 2023.
Edited by:
Sylvie Bertholet, GSK Vaccines, United StatesReviewed by:
Jayaraman Tharmalingam, University of Wisconsin-Madison, United StatesDr Beatrice Omusiro Ondondo, University Hospitals of Leicester NHS Trust, United Kingdom
Copyright © 2023 Raju Paul, Scholzen, Reeves, Shepard, Hess, Dzeng, Korek, Garritsen, Poznansky and Sluder. This is an open-access article distributed under the terms of the Creative Commons Attribution License (CC BY). The use, distribution or reproduction in other forums is permitted, provided the original author(s) and the copyright owner(s) are credited and that the original publication in this journal is cited, in accordance with accepted academic practice. No use, distribution or reproduction is permitted which does not comply with these terms.
*Correspondence: Ann E. Sluder, YXNsdWRlckBtZ2guaGFydmFyZC5lZHU=; Mark C. Poznansky, bXBvem5hbnNreUBtZ2guaGFydmFyZC5lZHU=
†Present address: Anja Scholzen, Byondis B.V., Nijmegen, Netherlands
Robert Shepard, University of Massachusetts Chan Medical School, Worcester, MA, United States
Joshua M. Hess, Program in Computational Biology & Medicine, Cornell University, New York, NY, United States
Skylar Korek, Department of General Surgery, Penn State Hershey Medical Center, Hershey, PA, United States
‡These authors have contributed equally to this work and share first authorship