
94% of researchers rate our articles as excellent or good
Learn more about the work of our research integrity team to safeguard the quality of each article we publish.
Find out more
ORIGINAL RESEARCH article
Front. Immunol., 01 September 2023
Sec. Microbial Immunology
Volume 14 - 2023 | https://doi.org/10.3389/fimmu.2023.1240419
This article is part of the Research TopicThe Covid-19 and TB Syndemic: Differences and SimilaritiesView all 11 articles
 Paul J. Baker1
 Eduardo P. Amaral1
 Ehydel Castro1Andrea C. Bohrer1Flor Torres-Juárez1Cassandra M. Jordan1Christine E. Nelson2
 Daniel L. Barber2
 Reed F. Johnson3
 Kerry L. Hilligan4†
 Katrin D. Mayer-Barber1*
Viral co-infections have been implicated in worsening tuberculosis (TB) and during the COVID-19 pandemic, the global rate of TB-related deaths has increased for the first time in over a decade. We and others have previously shown that a resolved prior or concurrent influenza A virus infection in Mycobacterium tuberculosis (Mtb)-infected mice resulted in increased pulmonary bacterial burden, partly through type I interferon (IFN-I)-dependent mechanisms. Here we investigated whether SARS-CoV-2 (SCV2) co-infection could also negatively affect bacterial control of Mtb. Importantly, we found that K18-hACE2 transgenic mice infected with SCV2 one month before, or months after aerosol Mtb exposure did not display exacerbated Mtb infection-associated pathology, weight loss, nor did they have increased pulmonary bacterial loads. However, pre-existing Mtb infection at the time of exposure to the ancestral SCV2 strain in infected K18-hACE2 transgenic mice or the beta variant (B.1.351) in WT C57Bl/6 mice significantly limited early SCV2 replication in the lung. Mtb-driven protection against SCV2 increased with higher bacterial doses and did not require IFN-I, TLR2 or TLR9 signaling. These data suggest that SCV2 co-infection does not exacerbate Mtb infection in mice, but rather the inflammatory response generated by Mtb infection in the lungs at the time of SCV2 exposure restricts viral replication.
Pulmonary viral infections have been shown to both increase the likelihood and exacerbate the severity of secondary bacterial infections in the lung (1–7). The underlying immunological mechanisms are diverse and range from lung epithelial barrier breakdown and augmented adhesion of pathogens to the subversion of both adaptive and innate immunity from protective anti-bacterial pathways towards detrimental anti-viral inflammatory pathways like type-I interferon (IFN-I) (5, 8). Viral co-infections also play a role in the exacerbation of Mycobacterium tuberculosis (Mtb) infection (9), one of the leading causes of infectious disease-related mortality worldwide (10). For example, co-infection with cytomegalovirus (CMV) has been associated with an enhanced risk of tuberculosis (TB) disease (11–13). Furthermore, there are marked associations between influenza A virus (IAV) co-infection at the time of TB diagnosis and elevated Mtb burden (14), as well as increased risk of mortality in TB patients co-infected with both Mtb and IAV (15). Mtb-infected mice that were either simultaneously or subsequently infected with murine pneumonia virus (PVM) or IAV have been shown to have exacerbated lung tissue pathology (16). Our previous work demonstrated that simultaneous or prior IAV co-infection elevates pulmonary Mtb bacterial burden and reduces host survival after Mtb infection (17, 18). When IAV infection coincided with initial priming of Mtb-specific T cell responses, loss of bacterial control was dependent on elevated IFN-I and interleukin-10 (IL-10) signaling ultimately resulting in a reduced Mtb-specific CD4+ T cell response (17, 18).
Since the beginning of the COVID-19 pandemic, caused by SARS-CoV-2 (SCV2), TB diagnosis and case reporting reduced globally by 18% despite no change in the actual incidence of TB infection (10, 19). Importantly, a 7.5% increase in global TB deaths was observed, marking the first year-on-year increase in the global TB death toll since 2005 (10). A clear understanding of whether co-infection with SCV2 and Mtb has immunological consequences on the outcome of TB or COVID-19 is confounded by non-biological factors of the COVID-19 pandemic, including reduced BCG vaccination rates, disrupted TB outreach services and amplified global poverty (20). In addition, there have been reduced rates of early TB diagnosis during the COVID-19 pandemic attributed to reduced availability of staff and equipment for clinics and diagnostic labs (20–23) and reduced patient presentation due to fear of COVID-19 infection or increased social stigma around respiratory symptoms (24). TB treatment regimens, which already faced significant challenges before the pandemic because of the intensive and prolonged course of antibiotics required, have also been negatively impacted in TB-endemic countries during the pandemic (23, 25–27). Alongside negative TB outcomes, clinical reports have shown that Mtb and SCV2 co-infection results in a greater likelihood of severe COVID-19 disease (by an odds ratio of 2.21), COVID-19-related death (by an odds ratio of 2.77) (28) and overall elevated risk of negative clinical outcomes in co-infected individuals (29). Mechanistic studies into the possibility of immunological interactions critically influencing the outcome of Mtb and SCV2 co-infections are needed to develop effective strategies to reduce the mortality rate of both diseases (30, 31).
To directly ask whether co-infection with Mtb and SCV2 has a biological impact on the outcome of either TB or COVID-19, we sequentially infected mice with SCV2 followed by Mtb or co-infected Mtb-infected mice with SCV2. We show here that regardless of the order of infection co-infection with SCV2, unlike co-infection with IAV, does not alter the outcome of Mtb infection in mice. Moreover, we show that early pulmonary SCV2 replication is suppressed in chronically Mtb-infected mice through a mechanism that is dependent on mycobacterial dose but does not require signaling through type-I interferon (IFN-I) or toll-like receptor 2 (TLR2) or TLR9.
We have previously shown that in mice, prior IAV infection leads to elevated pulmonary bacterial burden 16 weeks following subsequent Mtb infection (17). To determine whether prior infection with SCV2 similarly impacts the outcome of Mtb infection we used human Angiotensin Converting Enzyme 2 transgenic (K18-hACE2 Tg) mice, which are susceptible to infection with the ancestral strain of SCV2. K18-hACE2 Tg mice were infected with a sub-lethal dose of the hCoV-19/USA-WA1/2020 (USA-WA1/2020) isolate of SCV2 and 28 days later infected with Mtb (Figure 1A). Mtb disease was allowed to develop, and lungs and spleens were collected at 4 weeks (Figures 1B–D) or 20 weeks (Figures 1E–G) post Mtb infection. SCV2 infection resulted in transient weight loss 5 – 8 days post infection (Figure 1A). Lung pathology or bacterial distribution was determined by hematoxylin and eosin (H&E), and acid fast (AF) staining of lung sections 4 weeks post-Mtb infection, however no difference was detected when comparing mice previously infected with SCV2 to those animals that received Mtb alone (Figure 1B). Importantly, pulmonary (Figure 1C) or splenic (Figure 1D) bacterial loads were unchanged in mice previously infected with SCV2 compared to Mtb-only mice. To test whether prior SCV2 infection may affect the control of Mtb at a later timepoint, we assessed lung pathology and bacterial burden at 20 weeks post-Mtb infection. Again, H&E and AF staining did not reveal changes in lung pathology or bacterial localization between mice with prior SCV2 infection compared to mice that were only Mtb infected (Figure 1E). Similarly, previous SCV2 infection did not alter pulmonary (Figure 1F) or splenic (Figure 1G) bacterial loads at this later 20-week timepoint. Taken together, and in contrast to findings with prior IAV infection (17), our data here suggest that prior infection with SCV2 does not lead to increased Mtb-driven disease or impairment of Mtb bacterial replication in mice.
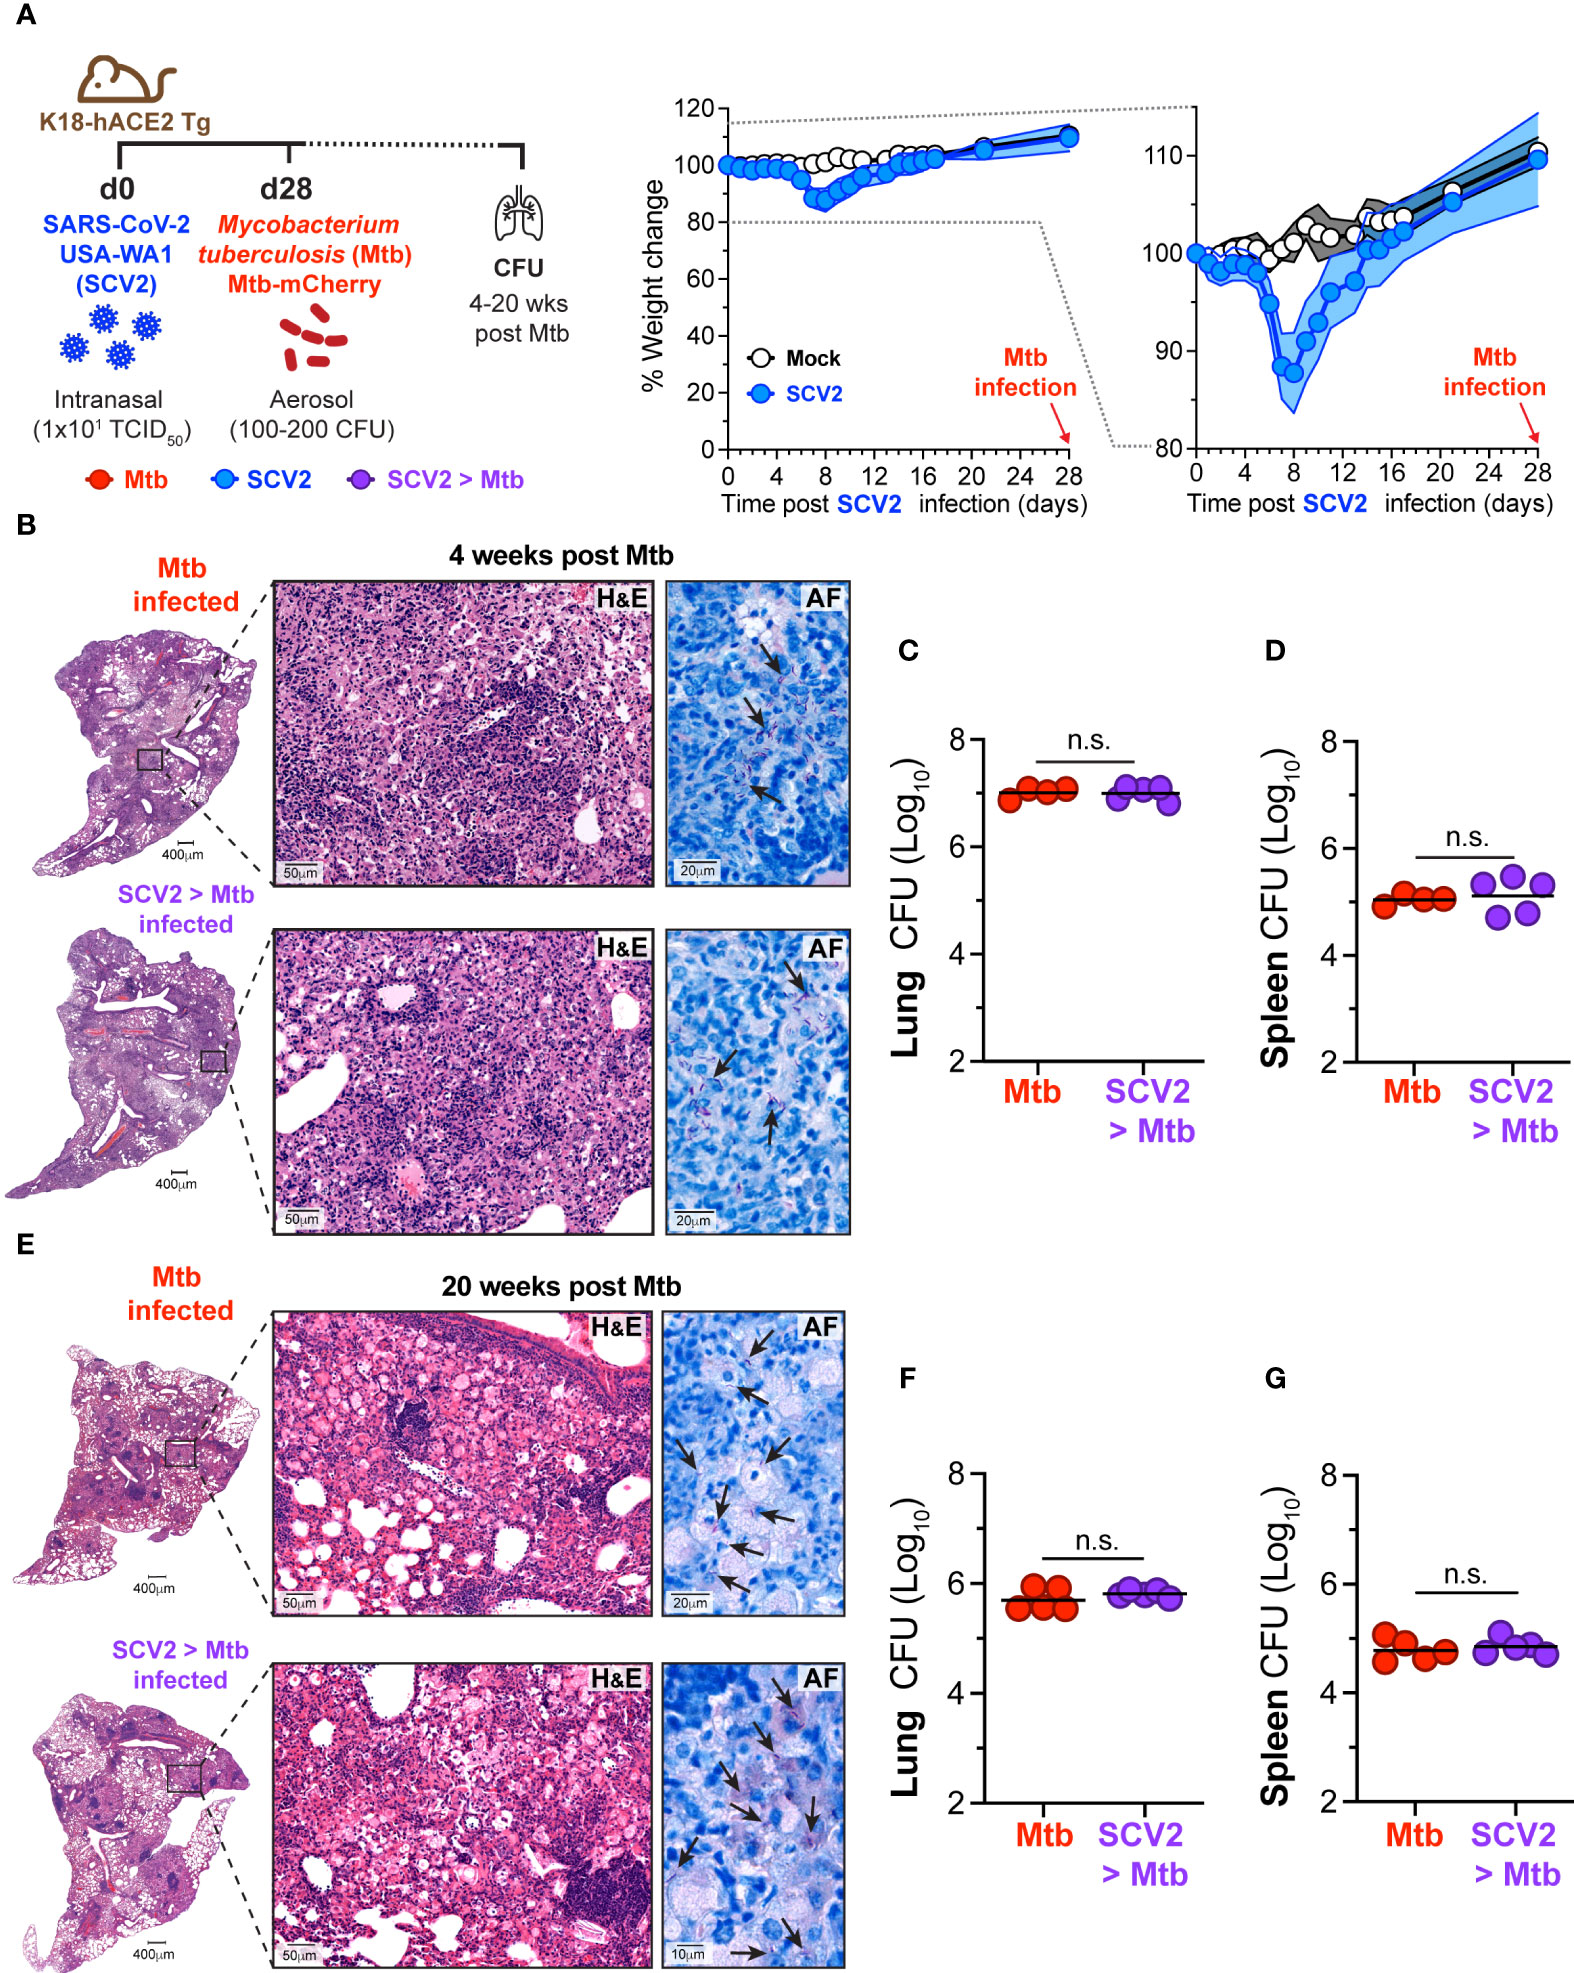
Figure 1 SCV2 infection one month before Mtb infection does not exacerbate Mtb disease. (A) Left: Schematic of experimental set-up where K18-hACE2 Tg mice were infected intranasally with 10 TCID50 SCV2 (USA-WA1/2020) or mock supernatant 28 days before aerosol infection with 100 – 200 CFU Mtb and mice were euthanized either 4 or 20 weeks after Mtb infection. Middle: Weight loss of K18-hACE2 Tg mice after SCV2 infection and before Mtb infection Right: Selected range of weight change curve to highlight differences in weight loss between SCV2 and Mock infected groups (n= 4-5 per group from one experiment representative of two independent experiments, mean ± SD as traveling error bars). (B) Representative hematoxylin and eosin (H&E) and acid-fast AF staining of lung tissue from mice at 4 weeks post Mtb infection, with or without prior SCV2 infection (arrows indicate examples of Mtb bacteria, scale bars indicate magnification). (C, D) Mtb CFU in (C) lungs and (D) spleens of mice at 4 weeks post Mtb infection. (E) Representative H&E and AF staining of lung tissue 20 weeks post Mtb infection with and without prior SCV2 infection (arrows indicate examples of Mtb bacteria, scale bars indicate magnification). (F, G) Mtb CFU in (F) lungs and (G) spleens of mice at 20 weeks post Mtb infection (n= 4-5 per group from one independent experiment per timepoint, geometric mean, two-tailed Mann Whitney test). n.s. = not significant.
We and others have reported that concurrent or sequential infection with IAV and Mtb resulted in loss of bacterial control (17, 18). To ask whether SCV2 co-infection could equally compromise Mtb replication, K18-hACE2 Tg mice were first infected with Mtb. At a later stage of infection (day 170 post-Mtb) Mtb-infected mice and age-matched controls were then infected with a sub-lethal dose of USA-WA1/2020 SCV2 and monitored for 28 days after which bacterial burdens and lung pathology were assessed (Figure 2A). Importantly, SCV2 co-infection did not impact the bacterial burden of Mtb in bronchoalveolar lavage (BAL), lungs, or spleens (Figure 2B). Additionally, no differences were seen in lung pathology or bacterial localization as determined by H&E and AF staining (Figure 2C) or scoring of affected lung areas (Figure 2D).
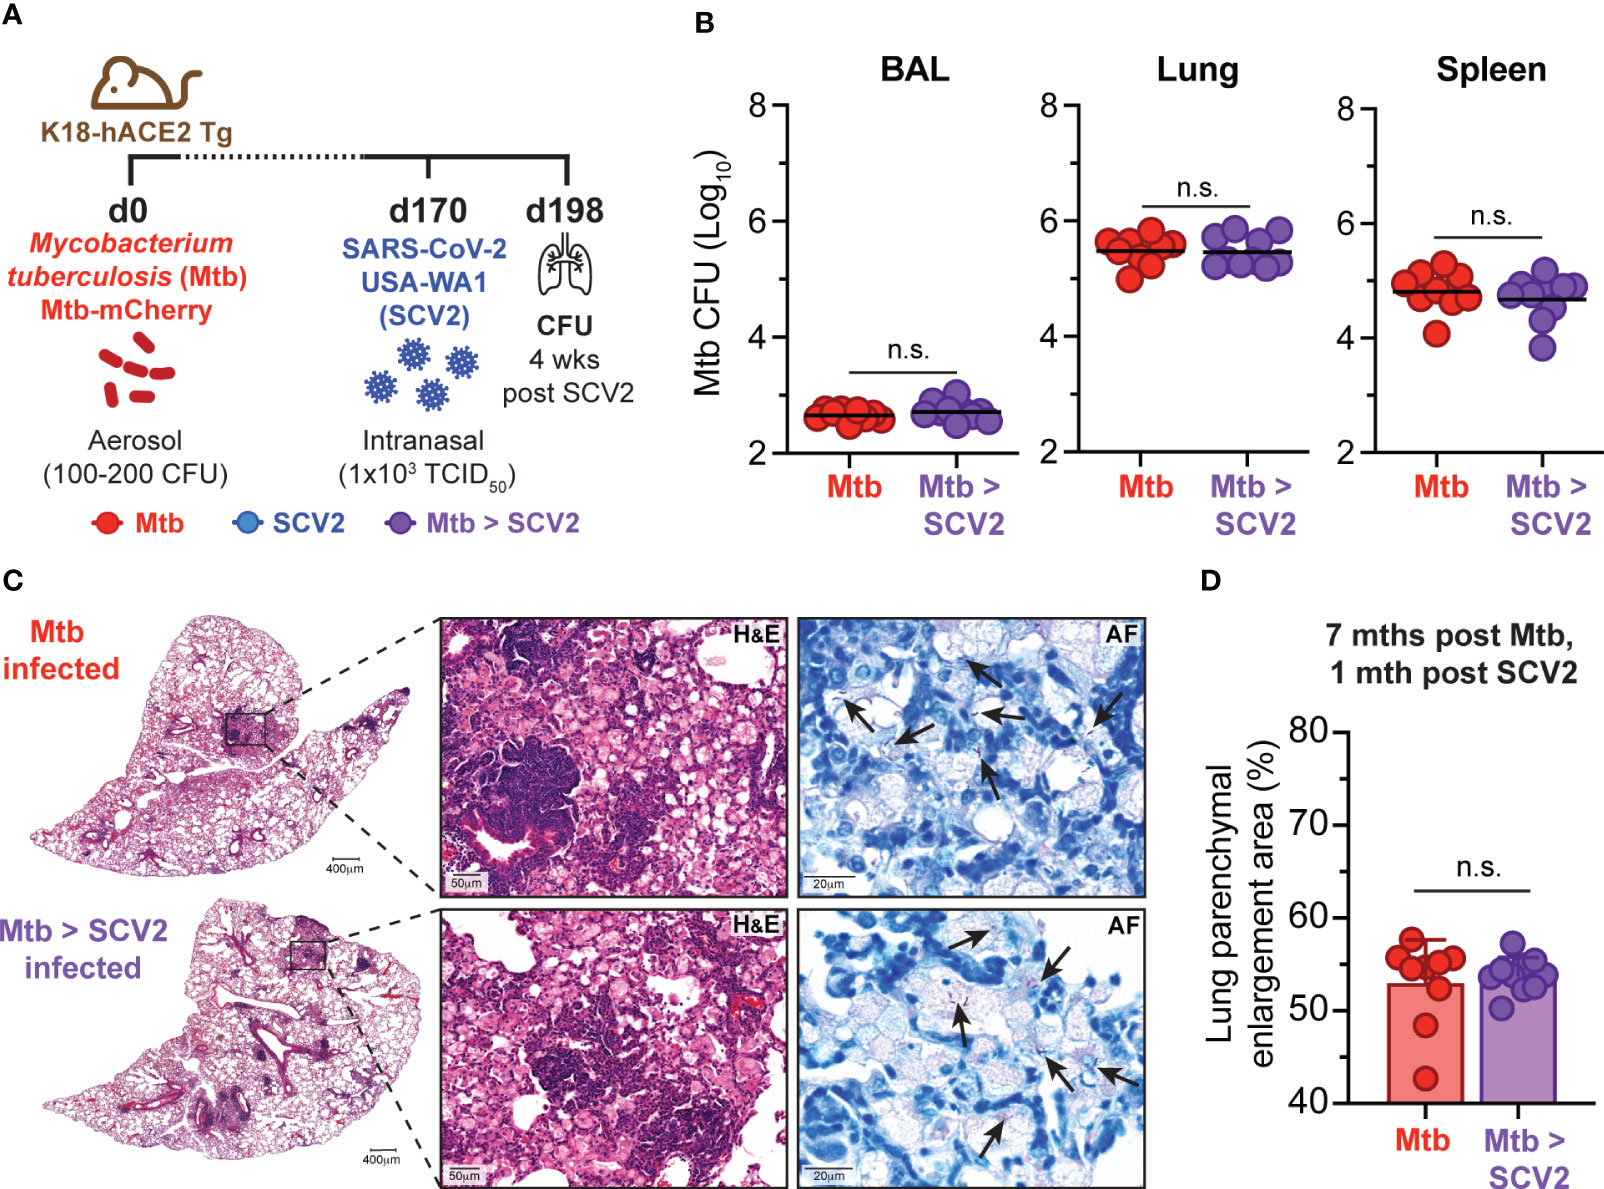
Figure 2 SCV2 co-infection does not exacerbate Mtb disease. (A) Schematic of experimental set-up where K18-hACE2 Tg mice were aerosol infected with 100 – 200 CFU Mtb (H37Rv-mCherry) 170 days before being intranasally infected with 1x10³ TCID50 SCV2 (USA-WA1/2020) or mock supernatant, mice were euthanized 1 month after SCV2 infection. (B) Mtb CFU in BALs, lungs and spleens (n= 9-10 per group, data combined from two independent experiments, geometric mean). (C) Representative H&E and AF staining of lung tissue from mice as described in (A) (arrows indicate examples of Mtb bacteria, scale bars indicate magnification) (D) Quantification of percentage of parenchymal enlargement from H&E shown in C) (n= 9-10 per group from two independent experiments, mean ± S.D., two-tailed Mann Whitney test). n.s. = not significant.
Next, we asked whether co-infection with SCV2 at 16 weeks post Mtb infection could negatively impact the existing Mtb-specific CD4+ or CD8+ T cell responses. When we quantified Mtb (ESAT64-17)-specific CD4+ T cells via MHC-II tetramer straining one month following co-infection with SCV2, the frequency of antigen-specific CD4+ T cells was unchanged between mice infected solely with Mtb or those co-infected with SCV2 (Figure 3A). There were also no differences in the proportion of lung parenchyma-residing ESAT64-17-specific CD4+ T cells, as assessed by lack of intravenous CD45 staining (i.v.neg) (32), nor in the expression of Ki-67 or levels of the transcription factor T-bet on those cells (Figure 3B). Likewise, when we examined Mtb-specific CD8+ T cell responses the overall abundance (Figure 3C) and proportion of parenchymal or KLRG1-expressing cells within Mtb TB10.44-11 and Mtb 32c93-102 MHC-I tetramer positive CD8+ T cells were similar between co-infected lungs and lung from mice infected with only Mtb (Figure 3D). Together these data suggest that the pre-existing pulmonary Mtb-specific CD4+ and CD8+ T cell responses are not negatively impacted over the course of 4 weeks following SCV2 co-infection.
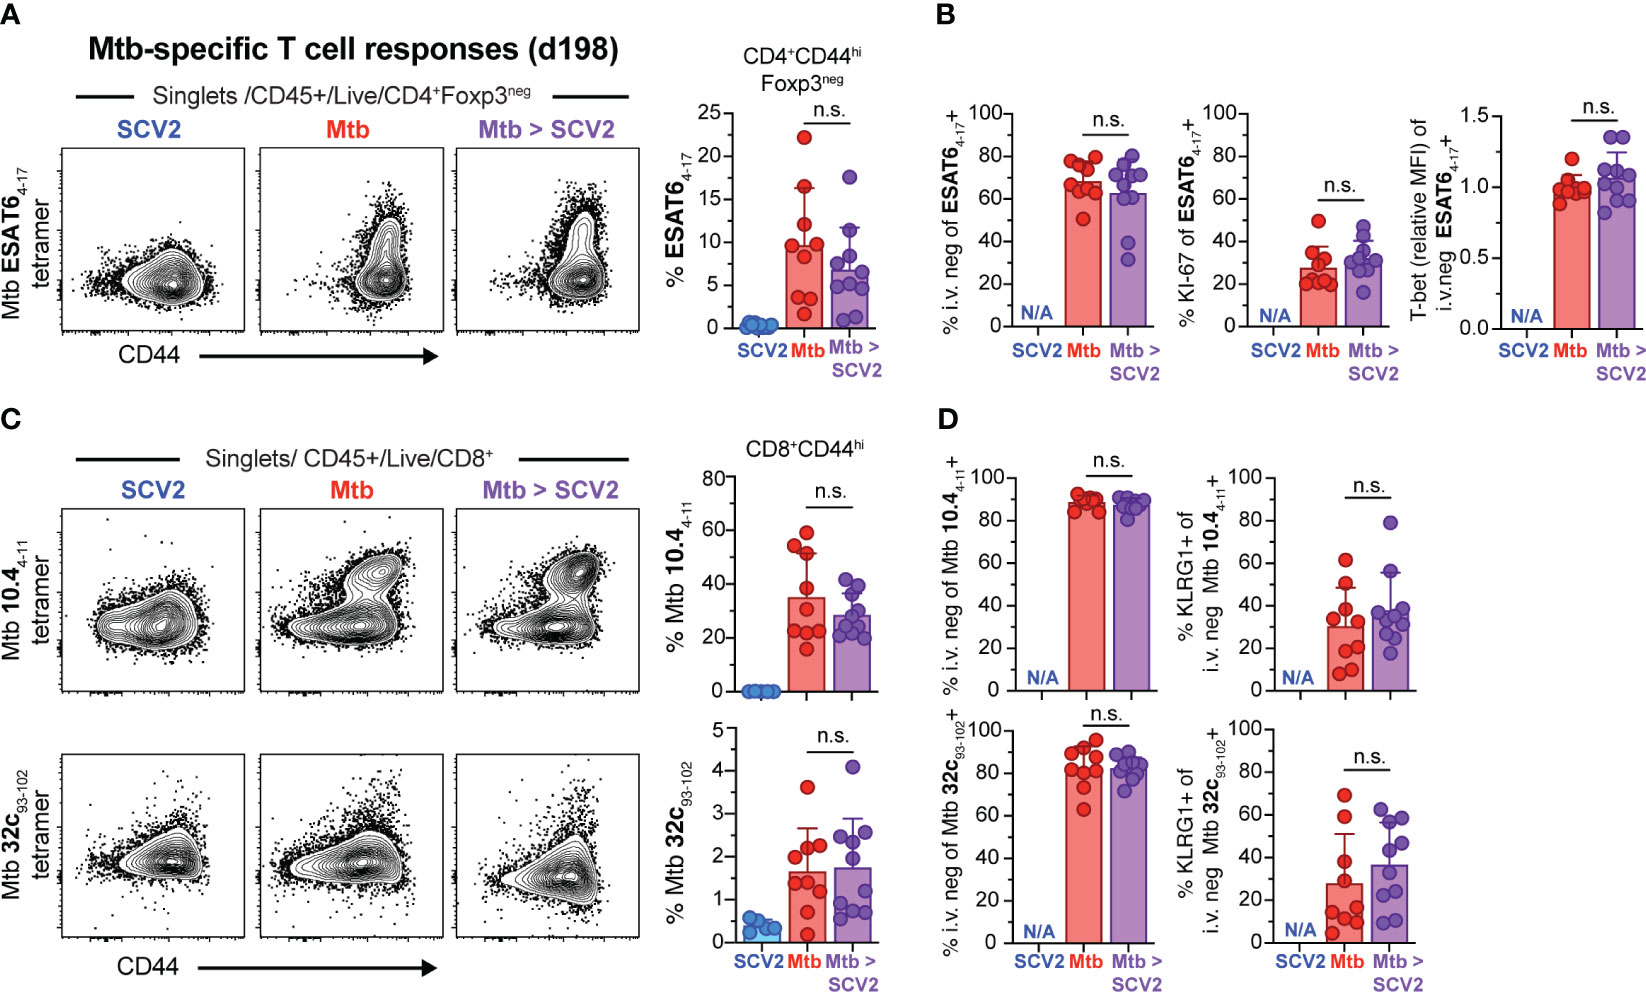
Figure 3 SCV2 co-infection does not negatively affect Mtb-specific CD4+ or CD8+ T cells. Example FACS plots and summary data from the lungs of mice described in Figure 2A. (A) Example FACS plots of ESAT64-17 MHC-II tetramer staining of CD4+ Foxp3- cells and proportion of ESAT64-17-specific cells within activated CD44hiCD4+Foxp3- T cells (B) Quantification of ESAT64-17 tetramer-positive cells that are recruited into the lung parenchyma (CD45 i.v.neg), positive for Ki-67 and relative expression intensity (geometric mean fluorescent intensity, MFI) of T-bet in lung resident ESAT64-17 tetramer-positive CD4+ T cells. (C) Example FACS plots of Mtb TB10.44-11 (top) and Mtb 32c93-102 (bottom) MHC-I tetramer staining of CD8+ T cells and proportion of Mtb TB10.44-11 or Mtb 32c93-102 -specific CD8+ T cells gated on activated CD44hiCD8+ T cells (D) Quantification of Mtb TB10.44-11 (top) and Mtb 32c93-102 (bottom) tetramer-positive cells recruited into the lung parenchyma (CD45 i.v.neg) and their expression of KLRG1 (N/A= not applicable, n= 9-10 per group, data combined from 2 independent experiments, mean ± S.D., two-tailed Mann Whitney test). n.s. = not significant.
We next measured SCV2 antigen-specific T cell responses 4 weeks after SCV2 infection in mice with and without an underlying Mtb infection using SCV2-specific tetramers (33). To measure SCV2 specific CD4+ T cells we utilized an ORF3A266-280 MHC-II I-Ab tetramer and 4 weeks after sub-lethal infection detected approximately 1-2% of effector CD4 T cells that stained positive for the reagent (blue symbols) by flow cytometry, compared to less than 1% in Mtb co-infected mice (purple symbols) and 0.5% non-specific staining background in SCV2 unexposed animals (red symbols) (Figure 4A). Thus the overall frequency of ORF3266-280 specific CD4+ T cells was significantly reduced in the lungs of co-infected mice compared to their SCV2-only counterparts. Conversely, proportionately more ORF3266-280 specific cells were residing in the lung parenchyma (i.v.neg) and expressed a small but significant increase in T-bet expression (Figure 4B). Importantly, both the SCV2 S539-546-specific and SCV2 N219-227-specific CD8+ T cell responses were significantly reduced in mice with an underlying Mtb infection compared to SCV2 alone (Figure 4C). Furthermore, while the overall proportion of i.v.neg, KLRG1-expressing S539-546-specific CD8+ T cells was the same regardless of Mtb infection status, the frequency of tissue-resident memory (TRM, CD69+) T cells, was significantly reduced within that fraction in co-infected lungs (Figure 4D). Thus, ongoing Mtb infection resulted in a significant reduction in the magnitude of the pulmonary SCV2 S539-546 specific TRM response.
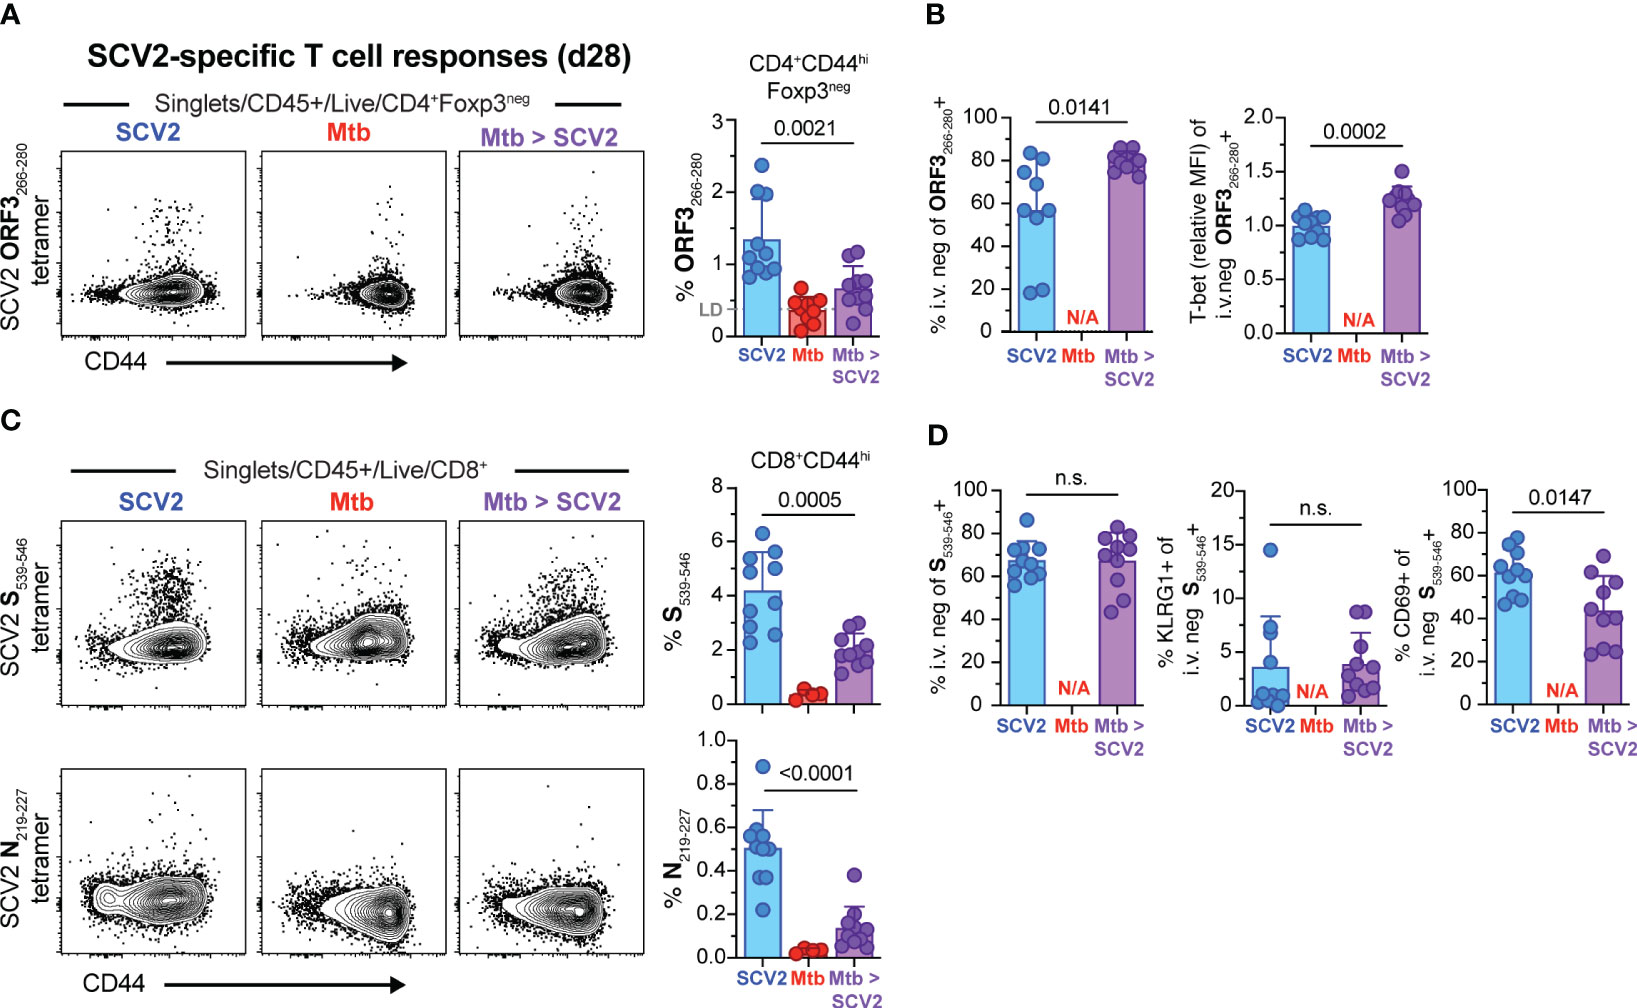
Figure 4 SCV2 co-infection of Mtb infected mice results in decreased SCV2-specific CD4+ and CD8+ T cells in the lungs 4 weeks later. Example FACS plots and summary data from the lungs of mice described in Figure 2A. (A) Example FACS plots of SCV2 ORF3266-280 MHC-II tetramer staining of CD4+ Foxp3- cells and proportion of ORF3266-28-specific cells within activated CD44hiCD4+Foxp3- T cells 4 weeks after SCV2 infection of naïve (blue) or 7-month Mtb-infected mice (purple). LD = Limit of Detection is indicated based on non-specific tetramer binding in Mtb only infected groups (red) (B) Quantification of ORF3266-280 tetramer-positive cells residing in lung parenchyma (CD45 i.v.neg) and relative expression intensity (geometric mean fluorescent intensity, MFI) of T-bet in lung resident ORF3266-280 tetramer-positive CD4+ T cells. (C) Example FACS plots of SCV2 S539-546 (top) and SCV2 N219-227 (bottom) MHC-I tetramer staining of CD8+ T cells and proportion of S539-546- or N219-227- specific CD8+ T cells gated on activated CD44hiCD8+ T cells (D) Quantification of SCV2 S539-546 tetramer-positive cells recruited into the lung parenchyma (CD45 i.v.neg) and their expression of KLRG1 and CD69. (N/A= not applicable, n= 9-10 per group, data combined from 2 independent experiments, mean ± S.D., two-tailed Mann Whitney test). n.s. = not significant.
Considering that antigen burden can directly impact T cell expansion and memory development (34), we asked whether the decrease in SCV2-specific CD8+ TRM frequency 4 weeks after SCV2 infection in Mtb-infected mice was caused by a change in the initial SCV2 viral burden. We suspected that viral loads were reduced in co-infected mice as susceptible K18-hACE2 Tg mice lost 10% of their pre-SCV2 infection body weight 5 – 8 days after SCV2 infection but did not lose any weight if they were also infected with Mtb (Figure 5A). To determine whether SCV2 viral titers were reduced in the lungs of co-infected mice, we infected K18-hACE2 Tg mice with USA-WA1/2020 either with or without underlying Mtb infection and collected lungs at 3 days post SCV2 infection, which is early enough to determine viral loads. Indeed, ongoing Mtb infection reduced SCV2 lung viral titers by 1-2 logs at 3 days post-infection as measured by both TCID50 assay on Vero E6 cells (Figure 5B) and quantitative PCR (qPCR) to measure the number of copies of the SCV2 E gene in both its actively replicating (sub-genomic, sgRNA) and typical (genomic, gRNA) conformations (35) (Figure 5C). Recognizing that the K18-hACE2 model has changes in viral tropism due to the artificial nature of the hACE2 transgene expression (36), we utilized a SCV2 variant of concern (VOC, beta variant, B.1.351), which carries an asparagine to tyrosine substitution at amino acid 501 of the spike protein, allowing binding to murine ACE2 and establishment of transient SCV2 infection in wild type (WT) C57Bl/6 mice (37, 38). Strikingly, we observed a significant reduction in B.1.351 SCV2 viral titers in the lungs of Mtb-infected C57Bl/6 mice as early as 1 day post SCV2 infection, and the magnitude of viral restriction correlated with increasing Mtb-infectious dose, with no replicating virus detectable in the lungs of mice that previously received a high dose of Mtb (1000 - 2000 CFU) (Figures 5D, E). Taken together, these results suggest that an underlying pulmonary Mtb infection restricts early viral replication, leading to a reduction in overall viral antigens and a decrease in the magnitude of the T cell and TRM response.
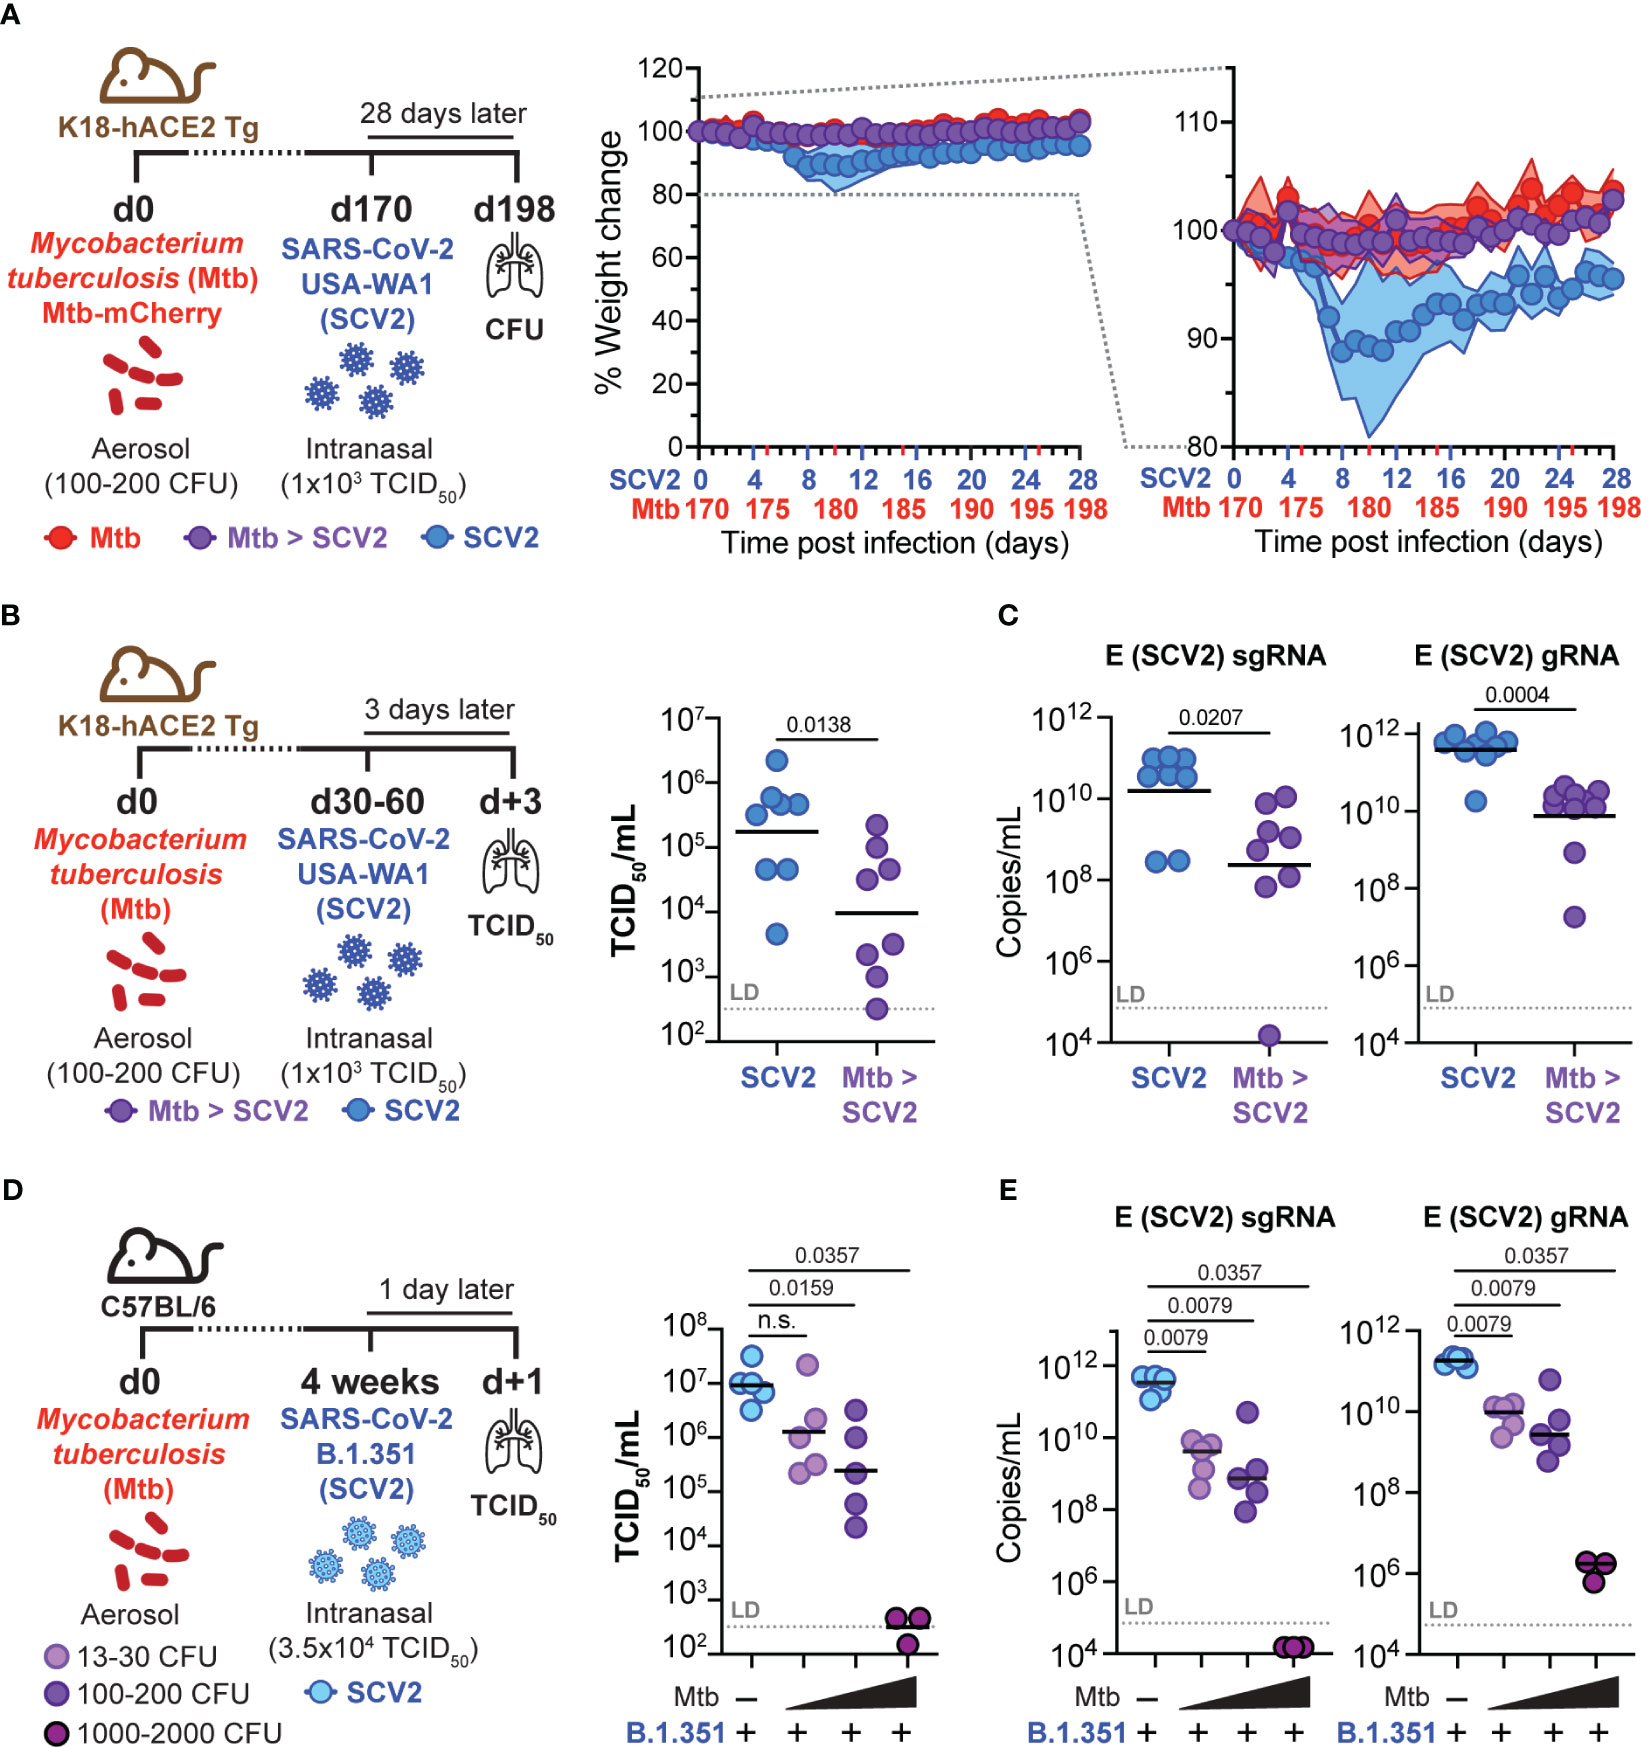
Figure 5 Pre-existing Mtb infection lowers early SCV2 viral burden in an Mtb dose-dependent manner. (A) Left: Schematic of experimental set-up where K18-hACE2 Tg mice were infected with Mtb 170 days before being intranasally infected with 1x10³ TCID50 SCV2 (USA-WA1/2020) or mock supernatant, mice were euthanized 28 days after SCV2 infection. Middle: Weight loss of SCV2 infected K18-hACE2 Tg mice with (purple) or without (blue) underlying Mtb infection Right: Selected range of weight change curve to highlight differences in weight loss between SCV2 only and co-infected groups (n= 9-10 per group pooled from 2 independent experiments, mean ± SD as traveling error bars). (B) Left: Schematic of experimental set-up where K18-hACE2 Tg mice were infected with Mtb by aerosol exposure 1-2 months before infection with 1x10³ TCID50 SCV2 (USA-WA1/2020), mice were euthanized 3 days after SCV2 infection. Right: SCV2 viral load in lungs as measured by TCID50 and (C) qPCR for the sub-genomic (sg) or genomic (g) SCV2 E gene (n= 8 per group, data combined from two independent experiments, geometric mean, two-tailed Mann Whitney test, LD= limit of detection). (D) Left: Schematic of experimental set-up where C57Bl/6 WT mice were infected with various doses of Mtb (H37Rv-mCherry) by aerosol exposure 4 weeks before being intranasally infected with 3.5x10⁴ TCID50 SCV2 (B.1.351), mice were euthanized 1 day later. Right: Viral loads in lung as measured by TCID50 on Vero E6 cells and (E) qPCR for the SCV2 E gene sgRNA and gRNA (right) (n= 3 – 5 per group from one experiment representative of two independent experiments, geometric mean, statistical significance calculated by two-tailed Mann Whitney test, LD= limit of detection). n.s. = not significant.
Because our findings showed restriction of viral replication as early as one day after SCV2 infection in a Mtb dose-dependent manner, we speculated that Mtb-driven innate inflammation, alongside induction of antiviral interferons, may mediate the observed protective effects. Mtb carries several pathogen-associated molecular patterns (PAMPs) that activate pattern recognition receptors (PRRs), including TLR2 and TLR9 (39). TLR activation leads to production of several inflammatory cytokines, including IFN-I. Due to the potent antiviral nature of IFN-I (8), we next examined whether Mtb sensing via TLR2 or TLR9 or a Mtb-driven IFN-I response were required for SCV2 restriction in Mtb-infected mouse lungs. We infected mice deficient in the IFNα receptor 1 (IFNAR1, Ifnar1-/-), TLR2 (Tlr2-/-), or TLR9 (Tlr9-/-) with Mtb and 1-2 months later with B.1.351 SCV2 (Figure 6A). Of note, without underlying Mtb infection (blue symbols), Ifnar1-/- mice displayed a 1.0 – 1.5 log significant increase in viral titers at three days after B.1.351 SCV2 infection compared to WT mice as measured by both TCID50 (Figure 6A) and qPCR (Figure 6B). SCV2-infected Tlr2-/- mice had a significant increase in viral titers when measured by TCID50 (Figure 6A) but not when assessed by qPCR (Figure 6B). Tlr9-/- mice showed no differences in lung viral titers (Figures 6A, B). Importantly and irrespective of these baseline increases in viral titers, we consistently observed a 1.5 – 2.0 log reduction in SCV2 viral loads in lungs of mice with an underlying Mtb infection, regardless of their expression of TLR2, TLR9, or IFNAR1 (Figures 6A, B). These results indicate that Mtb-induced restriction of SCV2 is not dependent solely on TLR2, TLR9 or IFN-I signaling and likely is a consequence of multiple innate inflammatory immune alterations during Mtb infection compared to the lungs of immunologically naïve mice.
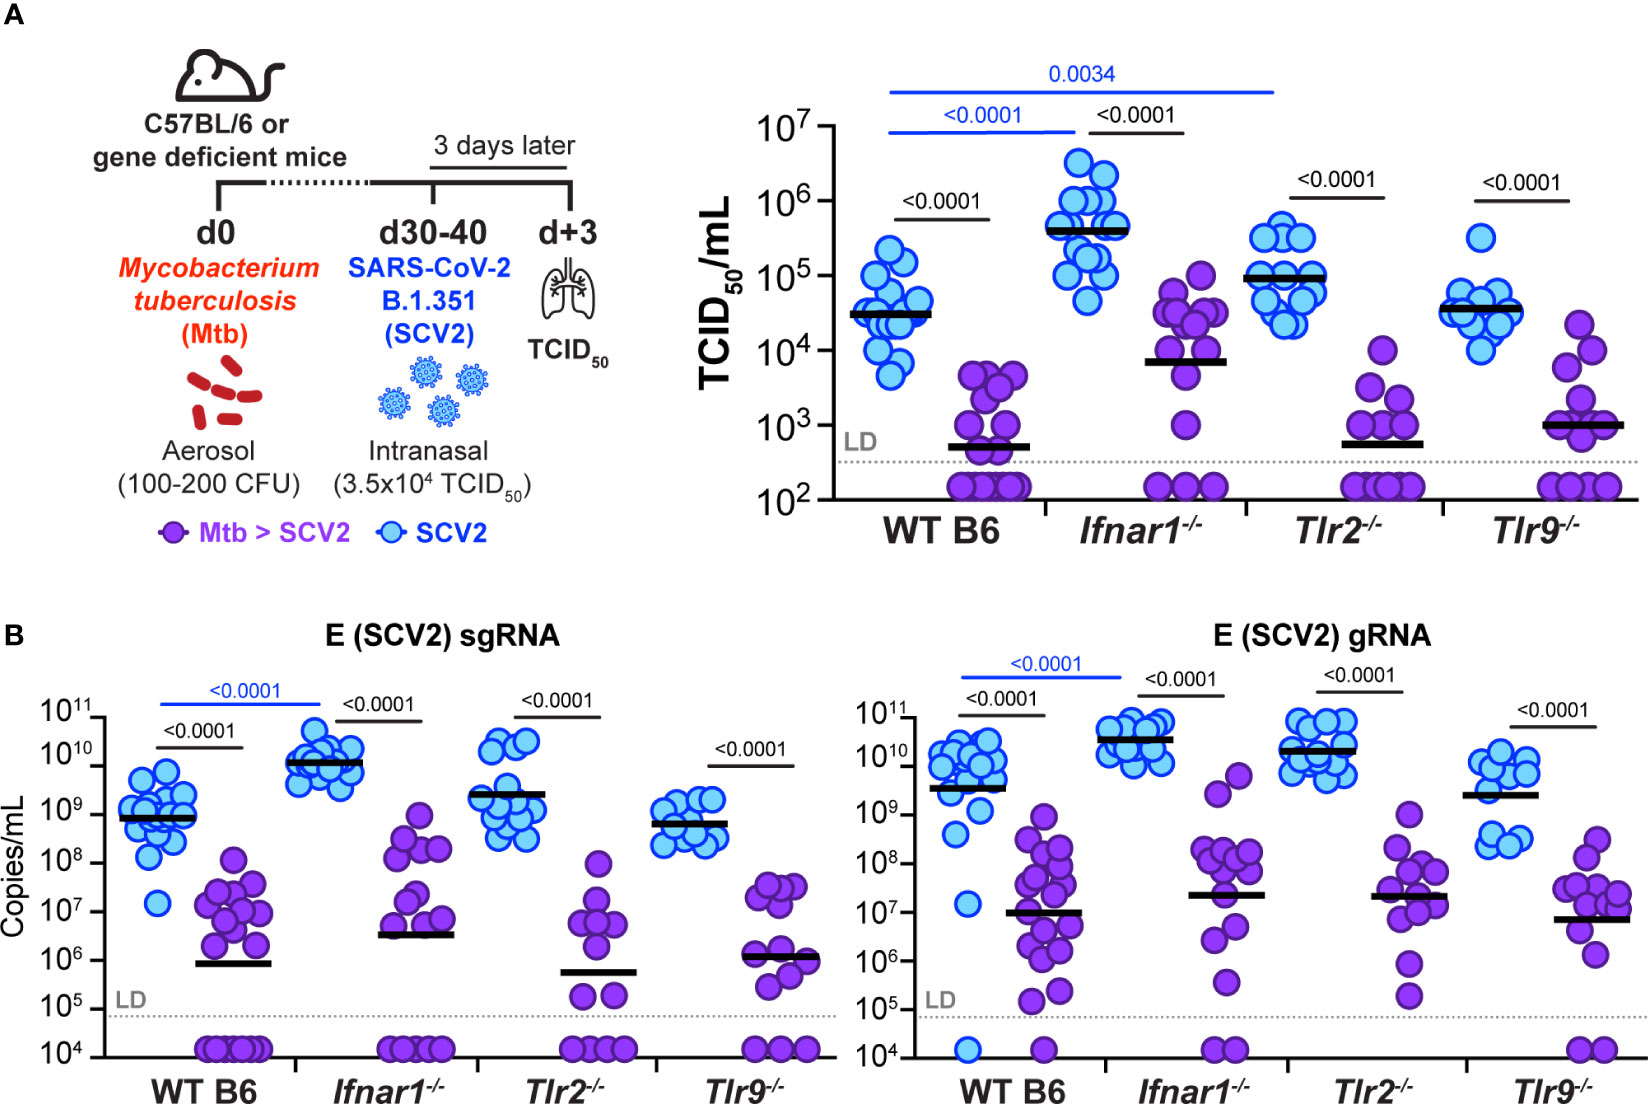
Figure 6 Underlying Mtb infection reduces SCV2 viral burden independent of IFNAR1, TLR2, or TLR9. (A) Left: Schematic of experimental set-up where C57Bl/6 WT, Ifnar1-/-, Tlr2-/- or Tlr9-/- mice were infected with Mtb 30-40 days prior to being intranasally infected with 3.5x10⁴ TCID50 SCV2 (B.1.351), mice were euthanized 3 days after SCV2 infection. Right: SCV2 viral load in lungs as measured by TCID50 on Vero E6 cells. (B) SCV2 viral loads in lungs as measured by qPCR for the SCV2 E sgRNA (left) or gRNA (right) (n= 11-19 per group, data combined from four independent experiments, geometric mean, two-tailed Mann Whitney test (only significant p values shown), LD= limit of detection; significant differences are indicated by blue comparisons between SCV2 only groups (blue), significant differences are indicated by black comparisons between SCV2 (blue) and coinfected groups (purple).
To investigate the immunological consequences of Mtb and SCV2 interactions we have utilized various murine co-infection models. We have shown that Mtb-infected mice that have recovered from a prior SCV2 infection showed no significant changes in Mtb bacterial burden or lung pathology. In addition, SCV2 co-infection of chronically Mtb-infected mice did not negatively impact bacterial control, lung pathology, or existing Mtb-specific T-cell responses. Importantly, using these models we have also demonstrated that early SCV2 replication is dampened in the lungs of Mtb-infected K18-hACE2 Tg and C57Bl/6 mice compared to mice without an underlying Mtb infection. This protective effect was Mtb dose-dependent, prevented SCV2-induced weight loss, and was associated with lower SCV2-specific memory T cell responses compared to mice infected only with SCV2. Our observations agree with previous data published by Rosas-Mejia and colleagues who first showed that concurrent co-infection with Mtb and SCV2 in both K18-hACE2 Tg and WT C57Bl/6 mice reduced SCV2 viral titers but did not affect Mtb bacterial loads (31). The Rosas-Meija study also showed that co-infection of mice with Mtb and SCV2 altered cytokine production and the abundance of immune cell subsets as determined by single cell RNA sequencing (scRNASeq) at 4 – 7 days post SCV2 infection compared to mice infected with either pathogen individually (31). Compared to lungs from SCV2 only mice, co-infected lungs had elevated IFNγ protein, increased Tumor Necrosis Factor (Tnf) transcript, reduced IFN-induced protein with tetratricopeptide repeats 2 (Ifit2) and Ifit3 transcripts, and scRNASeq indicated an increased proportion of B cells and a reduced frequency of CD8+ T cells. Our data adds that these perturbations do not affect the Mtb-specific T cell response, and instead may contribute to the reduction in SCV2-specific T cell responses that we have observed at one month post SCV2 co-infection. In addition, Hildebrand et al. reported a significant decrease in SCV2 viral titers at four days post SCV2 infection of Mtb-infected mice (30), but interestingly, they saw a significant increase in splenic Mtb loads while pulmonary Mtb burdens were not significantly changed (16). The discrepancy in bacterial replication seen by Hildebrand et al. may be due to their use of the Erdmann strain of Mtb compared to the H37Rv laboratory strain used both herein and in the Rosas Mejia study, suggesting the outcome of Mtb and SCV2 co-infection may be modulated by differences in the strain of Mtb. In turn, it is also likely that the strain and variant of SCV2 itself can influence disease during an underlying Mtb infection. Future studies directly comparing diverse strains of Mtb and SCV2 in mouse coinfection models would advance our understanding of how virulence factors expressed by each pathogen contribute to the overall outcome of both diseases.
The inability of SCV2 to increase mycobacterial load and lung pathology in mice subsequently infected with Mtb contrasts with our previous experiments with sequential IAV and Mtb infections (17). SCV2 infection likely engages immune pathways differently in both quantity and/or quality compared to IAV, such as IFN-I production. Others have shown through in vitro infection of a human airway epithelial cell line susceptible to both viruses that IAV was a more potent inducer of IFN activity (as measured by STAT1 phosphorylation) than USA-WA1/2020 SCV2 (40). Additionally, COVID-19 patients hospitalized with pneumonia have comparatively low and delayed production of IFN-I when contrasted with severe IAV pneumonia patients (41). As IFN-I has a detrimental impact on Mtb-driven disease outcomes in mice and humans (17, 42–48), this raises the possibility that SCV2 may not be able to exacerbate Mtb infection due to the induction of a weaker IFN response compared to IAV infection. Future studies must systematically address commonalities and differences between the long-term impacts of IAV or SCV2 infection on the lung microenvironment and subsequent respiratory immune responses to secondary infections. Our data also do not exclude the possibility that Mtb burden may be altered at timepoints different from those tested here or whether SCV2 co-infection, similar to IAV co-infection (17, 18), can alter the mortality of Mtb-infected animals.
Using flow cytometric analyses, we investigated the impact of SCV2 infection 16 weeks post Mtb infection on existing Mtb-specific T cell responses, however no reduction was detected compared to mice infected with Mtb alone. Other studies where viruses were administered within the first two weeks after Mtb-infection (17, 18, 49), a critical time during which initial T cell priming to Mtb antigens occurs (50), have reported dampened Mtb-specific T cell responses and increased susceptibility to Mtb. We intentionally did not explore SCV2 co-infection within the first two weeks after Mtb infection because we wanted to mimic the most common clinical scenarios (i.e., individuals who had recovered from a previous SCV2 infection or individuals with a latent, underlying Mtb infection). While isolated Mtb components such as those present in Complete Freund’s Adjuvant can serve as adjuvants to amplify adaptive responses to specific peptide antigens (51, 52), any potential adjuvant effect caused by infection with live Mtb bacteria here, was unable to boost antigen-specific T cell responses to SCV2. In contrast, we showed that ongoing Mtb infection reduced the frequency of SCV2-specific CD8+ TRM, which was likely due to strongly enhanced early innate viral control in Mtb infected mice. We cannot, however, completely rule out that the underlying Mtb infection additionally influenced the priming, expansion, contraction, and migration of SCV2-specific T cells into the lungs of co-infected mice; Therefore, further studies are needed to address how simultaneous infection with SCV2 and Mtb impacts the priming of adaptive immune responses and disease outcomes for each pathogen.
The Mtb infection-mediated suppression of SCV2 replication in our studies was apparent as early as one day post SCV2 exposure. As such, we propose that underlying Mtb infection enhances early anti-viral innate immunity in the lung. In contrast to the detrimental role IFN-I plays in Mtb infection, IFN-I is a critical family of cytokines promoting innate anti-viral immunity (8). However, our data suggest that IFN-I signaling did not mediate the increased viral control in Mtb-infected lungs, as we showed that Ifnar1-/- mice had a similarly reduced SCV2 burden as WT mice when previously infected with Mtb. Nevertheless, we also showed that IFNAR1-deficient mice had a higher viral load at 3 days post-infection independently of Mtb infection status, in line with previously published in vivo data that support IFN-I-dependent control of SCV2 replication in mice (53–57) and hamsters (58, 59). Genes induced by IFN-I signaling (Interferon Stimulate Genes, ISGs) overlap significantly, but not completely with genes induced by IFNγ (IFN-II) and IFNλ (IFN-III) (60, 61), suggesting that production of any family of IFNs may have similar effects during SCV2 infection. Several studies utilizing mice deficient in IFNγ signaling have demonstrated a direct role for IFN-II in restriction of SCV2 (62–64). Moreover, IFNγ plays a central role in SCV2 restriction following intravenous infection of mice with Mycobacterium bovis bacille Calmette-Guérin (BCG), an attenuated relative of Mtb (62, 65). Studies of IFNλ in SCV2-infected mice indicate that the IFN-III response can also restrict viral replication in the mouse lung (66). However, IFNλ signaling-deficient hamsters did not exhibit a similar defect in viral control (67). Thus, while Mtb-driven control of early viral replication occurred independently of IFN-I in our studies, it is possible that IFN-III and/or IFN-II, the latter of which is highly induced after mycobacterial infections in mice and is responsible for reduced SCV2 burden following infection with BCG (65), may contribute to the anti-viral state in Mtb-infected lungs.
Finally, because early viral restriction was Mtb-infection dose-dependent, we explored whether suppression of viral replication in Mtb-infected mice was mediated through mycobacterial sensing by TLR2 or TLR9. In addition to recognition of mycobacterial ligands, a role for TLR2 in recognizing the envelope (E) protein of SCV2 leading to innate viral control has been previously reported (68), and we show here that TLR2-deficient mice indeed displayed higher TCID50 viral titers in their lungs three days after infection with B.1.351 SCV2 in the absence of Mtb infection. Nevertheless, neither TLR2 nor TLR9 signals were individually responsible for suppressing SCV2 replication in the lungs of Mtb co-infected C57Bl/6 mice. Our data do not exclude the possibility that multiple TLRs may act in concert to induce a SCV2-suppressive immune environment during Mtb infection, and further functional studies are needed to uncover the complex immunological mechanisms responsible for increased innate anti-viral immunity. These mechanisms may include but are not limited to down-regulation of viral entry receptors, enhanced antiviral activation of lung epithelial cells, trained innate immunity or modulation of the innate immune cell milieu in the lung (64, 65, 69–71).
Together, our data suggest that, in the K18-hACE2 Tg mouse model, infection with the ancestral strain of SCV2 does not exacerbate ongoing or subsequent Mtb infection at the timepoints tested. Further studies utilizing different strains of mice, Mtb strains and SCV2 variants that explore the entire course of infection would further strengthen these observations. While our data do not rule out the possibility of immunological influences in the exacerbation of TB or COVID-19 in co-infected humans they do point to the impact of sociological and healthcare disruptions as more significant factors underlying the reported increase in TB mortality rates during the COVID-19 pandemic.
K18-hACE2 Tg hemizygous transgenic mice (B6.Cg-Tg(K18-ACE2)2Prlmn/J; JAX stock #034860) (36), were purchased from Jackson Laboratories (Bar Harbor, ME). C57Bl/6 mice or C57Bl/6 mice expressing a Foxp3-GFP reporter (C57BL/6-Foxp3tm1Kuch) (72) were used as wild type C57Bl/6 controls. Foxp3-GFP mice and Ifnar1 KO mice (B6-[KO]IFNa/bR1) (73) were obtained through a supply contract between NIAID and Taconic Farms. Tlr2 KO mice (74) and Tlr9 KO mice (75) were originally generated by the laboratory of Dr. Shizuo Akira (Osaka University, Japan) and were kind gifts of Dr. Alan Sher (NIH/NIAID) and Dr. Giorgio Trinchieri (NIH/NCI) respectively. All mouse strains were confirmed to be on a C57Bl/6 background by genetic background analysis submitted through Transnetyx and performed by Neogen using the MiniMUGA platform. Both male and female mice were used and were 8-16 weeks old at the onset of experiments and mice within experiments were age and sex matched. All animals were bred and maintained in an AAALAC-accredited ABSL2 or ABSL3 facility at the NIH and experiments were performed in compliance with an animal study proposal approved by the NIAID Animal Care and Use Committee.
Aerosol infections of mice with H37Rv-mCherry (50-200 CFU, or as indicated in figure legends) were carried out in a Glas-Col whole-body inhalation exposure system as previously described in detail (76). Briefly, to quantify Mtb CFU, lung or spleen homogenates, BALF or inocula were serial-diluted in PBS + 0.1% Tween-80 and plated on Middlebrook 7H11 agar (Sigma Aldrich) supplemented with oleic acid-albumin-dextrose-catalase (OADC) for 3 weeks at 37°C before colonies were counted.
SARS-CoV-2 hCoV-19/USA-WA1/2020 (Pango lineage A, GISAID reference: EPI_ISL_404895.2) (USA-WA1/2020) and SARS-CoV-2/human/ZAF/KRISP-K005325/2020 beta variant of concern (Pango lineage B.1.351, GISAID reference: EPI_ISL_678615) (B.1.351) were obtained from BEI resources (NIAID, NIH). Viral stocks were generated by infection of Vero cells (CCL-81, American Type Culture Collection) without (USA-WA1/2020) or with (B.1.351) stable expression of TMPRSS2 (77) at a multiplicity of infection of 0.01 for 48hrs. Cell culture media was harvested and centrifuged at 3500 x g, pooled, aliquoted, and stored at -80°C until use. Virus stocks were sequenced using the Illumina platform; USA-WA1/2020 was consistent with the reference sequence MN985325.1 except for H655Y in S, S6L in E, T7I in M, and S194T in N; B.1.351 was consistent with reference sequence MZ376663.1. Mice were anesthetized with isoflurane and infected intranasally with 35µL inoculum containing 1.0x101 - 1.0x10³ TCID50 USA-WA1/2020 or 3.5x10⁴ TCID50 B.1.351. Inoculum was quantified by TCID50 assay in Vero E6 cells (CRL-1586; American Type Culture Collection).
2.5x10⁴ Vero E6 cells were seeded in 100μL DMEM + 10% FCS per well of 96-well tissue culture cluster plates, incubated at 37°C + 5% CO2 for 16-24 hrs and washed twice with 100μL DMEM + 2% FCS before the assay was conducted. After harvesting lungs from mice, the inferior lobe, post-caval lobe and left lung were homogenized in 600μL PBS using 2.7mm glass beads on a Precellys tissue homogenizer (Bertin Instruments) before dilution with PBS to a final volume of 1.7mL. Viral titers were determined by performing 10-fold serial dilutions of homogenates in DMEM + 2% FCS in quadruplicate, then plating 100μL serial-diluted homogenate and 100μL DMEM + 2% FCS on washed Vero E6 cells and incubating at 37°C + 5% CO2 for 96 hours. TCID50 was measured by removing supernatants and staining wells with crystal violet before scoring for cytopathic effect and calculation using the Reed–Muench method.
For RNA extraction, the superior lobe from each mouse was placed in RNAlater (Invitrogen) and stored at −80°C. RNAlater-stabilized lung lobes were thawed at RT for 20 min, then homogenized in RLT Plus buffer with β-mercaptoethanol (QIAGEN). Total RNA was then isolated from the RLT-homogenized tissue using the RNeasy Plus Mini Kit (QIAGEN), including on-column DNase treatment using the RNase-Free DNase set (QIAGEN) following the manufacturer’s instructions and eluted in 60µL RNAse-free water. SCV2 genome copy quantitation was performed in duplicate from 2.5uL of eluted RNA per reaction using the Taqpath 1-step RT-qPCR Master Mix (Thermo) as described by the manufacturer. The SCV2 E gene in both typical (genomic, gRNA) and actively replicating (sub-genomic, sgRNA) conformations (35) was detected using primers at 500nM as follows: E (genomic) Forward (5’- ACAGGTACGTTAATAGTTAATAGCGT-3’), E (sub-genomic) Forward (5’- CGATCTCTTGTAGATCTGTTCTC-3’), E (genomic and sub-genomic) Reverse (5’- ATATTGCAGCAGTACGCACACA -3’) and the probe for both E genomic and sub-genomic reactions was used at 125nM (5′- (FAM)-ACACTAGCCATCCTTACTGCGCTTCG-(3IABkFQ) -3′). Cycling conditions: Initial: 25°C for 2 min, 50°C for 15 min, and 95°C for 2 min, Cycling: 95°C for 3 sec, 60°C for 30 sec, for 40 cycles. Copy number was calculated based on standard curves generated for each RT-qPCR run, with SCV2 RNA standard of known quantity and eleven 5-fold dilutions run in duplicate (78).
Lungs from infected mice were dissociated using a GentleMACS dissociator (Miltenyi Biotec) in digestion buffer comprised of 0.33mg/mL Liberase TL (Roche), 7U/mL benzonase (Sino Biological), 10µM cytochalasin D (Sigma-Aldrich) and 200µg/mL hyaluronidase (Sigma-Aldrich) followed by 30 - 45 minutes at 37°C. Digested lung was fully dispersed by passage through a 100µm pore size cell strainer and an aliquot was removed for bacterial CFU measurements when needed. Isolated cells were stained with MHC-II tetramers for 40min at 37°C in complete RPMI with 1mM aminoguanidine (Sigma-Aldrich), 100nM dasatinib (Cayman Chemical), 3µg/mL brefeldin A (ThermoFisher) and 2µM monensin (ThermoFisher). Cells were then washed and stained with MHC-I tetramers, surface antibodies and Molecular Probes LIVE/DEAD Fixable Near-IR Dead Cell Stain Kit (ThermoFisher) for 20 min at 4°C before permeabilization and fixation using eBioscience™ Foxp3 Transcription Factor Staining Buffer Set (ThermoFisher) at 4°C overnight. Intracellular staining was performed in eBioscience™ Permeabilization Buffer (ThermoFisher) for 40 minutes at 4°C. Samples were acquired on a FACSymphony (BD Biosciences). FACS data were analyzed using FlowJo10 (Treestar). Antibodies were purchased from BioLegend, BD and ThermoFisher as follows: anti-CD45 (30-F11), anti-CD4 (GK1.5), anti-FoxP3 (FJK-16s), anti-CD8a (53-6.7), anti-CD44 (IM7), anti-Ki-67 (B56), anti-T-bet (4B10), anti-KLRG1 (2F1), anti-CD69 (H1.2F3). Tetramer reagents were obtained from the NIH Tetramer Core Facility as follows: Mtb ESAT64-17 MHC-II I-Ab tetramer, Mtb TB10.44-11 MHC-I H-2Kb tetramer, Mtb 32c93-102 MHC-I H2-Db tetramer, SCV2 ORF3A266-280 MHC-II I-Ab tetramer, SCV2 S532-546 MHC-I H-2Kb tetramer, SCV2 N219-227 MHC-I H-2Db tetramer.
The middle right lung lobe from each mouse was fixed in 4% paraformaldehyde, transferred to 70% ethanol and paraffin-embedded before sectioning and mounting on glass slides for staining with hematoxylin and eosin (H&E) or the Kinyoun method for visualization of acid-fast (AF) mycobacteria. Stained slides were imaged by light microscopy on an Aperio Versa microscope (Leica Microsystems). Images were processed using QuPath v0.3.2 (Bankhead et al., 2017) and ImageJ v1.53t (NIH) for quantification and visualization as previously described (79).
Statistical analyses were performed using GraphPad Prism v9.0 for Mac OS X (GraphPad Software). Each figure legend lists all the statistical details of experiments, including the statistical tests used. Data are expressed as mean ± SD. Significant differences are indicated by the p value in each figure.
The raw data supporting the conclusions of this article will be made available by the authors, without undue reservation.
The animal study was approved by National Institute of Allergy and Infectious Diseases IACUC. The study was conducted in accordance with the local legislation and institutional requirements.
Conceptualization: PB and KM-B. Investigation: PB, EA, EC, AB, FT-J, CJ, KH and KM-B. Resources: CN, DB, RJ and KM-B. Data Analysis and Curation: PB, EA and KM-B. Data Visualization: PB, EA and KM-B. Writing – Original Draft: PB and KM-B, Writing – Review & Editing: all co-authors. Supervision: DB and KM-B. Funding Acquisition: RJ, DB, and KM-B. All authors contributed to the article and approved the submitted version.
This work was supported by the intramural research program of NIAID.
We are grateful to the staff of the NIAID Comparative Medicine Branch ABSL2 and ABSL3 facilities, NIAID Research Technologies Branch Flow Cytometry Core and NIAID Laboratory of Viral Diseases SARS-CoV-2 Virology Core for their assistance with the work contained in this manuscript.
The authors declare that the research was conducted in the absence of any commercial or financial relationships that could be construed as a potential conflict of interest.
All claims expressed in this article are solely those of the authors and do not necessarily represent those of their affiliated organizations, or those of the publisher, the editors and the reviewers. Any product that may be evaluated in this article, or claim that may be made by its manufacturer, is not guaranteed or endorsed by the publisher.
1. Brundage JF. Interactions between influenza and bacterial respiratory pathogens: implications for pandemic preparedness. Lancet Infect Dis (2006) 6:303–12. doi: 10.1016/S1473-3099(06)70466-2
2. Morris DE, Cleary DW, Clarke SC. Secondary bacterial infections associated with influenza pandemics. Front Microbiol (2017) 8:1041. doi: 10.3389/fmicb.2017.01041
3. Bakaletz LO. Viral potentiation of bacterial superinfection of the respiratory tract. Trends Microbiol (1995) 3:110–4. doi: 10.1016/S0966-842X(00)88892-7
4. Bakaletz LO. Viral–bacterial co-infections in the respiratory tract. Curr Opin Microbiol (2017) 35:30–5. doi: 10.1016/j.mib.2016.11.003
5. Obar JJ, Shepardson KM. Coinfections in the lung: How viral infection creates a favorable environment for bacterial and fungal infections. PloS Pathog (2023) 19:e1011334. doi: 10.1371/journal.ppat.1011334
6. Jamieson AM, Pasman L, Yu S, Gamradt P, Homer RJ, Decker T, et al. Role of tissue protection in lethal respiratory viral-bacterial coinfection. Science (2013) 340:1230–4. doi: 10.1126/science.1233632
7. Jamieson AM, Yu S, Annicelli CH, Medzhitov R. Influenza virus-induced glucocorticoids compromise innate host defense against a secondary bacterial infection. Cell Host Microbe (2010) 7:103–14. doi: 10.1016/j.chom.2010.01.010
8. McNab F, Mayer-Barber K, Sher A, Wack A, O’Garra A. Type I interferons in infectious disease. Nat Rev Immunol (2015) 15:87–103. doi: 10.1038/nri3787
9. Ong CWM, Migliori GB, Raviglione M, MacGregor-Skinner G, Sotgiu G, Alffenaar J-W, et al. Epidemic and pandemic viral infections: impact on tuberculosis and the lung: A consensus by the World Association for Infectious Diseases and Immunological Disorders (WAidid), Global Tuberculosis Network (GTN), and members of the European Society of Clinical Microbiology and Infectious Diseases Study Group for Mycobacterial Infections (ESGMYC). Eur Respir J (2020) 56:2001727. doi: 10.1183/13993003.01727-2020
10. World Health Organization. Global Tuberculosis Report 2022 (2022). Geneva: World Health Organization. Available at: https://www.who.int/teams/global-tuberculosis-programme/tb-reports/global-tuberculosis-report-2022 (Accessed November 1, 2022).
11. Müller J, Tanner R, Matsumiya M, Snowden MA, Landry B, Satti I, et al. Cytomegalovirus infection is a risk factor for tuberculosis disease in infants. JCI Insight (2019) 4:e130090. doi: 10.1172/jci.insight.130090
12. Stockdale L, Nash S, Farmer R, Raynes J, Mallikaarjun S, Newton R, et al. Cytomegalovirus antibody responses associated with increased risk of tuberculosis disease in Ugandan adults. J Infect Dis (2020) 221:1127–34. doi: 10.1093/infdis/jiz581
13. van der Heijden YF, Zhang B, Chougnet CA, Huaman MA. Cytomegalovirus infection is associated with increased prevalence of latent tuberculosis infection. Open Forum Infect Dis (2021) 8:ofab539. doi: 10.1093/ofid/ofab539
14. Mendy J, Jarju S, Heslop R, Bojang AL, Kampmann B, Sutherland JS. Changes in Mycobacterium tuberculosis-Specific Immunity With Influenza co-infection at Time of TB Diagnosis. Front Immunol (2019) 9:3093. doi: 10.3389/fimmu.2018.03093
15. Walaza S, Tempia S, Dawood H, Variava E, Moyes J, Cohen AL, et al. Influenza virus infection is associated with increased risk of death amongst patients hospitalized with confirmed pulmonary tuberculosis in South Africa, 2010–2011. BMC Infect Dis (2015) 15:26. doi: 10.1186/s12879-015-0746-x
16. Volkert M, Pierce C, Horsfall FL Jr, Dubos RJ. The enhancing effect of concurrent infection with pneumotropic viruses on pulmonary tuberculosis in mice. J Exp Med (1947) 86:203–14. doi: 10.1084/jem.86.3.203
17. Redford PS, Mayer-Barber KD, McNab FW, Stavropoulos E, Wack A, Sher A, et al. Influenza A virus impairs control of mycobacterium tuberculosis coinfection through a type I interferon receptor–dependent pathway. J Infect Dis (2014) 209:270–4. doi: 10.1093/infdis/jit424
18. Ring S, Eggers L, Behrends J, Wutkowski A, Schwudke D, Kröger A, et al. Blocking IL-10 receptor signaling ameliorates Mycobacterium tuberculosis infection during influenza-induced exacerbation. JCI Insight (2019) 4:e126533. doi: 10.1172/jci.insight.126533
19. Malik AA, Safdar N, Chandir S, Khan U, Khowaja S, Riaz N, et al. Tuberculosis control and care in the era of COVID-19. Health Policy Plan (2020) 35:1130–2. doi: 10.1093/heapol/czaa109
20. Zimmer AJ, Klinton JS, Oga-Omenka C, Heitkamp P, Nyirenda CN, Furin J, et al. Tuberculosis in times of COVID-19. J Epidemiol Community Health (2022) 76:310–6. doi: 10.1136/jech-2021-217529
21. Odume B, Falokun V, Chukwuogo O, Ogbudebe C, Useni S, Nwokoye N, et al. Impact of COVID-19 on TB active case finding in Nigeria. Public Health Action (2020) 10:157–62. doi: 10.5588/pha.20.0037
22. Klinton JS, Heitkamp P, Rashid A, Faleye BO, Win Htat H, Hussain H, et al. One year of COVID-19 and its impact on private provider engagement for TB: A rapid assessment of intermediary NGOs in seven high TB burden countries. J Clin Tuberc Mycobact Dis (2021) 25:100277. doi: 10.1016/j.jctube.2021.100277
23. McQuaid CF, Vassall A, Cohen T, Fiekert K, COVID/TB Modelling Working Group, White RG. The impact of COVID-19 on TB: a review of the data. Int J Tuberc Lung Dis (2021) 25:436–46. doi: 10.5588/ijtld.21.0148
24. Action global health advocacy partnership, global coalition of TB activists, global TB caucus, et al. The Impact of COVID-19 on the TB Epidemic: A Community Perspective. Available at: https://express.adobe.com/page/xJ7pygvhrIAqW/ (Accessed April 3, 2023).
25. Zimmer AJ, Heitkamp P, Malar J, Dantas C, O’Brien K, Pandita A, et al. Facility-based directly observed therapy (DOT) for tuberculosis during COVID-19: A community perspective. J Clin Tuberc Mycobact Dis (2021) 24:100248. doi: 10.1016/j.jctube.2021.100248
26. Benade M, Long L, Meyer-Rath G, Miot J, Evans D, Tucker J-M, et al. Reduction in initiations of drug-sensitive tuberculosis treatment in South Africa during the COVID-19 pandemic: Analysis of retrospective, facility-level data. PloS Glob Public Health (2022) 2:e0000559. doi: 10.1371/journal.pgph.0000559
27. Coutinho I, Alves LC, Werneck GL, Trajman A. The impact of the COVID-19 pandemic in tuberculosis preventive treatment in Brazil: a retrospective cohort study using secondary data. Lancet Reg Health – Am (2023) 19:100444. doi: 10.1016/j.lana.2023.100444
28. Song W, Zhao J, Zhang Q, Liu S, Zhu X, An Q, et al. COVID-19 and tuberculosis coinfection: an overview of case reports/case series and meta-analysis. Front Med (2021) 8:657006. doi: 10.3389/fmed.2021.657006
29. Chiok KR, Dhar N, Banerjee A. Mycobacterium tuberculosis and SARS-CoV-2 co-infections: The knowns and unknowns. iScience (2023) 26:106629. doi: 10.1016/j.isci.2023.106629
30. Hildebrand RE, Chandrasekar SS, Riel M, Touray BJB, Aschenbroich SA, Talaat AM. Superinfection with SARS-CoV-2 Has Deleterious Effects on Mycobacterium bovis BCG Immunity and Promotes Dissemination of Mycobacterium tuberculosis. Microbiol Spectr (2022) 0:e03075–22. doi: 10.1128/spectrum.03075-22
31. Rosas-Mejia O, Gloag ES, Li J, Ruane-Foster M, Claeys TA, Farkas D, et al. Mice infected with Mycobacterium tuberculosis are resistant to acute disease caused by secondary infection with SARS-CoV-2. PloS Pathog (2022) 18:e1010093. doi: 10.1371/journal.ppat.1010093
32. Anderson KG, Mayer-Barber K, Sung H, Beura L, James BR, Taylor JJ, et al. Intravascular staining for discrimination of vascular and tissue leukocytes. Nat Protoc (2014) 9:209–22. doi: 10.1038/nprot.2014.005
33. Joag V, Wijeyesinghe S, Stolley JM, Quarnstrom CF, Dileepan T, Soerens AG, et al. Cutting edge: mouse SARS-coV-2 epitope reveals infection and vaccine-elicited CD8 T cell responses. J Immunol (2021) 206:931–5. doi: 10.4049/jimmunol.2001400
34. Kaech SM, Cui W. Transcriptional control of effector and memory CD8+ T cell differentiation. Nat Rev Immunol (2012) 12:749–61. doi: 10.1038/nri3307
35. Long S. SARS-coV-2 subgenomic RNAs: characterization, utility, and perspectives. Viruses (2021) 13:1923. doi: 10.3390/v13101923
36. McCray PB, Pewe L, Wohlford-Lenane C, Hickey M, Manzel L, Shi L, et al. Lethal infection of K18-hACE2 mice infected with severe acute respiratory syndrome coronavirus. J Virol (2007) 81:813–21. doi: 10.1128/JVI.02012-06
37. Niu Z, Zhang Z, Gao X, Du P, Lu J, Yan B, et al. N501Y mutation imparts cross-species transmission of SARS-CoV-2 to mice by enhancing receptor binding. Signal Transduct Target Ther (2021) 6:1–3. doi: 10.1038/s41392-021-00704-2
38. Kant R, Kareinen L, Smura T, Freitag TL, Jha SK, Alitalo K, et al. Common laboratory mice are susceptible to infection with the SARS-coV-2 beta variant. Viruses (2021) 13:2263. doi: 10.3390/v13112263
39. Faridgohar M, Nikoueinejad H. New findings of Toll-like receptors involved in Mycobacterium tuberculosis infection. Pathog Glob Health (2017) 111:256–64. doi: 10.1080/20477724.2017.1351080
40. Lokugamage KG, Hage A, de Vries M, Valero-Jimenez AM, Schindewolf C, Dittmann M, et al. Type I interferon susceptibility distinguishes SARS-coV-2 from SARS-coV. J Virol (2020) 94:e01410–20. doi: 10.1128/JVI.01410-20
41. Galani I-E, Rovina N, Lampropoulou V, Triantafyllia V, Manioudaki M, Pavlos E, et al. Untuned antiviral immunity in COVID-19 revealed by temporal type I/III interferon patterns and flu comparison. Nat Immunol (2021) 22:32–40. doi: 10.1038/s41590-020-00840-x
42. Manca C, Tsenova L, Bergtold A, Freeman S, Tovey M, Musser JM, et al. Virulence of a Mycobacterium tuberculosis clinical isolate in mice is determined by failure to induce Th1 type immunity and is associated with induction of IFN-α/β. Proc Natl Acad Sci (2001) 98:5752–7. doi: 10.1073/pnas.091096998
43. Stanley SA, Johndrow JE, Manzanillo P, Cox JS. The type I IFN response to infection with mycobacterium tuberculosis requires ESX-1-mediated secretion and contributes to pathogenesis. J Immunol (2007) 178:3143–52. doi: 10.4049/jimmunol.178.5.3143
44. Berry MPR, Graham CM, McNab FW, Xu Z, Bloch SAA, Oni T, et al. An interferon-inducible neutrophil-driven blood transcriptional signature in human tuberculosis. Nature (2010) 466:973–7. doi: 10.1038/nature09247
45. Antonelli LRV, Gigliotti Rothfuchs A, Gonçalves R, Roffê E, Cheever AW, Bafica A, et al. Intranasal Poly-IC treatment exacerbates tuberculosis in mice through the pulmonary recruitment of a pathogen-permissive monocyte/macrophage population. J Clin Invest (2010) 120:1674–82. doi: 10.1172/JCI40817
46. Mayer-Barber KD, Andrade BB, Barber DL, Hieny S, Feng CG, Caspar P, et al. Innate and Adaptive Interferons Suppress IL-1α and IL-1β Production by Distinct Pulmonary Myeloid Subsets during Mycobacterium tuberculosis Infection. Immunity (2011) 35:1023–34. doi: 10.1016/j.immuni.2011.12.002
47. Ji DX, Yamashiro LH, Chen KJ, Mukaida N, Kramnik I, Darwin KH, et al. Type I interferon-driven susceptibility to Mycobacterium tuberculosis is mediated by IL-1Ra. Nat Microbiol (2019) 4:2128–35. doi: 10.1038/s41564-019-0578-3
48. Manca C, Tsenova L, Freeman S, Barczak AK, Tovey M, Murray PJ, et al. tuberculosis W/beijing strains upregulate type I IFNs and increase expression of negative regulators of the jak-stat pathway. J Interferon Cytokine Res (2005) 25:694–701. doi: 10.1089/jir.2005.25.694
49. Xu W, Snell LM, Guo M, Boukhaled G, Macleod BL, Li M, et al. Early innate and adaptive immune perturbations determine long-term severity of chronic virus and Mycobacterium tuberculosis coinfection. Immunity (2021) 54:526–541.e7. doi: 10.1016/j.immuni.2021.01.003
50. Urdahl KB, Shafiani S, Ernst JD. Initiation and regulation of T-cell responses in tuberculosis. Mucosal Immunol (2011) 4:288–93. doi: 10.1038/mi.2011.10
51. Lewis PA, Loomis D. Allergic irritability. J Exp Med (1924) 40:503–15. doi: 10.1084/jem.40.4.503
52. Billiau A, Matthys P. Modes of action of Freund’s adjuvants in experimental models of autoimmune diseases. J Leukoc Biol (2001) 70:849–60. doi: 10.1189/jlb.70.6.849
53. Israelow B, Song E, Mao T, Lu P, Meir A, Liu F, et al. Mouse model of SARS-CoV-2 reveals inflammatory role of type I interferon signaling. J Exp Med (2020) 217:e20201241. doi: 10.1084/jem.20201241
54. Sun J, Zhuang Z, Zheng J, Li K, Wong RL-Y, Liu D, et al. Generation of a broadly useful model for COVID-19 pathogenesis, vaccination, and treatment. Cell (2020) 182:734–743.e5. doi: 10.1016/j.cell.2020.06.010
55. Ogger PP, Garcia Martín M, Michalaki C, Zhou J, Brown JC, Du Y, et al. Type I interferon receptor signalling deficiency results in dysregulated innate immune responses to SARS-CoV-2 in mice. Eur J Immunol (2022) 52:1768–75. doi: 10.1002/eji.202249913
56. Uddin MB, Liang Y, Shao S, Palani S, McKelvey M, Weaver SC, et al. Type I IFN signaling protects mice from lethal SARS-coV-2 neuroinvasion. ImmunoHorizons (2022) 6:716–21. doi: 10.4049/immunohorizons.2200065
57. Leist SR, Dinnon KH, Schäfer A, Tse LV, Okuda K, Hou YJ, et al. A mouse-adapted SARS-coV-2 induces acute lung injury and mortality in standard laboratory mice. Cell (2020) 183:1070–1085.e12. doi: 10.1016/j.cell.2020.09.050
58. Bessière P, Wasniewski M, Picard-Meyer E, Servat A, Figueroa T, Foret-Lucas C, et al. Intranasal type I interferon treatment is beneficial only when administered before clinical signs onset in the SARS-CoV-2 hamster model. PloS Pathog (2021) 17:e1009427. doi: 10.1371/journal.ppat.1009427
59. Hoagland DA, Møller R, Uhl SA, Oishi K, Frere J, Golynker I, et al. Leveraging the antiviral type I interferon system as a first line of defense against SARS-CoV-2 pathogenicity. Immunity (2021) 54:557–570.e5. doi: 10.1016/j.immuni.2021.01.017
60. Platanias LC. Mechanisms of type-I- and type-II-interferon-mediated signalling. Nat Rev Immunol (2005) 5:375–86. doi: 10.1038/nri1604
61. Schoggins JW. Interferon-stimulated genes: what do they all do? Annu Rev Virol (2019) 6:567–84. doi: 10.1146/annurev-virology-092818-015756
62. Hilligan KL, Namasivayam S, Clancy CS, Baker PJ, Old SI, Peluf V, et al. Pre-existing interferon gamma conditions the lung to mediate early control of SARS-CoV-2. bioRxiv (2023) 2023:07.15.549135. doi: 10.1101/2023.07.15.549135
63. Karki R, Sharma BR, Tuladhar S, Williams EP, Zalduondo L, Samir P, et al. Synergism of TNF-α and IFN-γ Triggers inflammatory cell death, tissue damage, and mortality in SARS-coV-2 infection and cytokine shock syndromes. Cell (2021) 184:149–168.e17. doi: 10.1016/j.cell.2020.11.025
64. Gawish R, Starkl P, Pimenov L, Hladik A, Lakovits K, Oberndorfer F, et al. ACE2 is the critical in vivo receptor for SARS-CoV-2 in a novel COVID-19 mouse model with TNF- and IFNγ-driven immunopathology. eLife (2022) 11:e74623. doi: 10.7554/eLife.74623
65. Hilligan KL, Namasivayam S, Clancy CS, O’Mard D, Oland SD, Robertson SJ, et al. Intravenous administration of BCG protects mice against lethal SARS-CoV-2 challenge. J Exp Med (2021) 219:e20211862. doi: 10.1084/jem.20211862
66. Chong Z, Karl CE, Halfmann PJ, Kawaoka Y, Winkler ES, Keeler SP, et al. Nasally delivered interferon-λ protects mice against infection by SARS-CoV-2 variants including Omicron. Cell Rep (2022) 39:110799. doi: 10.1016/j.celrep.2022.110799
67. Boudewijns R, Thibaut HJ, Kaptein SJF, Li R, Vergote V, Seldeslachts L, et al. STAT2 signaling restricts viral dissemination but drives severe pneumonia in SARS-CoV-2 infected hamsters. Nat Commun (2020) 11:5838. doi: 10.1038/s41467-020-19684-y
68. Zheng M, Karki R, Williams EP, Yang D, Fitzpatrick E, Vogel P, et al. TLR2 senses the SARS-CoV-2 envelope protein to produce inflammatory cytokines. Nat Immunol (2021) 22:829–38. doi: 10.1038/s41590-021-00937-x
69. Tamir H, Melamed S, Erez N, Politi B, Yahalom-Ronen Y, Achdout H, et al. Induction of innate immune response by TLR3 agonist protects mice against SARS-coV-2 infection. Viruses (2022) 14:189. doi: 10.3390/v14020189
70. Martin-Sancho L, Lewinski MK, Pache L, Stoneham CA, Yin X, Becker ME, et al. Functional landscape of SARS-CoV-2 cellular restriction. Mol Cell (2021) 81:2656–2668.e8. doi: 10.1016/j.molcel.2021.04.008
71. Zhang B-Z, Shuai H, Gong H-R, Hu J-C, Yan B, Yuen TT-T, et al. Bacillus Calmette-Guérin–induced trained immunity protects against SARS-CoV-2 challenge in K18-hACE2 mice. JCI Insight (2022) 7:e157393. doi: 10.1172/jci.insight.157393
72. Bettelli E, Carrier Y, Gao W, Korn T, Strom TB, Oukka M, et al. Reciprocal developmental pathways for the generation of pathogenic effector TH17 and regulatory T cells. Nature (2006) 441:235–8. doi: 10.1038/nature04753
73. Müller U, Steinhoff U, Reis LFL, Hemmi S, Pavlovic J, Zinkernagel RM, et al. Functional role of type I and type II interferons in antiviral defense. Science (1994) 264:1918–21. doi: 10.1126/science.8009221
74. Takeuchi O, Hoshino K, Kawai T, Sanjo H, Takada H, Ogawa T, et al. Differential roles of TLR2 and TLR4 in recognition of gram-negative and gram-positive bacterial cell wall components. Immunity (1999) 11:443–51. doi: 10.1016/S1074-7613(00)80119-3
75. Hemmi H, Takeuchi O, Kawai T, Kaisho T, Sato S, Sanjo H, et al. A Toll-like receptor recognizes bacterial DNA. Nature (2000) 408:740–5. doi: 10.1038/35047123
76. Bohrer AC, Tocheny C, Assmann M, Ganusov VV, Mayer–Barber KD. Cutting edge: IL-1R1 mediates host resistance to mycobacterium tuberculosis by trans-protection of infected cells. J Immunol (2018) 201:1645–50. doi: 10.4049/jimmunol.1800438
77. Liu X, Luongo C, Matsuoka Y, Park H-S, Santos C, Yang L, et al. A single intranasal dose of a live-attenuated parainfluenza virus-vectored SARS-CoV-2 vaccine is protective in hamsters. Proc Natl Acad Sci (2021) 118:e2109744118. doi: 10.1073/pnas.2109744118
78. Nelson CE, Namasivayam S, Foreman TW, Kauffman KD, Sakai S, Dorosky DE, et al. Mild SARS-CoV-2 infection in rhesus macaques is associated with viral control prior to antigen-specific T cell responses in tissues. Sci Immunol (2022) 7:eabo0535 doi: 10.1126/sciimmunol.abo0535
Keywords: lung, mycobacterium tuberculosis, SARS-CoV-2, tuberculosis, COVID-19, Type-I interferon, co-infection
Citation: Baker PJ, Amaral EP, Castro E, Bohrer AC, Torres-Juárez F, Jordan CM, Nelson CE, Barber DL, Johnson RF, Hilligan KL and Mayer-Barber KD (2023) Co-infection of mice with SARS-CoV-2 and Mycobacterium tuberculosis limits early viral replication but does not affect mycobacterial loads. Front. Immunol. 14:1240419. doi: 10.3389/fimmu.2023.1240419
Received: 15 June 2023; Accepted: 15 August 2023;
Published: 01 September 2023.
Edited by:
Alex Sigal, Africa Health Research Institute (AHRI), South AfricaReviewed by:
Luis Horacio Gutiérrez-González, National Institute of Respiratory Diseases-Mexico (INER), MexicoCopyright © 2023 Baker, Amaral, Castro, Bohrer, Torres-Juárez, Jordan, Nelson, Barber, Johnson, Hilligan and Mayer-Barber. This is an open-access article distributed under the terms of the Creative Commons Attribution License (CC BY). The use, distribution or reproduction in other forums is permitted, provided the original author(s) and the copyright owner(s) are credited and that the original publication in this journal is cited, in accordance with accepted academic practice. No use, distribution or reproduction is permitted which does not comply with these terms.
*Correspondence: Katrin D. Mayer-Barber, bWF5ZXJrQG5pYWlkLm5paC5nb3Y=
†Present address: Kerry L. Hilligan, Malaghan Institute of Medical Research, Wellington, New Zealand
Disclaimer: All claims expressed in this article are solely those of the authors and do not necessarily represent those of their affiliated organizations, or those of the publisher, the editors and the reviewers. Any product that may be evaluated in this article or claim that may be made by its manufacturer is not guaranteed or endorsed by the publisher.
Research integrity at Frontiers
Learn more about the work of our research integrity team to safeguard the quality of each article we publish.