
94% of researchers rate our articles as excellent or good
Learn more about the work of our research integrity team to safeguard the quality of each article we publish.
Find out more
ORIGINAL RESEARCH article
Front. Immunol., 27 July 2023
Sec. Parasite Immunology
Volume 14 - 2023 | https://doi.org/10.3389/fimmu.2023.1224591
This article is part of the Research TopicMolecular Mechanisms of the Host Immune Response to Toxoplasma gondii InfectionView all 4 articles
 Franziska Hildebrandt1*‡
 Mubasher Mohammed1‡
 Alexis Dziedziech1,2†‡
 Amol K. Bhandage1†‡
 Anna-Maria Divne3
 Fredrik Barrenäs1
 Antonio Barragan1‡
 Johan Henriksson4‡
 Johan Ankarklev1,3*‡
Dendritic cells and macrophages are integral parts of the innate immune system and gatekeepers against infection. The protozoan pathogen, Toxoplasma gondii, is known to hijack host immune cells and modulate their immune response, making it a compelling model to study host-pathogen interactions. Here we utilize single cell Dual RNA-seq to parse out heterogeneous transcription of mouse bone marrow-derived dendritic cells (BMDCs) infected with two distinct genotypes of T. gondii parasites, over multiple time points post infection. We show that the BMDCs elicit differential responses towards T. gondii infection and that the two parasite lineages distinctly manipulate subpopulations of infected BMDCs. Co-expression networks define host and parasite genes, with implications for modulation of host immunity. Integrative analysis validates previously established immune pathways and additionally, suggests novel candidate genes involved in host-pathogen interactions. Altogether, this study provides a comprehensive resource for characterizing host-pathogen interplay at high-resolution.
Infection dynamics are determined by the interactions between an infectious agent, such as viruses, bacteria and parasites and their respective host. The host cells are required to recognize and respond to the intruder through activation of the immune system, while the invading microbes have evolved multiple strategies to ensure their survival, including evasion of the host’s immune response. Many obligate intracellular microorganisms are found to alter the cellular expression programs of infected and surrounding cells to actively evade immunity, scavenge nutrients and establish chronic infection or dormancy states within the host. Conversely, host cells have developed numerous protective mechanisms to prevent the establishment of different pathogens (1). Host cell responses can be unique among different host cell types but also towards different types or sub-types of pathogens.
The mammalian immune system heavily relies on innate immune sensors important in microbial detection (2). These sensors are commonly referred to as pattern recognition receptors (PRRs) and include a variety of different receptor types with the ability to recognize a wide-range of pathogen associated molecular Patterns (PAMPs). The most prominent PRR family comprises Toll-like receptors (TLRs), which can be present in the extracellular- or endosomal membrane of innate immune cells (3, 4). Two cell types of importance are the dendritic cells (DCs) and macrophages, which both present antigens to the adaptive immune cells upon recognition of a pathogen. DCs and macrophages are among the first responders to an infection as part of the mononuclear phagocyte system (5).Both cell types share the ability to produce cytokines upon stimulation leading to the initiation of an immune response. DCs have superior antigen presenting capacities and migrate to secondary lymphoid organs where they present antigen to naive T cells, resulting in their activation. macrophages on the other hand are considered general effector cells, presenting antigen at the site of infection and are primarily known for their role in phagocytosis and production of anti-inflammatory cytokines (6–8).
Distinct subtypes of bone marrow-derived DCs (BMDCs) have been described, including cells which display expression profiles characteristic of macrophages. In fact, Helft and colleagues used a sophisticated FACS approach for enrichment of subpopulation followed by gene expression analysis, to define that CD11c+ BMDCs comprise a heterogeneous population of macrophages and DCs (9). These subtypes have also been shown to display specific functions in response to particular pathogens or pathogen derived factors (5, 9, 10). For example, LPS was found to elicit a bimodal transcriptional response in two subpopulations of BMDCs (9, 10).
Certain intracellular parasites have become highly successful in transmission and in establishing chronic infection, as evidenced by their global prevalence. However, the understanding of the dynamics of host-pathogen interactions among these parasites remains fragmented. The extent of heterogeneity within BMDCs and other immune cell populations in their steady-state and in response to pathogens who are known immune modulators, such as T. gondii, has yet to be explored extensively at cellular resolution.
Toxoplasma gondii belongs to the Apicomplexan phylum including more than 4500 species of obligate intracellular, parasitic protozoa (11). Uniquely, T. gondii demonstrates the highest prevalence of infection among all known parasitic diseases of humankind, where one third of the human population is estimated to be infected (12). Infection occurs by ingestion of undercooked meat containing parasite cysts or via consumption of contaminated food or water containing oocysts originating from feline feces (13, 14). The majority of individuals infected with Toxoplasma are asymptomatic. However, vulnerable individuals including the immunocompromised, pregnant women and children born from an infected mother, can experience severe or even lethal disease in the form of disseminated or latent infections or cerebral toxoplasmosis (14).
An active infection is typically characterized by rapidly replicating tachyzoites, able to invade any nucleated host cell. The interaction between parasite-secreted proteins from organelles such as rhoptries, micronemes and dense granules within the apical complex and host adhesion receptors, for example host β-tubulin, galactose-containing carbohydrate ligands or sialic acids, aid in the invasion process (15, 16). Extensive and continuous replication of intracellular tachyzoites eventually leads to the disruption of the host cell. Thereafter parasites invade surrounding cells or disseminate to other areas of the body, even crossing barriers into the placenta or the brain (17).
DCs and macrophages, which are enriched in the intestinal lamina propria and the Peyer’s patches are the first responding immune cells towards incoming Toxoplasma parasites (18). The parasite can modulate the migratory behavior (19–22) or the immune response of infected macrophages and DCs for example to migrate to distant organs, including the brain. There, the parasite can then establish chronic infection through the formation of bradyzoites (23).
Across Europe and North America, the predominant infecting clonal lineages, i.e. T. gondii subpopulations which are related by descent, are commonly separated into type I, type II and type III parasites (24). They are not considered true species as sexual recombination, albeit infrequently, may occur between them (25, 26). These clonal lineages show differential correlations with disease progression and outcome in both mice and humans (25, 27). Type I parasites, as opposed to type II or type III parasites, cause lethal virulence in mice (27). In contrast, type II parasites disseminate more effectively due to increased hypermotility and longer migratory distances in infected leukocytes, possibly giving them an advantage in the development of chronic infection (28). Further, clonal lineages display differences in macrophage activation, with type II parasites activating classical immune activation, while type I and type III parasites induce alternative macrophage activation (29).
Previous characterization of transcriptional changes upon infection with T. gondii was integral to gain insight in the host-response. However, current publicly available data is mostly limited to population-wide bulk RNA sequencing (30, 31) of the host or in tandem with the parasite (32) as well as single cell RNA sequencing data of the host alone (33). Single cell dual sequencing (sc-DualSeq) enables dissecting and deciphering molecular population heterogeneity during highly dynamic interactions of an active infection (34, 35). The applicability of sc-DualSeq and the relevance of heterogeneity in infection dynamics was recently demonstrated in T. gondii infected monocytes (36) and human foreskin fibroblasts (37). However, an exhaustive image of host-pathogen interactions between different T. gondii clonal lineages and murine leukocytes on the transcriptional level and in single cells over other relevant time points has yet to be described.
In this study we aim to parse out the heterogeneity of complex host-parasite interplay by implementing scDual-seq to explore the interactions between murine BMDCs infected with type I and II T. gondii parasites over time, to identify inter-species co-expression networks.
We further aim to uncover underlying factors of heterogeneity in the host cell population beyond inherent stochasticity of gene expression, such as hidden cell subtypes and the effects of parasite secretion of effector molecules on the host cell. Additionally, we aim to create a computational resource to compare transcriptional responses in host-pathogen complexes, with the ambition of enabling the broader infection and immunology community to explore similarities between gene expression profiles in response to T. gondii infection and other host-pathogen interactions. This may include but is not limited to other protozoan pathogens, such as Plasmodium spp, Cryptosporidum spp, and Leishmania spp.
We recovered transcripts of host and pathogen signatures from individual BMDCs infected with two different strains of T. gondii parasites: T. gondii PTG (ME49-PTG, clonal type II) and T. gondii LDM (RH-LDM, clonal type I) at 3 and 12 hours post infection (hpi). Between these time points, the parasites undergo at least one cycle of endodyogeny, a specialized replication mechanism of T. gondii tachyzoites (38), leading to two or four parasites within each host cell at 12 hpi. Given that parasite lysate, consists of inactive parasites, the ability of active invasion and intracellular host cell modulation over time is lost, we only collected data for all controls at 3 hpi (Figure 1A).
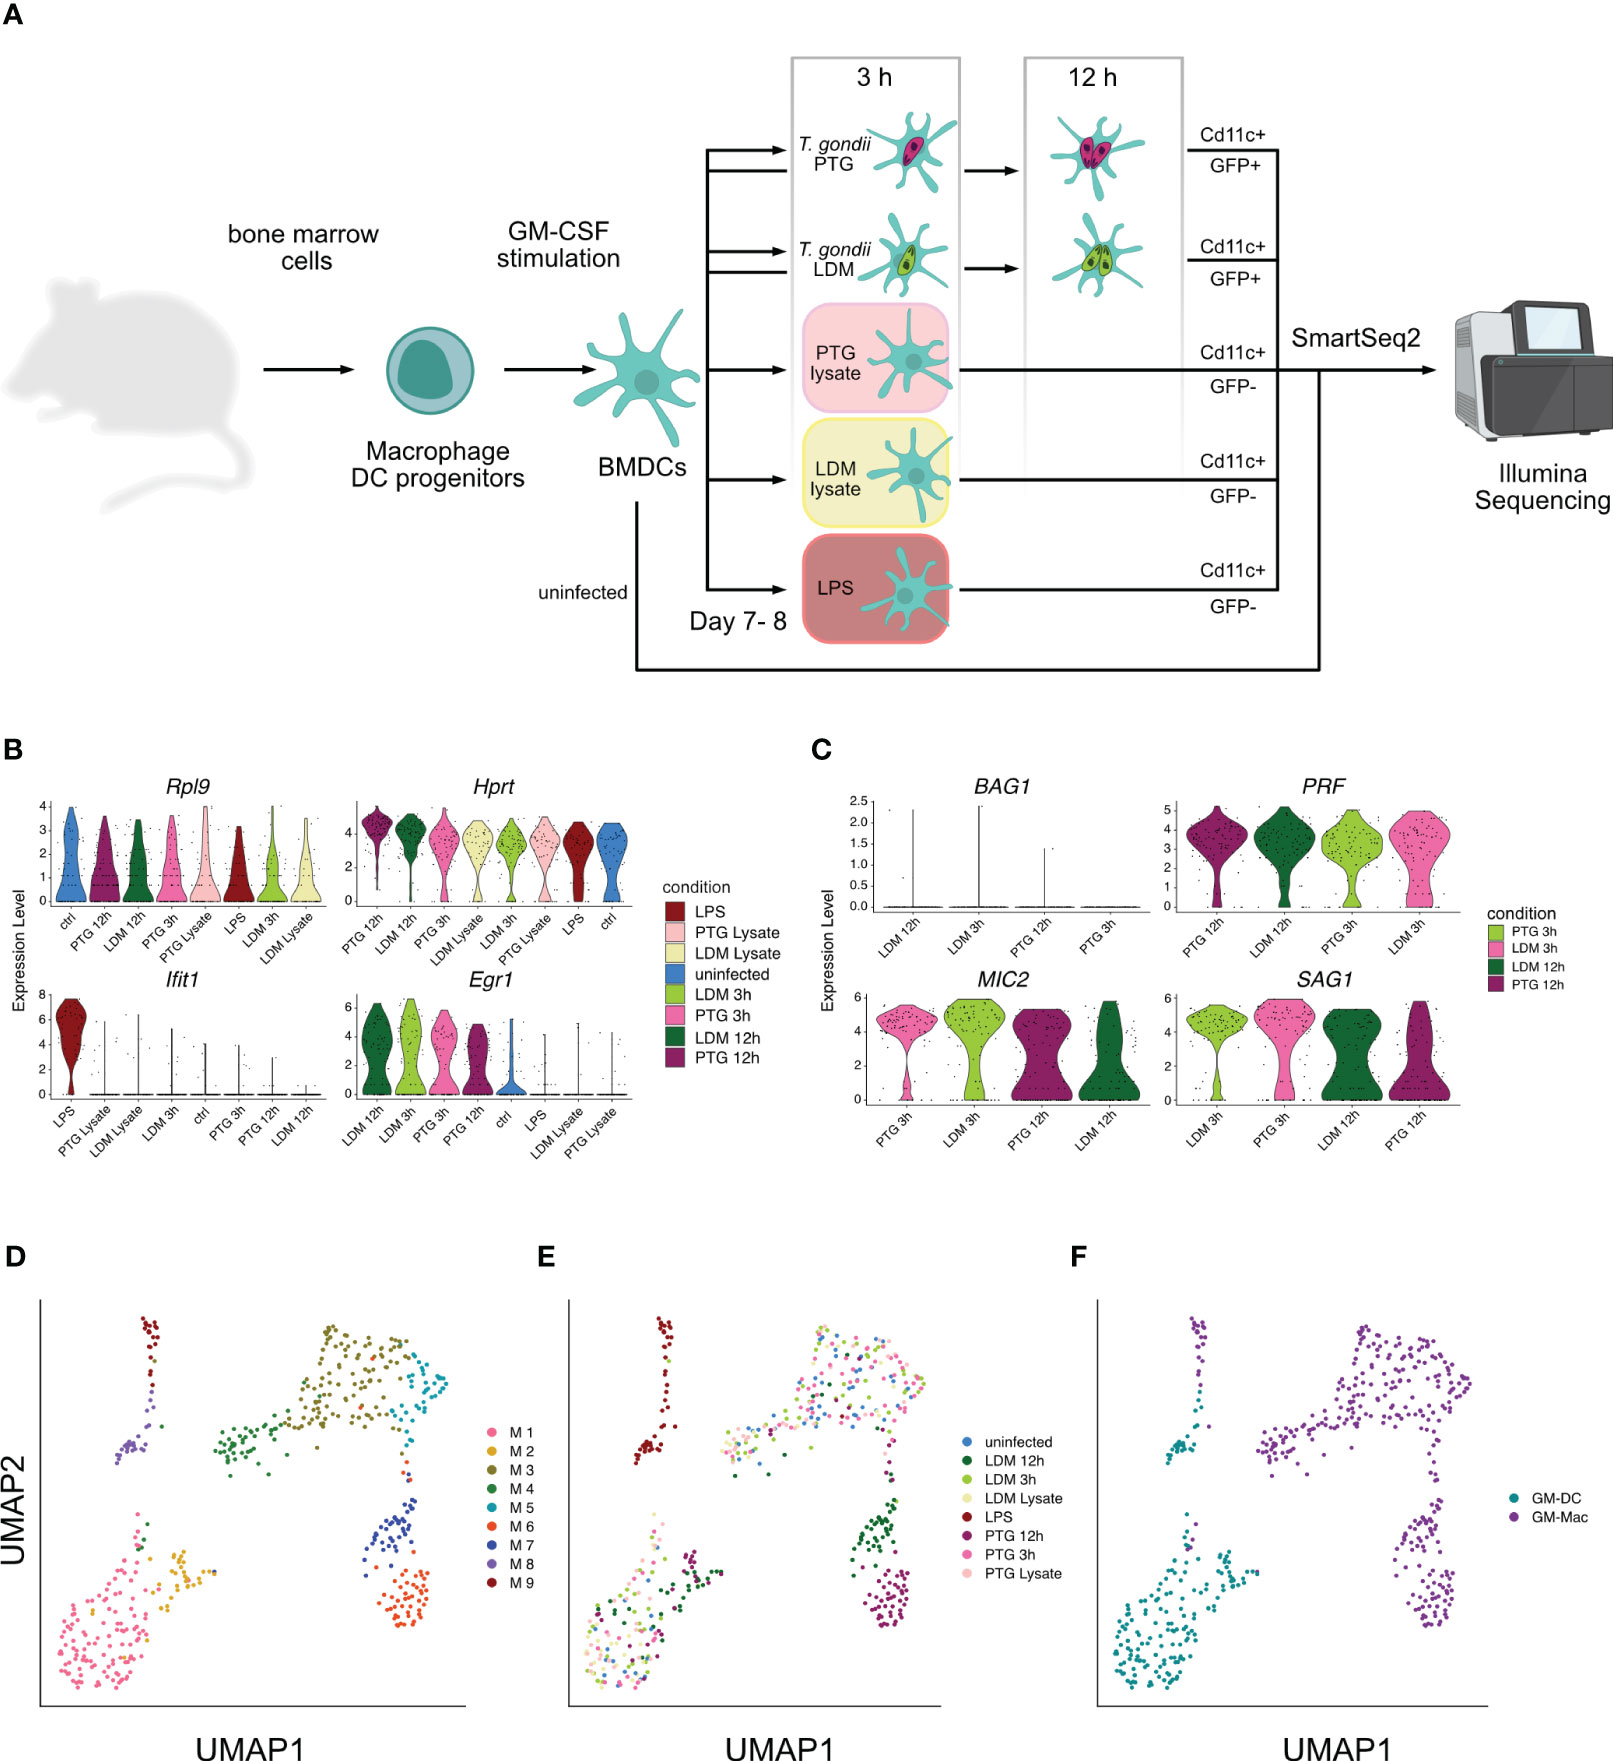
Figure 1 Transcriptional analysis of Toxoplasma BMDC infection at the single cell level. (A) Schematic overview of study design and biological significance. Primary BMDCs were collected, activated and infected with T. gondii LDM (LDM) and PTG (PTG) for 3 and 12 hours. Heat-inactivated lysates and LPS served as controls. Cells were then sorted based on GFP+ fluorescence from the parasite and presence of the CD11C-PE-Cy7 surface marker and subjected to scRNA-seq and subsequent analysis. In part created with https://www.biorender.com/. (B) Distribution of expression levels across infection conditions of selected mouse marker genes ordered by expression levels from highest to lowest. (C) Distribution of selected T. gondii markers across original conditions ordered by expression levels from highest to lowest. (D) UMAP projection of single cells colored by identified clusters from graph-based clustering. (E) UMAP projection of single cells colored by infection condition. (F) UMAP projection of single cells colored by infected host cell type.
The majority of reads originated from host transcripts across all cells and T. gondii PTG transcripts decrease between 3 and 12 hpi, as opposed to an increase of transcripts for LDM parasites. This indicates time-dependent differences in general transcriptional activity between strains (Supplementary Figure 1).
To validate our approach, we inspected the distribution of established host- and parasite marker genes across conditions. Housekeeping genes Rpl9 and Hprt (39, 40) show equal expression levels across all conditions and cells. Ifit1, a marker for immune response to LPS infection in macrophages (41), is upregulated in LPS-stimulated cells but not in T. gondii infected cells. Conversely, only cells infected with T. gondii sustain previously reported high levels of Egr1 expression (42), independent of their clonal lineage (Figure 1B).
The expression of the T. gondii marker gene, BAG1, exclusively expressed in bradyzoite stages (43), showed no upregulation in our data. PRF, essential for gliding motility, invasion and exit from host cells (44), shows increased expression in the late stages of T. gondii tachyzoites. MIC2 and SAG1, two other T. gondii genes expressing proteins essential for invasion, virulence and host cell binding (45, 46), showed expression across all infection conditions, peaking at early time points (Figure 1C). The observed expression of these established host and T. gondii marker genes in all cells of their respective condition justifies the number of cells used here, to investigate host-pathogen interactions.
For each infected cell, we retrieved expression data from the host and the parasite. We then isolated expression values of the host and the parasite to analyze them individually. Unsupervised clustering of the host data resulted in 9 clusters (M1 - M9) across all conditions (Figure 1D). Comparing the cluster annotations of cells to the experimental conditions in a UMAP embedding, showed that cluster M8 and M9 were comprised of only LPS activated cells, while cluster M2 and M6-M7 were comprised of almost exclusively T. gondii infected cells from 12 hpi which included both strains (LDM and PTG). Interestingly, we found uniform distribution of cells 3 hpi, uninfected cells and lysate cells challenged across the remaining clusters (M1 and M3-M5) (Figures 1D, E; Supplementary Figure 2).
Further, we observed four clearly separated groups of cells, including clusters M1-M2, M3-M5, M6-M7 and M8-M9, suggesting clear transcriptional differences between them (Figure 1D). Single cell studies have previously enabled the investigation of bimodality in the expression of seemingly homogenous BMDC populations (9, 10). Helft and colleagues suggest that murine bone marrow cells cultivated with granulocyte-macrophage colony-stimulating factor (GM-CSF), results in a heterogeneous population of CD11c+ MHCII+ macrophages (GM-Macs) and dendritic cells (GM-DCs) (9). With Helft et al. as our reference, we were able to classify clusters M1-M2 and cluster M8 as GM-DCs and the remaining murine clusters M3-M7 and M9 as being predominantly composed of GM-Macs (Figure 1F, Supplementary Figure 3, Supplementary Data 1). The majority of late stage infected (12 hpi) cells can be divided into three major clusters: I) M2, containing a mixture of LDM and PTG infected GM-DCs, II) M6, containing exclusively PTG infected GM-Macs and III) M7, containing exclusively LDM infected GM-Macs (Figure 1E, F). This indicates that different clonal lineages of T. gondii elicit different host responses in GM-Macs but not in GM-DCs at 12 hpi in vitro.
Parsing out the different transcriptional host responses of the cell subtypes across the 3 cluster groups highlighted above, we first performed a Differential Gene Expression Analysis (DGEA) between clusters M6 (PTG at 12 hpi) and M7 (LDM at 12 hpi), composed of GM-Macs. We then compared expression profiles of differentially expressed marker genes between M6 and M7 across the 3 clusters (M2, M6 and M7). Interestingly transcriptional profiles of M2 cells (GM-DCs) were more similar to cluster M7 (Figure 2A). Gene Ontology (GO) term enrichment revealed that genes upregulated in M6 (PTG at 12 hpi) are involved in the formation of complex signal transduction networks that activate innate immunity and inflammation (47) by the induction of immune mediators (48), Pattern Recognition Receptors (PRRs) (49), the JAK/STAT pathway (50), NF-κB signaling (51), and inflammasome activation (52). Conversely, the majority of genes upregulated in M7 (LDM at 12 hpi) are involved in the limitation of the immune and inflammatory response (53–56) and genes exhibiting balancing effects on pro- and anti-inflammatory signals (Rip2k, Pparg) (57–59).
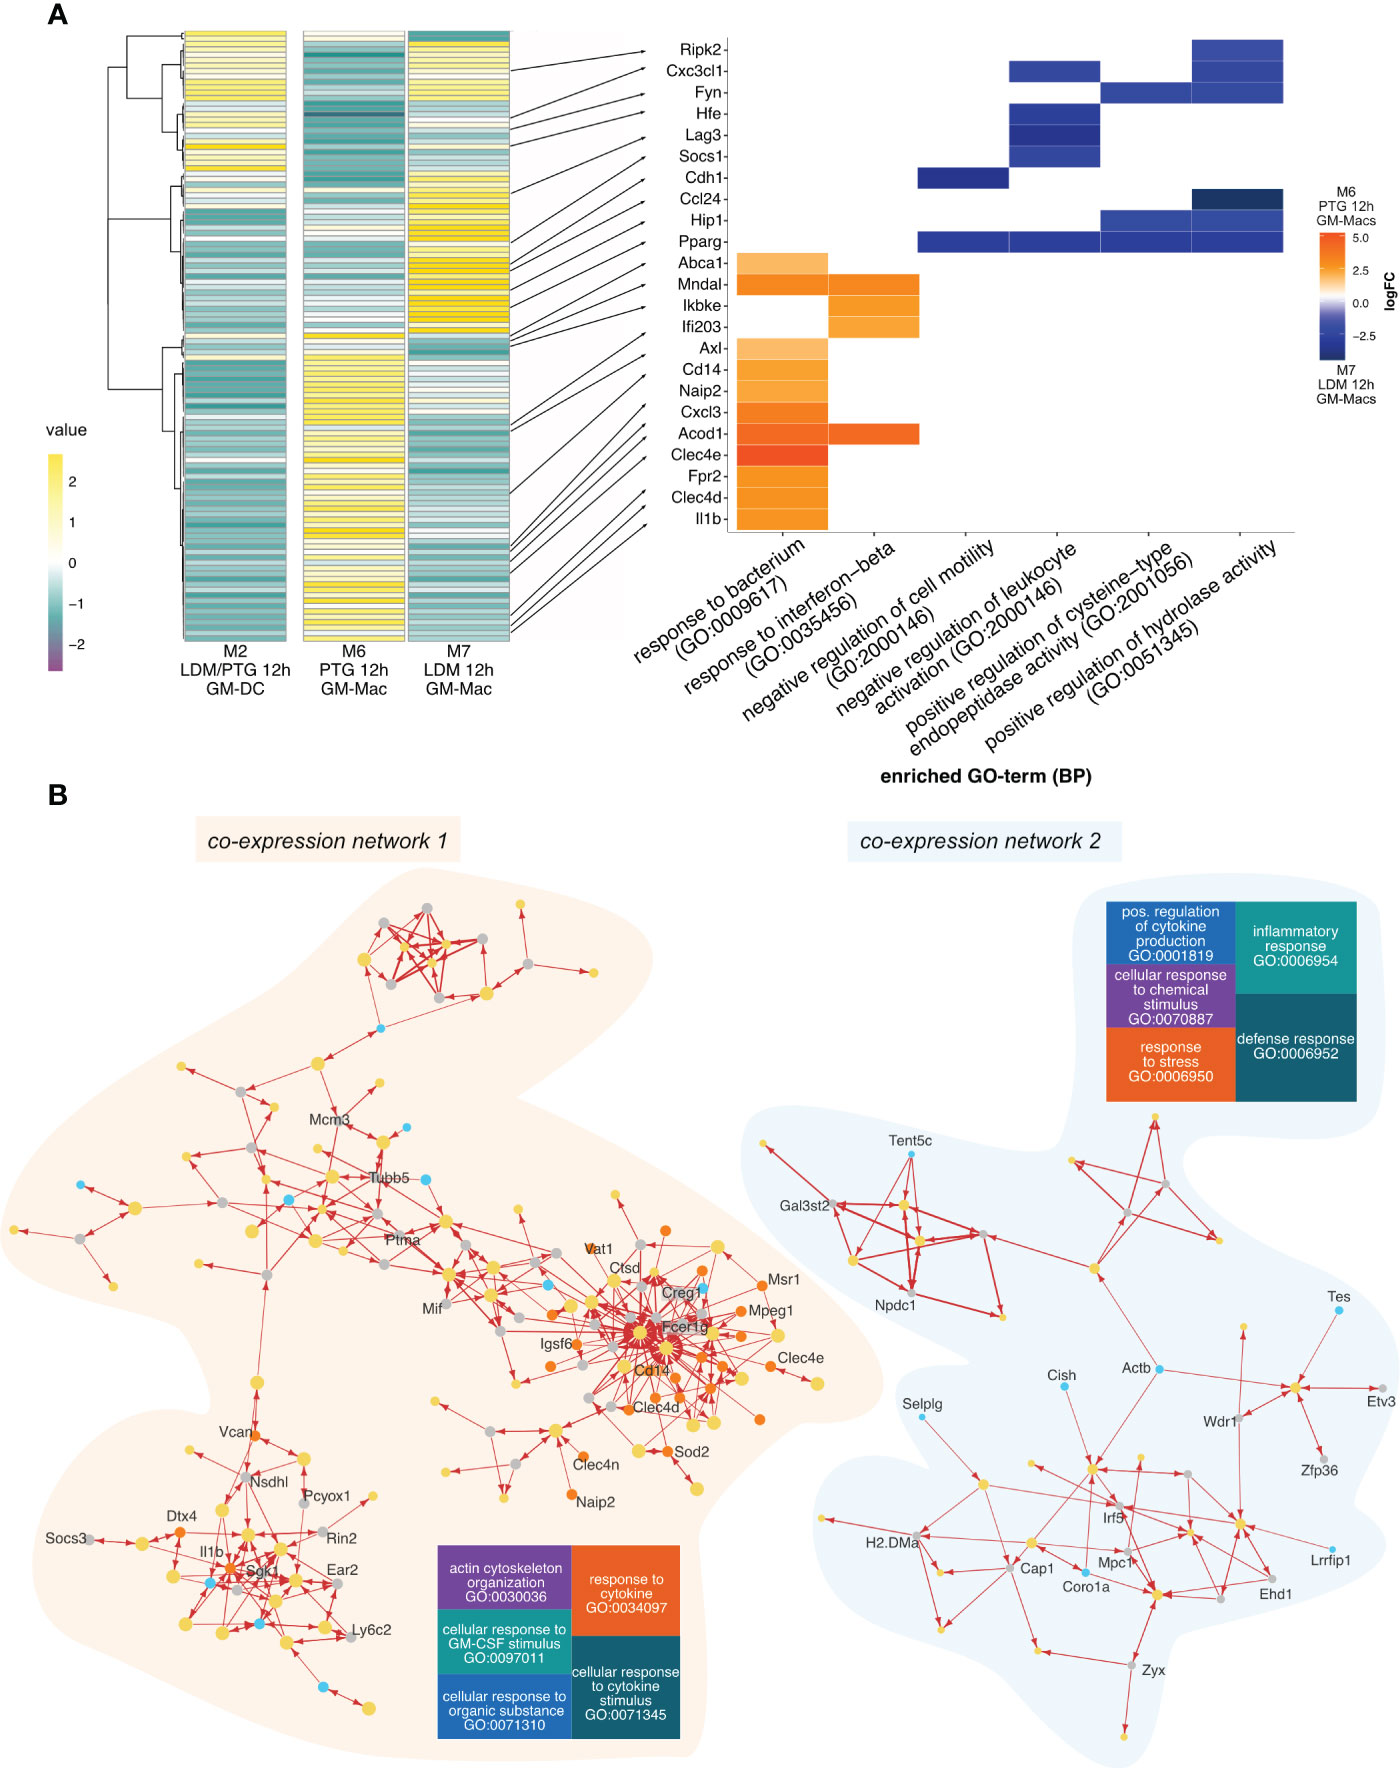
Figure 2 Gene expression and inter-species co-expression patterns of PTG and LDM infected BMDCs 12h post infection. (A) Heatmap of differentially expressed genes between cluster M6 (mainly GM-Macs containing PTG infected cells 12 hpi) cluster M7 (mainly GM-Macs containing LDM infected cells 12 hpi) across all clusters containing 12 hpi cells, including cluster M2 (mainly containing GM-DCs infected with both, LDM and PTG for 12h) (left panel). Average expression values (values) are depicted in a color scale from negative expression (purple, dark) to positive expression (yellow, light). The right panel depicts a heatplot of the logFC of selected genes (indicated with a black arrow) differentially expressed genes between the investigated groups (M6 and M7) and biological processes (GO). Positive values (orange) indicate upregulation in cluster M6 (PTG, 12 hpi). Negative values (blue) indicate upregulation in cluster M7 (LDM, 12 hpi). (B) Gene co-expression network of differentially expressed genes of cluster M6 (left panel) and M7 (right panel). Nodes represent genes with size representing weight. Node colors indicate gene source, with M7 marker genes in turquoise, M6 genes in orange, T. gondii genes in yellow and remaining M. musculus genes in gray. Arrows indicate the direction of co-expression. Increased arrow width indicates higher correlation value. Tree plots show the most highly enriched biological processes of the host. The size of each square represents the enrichment of each term, with larger squares exhibiting higher enrichment.
In line with previous reports, clusters consisting of cells infected with T. gondii for 12h, irrespective of cell type or clonal lineage, expressed an S-phase cell cycle signature (60, 61) (Supplementary Figure 4). This was further validated by expression of prominent cell cycle regulators, resembling an S-Phase regulatory state in late stage infected cell clusters (Supplementary Figure 5). Together with the effects on expression of immune genes this observation highlights the ability of T. gondii to modulate gene expression of multiple independent pathways simultaneously.
Co-expression networks identify which genes tend to show coordinated expression, enabling the identification of potential regulatory genes. To investigate co-expression networks between T. gondii and host genes across single cells, we identified co-expressed T. gondii genes and genes of cluster M6 or M7 using a correlation-based approach.
The network analysis revealed several co-expression clusters of variable size (Supplementary Figure 6). For simplicity, we selected the two largest clusters, containing the highest numbers of M6 upregulated genes (network 1) or M7 upregulated genes (network 2) for further analysis (Figure 2B; Supplementary Data 3). We observed a higher degree of connectivity for network 1 compared to network 2, indicating differential effects of infection on the gene expression program between cells infected with PTG (M6) and LDM (M7) parasites.
Overall, host genes present in interaction network 1 are predominantly involved in cytokine response and stimulation (GO:0034097, GO:0071345) and to a lesser extent, in cellular response to organic substances, GM-CSF stimulation and actin cytoskeleton organization (GO:0071310, GO:0097011, GO:0030038) (Figure 2B). We also observed co-expression of several marker genes from cluster M6, including Clec4d, Clec4e, Cd14 and Mpeg1 with a small set of T. gondii genes (Figure 2B). Based on the involvement of these host genes on immune related processes we speculate that the expression of a specific, small set of T. gondii genes of network 1 may be sufficient to modulate some of these processes.
Most genes of network 2 are involved in defense and inflammatory response (GO:0006952, GO:0006954), response to stress, cellular response to chemical stimulus and positive regulation of cytokine production (GO:0006950, GO:0070997, GO:0001819). Host genes in network 2 included Tes, Tent5c, Coro1a, Selp1g as well as Cish, H2-Dma and Lrrfip1. These genes are involved in partially opposing functions for inflammatory and immune responses as well as proliferation and tumor suppression (62, 63).
We continued to investigate parasite genes co-expressed in each network elucidating on coordinated gene expression between the host and parasite. We used an additional correlation-based approach to expand the number of co-expressed T. gondii genes involved in coordinating gene expression of network 1 (characterized by PTG parasite infection) and network 2 ((characterized by LDM parasite infection). In brief, we selected T. gondii genes showing positive or negative correlation with T. gondii genes found in network 1 or network 2. To reduce the potentially masking effects caused by differences in expression of replication genes of the parasite, we excluded genes of the S/M and G1 sub-transcriptome described using published bulk data (64). This analysis resulted in the generation of the expanded set of co-expressed T. gondii genes of network 1 (ETGN1) and the expanded set of co-expressed T. gondii genes of network 2 (ETGN 2).
We observed that the majority of genes of ETGN1 exhibited positive correlation with each other and only a few anti-correlated genes. ETGN2 comprised fewer genes which showed correlation to T. gondii genes of network 2, when compared to the number of correlated T. gondii genes of network1. However, all genes of ETGN2 exhibited positive correlation with one another, indicating these genes tend to be expressed together (Figure 3A, Supplementary Figures 7-8, Supplementary Data 4-6).

Figure 3 T. gondii differential transcription of clonal lineages during infection progression in BMDCs. (A) Visualization of Pearson correlation coefficients between genes in extended T. gondii networks (ETGNs). For ETGN 1 (left, orange bar) and ETGN2 (right, blue bar). Correlation values are shown in a gradient from most negative values in dark purple to most positive values in yellow (light). (B) Gene set enrichment of T. gondii genes from correlation analysis shown in a) for ETGN 1 (left, orange) and interaction ETGN2 (right, blue). The top panel shows enriched functions and the bottom shows enriched processes.
The majority of genes in ETGN 1 (PTG, 12h) belongs to the group of ribosomal proteins. We observed highest correlation values between ribosomal protein genes and genes important for the inner membrane complex of T. gondii. We observed a negative correlation between two members of the SRS (SAG1-related sequences) superfamily, namely SAG1 and SRS2, and the majority of the remaining ETGN 1 genes. SRS proteins have been linked to host cell attachment and activation of host immunity to regulate virulence (65). Our observations indicate that ribosomal protein genes and SAG-related sequences may fulfill opposite tasks in the parasites (Figure 3A, Supplementary Figure 7, Supplementary Data 4-5).
In agreement with the observed correlations of a high number of genes encoding ribosomal proteins, we found high enrichment of structural constituents of ribosome and RNA-/5s rRNA binding function as well as translation processes. Together with the high enrichment of energy metabolism related processes and functions, this may indicate that the PTG parasite’s increased energy expenditure is necessary for survival and the potential preparation for stage differentiation processes such as the formation of bradyzoites (Figure 3B).
ETGN 2 (LDM, 12h) is characterized by positive correlation between dense granule (GRA12, GRA3, GRA2, GRA7) and microneme (MIC1, MIC11, MIC5, MIC2, SUB1) (45, 66) associated genes. Conversely to ETGN 1, we found that SAG1 exhibited positive correlation with the remaining genes of ETGN 2 (Figure 3A, Supplementary Figure 8, Supplementary Data 4 + 6).
We observed enrichment of the GO terms for metabolic processes and functions, indicating that the LDM strain, which is overrepresented in ETGN 2, upregulates the macrophage energy metabolism more efficiently when compared to the PTG strain. This may indicate that LDM parasites change the macrophage environment more effectively in the favor of their growth and replication by scavenging essential nutrients from the host which are being produced at higher rates upon infection. Despite being defined as obsolete, we found it appropriate to highlight the term “obsolete pathogenesis” given its enrichment in more virulent LDM parasites. Suggesting this term may be related to virulence or host-pathogen interactions (Figure 3B).
We sought to provide further detail on how the parasite modulates its gene expression in response to the host investigating exclusively T. gondii gene expression. In contrast to the infected host cells, T. gondii parasites were actively replicating.Therefore, we assigned cell cycle stages (S/M or G1) across all cells, using previously described sub-transcriptomes (64) and regressed the cell cycle out of our dataset, resulting in 5 clusters (Tg1-5) across infection conditions (Figure 4A, B; Supplementary Figure 9).

Figure 4 T. gondii gene expression profiles and differential association with subcellular localisation across parasite and host clusters. (A) UMAP projection of T. gondii infected cells grouped by identified cluster. (B) UMAP projection of T. gondii infected cells grouped by condition. (C) Proportion of cells of each original infection condition (left) associated with each identified cluster (right). The color of the ribbon refers to the original condition. The color of the right bar indicates the cluster association (Tg1-Tg5). (D) Cube root transformed Fraction of marker genes of identified T. gondii clusters encoding proteins located to different localizations in T. gondii identified previously using hyperLOPIT (67). The size of each dot refers to the non-transformed fraction of differentially expressed genes to each location on the y-axis. (E) Heatmap depicting differentially expressed T. gondii genes grouped by T. gondii clusters (Tg1- Tg5) across host clusters exhibiting infection (M1-M7). For each T. gondii cluster, genes of the highest fraction of intracellular localization were selected for comparison. T. gondii clusters are represented in the colors selected for each cluster. Cell type annotations of host clusters are indicated by turquoise (GM-DC) and purple (GM-Mac). Averaged gene expression is shown in a color gradient from low expression (dark purple) to high expression (yellow).
When comparing the infection conditions with the identified clusters, we show that cluster Tg 1 is characterized by PTG specific expression. Cluster Tg 2, similar to Tg 5, is characterized by the presence of parasites of both strains and timepoints. Tg 3 mainly consisted of parasites from 12 hpi, while Tg 4 consisted mainly of LDM parasites (Figure 4C).
To further define what is driving the differences between parasites within each cluster, we investigated whether they express organelle-specific genes by comparing our gene expression results to spatially resolved proteome data on the subcellular level (67) (Figure 4D). While transcription data presented here does not equal protein expression and subsequent effector activity, comparison with spatially resolved proteomics data may give an indication about what processes the parasites are preparing for, providing a glimpse into the future of the parasite’s development.
Clusters Tg1 and Tg4 showed the highest fraction of genes belonging to dense granules. Across clusters containing mixed parasite populations, Tg2 exhibits the highest fraction of genes located to the nucleus, the cytosol and the 60S ribosome as well as unknown localization. Tg3 shows similar distributions of genes across localizations as Tg 1, with higher fractions within the apicoplast and the ER (Figure 4D). Tg 5 generally shows the highest number of upregulated genes across all T. gondii clusters, (Supplementary Figure 10; Supplementary Data 7) with the majority associated with rhoptries (Figure 4D; Supplementary Data 8). Rhoptry proteins, located in the apical region of the parasite, fulfill multiple roles for virulence, host cell invasion and potentially parasitophorous vacuole formation as well as manipulation of host response (68–70). The observed differences indicate that parasites within each cluster undergo or prepare themselves for different processes during infection, for example invasion, egress, stage differentiation or immune evasion and virulence.
We further examined the relationship between parasite clusters (Tg 1-5) and their gene expression profiles and T. gondii infected host cell clusters (M1-7). We observed obvious differences in T. gondii expression profiles for markers across host clusters (Figure 4E; Supplementary Figures 11, 12). For instance, different sets of dense granule genes between Tg 1 (PTG) and Tg 4 (LDM) showed inverse expression in clusters M6 (PTG 12 hpi) and M7 (LDM 12 hpi) (Figure 4E). In addition to observed differences between known subtypes of host cell types (GM-DCs and GM-Macs), we observed downregulation of all rhoptry and other location markers in host cell cluster M5 (Figure 4E).
Our findings suggest that T. gondii LDM (LDM) and PTG (PTG) provoke differential host cell responses primarily in GM-Macs and that an extended network of T. gondii specific genes are involved in these host-pathogen interactions at the single cell level. Beyond, we wanted to explore which innate immune responses are involved in the differential reactions of the two clonal lineages, comparing host responses to other common microorganisms.
We utilized RNA-seq data from a recent publication by Pandey and colleagues in which they studied the immune response towards seven common microbial signals in BMDCs (71). We observed the highest overlap in upregulated genes stimulated with CpG DNA type B (cpGB) and depleted zymosan, a β-glycan found in fungal cell walls, in macrophages and dendritic cells in both clonal lineages (Figure 5A). cpGB and zymosan are known to target TLR9 (73) or TLR2 and Dectin-1 (74). Further, we found cells infected with PTG parasites to exhibit higher overlap of expressed marker genes across most other microbial stimuli (Figure 5A). We found Igsf8 as the only shared marker gene between LPS stimulation and PTG parasite infection. Upon closer inspection, we find Igsf8 expression in both: PTG parasites and to a lesser extent in LDM infected cells. Overall we observed clear differences in expression based on cell type (GM-DC or GM-Mac), and higher expression for some genes in GM-Macs infected with PTG parasites (Figure 5B).
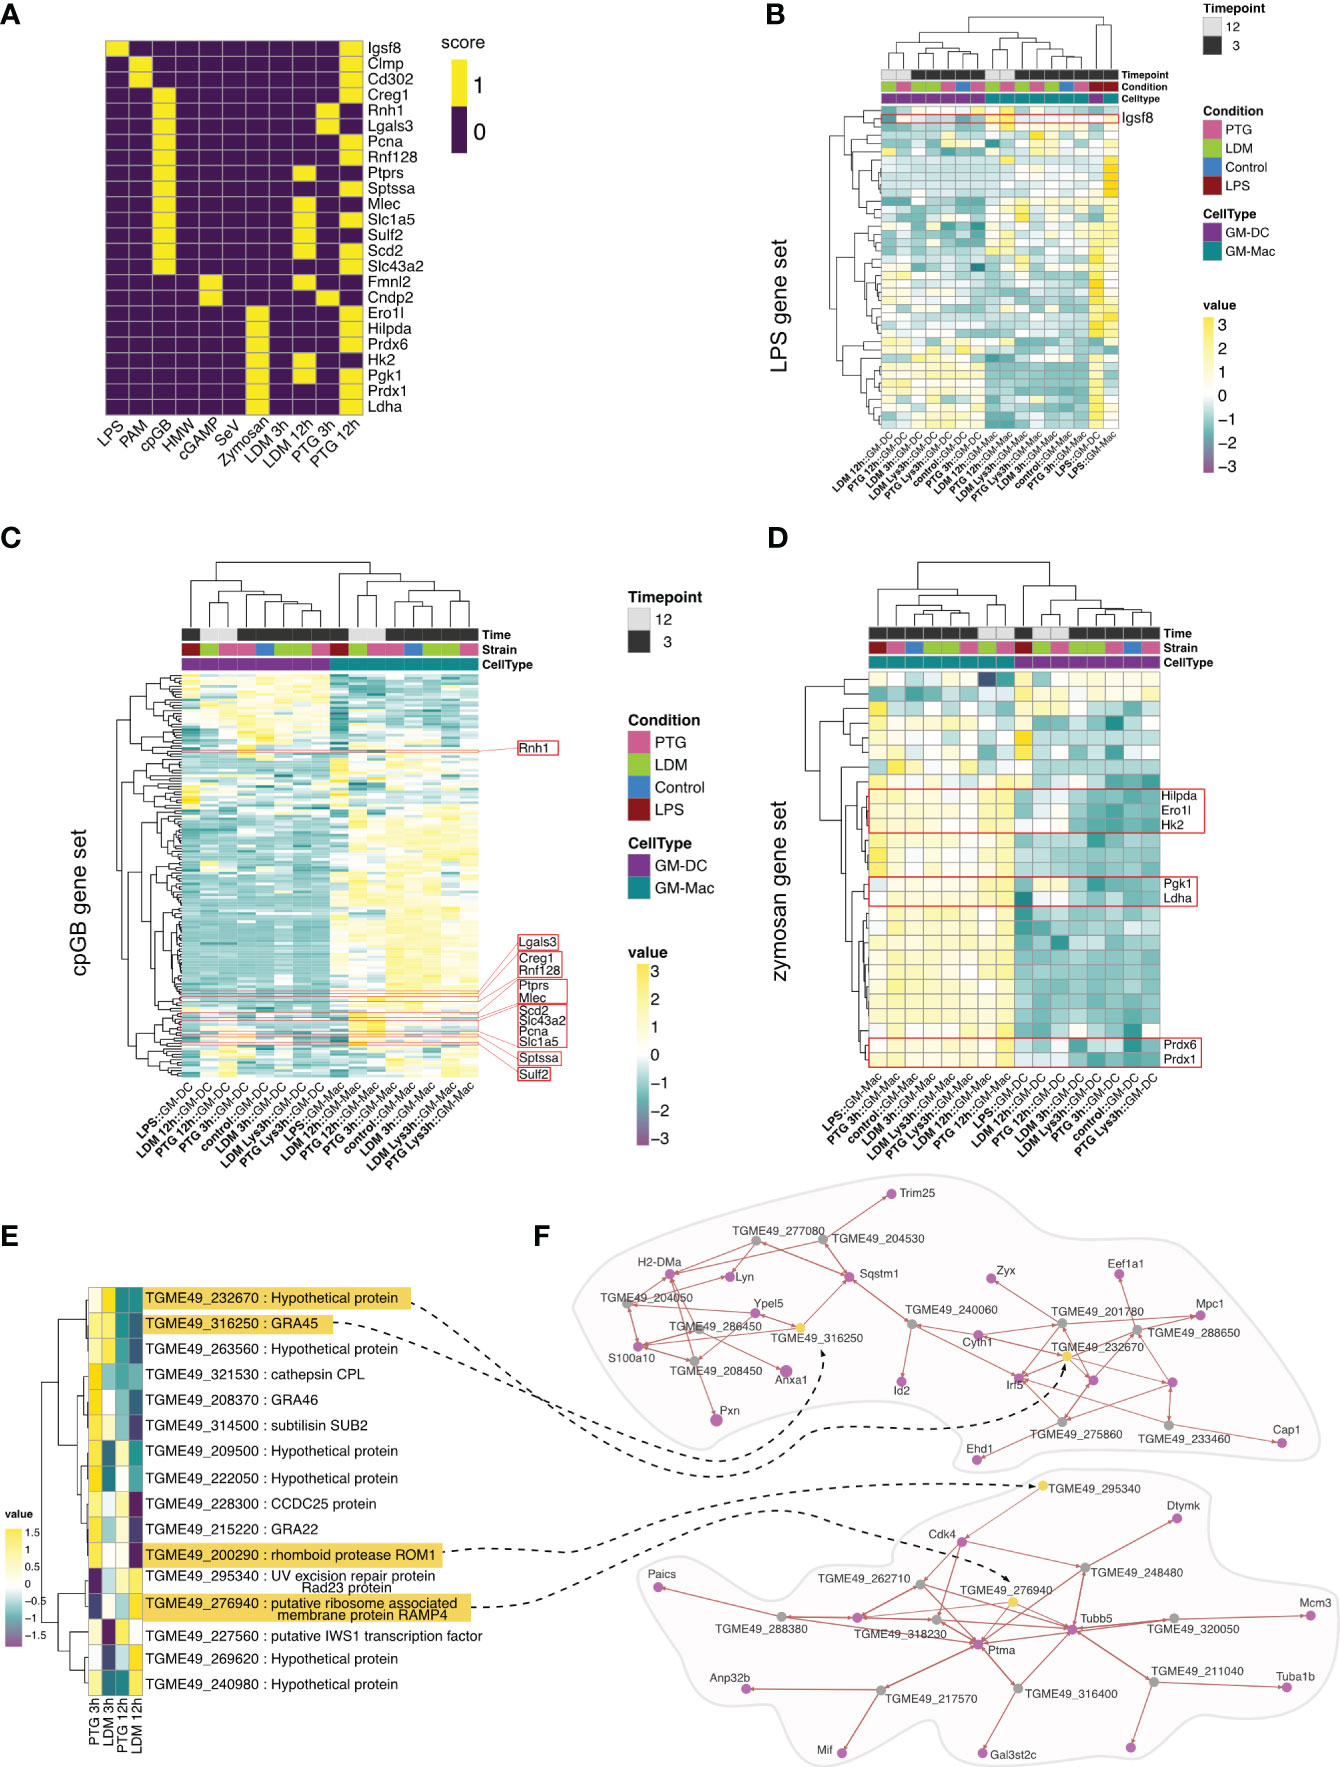
Figure 5 Cell type differentiation and comparative analysis of response to T. gondii infection with established PAMPs and T. gondii INFγ challenge. (A) Heatmap depicting commonly expressed genes between BMDCs exposed to established PAMPs (LPS, PAM, cpGB, HMW, cGAMP,SeV and Zymosan) and cells infected with T. gondii LDM and PTG for 3 or 12 hours. A score of 1 (yellow) indicates differential expression of the gene in the respective condition while a score of 0 indicates no differential expression. (B) Heatmap depicting expression of genes upregulated in LPS treated BMDCs (71), hierarchically clustered by condition in both cell types and gene expression. Expression values are shown in a gradient stretching from negative expression (dark purple) to positive expression (yellow). The red box highlights expressions of Igsf8. (C) Heatmap exhibiting gene expression values for previously identified cpGB signature and (D) zymosan signature. Shared marker genes between the reference signature (71) and our data are highlighted in red boxes. (E) Heatmap visualizing conducted comparative analysis between genes identified to be essential during INFγ stimulation in BMDMs (72) and their expression profiles in T. gondii infective states in our study (LDM and PTG infection 3 and 12 hpi). (F) Co-expression networks for essential T. gondii genes. Genes exhibiting correlation are connected with a black dashed arrow and highlighted in yellow. Correlating host genes are depicted as purple nodes. Remaining T. gondii genes are shown as gray nodes. The arrow indicates the direction of the correlation. Increased arrow width indicates higher correlation value.
For cpGB- and zymosan-stimulated BMDCs, we observed higher expression of genes in GM-Macs in comparison to GM-DCs, irrespective of infection. Of those genes that were shared between cpGB challenge and T. gondii infection, upregulation was more prominent in PTG infected cells (Figure 5C).
We then sought to use a similar approach to compare T. gondii expression in our cell population to other relevant cell population data. Therefore, we employed publicly available data from in vitro CRISPR-Cas9 screens of T. gondii genes comparing it to our dual-scSeq data. When we intersected T. gondii marker genes of our infected conditions with high confidence hits for “fitness under INFγ stress” identified by Wang et al. (72), we found the majority of intersecting genes to be upregulated in parasites 3 hpi, with PTG strains upregulating a higher number of genes compared to LDM strains. We also found genes TGME49_276940 and TGME49_269620, exclusively upregulated in LDM parasites 3 hpi or 12 hpi, respectively (Figure 5D).
To further characterize interactions between T. gondii INFγ stress marker genes and host genes, we generated co-expression networks, resulting in multiple networks of variable sizes (Supplementary Figure 13). For the two largest networks, we found GRA45 (TGME49_316250), upregulated in PTG parasites at 3 hpi, to be co-expressed with genes reported to be involved in regulation of innate immune response and inflammation (75, 76) or autophagy (77) (Figures 5E, F). Conversely, network genes upregulated in LDM parasites showed co-expression with genes involved in filamentation and pathogenesis (78, 79), respectively (Figure 5F).
In this study, we performed scDual-Seq of BMDCs infected with two phenotypically distinct clonal lineages of Toxoplasma gondii. We analyzed infection dynamics over two timepoints (3 and 12 hpi) during acute T. gondii infection and described expression patterns of individual populations of host cells in tandem with T. gondii gene expression. Information on heterogeneity of host-pathogen interactions was lost in previous bulk-RNA sequencing studies on T. gondii infected BMDCs. By using a scSeq approach we were able to show that the two investigated parasite lineages manipulate two subpopulations of infected BMDCs, namely, GM-Macs and GM-DCs differently (30–32).
Our data indicates that only the GM-Mac subpopulation at 12 hpi showed distinct differential expression profiles based on the infecting parasite strain, suggesting that they are either more susceptible to strain specific modulation by PTG and LDM parasites or that the GM-Mac subpopulation responds uniquely to different parasite strains. This highlights the importance of considering transcriptional heterogeneity of host-pathogen interactions, previously suggested by single cell studies on human monocytes infected with T. gondii parasites (36). Patir et al, investigate single-cell infection dynamics of human monocytes at 1 hpi, elaborating in detail on transcriptional heterogeneity and chemokine secretion. Our study significantly augments existing data on this important topic, by investigating transcriptional differences between different subpopulations of host cells infected with parasite strains of different genetic background and including the corresponding parasite expression dynamics.
Upregulation of genes associated with anti-inflammatory effects in LDM parasite infected GM-Macs as opposed to upregulation of a pro-inflammatory response in PTG infected cells is in agreement with previous studies in murine macrophage infections (30). The higher similarity of the gene expression signature of anti-inflammatory signals in GM-DCs infected with T. gondii parasites of the LDM as well as the PTG strain, suggests that the parasite exploits or even promotes immune tolerogenic capacities of infected DCs. DCs represent important regulators of the balance between tolerance and immunity, giving rise to large numbers of subtypes partially exhibiting immune tolerogenic phenotypes (80, 81). Moreover, stimulation with GM-CSF in BMDCs was shown to favor immune tolerogenic DC populations (82, 83). This suggests that, in addition to the reported manipulation of the migratory behavior of DCs promoting parasite dissemination (20), the parasite may be more efficient in generating a suitable environment for replication and survival in GM-DCs in comparison to GM-Macs. Conclusively, our observations highlight the importance of considering heterogeneity in host-pathogen interactions and prompt more detailed studies of the interactions between T. gondii and BMDCs, particularly GM-DCs.
We generated and examined co-expression networks of host- and parasite gene expression based on differential marker genes of cluster M6 (PTG, 12h) and M7 (LDM, 12h). We interpret the higher connectivity in network 1 to be indicative of an increased response to parasite expression in PTG parasites at 12 hpi in infected GM-Macs. Genes exhibiting strong correlation with only a few parasite genes within the network included C-type lectins Clec4d, Clec4e and Clec4n, important players in innate recognition of pathogens and interleukin production as well as phagocytosis of parasites in macrophages (48, 84, 85). Co-expression of these genes in network 1 may be crucial cues for the formation of bradyzoites in PTG parasites (86) as opposed to LDM parasites, which are less likely to form mature bradyzoites (87).
Genes within network 2 involved in immune system processes included genes with implications in host cell modulation of macrophages (88) or the restriction of effector T cell responses in acute viral infection (89). This supports the hypothesis that T. gondii LDM parasites modulate host cell responses and potentially limit them more effectively than PTG parasites. Apart from immune system related genes we also find a number of genes involved in tumor suppression including Tes (62) and Tent5c (63). This indicates that T. gondii LDM infection might have a more global effect on host cell proliferation and cell cycle dysregulation than reported so far.
The observed positive correlation between many genes encoding ribosomal proteins and a large number of host genes involved in energy expenditure, phagocytosis and inflammation in extended T. gondii network 1 (ETGN 1) suggests that the majority of parasites may express these genes in response to the pro-inflammatory immune response of the infected host cells. Moreover, the highly expressed ribosomal proteins may represent an interesting pool of potent targets for the innate immune system. For instance, ribosomal protein P2 has been previously identified as a target for protection against toxoplasmosis (90). Based on previous reports of the importance of MIC1, MIC2 and GRA2 for in effective immune evasion or virulence (45, 91, 92), T. gondii genes encoding secreted proteins in ETGN 2 likely belong to a network of genes with importance for these processes. Conclusively, while not providing causality or evidence for direct interactions, which is beyond the scope of this study, we consider our findings a valuable resource to investigate potential direct interactions between genes that correlate positively in expression in single cells for future functional studies on host-pathogen interactions.
Early stage parasites of both lineages showed expression of dense granules and micronemes, known to be important during cell adhesion and invasion of the parasite (93). Recent studies suggest that dense granules affect the behavior of host cells directly, as shown for altered cell-motility by GRA28 in infected macrophages (21).
The overall high fraction of dense granule genes at 3 hpi and the differential expression of these genes between LDM and PTG parasites further support the importance of dense granules for host-pathogen interactions and potential strain-specific host-cell modulation during the subsequent parasite development. Comparing the expression of location specific genes across host-cell clusters, we observed the absence of all genes encoding for rhoptry proteins in one sub-cluster of GM-Macs. Multiple rhoptries have been implicated in virulence and modification of host response, such as ROP16 and ROP18 (70, 94), indicating that parasites in this sub-cluster are less effective in establishing virulence, potentially being successfully targeted by the immune system. It is important to restate that transcription data presented here does not equal protein expression and subsequent effector activity. Therefore, our data draws an image of the potential future development of the parasite within a host-cell.
Comparing gene expression of T. gondii infected host cells to expression profiles of cells stimulated with a variety of PAMPs, we found the highest expression similarities to cpGB as well as zymosan stimulation, primarily in PTG infected GM-Macs 12 hpi. Zymosan stimulation results the secretion of pro-inflammatory cytokines (TNF-alpha, IL-8) and activation of the Dectin-1/Syk/NF-B signaling pathway, mediating an inflammatory response via TLR2 (95). CpG motifs lead to the activation of the NF-B-REl dependent innate pathway (96) via TLR9. T. gondii infection stimulates INF production and pro-inflammatory cytokine production in a Myeloid Differentiation factor 88 (MyD88) dependent manner. It is proposed that this pathway is mainly activated through stimulation of TLR11 (44, 97). However, there is additional evidence of the involvement of TLR9 (97, 98) and TLR2 (97, 99), confounded by similarities in expression patterns in our data. Moreover, our data provides gene lists of important genes expressed during a potential TLR2 or TLR9 stimulation by T. gondii parasites of different clonal lineages. This further supports the notion of the onset of a stronger more pro-inflammatory immune response by T. gondii type II (PTG) parasites in comparison to type I (LDM) parasites.
Co-expression analysis revealed genes involved in modulation of innate immune responses and TLR function are co-expressed with dense granule gene, GRA45, implying a potential role in immune modulation during an inflammatory response of the host. In addition, co-expression of genes related to cytoskeleton formation and pathogenesis as well as cell cycle regulation, supports the diversity of host cell modulation by T. gondii.
In summary, this study provides a detailed resource of host-pathogen interactions over the time-course of an acute T. gondii infection in BMDCs. The identification of differential responses in distinct sub-populations of cells highlights the importance of studying infection kinetics at the resolution of single infected cells and raises the question how and why parasites of different clonal origin modulate cell types differently or change cell type signatures. We show co-expression of parasite ribosomal proteins and pro-inflammatory genes in PTG infected cells and of dense granules and immune modulating genes in LDM infected cells, highlighting unprecedented differential modulation of host-pathogen interaction pathways between clonal lineages at the single-cell level. Further, we show differential expression of rhoptry, dense granule and microneme genes between PTG and LDM parasites as well as clusters of host cells, with strain specific host modulation by dense granules and micronemes contrasting rhoptry expression patterns. This highlights the importance of dense granules for nuanced host-pathogen interactions, prompting future functional studies on these effectors. Moreover, the integration and comparative analyses between our data and previously published data highlights the possibility of validating and identifying new expression programs during host-parasite interactions.
We anticipate that our observations provide information of future clinical implications, such as the development of effector molecule-targeting therapies, by providing novel candidate genes identified both in the host and parasite. We further anticipate that the data presented here provides a unique and comprehensive resource for studies of host-parasite interactions between T. gondii parasites and infected immune cells. Finally, this resource will serve as a tool, which can be applied to study host-pathogen interactions on a variety of other invasive pathogen and host cell complexes of medical and veterinary importance, including Plasmodium, Cryptosporidium, Babesia, and Leishmania as well as different bacteria and viruses.
Primary bone marrow-derived mononuclear phagocytes were generated as previously described (100, 101). Briefly, cells from the bone marrow of 6-10 week old C57BL/6 mice (Charles River) were cultured in RPMI 1640 (Gibco) complemented with 10% fetal bovine serum (FBS, Sigma), gentamicin (20 μg/ml; Gibco), glutamine (2 mM; Gibco) and HEPES (0.01 M; Gibco), referred to as complete media, and further supplemented with 10 ng/ml of recombinant mouse granulocyte-macrophage colony stimulating factor (GM-CSF) (Peprotech). Culture media was replenished on days two, four and six. Loosely adherent cells (102) were harvested on day seven or eight for experiments.
The parasite lines used include GFP-expressing RH-LDMluc (LDM, cloned from RH-GFPS65T) and GFP-expressing PTGluc (PTG, cloned from ME49/PTG-GFPS65T) (103). Tachyzoites were maintained by serial 2-day passaging in human foreskin fibroblast (HFF-1 SCRC-1041, American Type Culture Collection) monolayers cultured in Dulbecco’s modified Eagle’s medium (DMEM; Gibco) with 10% FBS, gentamicin (20μg/ml), glutamine (2mM), and HEPES (0.01 M).
On day seven or eight, BMDCs in complete media were challenged with freshly egressed T. gondii tachyzoites. To ensure an infection-rate of single parasites above 80%, cells at 3 hours were infected at a multiplicity of infection (MOI) of 3 (3h), or MOI of 1.5 (12 h) before single cell sorting. Under these conditions, infection frequencies were > 50%, with negligible cell lysis and >80-90% of infected cells containing a single T. gondii vacuole. Negative controls were treated with parasite lysates or not stimulated, while positive controls were treated with 100ng/ml LPS for 3 hours. The parasite lysates were produced by ultrasonication of live tachyzoites, where ultrasonication was applied 3 times at 10 second intervals with 1-minute interval on ice.
Post-infection, cells were treated with Fc-block (anti-mouse CD16/CD32 antibody, 1:200; BD 553142) for 15 minutes, washed with D-PBS and further incubated with a monoclonal antibody against CD11c conjugated with PE-Cyanine7 (1:200; Thermofisher 25-0114-82) for 30 minutes, washed with D-PBS and resuspended in ice-cold D-PBS. Cells were kept on ice prior to sorting.
A preliminary trial was set up to validate optimal cycling conditions for cDNA amplification of single T. gondii-infected BMDCs by performing rt-qPCR of target genes known to be expressed in T. gondii and genes known to be expressed in DCs (primer sequences).
The sorting was performed with a MoFlo Astrios EQ (Beckman Coulter, USA) cell sorter using 488 and 532 nm lasers for excitation, 100 µm nozzle, sheath pressure of 25 psi and 0.1 µm sterile-filtered 1 x PBS as sheath fluid. Flow sorting data was interpreted and displayed using the associated software, Summit v 6.3.1.
To test the precision of the adjustments made to center the drop in each well, a colorimetric test mimicking the sort was done based on (104). A 1.5 mg/µl solution of HRP (cat no 31490, ThermoFisher Scientific) with 1 drop of flow check beads (Beckman Coulter, USA) was sorted into each well of an Eppendorf 384-well plate (Cat no 34028, ThermoFisher Scientific). A color change after sorting indicated that the drop hit the sort buffer and that the precision was adequate.
Individual BMDCs or single T. gondii infected BMDCs were deposited into 384-well plates (Eppendorf twin.tecTM PCR plates) containing 2.3 µl of lysis buffer (105) using a CyClone™ robotic arm and at highly stringent single cell sort settings (single mode, 0.5 drop envelope). Side scatter was used as the trigger channel and sort regions were based on Toxoplasma cells expressing GFP and the surface antibody CD11C-PE-Cy7 bound to human dendritic cells. GFP was excited at 488 nm and detected with a 530/40 nm bandpass filter whereas PE-Cy7 was excited at 532 nm and detected using a 695/70 nm bandpass filter. The plate and sample holder were kept at 4 °C at all times during the sort. After the sort, the plates were immediately spun down and put on dry ice.
Single BMDCs or single T. gondii infected BMDCs were sorted directly into lysis buffer and cDNA libraries were generated using a slightly modified version of Smart-seq2 as previously described (105), but where we used 20 cycles for cDNA amplification.
Single-cell libraries were sequenced at the National Genomics Infrastructure, SciLifeLab Stockholm, using the HiSeq2500 platform (Illumina) for 56 bps single-end sequencing. We sequenced a total of 764 (negative controls n=2, per plate) single BMDCs or T. gondii infected BMDCs from a total of 8 different conditions.
A custom reference genome was made by combining Mus musculus GRCm38 and Toxoplasma gondii TGA4.44. The reads were aligned to the genome using STAR v 2.7.2, and gene expression was measured using featureCounts v 2.0.0, using default settings. Cells with less than 10 000 mapped reads were filtered due to substantially inferior quality and the remaining 518 cells were subjected to subsequent computational analysis. A total of 62 276 genes across 532 cells for the host (Mus musculus) and T. gondii were analyzed.
Main computational analysis of read-count matrices was performed using the Seurat package (v 4.0.3) (106) in R (v 4.2.0). The complete R workflow can be assessed in an R markdown (see code availability section). First, count matrices and metadata were loaded and split by the respective species. Ensembl IDs of genes were translated to gene symbols and cells with a mitochondrial gene count above 10% were filtered. Subsequently reads were normalized for sequencing depth using the “SCTransform” function in Seurat, selecting the top 3000 variable genes (107). Thereafter, dimensionality reduction was performed using PCA, computing the first 50 PCs. The first 15 PCs from the analysis were then subjected to shared-nearest-neighbor (SNN) inspired graph-based clustering via the “FindNeighbors” and “FindClusters” functions. For modularity optimization, the louvain algorithm was used and clustering was performed at a resolution of 0.8 for clustering granularity, resulting in 9 clusters. After clustering, a UMAP dimensionality reduction was performed.
Differential gene expression analysis (DGEA) of genes in identified clusters was performed using the function “FindAllMarkers” from the Seurat package (v. 4.0.5). Following the default option of the method, differentially expressed genes for each cluster were identified using a non-parametric Wilcoxon rank sum test. Differentially expressed genes in a cluster were defined by setting initial thresholds above a logarithmic fold-change of 0.5 and being present in at least 25% of the cells belonging to the same cluster. Representative marker genes with an adjusted p-value below 0.05 for each cluster were further selected. p-values were adjusted using a Bonferroni correction including all genes in the dataset. To find representative marker genes with elevated expression in comparison to the remaining clusters, only positive log fold-changes were considered. For individual analyses such as gene enrichment analysis (see “Gene set enrichment analysis (gsea)”), threshold values for differential gene expressions were modified and will be described in detail in the respective sections of the materials and methods and results. To identify DEGs between specific clusters of interest, the “FindMarkers” function in Seurat was used and the identities were set to the respective clusters of interest. The same thresholds as stated above were used to define DEGs.
For visualization purposes of DGE data, the gene expression data for all cells was averaged and grouped according to their cluster identity, resulting in average expression of each gene and cluster. Then, expression data was scaled and clipped to average expression values between -1.5 and 1.5, with negative values representing downregulation and positive values representing upregulation of each gene.
We classified cell types in our data using the clustifyr package (v.1.8.0) (108) and the sorted microarray expression data presented in (9) as reference. In brief, clustifyr adopts correlation-based methods to find reference transcriptomes with the highest similarity to query cluster expression profiles. After converting the microarray data in the correct format for automated cell type annotation, we used the default settings (Spearman rank correlation) to estimate correlation coefficients between the single cells in our clusters and the reference cell types.
To chart the cell cycle phases of individual cells, cell cycle scoring was performed using the “CellCycleScoring” function in Seurat. Scoring was performed based on the host (M. musculus) expression data as well as on the T. gondii data. Here the scoring function was performed using the default parameters. In brief, the function assigns each cell a score based on its expression of G2/M and S phase markers, which are assumed to be anticorrelated in their expression levels. Thus, cells expressing neither are assumed to be in G1 phase. Cell cycle associated marker gene lists for mouse were retrieved from: https://raw.githubusercontent.com/hbc/tinyatlas/master/cell_cycle/Mus_musculus.csv (20210707). These gene lists are based on orthology analyses of human cell cycle genes presented in (109).
T. gondii cell cycle associated genes were extracted from supplementary data of (64). As the cell cycle stages of T. gondii contain a S/M and G1 phase only, the resulting phases were changed accordingly.
To interpret gene expression data and differentially expressed genes further, we performed a gene set enrichment analysis for clusters of interest. This was done using the gseGO function of the clusterProfiler package in R (v.4.0.5). To identify significantly enriched genes, we set the ontology parameter to use gene set enrichment for biological processes and set the gene set parameters to include a minimum of three genes and a maximum of 800 genes in one set. The reference dataset for M.musculus was used, and the resulting p-value from the fast preranked gene set enrichment analysis (fgsea) was adjusted using a Benjamini-Hochberg correction. For differentially expressed genes between cluster M6 and cluster M7, correction of gene set enrichment resulted in non-significant p-values, which is why we don’t report significant differences for gene set enrichment but only fold changes of genes of interest with their respective biological process (Figure 2A).
To identify T. gondii specific gene set enrichment we used the ToxoDB database to annotate all T. gondii genes present in our dataset and included computed GO terms for I) function and II) process generated by VeuPathDB utilizing InterPro-to-GO (110). Then the counts for each computed GO-term within the gene list of interest were determined. After the fraction of genes of the geneset of interest was determined and divided by the fraction of the reference (all data) to determine the enrichment for each term and geneset. We termed the resulting value “enrichment score” in our data.
For reference data integration and comparison we included three publicly available datasets, to I) perform cell type annotations (cell type classification and annotation) (9) II) to compare the response in our data to data investigating PRR agonists (71) and III) to compare our results to identified essential genes for T. gondii during INFγ stress (72). For II) we first identified differentially expressed genes for each single condition (PAMP) using DESeq2 v.1.36.0 (111). We investigated expression patterns for II) by intersecting genes identified to be upregulated in BMDCs during stimulation with each agonist. For simplicity we generated bimodal scores resulting in two modes: expression (1) and no expression (0). We further show gene expression of PRR agonists by investigating aggregated expression of individual genes across our experimental conditions, visualized in a heatmap. We performed similar analyses for III), additionally investigating co-expression of shared genes between the reference data and our gene expression data.
To investigate inter-species co-expression networks we first performed an asymmetric Biweight midcorrelation (bicor) to identify gene expression correlations between T. gondii and M. musculus genes across cells. Using a k-nearest neighbor approach, we defined the top 20 interactors for each gene in the T. gondii expression matrix and M. musculus expression matrix. Using igraph (v.1.3.1), we then constructed correlation network plots (Co-expression networks). Using the three nearest neighbors (interactors), a correlation threshold of 0.3/-0.3 and 3 steps. The number of steps defines how many additional interactors after the primary interaction should be displayed after the interactors of the provided seed genes. We displayed the largest interaction clusters using the “induced_subgraph” function in igraph. To integrate publicly available data on T. gondii, we investigated co-expression of T.gondii genes, which were previously shown to be essential during INFγ stress in BMDMs (72).
To investigate gene expression correlation between genes resulting from the co-expression network analysis and other genes in the dataset, we first performed an asymmetric bicor correlation analysis between all genes present in the co-expression network cluster of interest and all remaining genes to determine which genes exhibit positive or negative expression correlation across cells. Then, we decided for an appropriate cut-off, only considering genes to be positively or negatively correlated based on the distribution of correlation values, resulting in thresholds between 0.15/-0.15 and 0.25/-0.25. After identifying a subset of genes exhibiting correlation above or below the determined threshold, we calculated pearson correlations between genes of interest and the subset of correlated genes and visualized them using the corrplot package (v.0.92).
The datasets presented in this study can be found in online repositories. The names of the repository/repositories and accession number(s) can be found below: PRJNA918538 (SRA). The code used for the analysis is available on Github via https://github.com/ANKARKLEVLAB/t.gondii_bmdc upon publication.
The Regional Animal Research Ethical Board, Stockholm, Sweden, approved experimental procedures and protocols involving extraction of cells from mice (N135/15, N78/16), following proceedings described in EU legislation (Council Directive 2010/63/EU).
JA, JH and ABa conceived the study. JA and JH supervised the study. ABh cultured cells and performed infections. JA and A-MD performed sorting and scSeq. MM and JH performed mapping and initial computational analyses. FH performed computational analysis of the data and generated figures. FB and FH designed and implemented co-expression network analysis; MM generated the shinyapp FH, AD and JA wrote the manuscript. All authors read and reviewed the manuscript.
JA is supported through grants from the Swedish Research Council (VR 2021-05057), and the Swedish Foundation for Medical Research (SSMF). JH and MIMS are supported by Vetenskapsrådet (VR 2021-06602). ABh was supported by a grant from the Swedish Research Council (VR 2018-0241 to ABa). ABa was funded by VR 2022-00520. FH is in part funded by the Sven and Lily Lawski foundation.
We thank the Microbial Single Cell Genomics and the Eukaryotic Single Cell Genomics facilities at Science for Life Laboratory (SciLifeLab), Sweden, for cell sorting as well as smart-seq2 library preparations, respectively, and the National Genomics Infrastructure, SciLifeLab for sequencing. The computations were performed using resources provided by SNIC through Uppsala Multidisciplinary Center for Advanced Computational Science (UPPMAX). We thank Moritz Treeck and the Treeck group for their scientific advice on Toxoplasma biology.
The authors declare that the research was conducted in the absence of any commercial or financial relationships that could be construed as a potential conflict of interest.
All claims expressed in this article are solely those of the authors and do not necessarily represent those of their affiliated organizations, or those of the publisher, the editors and the reviewers. Any product that may be evaluated in this article, or claim that may be made by its manufacturer, is not guaranteed or endorsed by the publisher.
The Supplementary Material for this article can be found online at: https://www.frontiersin.org/articles/10.3389/fimmu.2023.1224591/full#supplementary-material
1. Medzhitov R. Recognition of microorganisms and activation of the immune response. Nature (2007) 449:819–26. doi: 10.1038/nature06246
2. Hoebe K, Janssen E, Beutler B. The interface between innate and adaptive immunity. Nat Immunol (2004) 5:971–4. doi: 10.1038/ni1004-971
3. Fitzgerald KA, Kagan JC. Toll-like receptors and the control of immunity. Cell (2020) 180:1044–66. doi: 10.1016/j.cell.2020.02.041
4. El-Zayat SR, Sibaii H, Mannaa FA. Toll-like receptors activation, signaling, and targeting: an overview. Bull Natl Res Cent (2019) 43:187. doi: 10.1186/s42269-019-0227-2
5. Guilliams M, Ginhoux F, Jakubzick C, Naik SH, Onai N, Schraml BU, et al. Dendritic cells, monocytes and macrophages: a unified nomenclature based on ontogeny. Nat Rev Immunol (2014) 14:571–8. doi: 10.1038/nri3712
6. Hirayama D, Iida T, Nakase H. The phagocytic function of macrophage-enforcing innate immunity and tissue homeostasis. Int J Mol Sci (2017) 19:E92. doi: 10.3390/ijms19010092
7. Malissen B, Tamoutounour S, Henri S. The origins and functions of dendritic cells and macrophages in the skin. Nat Rev Immunol (2014) 14:417–28. doi: 10.1038/nri3683
8. Nouwen LV, Everts B. Pathogens menTORing macrophages and dendritic cells: manipulation of mTOR and cellular metabolism to promote immune escape. Cells (2020) 9:161. doi: 10.3390/cells9010161
9. Helft J, Böttcher J, Chakravarty P, Zelenay S, Huotari J, Schraml BU, et al. GM-CSF mouse bone marrow cultures comprise a heterogeneous population of CD11c+MHCII+ Macrophages and dendritic cells. Immunity (2015) 42:1197–211. doi: 10.1016/j.immuni.2015.05.018
10. Shalek AK, Satija R, Adiconis X, Gertner RS, Gaublomme JT, Raychowdhury R, et al. Single-cell transcriptomics reveals bimodality in expression and splicing in immune cells. Nature (2013) 498:236–40. doi: 10.1038/nature12172
11. Smith TG, Walliker D, Ranford-Cartwright LC. Sexual differentiation and sex determination in the Apicomplexa. Trends Parasitol (2002) 18:315–23. doi: 10.1016/S1471-4922(02)02292-4
12. Flegr J, Prandota J, Sovičková M, Israili ZH. Toxoplasmosis–a global threat. Correlation of latent toxoplasmosis with specific disease burden in a set of 88 countries. PloS One (2014) 9:e90203. doi: 10.1371/journal.pone.0090203
14. Mousavi P, Mirhendi H, Mohebali M, Shojaee S, Keshavarz Valian H, Fallahi S, et al. Detection of toxoplasma gondii in acute and chronic phases of infection in immunocompromised patients and pregnant women with real-time PCR assay using taqMan fluorescent probe. Iran J Parasitol (2018) 13:373–81.
15. Hu K, Johnson J, Florens L, Fraunholz M, Suravajjala S, DiLullo C, et al. Cytoskeletal components of an invasion machine—The apical complex of toxoplasma gondii. PloS Pathog (2006) 2:e13. doi: 10.1371/journal.ppat.0020013
16. Kato K. How does Toxoplama gondii invade host cells? J Vet Med Sci (2018) 80:1702–6. doi: 10.1292/jvms.18-0344
17. Barragan A, Sibley LD. Transepithelial migration of toxoplasma gondii is linked to parasite motility and virulence. J Exp Med (2002) 195:1625–33. doi: 10.1084/jem.20020258
18. Delgado Betancourt E, Hamid B, Fabian BT, Klotz C, Hartmann S, Seeber F. From entry to early dissemination—Toxoplasma gondii’s initial encounter with its host. Front. Cell. Infect. Microbiol (2019) 9:46. doi: 10.3389/fcimb.2019.00046
19. Bhandage AK, Kanatani S, Barragan A. Toxoplasma-induced hypermigration of primary cortical microglia implicates GABAergic signaling. Front Cell Infect Microbiol (2019) 9:73. doi: 10.3389/fcimb.2019.00073
20. Lambert H, Hitziger N, Dellacasa I, Svensson M, Barragan A. Induction of dendritic cell migration upon Toxoplasma gondii infection potentiates parasite dissemination. Cell Microbiol (2006) 8:1611–23. doi: 10.1111/j.1462-5822.2006.00735.x
21. ten Hoeve AL, Braun L, Rodriguez ME, Olivera GC, Bougdour A, Belmudes L, et al. The Toxoplasma effector GRA28 promotes parasite dissemination by inducing dendritic cell-like migratory properties in infected macrophages. Cell Host Microbe (2022) 30:1570–88.e7. doi: 10.1016/j.chom.2022.10.001
22. Ueno N, Lodoen MB, Hickey GL, Robey EA, Coombes JL. Toxoplasma gondii -infected natural killer cells display a hypermotility phenotype in vivo. Immunol Cell Biol (2015) 93:508–13. doi: 10.1038/icb.2014.106
23. Lambert H, Barragan A. Modelling parasite dissemination: host cell subversion and immune evasion by Toxoplasma gondii. Cell Microbiol (2010) 12:292–300. doi: 10.1111/j.1462-5822.2009.01417.x
24. Sibley LD, Ajioka JW. Population structure of Toxoplasma gondii : clonal expansion driven by infrequent recombination and selective sweeps. Annu Rev Microbiol (2008) 62:329–51. doi: 10.1146/annurev.micro.62.081307.162925
25. Howe DK, Sibley LD. Toxoplasma gondii comprises three clonal lineages: correlation of parasite genotype with human disease. The. J Infect Dis (1995) 172:1561–6. doi: 10.1093/infdis/172.6.1561
26. Bontell I, Hall N, Ashelford KE, Dubey J, Boyle JP, Lindh J, et al. Whole genome sequencing of a natural recombinant Toxoplasma gondii strain reveals chromosome sorting and local allelic variants. Genome Biol (2009) 10:R53. doi: 10.1186/gb-2009-10-5-r53
27. Sibley LD, Boothroyd JC. Virulent strains of Toxoplasma gondii comprise a single clonal lineage. Nature (1992) 359:82–5. doi: 10.1038/359082a0
28. Kanatani S, Uhlén P, Barragan A. Infection by toxoplasma gondii induces amoeboid-like migration of dendritic cells in a three-dimensional collagen matrix. PloS One (2015) 10:e0139104–e0139104. doi: 10.1371/journal.pone.0139104
29. Jensen KDC, Wang Y, Wojno EDT, Shastri AJ, Hu K, Cornel L, et al. Toxoplasma polymorphic effectors determine macrophage polarization and intestinal inflammation. Cell Host Microbe (2011) 9:472–83. doi: 10.1016/j.chom.2011.04.015
30. Melo MB, Nguyen QP, Cordeiro C, Hassan MA, Yang N, McKell R, et al. Transcriptional analysis of murine macrophages infected with different toxoplasma strains identifies novel regulation of host signaling pathways. PloS Pathog (2013) 9:e1003779. doi: 10.1371/journal.ppat.1003779
31. Menard KL, Bu L, Denkers EY. Transcriptomics analysis of Toxoplasma gondii-infected mouse macrophages reveals coding and noncoding signatures in the presence and absence of MyD88. BMC Genomics (2021) 22:130. doi: 10.1186/s12864-021-07437-0
32. Pittman KJ, Aliota MT, Knoll LJ. Dual transcriptional profiling of mice and Toxoplasma gondii during acute and chronic infection. BMC Genomics (2014) 15:806. doi: 10.1186/1471-2164-15-806
33. Guha J, Kang B, Claudio E, Redekar NR, Wang H, Kelsall BL, et al. NF kappa B regulator Bcl3 controls development and function of classical dendritic cells required for resistance to Toxoplasma gondii. PloS Pathog (2022) 18:e1010502. doi: 10.1371/journal.ppat.1010502
34. Avital G, Avraham R, Fan A, Hashimshony T, Hung DT, Yanai I. scDual-Seq: mapping the gene regulatory program of Salmonella infection by host and pathogen single-cell RNA-sequencing. Genome Biol (2017) 18:200. doi: 10.1186/s13059-017-1340-x
35. Muñoz JF, Delorey T, Ford CB, Li BY, Thompson DA, Rao RP, et al. Coordinated host-pathogen transcriptional dynamics revealed using sorted subpopulations and single macrophages infected with Candida albicans. Nat Commun (2019) 10:1607. doi: 10.1038/s41467-019-09599-8
36. Patir A, Gossner A, Ramachandran P, Alves J, Freeman TC, Henderson NC, et al. Single-cell RNA-seq reveals CD16- monocytes as key regulators of human monocyte transcriptional response to Toxoplasma. Sci Rep (2020) 10:21047. doi: 10.1038/s41598-020-78250-0
37. Sugi T, Tomita T, Kidaka T, Kawai N, Hayashida K, Weiss LM, et al. Single cell transcriptomes of In Vitro bradyzoite infected cells reveals toxoplasma gondii stage dependent host cell alterations. Front Cell Infect Microbiol (2022) 12:848693. doi: 10.3389/fcimb.2022.848693
38. Dubey JP, Lindsay DS, Speer CA. Structures of Toxoplasma gondii tachyzoites, bradyzoites, and sporozoites and biology and development of tissue cysts. Clin Microbiol Rev (1998) 11:267–99. doi: 10.1128/CMR.11.2.267
39. Mosley Y-YC, HogenEsch H. Selection of a suitable reference gene for quantitative gene expression in mouse lymph nodes after vaccination. BMC Res Notes (2017) 10:689. doi: 10.1186/s13104-017-3005-y
40. Walachowski S, Tabouret G, Fabre M, Foucras G. Molecular analysis of a short-term model of β-glucans-trained immunity highlights the accessory contribution of GM-CSF in priming mouse macrophages response. Front Immunol (2017) 8:1089. doi: 10.3389/fimmu.2017.01089
41. McDermott JE, Vartanian KB, Mitchell H, Stevens SL, Sanfilippo A, Stenzel-Poore MP. Identification and validation of ifit1 as an important innate immune bottleneck. PloS One (2012) 7:e36465. doi: 10.1371/journal.pone.0036465
42. Ten Hoeve AL, Hakimi M-A, Barragan A. Sustained Egr-1 Response via p38 MAP Kinase Signaling Modulates Early Immune Responses of Dendritic Cells Parasitized by Toxoplasma gondii. Front Cell Infect Microbiol (2019) 9:349. doi: 10.3389/fcimb.2019.00349
43. Knoll LJ, Tomita T, Weiss LM. Chapter 15 - Bradyzoite Development. In: Weiss LM, Kim K, editors. Toxoplasma Gondii, 2nd ed. Academic Press (2014). p. 521–49. doi: 10.1016/B978-0-12-396481-6.00015-5
44. Plattner F, Yarovinsky F, Romero S, Didry D, Carlier M-F, Sher A, et al. Toxoplasma profilin is essential for host cell invasion and TLR11-dependent induction of an interleukin-12 response. Cell Host Microbe (2008) 3:77–87. doi: 10.1016/j.chom.2008.01.001
45. Huynh M-H, Carruthers VB. Toxoplasma MIC2 is a major determinant of invasion and virulence. PloS Pathog (2006) 2:e84. doi: 10.1371/journal.ppat.0020084
46. Wang Y, Yin H. Research progress on surface antigen 1 (SAG1) of Toxoplasma gondii. Parasit Vectors (2014) 7:180. doi: 10.1186/1756-3305-7-180
47. Wu R, Chen F, Wang N, Tang D, Kang R. ACOD1 in immunometabolism and disease. Cell Mol Immunol (2020) 17:822–33. doi: 10.1038/s41423-020-0489-5
48. Patin EC, Orr SJ, Schaible UE. Macrophage inducible C-type lectin as a multifunctional player in immunity. Front Immunol (2017) 8:861. doi: 10.3389/fimmu.2017.00861
49. Zanoni I, Granucci F. Role of CD14 in host protection against infections and in metabolism regulation. Front Cell Infect Microbiol (2013) 3:32. doi: 10.3389/fcimb.2013.00032
50. Zarubica A, Trompier D, Chimini G. ABCA1, from pathology to membrane function. Pflugers Arch - Eur J Physiol (2007) 453:569–79. doi: 10.1007/s00424-006-0108-z
51. Gov L, Karimzadeh A, Ueno N, Lodoen MB. Human innate immunity to toxoplasma gondii is mediated by host caspase-1 and ASC and parasite GRA15. mBio (2013) 4:e00255–13. doi: 10.1128/mBio.00255-13
52. Zhao Y, Shi J, Shi X, Wang Y, Wang F, Shao F. Genetic functions of the NAIP family of inflammasome receptors for bacterial ligands in mice. J Exp Med (2016) 213:647–56. doi: 10.1084/jem.20160006
53. He H, Brenier-Pinchart M-P, Braun L, Kraut A, Touquet B, Couté Y, et al. Characterization of a Toxoplasma effector uncovers an alternative GSK3/β-catenin-regulatory pathway of inflammation. eLife (2018) 7:e39887. doi: 10.7554/eLife.39887
54. Jiang A, Bloom O, Ono S, Cui W, Unternaehrer J, Jiang S, et al. Disruption of E-cadherin-mediated adhesion induces a functionally distinct pathway of dendritic cell maturation. Immunity (2007) 27:610–24. doi: 10.1016/j.immuni.2007.08.015
55. Khan IA, Ouellette C, Chen K, Moretto M. Toxoplasma: immunity and pathogenesis. Curr Clin Micro Rpt (2019) 6:44–50. doi: 10.1007/s40588-019-0114-5
56. Stutz A, Kessler H, Kaschel M-E, Meissner M, Dalpke AH. Cell invasion and strain dependent induction of suppressor of cytokine signaling-1 by Toxoplasma gondii. Immunobiology (2012) 217:28–36. doi: 10.1016/j.imbio.2011.08.008
57. Canning P, Ruan Q, Schwerd T, Hrdinka M, Maki JL, Saleh D, et al. Inflammatory signaling by NOD-RIPK2 is inhibited by clinically relevant type II kinase inhibitors. Chem Biol (2015) 22:1174–84. doi: 10.1016/j.chembiol.2015.07.017
58. Chan MM, Evans KW, Moore AR, Fong D. Peroxisome proliferator-activated receptor (PPAR): balance for survival in parasitic infections. J Biomed Biotechnol (2010) 2010:1–9. doi: 10.1155/2010/828951
59. Pellegrini E, Signor L, Singh S, Boeri Erba E, Cusack S. Structures of the inactive and active states of RIP2 kinase inform on the mechanism of activation. PloS One (2017) 12:e0177161. doi: 10.1371/journal.pone.0177161
60. Lavine MD, Arrizabalaga G. Induction of mitotic S-phase of host and neighboring cells by Toxoplasma gondii enhances parasite invasion. Mol Biochem Parasitol (2009) 164:95–9. doi: 10.1016/j.molbiopara.2008.11.014
61. Molestina RE, El-Guendy N, Sinai AP. Infection with Toxoplasma gondii results in dysregulation of the host cell cycle. Cell Microbiol (2008) 10:1153–65. doi: 10.1111/j.1462-5822.2008.01117.x
62. Drusco A, Zanesi N, Roldo C, Trapasso F, Farber JL, Fong LY, et al. Knockout mice reveal a tumor suppressor function for Testin. Proc Natl Acad Sci USA (2005) 102:10947–51. doi: 10.1073/pnas.0504934102
63. Kazazian K, Haffani Y, Ng D, Lee CMM, Johnston W, Kim M, et al. FAM46C/TENT5C functions as a tumor suppressor through inhibition of Plk4 activity. Commun Biol (2020) 3:448. doi: 10.1038/s42003-020-01161-3
64. Behnke MS, Wootton JC, Lehmann MM, Radke JB, Lucas O, Nawas J, et al. Coordinated Progression through Two Subtranscriptomes Underlies the Tachyzoite Cycle of Toxoplasma gondii. PloS One (2010) 5:e12354. doi: 10.1371/journal.pone.0012354
65. Jung C, Lee CY-F, Grigg ME. The SRS superfamily of Toxoplasma surface proteins. Int J Parasitol (2004) 34:285–96. doi: 10.1016/j.ijpara.2003.12.004
66. Lagal V, Binder EM, Huynh M-H, Kafsack BFC, Harris PK, Diez R, et al. Toxoplasma gondii protease TgSUB1 is required for cell surface processing of micronemal adhesive complexes and efficient adhesion of tachyzoites: TgSUB1 microneme protein processing. Cell Microbiol (2010) 12:1792–808. doi: 10.1111/j.1462-5822.2010.01509.x
67. Barylyuk K, Koreny L, Ke H, Butterworth S, Crook OM, Lassadi I, et al. A Comprehensive Subcellular Atlas of the Toxoplasma Proteome via hyperLOPIT Provides Spatial Context for Protein Functions. Cell Host Microbe (2020) 28:752–766.e9. doi: 10.1016/j.chom.2020.09.011
68. Bradley PJ, Sibley LD. Rhoptries: an arsenal of secreted virulence factors. Curr Opin Microbiol (2007) 10:582–7. doi: 10.1016/j.mib.2007.09.013
69. Ghosh S, Kennedy K, Sanders P, Matthews K, Ralph SA, Counihan NA, et al. The Plasmodium rhoptry associated protein complex is important for parasitophorous vacuole membrane structure and intraerythrocytic parasite growth. Cell Microbiol (2017) 19:e12733. doi: 10.1111/cmi.12733
70. Hernández-de-los-Ríos A, Murillo-Leon M, Mantilla-Muriel LE, Arenas AF, Vargas-Montes M, Cardona N, et al. Influence of two major toxoplasma gondii virulence factors (ROP16 and ROP18) on the immune response of peripheral blood mononuclear cells to human toxoplasmosis infection. Front Cell Infect Microbiol (2019) 9:413. doi: 10.3389/fcimb.2019.00413
71. Pandey S, Gruenbaum A, Kanashova T, Mertins P, Cluzel P, Chevrier N. Pairwise stimulations of pathogen-sensing pathways predict immune responses to multi-adjuvant combinations. Cell Syst (2020) 11:495–508.e10. doi: 10.1016/j.cels.2020.10.001
72. Wang Y, Sangaré LO, Paredes-Santos TC, Hassan MA, Krishnamurthy S, Furuta AM, et al. Genome-wide screens identify Toxoplasma gondii determinants of parasite fitness in IFNγ-activated murine macrophages. Nat Commun (2020) 11:5258. doi: 10.1038/s41467-020-18991-8
73. Mathes AL, Rice L, Affandi AJ, DiMarzio M, Rifkin IR, Stifano G, et al. CpGB DNA activates dermal macrophages and specifically recruits inflammatory monocytes into the skin. Exp Dermatol (2015) 24:133–9. doi: 10.1111/exd.12603
74. Brown GD. Dectin-1: a signalling non-TLR pattern-recognition receptor. Nat Rev Immunol (2006) 6:33–43. doi: 10.1038/nri1745
75. Jeidane S, Scott-Boyer M-P, Tremblay N, Cardin S, Picard S, Baril M, et al. Association of a network of interferon-stimulated genes with a locus encoding a negative regulator of non-conventional IKK kinases and IFNB1. Cell Rep (2016) 17:425–35. doi: 10.1016/j.celrep.2016.09.009
76. Lou Y, Han M, Liu H, Niu Y, Liang Y, Guo J, et al. Essential roles of S100A10 in Toll-like receptor signaling and immunity to infection. Cell Mol Immunol (2020) 17:1053–62. doi: 10.1038/s41423-019-0278-1
77. Zou B, Liu J, Klionsky DJ, Tang D, Kang R. Extracellular SQSTM1 as an inflammatory mediator. Autophagy (2020) 16:2313–5. doi: 10.1080/15548627.2020.1843253
78. Pooja S, Pushpanathan M, Gunasekaran P, Rajendhran J. Endocytosis−Mediated invasion and pathogenicity of streptococcus agalactiae in rat cardiomyocyte (H9C2). PloS One (2015) 10:e0139733. doi: 10.1371/journal.pone.0139733
79. Case NT, Duah K, Larsen B, Wong CJ, Gingras A-C, O’Meara TR, et al. The macrophage-derived protein PTMA induces filamentation of the human fungal pathogen Candida albicans. Cell Rep (2021) 36:109584. doi: 10.1016/j.celrep.2021.109584
80. Domogalla MP, Rostan PV, Raker VK, Steinbrink K. Tolerance through education: how tolerogenic dendritic cells shape immunity. Front Immunol (2017) 8:1764. doi: 10.3389/fimmu.2017.01764
81. Manicassamy S, Pulendran B. Dendritic cell control of tolerogenic responses. Immunol Rev (2011) 241:206–27. doi: 10.1111/j.1600-065X.2011.01015.x
82. Bhattacharya P, Thiruppathi M, Elshabrawy HA, Alharshawi K, Kumar P, Prabhakar BS. GM-CSF: An immune modulatory cytokine that can suppress autoimmunity. Cytokine (2015) 75:261–71. doi: 10.1016/j.cyto.2015.05.030
83. Schutt CR, Gendelman HE, Mosley RL. Tolerogenic bone marrow-derived dendritic cells induce neuroprotective regulatory T cells in a model of Parkinson’s disease. Mol Neurodegeneration (2018) 13:26. doi: 10.1186/s13024-018-0255-7
84. Steichen AL, Binstock BJ, Mishra BB, Sharma J. C-type lectin receptor Clec4d plays a protective role in resolution of Gram-negative pneumonia. J Leukoc Biol (2013) 94:393–8. doi: 10.1189/jlb.1212622
85. Yonekawa A, Saijo S, Hoshino Y, Miyake Y, Ishikawa E, Suzukawa M, et al. Dectin-2 is a direct receptor for mannose-capped lipoarabinomannan of mycobacteria. Immunity (2014) 41:402–13. doi: 10.1016/j.immuni.2014.08.005
86. Jeong Y-I, Hong S-H, Cho S-H, Park MY, Lee S-E. Induction of IL-10-producing regulatory B cells following Toxoplasma gondii infection is important to the cyst formation. Biochem Biophys Rep (2016) 7:91–7. doi: 10.1016/j.bbrep.2016.05.008
87. Sullivan WJ, Jeffers V. Mechanisms of Toxoplasma gondii persistence and latency. FEMS Microbiol Rev (2012) 36:717–33. doi: 10.1111/j.1574-6976.2011.00305.x
88. Gannoun-Zaki L, Pätzold L, Huc-Brandt S, Baronian G, Elhawy MI, Gaupp R, et al. PtpA, a secreted tyrosine phosphatase from Staphylococcus aureus, contributes to virulence and interacts with coronin-1A during infection. J Biol Chem (2018) 293:15569–80. doi: 10.1074/jbc.RA118.003555
89. Tinoco R, Neubert EN, Stairiker CJ, Henriquez ML, Bradley LM. PSGL-1 is a T cell intrinsic inhibitor that regulates effector and memory differentiation and responses during viral infection. Front Immunol (2021) 12:677824. doi: 10.3389/fimmu.2021.677824
90. Yu Z, Lu Y, Liu Z, Aleem MT, Liu J, Luo J, et al. Recombinant Toxoplasma gondii Ribosomal Protein P2 Modulates the Functions of Murine Macrophages In Vitro and Provides Immunity against Acute Toxoplasmosis In Vivo. Vaccines (2021) 9:357. doi: 10.3390/vaccines9040357
91. Cérède O, Dubremetz JF, Soête M, Deslée D, Vial H, Bout D, et al. Synergistic role of micronemal proteins in Toxoplasma gondii virulence. J Exp Med (2005) 201:453–63. doi: 10.1084/jem.20041672
92. Mercier C, Howe DK, Mordue D, Lingnau M, Sibley LD. Targeted disruption of the GRA2 locus in Toxoplasma gondii decreases acute virulence in mice. Infect Immun (1998) 66:4176–82. doi: 10.1128/IAI.66.9.4176-4182.1998
93. Lebrun M, Carruthers VB, Cesbron-Delauw M-F. Toxoplasma Secretory Proteins and Their Roles in Cell Invasion and Intracellular Survival. In: Toxoplasma Gondii. Elsevier (2014). p. 389–453. doi: 10.1016/B978-0-12-396481-6.00012-X
94. Butcher BA, Fox BA, Rommereim LM, Kim SG, Maurer KJ, Yarovinsky F, et al. Toxoplasma gondii rhoptry kinase ROP16 activates STAT3 and STAT6 resulting in cytokine inhibition and arginase-1-dependent growth control. PloS Pathog (2011) 7:e1002236. doi: 10.1371/journal.ppat.1002236
95. Song JS, Kim Y-J, Han KU, Yoon BD, Kim JW. Zymosan and PMA activate the immune responses of Mutz3-derived dendritic cells synergistically. Immunol Lett (2015) 167:41–6. doi: 10.1016/j.imlet.2015.07.002
96. He B, Qiao X, Cerutti A. CpG DNA induces igG class switch DNA recombination by activating human B cells through an innate pathway that requires TLR9 and cooperates with IL-10. J Immunol (2004) 173:4479–91. doi: 10.4049/jimmunol.173.7.4479
97. Yarovinsky F, Sher A. Toll-like receptor recognition of Toxoplasma gondii. Int J Parasitol (2006) 36:255–9. doi: 10.1016/j.ijpara.2005.12.003
98. Khan IA. Toll road for Toxoplasma gondii: the mystery continues. Trends Parasitol (2007) 23:1–3. doi: 10.1016/j.pt.2006.10.001
99. Mun H-S. TLR2 as an essential molecule for protective immunity against Toxoplasma gondii infection. Int Immunol (2003) 15:1081–7. doi: 10.1093/intimm/dxg108
100. Kanatani S, Fuks JM, Olafsson EB, Westermark L, Chambers B, Varas-Godoy M, et al. Voltage-dependent calcium channel signaling mediates GABAA receptor-induced migratory activation of dendritic cells infected by Toxoplasma gondii. PloS Pathog (2017) 13:e1006739. doi: 10.1371/journal.ppat.1006739
101. Fuks JM, Arrighi RBG, Weidner JM, Kumar Mendu S, Jin Z, Wallin RPA, et al. GABAergic signaling is linked to a hypermigratory phenotype in dendritic cells infected by toxoplasma gondii. PloS Pathog (2012) 8:e1003051. doi: 10.1371/journal.ppat.1003051
102. Norbury CC, Chambers BJ, Prescott AR, Ljunggren H-G, Watts C. Constitutive macropinocytosis allows TAP-dependent major histocompatibility compex class I presentation of exogenous soluble antigen by bone marrow-derived dendritic cells. Eur J Immunol (1997) 27:280–8. doi: 10.1002/eji.1830270141
103. Hitziger N, Dellacasa I, Albiger B, Barragan A. Dissemination of Toxoplasma gondii to immunoprivileged organs and role of Toll/interleukin-1 receptor signalling for host resistance assessed by in vivo bioluminescence imaging. Cell Microbiol (2005) 7:837–48. doi: 10.1111/j.1462-5822.2005.00517.x
104. Rodrigues OR, Monard S. A rapid method to verify single-cell deposition setup for cell sorters. Cytometry A (2016) 89:594–600. doi: 10.1002/cyto.a.22865
105. Picelli S, Björklund Å.K., Faridani OR, Sagasser S, Winberg G, Sandberg R. Smart-seq2 for sensitive full-length transcriptome profiling in single cells. Nat Methods (2013) 10:1096–8. doi: 10.1038/nmeth.2639
106. Stuart T, Butler A, Hoffman P, Hafemeister C, Papalexi E, Mauck WM, et al. Comprehensive integration of single-cell data. Cell (2019) 177:1888–02.e21. doi: 10.1016/j.cell.2019.05.031
107. Hafemeister C, Satija R. Normalization and variance stabilization of single-cell RNA-seq data using regularized negative binomial regression. Genome Biol (2019) 20:296. doi: 10.1186/s13059-019-1874-1
108. Fu R, Gillen AE, Sheridan RM, Tian C, Daya M, Hao Y, et al. clustifyr: an R package for automated single-cell RNA sequencing cluster classification. F1000Res (2020) 9:223. doi: 10.12688/f1000research.22969.2
109. Tirosh I, Izar B, Prakadan SM, Wadsworth MH, Treacy D, Trombetta JJ, et al. Dissecting the multicellular ecosystem of metastatic melanoma by single-cell RNA-seq. Science (2016) 352:189–96. doi: 10.1126/science.aad0501
110. Camon EB, Barrell DG, Dimmer EC, Lee V, Magrane M, Maslen J, et al. An evaluation of GO annotation retrieval for BioCreAtIvE and GOA. BMC Bioinf (2005) 6 Suppl 1:S17. doi: 10.1186/1471-2105-6-S1-S17
Keywords: Toxoplasma gondii, bone marrow-derived dendritic cells, BMDCs, host-pathogen interactions, immune modulation, scDual-Seq, Dual single-cell RNA-seq
Citation: Hildebrandt F, Mohammed M, Dziedziech A, Bhandage AK, Divne A-M, Barrenäs F, Barragan A, Henriksson J and Ankarklev J (2023) scDual-Seq of Toxoplasma gondii-infected mouse BMDCs reveals heterogeneity and differential infection dynamics. Front. Immunol. 14:1224591. doi: 10.3389/fimmu.2023.1224591
Received: 17 May 2023; Accepted: 06 July 2023;
Published: 27 July 2023.
Edited by:
Tobias Steinfeldt, University of Freiburg Medical Center, GermanyReviewed by:
Dominik Rückerl, The University of Manchester, United KingdomCopyright © 2023 Hildebrandt, Mohammed, Dziedziech, Bhandage, Divne, Barrenäs, Barragan, Henriksson and Ankarklev. This is an open-access article distributed under the terms of the Creative Commons Attribution License (CC BY). The use, distribution or reproduction in other forums is permitted, provided the original author(s) and the copyright owner(s) are credited and that the original publication in this journal is cited, in accordance with accepted academic practice. No use, distribution or reproduction is permitted which does not comply with these terms.
*Correspondence: Franziska Hildebrandt, ZnJhbnppc2thLmhpbGRlYnJhbmR0QHN1LnNl; Johan Ankarklev, am9oYW4uYW5rYXJrbGV2QHN1LnNl
†Present addresses: Alexis Dziedziech, Department of Global Health, Institut Pasteur, Paris France
Amol K. Bhandage, Department of Cell and Molecular Biology, Biomedical Center (BMC), Uppsala University, Uppsala, Sweden
‡ORCID: Franziska Hildebrandt, orcid.org/0000-0002-2673-1704
Mubasher Mohammed, orcid.org/0000-0002-2352-7337
Alexis Dziedziech, orcid.org/0000-0001-7647-7639
Amol Bhandage, orcid.org/0000-0002-7116-0939
Antonio Barragan, orcid.org/0000-0001-7746-9964
Johan Henriksson, orcid.org/0000-0002-7745-2844
Johan Ankarklev, orcid.org/0000-0003-3170-8493
Disclaimer: All claims expressed in this article are solely those of the authors and do not necessarily represent those of their affiliated organizations, or those of the publisher, the editors and the reviewers. Any product that may be evaluated in this article or claim that may be made by its manufacturer is not guaranteed or endorsed by the publisher.
Research integrity at Frontiers
Learn more about the work of our research integrity team to safeguard the quality of each article we publish.