
94% of researchers rate our articles as excellent or good
Learn more about the work of our research integrity team to safeguard the quality of each article we publish.
Find out more
ORIGINAL RESEARCH article
Front. Immunol. , 10 October 2023
Sec. Multiple Sclerosis and Neuroimmunology
Volume 14 - 2023 | https://doi.org/10.3389/fimmu.2023.1216310
This article is part of the Research Topic Aging in multiple sclerosis: from childhood to old age, in women and men View all 13 articles
 Yao Wang1,2
 Yunyun Duan3
 Yuling Wu1,2
 Zhizheng Zhuo3
 Ningnannan Zhang4
 Xuemei Han5
 Chun Zeng6
 Xiaoya Chen6
 Muhua Huang1,2Yanyan Zhu1,2
 Haiqing Li7Guanmei Cao3
 Jie Sun4Yongmei Li6Fuqing Zhou1,2*†
 Yuxin Li7*†
Background: Sex-related effects have been observed in relapsing-remitting multiple sclerosis (RRMS), but their impact on functional networks remains unclear.
Objective: To investigate the sex-related differences in connectivity strength and time variability within large-scale networks in RRMS.
Methods: This is a multi-center retrospective study. A total of 208 RRMS patients (135 females; 37.55 ± 11.47 years old) and 228 healthy controls (123 females; 36.94 ± 12.17 years old) were included. All participants underwent clinical and MRI assessments. Independent component analysis was used to extract resting-state networks (RSNs). We assessed the connectivity strength using spatial maps (SMs) and static functional network connectivity (sFNC), evaluated temporal properties and dynamic functional network connectivity (dFNC) patterns of RSNs using dFNC, and investigated their associations with structural damage or clinical variables.
Results: For static connectivity, only male RRMS patients displayed decreased SMs in the attention network and reduced sFNC between the sensorimotor network and visual or frontoparietal networks compared with healthy controls [P<0.05, false discovery rate (FDR) corrected]. For dynamic connectivity, three recurring states were identified for all participants: State 1 (sparse connected state; 42%), State 2 (middle-high connected state; 36%), and State 3 (high connected state; 16%). dFNC analyses suggested that altered temporal properties and dFNC patterns only occurred in females: female patients showed a higher fractional time (P<0.001) and more dwell time in State 1 (P<0.001) with higher transitions (P=0.004) compared with healthy females. Receiver operating characteristic curves revealed that the fraction time and mean dwell time of State 1 could significantly distinguish female patients from controls (area under the curve: 0.838-0.896). In addition, female patients with RRMS also mainly showed decreased dFNC in all states, particularly within cognitive networks such as the default mode, frontoparietal, and visual networks compared with healthy females (P < 0.05, FDR corrected).
Conclusion: Our results observed alterations in connectivity strength only in male patients and time variability in female patients, suggesting that sex-related effects may play an important role in the functional impairment and reorganization of RRMS.
Multiple sclerosis (MS) is an immune-mediated demyelinating disease of the central nervous system (CNS) and is a leading non-traumatic cause of disability in young adults (1). Previous studies have reported that female MS patients have a higher incidence of recurrences (2–4), but male patients with MS seem to have more severe physical disability and to progress faster (5, 6). There is also strong evidence indicating that sex plays a crucial role in the recurrence and progression of MS. However, the underlying mechanisms of these sex-related effects within the CNS are complex and have not been fully studied in MS. Structural MRI studies found that male patients with MS seems to have a higher lesion load (7, 8), more severe microstructural damage, such as atrophy of gray matter and/or deep gray matter (9, 10), and demyelination of white matter (11), although these remain understudied.
In addition to structural damage, sex-related functional reorganization also appears to exist in relapsing-remitting MS (RRMS). Recently, static disconnectivity and network efficiency decreases of the default mode network were found in male RRMS patients and related to impaired visuospatial memory (12). However, only increased static functional connectivity was found in male RRMS patients from another study, but this sex-related difference of functional connectivity was no longer significant after regressing gray matter volume (13). These conflicting findings may result from sex-related differences in structural damage and functional reorganization of the CNS in RRMS patients with different sex.
Furthermore, recent research has shown that brain networks are not truly “static” but instead change over time during MRI scans (14). Dynamic functional network connectivity (dFNC) enables quantification of the connectivity strength and its temporal properties of dynamic changes on very short time scales (15). A growing number of studies have found that dFNC can identify recurring dynamic connectivity states in different subtypes and disease stages of MS and decreased dynamic functional connectivity was strong association with cognitive impairment (16, 17), fatigue (18), and disability (19). However, it remains unclear whether sex affects the dynamic connectivity of functional networks in RRMS patients.
As such, our study hypothesized that the connectivity strength and time variability of functional networks in RRMS patients are also affected by sex and related to brain structural damage or physical disability. To test this hypothesis, we retrospectively analyzed 208 patients with RRMS (135 females/73 males) and 228 healthy controls (123 females/105 males) from six centers in China, evaluating the spatial distribution strength, static functional connectivity strength, and dFNC pattern and its temporal properties of the resting-state networks (RSNs) in RRMS. Our study may reveal the pathophysiological mechanism of neurological damage in large-scale functional networks in RRMS patients by different sex.
All subjects signed written informed consent forms, and this study was approved by the local ethics review board at each center.
This retrospective multicenter study recruited 593 subjects (including 263 MS and 331 healthy controls) from six centers in China (from 2009 to 2019). All subjects needed to be right-handed, 18 to 65 years old, undergo MRI scans, and have complete clinical information. All MS patients were diagnosed by the 2017 Revised McDonald Criteria as being in the RRMS category. The Expanded Disability Status Scale (EDSS) was used to evaluate the patients’ overall disability. Ultimately, 135 female patients with RRMS (RRMS females) and 73 male patients with RRMS (RRMS males), matched for age, disease duration (DD), and EDSS scores, and 123 healthy females and 105 healthy males were recruited as controls.
All participants underwent 3.0 T MRI scans; the required scan sequences included high-resolution 3D T1-weight, T2-weight, fluid-attenuated inversion recovery (FLAIR), and resting-state functional MRI (rs-fMRI). The specific scan parameters of each center are described in our previous study (20).
White matter volume (WMV) and gray matter volume (GMV) were segmented and calculated automatically using the tissue probability maps method in the computational anatomy toolbox (CAT12). In addition, the ratio of brain parenchymal tissue (GMV plus WMV) to total intracranial cavity volume was defined as the brain parenchymal fraction (BPF).
As described in our previous study (20), lesion volume (LV) was manually delineated and checked by 5- and 11-year experienced radiologists based on the T2-weighted or FLAIR images, and lesion masks were created. The lesion masks were transformed into the Montreal Neurological Institute (MNI) space and the lesion volume calculated in the SPM12 platform.
fMRI data were preprocessed using the Resting-State fMRI Data Analysis Toolkit plus (REST plus v1.25) package based on SPM12 (Statistical Parametric Mapping) and MATLAB v8.40 (The Mathworks, Inc., U.S.). Since the scanning duration to acquire rs-fMRI data may be different in each center, fMRI data preprocessing was performed separately for each center (20). The processing pipeline included: 1) discarding the first 10 image volumes; 2) head movement realignment, the mean framewise displacement (FD) of each subject was evaluated to reflect mean head movement; 3) spatial normalization into the Montreal Neurological Institute (MNI) space and resampling with 3 × 3 × 3 mm3; and 4) spatial smoothing (full width at half maximum (FWHM)=6 mm).
We used ICA to identify RSNs rather than using seed-based approaches because ICA is data-driven and does not require prior assumptions (e.g., selecting the seed regions). In this study, we implemented spatial ICA to extract temporally coherent and spatially independent sources within the fMRI time course using the Group ICA Of fMRI Toolbox (GIFT v3.0b). The pipeline included: 1) dimensionality reduction with principal component analysis; 2) evaluating components using the Infomax algorithm and ICASSO algorithm (100 iterations); and 3) back reconstruction using the GICA3 algorithm. According to the works of Allen et al. (21) and Yeo et al. (22), 20 independent components (ICs) and seven RSNs were then obtained for further analysis: the default mode network (DMN), the sensorimotor network (SMN), the visual network (VIS), the frontoparietal network (FPN), the dorsal attention network (DAN), the ventral attention network (VAN), and the basal ganglia network (BG). The composite maps and peak coordinates of the ICs and RSNs are shown in Figure 1 and Table S1.
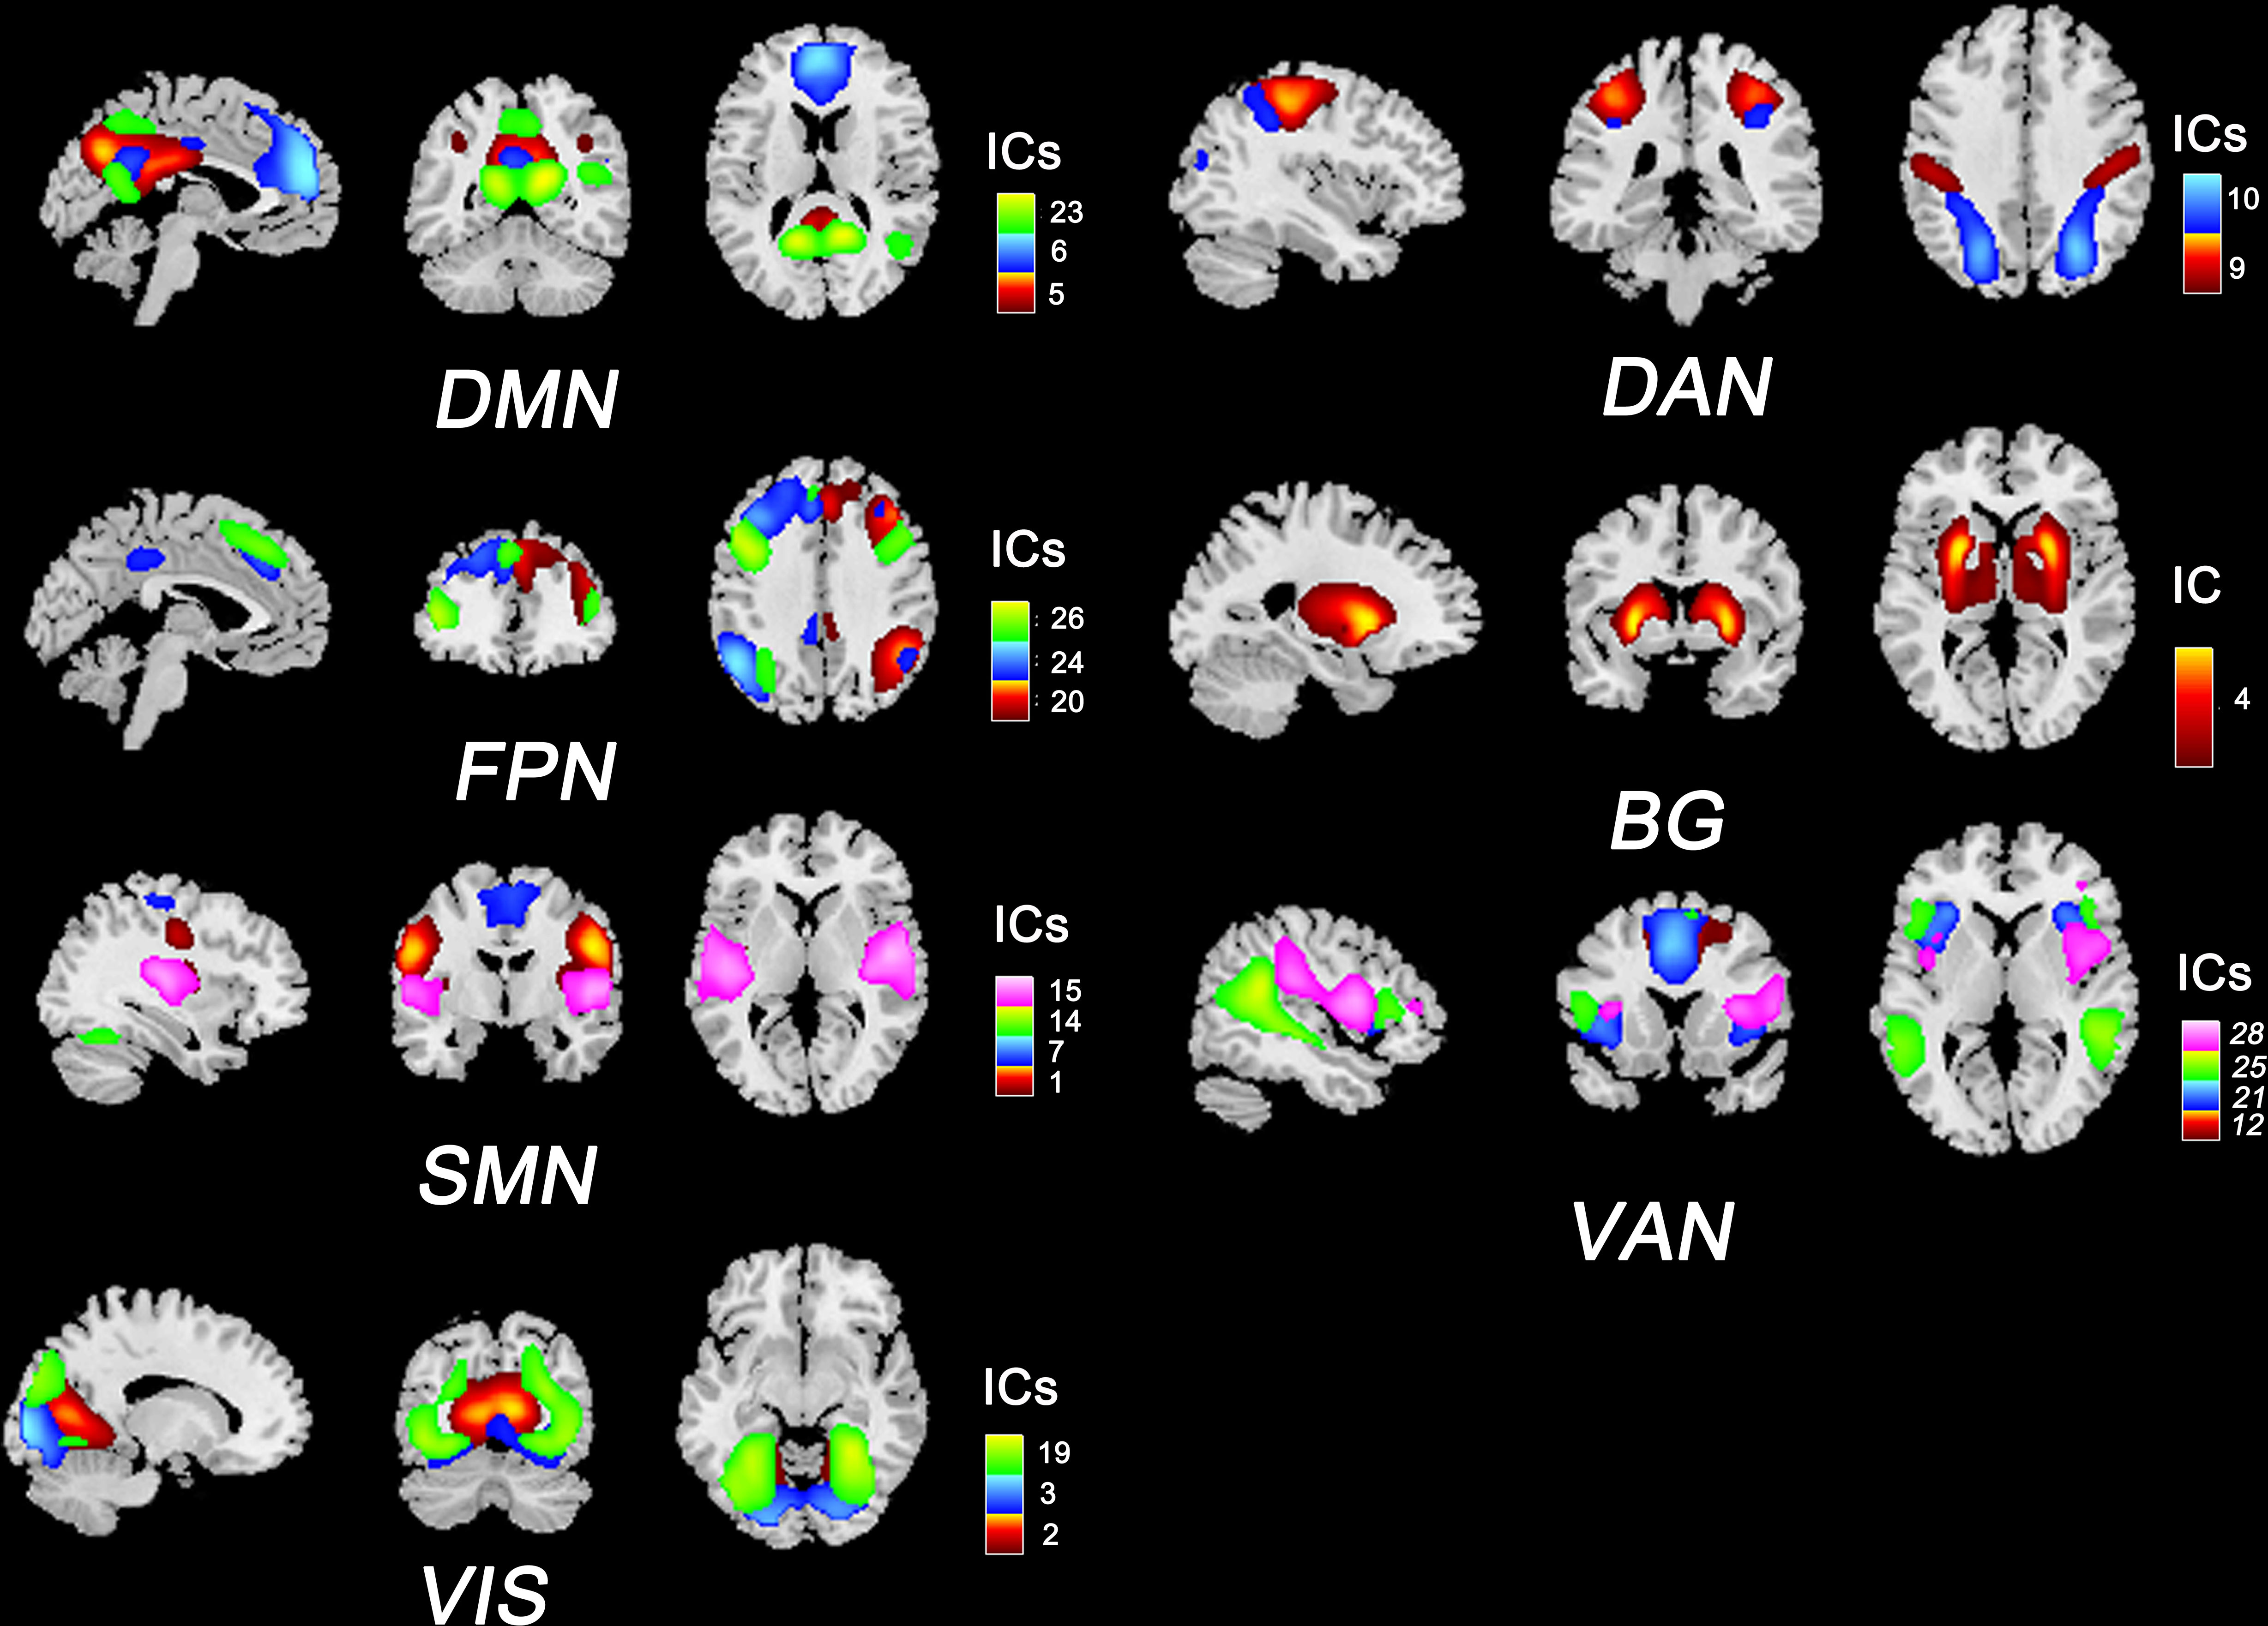
Figure 1 Composite maps of 20 independent components and seven RSNs. The number and color of each component correspond to the color bars. DMN, default mode network; SMN, sensorimotor network; VIS, visual network; FPN, frontoparietal network; DAN: dorsal attention network; VAN, ventral attention network; BG, basal ganglia network.
Multivariate analysis of covariance (MANCOVAN) was applied to assess the significant associations between the spatial map and static connectivity strength of the RSNs and group status (RRMS females, RRMS males, healthy females, and healthy males). We used univariate tests and regressed the age, mean FD, and multicenter variables as covariates to evaluate the effects of disease and sex.
To assess the intra-network connectivity strength, SMs were thresholded based on the distribution of voxelwise T statistics (i.e., mean ± 4SD) to evaluate the consistent and highly activated voxels within each network. This procedure requires an individual t-test for each voxel within a spatial map with a false discovery rate (FDR) correction at P<0.05.
For inter-network sFNC, we selected the default options to perform postprocessing on subject-specific time courses, including detrending using 3dDespike and filtering using a fifth-order Butterworth low-pass filter with a high-frequency cutoff of 0.15 Hz. Pearson’s correlations were computed for each pair of components and sFNC matrices were obtained for all subjects.
The dFNC was carried out in the Temporal dFNC toolbox in GIFT. A sliding window approach was used with a window width of 22 repetition times (TRs) (44s), a step of 1 TR (2s), and a Gaussian convolution of 3 TRs (6s). Furthermore, using L1 regularized inverse covariance matrix (repeated 10 times) was used to disperse the dFNC matrix, and Fisher’s Z-transformation was applied. Then, K-means clustering with Manhattan distance (150 iterations and five repetitions) was performed to distinguish recurring dFNC patterns within different windows for each subject. According to the elbow criterion, the optimal number of clusters was three or four (k= 3 or 4). The dFNC temporal properties included: 1) fraction time (the total time percentage of one subject staying in a state); 2) mean dwell time (the time each subject spent in a specific state); and 3) transition number (the total number of transitions from one state to another).
The following approaches were to reduce the potential effects of head motion on sFNC and dFNC: 1) subjects with translation > 3 mm or rotation > 3° were excluded; 2) ICA was used to identify and remove motion-related components from the fMRI data (23); 3) rs-fMRI time courses were detrended using 3dDespike and filtered using a fifth-order Butterworth low-pass filter with a high-frequency cutoff of 0.15 Hz; 4) the mean FD was regressed in the ANOVA tests of sFNC and dFNC between groups; and 5) six motion-realignment parameters were regressed on the sFNC and dFNC matrix for each subject.
Figure 2 shows the flow chart of the Methods. The demographic data, lesion volume, and other clinical variables were analyzed in SPSS 23.0. We applied Kolmogorov–Smirnov tests to evaluate the normality of the clinical data and ANOVA or Mann–Whitney U tests for differences between groups. One-way ANOVA and post hoc tests (P<0.05) with FDR correction were performed to evaluate significant associations between the SM, sFNC, and dFNC of the RSNs and group status: 1) healthy female vs. healthy male; 2) RRMS female vs. healthy female; 3) RRMS male vs. healthy male; and 4) RRMS female vs. RRMS male. Moreover, we used the Mann–Whitney U test (P<0.01) to compare the temporal features of the dFNC between groups. Receiver operating characteristic (ROC) curves analysis assessed the performance of static and dynamic indicators in distinguishing RRMS from healthy controls. Spearman or partial correlation analysis was applied to explore the relationships between altered functional or structural measures and clinical variables. The ANOVA and correlation analysis were applied with age, mean FD, and multi-center variables as covariates or control variables. Moreover, to investigate the effect of gray matter volume on functional networks, we also supplemented the ANOVA analysis with gray matter volume as a confounding factor between groups.
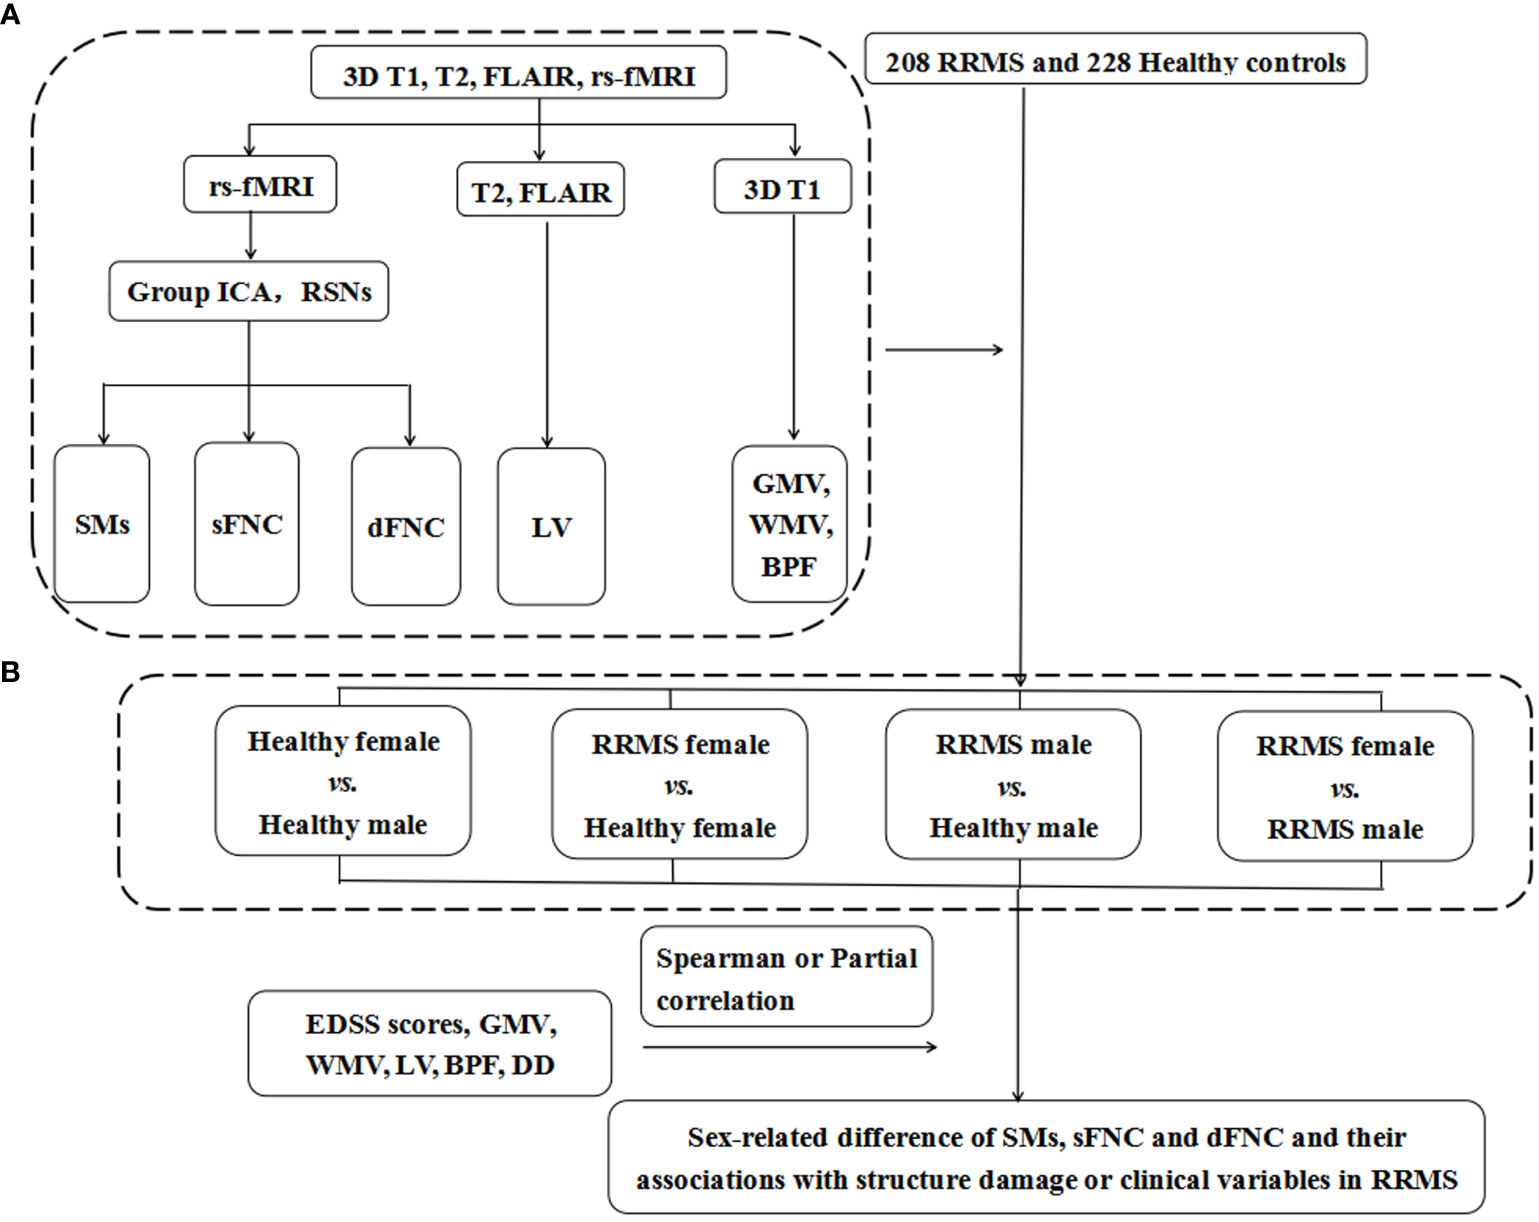
Figure 2 The flow chart of Materials and Methods. (A) The data of 3DT1, T2, rs-fMRI, and FLAIR images were preprocessed and postprocessed to calculate functional and structural indicators for each subject, including the SMs, sFNC, and dFNC and LV, GMV, WMV, and BPF. (B) A total of 208 RRMS patients and 228 healthy controls were recruited for this study, and they were divided into four groups according to sex. We compared the differences in SMs, sFNC, and dFNC between the above four groups to determine the sex effects in patients with RRMS. RRMS, relapsing-remitting multiple sclerosis; rs-fMRI, resting-state functional MRI; FLAIR, fluid-attenuated inversion recovery; Group ICA, group independent component analysis; RSNs, resting-state networks; SMs, spatial maps; sFNC, static functional network connectivity; dFNC, dynamic functional network connectivity; GMV, gray matter volume; WMV, white matter volume; BPF, brain parenchyma fraction; LV, lesion volume; DD, disease duration; EDSS score, Extended Disability Status Scale score.
The choice of window width for a sliding window method is a matter of debate. Previous studies have suggested that a window width between 30 s and 60 s could extract physiological signals (24, 25) and was not affected by noise. Thus, we also added the results of a window width of 30 TRs and the number of clusters of three or four (k=3 or 4).
Correspondence and requests for the data can be addressed to our corresponding author, Fuqing Zhou.
Table 1 shows all demographic data and group statistics. Lower GMV, WMV, and BPF were shown in RRMS patients compared with controls (P ≤ 0.002). Male RRMS patients showed higher GMV and WMV than female patients (P<0.001), but there was no statistically significant difference in BPF between female and male RRMS patients (P=0.423). Among the patients with RRMS, male patients had a higher lesion load (P=0.041) than female patients, even though the recruited RRMS patients were matched between sexes for age, disease course, and clinical disability. There was no significant difference in age or mean FD between the RRMS groups and healthy controls (P: 0.101-0.730).
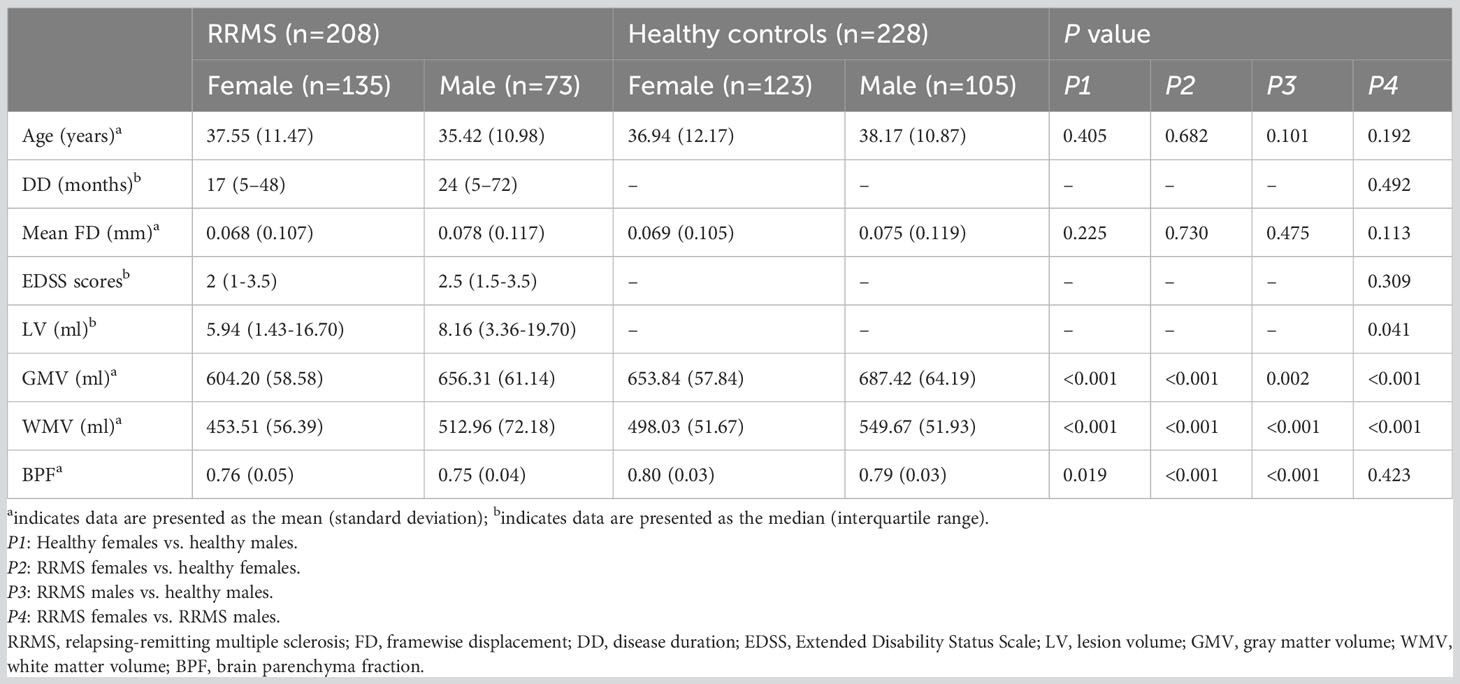
Table 1 Demographic data and clinical characteristics.
In healthy controls, healthy males showed lower SMs within the DMN (bilateral precuneus) and lower sFNC within the SMN and SMN-VIS compared with healthy females (P<0.05, FDR corrected) (Figures 3A1, A2). However, this sex difference disappeared between female and male patients with RRMS. Compared with healthy controls, only RRMS males exhibited decreased SMs within DAN, increased sFNC within PFN, and reduced sFNC of SMN-PFN, SMN-VIS, and SMN-VAN (P<0.05, FDR corrected) (Figures 3B1, B2). There was no significance in RRMS females vs. healthy females and RRMS females vs. RRMS males.
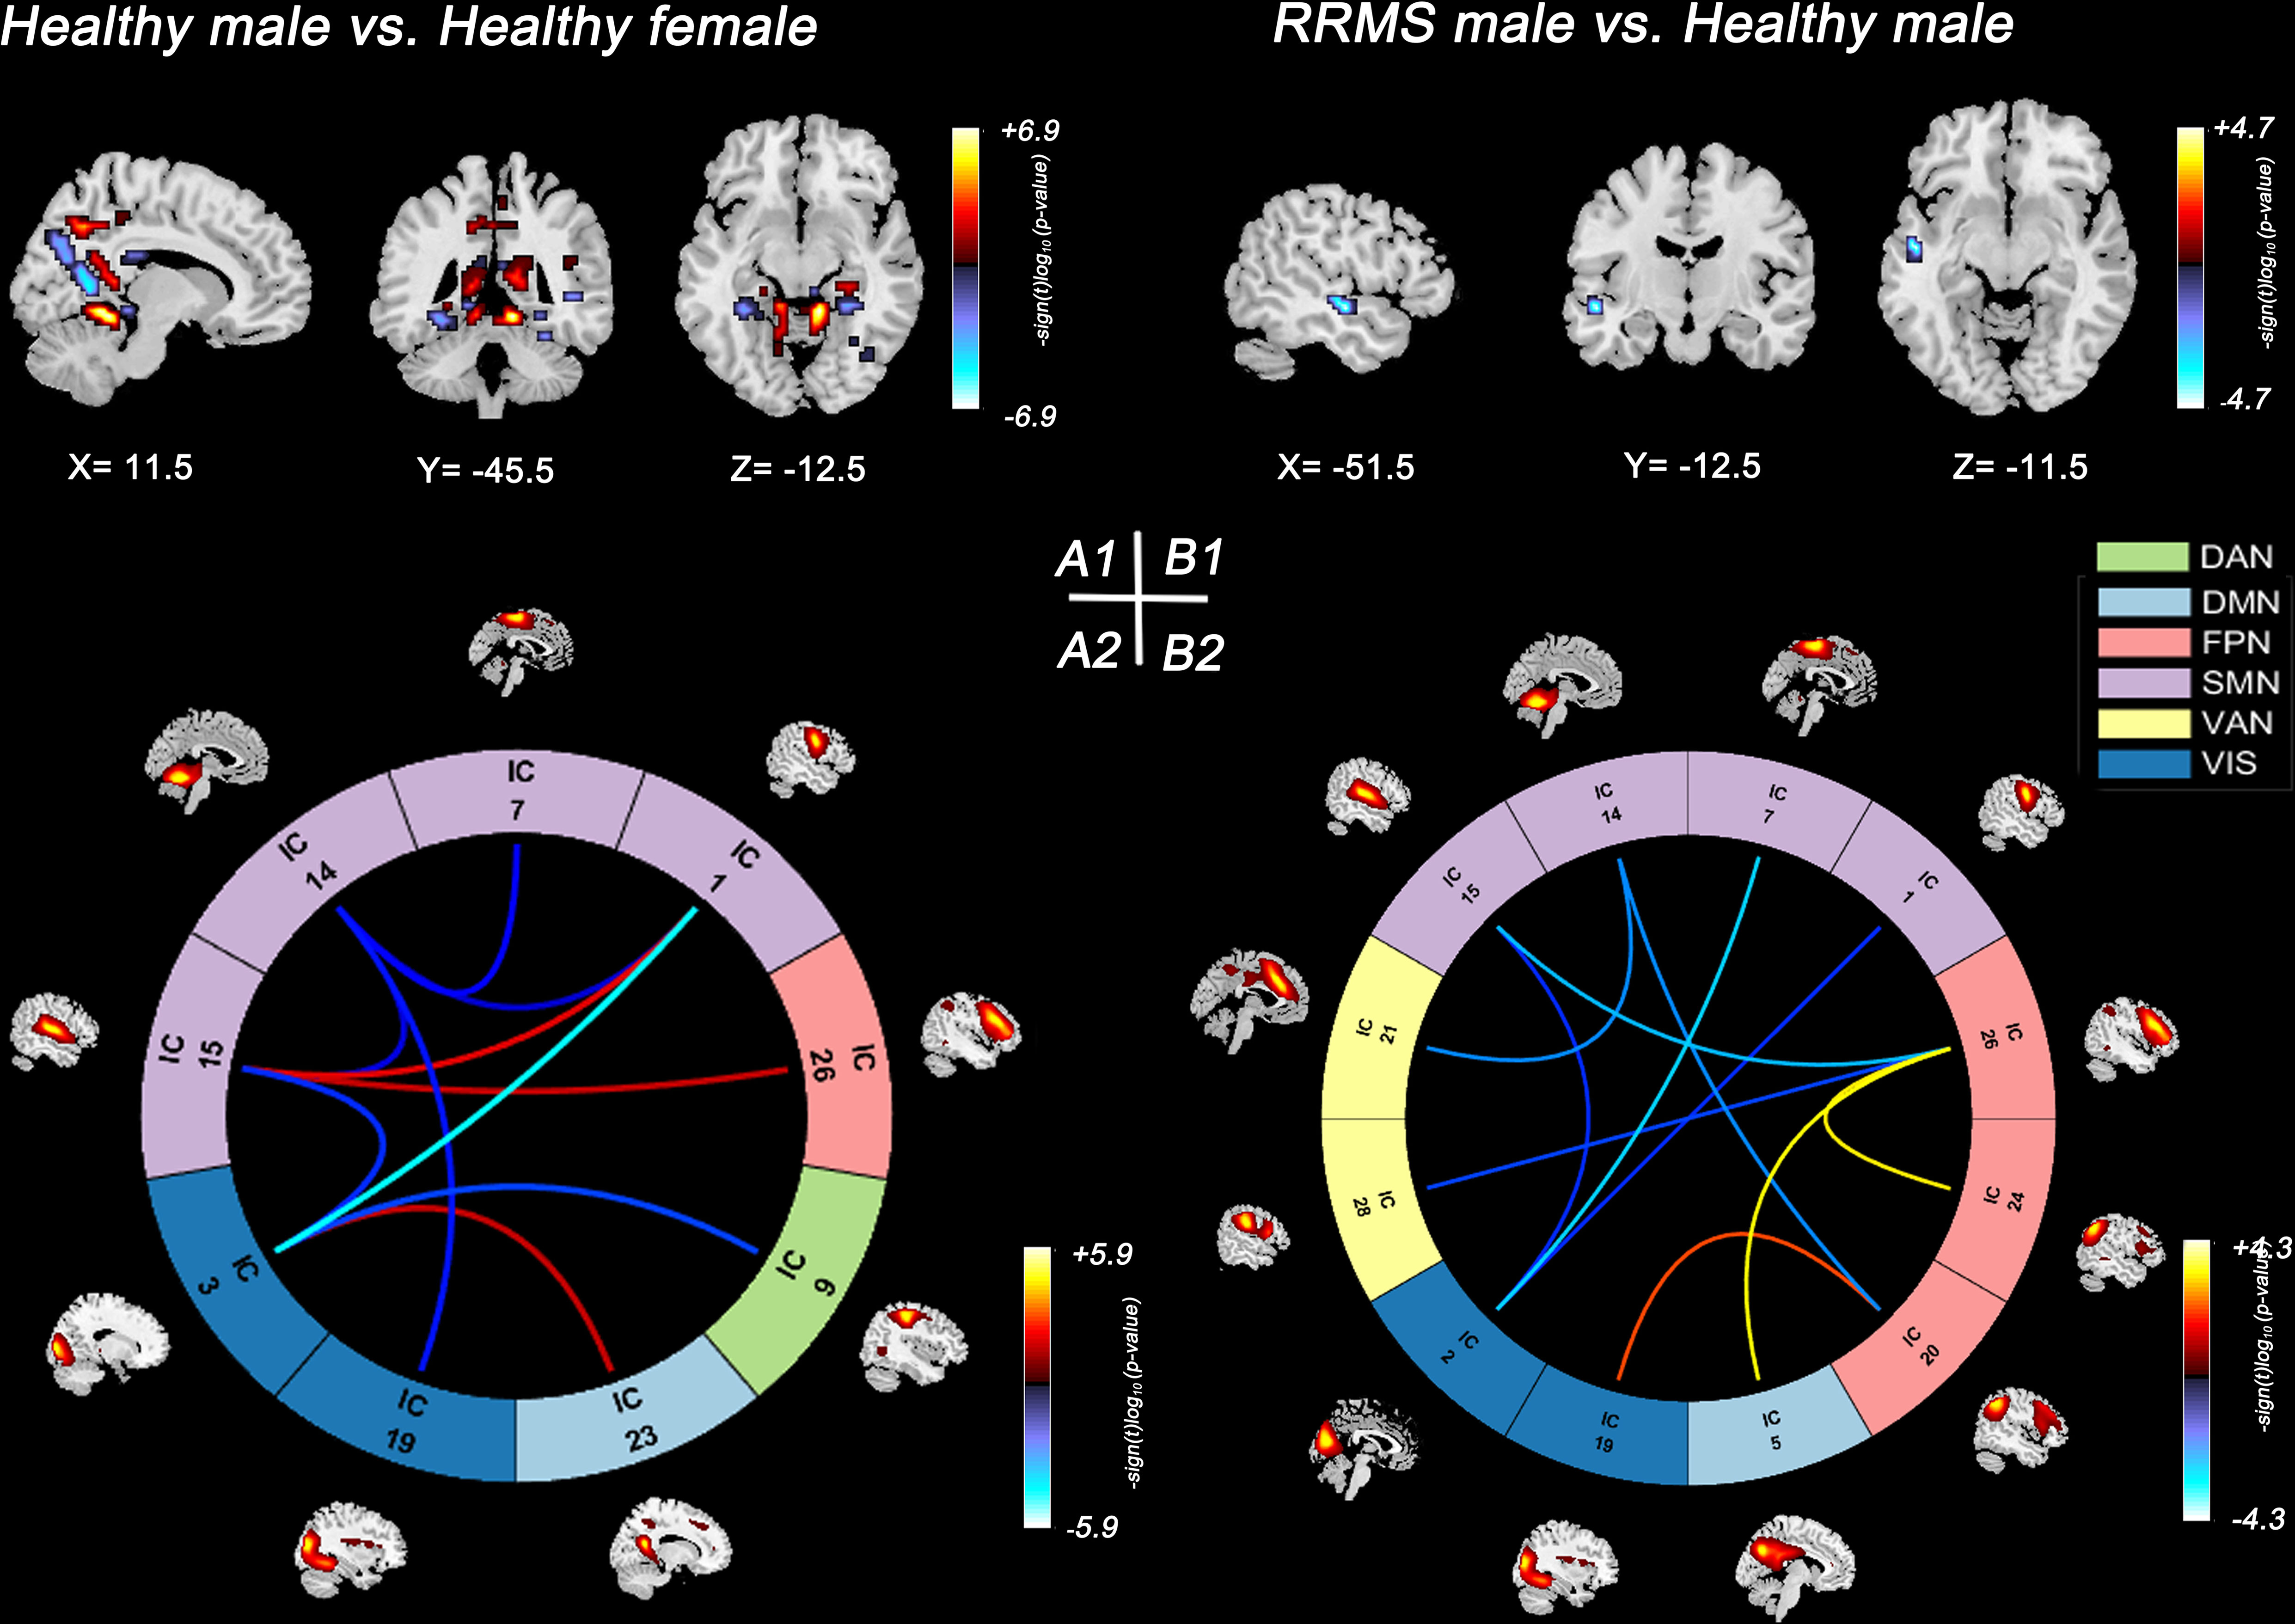
Figure 3 Significant results of the voxel-level comparison of RSN maps and sFNC between groups. Spatial maps of significant voxels (A1) and sFNC (A2) of RSNs in healthy groups, P<0.05, FDR corrected. Spatial maps of significant voxels (B1) and sFNC (B2) of RSNs between RRMS males and healthy males, P<0.05, FDR corrected. Significant cluster volume>10. RRMS, relapsing-remitting multiple sclerosis; DMN, default mode network; SMN, sensorimotor network; VIS, visual network; FPN, frontoparietal network; DAN, dorsal attention network; VAN, ventral attention network.
First, three recurrent dFNC states were identified after cluster analysis: State 1 (sparse connected state; 49%), State 2 (middle connected state; 36%), and State 3 (high connected state; 15%) (Figure 4A). State 1 was characterized by sparse connectivity both within and between networks, whereas State 3 showed a tightly connected matrix. State 2 was a transitional state between State 1 and State 3, which featured decreased dFNC between the SMN and DMN or FPN and increased dFNC within the DMN, FPN, SMN, and VIS. Figure 4B shows the percentage of specific states for each group: healthy females showed higher percentage in State 2 (99%), whereas healthy males and RRMS patients showed higher percentage in State 1 (98%, 99%,99%, respectively).
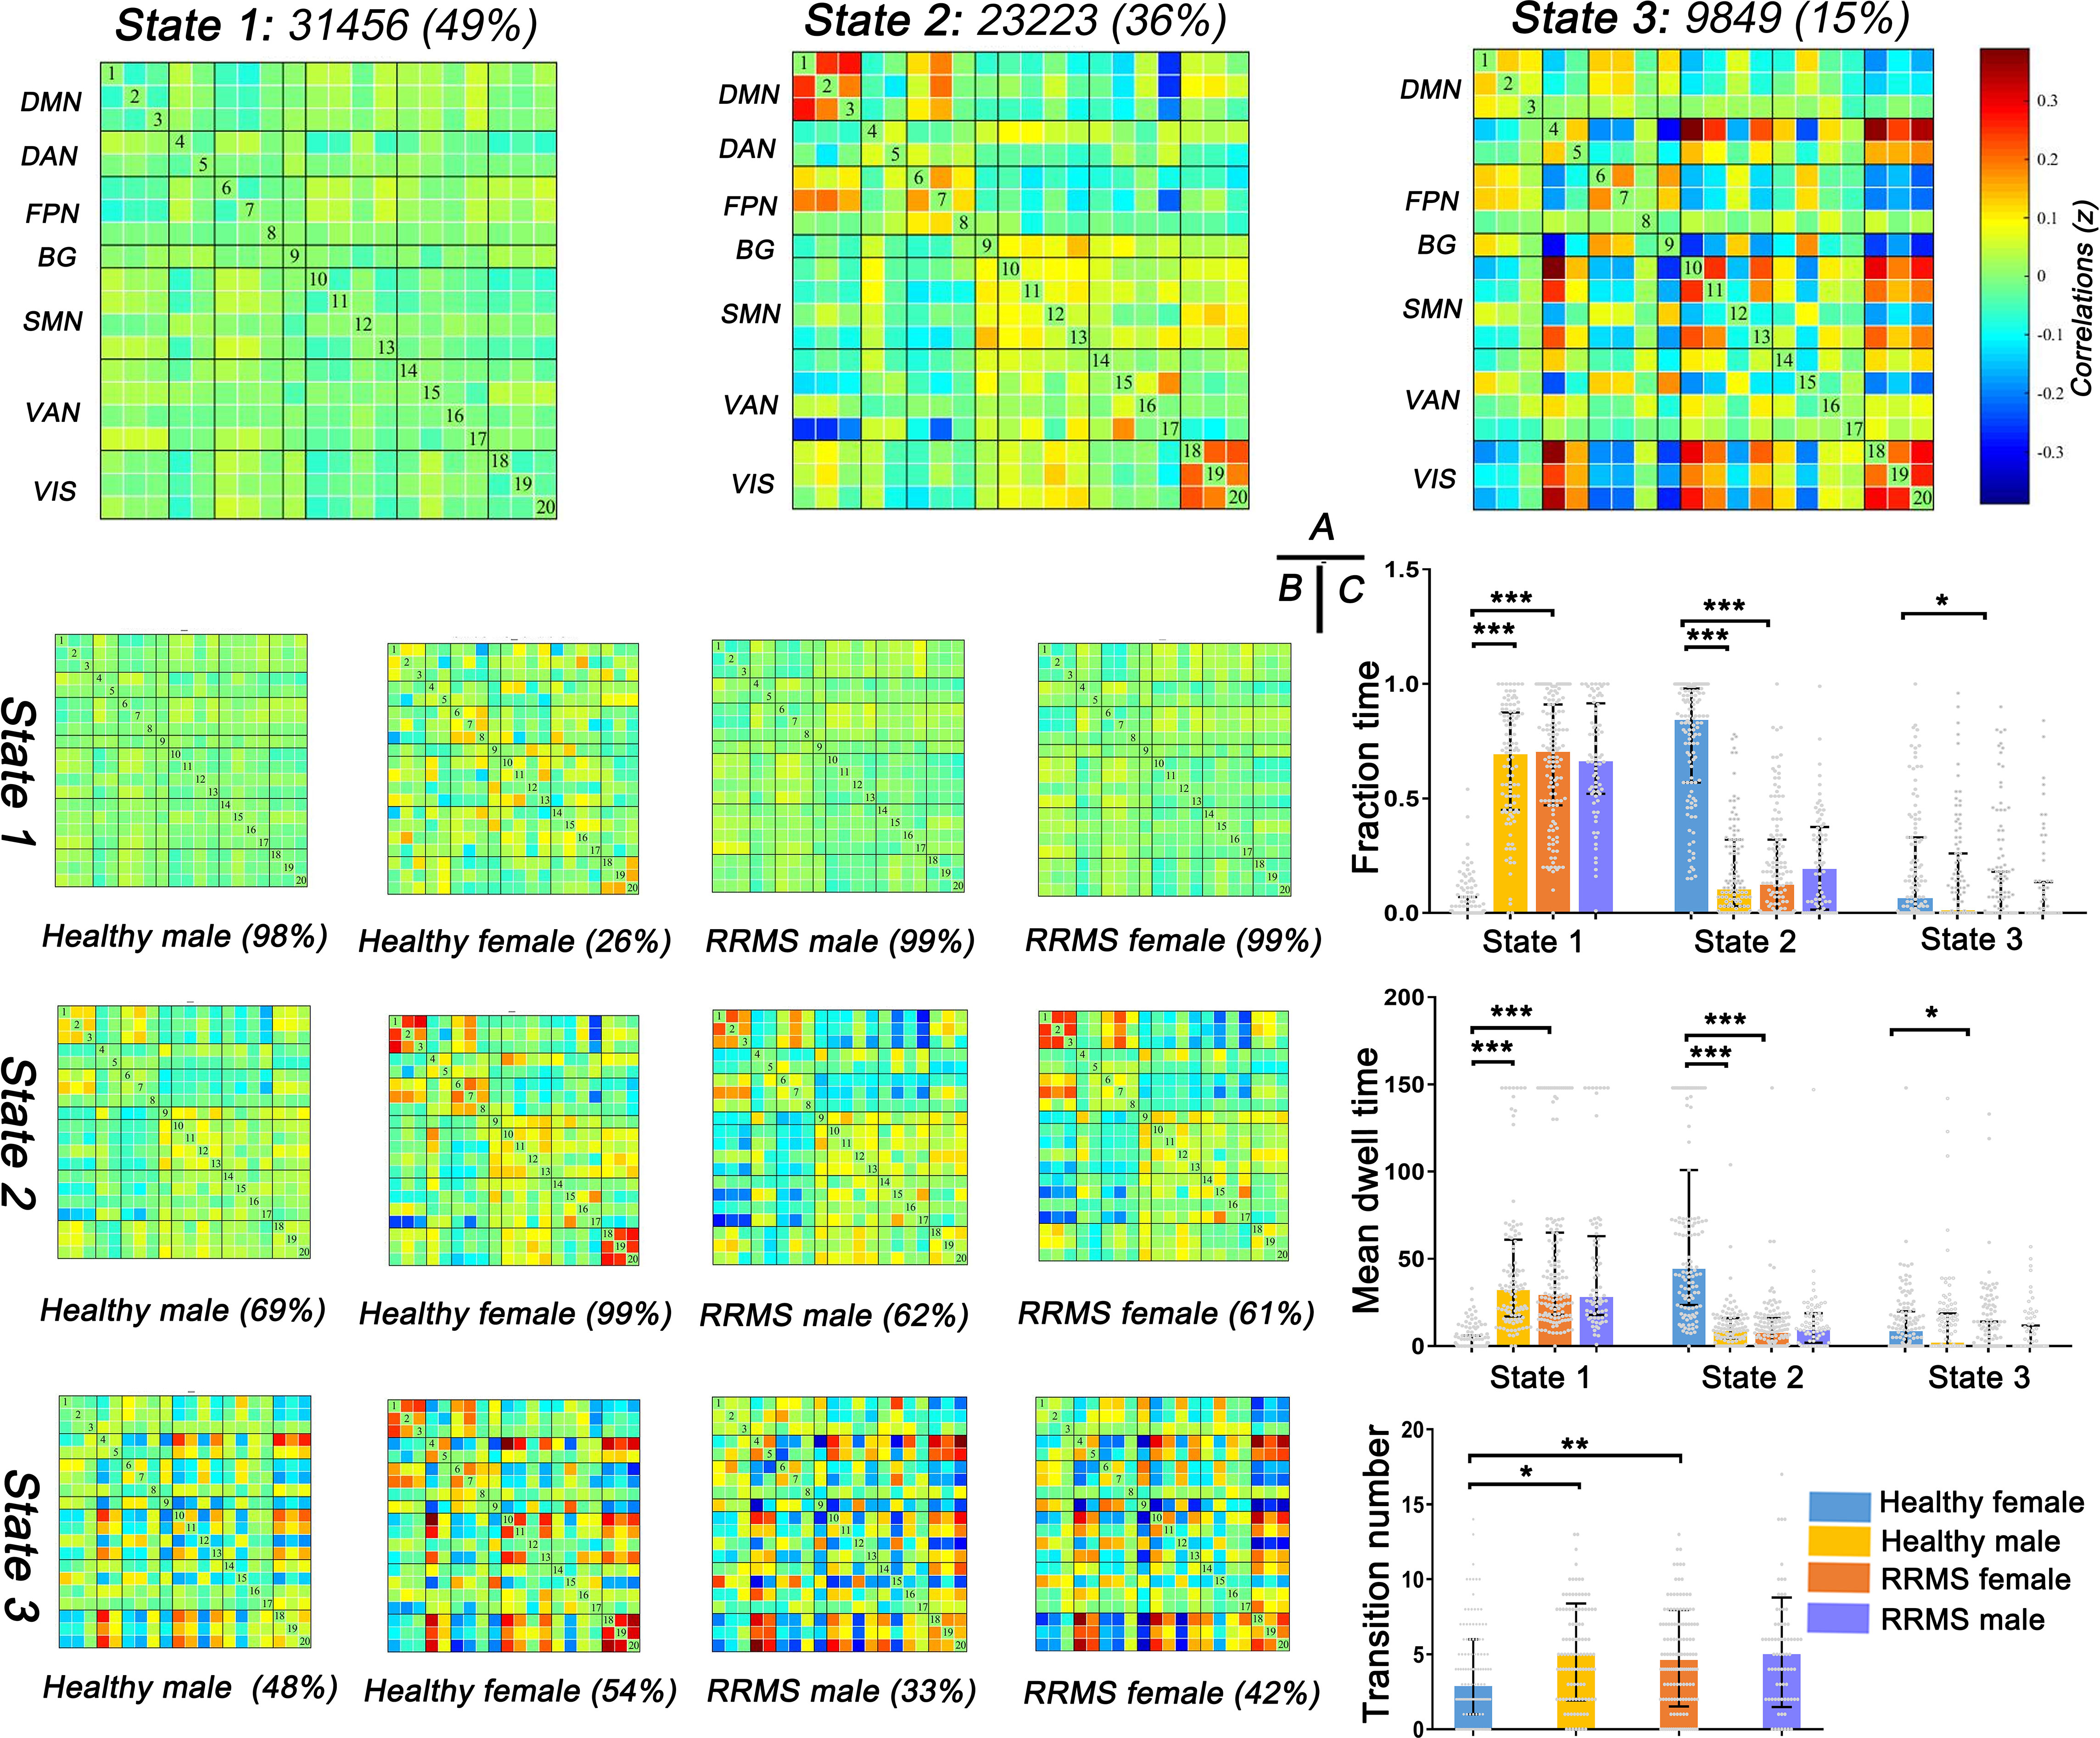
Figure 4 Results of clustering analysis and between-groups dynamic temporal properties. (A) Three dFNC states for all subjects with the total number of occurrences and percentage of total occurrences. (B) The specific connectivity state for each group. The percentage is calculated as the ratio of the number of subjects who entered one state to the total number of subjects in each group. (C) Significant differences in the temporal properties in healthy controls and RRMS groups: healthy females showed a higher fraction time and more dwell time in State 2 (P<0.001) with lower transitions (P=0.012) compared with healthy males, while female RRMS patients exhibited a higher fraction time and more dwell time in State 1 (P<0.001) and higher transitions (P=0.004) relative to healthy females. Fraction time: the total time percentage of one subject staying in a state. Mean dwell time: the time each subject spent in a specific state. Transition number: the total number of subject transitions from one state to another. *** indicates P<0.001, ** means P<0.01, * means P<0.05. RRMS, relapsing-remitting multiple sclerosis; DMN, default mode network; SMN, sensorimotor network; VIS, visual network; FPN, frontoparietal network; DAN, dorsal attention network; VAN, ventral attention network; BG, basal ganglia network.
Next, the temporal properties of dFNC revealed significant differences in fraction time, mean dwell time, and transitions among the three states among the groups (Figure 4C). Compared with healthy males, healthy females showed a higher fraction time (healthy female vs. healthy male: 85% vs. 11%; P<0.001) and more dwell time in State 2 (healthy female vs. healthy male: 45.33s vs. 4.42s; P<0.001) with lower transitions (healthy female vs. healthy male: three times vs. five times; P=0.035). However, the tendency changed once RRMS was established; female RRMS patients exhibited a higher fraction time (RRMS female vs. healthy female: 71% vs. 0%; P<0.001) and more dwell time in State 1 (RRMS female vs. healthy female: 30.25s vs. 0.00s; P<0.001) and higher transitions (RRMS female vs. healthy female: four times vs. three times; P=0.004), relative to healthy females. No statistical difference was seen in RRMS males vs. healthy males and RRMS females vs. RRMS males. Furthermore, ROC curve analysis found that the fraction time and mean dwell time of State 1 could significantly distinguish female patients from controls [areas under the curve (AUC): 0.838, 0.896, respectively] (Data Sheet 1, Figure S1).
Lastly, we also evaluated the dFNC differences between the healthy controls and RRMS groups. Similar to the results of the dFNC temporal properties, the dFNC pattern alterations were seen only in female groups: compared with healthy males, healthy females exhibited higher dFNC within DMN, FPN, and VIS in all states (P<0.05, FDR corrected) (Figure 5A). On the contrary, this trend disappeared among RRMS patients. Moreover, compared with healthy females, female patients mainly showed lower dFNC in all states, particularly within the DMN, FPN, and VIS (P<0.05, FDR corrected) (Figure 5B). There was no dynamic significance in RRMS males vs. healthy males and RRMS females vs. RRMS males.
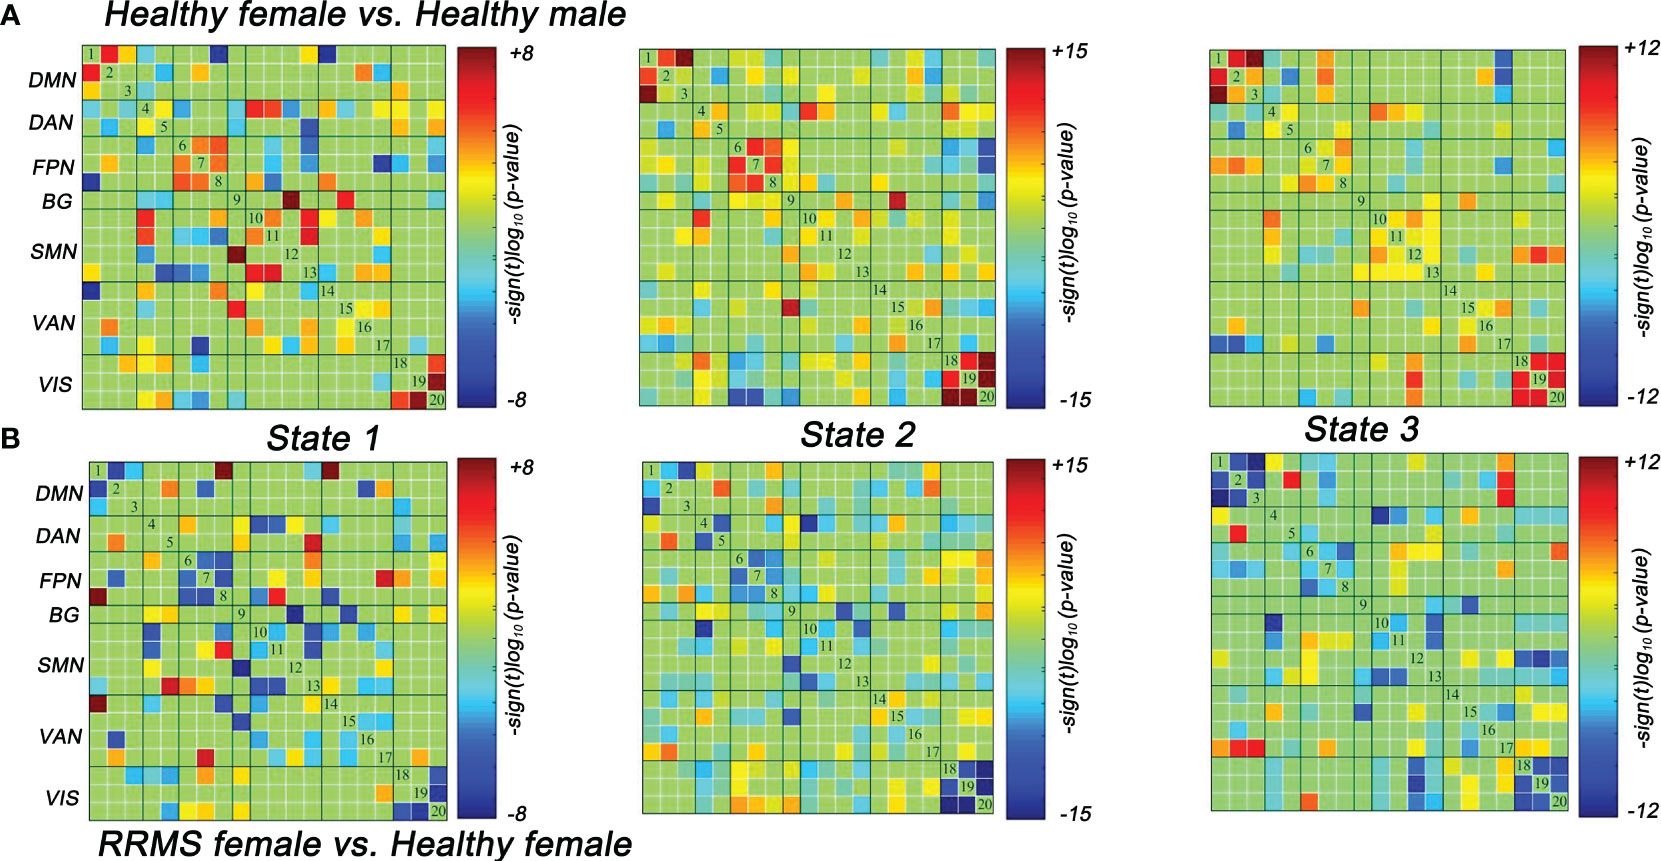
Figure 5 Significant differences in dFNC between groups. (A) Healthy females showed significantly higher dFNC within DMN, PFN, and VIS compared with healthy males (P<0.05, FDR corrected). (B) RRMS females showed significantly lower dFNC within DMN, PFN, and VIS compared with healthy females (P<0.05, FDR corrected). RRMS, relapsing-remitting multiple sclerosis; DMN, default mode network; SMN, sensorimotor network; VIS, visual network; FPN, frontoparietal network; DAN, dorsal attention network; VAN, ventral attention network; BG, basal ganglia network.
We next analyzed the between-group differences in functional network with gray matter volume as a covariate, and we found that gray matter volume had no significant effect on the results of SMs, sFNC and dFNC between RRMS groups and healthy controls. For more detailed results (including the description), see Data Sheet 2, Figures S2–S4.
In RRMS females, the lower fraction time (r = 0.224, P = 0.011) and mean dwell time (r = 0.305, P < 0.001) of State 1 related to lower GMV, and the higher numbers of transitions related to lower GMV (r=-0.314, P<0.001) and lower WMV (r=-0.225, P=0.011). For RRMS males, decreased sFNC of SMN-FPN was related to lower GMV (r=-0.311, P=0.012) and BPF (r=−0.284, P=0.022). The correlations with significant p values (P<0.05) are shown in Figure 6, Tables S2, S3.
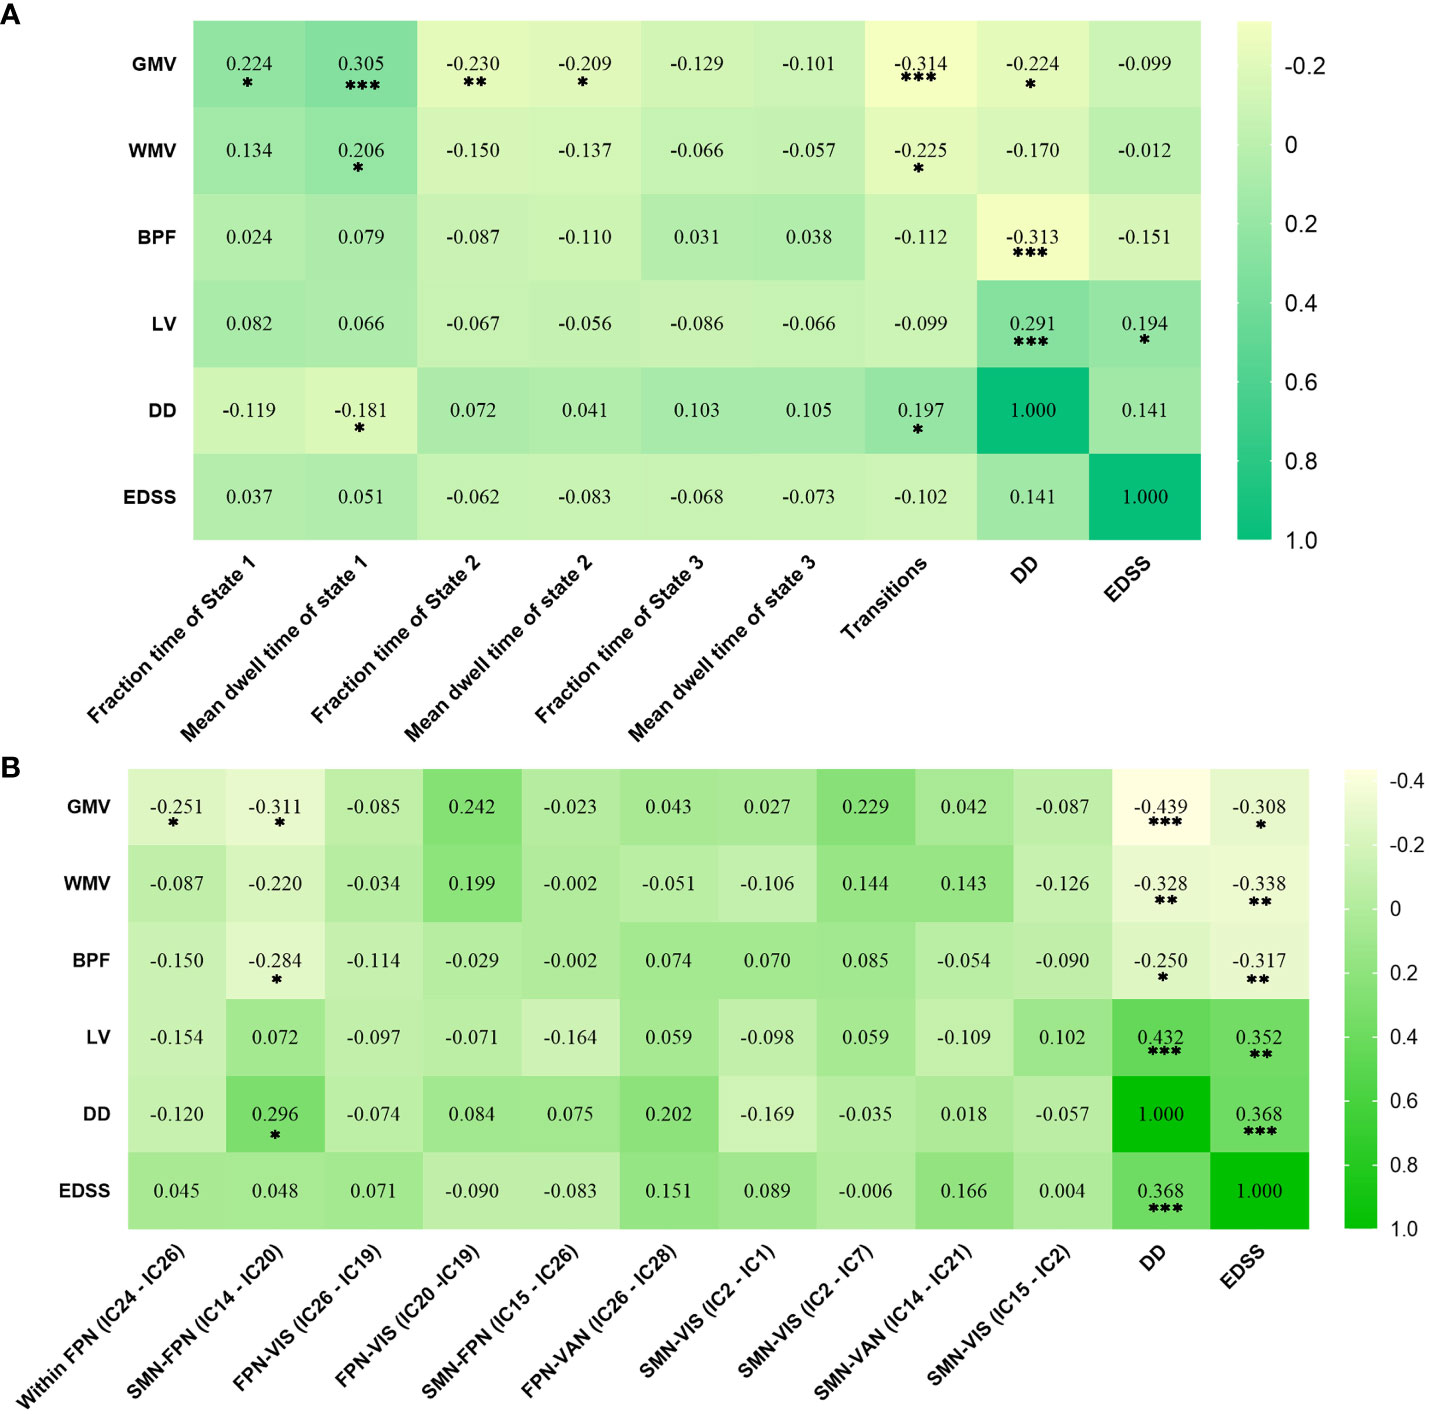
Figure 6 Significant correlation analysis results of RRMS patients. (A) Correlation results in female RRMS patients. (B) Correlation results in male RRMS patients. ***indicates P<0.001, **means P<0.01, *means P<0.05. Abbreviations: RRMS, relapsing-remitting multiple sclerosis; GMV, gray matter volume; WMV, white matter volume; BPF, brain parenchyma fraction; LV, Lesion volume, EDSS, extended disability status scale; DD, disease duration.
In these replication analyses, when the window width was 30 TRs or 22 TRs, and the clustering state was 3 or 4, we found that RRMS affected dFNC patterns and its temporal properties only in female patients with RRMS, indicating the dFNC results were very stable, reliable, and repeatable. The details are as follows:
The differences of temporal properties between groups suggested that RRMS females preferred State 1 (sparse connected state) and spent more time in State 1 compared with healthy females (P<0.001) (Figures S5–S7).
The dFNC differences between groups suggested that RRMS females showed decreased dFNC within DMN, FPN, and VIS in all states compared with healthy females (P<0.05, FDR corrected) (Figures S8–S10).
Our study investigated the between-group differences in the strength and time-varying connectivity of brain networks between RRMS and healthy subjects by sex and the associations with structural damage and disability. sFNC alterations were only observed in male patients with increased sFNC within the FPN and decreased sFNC across the SMN-FPN and SMN-VIS networks, whereas dFNC abnormalities were observed only in female RRMS patients, manifested as a higher fraction time and more dwell time in State 1 (sparse connected state) with lower transitions compared with healthy females. A higher fraction time and more dwell time of State 1 could significantly distinguish female patients from controls. Altered sFNC and altered temporal properties were related to structural damage in RRMS patients.
Given the disease damage to the brain, it is easy to understand that RRMS patients have lower gray matter and white matter volumes compared with healthy controls, and atrophy of gray and white matter has been reported in MS (26). However, RRMS males still had a higher lesion burden compared with female patients, even though the recruited RRMS patients were matched for age, disease duration, and clinical disability between sexes. This is consistent with previous studies that male patients seem to have a higher level of brain structural damage (9, 13). Further analysis of sFNC revealed increased and reduced sFNC in only male patients with RRMS compared with controls, mainly decreased sFNC across the SMN-FPN and SMN-VIS networks; these results remained after regressing gray matter volume. Our findings could be understood by the “network collapse”, a widely accepted model for explaining sFNC changes in MS proposing that sFNC change is a dynamic process and network efficiency tends to deteriorate with subsequent declines in sFNC, due to progressive brain structural damage and the reduced compensatory capacity of functional networks in MS (27). Furthermore, these functional networks have been widely reported in MS, and functional reorganization of the SMN occurs in all stages of relapse, remission, and recovery in RRMS, and are closely related to clinical disability (28, 29). Furthermore, functional changes in the FPN and VIS are involved in cognitive dysfunctions in RRMS patients, including attention (30), working memory (31), and visual information processing (32).
We analyzed the correlation analysis between structural measures and connectivity changes and found that there was no correlation in statistics between lesion load and altered connectivity in both female and male patient cohorts. These results may indicate that the sFNC reorganization in MS patients may be caused by multiple factors, such as damage of gray matter and white matter (33, 34). Indeed, our study found that the decreased sFNC of FPN-SMN was associated with lower BPF and GMV in RRMS males. Our findings support the hypothesis that male RRMS patients may have a higher degree of static connectivity impairment based on functional network evidence, and these functional reorganizations may be associated with structural damage. Recently, a systematic review found no clear trend towards one FC direction change in MS, which may be associated with the large heterogeneity within and between different study cohorts (e.g., different fMRI indicators, MS phenotypes, disease status, duration, and age) (35). Hence, our results still need to be interpreted cautiously.
Three recurring states were identified for dFNC. State 1, a sparse connected state, is characterized by overall lower connectivity within and between networks; it possibly reflects the baseline state of minimal activity between brain neurons at rest. State 2 and State 3 are more tightly connected states within or between the DMN, FPN, SMN, and VIS, which may suggest the active states of cognitive and motor networks aroused by the brain. Results of the dFNC temporal properties showed that female RRMS patients exhibited a higher fraction time and more dwell time with lower transitions in State 1 rather than State 2 usually exhibited among healthy females, suggesting that RRMS could cause the transition from the active state of cognitive networks (State 2) to the baseline state (State 1) with sparse connectivity in female patients. These results are supported by a recent longitudinal study, which found decreased dFNC even in clinically isolated syndromes, and the reduced dynamics were more significant over time. Importantly, the functional connectivity within a tightly connected state at baseline could predict cognitive performance after 5 years in MS (36).
Moreover, further ROC analysis indicted that the fraction time and mean dwell time of State 1 could discriminate female patients with RRMS from healthy females. The sparse connected state (State 1) is the most frequent dFNC state for RRMS patients, which is consistent with the findings of Hidalgo et al., which also observed that the decreased dFNC of State 1 was associated with poor motor and cognitive performance in MS patients (37). Our results indicated that the temporal properties of State 1 may be potential neuroimaging markers in female patients. Interestingly, the lower fraction and dwell time of State 1 related to lower GMV, and the higher numbers of transitions related to gray and white matter atrophy. These findings may suggest that female patients still trend toward dynamic functional compensation in response to structural damage in the early stages of disease, even if such functional compensation is unsuccessful.
Dynamic reorganization was only seen in female RRMS patients: reduced connectivity mainly within the DMN, FPN, and VIS in all states. These findings are consistent with a recent study into dynamic eigenvector centrality, which revealed that cognitively impaired MS patients had decreased dynamics in the DMN, FPN, and VIS compared with healthy controls (38). Our results further indicated that female patients not only show the transition of cognitive-related networks (from State 2 to State 1), but also decreased dFNC within the cognitive networks. As such, we speculate that altered dFNC temporal properties and decreased dFNC within the cognition networks may be maladaptive approaches to maintaining functioning in female patients.
However, the mechanism of how RRMS affects functional networks by sex is still unclear. It may be associated with the complex interactions of sex hormone levels, regulation of the immune system, and certain MS susceptibility genes (39–41). Studies have suggested that sex hormones may have beneficial effects on reducing inflammation and neurodegeneration in MS, which were confirmed in mouse models of MS/demyelination (42, 43). Although a previous study has reported gray matter loss associated with ovarian aging in MS (44), there is still a lack of research on how sex hormones affect functional network connectivity in MS patients. Moreover, recent studies have shown that sex is an important regulator of functional network reorganization in both healthy people and patients with Alzheimer’s disease (45). Exploring sex-related differences in functional connectivity could provide important information to characterize the brain and cognitive changes of RRMS patients.
Our study is not without limitations. It is still preliminary work and may be affected by different disease durations, disabilities, and disease states. Thus, further research should be carried out based on these points to verify our results. Although our results revealed that female RRMS patients showed reduced dFNC on cognition-related networks, the lack of cognitive-related assessments limited our interpretation of cognitive-related networks (e.g., DMN) due to the retrospective design.
In conclusion, our study found that RRMS affected static connectivity in males and dynamic connectivity in females, suggesting that sex-related effects may be important factors for functional damage and reorganization of the CNS in RRMS patients. Exploring these sex-related differences might increase the possibility of sex-specific approaches to treating RRMS in the future.
The raw data supporting the conclusions of this article will be made available by the authors, without undue reservation.
The studies involving human participants were reviewed and approved by Ethics Committee of The First Affiliated Hospital of Nanchang University. The patients/participants provided their written informed consent to participate in this study. Written informed consent was obtained from the individual(s) for the publication of any potentially identifiable images or data included in this article.
YW, FZ, YXL, and YD contributed to drafting/revising the manuscript. YLW contributed to data analysis. ZZ, NZ, XH, and CZ performed the statistical analysis. XC, MH, YZ, HL, and GC contributed to MRI data acquisition and analysis. JS and YML contributed to interpretation of the data. All authors approved and take public responsibility for the version to be published.
The study was supported by the National Natural Science Foundation of China (Grant Number: 81771808).
The authors thank the other local centers for the support in data collection.
The authors declare that the research was conducted in the absence of any commercial or financial relationships that could be construed as a potential conflict of interest.
All claims expressed in this article are solely those of the authors and do not necessarily represent those of their affiliated organizations, or those of the publisher, the editors and the reviewers. Any product that may be evaluated in this article, or claim that may be made by its manufacturer, is not guaranteed or endorsed by the publisher.
The Supplementary Material for this article can be found online at: https://www.frontiersin.org/articles/10.3389/fimmu.2023.1216310/full#supplementary-material
Supplementary Figure 1 | Receiver operating characteristic curve of dFNC temporal properties. AUC, areas under the curve.
Supplementary Figure 2 | Significant results of voxel-level comparison of RSN maps and sFNC between groups with gray matter volume as a covariate. Spatial maps of significant voxels (A1) and sFNC (A2) of RSNs in healthy groups, P<0.05, FDR corrected. Spatial maps of significant voxels (B1) and sFNC (B2) of RSNs between RRMS males and healthy males, P<0.05, FDR corrected. Significant cluster volume>10. RRMS, relapsing-remitting multiple sclerosis; DMN, default mode network; SMN, sensorimotor network; VIS, visual network; FPN, frontoparietal network; DAN, dorsal attention network; VAN, ventral attention network.
Supplementary Figure 3 | Results of clustering analysis and between-groups dynamic temporal properties with gray matter volume as a covariate. (A) Three dFNC states for all subjects with the total number of occurrences and percentage of total occurrences. (B) The specific connectivity state for each group. The percentage is calculated as the ratio of the number of subjects who entered one state to the total number of subjects in each group. (C) Significant differences in the temporal properties in healthy controls and RRMS groups: healthy females showed a higher fraction time (P<0.001) and more dwell time in State 2 (P<0.001) with lower transitions (P<0.001) compared with healthy males, while female RRMS patients exhibited a higher fraction time (P<0.001) and more dwell time in State 1 (P<0.001) and higher transitions (P=0.005) relative to healthy females. Fraction time: the total time percentage of one subject staying in a state. Mean dwell time: the time each subject spent in a specific state. Transition number: the total number of subject transitions from one state to another. *** indicates P<0.001, ** means P<0.01, * means P<0.05. RRMS, relapsing-remitting multiple sclerosis; DMN, default mode network; SMN, sensorimotor network; VIS, visual network; FPN, frontoparietal network; DAN, dorsal attention network; VAN, ventral attention network; BG, basal ganglia network.
Supplementary Figure 4 | Significant differences in dFNC between groups with gray matter volume as a covariate. (A) Healthy females showed significantly higher dFNC within DMN, PFN, and VIS compared with healthy males (P<0.05, FDR corrected). (B) RRMS females showed significantly lower dFNC within DMN, PFN, and VIS compared with healthy females (P<0.05, FDR corrected). RRMS, relapsing-remitting multiple sclerosis; DMN, default mode network; SMN, sensorimotor network; VIS, visual network; FPN, frontoparietal network; DAN, dorsal attention network; VAN, ventral attention network; BG, basal ganglia network.
Supplementary Figure 5 | Results of clustering analysis and between-groups dynamic temporal properties when the window width was 22 TRs, the step was 1 TR, and the number of clusters was four. (A) Four dFNC states for all subjects with the total number of occurrences and percentage of total occurrences. (B) The specific connectivity state for each group. The percentage is calculated as the ratio of the number of subjects who entered one state to the total number of subjects in each group. (C) Significant differences in the temporal properties in healthy controls and RRMS groups: healthy females showed a higher fraction time (P<0.001) and more dwell time in State 2 (P<0.001) with lower transitions (P<0.05) compared with healthy males, while female RRMS patients exhibited a higher fraction time (P<0.001) and more dwell time in State 1 (P<0.001) and higher transitions (P=0.005) relative to healthy females. Fraction time: the total time percentage of one subject staying in a state. Mean dwell time: the time each subject spent in a specific state. Transition number: the total number of subject transitions from one state to another. *** indicates P<0.001, ** means P<0.01, * indicates P<0.05. RRMS, relapsing-remitting multiple sclerosis; DMN, default mode network; SMN, sensorimotor network; VIS, visual network; FPN, frontoparietal network; DAN: dorsal attention network; VAN, ventral attention network; BG, basal ganglia network.
Supplementary Figure 6 | Results of clustering analysis and between-groups dynamic temporal properties when the window width was 30 TRs, the step was 1 TR, and the number of clusters was three. (A) Three dFNC states for all subjects with the total number of occurrences and percentage of total occurrences. (B) The specific connectivity state for each group. The percentage is calculated as the ratio of the number of subjects who entered one state to the total number of subjects in each group. (C) Significant differences in the temporal properties in healthy controls and RRMS groups: healthy females showed a higher fraction time (P<0.001) and more dwell time in State 2 (P<0.001) compared with healthy males, while female RRMS patients exhibited a higher fraction time (P<0.001) and more dwell time in State 1 (P<0.001) and higher transitions (P=0.01) relative to healthy females. Fraction time: the total time percentage of one subject staying in a state. Mean dwell time: the time each subject spent in a specific state. Transition number: the total number of subject transitions from one state to another. *** indicates P<0.001, ** means P<0.01. RRMS, relapsing-remitting multiple sclerosis; DMN, default mode network; SMN, sensorimotor network; VIS, visual network; FPN, frontoparietal network; DAN: dorsal attention network; VAN, ventral attention network; BG, basal ganglia network.
Supplementary Figure 7 | Results of clustering analysis and between-groups dynamic temporal properties when the window width was 30 TRs, the step was 1 TR, and the number of clusters was four. (A) Four dFNC states for all subjects with the total number of occurrences and percentage of total occurrences. (B) The specific connectivity state for each group. The percentage is calculated as the ratio of the number of subjects who entered one state to the total number of subjects in each group. (C) Significant differences in the temporal properties in healthy controls and RRMS groups: healthy females showed a higher fraction time (P<0.001) and more dwell time in State 2 (P<0.001) compared with healthy males, while female RRMS patients exhibited a higher fraction time (P<0.001) and more dwell time in State 1 (P<0.001) and higher transitions (P=0.002) relative to healthy females. Fraction time: the total time percentage of one subject staying in a state. Mean dwell time: the time each subject spent in a specific state. Transition number: the total number of subject transitions from one state to another. *** indicates P<0.001, ** means P<0.01, * indicates P<0.05. RRMS, relapsing-remitting multiple sclerosis; DMN, default mode network; SMN, sensorimotor network; VIS, visual network; FPN, frontoparietal network; DAN: dorsal attention network; VAN, ventral attention network; BG, basal ganglia network.
Supplementary Figure 8 | Significant differences in dFNC between groups when the window width was 22 TRs, the step was 1 TR, and the number of clusters was four. (A) Healthy females showed significantly higher dFNC within DMN, PFN, and VIS compared with healthy males (P<0.05, FDR corrected). (B) RRMS females showed significantly lower dFNC within DMN, PFN, and VIS compared with healthy females (P<0.05, FDR corrected). RRMS, relapsing-remitting multiple sclerosis; DMN, default mode network; SMN, sensorimotor network; VIS, visual network; FPN, frontoparietal network; DAN: dorsal attention network; VAN, ventral attention network; BG, basal ganglia network.
Supplementary Figure 9 | Significant differences in dFNC between groups when the window width was 30 TRs, the step was 1 TR, and the number of clusters was three. (A) Healthy females showed significantly higher dFNC within DMN, PFN, and VIS compared with healthy males (P<0.05, FDR corrected). (B) RRMS females showed significantly lower dFNC within DMN, PFN, and VIS compared with healthy females (P<0.05, FDR corrected). RRMS, relapsing-remitting multiple sclerosis; DMN, default mode network; SMN, sensorimotor network; VIS, visual network; FPN, frontoparietal network; DAN: dorsal attention network; VAN, ventral attention network; BG, basal ganglia network.
Supplementary Figure 10 | Significant differences in dFNC between groups when the window width was 30 TRs, the step was 1 TR, and the number of clusters was four. (A) Healthy females showed significantly higher dFNC within DMN, PFN, and VIS compared with healthy males (P<0.05, FDR corrected). (B) RRMS females showed significantly lower dFNC within DMN, PFN, and VIS compared with healthy females (P<0.05, FDR corrected). RRMS, relapsing-remitting multiple sclerosis; DMN, default mode network; SMN, sensorimotor network; VIS, visual network; FPN, frontoparietal network; DAN, dorsal attention network; VAN, ventral attention network; BG, basal ganglia network.
1. Kobelt G, Thompson A, Berg J, Gannedahl M, Eriksson J, Group MS, et al. New insights into the burden and costs of multiple sclerosis in Europe. Mult Scler. (2017) 23(8):1123–36. doi: 10.1177/1352458517694432
2. Alonso A, Hernan MA. Temporal trends in the incidence of multiple sclerosis: a systematic review. Neurology (2008) 71(2):129–35. doi: 10.1212/01.wnl.0000316802.35974.34
3. Kalincik T, Vivek V, Jokubaitis V, Lechner-Scott J, Trojano M, Izquierdo G, et al. Sex as a determinant of relapse incidence and progressive course of multiple sclerosis. Brain (2013) 136(Pt 12):3609–17. doi: 10.1093/brain/awt281
4. Tremlett H, Zhao Y, Joseph J, Devonshire V, Neurologists UC. Relapses in multiple sclerosis are age- and time-dependent. J Neurol Neurosurg Psychiatry (2008) 79(12):1368–74. doi: 10.1136/jnnp.2008.145805
5. Leray E, Yaouanq J, Le Page E, Coustans M, Laplaud D, Oger J, et al. Evidence for a two-stage disability progression in multiple sclerosis. Brain (2010) 133(Pt 7):1900–13. doi: 10.1093/brain/awq076
6. Ribbons KA, McElduff P, Boz C, Trojano M, Izquierdo G, Duquette P, et al. Male sex is independently associated with faster disability accumulation in relapse-onset MS but not in primary progressive MS. PloS One (2015) 10(6):e0122686. doi: 10.1371/journal.pone.0122686
7. Rizzo JF 3rd, Lessell S. Risk of developing multiple sclerosis after uncomplicated optic neuritis: a long-term prospective study. Neurology (1988) 38(2):185–90. doi: 10.1212/WNL.38.2.185
8. Li DK, Held U, Petkau J, Daumer M, Barkhof F, Fazekas F, et al. MRI T2 lesion burden in multiple sclerosis: a plateauing relationship with clinical disability. Neurology (2006) 66(9):1384–9. doi: 10.1212/01.wnl.0000210506.00078.5c
9. Pozzilli C, Tomassini V, Marinelli F, Paolillo A, Gasperini C, Bastianello S. ‘Gender gap’ in multiple sclerosis: magnetic resonance imaging evidence. Eur J Neurol (2003) 10(1):95–7. doi: 10.1046/j.1468-1331.2003.00519.x
10. Dolezal O, Gabelic T, Horakova D, Bergsland N, Dwyer MG, Seidl Z, et al. Development of gray matter atrophy in relapsing-remitting multiple sclerosis is not gender dependent: results of a 5-year follow-up study. Clin Neurol Neurosurg (2013) 115 Suppl 1:S42–8. doi: 10.1016/j.clineuro.2013.09.020
11. Klistorner A, Wang C, Yiannikas C, Parratt J, Dwyer M, Barton J, et al. Evidence of progressive tissue loss in the core of chronic MS lesions: A longitudinal DTI study. NeuroImage Clin (2018) 17:1028–35. doi: 10.1016/j.nicl.2017.12.010
12. Schoonheim MM, Hulst HE, Landi D, Ciccarelli O, Roosendaal SD, Sanz-Arigita EJ, et al. Gender-related differences in functional connectivity in multiple sclerosis. Mult Scler. (2012) 18(2):164–73. doi: 10.1177/1352458511422245
13. Sanchis-Segura C, Cruz-Gomez AJ, Belenguer A, Fittipaldi Marquez MS, Avila C, Forn C. Increased regional gray matter atrophy and enhanced functional connectivity in male multiple sclerosis patients. Neurosci Lett (2016) 630:154–7. doi: 10.1016/j.neulet.2016.07.028
14. Filippi M, Spinelli EG, Cividini C, Agosta F. Resting state dynamic functional connectivity in neurodegenerative conditions: A review of magnetic resonance imaging findings. Front Neurosci (2019) 13:657. doi: 10.3389/fnins.2019.00657
15. Hutchison RM, Womelsdorf T, Allen EA, Bandettini PA, Calhoun VD, Corbetta M, et al. Dynamic functional connectivity: promise, issues, and interpretations. Neuroimage (2013) 80:360–78. doi: 10.1016/j.neuroimage.2013.05.079
16. d’Ambrosio A, Valsasina P, Gallo A, De Stefano N, Pareto D, Barkhof F, et al. Reduced dynamics of functional connectivity and cognitive impairment in multiple sclerosis. Mult Scler. (2020) 26(4):476–88. doi: 10.1177/1352458519837707
17. van Geest Q, Hulst HE, Meijer KA, Hoyng L, Geurts JJG, Douw L. The importance of hippocampal dynamic connectivity in explaining memory function in multiple sclerosis. Brain Behav (2018) 8(5):e00954. doi: 10.1002/brb3.954
18. Tijhuis FB, Broeders TAA, Santos FAN, Schoonheim MM, Killestein J, Leurs CE, et al. Dynamic functional connectivity as a neural correlate of fatigue in multiple sclerosis. NeuroImage Clin (2021) 29:102556. doi: 10.1016/j.nicl.2020.102556
19. Schoonheim MM, Douw L, Broeders TA, Eijlers AJ, Meijer KA, Geurts JJ. The cerebellum and its network: Disrupted static and dynamic functional connectivity patterns and cognitive impairment in multiple sclerosis. Mult Scler. (2021) 27(13):2031–9. doi: 10.1177/1352458521999274
20. Zheng F, Li Y, Zhuo Z, Duan Y, Cao G, Tian D, et al. Structural and functional hippocampal alterations in Multiple sclerosis and neuromyelitis optica spectrum disorder. Mult Scler. (2021) 28(5):707–17. doi: 10.1177/13524585211032800
21. Allen EA, Erhardt EB, Damaraju E, Gruner W, Segall JM, Silva RF, et al. A baseline for the multivariate comparison of resting-state networks. Front Syst Neurosci (2011) 5:2. doi: 10.3389/fnsys.2011.00002
22. Yeo BT, Krienen FM, Sepulcre J, Sabuncu MR, Lashkari D, Hollinshead M, et al. The organization of the human cerebral cortex estimated by intrinsic functional connectivity. J Neurophysiol (2011) 106(3):1125–65. doi: 10.1152/jn.00338.2011
23. Uddin LQ. Mixed signals: on separating brain signal from noise. Trends Cognit Sci (2017) 21(6):405–6. doi: 10.1016/j.tics.2017.04.002
24. Liegeois R, Ziegler E, Phillips C, Geurts P, Gomez F, Bahri MA, et al. Cerebral functional connectivity periodically (de)synchronizes with anatomical constraints. Brain Struct Funct (2016) 221(6):2985–97. doi: 10.1007/s00429-015-1083-y
25. Preti MG, Bolton TA, Van De Ville D. The dynamic functional connectome: State-of-the-art and perspectives. Neuroimage (2017) 160:41–54. doi: 10.1016/j.neuroimage.2016.12.061
26. Sanfilipo MP, Benedict RH, Weinstock-Guttman B, Bakshi R. Gray and white matter brain atrophy and neuropsychological impairment in multiple sclerosis. Neurology (2006) 66(5):685–92. doi: 10.1212/01.wnl.0000201238.93586.d9
27. Schoonheim MM, Meijer KA, Geurts JJ. Network collapse and cognitive impairment in multiple sclerosis. Front Neurol (2015) 6:82. doi: 10.3389/fneur.2015.00082
28. Strik M, Chard DT, Dekker I, Meijer KA, Eijlers AJ, Pardini M, et al. Increased functional sensorimotor network efficiency relates to disability in multiple sclerosis. Mult Scler. (2021) 27(9):1364–73. doi: 10.1177/1352458520966292
29. Zhuang Y, Zhou F, Gong H. Intrinsic functional plasticity of the sensorimotor network in relapsing-remitting multiple sclerosis: evidence from a centrality analysis. PloS One (2015) 10(6):e0130524. doi: 10.1371/journal.pone.0130524
30. Vereb D, Toth E, Bozsik B, Kiraly A, Szabo N, Kincses B, et al. Altered brain network function during attention-modulated visual processing in multiple sclerosis. Mult Scler. (2021) 27(9):1341–9. doi: 10.1177/1352458520958360
31. Aguirre N, Cruz-Gomez AJ, Esbri SF, Miro-Padilla A, Bueicheku E, Broseta-Torres R, et al. Enhanced frontoparietal connectivity in multiple sclerosis patients and healthy controls in response to an intensive computerized training focused on working memory. Mult Scler Relat Disord (2021) 52:102976. doi: 10.1016/j.msard.2021.102976
32. Gabilondo I, Rilo O, Ojeda N, Pena J, Gomez-Gastiasoro A, Mendibe Bilbao M, et al. The influence of posterior visual pathway damage on visual information processing speed in multiple sclerosis. Mult Scler. (2017) 23(9):1276–88. doi: 10.1177/1352458516676642
33. Baltruschat SA, Ventura-Campos N, Cruz-Gomez AJ, Belenguer A, Forn C. Gray matter atrophy is associated with functional connectivity reorganization during the Paced Auditory Serial Addition Test (PASAT) execution in Multiple Sclerosis (MS). J Neuroradiol (2015) 42(3):141–9. doi: 10.1016/j.neurad.2015.02.006
34. Tommasin S, Iakovleva V, Rocca MA, Gianni C, Tedeschi G, De Stefano N, et al. Relation of sensorimotor and cognitive cerebellum functional connectivity with brain structural damage in patients with multiple sclerosis and no disability. Eur J Neurol (2022) 29(7):2036–46. doi: 10.1111/ene.15329
35. Jandric D, Doshi A, Scott R, Paling D, Rog D, Chataway J, et al. A systematic review of resting-state functional MRI connectivity changes and cognitive impairment in multiple sclerosis. Brain Connect. (2022) 12(2):112–33. doi: 10.1089/brain.2021.0104
36. Koubiyr I, Broeders TA, Deloire M, Brochet B, Tourdias T, Geurts JJ, et al. Altered functional brain states predict cognitive decline 5 years after a clinically isolated syndrome. Mult Scler. (2022) 28(12):1973–82. doi: 10.1177/13524585221101470
37. Hidalgo de la Cruz M, Valsasina P, Sangalli F, Esposito F, Rocca MA, Filippi M. Dynamic functional connectivity in the main clinical phenotypes of multiple sclerosis. Brain Connect. (2021) 11(8):678–90. doi: 10.1089/brain.2020.0920
38. Eijlers AJC, Wink AM, Meijer KA, Douw L, Geurts JJG, Schoonheim MM. Reduced network dynamics on functional MRI signals cognitive impairment in multiple sclerosis. Radiology (2019) 292(2):449–57. doi: 10.1148/radiol.2019182623
39. Acs P, Kipp M, Norkute A, Johann S, Clarner T, Braun A, et al. 17beta-estradiol and progesterone prevent cuprizone provoked demyelination of corpus callosum in male mice. Glia (2009) 57(8):807–14. doi: 10.1002/glia.20806
40. Airas L. Hormonal and gender-related immune changes in multiple sclerosis. Acta Neurol Scand (2015) 132(199):62–70. doi: 10.1111/ane.12433
41. Keane JT, Afrasiabi A, Schibeci SD, Fewings N, Parnell GP, Swaminathan S, et al. Gender and the sex hormone estradiol affect multiple sclerosis risk gene expression in epstein-barr virus-infected B cells. Front Immunol (2021) 12:732694. doi: 10.3389/fimmu.2021.732694
42. Aryanpour R, Pasbakhsh P, Zibara K, Namjoo Z, Beigi Boroujeni F, Shahbeigi S, et al. Progesterone therapy induces an M1 to M2 switch in microglia phenotype and suppresses NLRP3 inflammasome in a cuprizone-induced demyelination mouse model. Int Immunopharmacol. (2017) 51:131–9. doi: 10.1016/j.intimp.2017.08.007
43. Garay L, Gonzalez Deniselle MC, Lima A, Roig P, De Nicola AF. Effects of progesterone in the spinal cord of a mouse model of multiple sclerosis. J Steroid Biochem Mol Biol (2007) 107(3-5):228–37. doi: 10.1016/j.jsbmb.2007.03.040
44. Graves JS, Henry RG, Cree BAC, Lambert-Messerlian G, Greenblatt RM, Waubant E, et al. Ovarian aging is associated with gray matter volume and disability in women with MS. Neurology (2018) 90(3):e254–e60. doi: 10.1212/WNL.0000000000004843
Keywords: relapsing-remitting multiple sclerosis, magnetic resonance imaging, sex, independent component analysis, static functional network connectivity, dynamic functional network connectivity
Citation: Wang Y, Duan Y, Wu Y, Zhuo Z, Zhang N, Han X, Zeng C, Chen X, Huang M, Zhu Y, Li H, Cao G, Sun J, Li Y, Zhou F and Li Y (2023) Male and female are not the same: a multicenter study of static and dynamic functional connectivity in relapse-remitting multiple sclerosis in China. Front. Immunol. 14:1216310. doi: 10.3389/fimmu.2023.1216310
Received: 03 May 2023; Accepted: 30 August 2023;
Published: 10 October 2023.
Edited by:
Alessandra Lugaresi, University of Bologna, ItalyReviewed by:
Nils Muhlert, The University of Manchester, United KingdomCopyright © 2023 Wang, Duan, Wu, Zhuo, Zhang, Han, Zeng, Chen, Huang, Zhu, Li, Cao, Sun, Li, Zhou and Li. This is an open-access article distributed under the terms of the Creative Commons Attribution License (CC BY). The use, distribution or reproduction in other forums is permitted, provided the original author(s) and the copyright owner(s) are credited and that the original publication in this journal is cited, in accordance with accepted academic practice. No use, distribution or reproduction is permitted which does not comply with these terms.
*Correspondence: Fuqing Zhou, bmR5ZnkwMjMwMUBuY3UuZWR1LmNu; Yuxin Li, bGl5dXhpbkBmdWRhbi5lZHUuY24=
†These authors have contributed equally to this work
Disclaimer: All claims expressed in this article are solely those of the authors and do not necessarily represent those of their affiliated organizations, or those of the publisher, the editors and the reviewers. Any product that may be evaluated in this article or claim that may be made by its manufacturer is not guaranteed or endorsed by the publisher.
Research integrity at Frontiers
Learn more about the work of our research integrity team to safeguard the quality of each article we publish.