 Yuejin Liang1,2†
 Aditi1†Florence Onyoni1
 Hui Wang3Casey Gonzales3Piyanate Sunyakumthorn4
 Ping Wu5
 Parimal Samir1,2,3,6*
 Lynn Soong1,2,3*
- 1Department of Microbiology and Immunology, University of Texas Medical Branch, Galveston, TX, United States
- 2Institute for Human Infections and Immunity, University of Texas Medical Branch, Galveston, TX, United States
- 3Department of Pathology, University of Texas Medical Branch, Galveston, TX, United States
- 4Department of Veterinary Medicine, United States Army Medical Directorate, Armed Forces Research Institute of Medical Sciences (United States MD-AFRIMS), Bangkok, Thailand
- 5Department of Neuroscience, Cell Biology and Anatomy, University of Texas Medical Branch, Galveston, TX, United States
- 6Department of Biochemistry and Molecular Biology, University of Texas Medical Branch, Galveston, TX, United States
Scrub typhus, an acute febrile illness caused by Orientia tsutsugamushi (Ot), is prevalent in endemic areas with one million new cases annually. Clinical observations suggest central nervous system (CNS) involvement in severe scrub typhus cases. Acute encephalitis syndrome (AES) associated with Ot infection is a major public health problem; however, the underlying mechanisms of neurological disorder remain poorly understood. By using a well-established murine model of severe scrub typhus and brain RNA-seq, we studied the brain transcriptome dynamics and identified the activated neuroinflammation pathways. Our data indicated a strong enrichment of several immune signaling and inflammation-related pathways at the onset of disease and prior to host death. The strongest upregulation of expression included genes involved in interferon (IFN) responses, defense response to bacteria, immunoglobulin-mediated immunity, IL-6/JAK-STAT signaling, and TNF signaling via NF-κB. We also found a significant increase in the expression of core genes related to blood-brain barrier (BBB) disruption and dysregulation in severe Ot infection. Brain tissue immunostaining and in vitro infection of microglia revealed microglial activation and proinflammatory cytokine production, suggesting a crucial role of microglia in neuroinflammation during scrub typhus. This study provides new insights into neuroinflammation in scrub typhus, highlighting the impact of excessive IFN responses, microglial activation, and BBB dysregulation on disease pathogenesis.
Introduction
Scrub typhus is a mite-borne infection caused by Orientia tsutsugamushi (Ot), an obligate intracellular bacterium closely related to Rickettsia. This disease causes at least one million clinical cases per year in the “tsutsugamushi triangle,” a region encompassing much of northern and eastern Asia, islands of the western Pacific Ocean, and a portion of northern Australia (1) However, new cases have been reported in other geographic areas, including South America (2). Yet, no vaccines are currently available for scrub typhus. Delayed antibiotic treatment is common due to non-specific symptoms at the initial stages of infection and missed or delayed diagnosis (3). In some patients, the bacteria spread systemically and cause severe outcomes, including interstitial pneumonia, myocardial and hepatic lesions, meningoencephalitis, acute respiratory distress syndrome, and multi-organ failure. The mortality rates can range from 0% to 70%, with a median of 6%, if left untreated (4).
The central nervous system (CNS) involvement is common among severe cases of scrub typhus with diverse neurological symptoms (headache, vomiting, altered sensorium, and seizures), but this clinical experience has largely been overlooked (5–8). The epidemiological studies in India and Thailand have suggested that 15%-25% of patients with scrub typhus had neurological complications (9–11). Importantly, CNS infections are positively correlated with mortality in scrub typhus (12). One meta-analysis study has illustrated that around 4% of patients with neurological manifestations of scrub typhus die in hospitals, and that case fatality rate may be higher in children than in adults (13, 14). Another clinical study has also indicated that most patients who recovered from acute encephalitis syndrome (AES) caused by Ot, often experience cognitive and behavioral impairments, and that more than 50% of them exhibited mild to severe degree of disability, raising a concern of long-term care requirement (15). A more recent population-based cohort study in Korea revealed that a previous episode of scrub typhus infection during old age is significantly linked to a higher risk of developing dementia, particularly Alzheimer’s disease (16), suggesting that Ot-triggered neuroinflammation may contribute to the pathogenesis of neurodegeneration.
The mechanisms of CNS disorders in scrub typhus remain unclear. Emerging evidence from animal studies suggests that excessive immune responses could be a potential contributor to the development of neuroinflammation and short- and long-term CNS damage (17). It is known that cytokines play an important role in both the normal development of the brain and in brain injuries. T helper 1 (Th1) cell cytokines, such as IFN-γ and TNF-α are considered inflammatory mediator in the brain following infection or injury, while Th2 cytokines (IL-4, IL-5, IL-13, etc.) and IL-10 may modulate Th1 proinflammatory responses (18, 19). In scrub typhus patients, dominant Th1 immune responses have been observed, as evidenced by highly increased IFN-γ, TNF-α and CXCL10, while levels of Th2-associated chemokines were undetectable or marginally induced (20, 21). Blood brain barrier (BBB) leakage, as measured by significantly higher albumin index in cerebrospinal fluid has been confirmed in scrub typhus patients (22). Moreover, the increased albumin index was positively correlated with the expression levels of an astrocyte marker (glial fibrillary acidic protein), indicating the activation of astrocytes in the brain of scrub typhus patients (22). In a rhesus macaque (Macaca mulatta) model of Ot infection, a preferential development of a Th1 immune response was also observed as characterized by upregulation of serum IFN-γ as well as other inflammatory cytokines including TNF-α, IL-15, IL-6, IL-18, regulatory IL-1ra, IL-8, and G-CSF (23). However, in-depth investigation of Ot-related neuroinflammation and BBB damage in humans or non-human primate models are lacking.
Using lethal mouse models of scrub typhus induced by Ot Karp strain, our group has demonstrated the type 1-skewed neuroinflammation, cellular activation and vascular activation/damage in the brain, even though the brain tissues contain relatively low bacterial burdens compared with other organs such as lungs (24, 25). In mouse cortex and cerebellum sections, there are increased infiltration of immune cells including T cells and macrophages, as well as the activated brain resident microglia and astrocytes at the peak of infection (days 6-10) (24), which correlated with endothelial damage as judged by increased ICAM1-positive staining in Ot-infected brain tissues (4, 24). In addition to Ot infection, animal studies showed that other Rickettsial infections also induce neurological disorder. In a Rickettsia typhi study, infected RAG1-/- mice exhibited lethal neurological disorders with a massive expansion of microglia and neuronal cell death in a persistent infection stage (26). BBB damage and intracerebral microhemorrhages were also reported in a mouse model of R. australis infection (27). However, the mechanism of CNS infection and AES in scrub typhus is unknown, mainly due to the lack of appropriate animal models and the requirement of biosafety level 3 practices and containment.
In the current study, we wanted to further explore molecular mechanisms underlying neurological pathogenesis in severe scrub typhus via utilizing a lethal C57BL/6 mouse model. To obtain an unbiased view of brain responses to Ot infection, we used comprehensive approaches, including brain tissue RNA-seq assay and qRT-PCR analyses of relevant genes, as well as in vitro infection of human and mouse microglial cell lines for assessing bacterial growth and inflammatory responses. This study provides the first line of evidence for microglial activation and selective activation of the IFN pathways, which may lead to excessive neuroinflammation and BBB disruption at severe stages of Ot infection.
Materials and methods
Mouse infection and ethics statement
Female C57BL/6 mice were purchased from Jackson Laboratory (stock #000664). Mice were maintained under specific pathogen-free conditions and used at 6-9 weeks of age, following protocols approved by the Institutional Animal Care and Use Committee (protocol # 1902006) at the University of Texas Medical Branch (UTMB) in Galveston, TX. All mouse infection studies were performed in the ABSL3 facility in the Galveston National Laboratory located at UTMB; all tissue processing and analysis procedures were performed in the BSL3 or BSL2 facilities. UTMB operates to comply with the USDA Animal Welfare Act (Public Law 89–544), the Health Research Extension Act of 1985 (Public Law 99–158), the Public Health Service Policy on Humane Care and Use of Laboratory Animals, and the NAS Guide for the Care and Use of Laboratory Animals (ISBN-13). UTMB is a registered Research Facility under the Animal Welfare Act and has a current assurance on file with the Office of Laboratory Animal Welfare, in compliance with NIH Policy. Mice (5/group) were inoculated intravenously (i.v.) with 6 × 10⁴ FFU (200 µl) of Ot Karp strain or PBS (day 0) and monitored daily for weight loss, signs of disease, and survival. Animals were euthanized at day 0, 2, 6 and 10 post infection for tissue collection (28–30). Brain tissues were stored in RNAlater (Qiagen) and incubated in 4°C overnight for inactivation of bacteria. This animal experiment has been conducted independently three times.
Cell culture and bacterial stock preparation
Vero cells (African green monkey kidney epithelial cells) were cultured in MEM medium (Gibco) containing 10% fetal bovine serum (FBS), 100 U/mL penicillin, and 100 µg/mL streptomycin. Bacterial stock was prepared, as in our previous reports (29, 30). BV2 cells were cultured with DMEM medium plus 10% FBS; C20 was cultured in DMEM/F12 medium (Gibco) supplemented with 1% FBS and 1×N-2 supplement (Gibco) (31). Cells were infected with bacteria (MOI 10) and harvested at 24 and 72 hours (h). Uninfected cells were used as negative controls.
Quantitative reverse transcriptase-PCR
Tissues were homogenized using metal beads in a BeadBlaster 24 Microtube Homogenizer (Benchmark Scientific) with an RLT lysis buffer (Qiagen). Cultured cells were also harvested and lysed by using RTL lysis buffer. RNA was extracted by using RNeasy Mini kits (Qiagen) and used for cDNA synthesis with an iScript Reverse Transcription kit (Bio-Rad). cDNA was amplified in a 10 μL reaction mixture containing 5 μL of iTaq SYBR Green Supermix (Bio-Rad) and 5 μM each of gene-specific forward and reverse primers. The PCR assays were denatured for 30s at 95°C, followed by 40 cycles of 15s at 95°C, and 60s at 60°C, by utilizing the CFX96 Touch real-time PCR detection system (Bio-Rad). Relative quantitation of mRNA expression was calculated using the 2−ΔΔCt method. The primers are listed in Supplementary Table 1.
IF staining and fluorescent microscopy
Brain tissues were fixed in 4% paraformaldehyde (PFA) and embedded in Tissue-Tek OCT, as described in our previous report (24). Briefly, cryosections (6 µm) were fixed for 10 min in ice-cold acetone and rehydrated with PBS. For immunofluorescent staining, sections were permeabilized and blocked using 5% normal goat serum, 0.2% Triton X-100 in PBS for 1 h, followed by primary antibody incubation overnight at 4°C. The anti-IBA1 Ab (ab178846) was purchased from Abcam and Biolegend, respectively. The Alexa Fluor555-conjugated or Alexa Fluor488-conjugated anti-rabbit IgG (H+L), F(ab’)2 Fragment secondary antibodies (Cell Signaling Technology, 1:500 dilution) were used to stain the sections for 1 h at room temperature, followed by three washes with PBS. The TrueVIEW Autofluorescence Quenching Kit (Vector Laboratories) was applied to diminish unwanted autofluorescence and the microscope slides were covered by using Fluoroshield Mounting Medium with DAPI (Abcam). Images were captured using a Carl Zeiss Axio Observer fluorescence microscope or a confocal microscope Zeiss LSM 880 with Airyscan. For each mouse, at least three fixed-frozen sections were included for each experiment. All images were captured with the same conditions of laser power and detector gain.
RNA-seq assay and data analysis
Brain RNA was extracted by using RNeasy RNA Isolation kit (Qiagen). Samples (3 mice/group) were sent to LC Sciences (Houston, TX) for RNA purity/quantity assessment via Bioanalyzer 2100 and RNA 6000 Nano LabChip Kit (Agilent), mRNA extraction, cDNA libraries construction, and sequencing by using the Illumina Novaseq™ 6000. The Mus musculus genome build mm10 was used as a reference genome. Quality control analysis was done by using FastQC (32) and RSeQC6 (33). Semi-supervised hierarchical clustering analysis and heatmap generation were performed by using the Morpheus tool (https://software.broadinstitute.org/morpheus). Principal component analysis and volcano plot were done in R using PCAtools (34) and EnhancedVolcano (35) packages. The RNA-seq data presented herein were deposited in NCBI’s Gene Expression Omnibus, accessible through GEO Series accession number GSE227525 (https://www.ncbi.nlm.nih.gov/geo/query/acc.cgi?acc=GSE227525).
Quantitative PCR for measuring bacterial burdens
To determine bacterial burdens, DNA was extracted from brain tissues via a DNeasy Blood & Tissue Kit (Qiagen) and used for qPCR assays, as previously described (28, 36, 37). The primers were OtsuF630 (5’-AACTGATTTTATTCAAACTAATGCTGCT-3’) and OtsuR747 (5’-TATGCCTGAGTAAGATACGTGAATGGAATT-3’) (Integrated DNA Technologies). Bacterial loads were normalized to total nanogram (ng) of DNA per µL for the same sample, and data are expressed as the gene copy number of 47-kDa protein per ng of DNA. The copy number for the 47-kDa gene was determined by known concentrations of a control plasmid containing single-copy insert of the gene. Gene copy numbers were determined via serial dilutions (10-fold) of the Ot Karp 47-kDa plasmid.
GSEA analysis
Pathway enrichment analysis using gene set enrichment analysis with GSEA version 3.0 was performed with a ranked gene list (38, 39). Specifically, ranked gene list is prepared from the differential gene expression analysis by using the following metrics: sign of the Log2fold change multiplied by the inverse of the p-value. GSEAPreranked was run with 2000 permutations. Primary gene sets investigated were obtained from the MSigDB and published reports (40, 41). GSEA FDR Q <0.05 cutoff was applied to examine enriched gene sets in our dataset.
Cytoscape analysis
Enrichment results from the GSEA analysis were visualized using Cytoscape (42). GSEA output files were uploaded in the EnrichmentMap app of Cytoscape and FDR Q value cut off was set to 0.01. Clusters are automatically defined using AutoAnnotate Cytoscape app.
Statistical analysis
Data were presented as mean ± standard error of mean (SEM). Differences between individual treatment and control groups were determined by using unpaired Student’s t test, utilizing Welch’s correction when appropriate. One-way ANOVA was used for multiple group comparisons, with a Tukey’s Post Hoc for comparisons between groups. Two-way ANOVA was used for the statistical analysis of body weight change. Log-rank (Mantel-Cox) test was used for survival curve analysis. All data were analyzed by using GraphPad Prism software 8.0. Statistically significant values are denoted as *, p < 0.05; **; p < 0.01, ***; p < 0.001, and ****; p < 0.0001, respectively. All in vitro cell culture experiments were performed three times independently, with triplicate samples obtained each time. All qRT-PCR and qPCR assays (4-5 samples/group) were repeated twice independently.
Results
Severe Ot infection leads to widespread changes in gene expression in the brain
To understand the brain pathogenesis in severe Ot infection, we intravenously infected mice with lethal dose of bacteria (6 × 10⁴ FFU) and collected brain tissues at days 2 (incubation period), 6 (disease onset), and 10 (disease peak), respectively. As in our previous reports (28, 37), infected mice started body weight loss around day 7, and approximately half of mice expired between days 11 and 14 (Figures 1A, B). Brain bacterial burdens were detectable at day 2, reached the peak at day 6, and reduced at day 10 (Figure 1C). We used RNA-seq based transcriptomics profiling of brain cortex at the indicated timepoints (Figure 1D). Mice with PBS injection were used as mock controls (day 0). We used Principal Component Analysis (PCA) and semi-supervised Hierarchical Clustering Analysis (HCA) to understand the pattern of gene expression changes in the brain during the infection. PCA analysis revealed a clear separation between infected samples compared to uninfected brain tissues (Figure 1D). Infected samples from the same timepoints were closer to each other as compared to others, suggesting a consistent difference in the brain transcriptomes at different stages of infection. HCA analysis also followed the same trends, with clear differences in gene expression at different timepoints (Figure 1E). Day 2 samples had a total of 1,333 differentially expressed genes, while days 6 and 10 samples contacted a total of 1,478 and 2,469 differentially expressed genes, respectively. Several genes previously reported to be involved in host responses against Ot (24, 43) were differentially expressed in infected brains, including interferon-stimulated genes (ISGs) that are critical components of immune response to microbial infections (Gbp2/4/6, Stat1, Mx1 and Irf7) at day 10 (Figure 1F). Consistent with our previous reports (24, 29), IFNg and Tnf were the dominate type-1 immune markers in infected brains. Together, the RNA-seq transcriptomics revealed widespread dysregulation of gene expression with strong type 1 immunity in Ot-infected brain tissues.
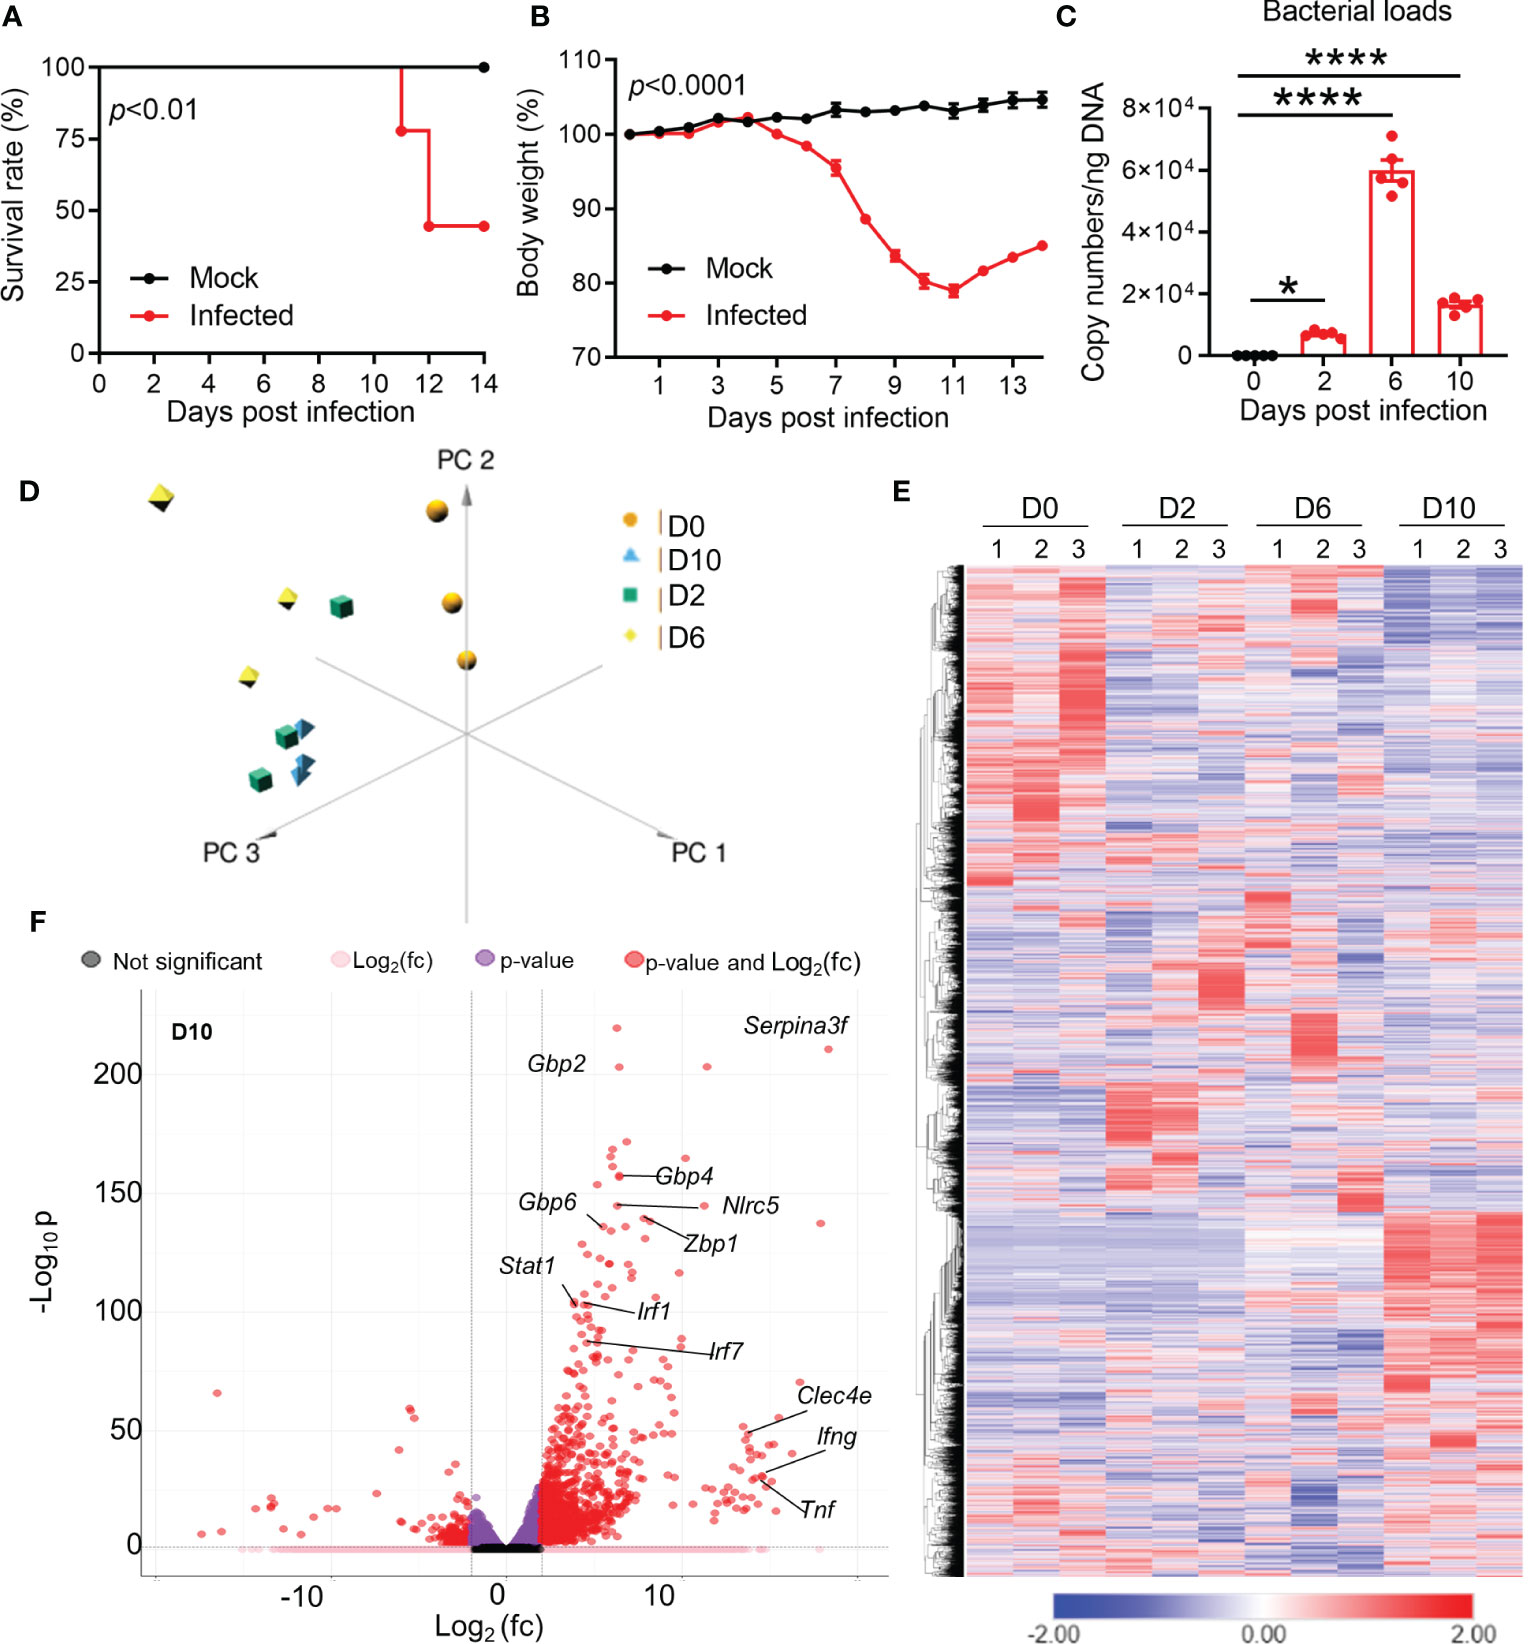
Figure 1 Dynamic brain transcriptomes of mice following Ot infection. B6 mice (5/group) were injected i.v. with Ot (6 × 10⁴ FFU) or PBS (used as a mock or D0 controls). Brain cortexes were harvested at days 2, 6, and 10 post-infections, followed by RNA isolation. (A) Animal survival rates. (B) Body weight changes. (C) Bacterial burdens in the brain tissues. This animal experiment has been conducted independently three times and the data are shown from a single representative experiment. ****, p < 0.0001. (D) Principal component analysis of RNA-seq data of mouse brain at days 2, 6, and 10. Three samples in each group were performed for RNA-seq analysis. (E) Unsupervised clustering of brain transcriptomes. (F) Volcano plot analysis of differentially expressed genes at day 10 vs day 0.
Ot infection results in the activation of IFN signaling pathways and neuroinflammation
To define cellular processes that may cause neuropathology in Ot-infected brains during disease progression, we performed comparative pathway analyses on the transcriptomics data from brains (mocks versus days 2, 6, and 10, respectively) by using the Gene Set Enrichment Analysis (GSEA) software, as well as the Cytoscape Enrichment Map to visualize the biological processes that may play a role in host response against bacterial infection. Consistent with our previous PCR- and NanoString-based studies (4, 24, 29), day 2-vs-mock GSEA analysis of RNA-seq data revealed minor, but statistically significant, upregulation in a few biological pathways, including “complement activation pathway” and “humoral immune response mediated by circulating immunoglobulin” (Figure 2A, Supplementary Figure 1A). In contrast, we observed strong enrichment of several pathways related to immune signaling and inflammation for day 6- and day 10-versus-mock comparison. The notable top 10 pathways were related to “Hallmark interferon gamma response,” “defense response to bacteria,” and “Immunoglobulin mediated immunity” (Figures 2A, B, Supplementary Figure 1B). To further validate genes differentially induced at days 6 and 10, we analyzed their transcriptomic profiles by using mSigDB Hallmark gene data set (Supplementary Figure 2). Consistently, “Hallmark interferon gamma response,” “Hallmark interferon alpha response,” “IL-6, JAK-STAT signaling,” and “TNF signaling via NF-κB” were among the top 10 pathways induced at days 6 and 10, respectively, as compared to control brains. The lack of an enrichment for these pathways at day 2, suggested to us that immune signaling in response to Ot infection peaked around day 6 and had sustained activation at day 10 (prior to host death).
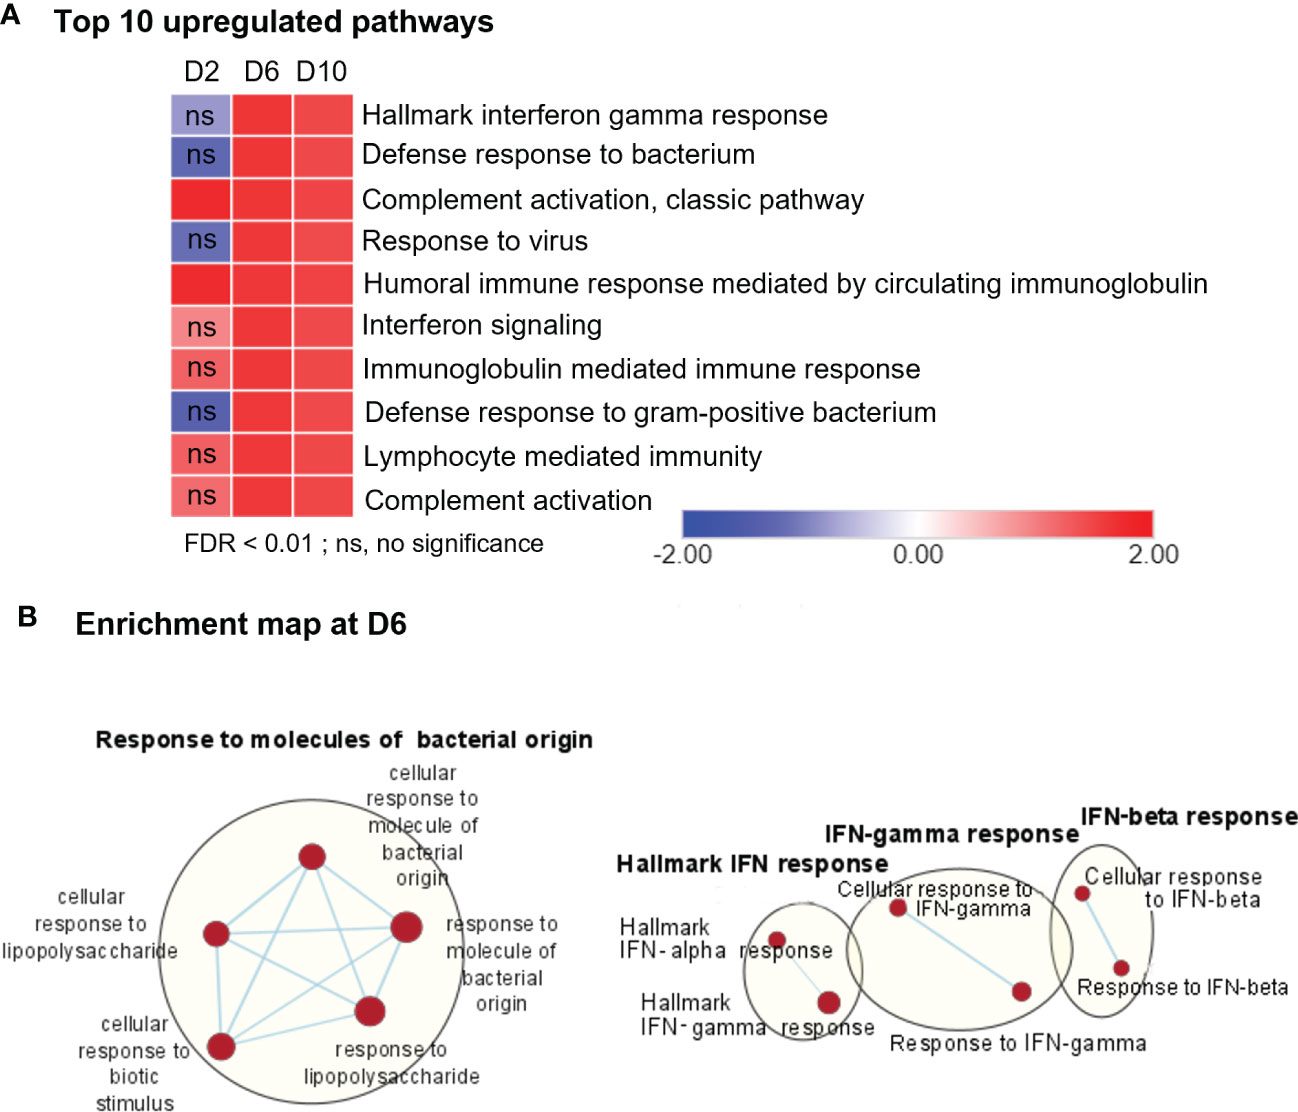
Figure 2 RNA-seq analyses of differentially expressed genes, showing upregulation in immune signaling in Ot-infected mouse brains. Brain RNA-seq experiment was performed, as in Figure 1. (A) Pathway enrichment analysis of differential expressed genes by using GSEA shows top 10 upregulated pathways in infected brain samples as compared to mocks. (B) Cytoscape enrichment map (FDR Q value < 0.01) of GSEA pathways enriched in upregulated genes in infected mouse brain at day 6 compared to mocks. Clusters of nodes were labeled using Auto Annotate feature of Cytoscape application. Red nodes represent upregulated gene set enrichment, while blue represents downregulated gene sets. ns, not significant.
Ot infection alters the expression of blood-brain barrier genes
It is well known that BBB tightly regulates the movement of biological substances between blood and neural cells and is required for maintaining brain homeostasis. BBB disruption is often observed in various pathological conditions, including severe bacterial infection (4, 22, 44). Our previous histological analyses of Ot-infected mouse brains have revealed prominent endothelial cell damage, with increased recruitment of CD3+ T cells and CD45+ leukocytes to the cortex and cerebellum (24, 30). Other groups have recently reported a core of BBB genes that can be used as the signature biomarkers of BBB disruption in various neurological diseases (40), as this core module includes 136 genes critical for various BBB functions (Supplementary Table 2). To assess if BBB dysfunction contributed to our observed mouse mortality, we considered and examined these BBB signature genes in our analyses of transcriptomics. Strikingly, we found that many upregulated genes (FDR <0.05, log2FC = 1) in our dataset were consistent and overlapped with the core BBB signature. For day 2 samples, this overlap was minimal and only 7 upregulated genes were found (Figures 3A, B), which was consistent with our previous report of minimal vascular damage at initial infection (24). As expected, a considerable overlap was found between our dataset and the reported BBB dysfunction module (40), with 31 matched genes at day 6, and 60 genes at day 10, respectively (Figures 3A, B). GSEA analysis also showed an enrichment of BBB dysfunction module at days 6 and 10 (Figure 3B). We further analyzed several BBB genes at day 10 via qRT-PCR and confirmed a significant increase in Cxcl10, Casp4, Upp1, Ch25h, Selp, Lrg1, Ccl2, and Slfn9 expression as compared to mocks (day 0) (Figure 3C). Together, these data indicate a disruption in BBB during severe stages of lethal Ot infection.
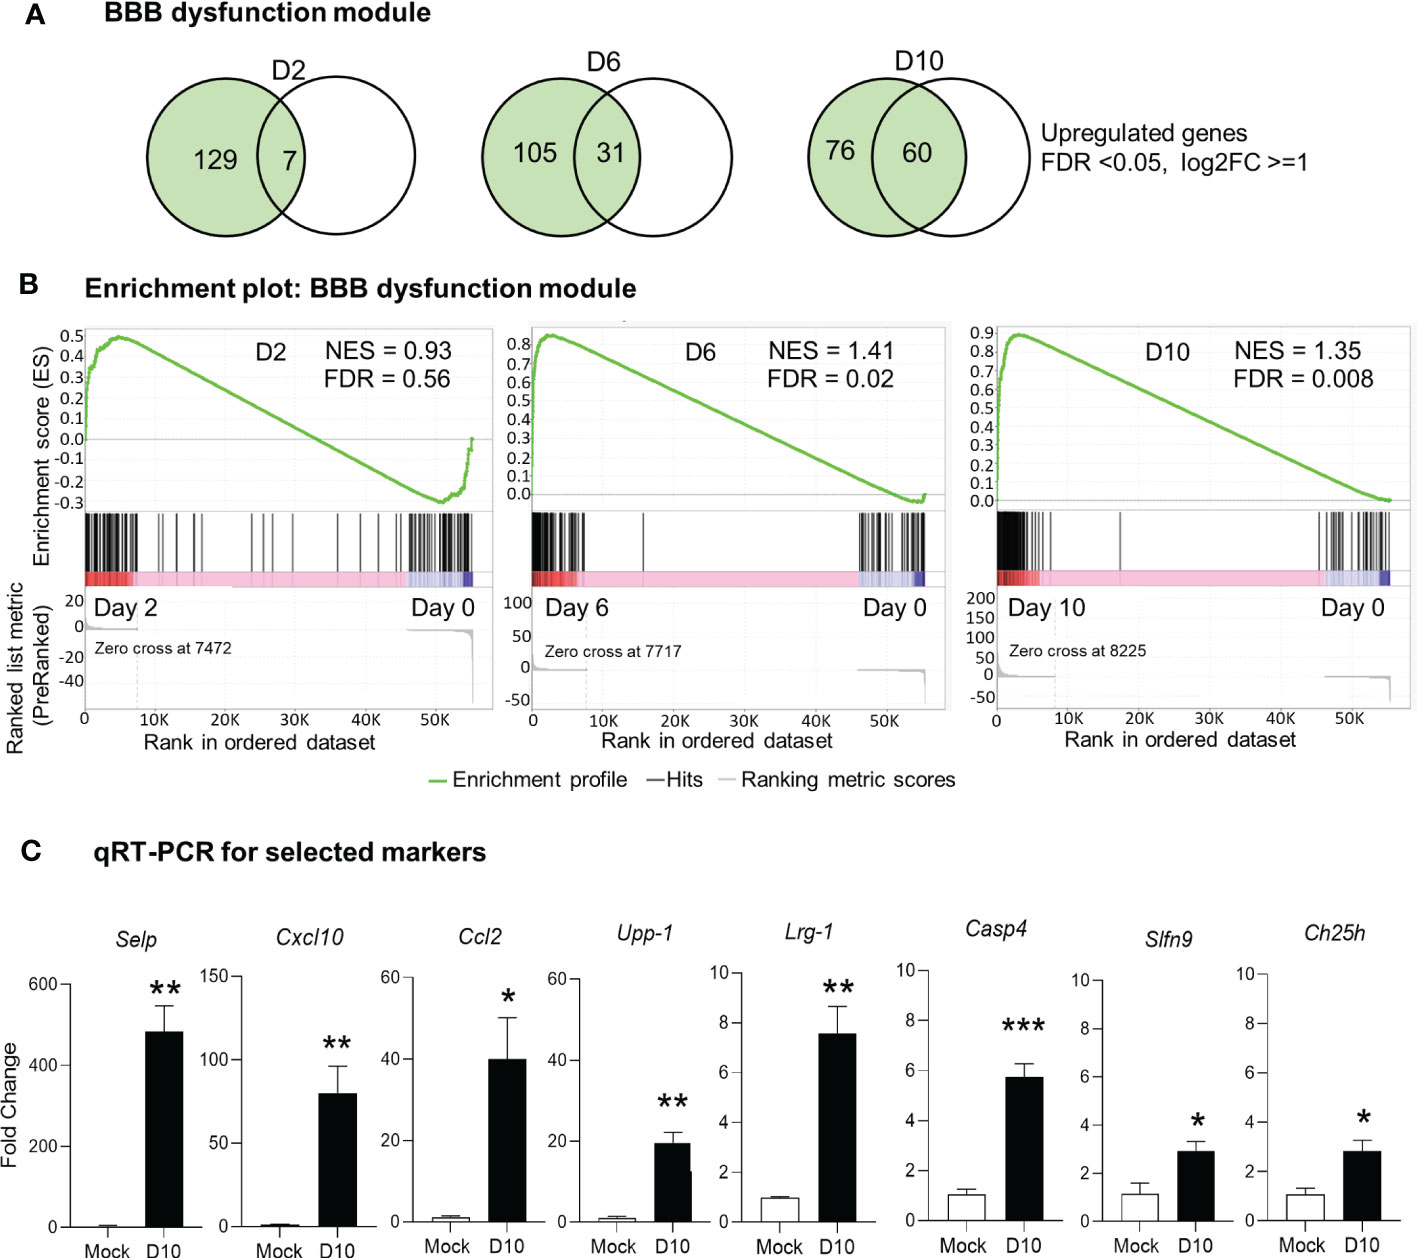
Figure 3 Alteration of blood brain barrier in Ot-infected mice. Brain RNA-seq experiment was performed, as in Figure 1. (A) Venn diagram shows the numbers of unique and shared differentially expressed genes for each comparison. (B) GSEA analysis identifies significant enrichment of blood brain barrier dysfunction module at days 6 and10. (C) qRT-PCR assay confirms the upregulation of blood brain barrier related genes at day 10 as compared to mocks. A two-tailed student t test was used for comparison between two groups. *, p < 0.05; **, p < 0.01; ***, p < 0.001. The qRT-PCR data (4-5 samples/group) were from one experiment representative of three performed independently.
Transcriptional regulation by STAT1/STATdrives type responses against Ot infection in mice
Since we observed activation of immune signaling in the brain as the main biological process in response to Ot infection, we next examined key transcription factors that might drive this host signaling response. We performed GSEA analysis by using ENCODE ChIP-Seq dataset. The significant enrichment of transcription factors critical for immune signaling was evident at days 6 and 10 (FDR <0.05), but not detectable at day 2 (FDR >0.05; Figure 4). The top enriched 5 transcription factors at day 6 were STAT2, STAT1, FOXM1, TCF12, and CEBPB; at day 10, STAT2, STAT1, TCF12, BATF and TEAD4 were identified as top 5 enriched transcription factors (Figures 4A, B). Our qRT-PCR data further confirmed RNA-seq findings, judged by significantly increased transcript levels of Mx1, Mx2, Isg20, Isg15, Irf7, Oas3, Ifit1, and Rsad2 at day 10 as compared to mocks (day 0) (Figure 4C). Importantly, STAT1 and STAT2 were both identified as top enriched transcription factors at days 6 and 10 data sets, suggesting a critical role for IFN signaling in mediating neuroinflammation during Ot infection.
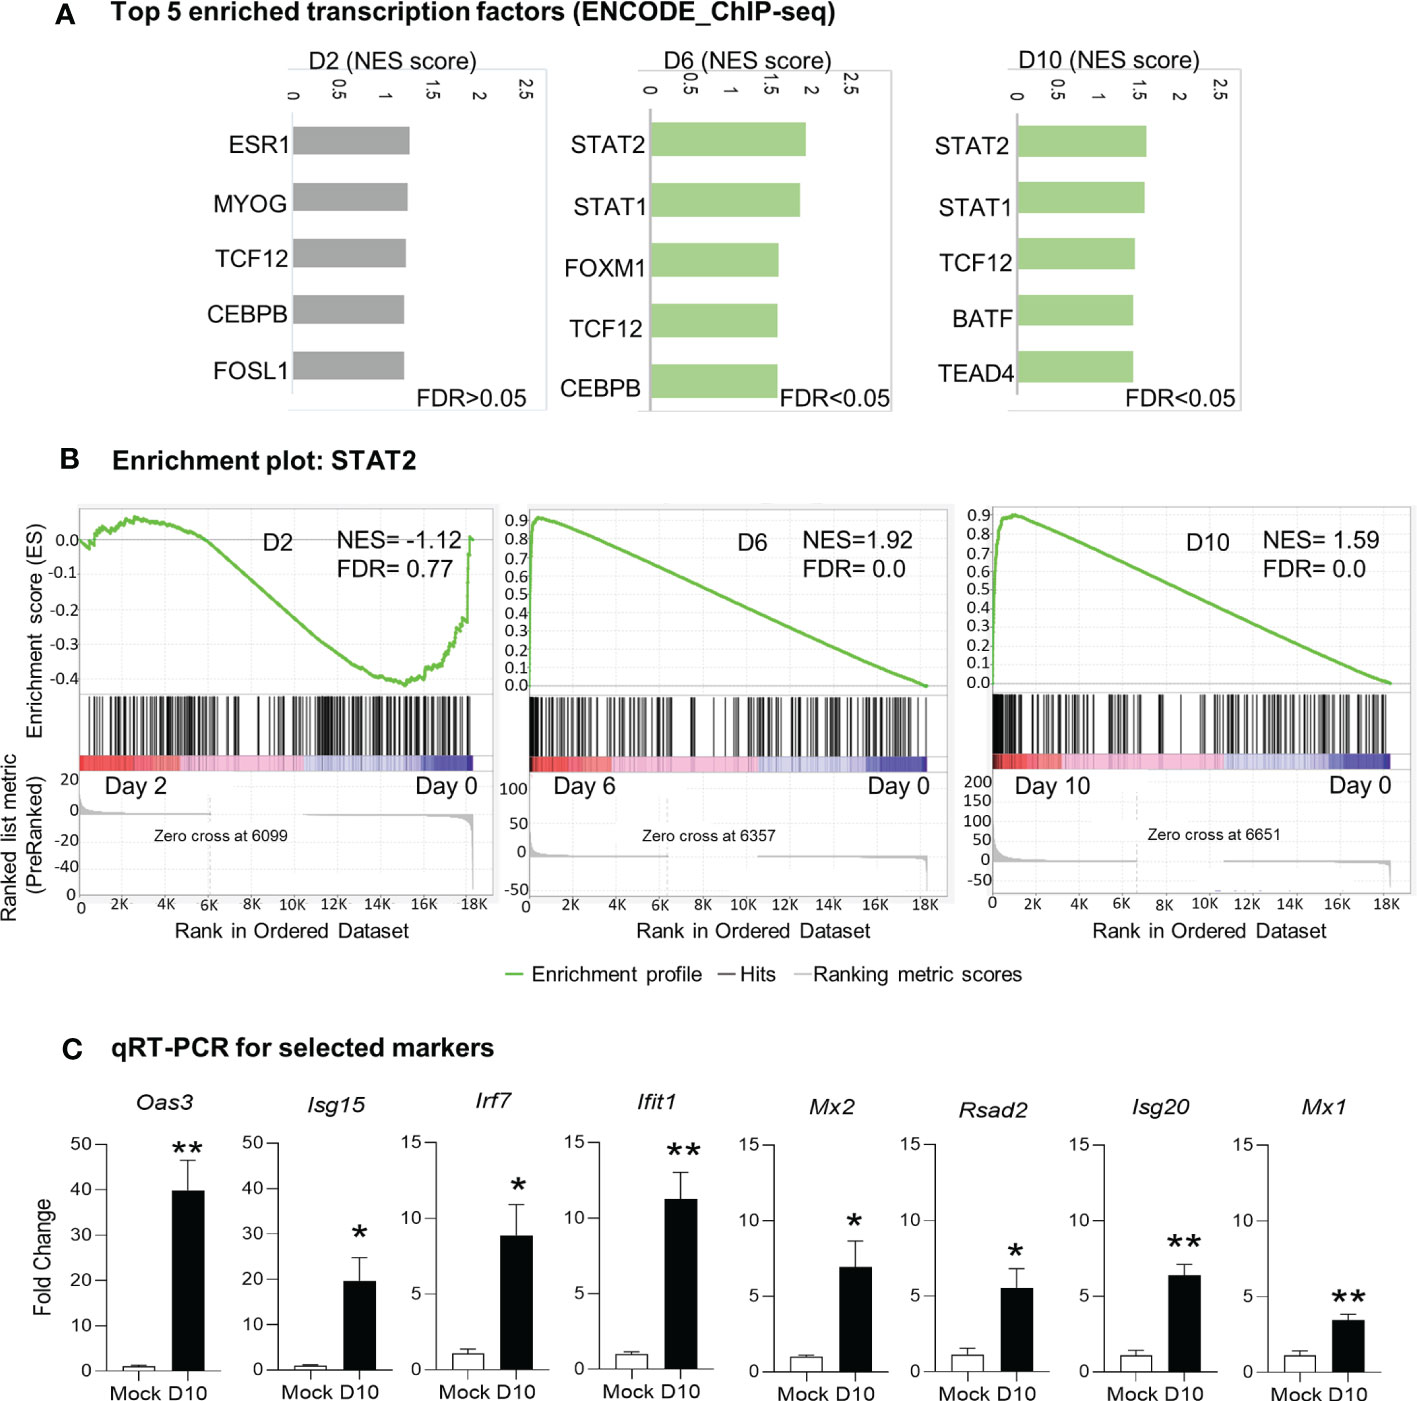
Figure 4 Identification of putative transcription factors responsible for differential gene expression during Ot infection. Brain RNA-seq experiment was performed as in Figure 1. (A) GSEA analysis to identify top 5 enriched transcription factors in mouse brain. (B) Enrichment plots for the transcription factor STAT2. (C) qRT-PCR assay confirms the upregulation of interferon-stimulated genes at day 10 as compared to mocks. A two-tailed student t test was used for comparison between two groups. *, p < 0.05; **, p < 0.01. The qRT-PCR experiments were performed twice independently with 4-5 samples per group, and the data are shown from a single representative experiment.
Reactive microglia state is induced in response to Ot infection
Microglia are brain-resident myeloid cells that are considered immune sentinels, playing key roles in brain homoeostasis during physiological and pathological conditions. To determine microglia activation following Ot infection, we stained mouse brain sections with IBA1 (a microglia marker). While the control samples contained resting microglia, characterized by long, ramified processes with comparatively small cell bodies, microglia activation was significant at day 10, as judged by their increased branching and lengthening of processes and enlarged cell bodies (Figure 5A). Mathys, et al. have recently used single-cell RNA-seq and identified a disease stage-specific microglia gene signature in a neurodegeneration model with Alzheimer’s disease-like phenotype, defining microglia reactive states as “early response” (a transient intermediate activation of microglia that proliferate) and “late response” (reactive microglia), respectively (41). To assess microglia activation state during Ot infection, we utilized Mathy’s reported analysis strategy. Interestingly, we found a significant enrichment of gene sets for early response (cluster 3/cluster7) and late response (cluster 6) at days 6 and 10, as compared to control brains by using GSEA (Figures 5B, C). Such trends were consistent with increased number of IBA1+ cells in infected brain tissues (Figure 5A). Notably, late-response-gene set had higher NES compared to early-response-gene set, suggesting a dominant response from reactive microglia during Ot infection (Figure 5). Together, our data supports a role of microglia activation in driving neuroinflammation in the brain of Ot-infected mice.
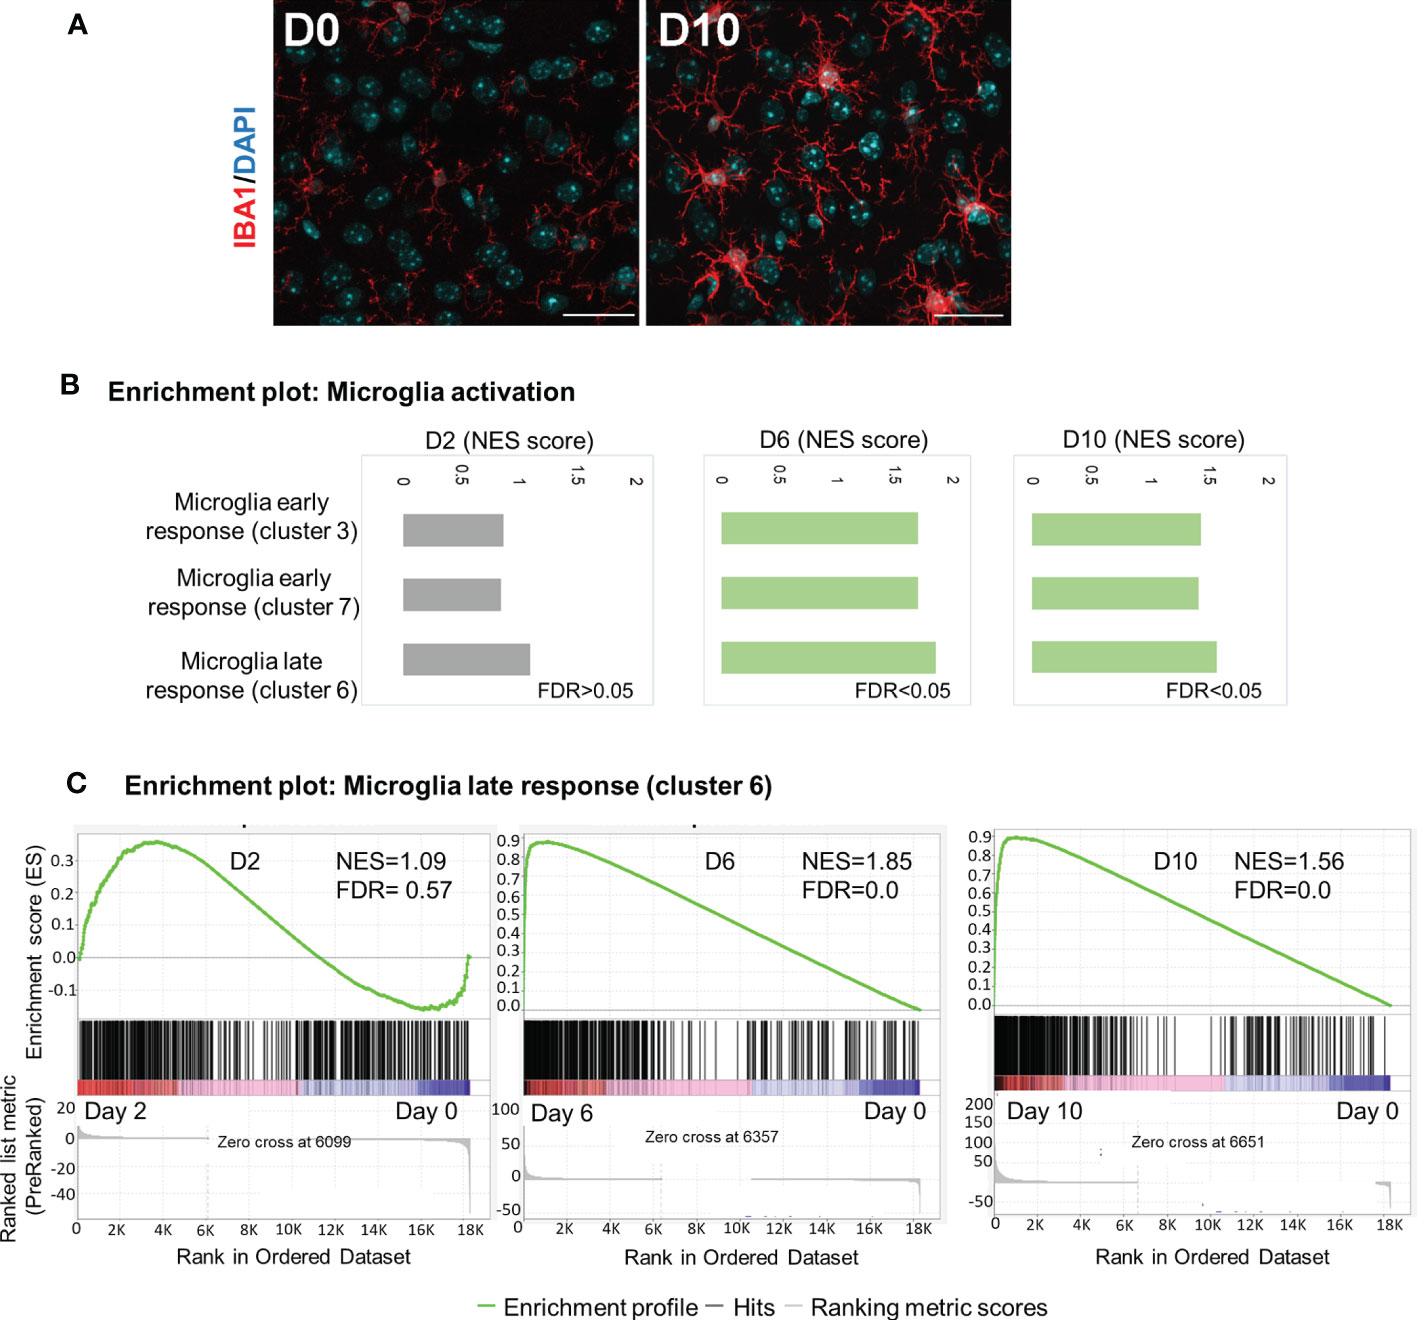
Figure 5 Activation of microglia in mouse brain in response to Ot infection. Brain RNA-seq experiment was performed as in Figure 1. (A) Activation of microglia at day 0 and 10 was evaluated by immunostaining (IBA1: red; DAPI: blue; Scale bars = 50 μm). Images were shown from one experiment representative of three performed independently (5 mice/group). (B) GSEA analysis identifies activation of ‘early response’ and ‘late response’ microglia gene expression signatures. (C) Enrichment plots for microglia ‘late response’ gene expression module at days 2, 6 and 10.
Astrocytes, also known as astroglia, are characteristic star-shaped glial cells in the brain and are often thought of as “nurse” cells for neurons in the brain parenchyma. Reactive astrocytes in CNS injury or disease can be polarized to A1 and A2 types that are neurotoxic and neuroprotective, respectively (45, 46). Since A1 astrocytes are induced by classically activated neuroinflammatory microglia (45), we speculated that severe Ot infection may also promote A1-like responses in the brain. We then analyzed our RNA-seq data for gene profiles associated with astrocyte activation and found that most pan-astrocytic markers were upregulated at day 10, as compared to those of day 0. Importantly, most A1-specific genes were also upregulated, while 70% of A2-specific markers were not altered or slightly decreased at the severe stage of infection (Supplementary Figure 3). Oure data suggest a strong brain A1-like responses in severe Ot infection, and these neurotoxic astrocytes may contribute to Ot-induced neuroinflammation and acute encephalitis.
To support our conclusion, we further investigated whether Ot replicated in microglia and promoted inflammation in vitro. We infected mouse and human microglia cell lines (BV2 and C20, respectively) with bacteria (MOI 10). Immunofluorescence staining clearly indicated established Ot infection in mouse microglia (Figure 6A). Furthermore, qRT-PCR analysis of proinflammatory genes indicated significantly increased levels of Cxcl10, Il-1b, and Tnf, especially at 72 h post-infection (Figure 6B). Similar results were also found in human microglia C20 (Figures 6C, D). The time-dependent increase in bacterial burdens of C20 cells confirmed productive intracellular replication (Supplementary Figure 4). Together, our in vitro data demonstrate Ot-induced bacterial growth and a pro-inflammatory response in microglia, potentially leading to neuroinflammation and subsequent brain damage.
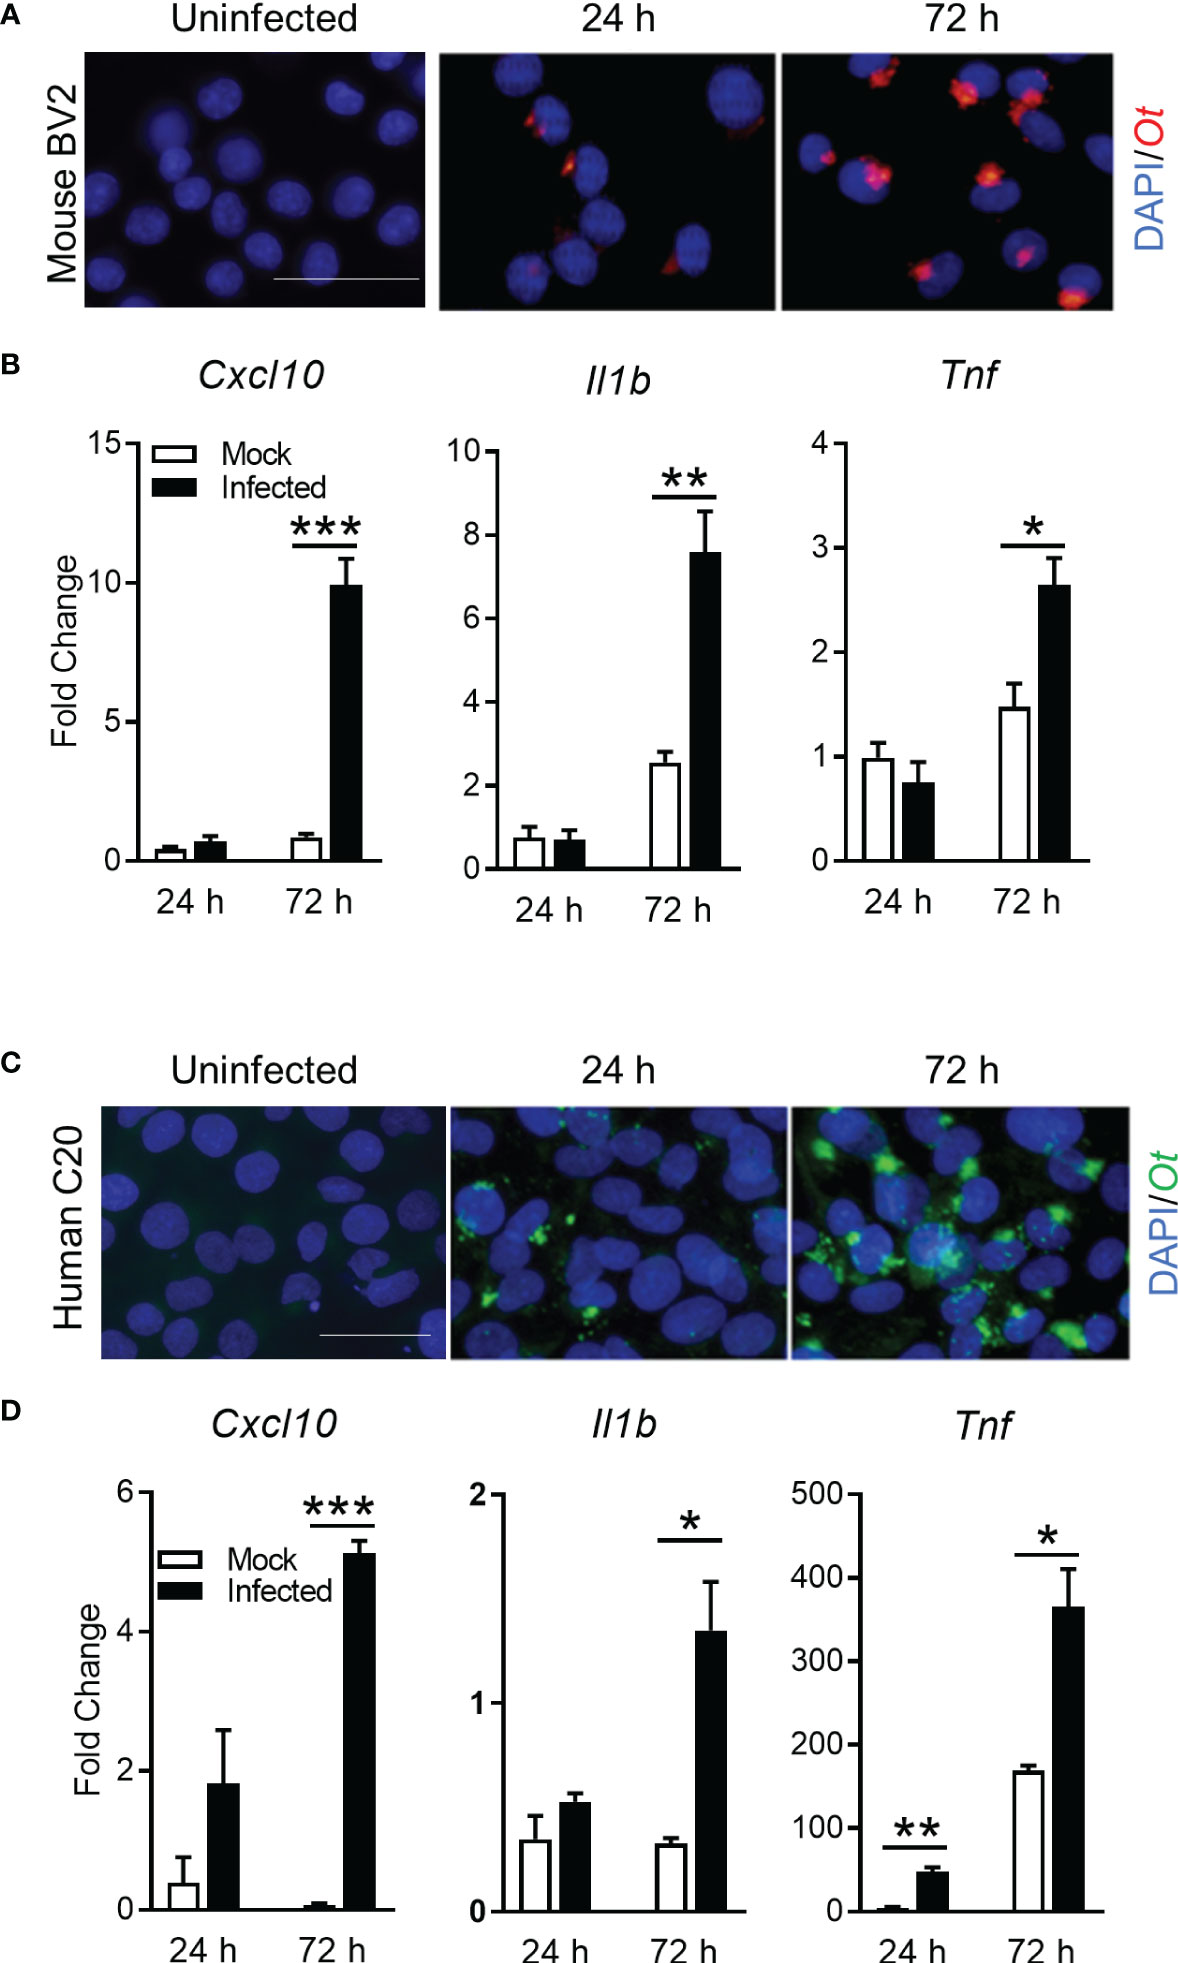
Figure 6 Ot bacteria replicate in microglial cell lines and induce inflammatory responses. Mouse BV2 and human C20 microglial cell lines were infected with Ot (MOI 10) in vitro. Uninfected cells were used as controls. Cells were harvested at 24 and 72 h. (A, C) Bacteria were detected by immunostaining using anti-TSA56 antibody. Scale bars = 50 μm. (B, D) Transcriptive levels of inflammatory gene Cxcl10, IL1b, and Tnf were analyzed by qRT-PCR. A two-tailed student t test was used for comparison between two groups. *, p < 0.05; **, p < 0.01; ***, p < 0.001. These experiments were repeated twice independently with triplicate samples each time and the data were shown from a single representative experiment.
Discussion
Neurological manifestations and sequelae of scrub typhus have long been overlooked. Antibiotics for the treatment of scrub typhus are not routinely advised for empirical treatment of CNS infections, leading to chronic sequelae of infection (14). Although clinical reports imply that Ot infection is the significant cause of AES in the endemic region, there is limited mechanistic research of Ot-induced AES mainly due to the shortage of appropriate animal models. To better understand the mechanism of CNS disorder in scrub typhus, we performed a kinetic study by using our established mouse model (24, 30), analyzed brain tissue samples by RNA-seq and immunostaining, and conducted in vitro infection studies with microglial cell cultures. This study provided several lines of new evidence for IFN responses, neuroinflammation, microglial activation, and BBB dysregulation during severe scrub typhus in mice.
Firstly, our data revealed the significant upregulation of IFN signaling in the brains of severe Ot infection. The significant IFN-I upregulation in Ot infection was not observed at day 2, but at days 6 and 10, respectively (Figure 1, Supplementary Figure 1). This result was consistent with a report by Min et. al., who showed the increased IFNβ proteins in mouse plasma at day 12 of Ot infection (47). High level of IFN-I may help control Ot infection in the brains and other organs, as we found significantly decreased bacterial burdens at day 10 compared to those at day 6 (Figure 1C). However, IFN-I may also contribute to neurological diseases, due to its neurotoxic effect on brain cells (48), and IFN-I induced by systemic infection can also hinder CNS vascular repair following brain injury (49). While our RNA-seq data were consistent with those reports, revealing the disrupted BBB at day 10 (Figure 3), further investigation is necessary to elucidate the essential function of IFN-I in Ot-induced acute and persistent neurological disorders.
Obligate bacterial pathogens that inhabit the host cytosol are often resistant to IFN-I, but such bacteria are sensitive to control mechanisms mediated by IFN-γ (50). A reported in vitro study with Ot Gilliam strain and BALB/3T3 mouse fibroblasts has indicated that IFN-γ significantly inhibits Ot growth, but also has toxic effects to the infected cells (51). In this study, the upregulation of cerebral IFN-γ expression at days 6 and 10 may be attributed to cellular recruitment to the CNS, including Th1 and cytotoxic T cells, as observed in our previous immunostaining study (24). These infiltrates may contribute to the activation of resident glial cells and aid in the clearance of bacteria. Given that inducible nitric oxide synthase (iNOS) plays a crucial role in regulating Ot growth in vitro (25), it is plausible that IFN-γ may enhance iNOS signaling in microglia and infiltrating macrophages/monocytes, leading to bacterial elimination in the brain. Our RNA-seq data herein also showed the activation of complement in inflamed brains, consistent with previous findings from mouse blood samples (52). Furthermore, activated microglia are known to produce neurotoxic TNF-α, which may interact synergistically with IFN-γ to enhance inflammatory microglial responses (53). Such responses collectively can drive caspase-8/FADD-mediated PANoptosis, a process that can contribute to neurodegeneration (54). Therefore, the sustained cytokine/chemokine production may cause neuroinflammation, brain damage, and host death.
Secondly, our confocal microscopy study provided strong evidence for intense microglia activation at day 10 (Figure 5), even when brain bacteria were well under control (Figure 1). Our previously reported immunostaining study has revealed IBA1 and Ot colocalization in mouse brains (24). We noticed that IBA1-positive microglia at day 10 only exhibited a bushy morphology with enlarged cell bodies, but were not a final phagocytic amoeboid state, suggesting that they were highly activated at the severe disease stages (prior to host death). This was in sharp contrast to the relatively low brain bacterial burdens, implying a more important role of immunopathogenesis in brain injury. It was evident that Ot was capable of infecting and replicating within both human and mouse microglia in vitro, as indicated by the cytosolic growth of Ot observed through fluorescent staining at 72 h (Figure 6). Given our observation of high levels of IFN-γ in the brains of infected mice (Figure 1), as well as in our previous reports (4, 24), it is possible that microglia respond to IFN-γ stimulation and polarize to an M1-like phenotype (55), resulting in restricted Ot growth, as in our previous study on M1 macrophages (56). Consistent with a report of activated microglia in producing pro-inflammatory cytokines (57), we also found a significant increase in the expression of Cxcl10, Il1b, and Tnf (Figure 6). Among these cytokines, CXCL10 is a known typical type 1 immune chemokine, playing a key role for T cell recruitment and neuroinflammation in various infectious diseases, including COVID-19 (58–61).
It is known that IL-1β and TNF-α produced by activated microglia are detrimental during the brain infection, as they can cause neuronal death via direct effects on neurons or indirectly via glial production of neurotoxic substances (62, 63). Increased CNS IL-1β can further amplify microglial activation, leading to neuroinflammation that causes neuropathology. Furthermore, astrocytes can be activated to become either type 1 (A1) or type 2 (A2) cells, playing neurotoxic or neuroprotective roles in the CNS (45). Such astrocyte reactivation is known to be tightly regulated by activated microglia-derived inflammatory mediators, including TNF-α, IL-1α and C1q (45). As indicated in Supplementary Figure 3, Ot infection significantly upregulated A1-asscoated, but not A2-asscoated, genes. We speculated that activated microglia may also exacerbate inflammation and promote CNS damage via facilitating neurotoxic A1 polarization. Notably, TNF-α which is an indispensable mediator for microglia-induce A1 phenotype, were remarkably elevated in brain tissues (24) and in vitro microglial cultures by Ot infection (Figure 6). These results indicate that TNF-α might be the key inflammatory factor that mediates neuroinflammation in scrub typhus. However, systemic blockage of TNF signaling in mice at initial stage impairs anti-bacterial T cell responses (64), leading to unrestrained Ot replication and fatal outcomes (28). Further investigation is necessary to elucidate the temporal and tissue-specific functions of these inflammatory cytokines in scrub typhus.
Finally, our data collectively suggest the progression of BBB dysfunction during severe Ot infection. Clinical studies have reported signs of BBB damage in severe scrub typhus patients, as well as in other rickettsial spp. infection (22). Ot dissemination into the brain has been demonstrated in several mouse models (24, 25). However, clinical studies are limited, showing no specific biomarkers that could differentiate rickettsial from other neurological infections, such as tuberculosis meningitis and Japanese encephalitis virus (22). This study clearly revealed alterations of genes known to be associated with BBB disruption in different neurological diseases, but more importantly, a positive correlation of gene numbers and scrub typhus disease development (Figure 3). The core genes that were significantly increased at both days 6 and 10 (Cxcl10, Casp4, Upp1, Ch25h, Selp, Lrg1, Ccl2, Slfn9) were confirmed by qRT-PCR; they could serve as potential biomarkers of BBB disruption in Ot infection. Future molecular tests of specific biomarkers may help early detection of neurological damage and reduce the mortality of scrub typhus patients. It will also be important to determine the timing and underlying mechanisms of IFN responses in BBB disruption. Such studies will provide new insight into the prevention strategy of neurological disorder in scrub typhus.
In summary, this study provided new lines of evidence for neuroinflammation and BBB dysregulation during severe scrub typhus in mice, as well as in Ot-infected microglial cell cultures (Figure 7). Mouse brain transcriptomics and immunostaining revealed highly activated innate immune signaling, complement activation, IFN responses, and the activation of brain-resident phagocyte microglia, which positively correlated with BBB dysregulation, particularly at late stages of scrub typhus. We clearly indicated that microglial cells were targets of Ot replication and cellular sources of proinflammatory gene expression (Cxcl10, Il1b, Tnf). We propose that these inflammatory responses collectively contribute to bacterial elimination in the brains, but also CNS damage in severe scrub typhus, and that immune-mediated tissue injury would sustain even when bacterial replication is under control. This study highlights the dominant type 1 immune responses, microglia activation, and BBB disruption in inflamed brain tissues, paving the way for future investigation of CNS dysregulation in scrub typhus and other rickettsial diseases. Further studies utilizing advanced technologies, such as single-cell RNA sequencing and other omics approaches, will provide a comprehensive understanding of the heterogeneous populations of brain resident cells and their precise functions in Ot-induced neurological disorders.
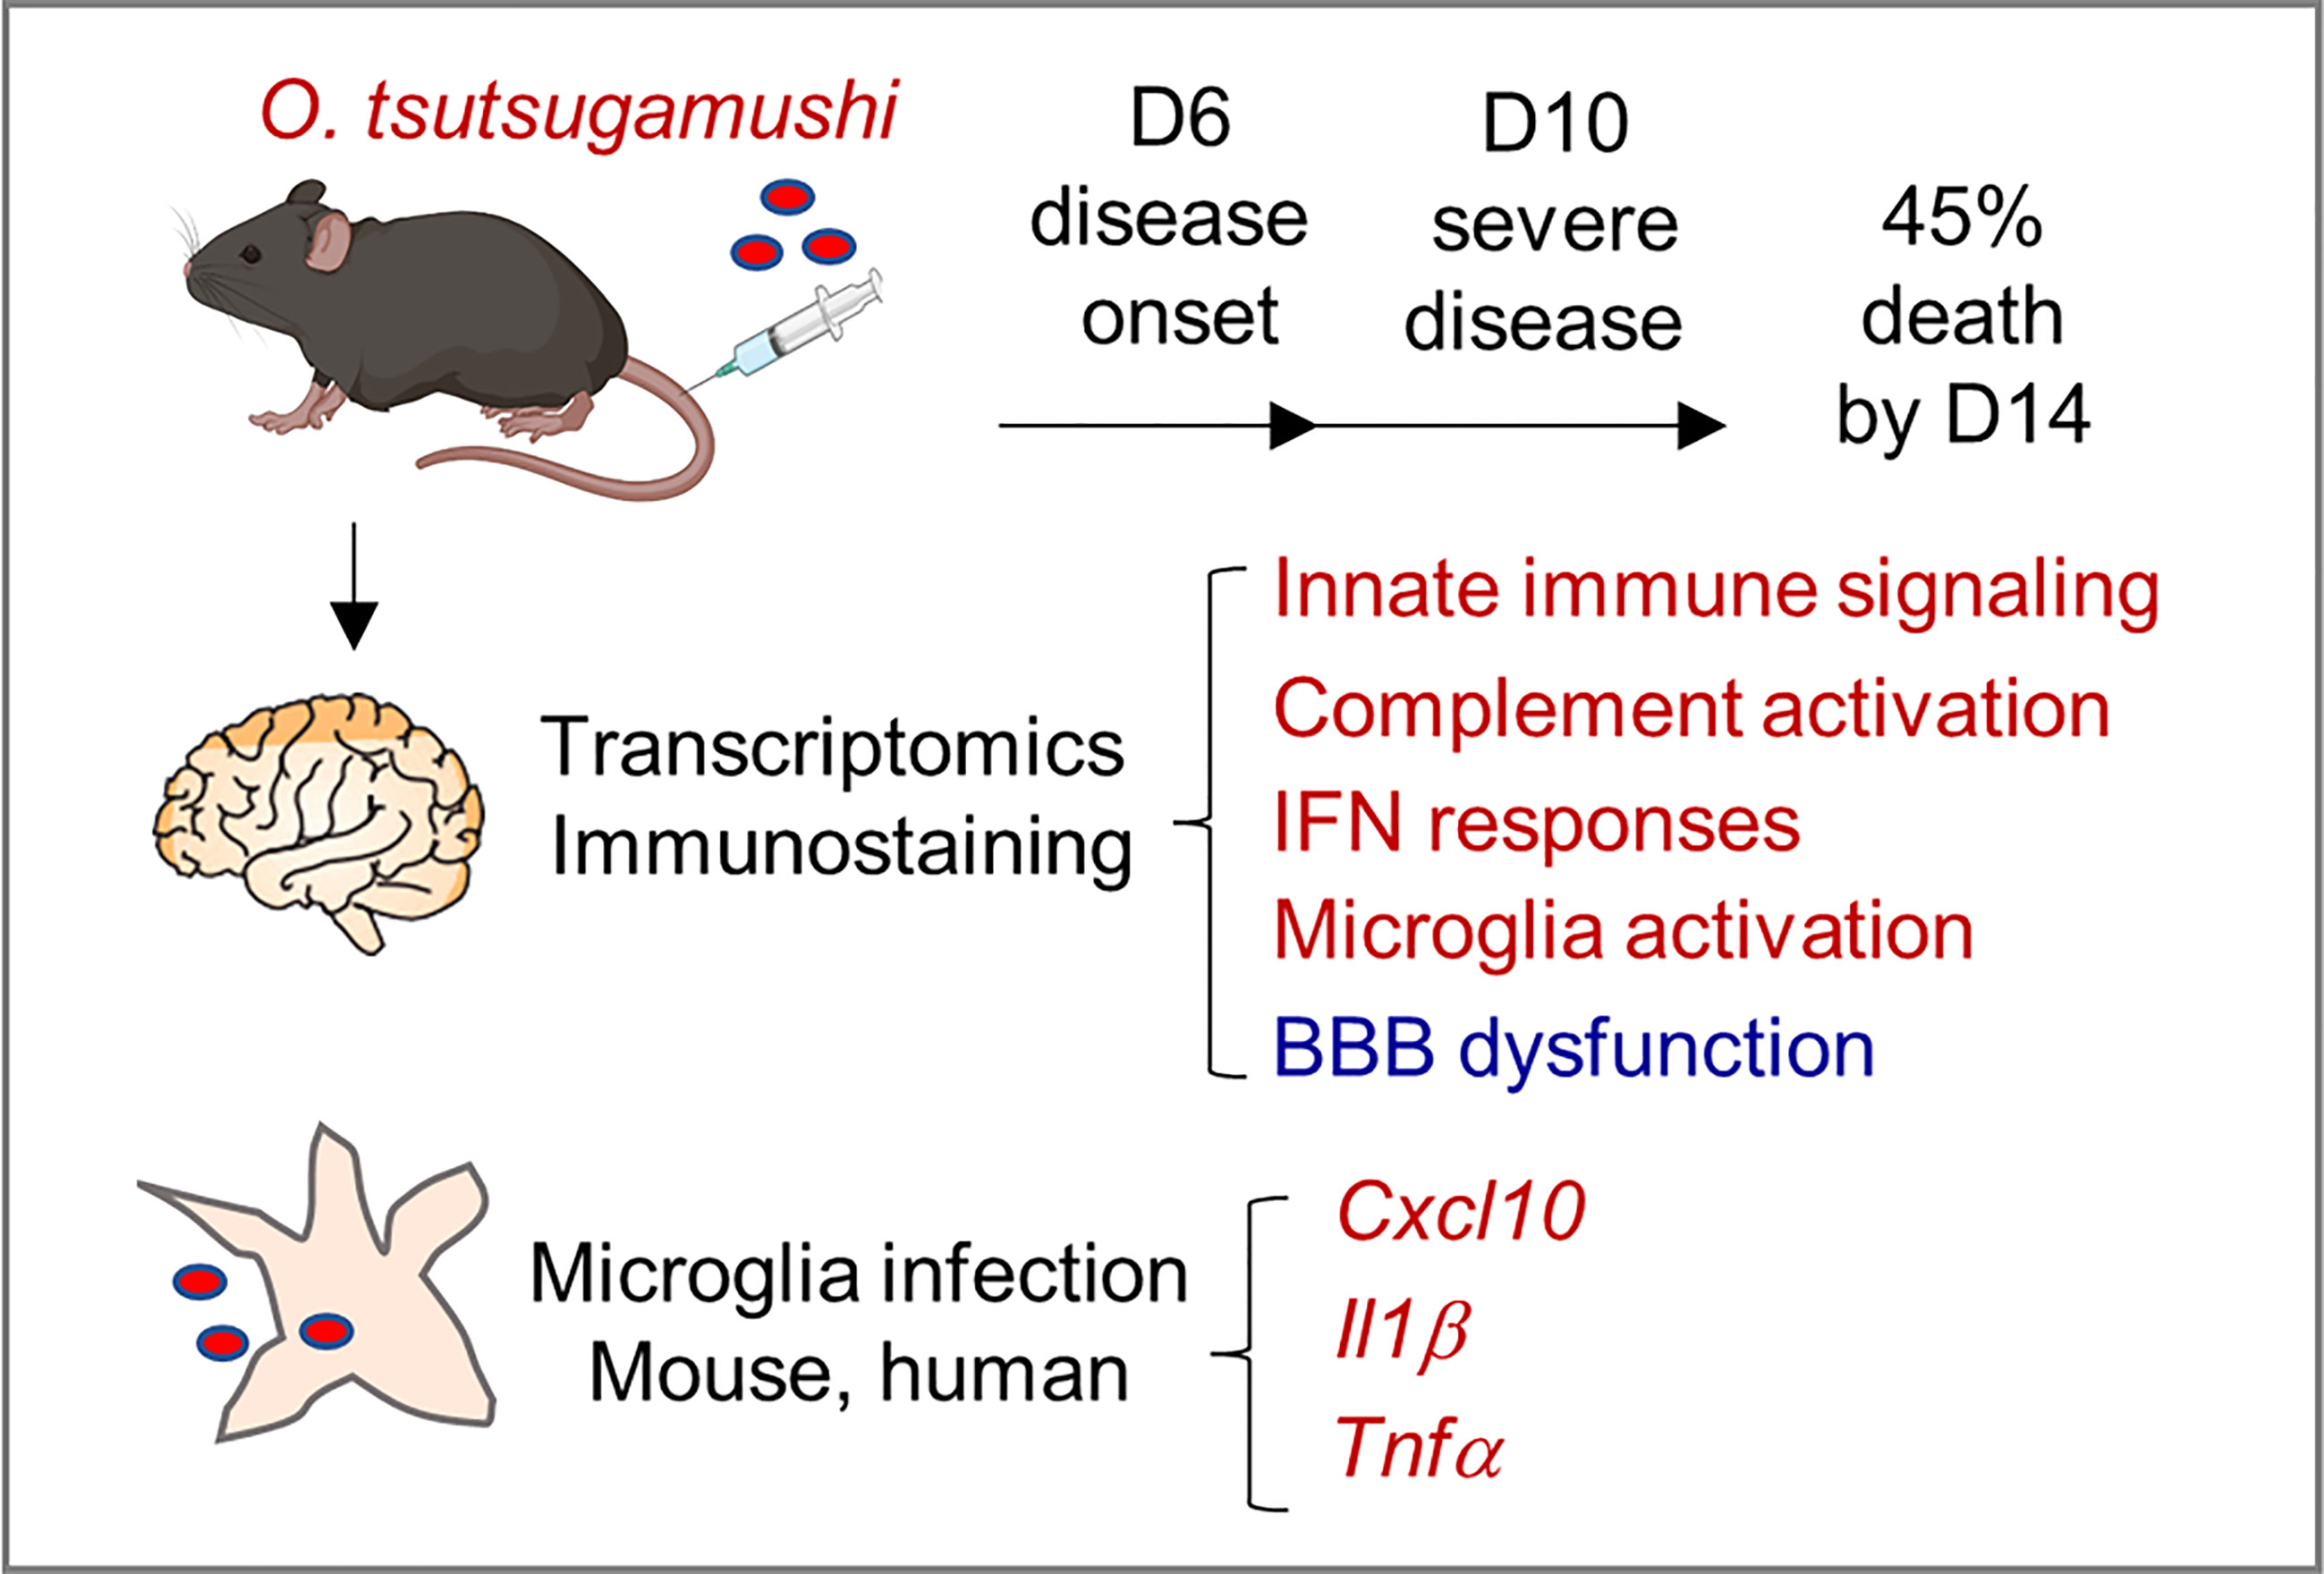
Figure 7 A schematic illustration of neuroinflammation in Ot-infected mice and microglia. Following i.v. infection with a lethal dose of Ot bacteria, B6 mice developed signs of disease (day 6), severe symptoms (day 10), with 45% mortality rates by day 14. Mouse brain transcriptomics at days 6 and 10 revealed the activation of innate immune signaling, complement activation, IFN responses, and brain-resident phagocyte microglia (in red), which correlated with reduction/dysregulation of the blood-brain barrier (in blue), particularly on day 10. Microglial cells were targets of Ot replication and cellular sources of proinflammatory gene expression (Cxcl10, Il1b, Tnf). These inflammatory responses collectively contributed to bacterial elimination in the brains, but also CNS damage in severe scrub typhus.
Data availability statement
The datasets presented in this study can be found in online repositories. The names of the repository/repositories and accession number(s) can be found below: https://www.ncbi.nlm.nih.gov/geo/query/acc.cgi?acc=GSE227525.
Ethics statement
The animal study was reviewed and approved by Mice were maintained under specific pathogen-free conditions and used at 6-9 weeks of age, following protocols approved by the Institutional Animal Care and Use Committee (protocol # 1902006) at the University of Texas Medical Branch (UTMB) in Galveston, TX.
Author contributions
YL, LS, and PSa contributed to conception and design of the study. YL, HW and FO performed the experiments. YL, A, CG, LS and PSa organized the database and performed the statistical analysis. YL and A wrote the first draft of the manuscript. LS, PSu, PSa, YL and A revised the manuscript. All authors contributed to the article and approved the submitted version.
Funding
This work was supported partially by the National Institute of Allergy and Infectious Diseases grants (AI132674 and AI156536 to LS, and AI153586 to YL, https://www.niaid.nih.gov), a UTMB Center for Biodefense and Emerging Infectious Diseases Pilot grant (to LS, https://www.utmb.edu/cbeid) and a UTMB IHII Pilot grant (to YL, https://www.utmb.edu/ihii/programs-initiatives/pilot-grant-program). CG was the recipient of a NIAID Biodefense Training Program fellowship (T32 AI060549 to Ashok Chopra). FO was the recipient of a NIH NIGMS PREP Program fellowship (R25 GM134990 to Gracie Vargas). The funders had no roles in study design, data collection and analysis, decision to publish, or preparation of the manuscript. PSa and A are funded by UTMB startup grant and the McLaughlin Endowment Fund (https://www.utmb.edu/mclaughlin/endowment/about).
Acknowledgments
We would like to thank Dr. Haitao Hu for kindly sharing his microglial cell lines with us, and Dr. David Walker for providing the BSL-3 research facilities.
Conflict of interest
The authors declare that the research was conducted in the absence of any commercial or financial relationships that could be construed as a potential conflict of interest.
Publisher’s note
All claims expressed in this article are solely those of the authors and do not necessarily represent those of their affiliated organizations, or those of the publisher, the editors and the reviewers. Any product that may be evaluated in this article, or claim that may be made by its manufacturer, is not guaranteed or endorsed by the publisher.
Supplementary material
The Supplementary Material for this article can be found online at: https://www.frontiersin.org/articles/10.3389/fimmu.2023.1194881/full#supplementary-material
Supplementary Figure 1 | Enrichment analysis of differentially expressed genes in response to Ot infection in mice. Brain RNA-seq experiment was performed as in Cytoscape enrichment map (FDR Q value < 0.01) of GSEA pathways enriched in upregulated genes in Ot-infected mouse brain tissue at days 2 (A) and 10 (B) post-infection compared to mocks.
Supplementary Figure 2 | GSEA analysis using Hallmark gene sets of differentially expressed genes in Ot-infected mice. Brain RNA-seq experiment was performed, as in . GSEA analysis identifies hallmark gene sets at days 0, 6 and 10, respectively.
Supplementary Figure 3 | Ot infection induces a type 1 astrocyte (A1) polarization in the brain. Brain RNA-seq experiment was performed, as in The FPKM fold changes of genes at day 10 were showed as a heat map with mock mice as controls. The selected genes were associated with pan reactive, A1- and A2-specific astrocytes. A two-tailed Student’s t test was used for statistical analysis of two groups. *, p < 0.05.
Supplementary Figure 4 | Ot replication in a human C20 microglial cell line. C20 were infected with Ot in vitro (MOI 10) and uninfected cells were used as controls. Cells were harvested at indicated time points for bacterial burden measurement by qPCR. A one-way ANOVA with a Tukey’s multiple comparisons test was used for statistical analysis. This experiment was repeated twice independently with triplicate samples each time, and the data were shown from a single representative experiment.
References
1. Luce-Fedrow A, Lehman ML, Kelly DJ, Mullins K, Maina AN, Stewart RL, et al. A review of scrub typhus (Orientia tsutsugamushi and related organisms): then, now, and tomorrow. Trop Med Infect Dis (2018) 3(1):8. doi: 10.3390/tropicalmed3010008
2. Weitzel T, Dittrich S, Lopez J, Phuklia W, Martinez-Valdebenito C, Velasquez K, et al. Endemic scrub typhus in south America. N Engl J Med (2016) 375(10):954–61. doi: 10.1056/NEJMoa1603657
3. Valbuena G, Walker DH. Approaches to vaccines against Orientia tsutsugamushi. Front Cell Infect Microbiol (2012) 2:170. doi: 10.3389/fcimb.2012.00170
4. Fisher J, Card G, Soong L. Neuroinflammation associated with scrub typhus and spotted fever group rickettsioses. PloS Negl Trop Dis (2020) 14(10):e0008675. doi: 10.1371/journal.pntd.0008675
5. Mahajan SK, Rolain JM, Kanga A, Raoult D. Scrub typhus involving central nervous system, India, 2004-2006. Emerg Infect Dis (2010) 16(10):1641–3. doi: 10.3201/eid1610.100456
6. Silpapojakul K, Ukkachoke C, Krisanapan S, Silpapojakul K. Rickettsial meningitis and encephalitis. Arch Intern Med (1991) 151(9):1753–7. doi: 10.1001/archinte.1991.00400090051010
7. Garg D, Manesh A. Neurological facets of scrub typhus: a comprehensive narrative review. Ann Indian Acad Neurol (2021) 24(6):849–64. doi: 10.4103/aian.aian_739_21
8. Misra UK, Kalita J, Mani VE. Neurological manifestations of scrub typhus. J Neurol Neurosurg Psychiatry (2015) 86(7):761–6. doi: 10.1136/jnnp-2014-308722
9. Varghese GM, Mathew A, Kumar S, Abraham OC, Trowbridge P, Mathai E. Differential diagnosis of scrub typhus meningitis from bacterial meningitis using clinical and laboratory features. Neurol India (2013) 61(1):17–20. doi: 10.4103/0028-3886.107919
10. Dubot-Peres A, Mayxay M, Phetsouvanh R, Lee SJ, Rattanavong S, Vongsouvath M, et al. Management of central nervous system infections, Vientiane, Laos, 2003-2011. Emerg Infect Dis (2019) 25(5):898–910. doi: 10.3201/eid2505.180914
11. Jain P, Prakash S, Tripathi PK, Chauhan A, Gupta S, Sharma U, et al. Emergence of Orientia tsutsugamushi as an important cause of acute encephalitis syndrome in India. PloS Negl Trop Dis (2018) 12(3):e0006346. doi: 10.1371/journal.pntd.0006346
12. Dittrich S, Rattanavong S, Lee SJ, Panyanivong P, Craig SB, Tulsiani SM, et al. Orientia, rickettsia, and leptospira pathogens as causes of cns infections in Laos: a prospective study. Lancet Glob Health (2015) 3(2):e104–12. doi: 10.1016/S2214-109X(14)70289-X
13. Alam AM, Gillespie CS, Goodall J, Damodar T, Turtle L, Vasanthapuram R, et al. Neurological manifestations of scrub typhus infection: a systematic review and meta-analysis of clinical features and case fatality. PloS Negl Trop Dis (2022) 16(11):e0010952. doi: 10.1371/journal.pntd.0010952
14. Pulla P. Disease sleuths unmask deadly encephalitis culprit. Science (2017) 357(6349):344. doi: 10.1126/science.357.6349.344
15. Prakash Gangwar S, Thangaraj JWV, Zaman K, Vairamani V, Mittal M, Murhekar M. Sequelae following acute encephalitis syndrome caused by. Orientia Tsutsugamushi. Pediatr Infect Dis J (2020) 39(5):e52–e4. doi: 10.1097/INF.0000000000002595
16. Kim J, Seok H, Jeon JH, Choi WS, Seo GH, Park DW. Association of scrub typhus with incidence of dementia: a nationwide population-based cohort study in Korea. BMC Infect Dis (2023) 23(1):127. doi: 10.1186/s12879-023-08107-0
17. Passaro AP, Lebos AL, Yao Y, Stice SL. Immune response in neurological pathology: emerging role of central and peripheral immune crosstalk. Front Immunol (2021) 12:676621. doi: 10.3389/fimmu.2021.676621
18. Sredni-Kenigsbuch D. Th1/Th2 cytokines in the central nervous system. Int J Neurosci (2002) 112(6):665–703. doi: 10.1080/00207450290025725
19. Krishnarajah S, Becher B. T(H) cells and cytokines in encephalitogenic disorders. Front Immunol (2022) 13:822919. doi: 10.3389/fimmu.2022.822919
20. Munch CC, Upadhaya BP, Rayamajhee B, Adhikari A, Munch M, En-Nosse N, et al. Multiple orientia clusters and Th1-skewed chemokine profile: a cross-sectional study in patients with scrub typhus from Nepal. Int J Infect Dis (2022) 128:78–87. doi: 10.1016/j.ijid.2022.12.022
21. Chung DR, Lee YS, Lee SS. Kinetics of inflammatory cytokines in patients with scrub typhus receiving doxycycline treatment. J Infect (2008) 56(1):44–50. doi: 10.1016/j.jinf.2007.09.009
22. Dittrich S, Sunyakumthorn P, Rattanavong S, Phetsouvanh R, Panyanivong P, Sengduangphachanh A, et al. Blood-brain barrier function and biomarkers of central nervous system injury in rickettsial versus other neurological infections in Laos. Am J Trop Med Hyg (2015) 93(2):232–7. doi: 10.4269/ajtmh.15-0119
23. Inthawong M, Sunyakumthorn P, Wongwairot S, Anantatat T, Dunachie SJ, Im-Erbsin R, et al. A time-course comparative clinical and immune response evaluation study between the human pathogenic Orientia tsutsugamushi strains: Karp and gilliam in a rhesus macaque (Macaca mulatta) model. PloS Negl Trop Dis (2022) 16(8):e0010611. doi: 10.1371/journal.pntd.0010611
24. Soong L, Shelite TR, Xing Y, Kodakandla H, Liang Y, Trent BJ, et al. Type 1-skewed neuroinflammation and vascular damage associated with Orientia tsutsugamushi infection in mice. PloS Negl Trop Dis (2017) 11(7):e0005765. doi: 10.1371/journal.pntd.0005765
25. Keller CA, Hauptmann M, Kolbaum J, Gharaibeh M, Neumann M, Glatzel M, et al. Dissemination of Orientia tsutsugamushi and inflammatory responses in a murine model of scrub typhus. PloS Negl Trop Dis (2014) 8(8):e3064. doi: 10.1371/journal.pntd.0003064
26. Osterloh A, Papp S, Moderzynski K, Kuehl S, Richardt U, Fleischer B. Persisting rickettsia typhi causes fatal central nervous system inflammation. Infect Immun (2016) 84(5):1615–32. doi: 10.1128/IAI.00034-16
27. Su Z, Chang Q, Drelich A, Shelite T, Judy B, Liu Y, et al. Annexin A2 depletion exacerbates the intracerebral microhemorrhage induced by acute rickettsia and Ebola virus infections. PloS Negl Trop Dis (2020) 14(7):e0007960. doi: 10.1371/journal.pntd.0007960
28. Liang Y, Fisher J, Gonzales C, Trent B, Card G, Sun J, et al. Distinct role of Tnfr1 and Tnfr2 in protective immunity against Orientia tsutsugamushi infection in mice. Front Immunol (2022) 13:867924. doi: 10.3389/fimmu.2022.867924
29. Soong L, Wang H, Shelite TR, Liang Y, Mendell NL, Sun J, et al. Strong type 1, but impaired type 2, immune responses contribute to Orientia tsutsugamushi-induced pathology in mice. PloS Negl Trop Dis (2014) 8(9):e3191. doi: 10.1371/journal.pntd.0003191
30. Shelite TR, Saito TB, Mendell NL, Gong B, Xu G, Soong L, et al. Hematogenously disseminated Orientia tsutsugamushi-infected murine model of scrub typhus [Corrected]. PloS Negl Trop Dis (2014) 8(7):e2966. doi: 10.1371/journal.pntd.0002966
31. Garcia-Mesa Y, Jay TR, Checkley MA, Luttge B, Dobrowolski C, Valadkhan S, et al. Immortalization of primary microglia: a new platform to study hiv regulation in the central nervous system. J Neurovirol (2017) 23(1):47–66. doi: 10.1007/s13365-016-0499-3
32. Leggett RM, Ramirez-Gonzalez RH, Clavijo BJ, Waite D, Davey RP. Sequencing quality assessment tools to enable data-driven informatics for high throughput genomics. Front Genet (2013) 4:288. doi: 10.3389/fgene.2013.00288
33. Wang L, Wang S, Li W. Rseqc: quality control of rna-seq experiments. Bioinformatics (2012) 28(16):2184–5. doi: 10.1093/bioinformatics/bts356
34. Blighe K LA. Pcatools: pcatools: everything principal components analysis. In: R package version 2.10.0. GitHub (2022). Available at: https://Github.Com/Kevinblighe/Pcatools.
35. Blighe K RS, Lewis M. Enhancedvolcano: publication-ready volcano plots with enhanced colouring and labeling. In: R package version 1.16.0. GitHub (2022). Available at: https://Github.Com/Kevinblighe/Enhancedvolcano.
36. Liang Y, Wang H, Gonzales C, Thiriot J, Sunyakumthorn P, Melby PC, et al. Ccr7/Dendritic cell axis mediates early bacterial dissemination in Orientia tsutsugamushi-infected mice. Front Immunol (2022) 13:1061031. doi: 10.3389/fimmu.2022.1061031
37. Thiriot J, Liang Y, Fisher J, Walker DH, Soong L. Host transcriptomic profiling of cd-1 outbred mice with severe clinical outcomes following infection with. Orientia Tsutsugamushi. PloS Negl Trop Dis (2022) 16(11):e0010459. doi: 10.1371/journal.pntd.0010459
38. Mootha VK, Lindgren CM, Eriksson KF, Subramanian A, Sihag S, Lehar J, et al. Pgc-1alpha-Responsive genes involved in oxidative phosphorylation are coordinately downregulated in human diabetes. Nat Genet (2003) 34(3):267–73. doi: 10.1038/ng1180
39. Subramanian A, Tamayo P, Mootha VK, Mukherjee S, Ebert BL, Gillette MA, et al. Gene set enrichment analysis: a knowledge-based approach for interpreting genome-wide expression profiles. Proc Natl Acad Sci U.S.A. (2005) 102(43):15545–50. doi: 10.1073/pnas.0506580102
40. Munji RN, Soung AL, Weiner GA, Sohet F, Semple BD, Trivedi A, et al. Profiling the mouse brain endothelial transcriptome in health and disease models reveals a core blood-brain barrier dysfunction module. Nat Neurosci (2019) 22(11):1892–902. doi: 10.1038/s41593-019-0497-x
41. Mathys H, Adaikkan C, Gao F, Young JZ, Manet E, Hemberg M, et al. Temporal tracking of microglia activation in neurodegeneration at single-cell resolution. Cell Rep (2017) 21(2):366–80. doi: 10.1016/j.celrep.2017.09.039
42. Shannon P, Markiel A, Ozier O, Baliga NS, Wang JT, Ramage D, et al. Cytoscape: a software environment for integrated models of biomolecular interaction networks. Genome Res (2003) 13(11):2498–504. doi: 10.1101/gr.1239303
43. Fisher J, Gonzales C, Chroust Z, Liang Y, Soong L. Orientia tsutsugamushi infection stimulates syk-dependent responses and innate cytosolic defenses in macrophages. Pathogens (2022) 12(1):53. doi: 10.3390/pathogens12010053
44. Sekeyova Z, Danchenko M, Filipcik P, Fournier PE. Rickettsial infections of the central nervous system. PloS Negl Trop Dis (2019) 13(8):e0007469. doi: 10.1371/journal.pntd.0007469
45. Liddelow SA, Guttenplan KA, Clarke LE, Bennett FC, Bohlen CJ, Schirmer L, et al. Neurotoxic reactive astrocytes are induced by activated microglia. Nature (2017) 541(7638):481–7. doi: 10.1038/nature21029
46. Liddelow SA, Barres BA. Reactive astrocytes: production, function, and therapeutic potential. Immunity (2017) 46(6):957–67. doi: 10.1016/j.immuni.2017.06.006
47. Min CK, Kim HI, Ha NY, Kim Y, Kwon EK, Yen NTH, et al. A type I interferon and il-10 induced by Orientia tsutsugamushi infection suppresses antigen-specific T cells and their memory responses. Front Immunol (2018) 9:2022. doi: 10.3389/fimmu.2018.02022
48. Viengkhou B, Hofer MJ. Breaking down the cellular responses to type I interferon neurotoxicity in the brain. Front Immunol (2023) 14:1110593. doi: 10.3389/fimmu.2023.1110593
49. Mastorakos P, Russo MV, Zhou T, Johnson K, McGavern DB. Antimicrobial immunity impedes cns vascular repair following brain injury. Nat Immunol (2021) 22(10):1280–93. doi: 10.1038/s41590-021-01012-1
50. Burke TP, Engstrom P, Chavez RA, Fonbuena JA, Vance RE, Welch MD. Inflammasome-mediated antagonism of type I interferon enhances rickettsia pathogenesis. Nat Microbiol (2020) 5(5):688–96. doi: 10.1038/s41564-020-0673-5
51. Hanson B. Susceptibility of rickettsia tsutsugamushi gilliam to gamma interferon in cultured mouse cells. Infect Immun (1991) 59(11):4125–33. doi: 10.1128/iai.59.11.4125-4133.1991
52. Chao CC, Yang R, Zhang Z, Belinskaya T, Chan CT, Miller SA, et al. Temporal analysis of mrna expression profiles in orientia infected C3heb/Fej mouse. BMC Microbiol (2020) 20(1):3. doi: 10.1186/s12866-019-1684-3
53. Lively S, Schlichter LC. Microglia responses to pro-inflammatory stimuli (Lps, Ifngamma+Tnfalpha) and reprogramming by resolving cytokines (Il-4, il-10). Front Cell Neurosci (2018) 12:215. doi: 10.3389/fncel.2018.00215
54. Karki R, Sharma BR, Tuladhar S, Williams EP, Zalduondo L, Samir P, et al. Synergism of tnf-alpha and ifn-gamma triggers inflammatory cell death, tissue damage, and mortality in sars-Cov-2 infection and cytokine shock syndromes. Cell (2021) 184(1):149–68 e17. doi: 10.1016/j.cell.2020.11.025
55. Orihuela R, McPherson CA, Harry GJ. Microglial M1/M2 polarization and metabolic states. Br J Pharmacol (2016) 173(4):649–65. doi: 10.1111/bph.13139
56. Trent B, Fisher J, Soong L. Scrub typhus pathogenesis: innate immune response and lung injury during Orientia tsutsugamushi infection. Front Microbiol (2019) 10:2065. doi: 10.3389/fmicb.2019.02065
57. Sun H, Wan X, Fan Y, Liu P, Song Y, Zhu N, et al. Bacteria reduce flagellin synthesis to evade microglia-Astrocyte-Driven immunity in the brain. Cell Rep (2022) 40(1):111033. doi: 10.1016/j.celrep.2022.111033
58. Xu J, Neal LM, Ganguly A, Kolbe JL, Hargarten JC, Elsegeiny W, et al. Chemokine receptor Cxcr3 is required for lethal brain pathology but not pathogen clearance during cryptococcal meningoencephalitis. Sci Adv (2020) 6(25):eaba2502. doi: 10.1126/sciadv.aba2502
59. Stiles LN, Hosking MP, Edwards RA, Strieter RM, Lane TE. Differential roles for Cxcr3 in Cd4+ and Cd8+ T cell trafficking following viral infection of the cns. Eur J Immunol (2006) 36(3):613–22. doi: 10.1002/eji.200535509
60. Skinner D, Marro BS, Lane TE. Chemokine Cxcl10 and coronavirus-induced neurologic disease. Viral Immunol (2019) 32(1):25–37. doi: 10.1089/vim.2018.0073
61. Gudowska-Sawczuk M, Mroczko B. What is currently known about the role of Cxcl10 in sars-Cov-2 infection? Int J Mol Sci (2022) 23(7):3673. doi: 10.3390/ijms23073673
62. Chao CC, Hu S, Ehrlich L, Peterson PK. Interleukin-1 and tumor necrosis factor-alpha synergistically mediate neurotoxicity: involvement of nitric oxide and of n-Methyl-D-Aspartate receptors. Brain Behav Immun (1995) 9(4):355–65. doi: 10.1006/brbi.1995.1033
63. Thornton P, Pinteaux E, Gibson RM, Allan SM, Rothwell NJ. Interleukin-1-Induced neurotoxicity is mediated by glia and requires caspase activation and free radical release. J Neurochem (2006) 98(1):258–66. doi: 10.1111/j.1471-4159.2006.03872.x
Keywords: neuroinflammation, scrub typhus, IFN response, microglial activation, BBB disruption, innate immune activation, RNA-Seq - RNA sequencing
Citation: Liang Y, Aditi, Onyoni F, Wang H, Gonzales C, Sunyakumthorn P, Wu P, Samir P and Soong L (2023) Brain transcriptomics reveal the activation of neuroinflammation pathways during acute Orientia tsutsugamushi infection in mice. Front. Immunol. 14:1194881. doi: 10.3389/fimmu.2023.1194881
Received: 27 March 2023; Accepted: 02 May 2023;
Published: 22 June 2023.
Edited by:
Christoph Hölscher, Research Center Borstel (LG), GermanyReviewed by:
Jeanne Salje, University of Cambridge, United KingdomAnke Osterloh, Research Center Borstel (LG), Germany
Copyright © 2023 Liang, Aditi, Onyoni, Wang, Gonzales, Sunyakumthorn, Wu, Samir and Soong. This is an open-access article distributed under the terms of the Creative Commons Attribution License (CC BY). The use, distribution or reproduction in other forums is permitted, provided the original author(s) and the copyright owner(s) are credited and that the original publication in this journal is cited, in accordance with accepted academic practice. No use, distribution or reproduction is permitted which does not comply with these terms.
*Correspondence: Parimal Samir, Zm5wYXJpbWFAdXRtYi5lZHU=; Lynn Soong, bHlzb29uZ0B1dG1iLmVkdQ==
†These authors have contributed equally to this work