 Yanhong Shou
 Ronghui Zhu
 Zhenwei Tang
 Xiao-Yong Man
- 1Department of Dermatology, Second Affiliated Hospital, Zhejiang University School of Medicine, Hangzhou, China
- 2Department of Dermatology, Huashan Hospital, Fudan University, Shanghai, China
Background: The hyperproliferation featured with upregulated glycolysis is a hallmark of psoriasis. However, molecular difference of keratinocyte glycolysis amongst varied pathologic states in psoriasis remain elusive.
Objectives: To characterize glycolysis status of psoriatic skin and assess the potential of glycolysis score for therapeutic decision.
Methods: We analyzed 345414 cells collected from different cohorts of single-cell RNA seq database. A new method, Scissor, was used to integrate the phenotypes in GSE11903 to guide single-cell data analysis, allowing identification of responder subpopulations. AUCell algorithm was performed to evaluate the glycolysis status of single cell. Glycolysis signature was used for further ordering in trajectory analysis. The signature model was built with logistic regression analysis and validated using external datasets.
Results: Keratinocytes (KCs) expressing SLC2A1 and LDH1 were identified as a novel glycolysis-related subpopulation. Scissor+ cells and Scissor− cells were defined as response and non-response phenotypes. In Scissor+ SLC2A1+ LDH1+ KCs, ATP synthesis pathway was activated, especially, the glycolysis pathway being intriguing. Based on the glycolysis signature, keratinocyte differentiation was decomposed into a three-phase trajectory of normal, non-lesional, and lesional psoriatic cells. The area under the curve (AUC) and Brier score (BS) were used to estimate the performance of the glycolysis signature in distinguishing response and non-response samples in GSE69967 (AUC =0.786, BS =17.7) and GSE85034 (AUC=0.849, BS=11.1). Furthermore, Decision Curve Analysis suggested that the glycolysis score was clinically practicable.
Conclusion: We demonstrated a novel glycolysis-related subpopulation of KCs, identified 12-glycolysis signature, and validated its promising predictive efficacy of treatment effectiveness.
Introduction
Psoriasis, a chronic immune-mediated skin disorder occuring in approximately 2%–3% of the population worldwide, is characterized by raised scales and inflammatory eruptions on skin (1). Histologically, lesional skin is featured with abnormal proliferation of keratinocytes and is believed to be the main cause of clinical manifestations. Understanding why psoriatic keratinocytes being hyperproliferative remains critical for its treatment.
According to previous studies (2, 3), hyperproliferative keratinocytes in psoriatic lesions are incompletely differentiated and metabolically activated. In general, hyperproliferative cells require energic support to meet their self-accelerating cellular processes (2). A phenomenon termed “the Warburg effect” is well studied that cancer cells are dependent on glycolysis for energy production (4, 5). Glycolysis is a major source of energy generation, supporting rapid proliferation in many cells (6, 7). In psoriasis, skin cells undergo complete turnover within three or four days, whereas in healthy skin, this process takes one month (8). The pathologic proliferation of keratinocytes is one of the pathophysiological hallmarks of psoriasis (2). Previous research has indicated that enhanced glucose metabolism is essential for proliferating keratinocytes (9). Upregulated glucose transporter 1 (GLUT1) expression is correlated with increased Psoriasis Area and Severity Index (PASI) score, implying that it could be a target for abnormal hyperproliferation (10). Further research into glycolytic molecules linked to psoriasis pathogenesis is required.
Although metabolites can be directly determined by liquid chromatography-mass spectrometry technology, higher requirements of sample storage and easier degradation of targets are common. As a result, methods for determining the metabolic status via gene expression have been developed. Bulk RNA sequencing (bulk RNA-seq) represents the average of gene expression patterns at the whole population level, and the development of single-cell RNA sequencing (scRNA-seq) technologies allows the transcriptome profiling to be investigated at a single-cell resolution. By applying up-to-date single-cell sequencing, the metabolic reprogramming of single cell can even be identified via bioinformatic methods.
Here we collected scRNA-seq data from several recent studies (11–13) and analyzed the glycolysis level in diverse cell types, especially epidermal keratinocytes. Moreover, the phenotypes in GSE11903 were applied to recognize the specific subpopulations responsible for treatment. We sought to investigate the molecular signature and calculated the glycolysis score. According to the gene expression data and clinical information, an individual therapeutic effect assessment was performed. Before a long-term treatment regimen, gene expression studies could identify a potential therapeutic response at the molecular level.
Methods
Data acquisition
Single-cell transcriptome profiling from E-MTAB-8142 (11), which using skin biopsies from 24 patients with psoriasis (12 lesional samples, 12 non-lesional samples), and 40 healthy control subjects, was obtained via the European Bioinformatics Institute (https://www.ebi.ac.uk/). We also collected the scRNA-seq data including 5 patients with psoriasis and 3 healthy control subjects from GSE150672 (12) via the Gene Expression Omnibus (GEO) database (https://www.ncbi.nlm.nih.gov/geo/) and collected single-cell transcriptome profiling of normal and inflamed human epidermis from EGAS00001002927 (13) via the Genome-phenome Archive (EGA) database (https://ega-archive.org). RNA-seq datasets can be accessed on GEO: GSE30999 (14), GSE41664 (15), GSE78097 (16), GSE13355 (17), GSE14905 (18), GSE69967 (19), GSE11903 (20), GSE85034 (21).
Data filtering and preprocessing
The following criteria were used to filter cells: (1) the total number of unique molecular identifiers (UMIs) per cell; (2) the number of detected genes per cell; and (3) the ratio of mitochondrial genes. The UMI count ranged from 200 to 50000, and the number of genes detected per cell ranged from 10% to 90% of total detected levels. High-quality cells were reserved if the proportion of mitochondrial genes was <10%. Doublets were detected by the package DoubletFinder (22). Cells identified as doublets were excluded.
Cell type recognition
Based on the top 15 principal components and the top 2000 variable genes, batch effects among the datasets were eliminated using the RunHarmony function (23). Uniform Manifold Approximation and Projection (UMAP) (24) with a resolution of 0.5 coordinate FindAllMarkers function in Seurat was then used for cluster-specific genes.
Scissor selected cells
In the GSE11903 dataset of psoriasis treated with etanercept, we observed responders and non-responders. Combined with the phenotypes collected from GSE11903, the new approach Scissor (version 2.0.0) was executed to recognize the phenotype-related cells from single-cell data (25). Logistic regression with the parameter α 0.05 was set in the process. Scissor+ cells and Scissor− cells will be linked to the responder and non-responder phenotypes, respectively.
Pathway activity calculation
Pathway of glycolysis/gluconeogenesis was obtained from Kyoto Encyclopedia of Genes and Genomes (KEGG) database (http://www.genome.jp/kegg). According to the published articles, the major genes in the Th17/Th22 pathway were then defined and summarized. The AUCell package uses the “Area Under the Curve” (AUC) to calculate the activity level of gene sets using a rank-based scoring method and computes a gene set activation score for each cell. Following that, the AUCell package (version 1.8.0) (26) was used to calculate the activity of glycolysis/gluconeogenesis or the Th17/Th22 pathway for individual cells.
Differential gene expression analysis
We performed a differential gene expression analysis on a per cluster of keratinocytes for lesional vs non-lesional psoriasis samples, then retained differentially expressed genes (DEGs) with adjusted P value < 0.05 & abs avg_log2FC >0.25. DEGs were extracted, and further functional enrichment analysis was carried using the clusterProfile package (version 3.18.1) (27). Based on the metabolic pathways from KEGG database, package fgsea (version 1.16.0) was performed to calculate the normalized enrichment score (28).
Single-cell trajectory analysis
We were interested in the role of glycolysis/gluconeogenesis in keratinocytes, thus focusing on downstream extraction and visualization of keratinocytes. Package monocle (version 2.6.4) (29) was utilized to construct pseudotime trajectories. Overlapped genes between DEGs and glycolysis/gluconeogenesis gene set were determined as gene signature and then were used for ordering in a semi-supervised manner.
Calculation of gene signature score
Overlapped genes were identified between DEGs and the glycolysis/gluconeogenesis gene set, and logistic regression was performed using the glm function. To ensure the algorithm was robust, well-correlated genes were selected in the model (P<0.05). Furthermore, we used the following method to calculate each patient’s signature score: score=k∑gene. In this formula, “gene” refers to the gene expression level of each gene signature, and “k” refers to the coefficient for each gene signature.
Scoring classifier
To estimate and visualize the performance of the gene signature score, the Receiver Operating Characteristic Curve (ROC) was depicted and the Area Under the Curve (AUC) was calculated. Calibration curves were depicted for calibration visualization. Decision curve analysis (DCA) was conducted to assess the clinical benefits. pROC (version 1.18.0), rms (version 6.2-0), and rmda (version 1.6) were used in this part.
Statistical analysis
Significance between non-responders versus responder phenotype was compared through the t-test. The statistical difference between normal, non-lesional, and lesional groups was analyzed using ANOVA approaches. Spearman’s correlation coefficients were calculated using the corrplot package (version 0.84). Our analyses were performed with R software, R version 4.0.5.
Results
Single-cell RNA-seq profiling and screening of marker genes
The study workflow was shown in Figure 1. We integrated the selected datasets using Seurat’s standard workflow and identified 201915, 59700, and 83799 cells from normal, non-lesional psoriasis, and lesional psoriasis samples, respectively. Using graphical unsupervised clustering, we recognized seven clusters of cells (Figure 2A) and defined them according to the signature expression of marker genes (Supplementary Figure 1A).
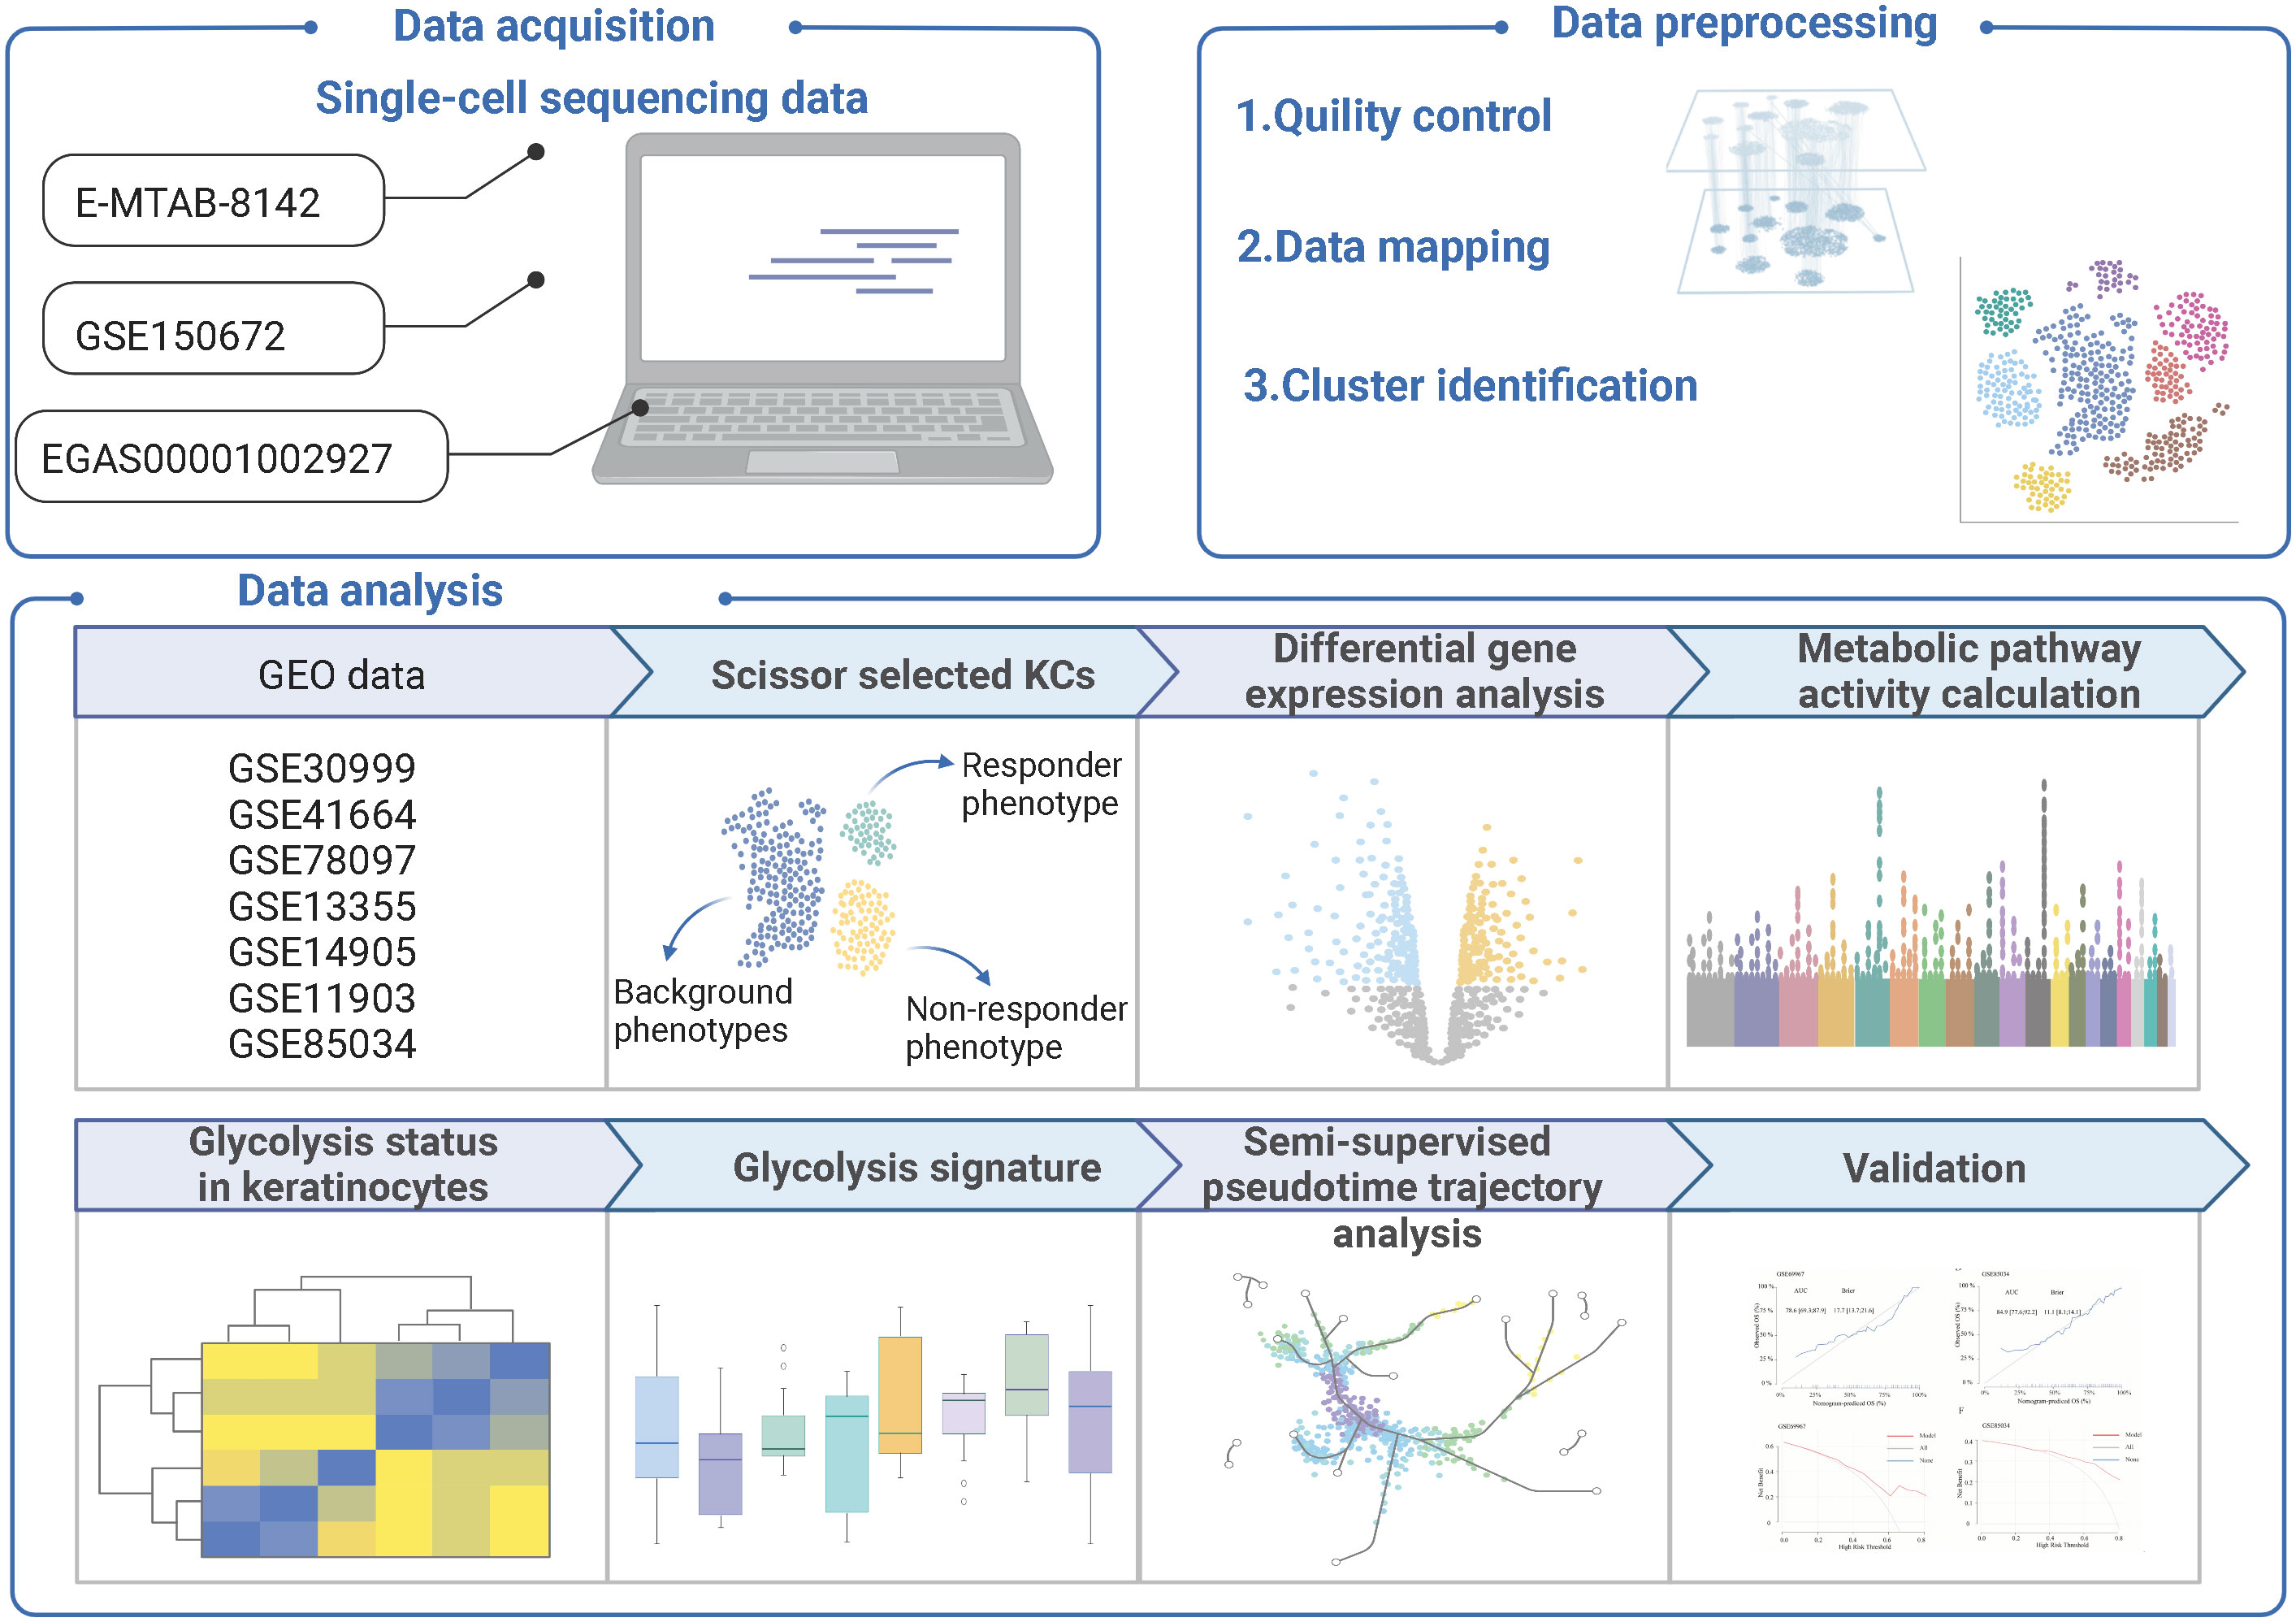
Figure 1 The flowchart of the research.
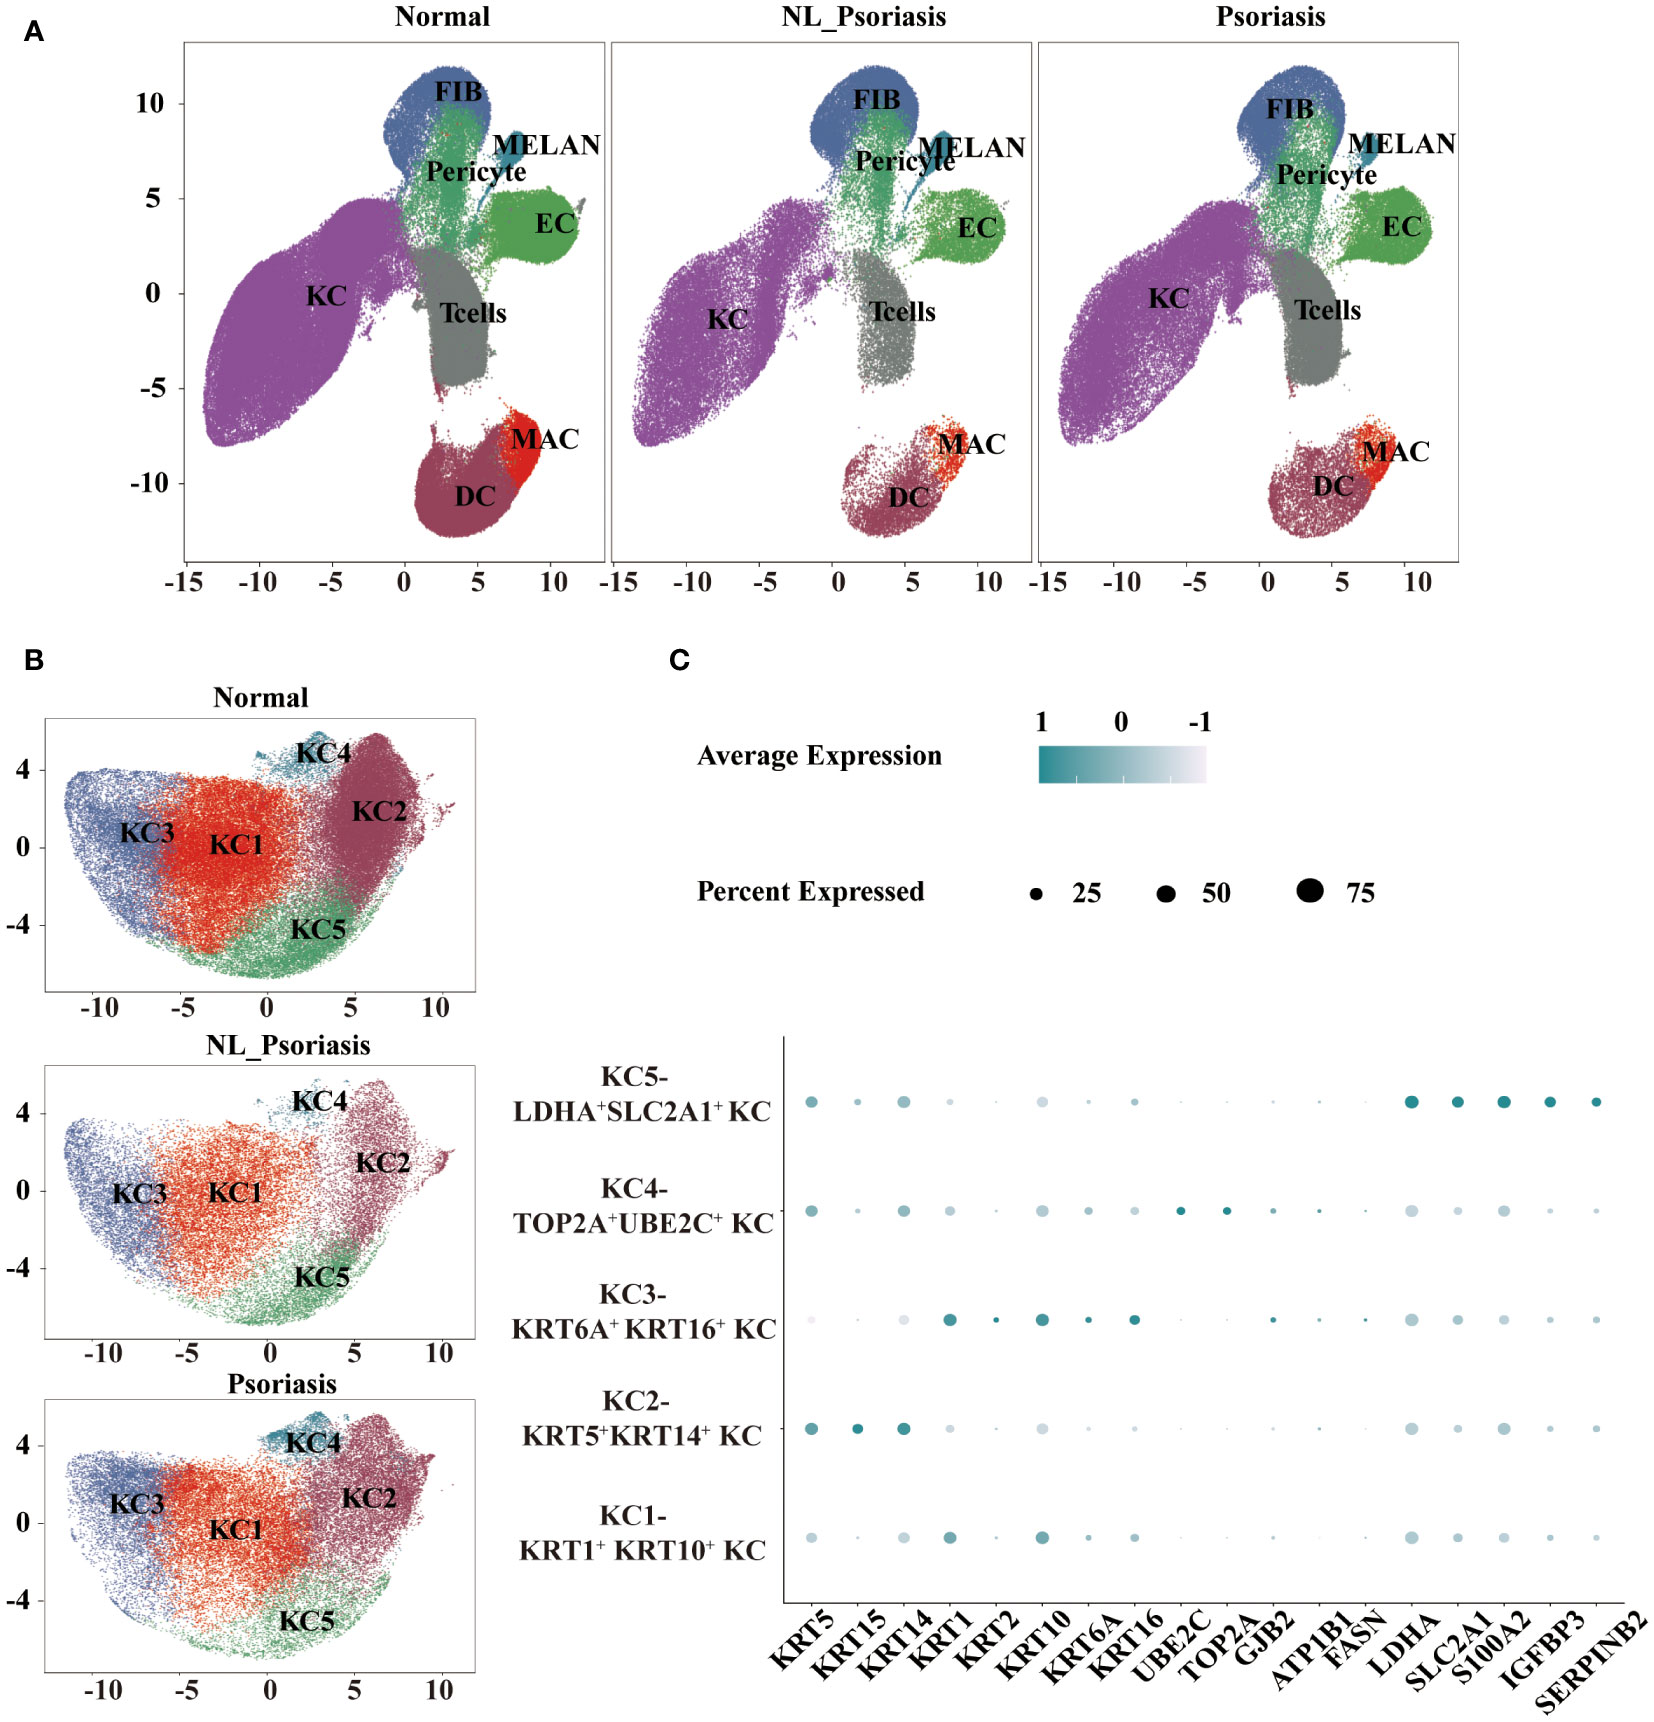
Figure 2 Single-cell landscape of normal and psoriasis human skin. (A) UMAP visualization of eight cell types. (B) UMAP representation of five clusters of keratinocytes. (C) A dot plot displaying critical marker transcripts used to distinguish keratinocytes. UMAP, Uniform manifold approximation and project.
First-level analysis showed that keratinocytes (KCs) were recognized by KRT genes. T cells were distinguished by coordinate upregulation of CD3D, CD3G, and CD3E, and macrophages/dendritic cells (MAC/DC) showed high HLA levels. Fibroblasts (FIB) highly showed expressions of COL1A1, DCN, and LUM. Finally, endothelial cells (EC) were recognized by the VWF and PECAM1 levels. Melanocytes (MELAN) indicated elevated for transcripts known to be expressed in melanocyte pigment synthesis pathway. A cluster of cells expressed ACTA2 and TAGLN were recognized as pericytes. We determined the relative proportion of subpopulations in all samples, suggesting increased T cells in lesional psoriasis versus in normal skin (P<0.05, Supplemental Figure 1B).
To further characterize KC, we performed the second-level clustering analysis of them. Based on UMAP (Figure 2B), five subpopulations were identified: ‘KC1’, ‘KC2’, ‘KC3’, ‘KC4’, and ‘KC5’. As shown in Figure 2C, ‘KC1’ expressed high levels of KRT1 and KRT10 and corresponded to suprabasal keratinocytes (KRT1+KRT10+ KC). ‘KC2’ were defined as basal keratinocytes for their high expression levels of KRT5 and KRT14 (KRT5+ KRT14+ KC). Due to the significant expression of KRT1, KRT10, KRT6A, and KRT16, a cluster of KC3 were recognized as inner root sheath (IRS)-sebaceous cells (KRT6A+KRT16+ KC). And the UBE2C - and TOP2A -expressing KC4 were annotated as proliferating keratinocytes (TOP2A+UBE2C+ KC). Genes involved in glycolysis and inflammation (LDH1, SCL2A1, S100A2, IGFBP3, and SERPINB2) were highly expressed in the ‘KC5’, leading us to define them as a glycolysis-related subpopulation (LDHA+SLC2A1+ KC).
Identifying the responder and non-responder keratinocyte subpopulations
Application of biologics have exhibited favorable results in psoriasis therapy but also showed varied responses in some patients. We analyzed clinical phenotypical features provided by a psoriasis dataset to investigate the mechanism underlying different responses. Scissor analysis was performed on 35405 keratinocytes from psoriasis samples. A total of 3565 Scissor+ cells associated with the responder phenotype and 3720 Scissor− cells related to the non-responder phenotype were recognized (Figure 3A). To characterize the transcriptional features, 61 upregulated genes and 51 downregulated genes were differentially expressed in Scissor+ cells versus Scissor− cells (Figure 3B). Notably, we found that numerous ATP-related genes were among the overexpressed genes listed above. Consistently, several ATP synthesis pathways were enriched in Scissor+ cells through GO enrichment analysis (Figure 3C). ATP production includes three important cellular processes——glycolysis, oxidative phosphorylation, and beta-oxidation. By performing Gene Set Enrichment Analysis (GSEA), we confirmed the significant metabolic pathways based on the ranked matrix of putative differentially expressed genes (Figure 3D). In 85 metabolic pathways, the top five were oxidative phosphorylation, the TCA cycle, propanoate metabolism, pyruvate metabolism, and glycolysis.
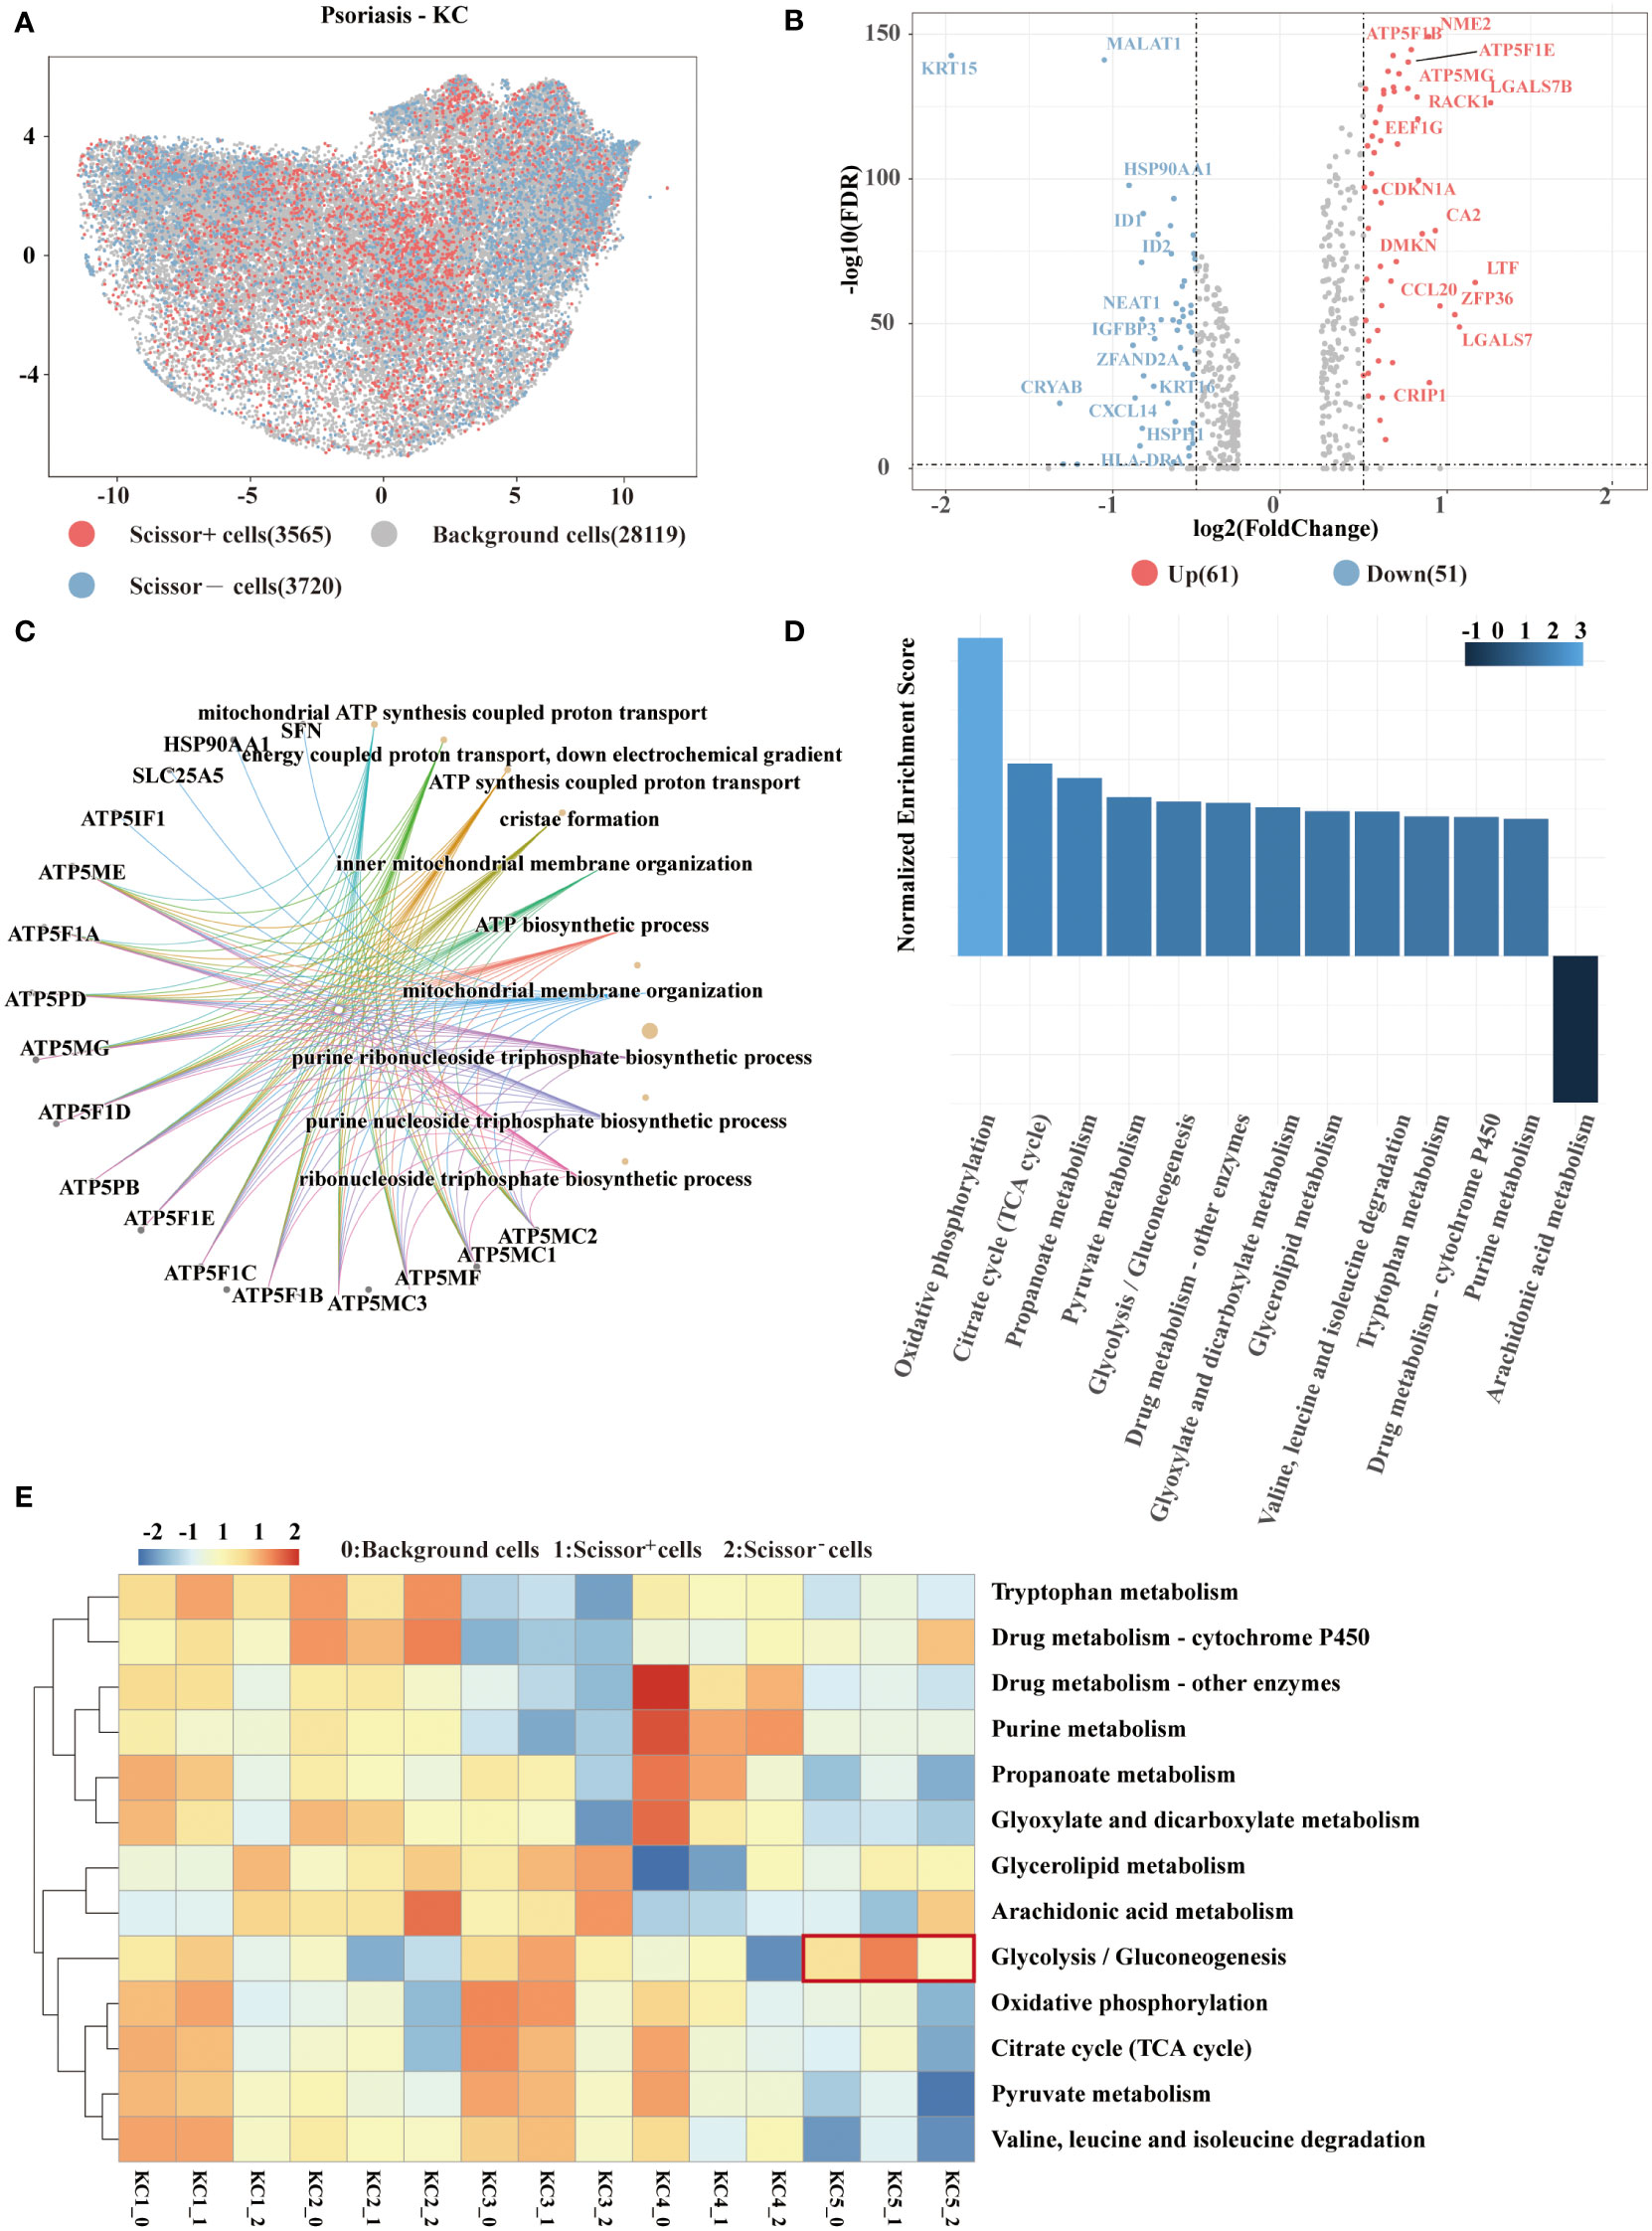
Figure 3 Scissor identification results on psoriasis keratinocytes. (A) UMAP visualization of the Scissor-selected cells. The red and blue dots show Scissor+ and Scissor− cells, representing responder and non-responder phenotypes, respectively. (B) Volcano plot of differential gene expressions in Scissor+ cells versus Scissor− cells. (C) GO enrichment analysis of differential gene expressions between Scissor+ cells and Scissor− cells. (D) GSEA plot of the up and down metabolic pathways. The adjusted P value <0.05. (E) Heat map of enriched metabolic pathways. The red and blue elements suggest the activated and repressed pathways in keratinocytes. GO, gene ontology; GSEA, Gene set enrichment analysis.
AUCell was used to calculate metabolic pathway activity in Scissor+ and Scissor− cells to evaluate their metabolic status. As shown in the heatmap (Figure 3E), the glycolysis pathway was especially intriguing in LDHA+SLC2A1+ KC. In addition, the glycolysis score of Scissor+ cells were significantly higher than that of Scissor− cells and other background cells, revealing an important role of glycolysis in response to biologic psoriasis treatment (P=0.017).
Estimation of glycolysis in keratinocytes
The glycolysis status in keratinocytes was observed. In comparison with normal samples, the glycolysis score was significantly higher in psoriasis samples in KRT5+ KRT14+ KC, KRT1+KRT10+ KC, and LDHA+SLC2A1+ KC (all P<0.001, Figure 4A). Next, combined with the above-observed specific makers of glycolysis in LDHA+SLC2A1+ KC, we suspected that glycolysis stands out.
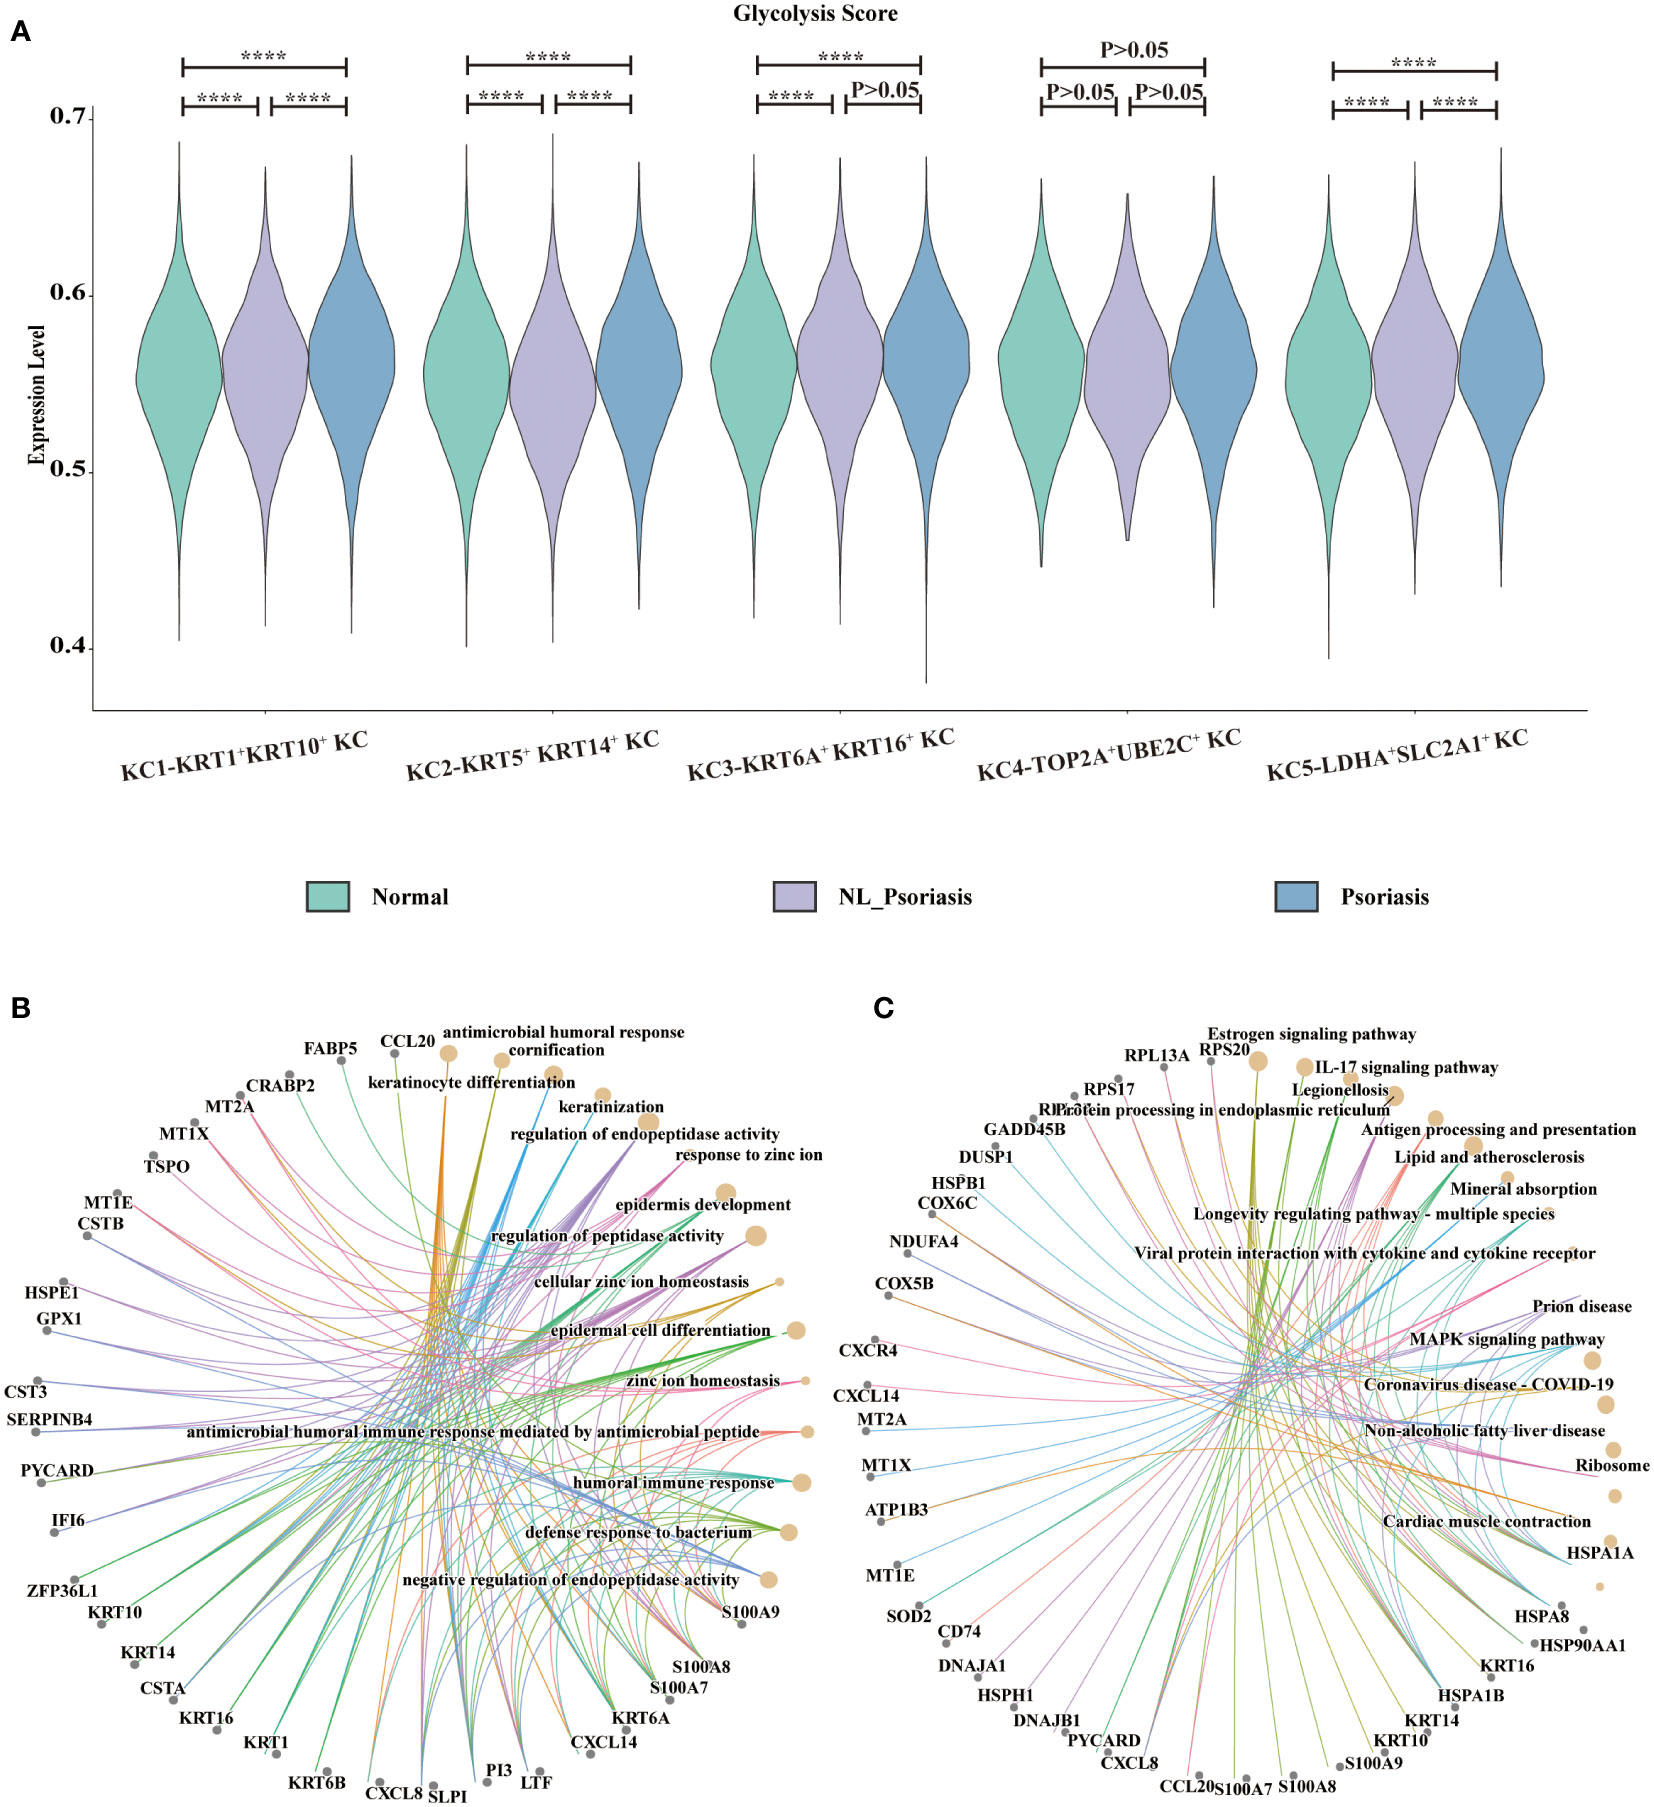
Figure 4 Glycolysis status in keratinocytes. (A) Display of glycolysis for subpopulations. Y-axis corresponds to glycolysis pathway activity. The X-axis represents KC population in normal skin, non-lesional and lesional psoriasis samples. (B, C) GO and KEGG enrichment analysis of top-100 differentially expressed genes between non-lesional phenotype and lesional phenotype. GO, gene ontology; KEGG, Kyoto Encyclopedia of Genes and Genomes ****P<0.0001.
To investigate the gene signature of lesional phenotype, differential gene expression analysis was performed between non-lesional and lesional samples. The top 100 upregulating DEGs in lesional LDHA+SLC2A1+ KC were enriched in biological processes related to keratinocyte differentiation, cornification, keratinization, and epidermis development (Figure 4B), as well as the KEGG pathway of IL-17 signaling (Figure 4C).
Pseudo−time trajectory reconstruction
To focus on glycolysis in developmental decision-making within individual cells in disease progression, we identified 12 overlapped genes (BPGM, ALDH3A2, ALDH2, ALDH3A1, HK2, LDHB, ALDH1A3, PKM, LDHA, ALDH7A1, GAPDH, and PGK1) between the DEGs and glycolysis gene set. Pseudotime trajectory analysis in a semi-supervised manner was executed. Cells from normal samples were mainly at the start of the projected timeline trajectory, while cells from non-lesional and lesional psoriasis samples were positioned in the middle and the end, respectively (Figure 5A). These results highlighted that glycolysis gene regulation coordinates trajectory of disease progression in keratinocytes.
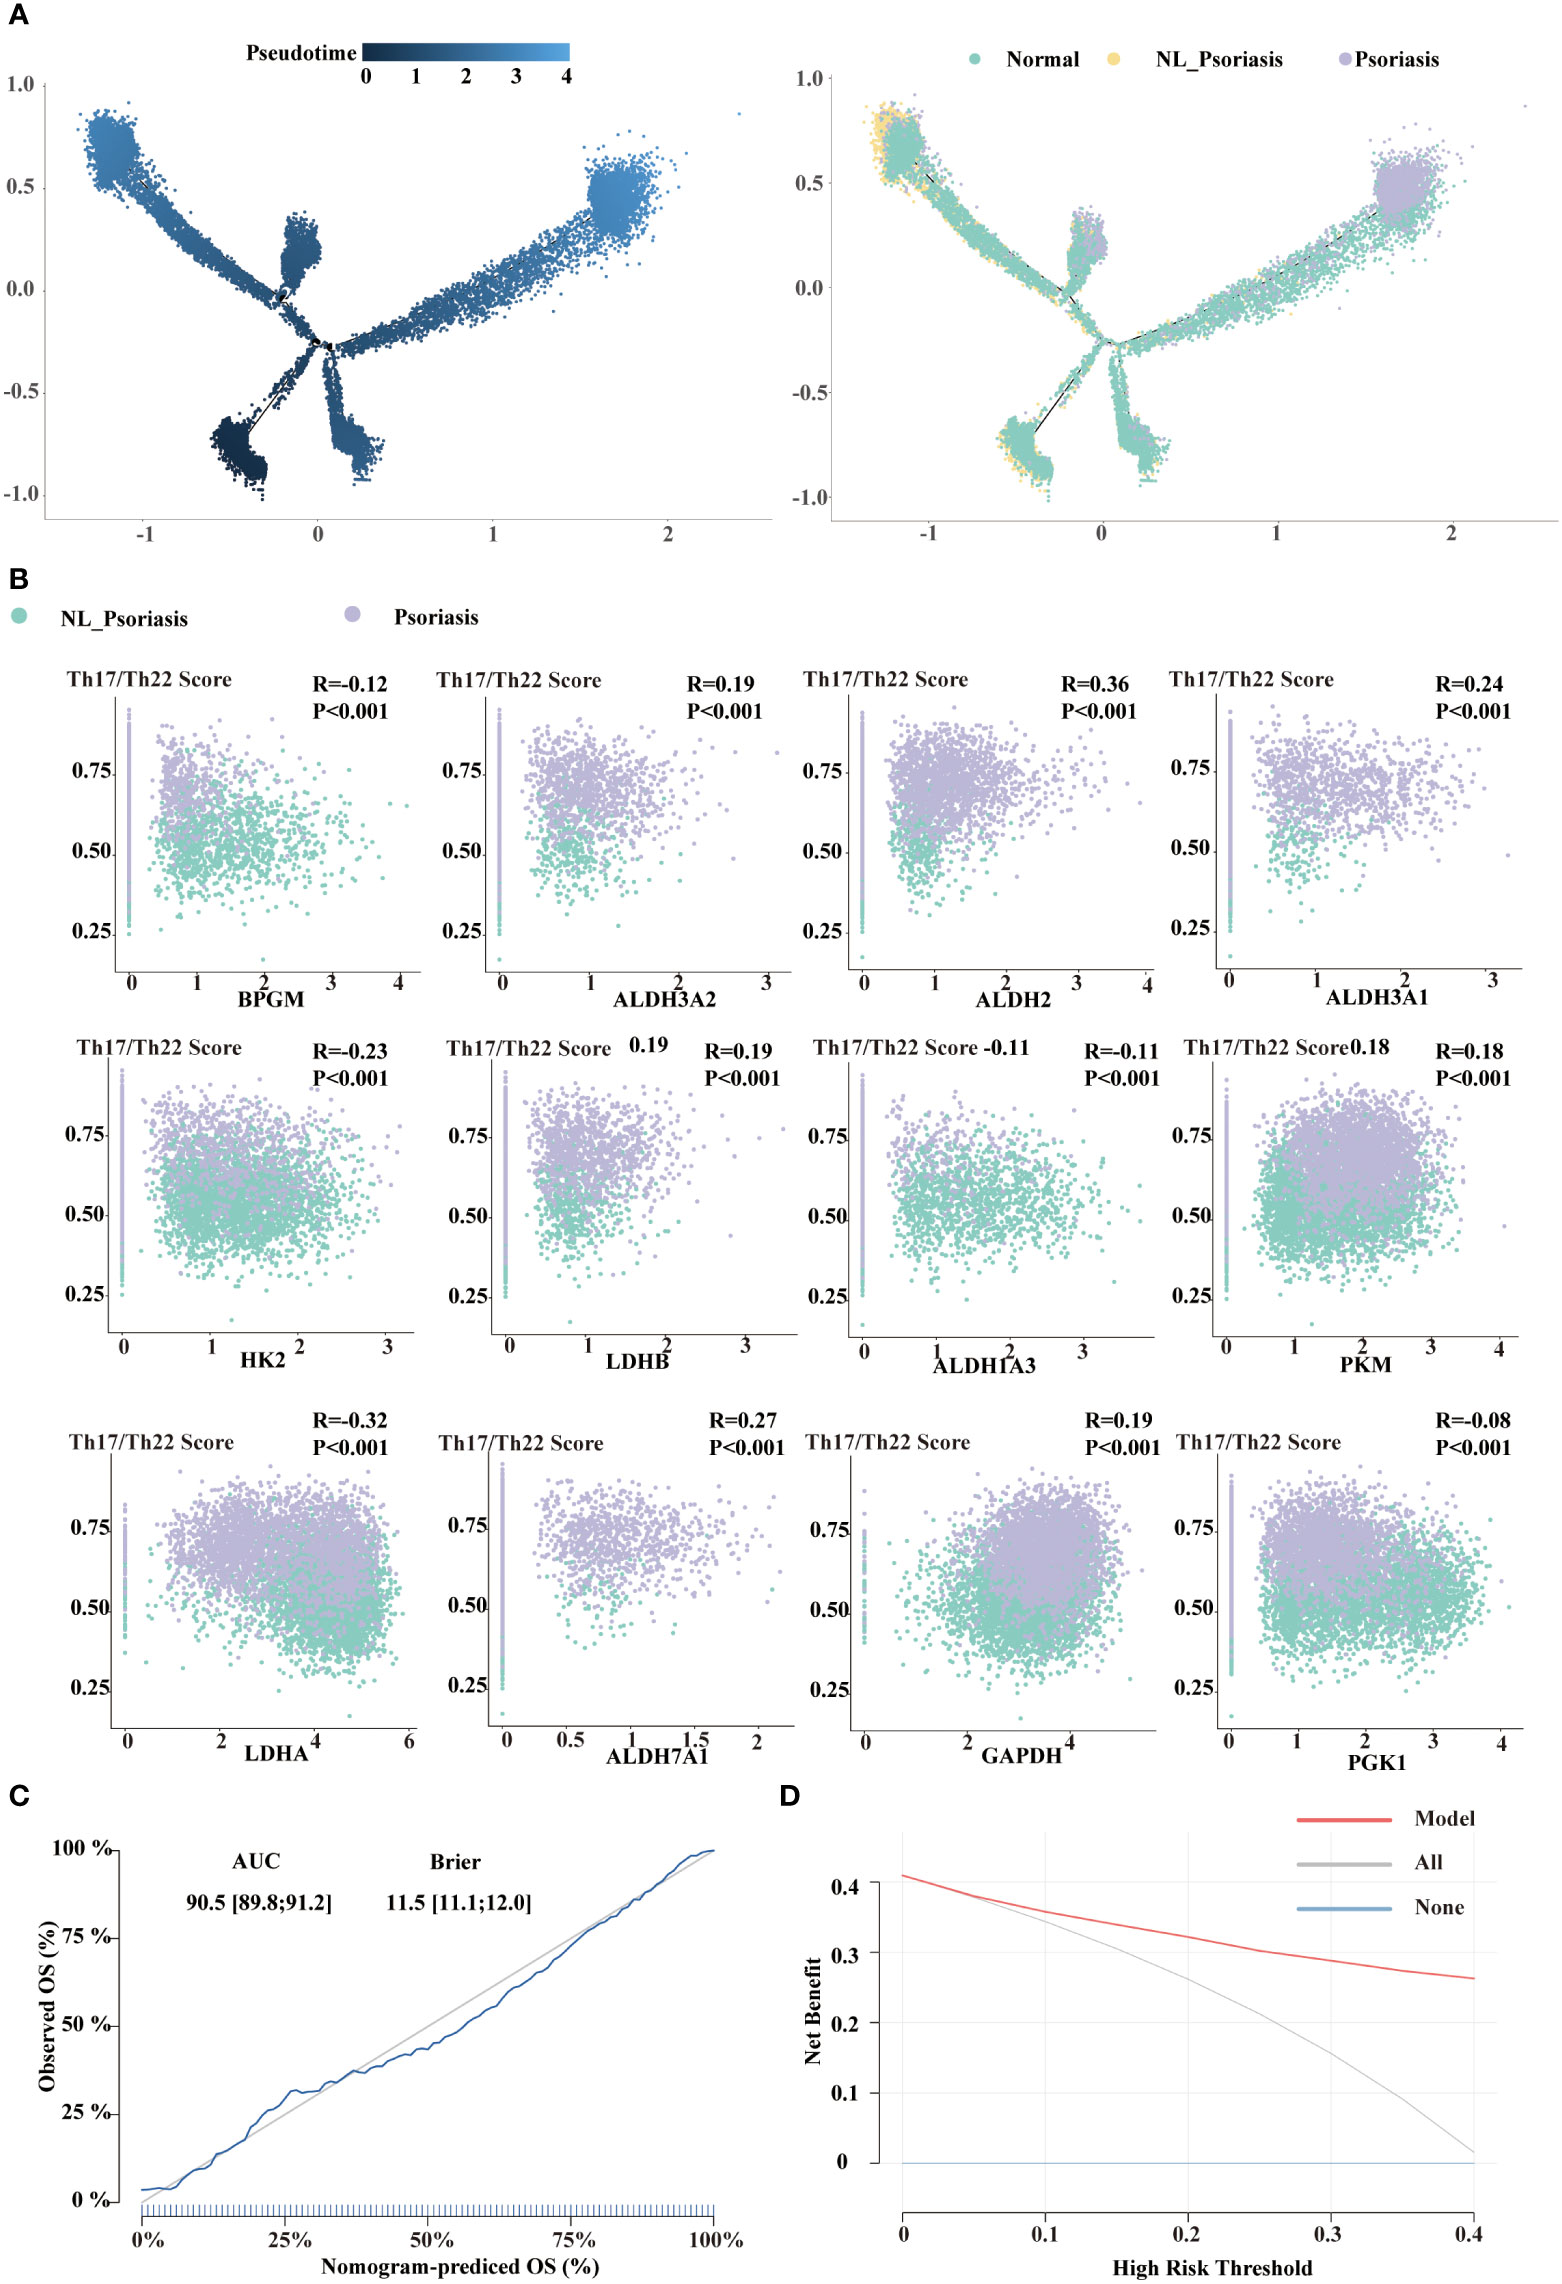
Figure 5 Construction of 12-gene signature. (A) Distribution of KC5 on the pseudo-time trajectory in a semi-supervised manner. Cells are colored based on pseudotime and tissue types. (B) The correlation between Th17/Th22 pathway activity and the selected signatures. (C) Calibration curve of the 12-gene signature model. (D) Decision Curve Analysis of the 12-gene signature model.
Correlation analysis suggested that mRNA expression of overlapped genes and Th17/Th22 score were correlated across a variety of ranges from R= -0.29 to 0.37 (all P<0.001, Figure 5B). Eight were positively associated with the lesional phenotype, whereas eight were negative with the non-lesional phenotype. This minimum set of genes indicated candidate targets for further investigation and therapy for psoriasis.
Multivariate logistic regression analysis was performed on these 12-glycolysis gene signature, and a glycolysis-related model was established. The model performed well in distinguishing between non-lesional and lesional psoriasis samples. The model had a good discrimination for distinguishing non-lesional and lesional psoriasis samples (AUC=0.905, 95%CI 0.898-0.912; BS=11.5, 95%CI 11.1-12.0). The calibration curve showed the agreement between the observed and expected numbers predicted by the model (Figure 5C). Finally, we performed decision curve analysis to assess the clinical impact of the model. As shown in Figure 5D, the decision curve suggested the clinical net benefit of the use of our glycolysis-related model if the threshold probability is over 0.05.
Glycolysis gene signature score to evaluate the clinical changes
To further examine the clinical relevance of the above signatures, we chose six independent psoriasis datasets obtained from GEO and performed score calculation using the 12 genes. In comparison to healthy and non-lesional psoriasis samples, lesional psoriasis samples has highest scores (all P<0.05, Figure 6A). Moreover, there was a progressive decline of signature scores over time during treatment, including etanercept, tofacitinib, and methotrexate (MTX) (Figure 6B).
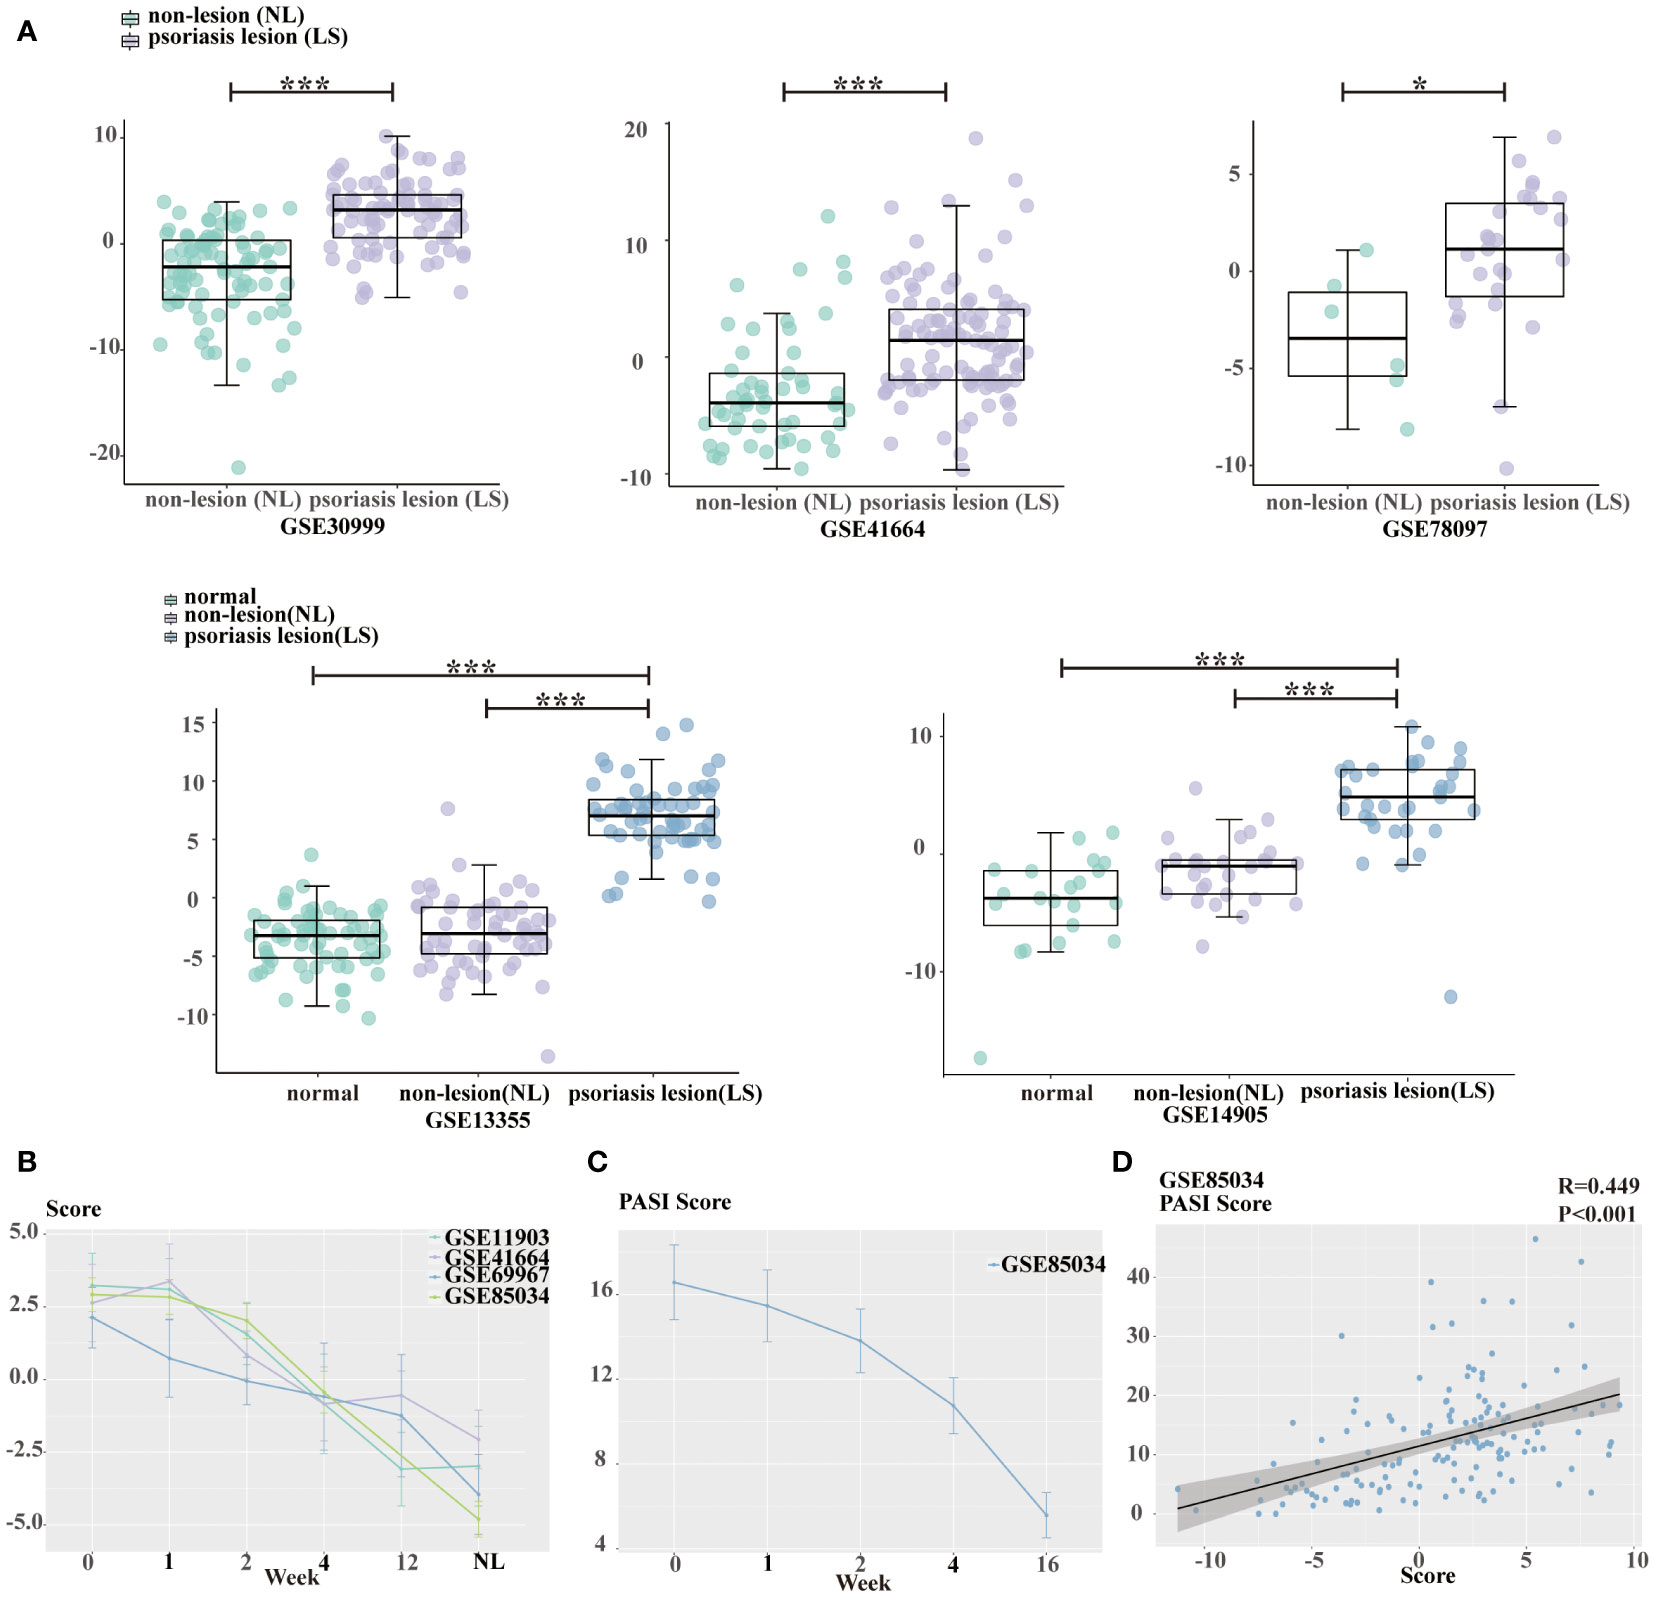
Figure 6 Estimation of glycolysis score. (A) Boxplot presenting the difference of glycolysis score among healthy skin, non-lesional psoriasis samples, and lesional psoriasis samples in GSE30999, GSE41664, GSE78097, GSE13355, and GSE14905. (B) The declining tendency of glycolysis score with treatment time in GSE11903, GSE41664, GSE69967, and GSE85034 cohorts. (C) The decreasing tendency of PASI scores with treatment time in GSE85034 cohort. (D) The correlation between glycolysis score and PASI score in GSE85034 cohort. *P<0.05, ***P<0.001.
In the dataset GSE85034, we observed a time-dependent and concomitant decrease in both signature score and PASI score (Figure 6C). Furthermore, spearman’s correlation analysis showed that PASI clinical score was positively associated with the glycolysis gene signature score (R=0.449, Figure 6D).
Glycolysis gene signature score to assess the therapeutic efficacy
Non-responders and responders differed significantly in glycolysis score from week 2 forward for patients treated with tofacitinib in the GSE69967 dataset (Figure 7A). Furthermore, the decline in glycolysis score was more pronounced in responders than in non-responders. Similar results were observed in GSE85034 dataset, which included patients receiving methotrexate or adalimumab (Figure 7B). At week16, the difference between non-responders and responders was statistically significant. Next, we sought to investigate whether glycolysis score could predict future treatment response.
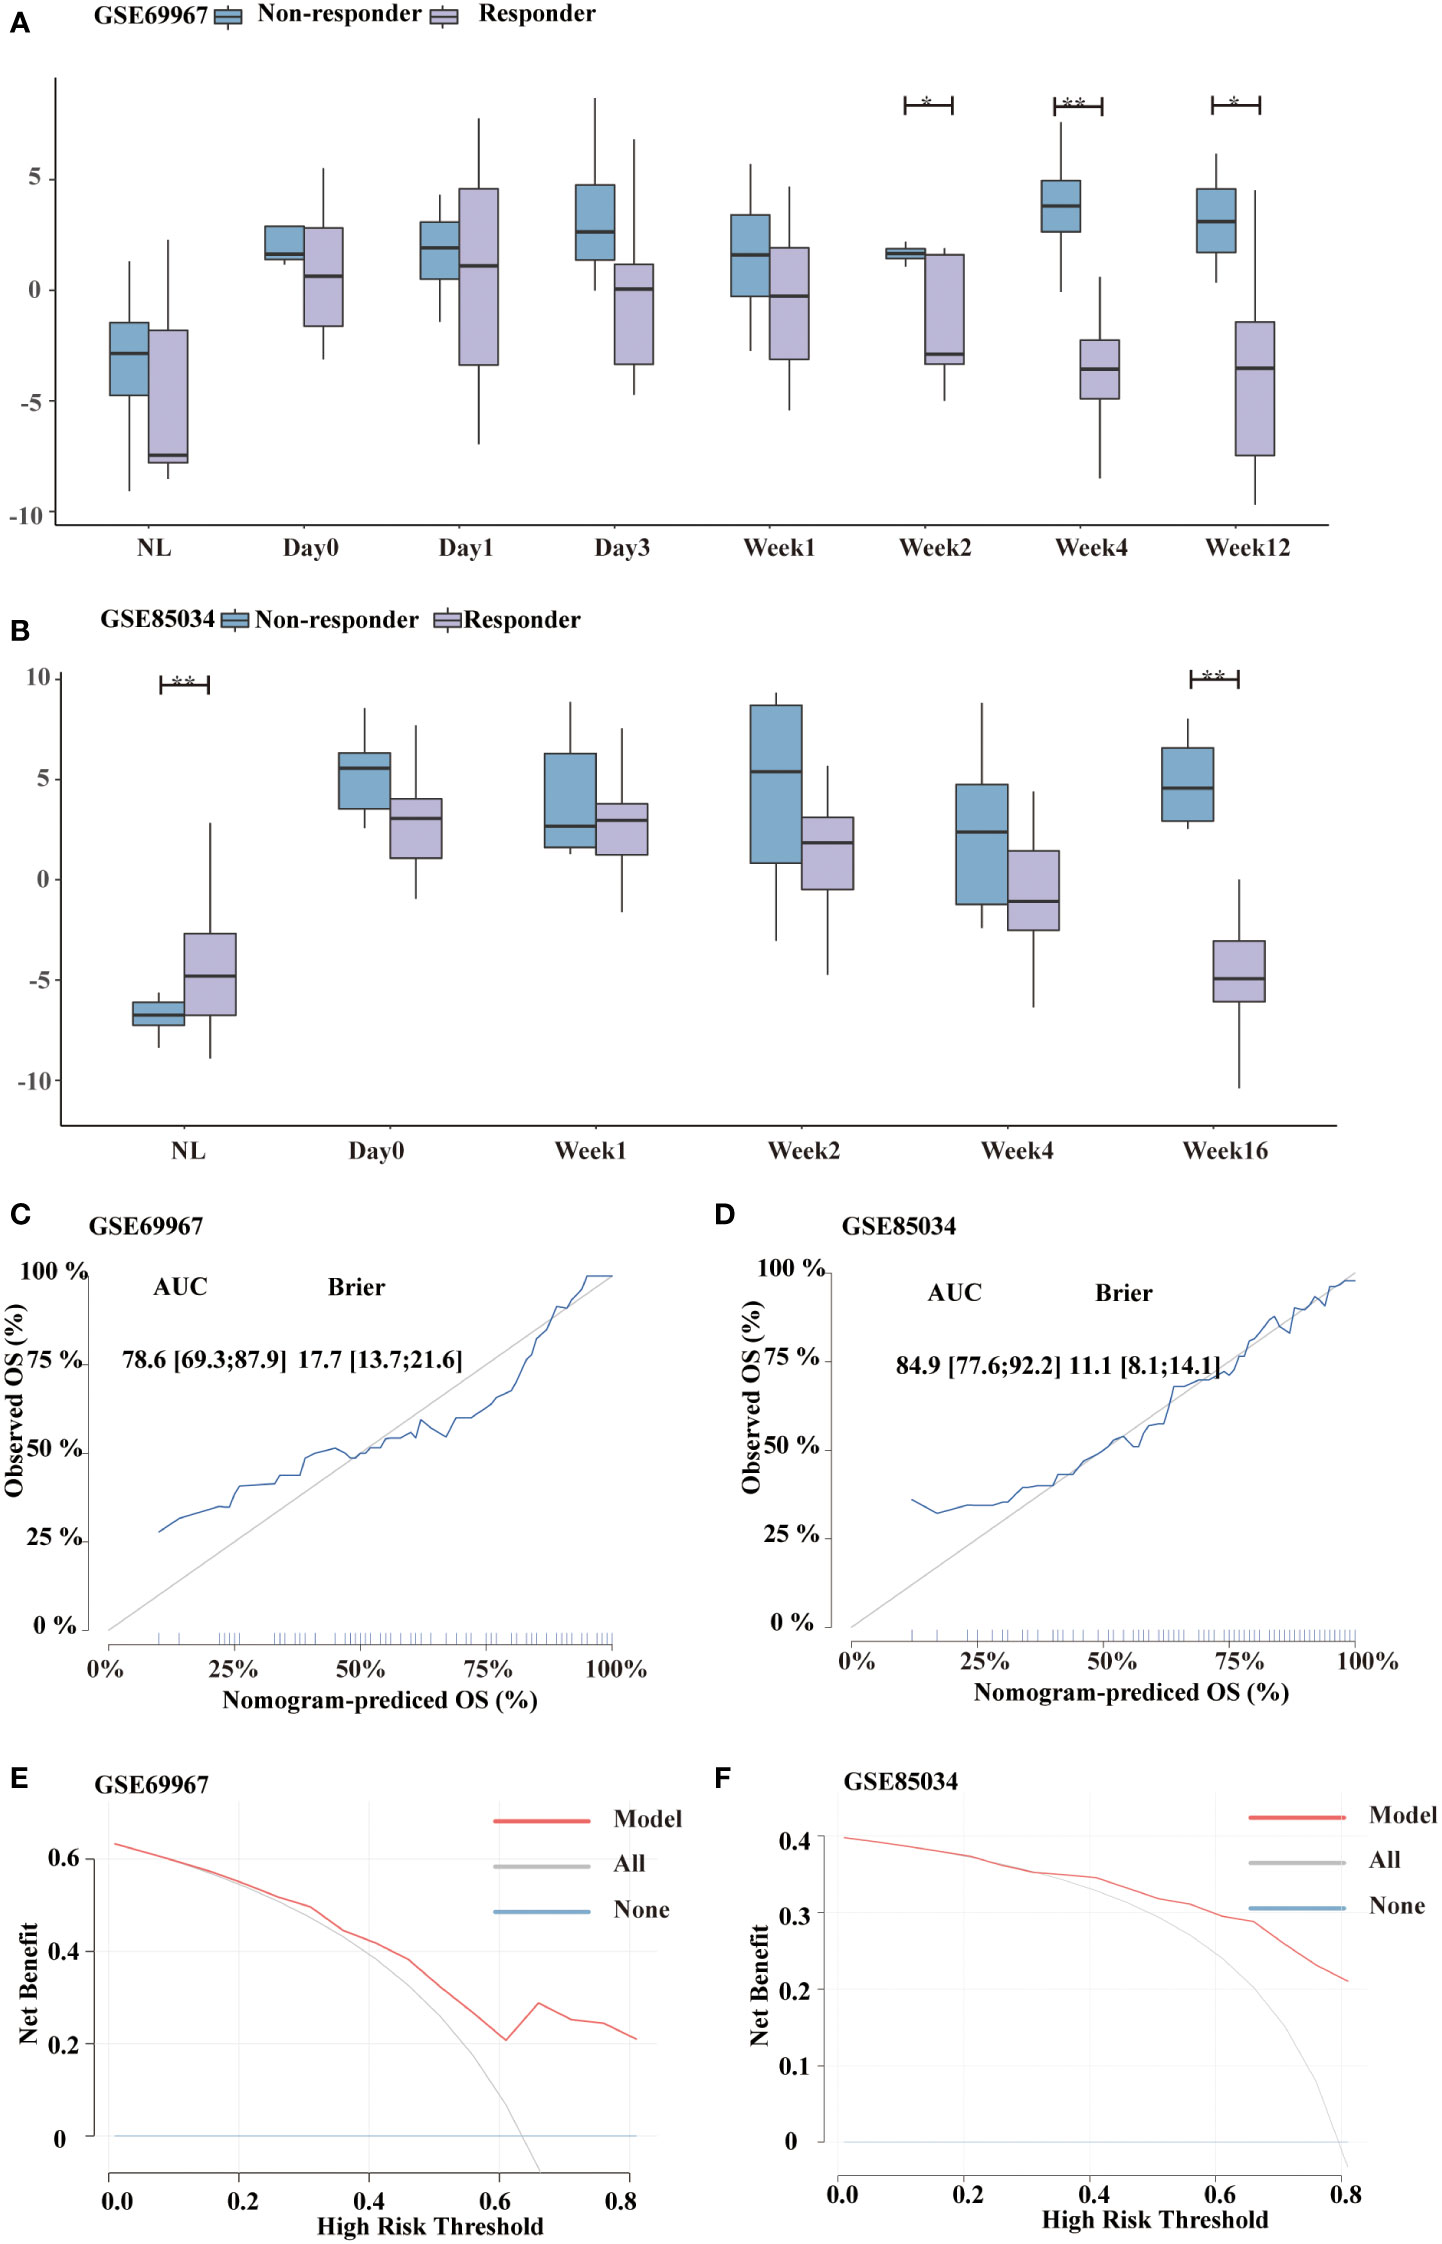
Figure 7 Distinguishment of responders and non-responders using glycolysis score. (A, B) Boxplot showing the distribution of glycolysis score between responders and non-responders in GSE69967 (patients treated with tofacitinib) and GSE85034 (patients treated with methotrexate or adalimumab) cohort, respectively. (C, D) Calibration curve of the glycolysis signature in GSE69967 and GSE85034 cohort. (E, F) Decision Curve Analysis of the glycolysis signature in GSE69967 and GSE85034 cohort. *P<0.05, **P<0.01.
To differentiate the non-responders and responders, calibration curve analyses showed the diagnostic accuracy as follows: GSE69967 (AUC=0.786, 95%CI 0.693-0.879; BS=17.7, 95%CI 13.7-21.6, Figure 7C) and GSE85034 (AUC=0.849, 95%CI 0.776-0.922; BS=11.1, 95%CI 8.1-14.1, Figure 7D), showing that this model is still valid. In addition, we validated the clinical practicability using DCA (Figures 7E, F). These findings demonstrated the net benefit of the glycolysis model.
Discussion
As glucose is a preferred bioenergetic substrate for proliferating cells, glucose uptake and utilization are essential in the pathogenesis of psoriasis. Based on the single-cell profiles of psoriasis, we report for the first-time status of intracellular glycolysis in a specific population of keratinocytes and identified a 12-gene prediction model. The validation of the model paved the way for distinguishing different tissues, classifying responders and non-responders, and predicting the effectiveness of therapy.
In our study, the expression of SCL2A1 and LDH1 was used to define a population of glycolysis-related keratinocytes. SLC2A1, one of the glucose transporters, is overexpressed in proliferating inflammatory cells and keratinocytes. In several models, SLC2A1 deletion attenuates inflammatory infiltration (30, 31). According to recent reports, SLC2A1 plays role in UV-irradiated mouse skin (32), during wound healing responses (33), and in psoriasis (10). LDH1 inhibition has been shown to reduce the damaging inflammatory contributions in rheumatoid arthritis and osteoarthritis (34, 35). In addition to expressing SCL2A1 and LDH1, LDHA+SLC2A1+ KC exhibited high levels of S100A2, IGFBP3, and SERPINB2, denoting inflammatory conditions in these keratinocytes.
Several methods have been proposed to identify disease-relevant cells from single-cell data, which helps to understand the pathogenic mechanisms. HoneyBadger (36) was carried out to recognize cancerous cells. Scissor was developed for discerning phenotype-specific cell subpopulations using phenotype information from bulk data (37). In our research, we introduce treatment response as a phenotype to infer phenotype-relevant cells from single-cell data. ATP production performed particularly specific in Scissor+ cells, and oxidative phosphorylation, TCA cycle, propanoate metabolism, pyruvate metabolism, and glycolysis were also enriched. In psoriasis, ATP synthesis demand may be a hallmark of therapy-responding keratinocytes.
Most of these enrichment patterns of DEGs were consistent with previous studies, including epidermal cell differentiation and the IL-17 signaling pathway. The results outlined here demonstrated changes in mRNA gene expression pointing to the progression of psoriasis. Furthermore, an upward trend of glycolysis was observed from healthy samples to lesional psoriasis samples in keratinocytes. These results indicated a significant global shift in glycolysis score from normal to psoriasis and the altered glycolysis level might play an essential role during psoriasis initiation and progression.
A total of 12 common transcriptome signature were defined. Note that not only the current signature is relevant for Th17/Th22 pathway activity, but also involved in the classification in the multivariable model. Furthermore, monocle can be performed to define and recover biological progression between cellular states, including differentiation, proliferation, and reprogramming (29). Using a semi-supervised algorithm based on these 12 genes, a branch of healthy cells was separated from a two-phase keratinocyte differentiation trajectory. Taken together, pseudotime trajectory analysis reveals the significance of glycolysis in disease progression.
Skin samples from psoriatic patients witness significant metabolic reprogramming, which is closely linked to phenotypic variation and progression. According to studies based on metabolomics, metabolites such as choline, glutamic acid, lactic acid, urocanic acid, and saturated fatty acids have been identified as psoriasis biomarkers (38, 39). The levels of amino acids were also associated with the severity of psoriasis and the effects of anti-TNFα treatment (40). Notedly, the glycolysis pathway in our research appeared to be more intrigued and performed especially higher level in Scissor+ cells than other cells. As a result, the metabolic shift reflects not only the pathologies of the disease but also the therapeutic response.
Here, different responses to diverse therapies were observed, including etanercept, tofacitinib, and MTX. We observed a decreasing glycolysis score over time, indicating that the glycolysis score can be viewed as an evaluation approach. Rather than being used as a predictive index, the glycolysis score can help discriminate between responders and non-responders. After receiving therapy with tofacitinib or MTX, responders had a greater decrease in glycolysis scores and a more favorable therapeutic profile. The glycolysis score assists in determining whether psoriasis patients are receptive to treatment, hence avoiding potential side effects and lowering expenditures. Our research sheds new insight on the utilization of an individual’s molecular data to create a customized treatment.
There are some limitations. Although we present a comprehensive transcriptome profile of glycolysis level analysis and identified significant genes, all our findings were based on public data sets and lacked some validation by experiments. Second, the biases from the retrospective studies might be inevitable, but we validated the results in several databases and demonstrated the reliability to a certain extent. Third, we have restricted our study to keratinocyte glycolysis. Hexokinase activity in dendritic cells has been linked to IL-23 and psoriasis-like inflammatory responses (41). It is imperative to conduct further research to investigate whether other cell types, particularly immune cells, exhibit altered glycolysis status.
We demonstrated characteristic changes in the glycolysis level in psoriasis across all available single-cell data, implying glycolysis status may be associated with disease severity and therapeutic response. Furthermore, we investigated specific glycolytic markers and validated their diagnostic and prognostic efficacy in the five cohorts. Glycolysis score used for prediction of treatment outcome may further benefit psoriasis populations.
Data availability statement
The original contributions presented in the study are included in the article/Supplementary Material. Further inquiries can be directed to the corresponding author/s.
Author contributions
Data curation and Formal Analysis, YS and RZ; Supervision, ZT; Writing – original draft, YS; Supervision and Writing – review & editing, X-YM. All authors contributed to the article and approved the submitted version.
Funding
This research is supported by grants from the National Natural Science Foundation of China (Nos. 81930089, 82103709, and 82230104).
Conflict of interest
The authors declare that the research was conducted in the absence of any commercial or financial relationships that could be construed as a potential conflict of interest.
Publisher’s note
All claims expressed in this article are solely those of the authors and do not necessarily represent those of their affiliated organizations, or those of the publisher, the editors and the reviewers. Any product that may be evaluated in this article, or claim that may be made by its manufacturer, is not guaranteed or endorsed by the publisher.
Supplementary material
The Supplementary Material for this article can be found online at: https://www.frontiersin.org/articles/10.3389/fimmu.2023.1188745/full#supplementary-material
Supplementary Figure 1 | (A) Dot plot displaying the specific marker genes selected to classify subpopulations. (B) Plot of the proportion of cells in different subpopulations from normal, non-lesional psoriasis samples, and lesional psoriasis samples.
Abbreviations
PASI, Psoriasis Area and Severity Index; GLUT1, glucose transporter 1; bulk RNA-seq, bulk RNA sequencing; scRNA-seq, single-cell RNA sequencing; GEO, Gene Expression Omnibus; EGA, Genome-phenome Archive; UMIs, unique molecular identifiers; UMAP, Uniform Manifold Approximation and Projection; KEGG, Kyoto Encyclopedia of Genes and Genomes; DEGs, differentially expressed genes; ROC, Receiver Operating Characteristic Curve; AUC, the Area Under the Curve; KCs, keratinocytes; MAC/DC, macrophages/dendritic cells; FIB, fibroblasts; EC, endothelial cells; MELAN, melanocytes; MTX, methotrexate; BS, Brier score.
References
1. Parisi R, Iskandar IYK, Kontopantelis E, Augustin M, Griffiths CEM, Ashcroft DM. National, regional, and worldwide epidemiology of psoriasis: systematic analysis and modelling study. Bmj (2020) 369:m1590. doi: 10.1136/bmj.m1590
2. Armstrong AW, Read C. Pathophysiology, clinical presentation, and treatment of psoriasis: a review. Jama (2020) 323(19):1945–60. doi: 10.1001/jama.2020.4006
3. Cibrian D, de la Fuente H, Sánchez-Madrid F. Metabolic pathways that control skin homeostasis and inflammation. Trends Mol Med (2020) 26(11):975–86. doi: 10.1016/j.molmed.2020.04.004
4. Koppenol WH, Bounds PL, Dang CV. Otto Warburg's contributions to current concepts of cancer metabolism. Nat Rev Cancer (2011) 11(5):325–37. doi: 10.1038/nrc3038
5. Vander Heiden MG, Cantley LC, Thompson CB. Understanding the warburg effect: the metabolic requirements of cell proliferation. Science (2009) 324(5930):1029–33. doi: 10.1126/science.1160809
6. Lunt SY, Vander Heiden MG. Aerobic glycolysis: meeting the metabolic requirements of cell proliferation. Annu Rev Cell Dev Biol (2011) 27:441–64. doi: 10.1146/annurev-cellbio-092910-154237
7. Curtis M, Kenny HA, Ashcroft B, Mukherjee A, Johnson A, Zhang Y, et al. Fibroblasts mobilize tumor cell glycogen to promote proliferation and metastasis. Cell Metab (2019) 29(1):141–55.e9. doi: 10.1016/j.cmet.2018.08.007
8. Lowes MA, Bowcock AM, Krueger JG. Pathogenesis and therapy of psoriasis. Nature (2007) 445(7130):866–73. doi: 10.1038/nature05663
9. Zhang Z, Zi Z, Lee EE, Zhao J, Contreras DC, South AP, et al. Differential glucose requirement in skin homeostasis and injury identifies a therapeutic target for psoriasis. Nat Med (2018) 24(5):617–27. doi: 10.1038/s41591-018-0003-0
10. Hodeib AA, Neinaa YME, Zakaria SS, Alshenawy HA. Glucose transporter-1 (GLUT-1) expression in psoriasis: correlation with disease severity. Int J Dermatol (2018) 57(8):943–51. doi: 10.1111/ijd.14037
11. Reynolds G, Vegh P, Fletcher J, Poyner EFM, Stephenson E, Goh I, et al. Developmental cell programs are co-opted in inflammatory skin disease. Science (2021) 371(6527). doi: 10.1126/science.aba6500
12. Hughes TK, Wadsworth MH 2nd, Gierahn TM, Do T, Weiss D, Andrade PR, et al. Second-strand synthesis-based massively parallel scRNA-seq reveals cellular states and molecular features of human inflammatory skin pathologies. Immunity (2020) 53(4):878–94.e7. doi: 10.1016/j.immuni.2020.09.015
13. Cheng JB, Sedgewick AJ, Finnegan AI, Harirchian P, Lee J, Kwon S, et al. Transcriptional programming of normal and inflamed human epidermis at single-cell resolution. Cell Rep (2018) 25(4):871–83. doi: 10.1016/j.celrep.2018.09.006
14. Suárez-Fariñas M, Li K, Fuentes-Duculan J, Hayden K, Brodmerkel C, Krueger JG. Expanding the psoriasis disease profile: interrogation of the skin and serum of patients with moderate-to-severe psoriasis. J Invest Dermatol (2012) 132(11):2552–64. doi: 10.1038/jid.2012.184
15. Bigler J, Rand HA, Kerkof K, Timour M, Russell CB. Cross-study homogeneity of psoriasis gene expression in skin across a large expression range. PloS One (2013) 8(1):e52242. doi: 10.1371/journal.pone.0052242
16. Kim J, Bissonnette R, Lee J, Correa da Rosa J, Suárez-Fariñas M, Lowes MA, et al. The spectrum of mild to severe psoriasis vulgaris is defined by a common activation of IL-17 pathway genes, but with key differences in immune regulatory genes. J Invest Dermatol (2016) 136(11):2173–82. doi: 10.1016/j.jid.2016.04.032
17. Nair RP, Duffin KC, Helms C, Ding J, Stuart PE, Goldgar D, et al. Genome-wide scan reveals association of psoriasis with IL-23 and NF-kappaB pathways. Nat Genet (2009) 41(2):199–204. doi: 10.1038/ng.311
18. Yao Y, Richman L, Morehouse C, de los Reyes M, Higgs BW, Boutrin A, et al. Type I interferon: potential therapeutic target for psoriasis? PloS One (2008) 3(7):e2737. doi: 10.1371/journal.pone.0002737
19. Krueger J, Clark JD, Suárez-Fariñas M, Fuentes-Duculan J, Cueto I, Wang CQ, et al. Tofacitinib attenuates pathologic immune pathways in patients with psoriasis: a randomized phase 2 study. J Allergy Clin Immunol (2016) 137(4):1079–90. doi: 10.1016/j.jaci.2015.12.1318
20. Zaba LC, Suárez-Fariñas M, Fuentes-Duculan J, Nograles KE, Guttman-Yassky E, Cardinale I, et al. Effective treatment of psoriasis with etanercept is linked to suppression of IL-17 signaling, not immediate response TNF genes. J Allergy Clin Immunol (2009) 124(5):1022–10.e1-395. doi: 10.1016/j.jaci.2009.08.046
21. Correa da Rosa J, Kim J, Tian S, Tomalin LE, Krueger JG, Suárez-Fariñas M. Shrinking the psoriasis assessment gap: early gene-expression profiling accurately predicts response to long-term treatment. J Invest Dermatol (2017) 137(2):305–12. doi: 10.1016/j.jid.2016.09.015
22. McGinnis CS, Murrow LM, Gartner ZJ. DoubletFinder: doublet detection in single-cell RNA sequencing data using artificial nearest neighbors. Cell Syst (2019) 8(4):329–37.e4. doi: 10.1016/j.cels.2019.03.003
23. Korsunsky I, Millard N, Fan J, Slowikowski K, Zhang F, Wei K, et al. Fast, sensitive and accurate integration of single-cell data with harmony. Nat Methods (2019) 16(12):1289–96. doi: 10.1038/s41592-019-0619-0
24. Becht E, McInnes L, Healy J, Dutertre CA, Kwok IWH, Ng LG, et al. Dimensionality reduction for visualizing single-cell data using UMAP. Nat Biotechnol (2018) 37(1):38–44 doi: 10.1038/nbt.4314
25. Sun D, Guan X, Moran AE, Wu L-Y, Qian DZ, Schedin P, et al. Identifying phenotype-associated subpopulations by integrating bulk and single-cell sequencing data. Nat Biotechnol (2022) 40(4):527–38. doi: 10.1038/s41587-021-01091-3
26. Aibar S, González-Blas CB, Moerman T, Huynh-Thu VA, Imrichova H, Hulselmans G, et al. SCENIC: single-cell regulatory network inference and clustering. Nat Methods (2017) 14(11):1083–6. doi: 10.1038/nmeth.4463
27. Yu G, Wang LG, Han Y, He QY. clusterProfiler: an r package for comparing biological themes among gene clusters. Omics (2012) 16(5):284–7. doi: 10.1089/omi.2011.0118
28. Sergushichev AA. An algorithm for fast preranked gene set enrichment analysis using cumulative statistic calculation. bioRxiv (2016):060012. doi: 10.1101/060012
29. Trapnell C, Cacchiarelli D, Grimsby J, Pokharel P, Li S, Morse M, et al. The dynamics and regulators of cell fate decisions are revealed by pseudotemporal ordering of single cells. Nat Biotechnol (2014) 32(4):381–6. doi: 10.1038/nbt.2859
30. Wang L, Pavlou S, Du X, Bhuckory M, Xu H, Chen M. Glucose transporter 1 critically controls microglial activation through facilitating glycolysis. Mol Neurodegener (2019) 14(1):2. doi: 10.1186/s13024-019-0305-9
31. Freemerman AJ, Johnson AR, Sacks GN, Milner JJ, Kirk EL, Troester MA, et al. Metabolic reprogramming of macrophages: glucose transporter 1 (GLUT1)-mediated glucose metabolism drives a proinflammatory phenotype. J Biol Chem (2014) 289(11):7884–96. doi: 10.1074/jbc.M113.522037
32. Tochio T, Tanaka H, Nakata S. Glucose transporter member 1 is involved in UVB-induced epidermal hyperplasia by enhancing proliferation in epidermal keratinocytes. Int J Dermatol (2013) 52(3):300–8. doi: 10.1111/j.1365-4632.2011.05299.x
33. Elson DA, Ryan HE, Snow JW, Johnson R, Arbeit JM. Coordinate up-regulation of hypoxia inducible factor (HIF)-1alpha and HIF-1 target genes during multi-stage epidermal carcinogenesis and wound healing. Cancer Res (2000) 60(21):6189–95.
34. Souto-Carneiro M, Klika K, Abreu MT, Meyer A, Saffrich R, Sandhoff R, et al. Proinflammatory profile of autoimmune CD8 + T cells relies on increased LDHA activity and aerobic glycolysis. Arthritis Rheumatol (2020) 72(12):2050–64. doi: 10.1002/art.41420
35. Arra M, Swarnkar G, Ke K, Otero JE, Ying J, Duan X, et al. LDHA-mediated ROS generation in chondrocytes is a potential therapeutic target for osteoarthritis. Nat Commun (2020) 11(1):3427. doi: 10.1038/s41467-020-17242-0
36. Fan J, Lee HO, Lee S, Ryu DE, Lee S, Xue C, et al. Linking transcriptional and genetic tumor heterogeneity through allele analysis of single-cell RNA-seq data. Genome Res (2018) 28(8):1217–27. doi: 10.1101/gr.228080.117
37. Sun D, Guan X, Moran AE, Wu L-Y, Qian DZ, Schedin P, et al. Identifying phenotype-associated subpopulations by integrating bulk and single-cell sequencing data. Nat Biotechnol (2021) 40(4):527–38. doi: 10.1038/s41587-021-01091-3
38. Dutkiewicz EP, Hsieh KT, Wang YS, Chiu HY, Urban PL. Hydrogel micropatch and mass spectrometry-assisted screening for psoriasis-related skin metabolites. Clin Chem (2016) 62(8):1120–8. doi: 10.1373/clinchem.2016.256396
39. Herbert D, Franz S, Popkova Y, Anderegg U, Schiller J, Schwede K, et al. High-fat diet exacerbates early psoriatic skin inflammation independent of obesity: saturated fatty acids as key players. J Invest Dermatol (2018) 138(9):1999–2009. doi: 10.1016/j.jid.2018.03.1522
40. Kamleh MA, Snowden SG, Grapov D, Blackburn GJ, Watson DG, Xu N, et al. LC-MS metabolomics of psoriasis patients reveals disease severity-dependent increases in circulating amino acids that are ameliorated by anti-TNFα treatment. J Proteome Res (2015) 14(1):557–66. doi: 10.1021/pr500782g
Keywords: single-cell RNA seq, psoriasis, glycolysis, molecular signature, therapeutic effects
Citation: Shou Y, Zhu R, Tang Z and Man X-Y (2023) A prediction model identifying glycolysis signature as therapeutic target for psoriasis. Front. Immunol. 14:1188745. doi: 10.3389/fimmu.2023.1188745
Received: 17 March 2023; Accepted: 20 April 2023;
Published: 02 May 2023.
Edited by:
Zhongjian Chen, Shanghai Skin Disease Hospital, ChinaReviewed by:
Yuling Shi, Shanghai Tenth People’s Hospital, Tongji University, ChinaMartin P. Alphonse, Johns Hopkins Medicine, United States
Copyright © 2023 Shou, Zhu, Tang and Man. This is an open-access article distributed under the terms of the Creative Commons Attribution License (CC BY). The use, distribution or reproduction in other forums is permitted, provided the original author(s) and the copyright owner(s) are credited and that the original publication in this journal is cited, in accordance with accepted academic practice. No use, distribution or reproduction is permitted which does not comply with these terms.
*Correspondence: Xiao-Yong Man, bWFueHlAemp1LmVkdS5jbg==
†These authors have contributed equally to this work