 Qi Shu
 Han She
 Xi Chen3
 Like Zhong
 Junfeng Zhu
 Luo Fang
95% of researchers rate our articles as excellent or good
Learn more about the work of our research integrity team to safeguard the quality of each article we publish.
Find out more
ORIGINAL RESEARCH article
Front. Immunol. , 09 May 2023
Sec. Inflammation
Volume 14 - 2023 | https://doi.org/10.3389/fimmu.2023.1184126
This article is part of the Research Topic Multiple organ dysfunctions in perioperative critical illness and the prognosis after anesthesia View all 23 articles
Background: Sepsis remains a complex condition with incomplete understanding of its pathogenesis. Further research is needed to identify prognostic factors, risk stratification tools, and effective diagnostic and therapeutic targets.
Methods: Three GEO datasets (GSE54514, GSE65682, and GSE95233) were used to explore the potential role of mitochondria-related genes (MiRGs) in sepsis. WGCNA and two machine learning algorithms (RF and LASSO) were used to identify the feature of MiRGs. Consensus clustering was subsequently carried out to determine the molecular subtypes for sepsis. CIBERSORT algorithm was conducted to assess the immune cell infiltration of samples. A nomogram was also established to evaluate the diagnostic ability of feature biomarkers via “rms” package.
Results: Three different expressed MiRGs (DE-MiRGs) were identified as sepsis biomarkers. A significant difference in the immune microenvironment landscape was observed between healthy controls and sepsis patients. Among the DE-MiRGs, NDUFB3 was selected to be a potential therapeutic target and its significant elevated expression level was confirmed in sepsis using in vitro experiments and confocal microscopy, indicating its significant contribution to the mitochondrial quality imbalance in the LPS-simulated sepsis model.
Conclusion: By digging the role of these pivotal genes in immune cell infiltration, we gained a better understanding of the molecular immune mechanism in sepsis and identified potential intervention and treatment strategies.
Sepsis is a fatal syndrome resulting from multiple organ failure caused by an inappropriate host response to infection. Despite a significant decline in sepsis mortality due to improvements in life support techniques, long-term ICU stays remain on the rise, resulting in a significant socioeconomic burden (1, 2). Despite significant advances in diagnosis and treatment, the incidence of sepsis continues to increase due to an incomplete understanding of the pathogenesis due to individual heterogeneity and the complexity of the infection (3). At the same time, there are few studies on the factors related to long-term mortality in patients with sepsis, and risk stratification is unclear (4, 5). Therefore, there is a need to further search for prognostic factors, more accurate risk stratification for sepsis, and more sensitive and specific diagnostic and therapeutic targets.
In recent years, the role of mitochondria beyond energy supply has received increasing attention. Danger signals actively secreted or passively released by dead or damaged cells are known as damage-related molecular patterns (DAMPs). DAMPs activate the immune system by activating classical pattern recognition receptors (PRRS)or non-PRR pathways, including ion channels and G-protein-coupled receptors (6). ATP, the main form of energy produced by mitochondria, is a DAMP. Damage-induced release of mitochondria and their contents can increase local ATP levels, thereby enhancing the killing effect of macrophages in sepsis through P2X7 and P2X4 receptors (7, 8). In addition to ATP, various components of mitochondria can be used as DAMPs, including transfactor A, cytochrome c, succinate, mitochondrial (TFAM), cardiolipin, and mtRNA (9). These mitochondrial damage-associated molecular patterns (mtDAMPs) can be stimulated by lipopolysaccharide secretion by monocytes in extracellular vesicles (10). mtDAMP released into circulation is recognized by the immune system and drives an inflammatory response (11). Additonally, during sepsis process, mitochondrial stress leads to mitochondrial membrane potential decreases, resulting in impaired membrane integrity (12). This mitochondrial damage causes mitochondrial DNA (mtDNA) leaking into the cytoplasm and acting as a key DAMP. By affecting the respiratory chain, enhancing oxidative stress and inflammatory response, inducing cell apoptosis, mitochondrial damage leads to cell dysfunction and tissue damage, and further aggravates mitochondrial dysfunction, thus forming a feedback loop (13).
Uncontrolled inflammation following severe trauma is often one of the key factors leading to organ damage and poor prognosis. An increasing number of reports have hinted at the important roles of mtDNA and mtDAMP in sepsis (14). mtDAMPs can induce a strong inflammatory response and septicaemia - like symptoms. mtDAMPs are present in trauma patients. Animals treated with mtDAMP showed an exaggerated inflammatory response triggered by mtDAMP (14). Traumatized patients had higher plasma mtDNA levels (15, 16) than healthy subjects. Moreover, mtDNA levels were closely associated with post-injury complications (17). Plasma levels of circulating mtDNA were significantly higher in patients with severe sepsis/septic shock than in patients with postoperative inflammation or trauma (18, 19). Thus, the plasma concentration of mtDNA was considered to be an independent predictor of post-traumatic SIRS (20). mtDNA may be better than lactate concentration or even SOFA score in predicting mortality after admission in sepsis patients (21). Further studies of both mtDNA and mtDAMPs in sepsis will greatly improve our understanding of sepsis pathogenesis.
In this study, we aim to use machine learning algorithms to identify new mitochondria-related genes (MiRGs) in sepsis. Three MiRGs (BCKDHB, LETMD1, and NDUFB3) were screened out. More information about the role of MiRGs in immune infiltration was further explored. After the verification of high expression of NDUFB3 with our sepsis clinical specimens, the effect of NDUFB3 on mitochondria was tested with a confocal microscope. The expression of NDUFB3 was inhibited by small interfering RNA technology and the mitochondrial function was significantly reduced in the sepsis model. This study provides new ideas and targets for the intervention and treatment of sepsis.
Three public gene expression matrices (GSE54514, GSE65682, and GSE95233), comprising of gene expression data from sepsis patients (SP) and healthy controls (HC), were obtained from the Gene Expression Omnibus (GEO) databases. The GSE65682 dataset (GPL13667, [HG-U219] Affymetrix Human Genome U219 Array), consisting of 42 healthy samples and 760 sepsis samples, served as the training cohort, while the GSE54514 (GPL6947, Illumina HumanHT-12 V3.0 expression beadchip) and GSE95233 (GPL570, [HG-U133_Plus_2] Affymetrix Human Genome U133 Plus 2.0 Array) datasets, which included 58 healthy samples and 229 sepsis samples, were utilized as the test cohort. The R script “sva” was employed to normalize the data and eliminate any batch effects present in the three datasets (20). The definition of differentially expressed genes (DEGs) was established at |Fold change| ≥ 2, p (p. adjust) < 0.05. Mitochondria-related genes (MiRGs) were collected from the Mito-Carta, MitoMiner, IMPI 2, and UniProt databases.
Weighted gene co-expression network analysis (WGCNA) was employed in this study to identify the pivotal gene module associated with sepsis and healthy controls. Initially, all samples underwent clustering to exclude anomalous samples. Next, with the application of the scale-free topology model fit (R2 = 0.85), a network was constructed with a soft threshold (power) of 9 (β). The genes were subsequently separated into distinct modules and clustered in a tree, which were then merged into the final module. Pearson correlation algorithm was employed to calculate the correlation between each gene module. Eventually, the association between clinical features and gene modules was estimated, and the most relevant modules for the following analysis were selected. The least absolute shrinkage and selection operator (LASSO) logistic regression and random forests (RF) were employed for feature selection to screen diagnostic markers for sepsis. The LASSO algorithm was conducted using the “glmnet” package, while the RF algorithm was implemented as tree-based methods for classification and regression analysis. In this study, variables with the minimum log lambda of LASSO were considered as characteristics variables, and the importance threshold for selecting crucial variables using RF was set at 3. The common genes from LASSO and RF were obtained by Venn plot and used for further analysis.
We utilized the “clusterProfiler” and “ggplot2” packages to perform enrichment analyses of DE-MiRGs using Gene Ontology (GO) and the Kyoto Encyclopedia of Genes and Genomes (KEGG) (22). Furthermore, we applied GSEA to enrich the DEGs into distinct functional signaling pathways for HC and SP groups.
A nomogram model, which is based on the differentially expressed miRNA-regulated genes (DE-MiRGs), was constructed using the R package “rms”, to estimate the diagnostic probability of sepsis patients. To validate the diagnostic capacity of the nomogram, a receiver operating characteristic (ROC) curve was plotted. The nomogram scores were computed using the following parameters: -2.548 x BCKDHB + -5.454 x LETMD1 + 4.507 x NDUFB3.
Based on the expression matrix of each samples in the training cohort (GSE65682), the CIBERSORT algorithm was employed to evaluate the immune infiltration. Following the computation of marker genes for 22 immune cells, the relative proportion of the 22 immune cells was obtained. To investigate the correlation between infiltrating immune cells and 3 diagnostic biomarkers, Pearson’s correlation was conducted using the “ggplot2” R package. The 3 diagnostic DE-MiRGs were utilized for consensus clustering, with a maximum K of 9, via the R package “ConsensusClusterPlus”. Based on the optimal classification of K = 2, sepsis patients were classified into 2 molecular subtypes for further analysis. “ggplot2” script was utilized to exhibit the distribution pattern of HC and SP groups in a PCA plot based on the 22 immune cells proportion.
The clinical blood samples used in this study were obtained from 30 sepsis patients and 15 healthy volunteers at Daping Hospital (Chongqing, China) (Supplementary Table 1). The study was approved by the Ethics Committee of the Army Medical University and was registered with the Chinese Clinical Trial Registry (ChiCTR2200055772). All procedures were carried out under the approval of the Ethics Committee, and informed consent was obtained from all patients prior to participation.
The Mito-tracker was procured from Thermo Fisher Scientific (Waltham, MA, USA). The ROS assay kit, ATP detection kit, and JC-1 enhanced mitochondrial membrane potential assay kit were purchased from Beyotime (Shanghai, CHINA). The siRNA for NDUFB3 was generated by Obio Technology (Shanghai, CHINA), and the target sequence of siNDUFB3 was 5′- GAUUAUAGACAAUGGAAGATT -3′. H9C2 cells were obtained from the American Type Culture Collection (ATCC), located in Manassas, VA, USA, and cultured in DMEM supplemented with 10% FBS and 1% antibiotics in a 5% CO2/95% air atmosphere, at 37°C (23). To construct an in vitro sepsis model, H9C2 cells were stimulated with 1μg/ml LPS, purchased from Sigma (St. Louis, MO, USA), for 12 hours.
The cells were introduced into the confocal chamber and incubated with Mito-tracker (diluted to a ratio of 1:10,000), DCFH-DA (diluted to a ratio of 1:1,000), and JC-1 (diluted to a ratio of 1:1,000) at a temperature of 37°C for a period of 30 minutes. Following this, observations were made of the mitochondrial morphology, reactive oxygen species (ROS), and mitochondrial membrane potential utilizing a laser confocal microscope (Leica SP5, Germany). The mitochondrial length was subsequently analyzed utilizing a mitochondrial network analysis (MiNA) toolset, which was included in the ImageJ software (https://fiji.sc/).
The blood RNA was extracted using the PureLink™ blood total RNA extraction kit (Invitrogen).Then, the extracted RNA was then reverse transcribed into cDNA libraries using the Bestar™ qPCR RT Kit (DBI Bioscience), and fluorescent quantitative PCR reactions were performed using the Bestar® SYBRGreen qPCR master mix (DBI Bioscience). Actin was handled as an internal reference. Primers used in these experiments were listed in Supplementary Table 2.
Statistical analyses were performed using R (version 4.1.1), GraphPad Prism (version 8.0.1), and SPSS 17.0 (SPSS Inc., Chicago, IL, USA). Cell study data were repeated in a minimum of three independent experiments. In this study, statistical differences between the two groups were tested using the T test and Wilcoxon rank-sum test. One-way ANOVA analysis was used between multiple groups. All data are presented as the mean ± standard deviation (SD) and statistical significance was considered at p < 0.05.
Three datasets were collected from the GEO database (GSE95233, GSE65682, GSE54514) in this study. After removing the batch effect and data normalization, we collected 100 healthy samples (HC) and 989 sepsis samples (SP) for the subsequent analyses (Figure 1). In the training cohort (GSE65682), under the screening condition set at |fold change| ≥ 2 and p-value (p.adjust) < 0.05, 744 DEGs were obtained, including 398 down- and 346 up-regulated DEGs (Figure 2A). The heatmap diagram showed the expression of the top 25 up- and down-regulated DEGs in HC and SP groups (Figure 2B). The analysis of GSEA suggested that the DEGs in the SP group were greatly enriched in chemical carcinogenesis-DNA adducts, fatty acid biosynthesis, glycosphingolipid biosynthesis-lacto and neolacto series, mucin type O−glycan biosynthesis, and starch and sucrose metabolism; however, we found that the DEGs in HC group were remarkably enriched in immune-related signaling pathways, including antigen processing and presentation and allograft rejection (Figures 2C, D).
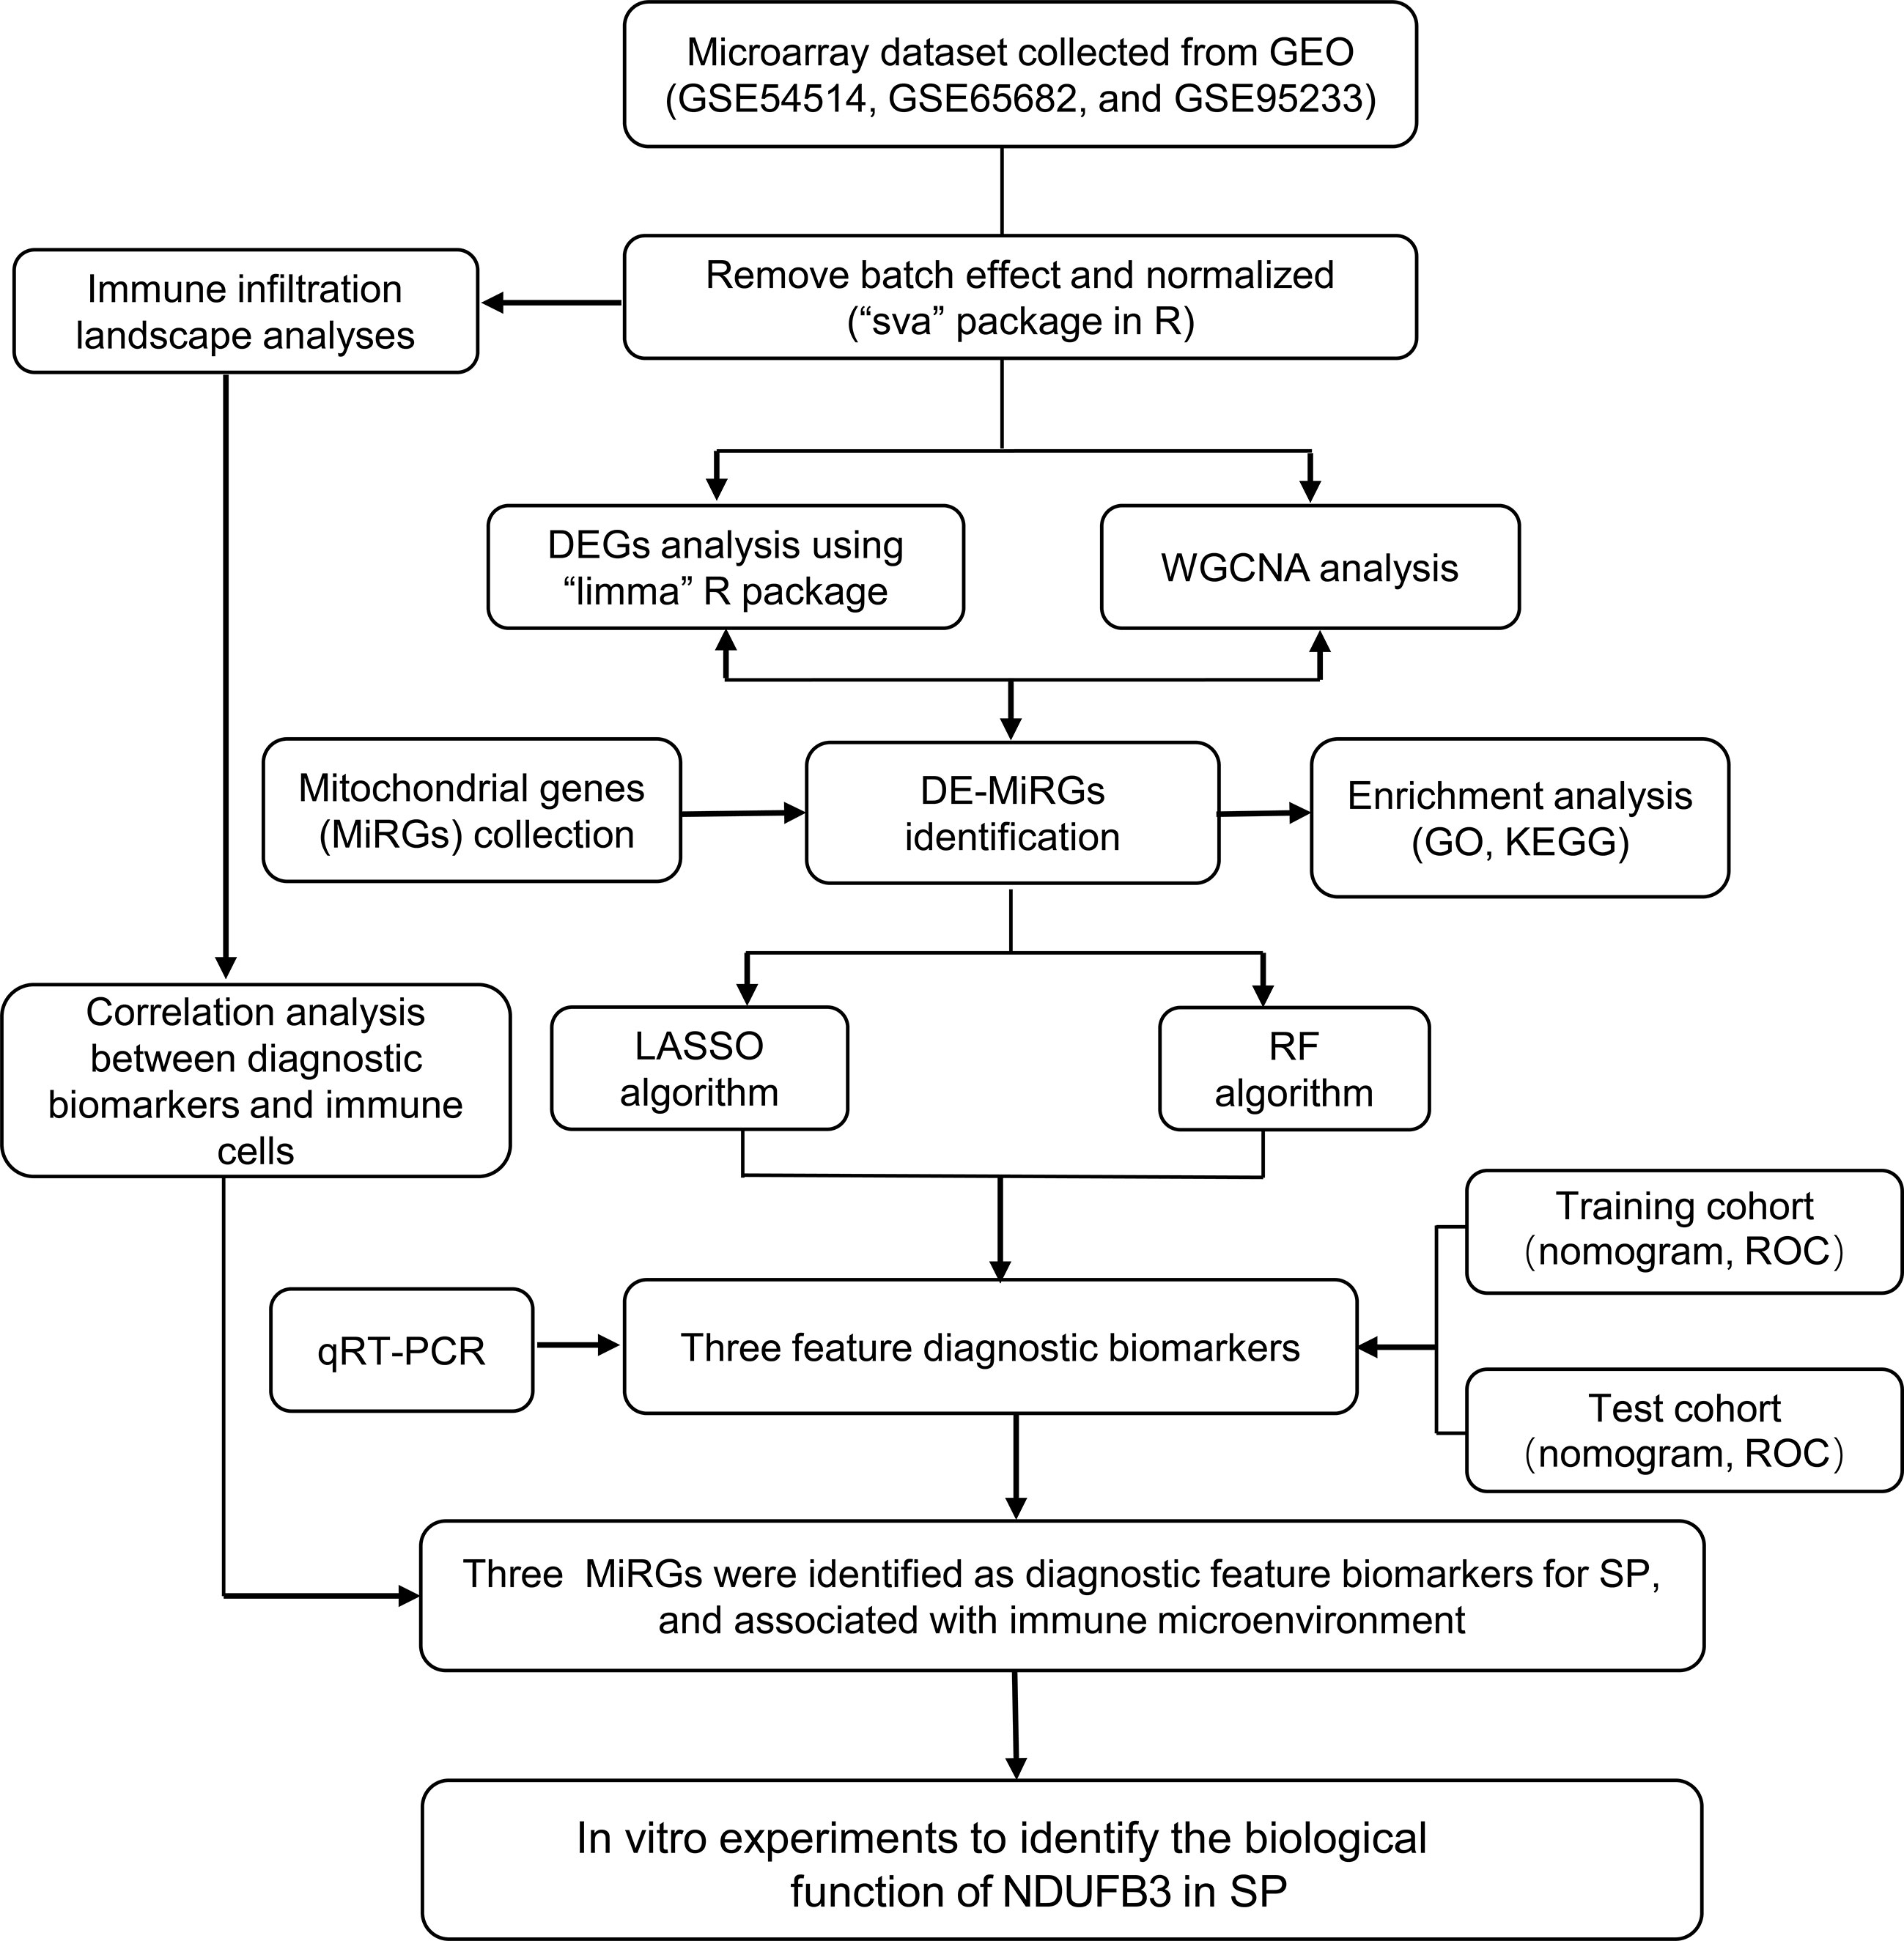
Figure 1 Diagram of the Study flow.
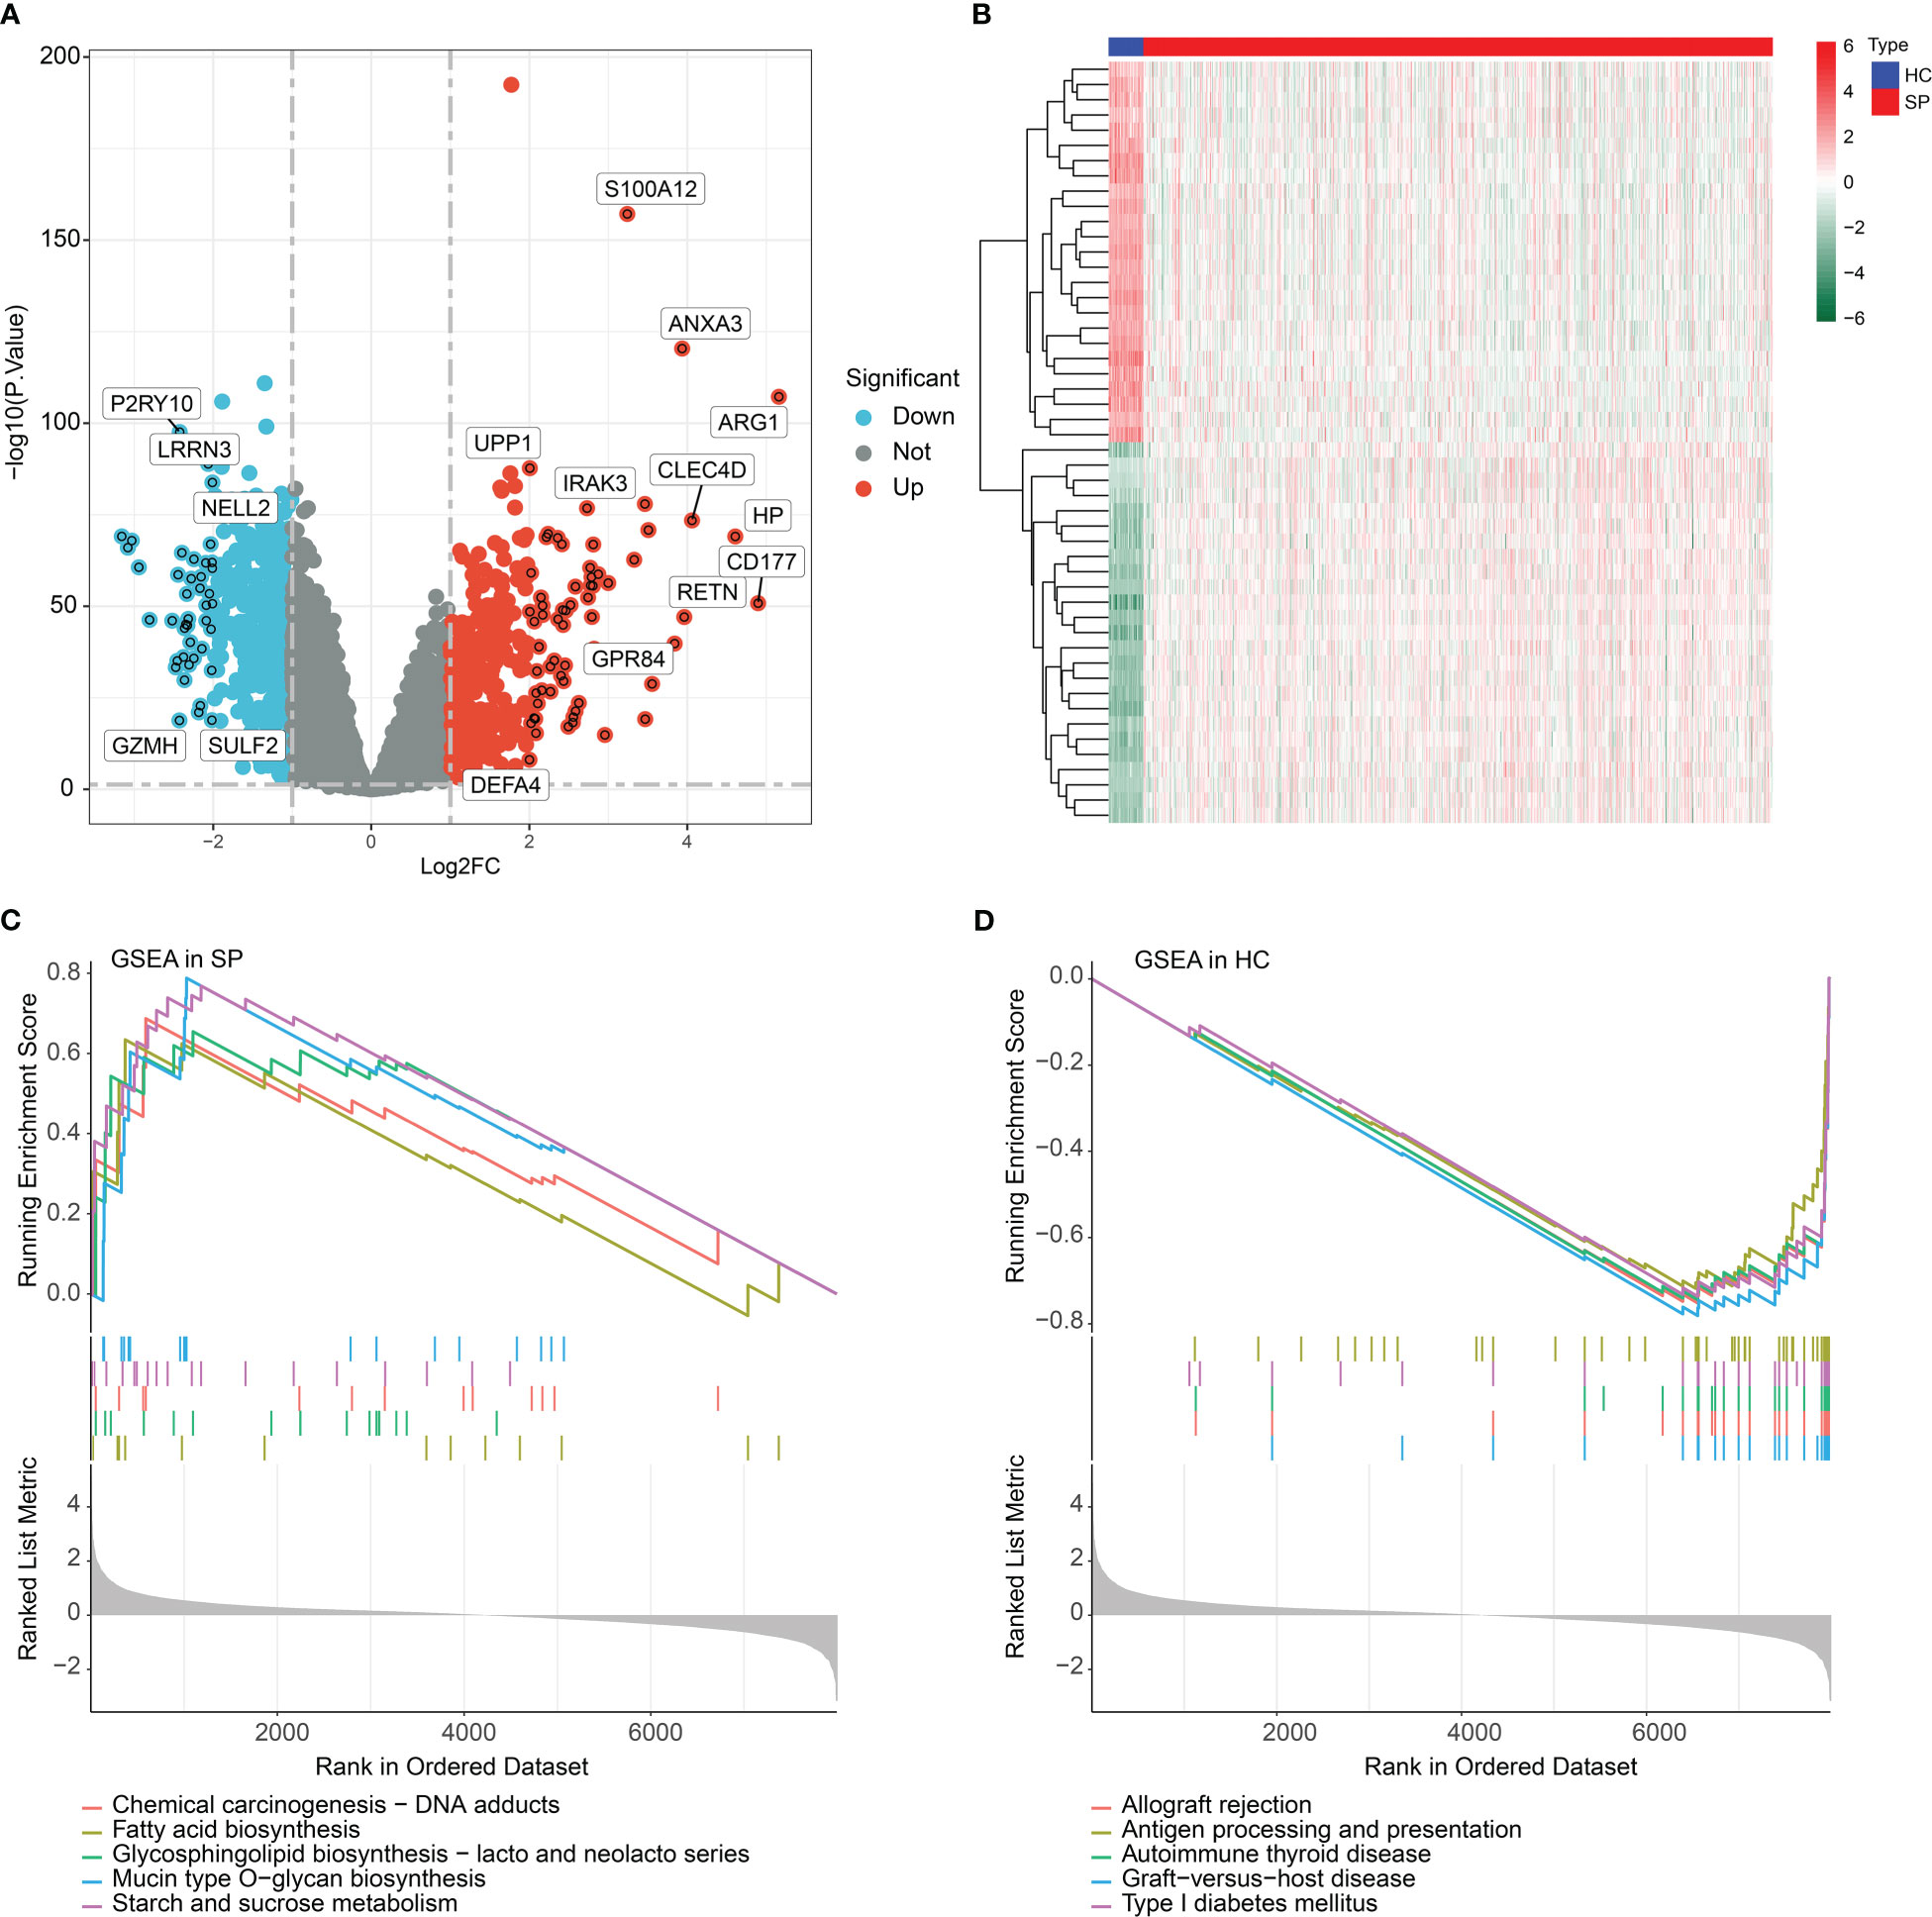
Figure 2 Identification of DEGs and GSEA functional enrichment analysis. (A) Volcano plot of DEGs in HC and SP groups. The threshold of screening DEGs is set at |fold change| ≥ 2 and p (p.adjust) < 0.05. Turquoise dots represent down-regulated genes and red dots represents up-regulated genes. (B) Analysis of top 25 up- and down-regulated genes in HC and SP group. (C, D) GSEA analysis of DEGs in HC and SP group.
The training cohort (GSE65682) was utilized to develop a WGCNA network. The 42 HC samples and 760 SP samples were clustered under a set threshold condition to exclude abnormal samples. Under the filter of scale-free topology (R2 > 0.85), the soft threshold (power) for scale independence was selected as β = 9 (Figure 3A). With the height of clustering of module eigengenes set at 0.25, a total of 18 gene modules were obtained for further analysis (Figure 3B). The cluster dendrogram indicated the height of each module which was cut by the dynamic tree and merged into modules (Figure 3C). The correlation heatmap suggested that there was no apparent correlation between each module (Figure 3D). In addition, transcriptional correlation analysis within each module showed that there was no significant association between modules, showing the reliability of module descriptions (Figure 3E). The relationship of gene modules and clinical features illustrated that module black was negatively correlated with SP (r = -0.6, p = 4e-80), and positively correlated with HC (r = 0.6, p = 4e-80); module red was negatively associated with HC (r = -0.52, p = 8e-57), and positively correlated with SP (r = 0.52, p = 8e-57); module green was positively correlated with HC (r = 0.37, p = 7e-27), and negatively correlated with SP (r = -0.37, p = 7e-27, Figure 3F). According to the correlation coefficient, module black was identified as the most characteristic module. The scatter plot indicated that the module membership versus gene significance showed a high correlation of HC and SP (r = 0.77, p = 1.4e-179), and the genes in this module were collected for further analysis (Figures 3G, H).
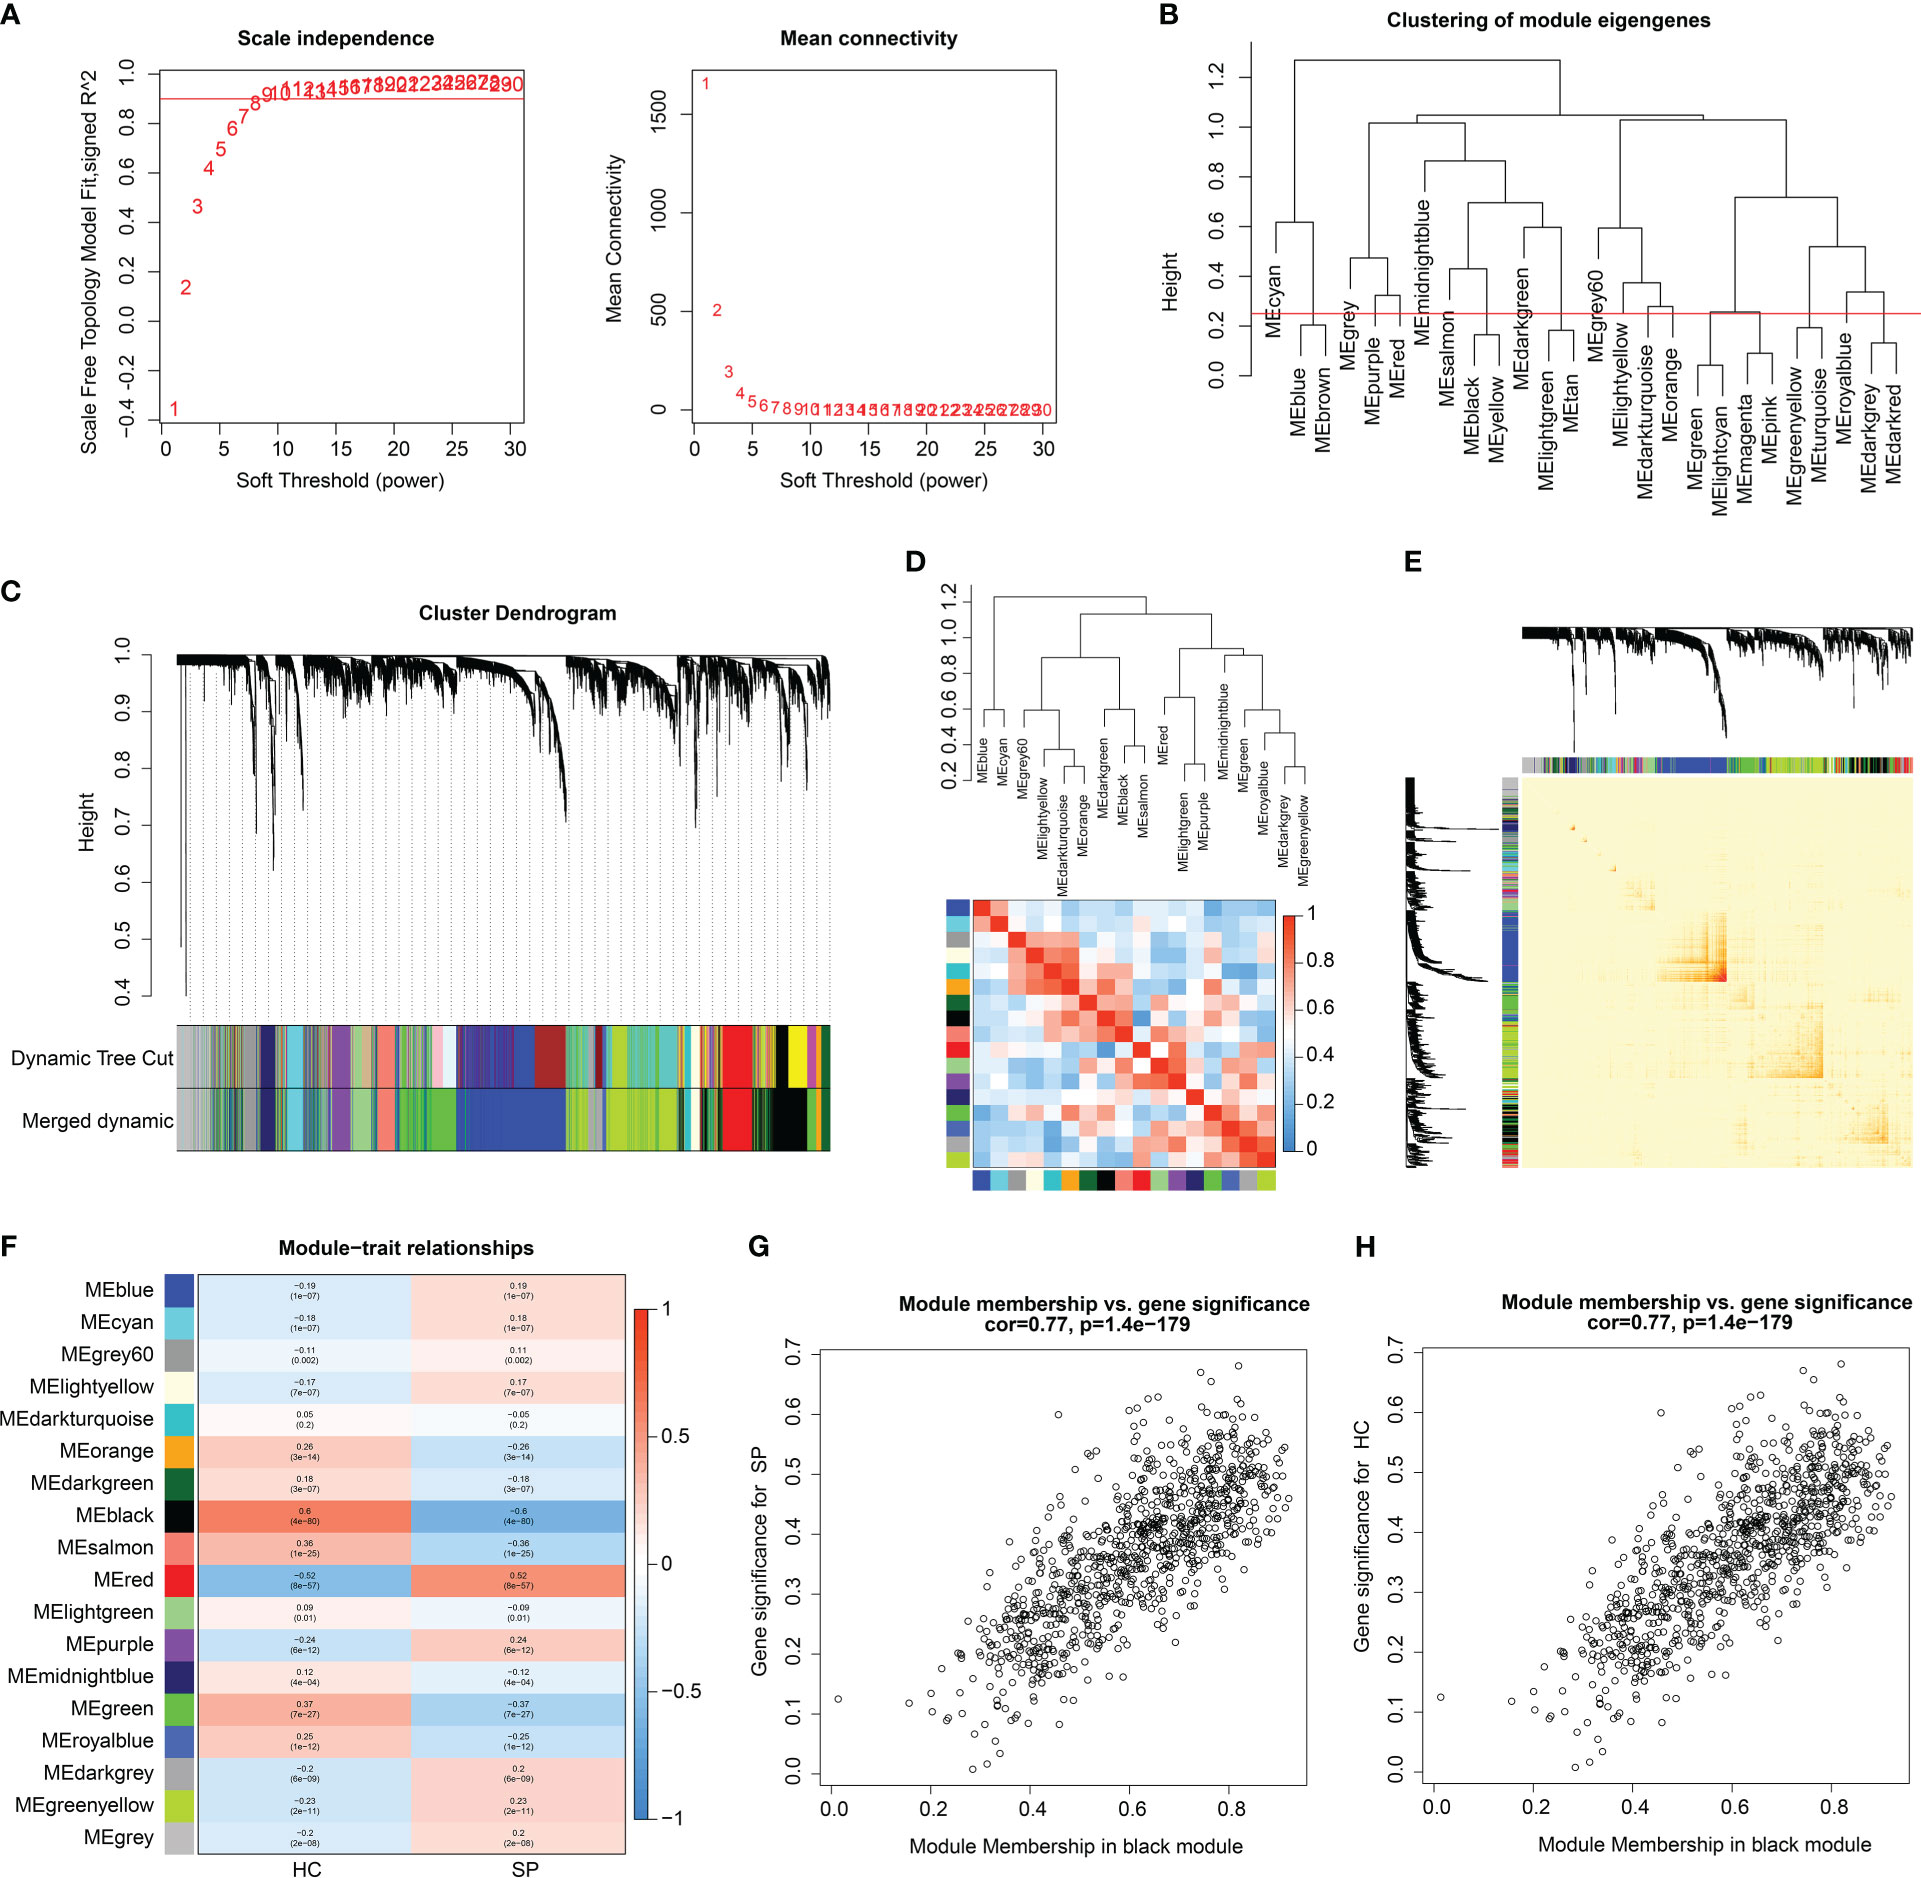
Figure 3 WGCNA analysis to select characteristics gene module for SP. (A) Scale free topology model fit (R2 = 0.85) and mean connectivity. (B) Clustering of module genes. (C) Cluster dendrogram for selecting gene modules. (D) Association between the gene modules. (E) Correlation analysis of transcriptome in different modules. (F) Heatmap analysis of 18 modules and clinical features (HC, SP). (G, H) Module membership vs. gene significance for SP and HC in black module.
Based on the different analysis and WGCNA (black module), 64 overlapping genes were identified as pivotal DE-MiRGs by the Venn diagram (Figure 4A) (24). We utilized function enrichment analysis to explore the potential molecular biological function of pivotal DE-MiRGs for SP. The analysis of GO enrichment illustrated that those pivotal DE-MiRGs were associated with the generation of precursor metabolites and energy, cellular respiration, mitochondrial matrix, and structural constituent of ribosome (Figure 4B). The KEGG analysis of pivotal DE-MiRGs was linked with carbon metabolism, ribosome, diabetic cardiomyopathy, and chemical carcinogenesis-reactive oxygen species (Figure 4C).
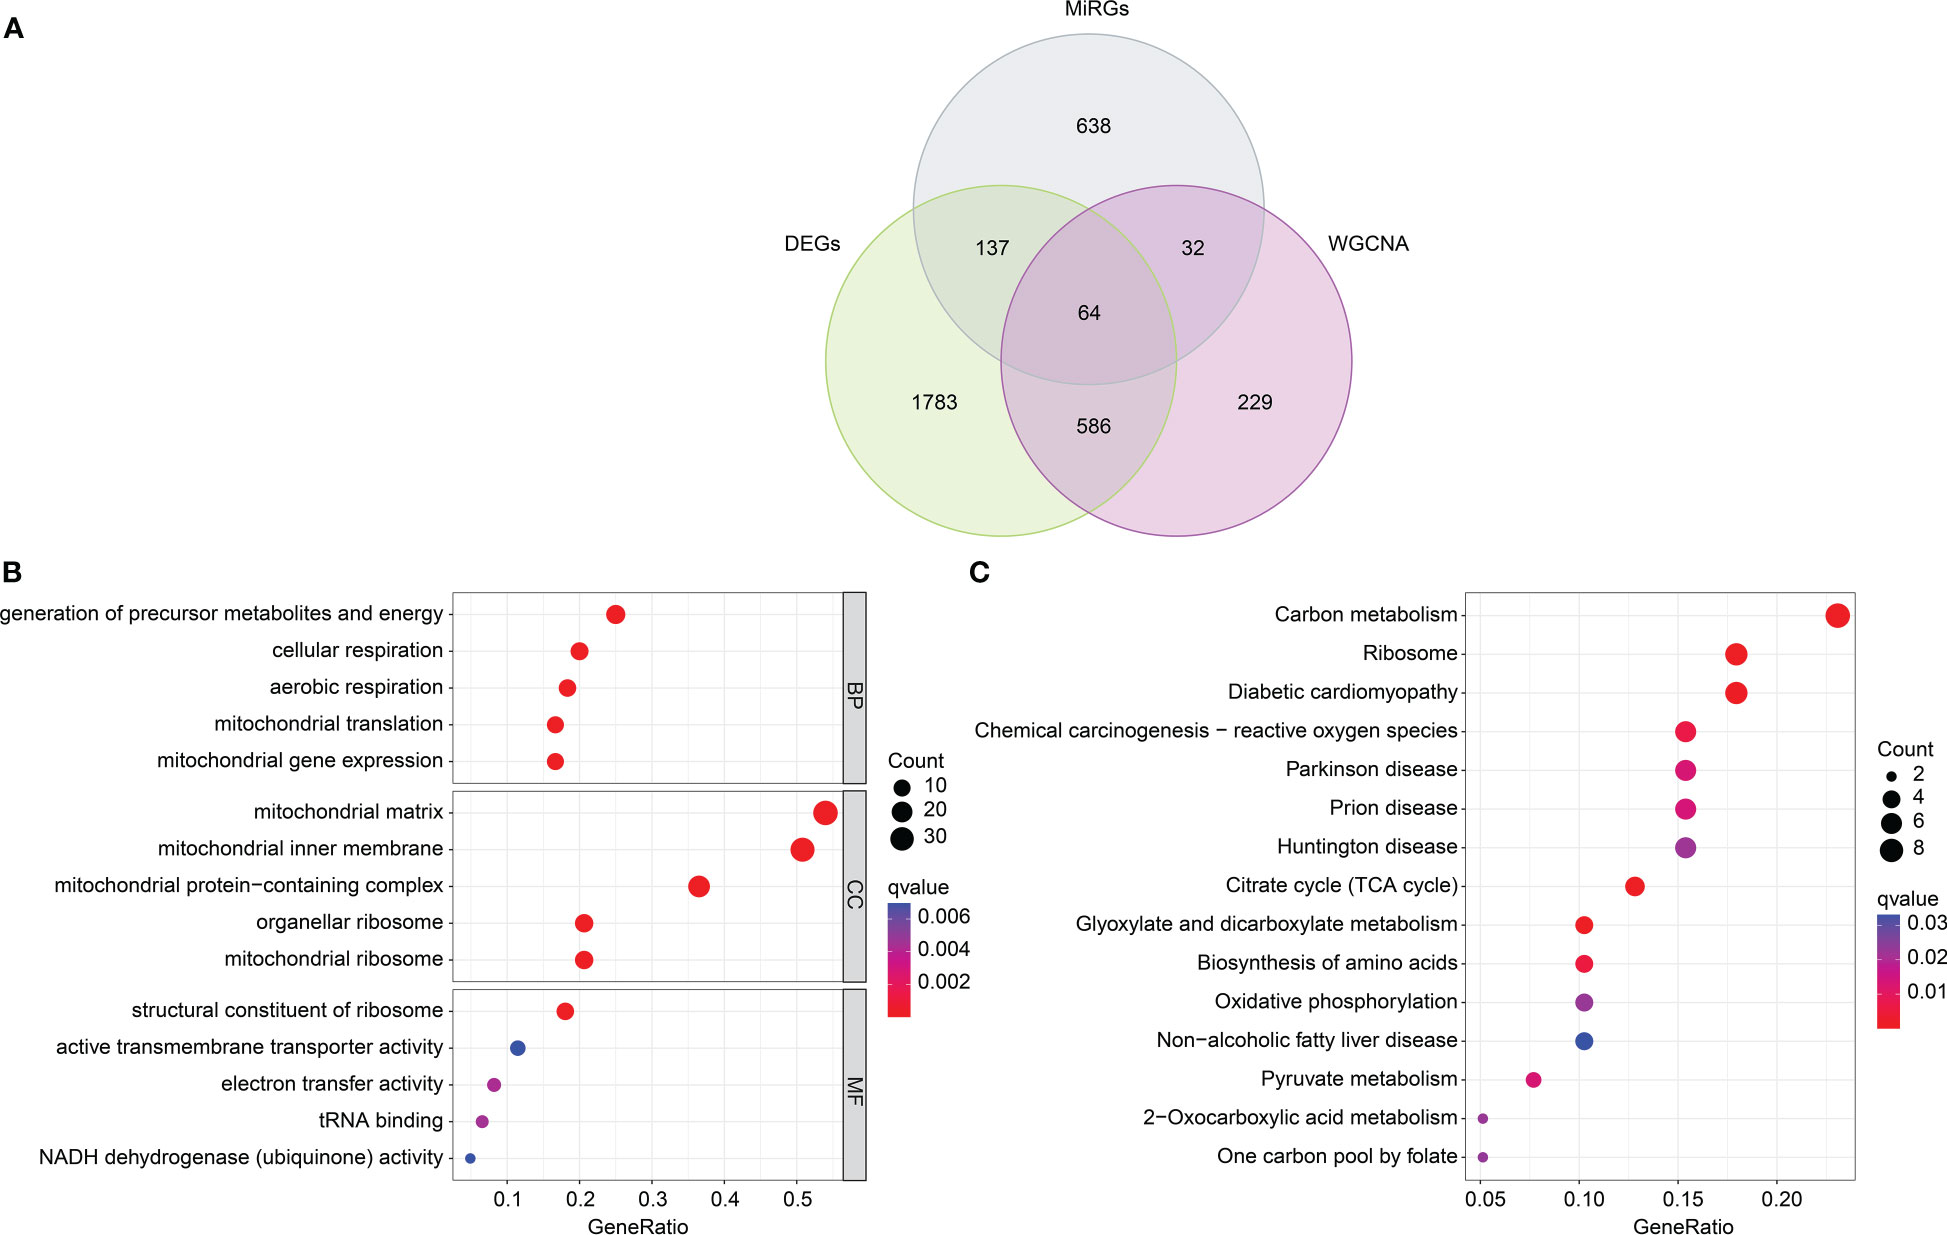
Figure 4 DE-MiRGs screening and function enrichment analysis. (A) Identification of pivotal DE-MiRGs in black module. (B) GO enrichment analysis of DE-MiRGs. (C) KEGG pathway analysis of DE-MiRGs.
We performed two machine learning algorithms to select the feature DE-MiRGs for SP. The LASSO algorithm showed the minimum lambda of DE-MiRGs, and 10 characteristic variates were obtained (Figures 5A, B). Random forest (RF) algorithm result identified 8 feature DE-MiRGs for further analysis (Figure 5C). According to LASSO and RF algorithms, three overlapping genes were identified as feature biomarkers, including BCKDHB, LETMD1, and NDUFB3 (Figure 5D). As displayed in Figure 5E, a remarkable association was observed between the three feature biomarkers; BCKDHB was positively associated with LETMD1 and negatively associated with NDUFB3; NDUFB3 was negatively correlated with LETMD1.
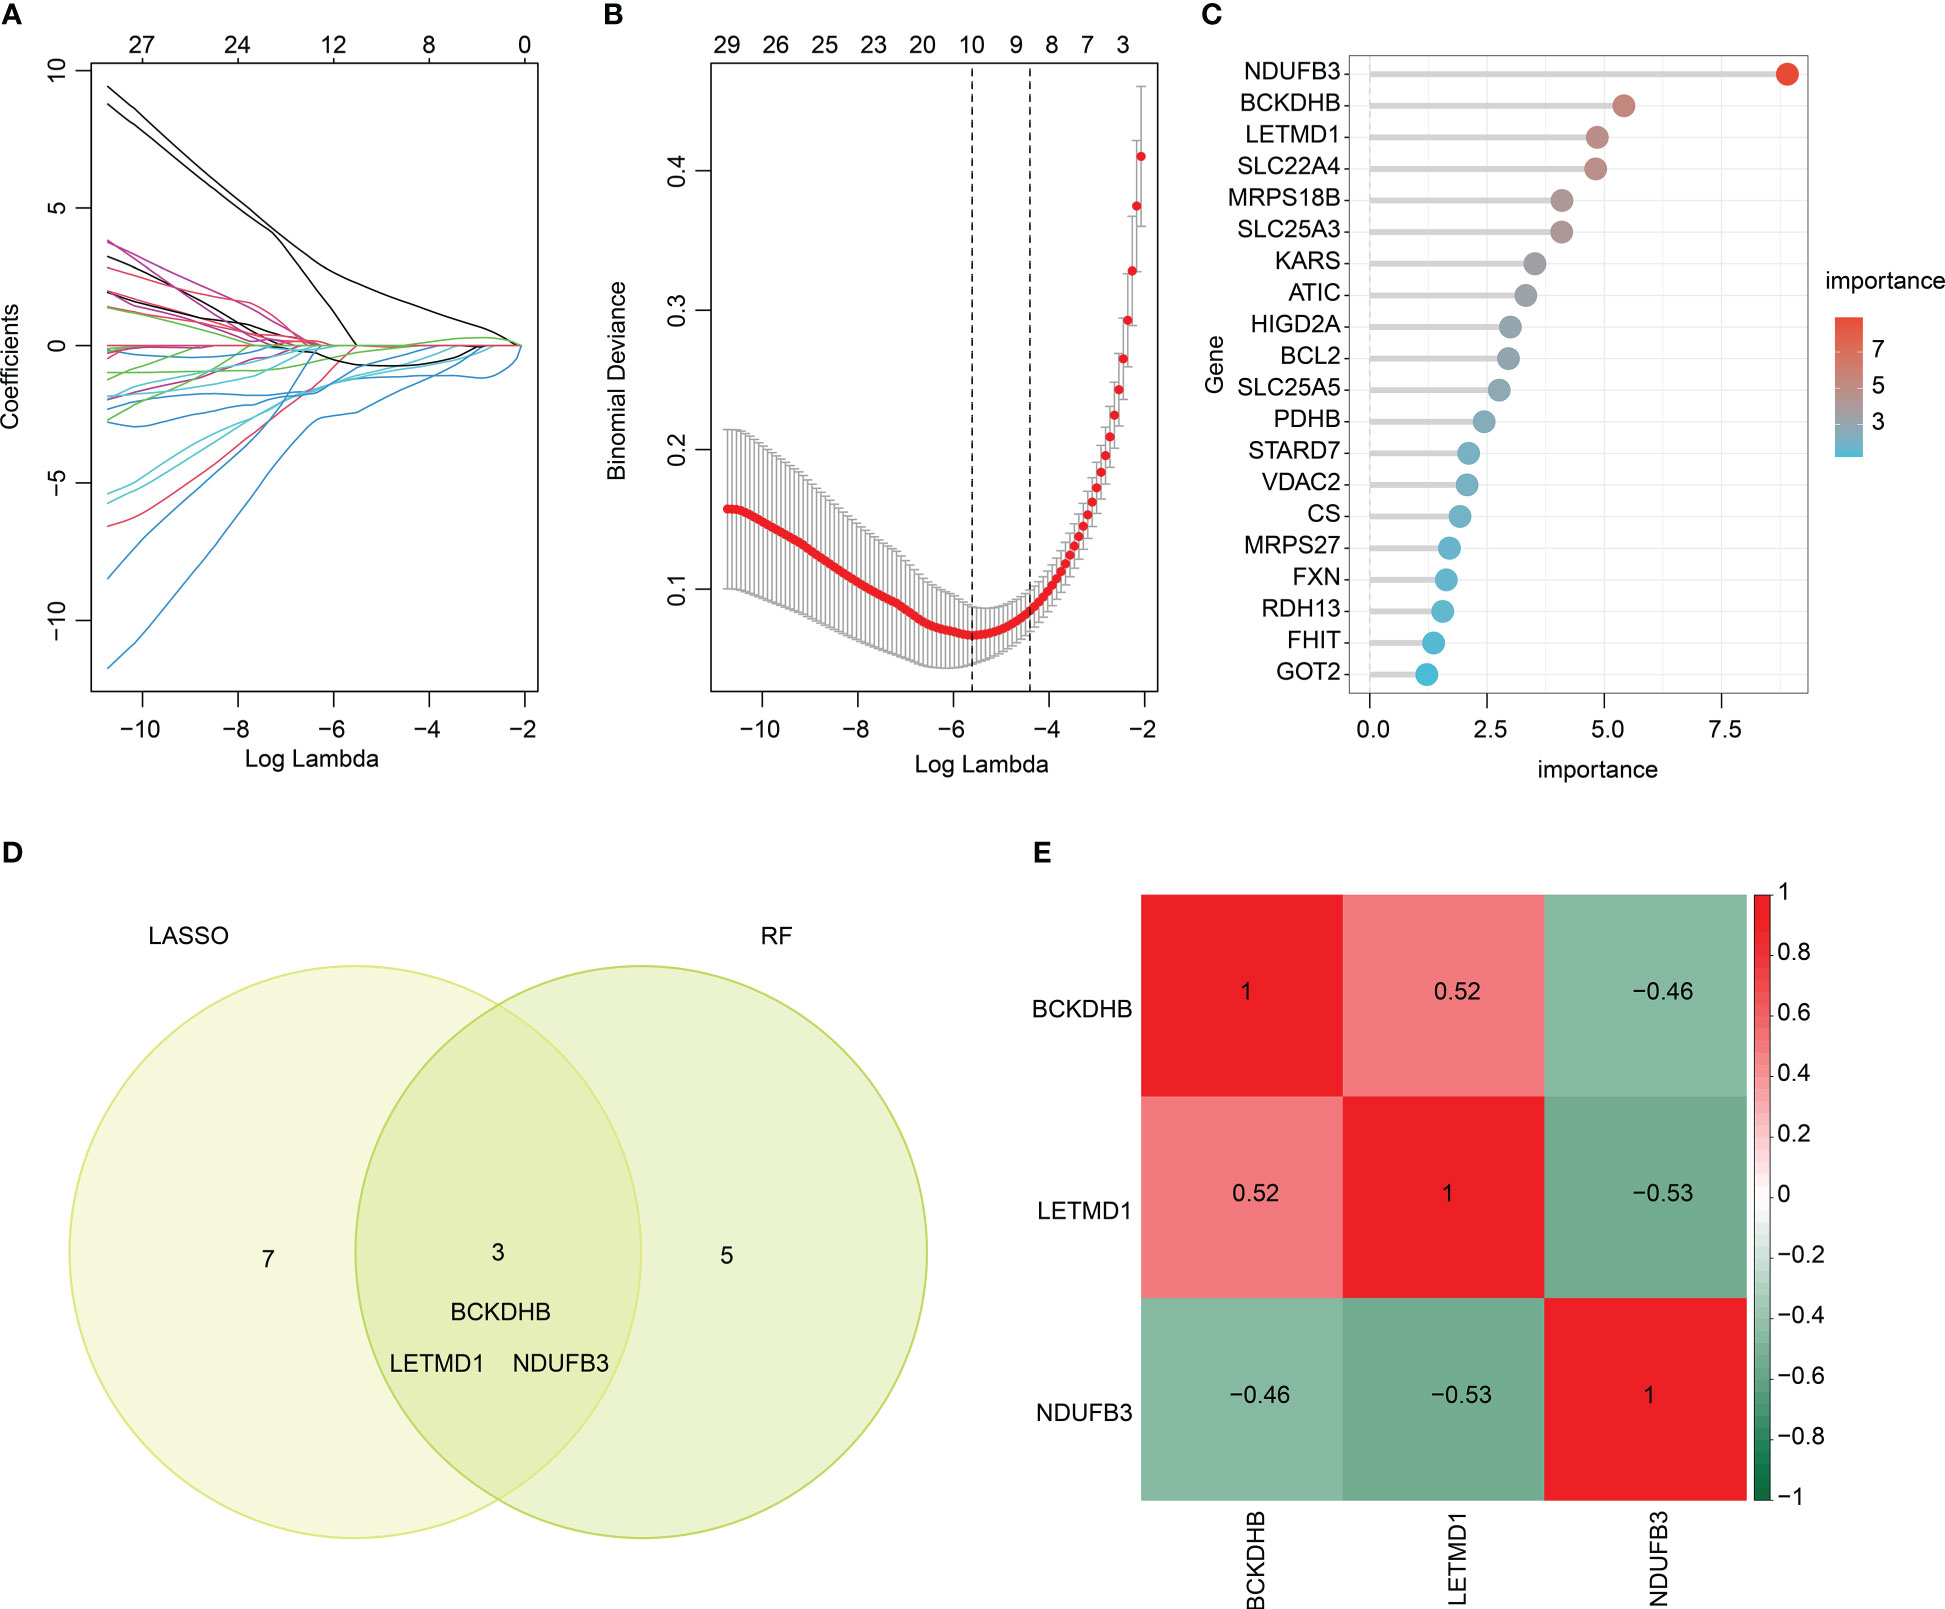
Figure 5 Feature biomarkers selection via machine language algorithms. (A, B) LASSO analysis to screen key DE-MiRGs. (C) RandomForest (RF) analysis of key DE-MiRGs, the filter condition for screening feature variates is set at: importance > 3. (D) Venn analysis of LASSO and RF. The overlapping genes are considered as feature biomarkers. (E) Correlation heatmap of BCKDHB, LETMD1, and NDUFB3. Green color represents negative correlation, red color represents positive correlation.
Two separate cohorts were adopted to validate the expression and diagnostic effectiveness of feature biomarkers. In the training cohort (GSE65682) and validation cohort (GSE95233, GSE54514), the expression of three feature biomarkers suggested the HC group had higher expression of BCKDHB, LETMD1, and lower expression of NDUFB3 (Figures 6A, B). Moreover, a nomogram model was established based on three gene signatures to evaluate the diagnostic effectiveness of SP in both cohorts. The results of the nomogram illustrated a satisfactory diagnostic ability of BCKDHB, LETMD1, and NDUFB3 for SP (Figures 6C, E). The ROC analysis in the training cohort suggested that the AUC of three feature biomarkers (BCKDHB, LETMD1, NDUFB3) and nomogram score was 0.971, 0.977, 0.985, and 0.997, respectively (Figure 6D). The ROC analysis of feature biomarkers (BCKDHB, LETMD1, NDUFB3) and nomogram score in the validation cohort displayed that the AUC was 0.732, 0.614, 0.734, and 0.768 (Figure 6F). These results demonstrate a satisfactory diagnostic effectiveness of three feature biomarkers that could be used for clinical precision diagnosis of SP.
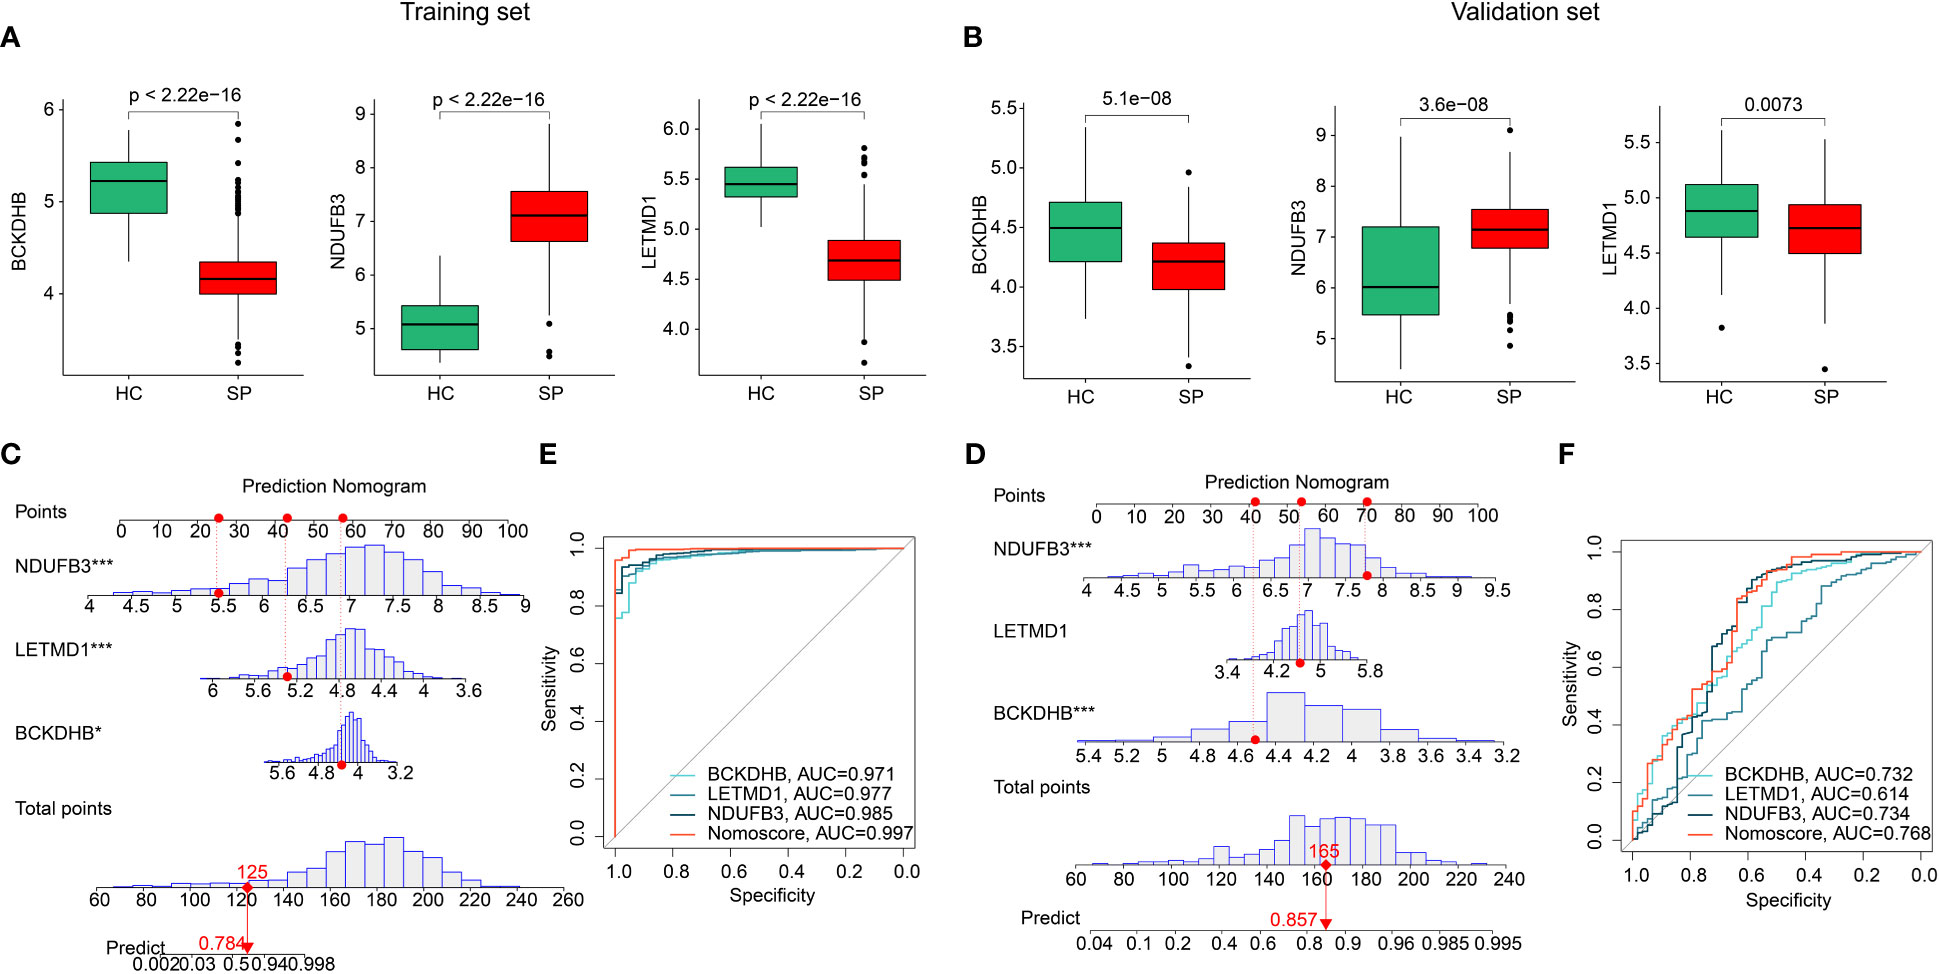
Figure 6 Validation of the expression of feature biomarkers and effectiveness evaluation. (A) The expression of BCKDHB, LETMD1, NDUFB3 in training cohort (GSE65682). (B) Validation of BCKDHB, LETMD1, NDUFB3 in validation cohort (GSE95233, GSE54514). (C, D) Nomogram construction and ROC curve of three gene signatures in GSE65682. (E, F) Nomogram construction and ROC curve of three gene signatures in GSE95233 and GSE54514.
By assessing the signature of 22 immune cell subtypes, we calculated the relative percent of 22 immune cells in the HC and SP groups based on the CIBERSORT algorithm (Figure 7A). Between the 22 immune cells, a significant correlation was observed in a heatmap; NK cells resting was negatively correlated with NK cells activated (r = -0.68), but positively correlated with T cells CD8 (r = 0.41); T cells CD4 memory activated was positively correlated with T cells CD8 (r = 0.42); B cells memory was negatively correlated with eosinophils (r = -0.44), NK cells activated (r = -0.35) and macrophages M0 (r = -0.35) (Figure 7B). Quantitative data revealed a great difference between HC and SP groups in most immune cells, such as B cells memory, T cells CD8, T cells CD4 memory resting, T cells CD4 memory activated, and T cells regulatory (Tregs) (Figure 7C). PCA plot illustrated a significant classification of immune cells in HC and SP groups (Figure 7D). Moreover, the correlation analysis of three feature biomarkers and the immune microenvironment landscape suggested that BCKDHB, LETMD1, and NDUFB3 were greatly correlated with 22 immune cells (Figures 7E–G). Collectively, these findings demonstrate a significant difference between HC and SP groups in the immune microenvironment and closely associated with BCKDHB, LETMD1, and NDUFB3.
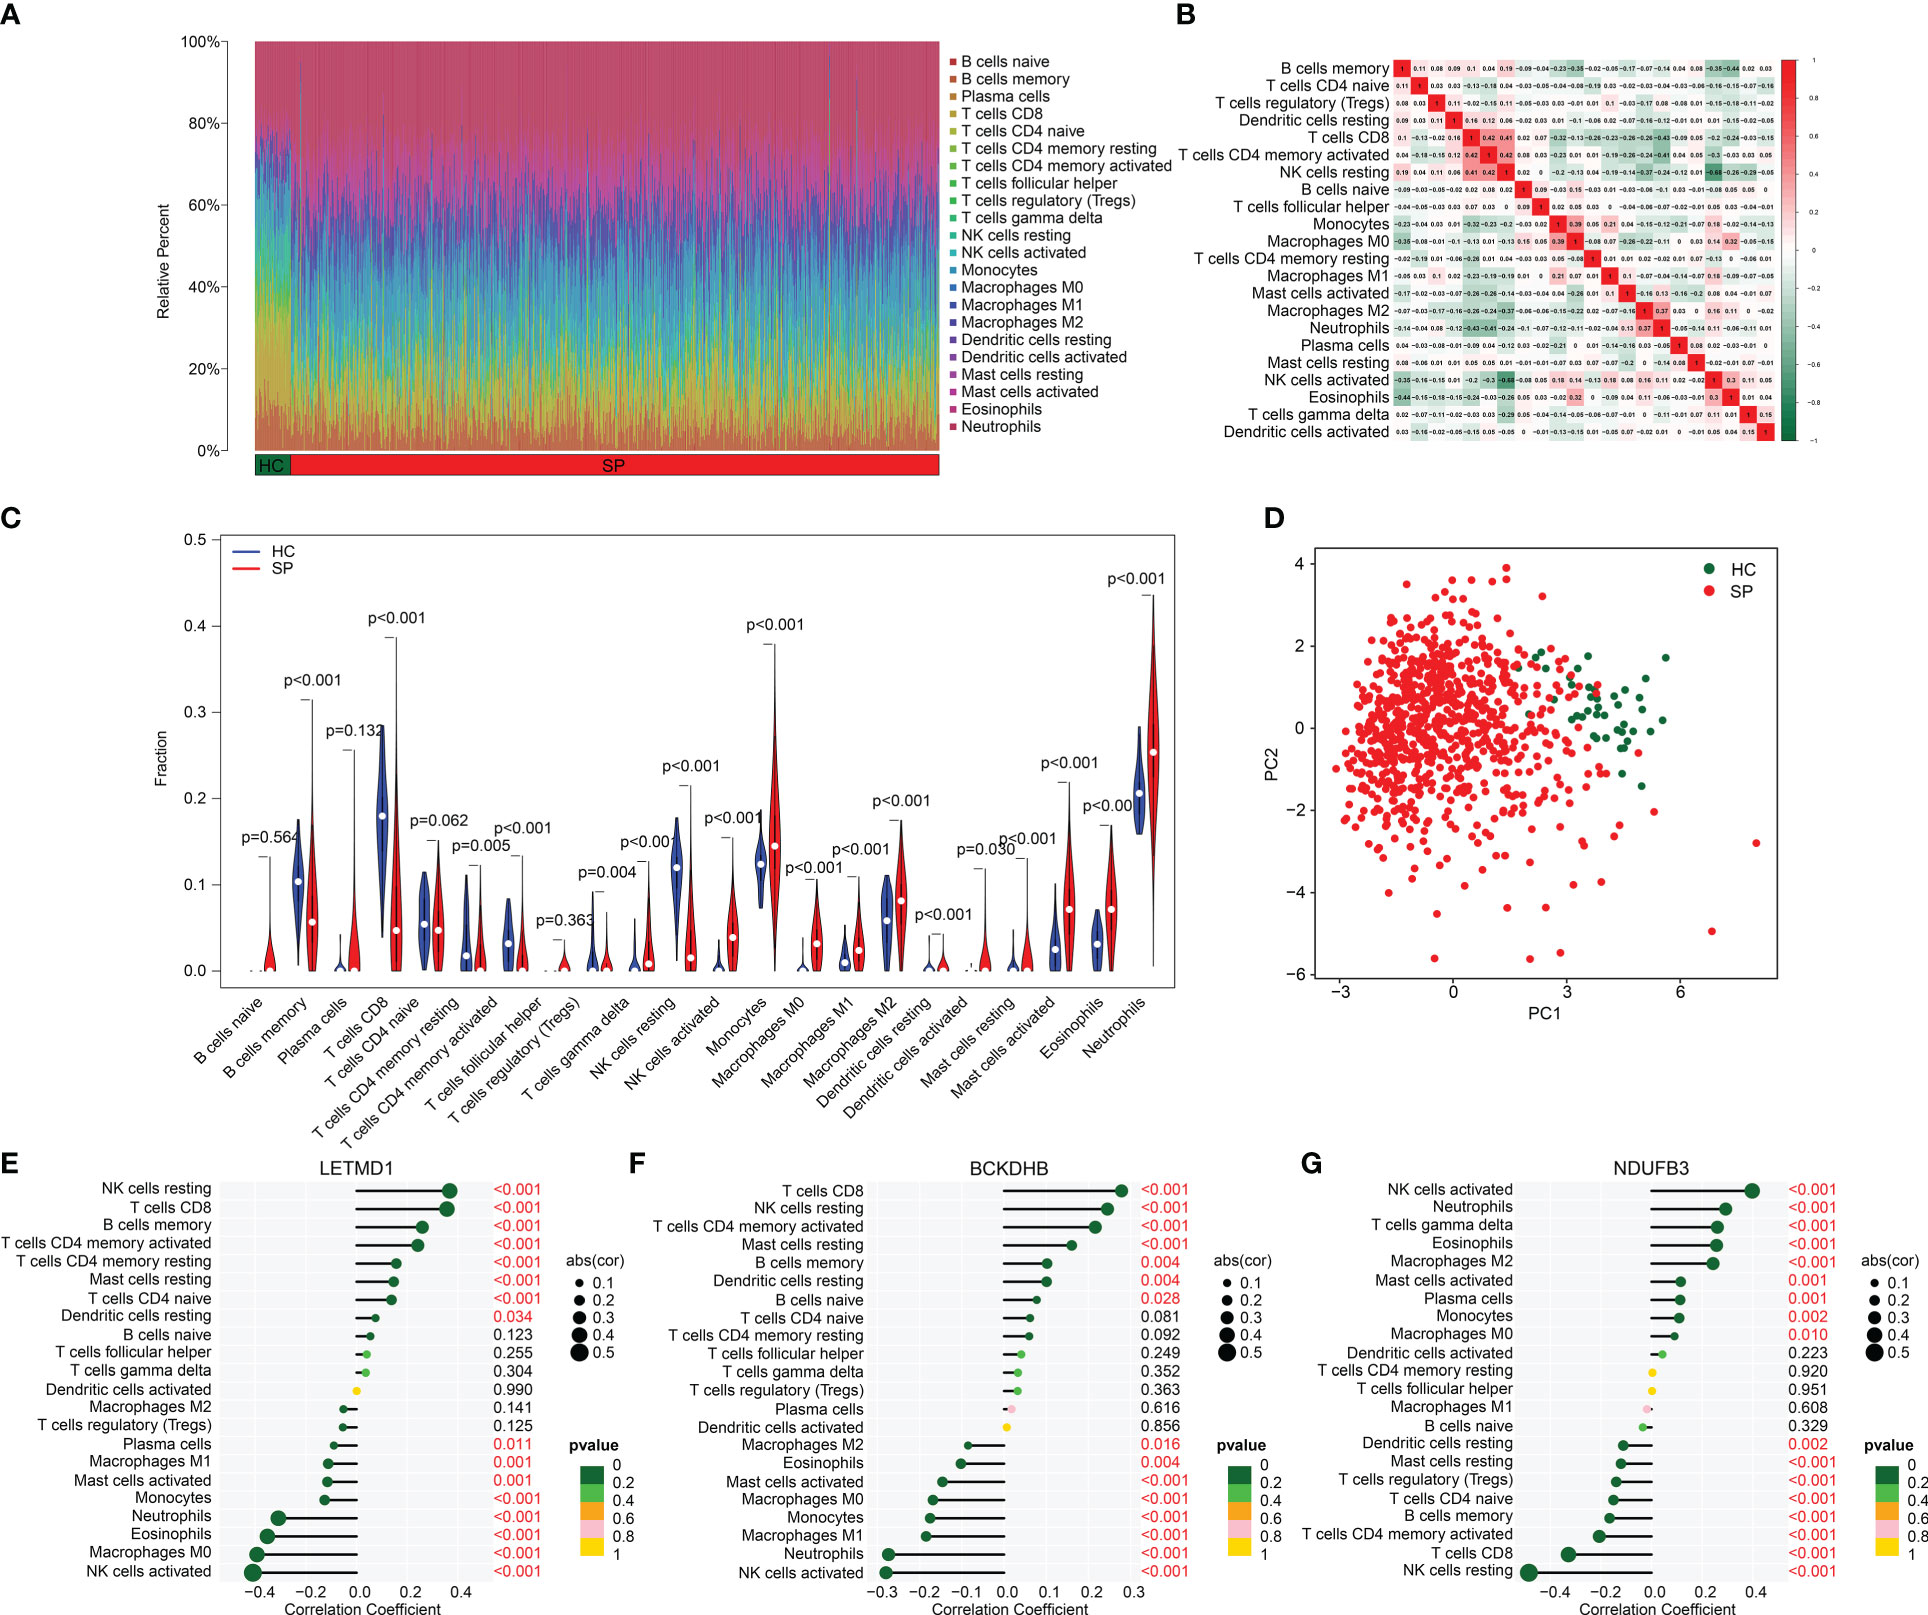
Figure 7 Analysis of immune microenvironment landscape in HC and SP groups. (A) Immune cells assessment between HC and SP groups. (B) Analysis of correlation in 22 type immune cells. (C) Violin diagram of 22 type immune cells in HC and SP groups. (D) PCA plot showed a different distribution pattern in HC and SP. (E–G) Correlation analysis of three diagnostic biomarkers (BCKDHB, LETMD1, and NDUFB3) and immune microenvironment.
We performed a consensus clustering analysis to cluster the SP samples into different molecular subgroups. Based on the three diagnostic biomarkers, two optimal classifications were obtained for SP (Figures 8A–C). The quantitative data indicated that the samples in Cluster A had higher expression of BCKDHB and LETMD1, whereas the expression of NDUFB3 was higher in Cluster B (Figures 8D–F). The immune cell assessment result illustrated that the immune microenvironment of samples in both cluster classifications was greatly different, such as B cells memory, T cells CD8, T cells CD4 naïve, and neutrophils (Figure 8G). The analysis of GSEA suggested that the DEGs in the Cluster A group were greatly enriched in Antigen processing and presentation and graft versus host disease, while the DEGs in Cluster B group were remarkably enriched in Glycosphingolopid biosynthesis and O-glycan biosynthesis (Supplementary Figure 1). These findings demonstrate that the SP samples could be accurately classified into different molecular subgroups based on the three feature biomarkers and notably correlated with the immune microenvironment.
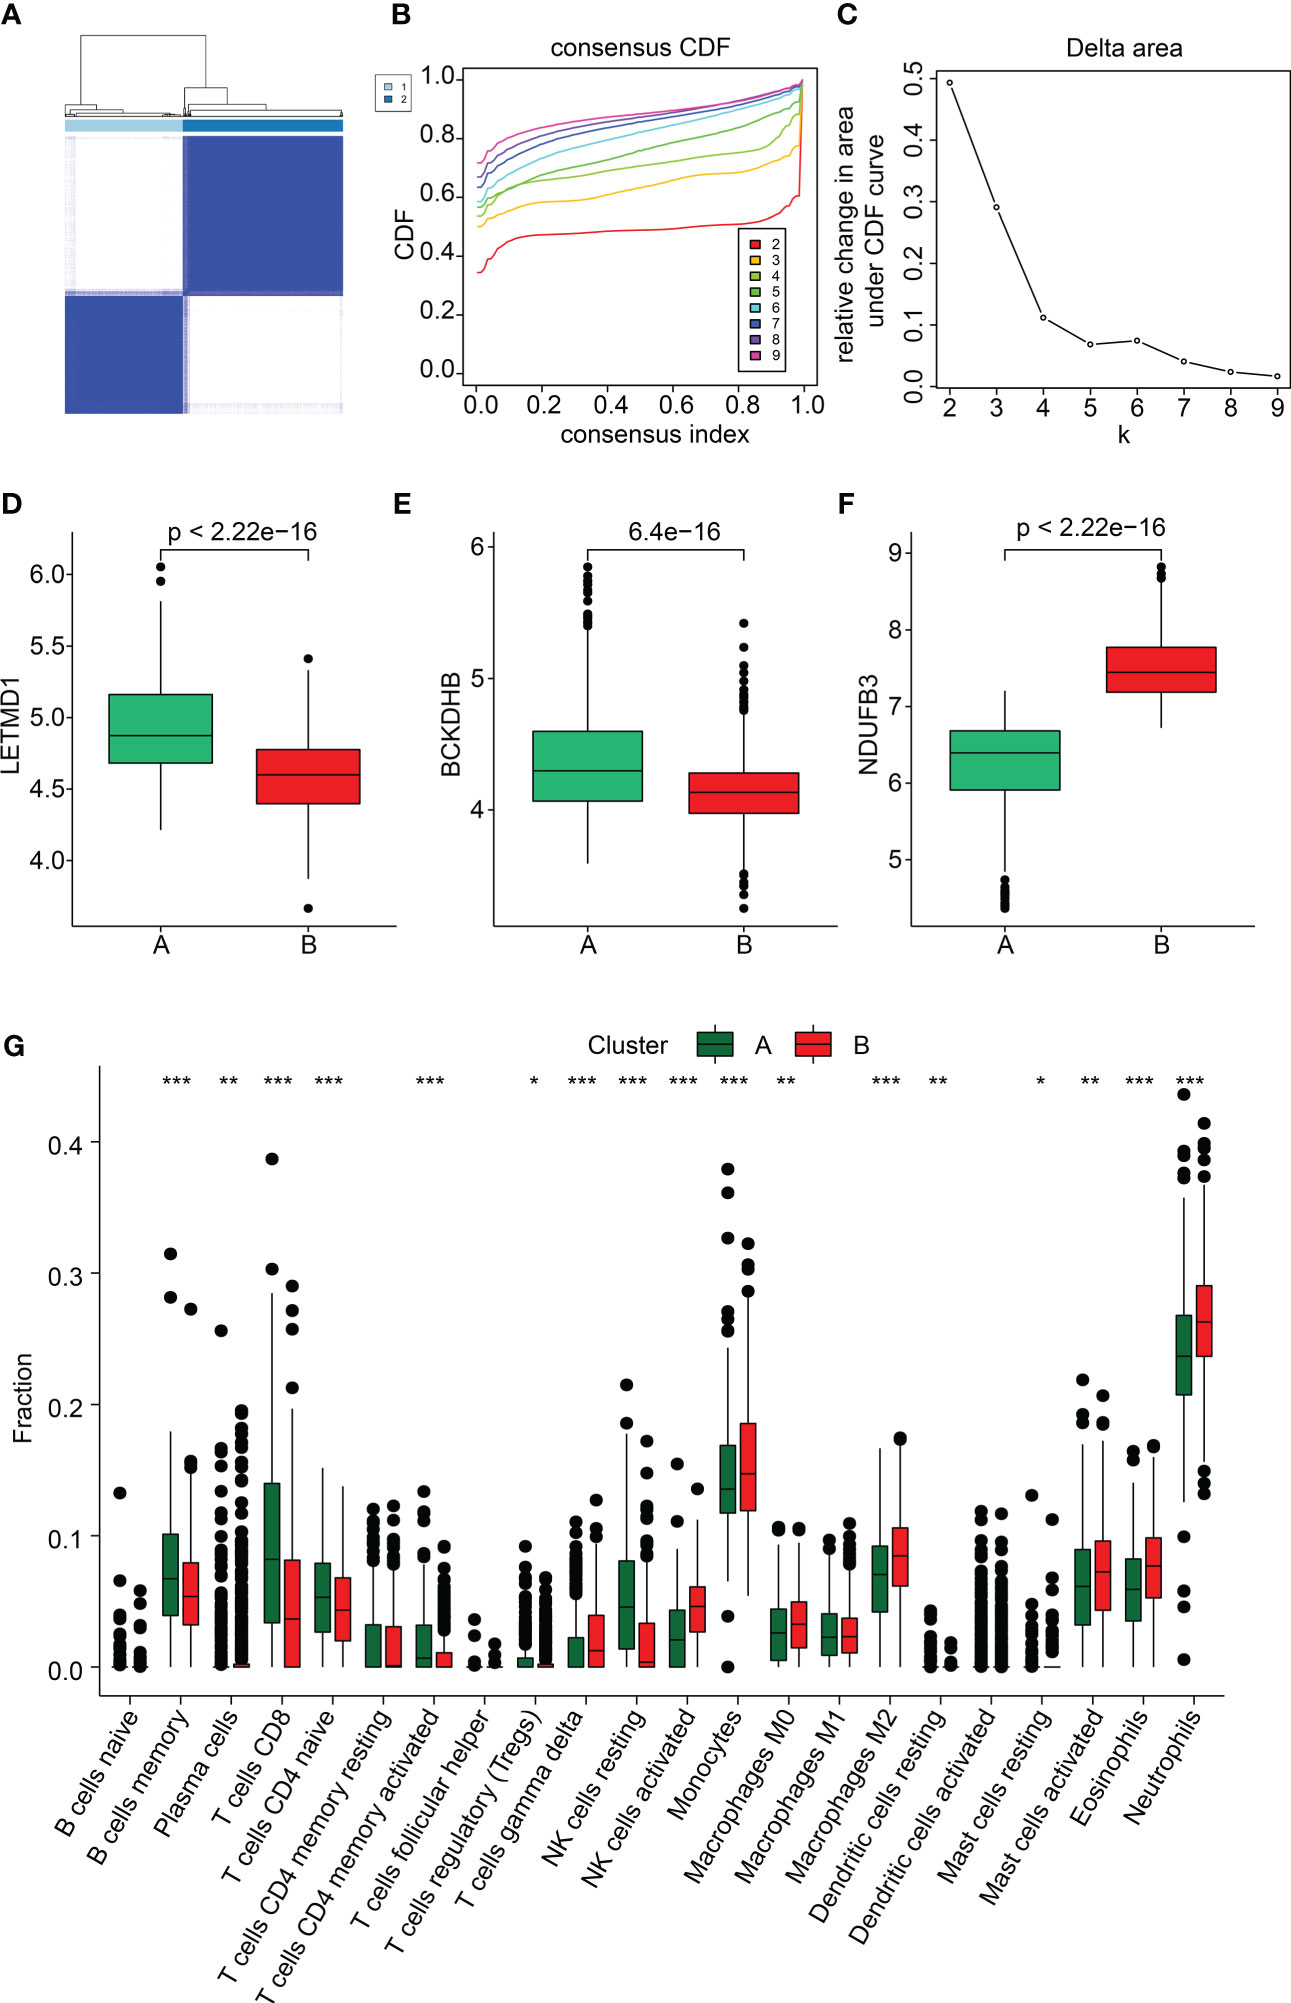
Figure 8 Subgroup analysis of SP samples based on three feature biomarkers. (A–C) Consensus clustering analysis. (D–F) The expression of BCKDHB and LETMD1, and NDUFB3 in both cluster subgroups. (G) Immune microenvironment analysis of subgroups. *p<0.05, **p<0.01, ***p<0.001.
In order to further validate the expressions of 3 diagnostic biomarkers in sepsis, we collected the serum of 30 septic patients (SP) and 15 healthy controls (HC) for quantitative real-time PCR (qPCR). The results of qPCR showed that the expression of NDUFB3 was higher in sepsis, whereas the expression of LETMD1 and BCKDHB were lower in SP than in HC (Figure 9A). At the same time, the results of TEM showed that, as compared with the control group, the mitochondria ridge in sepsis was disordered, and broken with obvious vacuolar degeneration (Figure 9B).
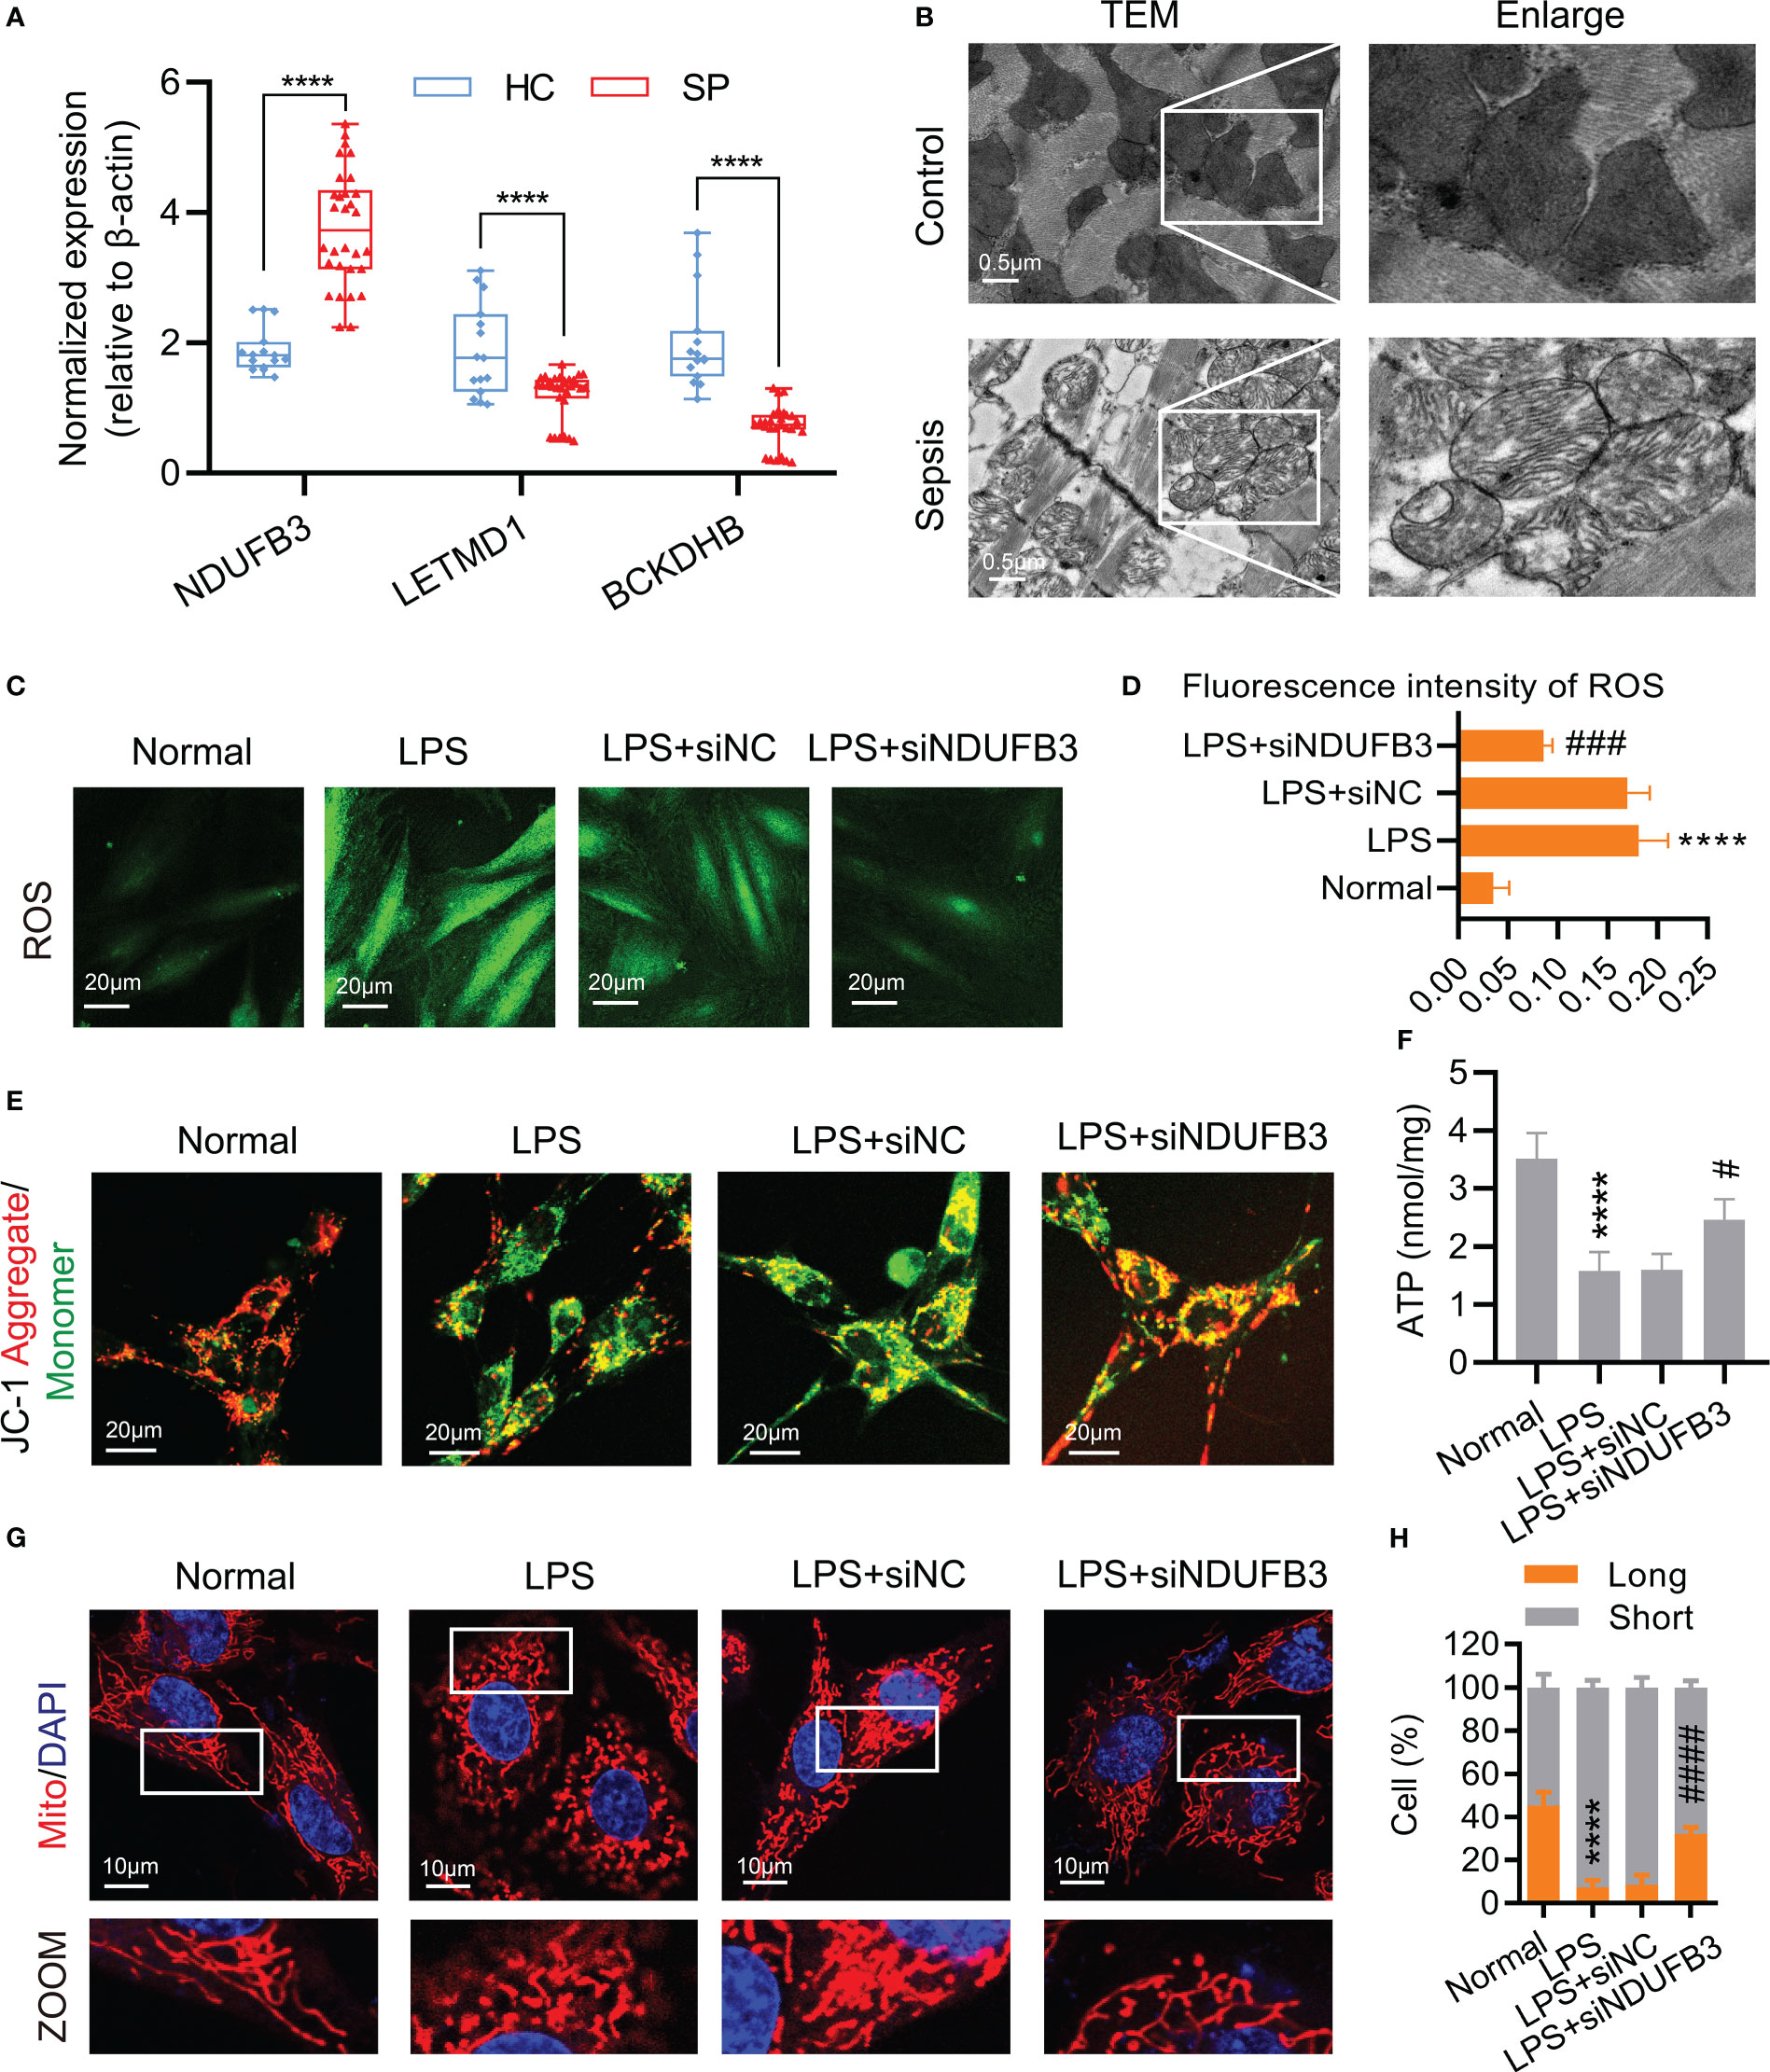
Figure 9 NDUFB3 inhibition attenuated mitochondrial quality imbalance after sepsis. (A) qPCR was conducted to examine the expression of NDUFB3, LETMD1 and BCKDHB in 30 SP and 15 HC samples. ****P< 0.0001 as compared with the SP group. (B) TEM images showed mitochondria cristae damage in heart tissues (bar = 0.5 μm) (n=3). (C) ROS staining immunofluorescence reflected the oxidative stress in H9C2 cells (bar = 20 μm) (n=3). (D) The fluorescence intensity of ROS. (E) JC-1 aggregate/monomer reflected the mitochondrial membrane potential in H9C2 cells (bar = 20 μm) (n=3). (F) The concentration of ATP (n=3). (G) Representative images of mitochondrial morphology in H9C2 cells (bar = 10 μm) (n=3). (H) Ratio (long/short) of mitochondria (long (> 8 µm) and short ≤ 8 µm) was quantified by ImageJ. ****P< 0.01 as compared with the normal group, #P< 0.05 as compared with the LPS group, ###P< 0.001 as compared with the LPS group, ####P< 0.0001 as compared with the LPS group. all data are presented as the mean ± SD.
We further explored the possible roles of DE-MiRGs dysregulation on mitochondrial function in sepsis. As the highest AUC among the three diagnostic biomarkers, we mainly focused on the role of NDUFB3. H9C2 cells were stimulated with LPS to mimic the in vitro sepsis model (25). The fluorescence intensity of ROS (Figures 9C, D) was significantly increased, indicating that oxidative stress occurred in the LPS group. The mitochondrial membrane potential and ATP reduced in H9C2 cells represented the dysfunction of mitochondria (Figures 9E, F). The mitochondrial morphology of H9C2 cells was significantly fragmented, confirming the existence of mitochondrial damage after sepsis (Figures 9G, H). Negative control (siNC) could not improve the mitochondrial function and morphology of H9C2 cells after being treated with LPS (Figures 9C–H). NDUFB3 inhibition by siNDUFB3 (Supplementary Figure 2) could significantly attenuate mitochondrial dysfunctions of H9C2 cells, showing a decreased ROS level, increased mitochondrial membrane potential and ATP (Figures 9C–F). Besides, NDUFB3 inhibition by siNDUFB3 could significantly improve mitochondrial morphology in LPS-treated H9C2 cells (Figures 9G, H). Overall, our results suggested that NDUFB3 is highly expressed in sepsis and plays a vital role in the mitochondrial quality imbalance in LPS -treated H9C2 cells.
Sepsis is a potentially life-threatening condition caused by the spread of bacteria or toxins in the bloodstream. Mitochondria, the powerhouses of the cell, play a crucial role in the immune response to sepsis by releasing signals that initiate an inflammatory response and energy production to fight the infection (9). However, mitochondrial dysfunction can exacerbate the severity of septicemia and increase the risk of mortality. In this study, we found the mitochondria ridge in sepsis patients was disordered, broken with obvious vacuolar degeneration by confocal microscope. In vitro experiments subsequently confirmed the existence of mitochondrial damage in sepsis. Mitochonria have been proposed as a key players in the pathogenesis of sepsis. Ultra-structural aterations of mitochondria have been found in animal species (26). Changes in mitochondrial morphology, such as fragmentation and swelling, have been observed in septic patients (27). This evidence is in line with the report that increased mitochondrial respiration and ATP synthesis can reduce oxidative stress, overcome metabolic paralysis, regenerate tissues, organs and innate and adaptive immune cells, which makes sepsis better survival (28). Some drugs targeting mitochondrial are being developed. Some known effective drugs have also been proven to work partially through mitochondrial-related pathways (29). This fact indicates MiRGs could function as therapeutic targets for sepsis patients.
We screened out three MiRGs and verified them again with our specimens. So far, there have been no in-depth studies on sepsis with these three genes. NDUFB3 (NADH dehydrogenase (ubiquinone) 1 beta subcomplex, 3) is an important subunit of mitochondrial respiratory complex I. Our data showed NDUFB3 played an important role in the process of mitochondrial mass imbalance in the simulated sepsis model treated with LPS. However, seldom evidence could be found concerning its functions in sepsis progression. The expression changes of NDUFB3 lead to the production of mitochondrial reactive oxygen species (mtROS) (30). The roles of mtROS in sepsis are twofold. On the one hand, mtROS can be used as bactericidal weapon during infection. However, mtROS levels are essential to induce an effective immune response within a controlled range. When mitochondrial damage occurs, overproduction of mtROS can lead to persistent inflammation, leading to pathologic outcomes such as sepsis (31).
Reports about BCKDHB have focused on its effect on maple syrup urine disease (MSUD). BCKDHB gene is one of the main catalytic subunits of branched ketoate dehydrogenase (BCKDH) in mitochondria. Together with BCKDHA, it forms a branched α-ketoate dehydrogenase E1 complex, which can decompose branched amino acids (32). Increased branched-chain amino acid concentrations were found in a variety of insulin-deficient and resistant states. The mechanism of BCKDH is not fully understood, and the decreased activity of BCKDH may be an important cause (33). Sepsis is associated with hypermetabolism. If the hypermetabolic state persists, life-threatening multisystem organ failure may occur (34). In this case, branched-chain amino acids are important energy substrates for muscles (35, 36). Insulin resistance and inflammation-related metabolic changes in the Sepsis process may be related to branched-chain amino acid metabolism involved in BCKDHB (34). Protein 1 of the LETM1 domain (LETMD1), also known as HCCR-1, is a mitochondrial protein. Limited studies have shown that LETMD1 is essential for the mitochondrial structure and thermogenic function of brown fat cells (37). LETMD1 selectively regulates reactive oxygen generation and NF-κB activation in macrophages through MyD88, thus regulating phagocytosis and inflammatory response to lipopolysaccharide (38). Inflammatory reactions of lipopolysaccharide trigger the secretion of pro-inflammatory cytokines and other biological processes through initiating signal cascades, thus becoming an extremely important link in the process of sepsis and development, and a potential therapeutic target (39, 40).
The correlation analysis of immune cell infiltration suggests the existence of immunosuppressive and depleted microenvironments in sepsis patients. In addition, after dividing sepsis patients into two groups using consensus clustering, we observed the effect of MiRGs on the immune microenvironment of patients with Sepsis. The effect of MiRGs on immune infiltration in other diseases has been reported (41–43). We have observed that DE-MiRG screened in sepsis is associated with neutrophil immune infiltration. Compared with the control group, the levels of neutrophils in patients with sepsis were significantly higher. Neutrophils control the infection by migrating to the inflamed site and exercising their lethal role against the pathogen. In sepsis, neutrophil migration and killing capacity are decreased, resulting in an insufficient response to infections and easy collateral damage to surrounding tissues due to the decline in precision (44). In addition, increased levels of neutrophils in sepsis patients often lead to a number of harmful functions. First, the accumulation of activated neutrophils blocks the capillary lumen, leading to ischemia (45). Secondly, neutrophils that migrate to vital organs can locally release pro-inflammatory and lytic factors that cause local tissue damage (46). As a double-edged sword in the progression of sepsis, the relationship between high neutrophil levels in patients with sepsis and prognosis needs to be further investigated. The consensus clustering further indicated the correlation of these three mitochondria-related hub genes with a high level of neutrophils in sepsis. With increasing evidence that neutrophils may be a promising therapeutic target for sepsis treatment (47), the possibility of MiRGs as therapeutic targets needs to be further explored.
Our data also showed high levels of eosinophils in patients with sepsis and significant differences in eosinophil expression among MiRGs subgroups of sepsis patients. This is consistent with the previously reported conclusion that there is a positive association between increased eosinophilic counts and sepsis compared with non-septic trauma patients admitted to the ICU (48). Currently, there is no consensus on the role of eosinophils in sepsis. Low levels of peripheral eosinophil activity have been reported to be associated with poor survival in sepsis (49). One explanation is that the type 2 immune response is related to eosinophilia. It can balance the pro-inflammatory response of sepsis due to type 1 immune response disorder. Thus, the lack of eosinophils may be a manifestation of an immune imbalance and may thus trigger the secretion of pro-inflammatory cytokines, leading to poorer outcomes (49). In addition, when stimulated by bacterial lipopolysaccharide, eosinophils, can release mtDNA and form extracellular structures with granular proteins that can bind to and kill bacteria, thus contributing to antibacterial defense (50). In general, studies on sepsis, MiRG and the interaction with eosinophils are superficial and need further investigation.
In summary, we identified three MiRGs (BCKDHB, LETMD1, and NDUFB3) by the machine learning algorithm. Subsequently, the role of these hub genes in immune cell infiltration was studied to further understand the immune mechanism in the pathogenesis of sepsis. Differences in the immune micro-environment between subgroups of patients with sepsis provide innovative insights into personalized immunotherapy for sepsis. By qPCR, the high expression of NDUFB3 in sepsis was verified by our clinical specimens. In vitro experiments showed NDUFB3 plays an important role in the process of mitochondrial mass imbalance in the LPS-simulated sepsis model. This study provides new ideas and targets for the intervention and treatment of sepsis. Although we provide risk stratification and potential intervention targets by expanding the pool of sepsis biomarkers including NDUFB3, the scope of application of a single biomarker is limited due to the complexity of sepsis etiology (51). In the future, combined with other studies, the sepsis risk stratification marker pool will be further expanded. Gene array analysis will help reduce the bias of gene selection, in order to accurately evaluate different sepsis subtypes, stages of disease progression and treatment intensity selection (52, 53). There are for sure shortcomings in this study. We have not been able to conduct further experimental verification of the molecular mechanism of NDUFB3 caused mitochondrial mass imbalance. The immune infiltration results were a correlation rather than a more accurate causal analysis. Further in-depth explorations about the role of MiRGs could be done in the future.
The datasets presented in this study can be found in online repositories. The names of the repository/repositories and accession number(s) can be found in the article/Supplementary Material.
This study protocol was approved by the Ethics Committee of the Army Medical University and was registered by the Chinese Clinical Trial Registry (ChiCTR2200055772). The patients/participants provided their written informed consent to participate in this study.
JZ, LZ and XC contributed the data collection and data analysis. QS and HS conceived the original ideas and composed this manuscript. LF contributed the table and figures of this manuscript. QS and HS contributed equally to this article and all authors contributed to the article and approved the submitted version.
The authors declare that the research was conducted in the absence of any commercial or financial relationships that could be construed as a potential conflict of interest.
All claims expressed in this article are solely those of the authors and do not necessarily represent those of their affiliated organizations, or those of the publisher, the editors and the reviewers. Any product that may be evaluated in this article, or claim that may be made by its manufacturer, is not guaranteed or endorsed by the publisher.
The Supplementary Material for this article can be found online at: https://www.frontiersin.org/articles/10.3389/fimmu.2023.1184126/full#supplementary-material
1. Fleischmann C, Scherag A, Adhikari NK, Hartog CS, Tsaganos T, Schlattmann P, et al. Assessment of global incidence and mortality of hospital-treated sepsis. current estimates and limitations. Am J Respir Crit Care Med (2016) 193(3):259–72. doi: 10.1164/rccm.201504-0781OC
2. Kahn JM, Le T, Angus DC, Cox CE, Hough CL, White DB, et al. The epidemiology of chronic critical illness in the united states*. Crit Care Med (2015) 43(2):282–7. doi: 10.1097/CCM.0000000000000710
3. Rudd KE, Johnson SC, Agesa KM, Shackelford KA, Tsoi D, Kievlan DR, et al. Global, regional, and national sepsis incidence and mortality, 1990-2017: analysis for the global burden of disease study. Lancet (2020) 395(10219):200–11. doi: 10.1016/S0140-6736(19)32989-7
4. Pfeiffer C, Bach M, Bauer T, Campos da Ponte J, Schomig E, Grundemann D, et al. Knockout of the ergothioneine transporter ETT in zebrafish results in increased 8-oxoguanine levels. Free Radic Biol Med (2015) 83:178–85. doi: 10.1016/j.freeradbiomed.2015.02.026
5. Papanicolas I, Orav EJ, Jha AK. Is mortality readmissions bias a concern for readmission rates under the hospital readmissions reduction program? Health Serv Res (2020) 55(2):249–58. doi: 10.1111/1475-6773.13268
6. Wu Y, Zhang L, He S, Guan B, He A, Yang K, et al. Identification of immune-related LncRNA for predicting prognosis and immunotherapeutic response in bladder cancer. Aging (Albany NY) (2020) 12(22):23306–25. doi: 10.18632/aging.104115
7. Csoka B, Nemeth ZH, Toro G, Idzko M, Zech A, Koscso B, et al. Extracellular ATP protects against sepsis through macrophage P2X7 purinergic receptors by enhancing intracellular bacterial killing. FASEB J (2015) 29(9):3626–37. doi: 10.1096/fj.15-272450
8. Csoka B, Nemeth ZH, Szabo I, Davies DL, Varga ZV, Paloczi J, et al. Macrophage P2X4 receptors augment bacterial killing and protect against sepsis. JCI Insight (2018) 3(11). doi: 10.1172/jci.insight.99431
9. Li S, Hu Q, Huang J, Wu X, Ren J. Mitochondria-derived damage-associated molecular patterns in sepsis: from bench to bedside. Oxid Med Cell Longev 2019 (2019) p:6914849. doi: 10.1155/2019/6914849
10. Konecna B, Park J, Kwon WY, Vlkova B, Zhang Q, Huang W, et al. Monocyte exocytosis of mitochondrial danger-associated molecular patterns in sepsis suppresses neutrophil chemotaxis. J Trauma Acute Care Surg (2021) 90(1):46–53. doi: 10.1097/TA.0000000000002973
11. Weinberg SE, Sena LA, Chandel NS. Mitochondria in the regulation of innate and adaptive immunity. Immunity (2015) 42(3):406–17. doi: 10.1016/j.immuni.2015.02.002
12. Harrington JS, Choi AMK, Nakahira K. Mitochondrial DNA in sepsis. Curr Opin Crit Care (2017) 23(4):284–90. doi: 10.1097/MCC.0000000000000427
13. van der Slikke EC, Star BS, van Meurs M, Henning RH, Moser J, Bouma HR, et al. Sepsis is associated with mitochondrial DNA damage and a reduced mitochondrial mass in the kidney of patients with sepsis-AKI. Crit Care (2021) 25(1):36. doi: 10.1186/s13054-020-03424-1
14. Itagaki K, Rica I, Konecna B, Kim HI, Park J, Kaczmarek E, et al. Role of mitochondria-derived danger signals released after injury in systemic inflammation and sepsis. Antioxid Redox Signal (2021) 35(15):1273–90. doi: 10.1089/ars.2021.0052
15. Lam NY, Rainer TH, Chiu RW, Joynt GM, Lo YM. Plasma mitochondrial DNA concentrations after trauma. Clin Chem (2004) 50(1):213–6. doi: 10.1373/clinchem.2003.025783
16. Zhang Q, Raoof M, Chen Y, Sumi Y, Sursal T, Junger W, et al. Circulating mitochondrial DAMPs cause inflammatory responses to injury. Nature (2010) 464(7285):104–7. doi: 10.1038/nature08780
17. Simmons JD, Lee YL, Mulekar S, Kuck JL, Brevard SB, Gonzalez RP, et al. Elevated levels of plasma mitochondrial DNA DAMPs are linked to clinical outcome in severely injured human subjects. Ann Surg (2013) 258(4):591–6; discussion 596-8. doi: 10.1097/SLA.0b013e3182a4ea46
18. Schneck E, Edinger F, Hecker M, Sommer N, Pak O, Weissmann N, et al. Blood levels of free-circulating mitochondrial DNA in septic shock and postsurgical systemic inflammation and its influence on coagulation: a secondary analysis of a prospective observational study. J Clin Med (2020) 9(7). doi: 10.3390/jcm9072056
19. Yamanouchi S, Kudo D, Yamada M, Miyagawa N, Furukawa H, Kushimoto S, et al. Plasma mitochondrial DNA levels in patients with trauma and severe sepsis: time course and the association with clinical status. J Crit Care (2013) 28(6):1027–31. doi: 10.1016/j.jcrc.2013.05.006
20. Gu X, Yao Y, Wu G, Lv T, Luo L, Song Y, et al. The plasma mitochondrial DNA is an independent predictor for post-traumatic systemic inflammatory response syndrome. PloS One (2013) 8(8):e72834. doi: 10.1371/journal.pone.0072834
21. Kung CT, Hsiao SY, Tsai TC, Su CM, Chang WN, Huang CR, et al. Plasma nuclear and mitochondrial DNA levels as predictors of outcome in severe sepsis patients in the emergency room. J Transl Med (2012) 10:130. doi: 10.1186/1479-5876-10-130
22. Yu G, Wang LG, Han Y, He QY. clusterProfiler: an r package for comparing biological themes among gene clusters. OMICS (2012) 16(5):284–7. doi: 10.1089/omi.2011.0118
23. Zheng D, Zhang J, Zhang Z, Kuang L, Zhu Y, Wu Y, et al. Endothelial microvesicles induce pulmonary vascular leakage and lung injury during sepsis. Front Cell Dev Biol (2020) 8:643. doi: 10.3389/fcell.2020.00643
24. Zhao Z, He S, Yu X, Lai X, Tang S, Mariya ME, et al. Analysis and experimental validation of rheumatoid arthritis innate immunity gene CYFIP2 and pan-cancer. Front Immunol (2022) 13:954848. doi: 10.3389/fimmu.2022.954848
25. She H, Hu Y, Zhou Y, Tan L, Zhu Y, Ma C, et al. Protective effects of dexmedetomidine on sepsis-induced vascular leakage by alleviating ferroptosis via regulating metabolic reprogramming. J Inflammation Res (2021) 14:6765–82. doi: 10.2147/JIR.S340420
26. Marik PE. Hydrocortisone, ascorbic acid and thiamine (HAT therapy) for the treatment of sepsis. focus on ascorbic acid. Nutrients (2018) 10(11). doi: 10.3390/nu10111762
27. Kozlov AV, Lancaster JR Jr, Meszaros AT, Weidinger A. Mitochondria-meditated pathways of organ failure upon inflammation. Redox Biol (2017) 13:170–81. doi: 10.1016/j.redox.2017.05.017
28. McCall CE, Zhu X, Zabalawi M, Long D, Quinn MA, Yoza BK, et al. Sepsis, pyruvate, and mitochondria energy supply chain shortage. J Leukoc Biol (2022) 112(6):1509–14. doi: 10.1002/JLB.3MR0322-692RR
29. Zeng Z, Huang Q, Mao L, Wu J, An S, Chen Z, et al. The pyruvate dehydrogenase complex in sepsis: metabolic regulation and targeted therapy. Front Nutr (2021) 8:783164. doi: 10.3389/fnut.2021.783164
30. Chung IC, Chen LC, Tsang NM, Chuang WY, Liao TC, Yuan SN, et al. Mitochondrial oxidative phosphorylation complex regulates NLRP3 inflammasome activation and predicts patient survival in nasopharyngeal carcinoma. Mol Cell Proteomics (2020) 19(1):142–54. doi: 10.1074/mcp.RA119.001808
31. Silwal P, Kim JK, Kim YJ, Jo EK. Mitochondrial reactive oxygen species: double-edged weapon in host defense and pathological inflammation during infection. Front Immunol (2020) 11:1649. doi: 10.3389/fimmu.2020.01649
32. Li H, Wang X, Rukina D, Huang Q, Lin T, Sorrentino V, et al. An integrated systems genetics and omics toolkit to probe gene function. Cell Syst (2018) 6(1):90–102.e4. doi: 10.1016/j.cels.2017.10.016
33. Kuzuya T, Katano Y, Nakano I, Hirooka Y, Itoh A, Ishigami M, et al. Regulation of branched-chain amino acid catabolism in rat models for spontaneous type 2 diabetes mellitus. Biochem Biophys Res Commun (2008) 373(1):94–8. doi: 10.1016/j.bbrc.2008.05.167
34. Holecek M. Branched-chain amino acids in health and disease: metabolism, alterations in blood plasma, and as supplements. Nutr Metab (Lond) (2018) 15:33. doi: 10.1186/s12986-018-0271-1
35. Holecek M. Leucine metabolism in fasted and tumor necrosis factor-treated rats. Clin Nutr (1996) 15(2):91–3. doi: 10.1016/S0261-5614(96)80028-8
36. Nawabi MD, Block KP, Chakrabarti MC, Buse MG. Administration of endotoxin, tumor necrosis factor, or interleukin 1 to rats activates skeletal muscle branched-chain alpha-keto acid dehydrogenase. J Clin Invest (1990) 85(1):256–63. doi: 10.1172/JCI114421
37. Snyder MM, Yue F, Zhang L, Shang R, Qiu J, Chen J, et al. LETMD1 is required for mitochondrial structure and thermogenic function of brown adipocytes. FASEB J (2021) 35(11):e21965. doi: 10.1096/fj.202100597R
38. Lim SG, Suk K, Lee WH. LETMD1 regulates phagocytosis and inflammatory responses to lipopolysaccharide via reactive oxygen species generation and NF-kappaB activation in macrophages. J Immunol (2020) 204(5):1299–309. doi: 10.4049/jimmunol.1900551
39. Gabarin RS, Li M, Zimmel PA, Marshall JC, Li Y, Zhang H, et al. Intracellular and extracellular lipopolysaccharide signaling in sepsis: avenues for novel therapeutic strategies. J Innate Immun (2021) 13(6):323–32. doi: 10.1159/000515740
40. Pfalzgraff A, Weindl G. Intracellular lipopolysaccharide sensing as a potential therapeutic target for sepsis. Trends Pharmacol Sci (2019) 40(3):187–97. doi: 10.1016/j.tips.2019.01.001
41. Jiang N, Zhang X, Chen Q, Kantawong F, Wan S, Liu J, et al. Identification of a mitochondria-related gene signature to predict the prognosis in AML. Front Oncol (2022) 12:823831. doi: 10.3389/fonc.2022.823831
42. Su J, Li Y, Liu Q, Peng G, Qin C, Li Y, et al. Identification of SSBP1 as a ferroptosis-related biomarker of glioblastoma based on a novel mitochondria-related gene risk model and in vitro experiments. J Transl Med (2022) 20(1):440. doi: 10.1186/s12967-022-03657-4
43. Zheng D, Liu J, Xie L, Wang Y, Ding Y, Peng R, et al. Enzyme-instructed and mitochondria-targeting peptide self-assembly to efficiently induce immunogenic cell death. Acta Pharm Sin B (2022) 12(6):2740–50. doi: 10.1016/j.apsb.2021.07.005
44. Sonego F, Castanheira FV, Ferreira RG, Kanashiro A, Leite CA, Nascimento DC, et al. Paradoxical roles of the neutrophil in sepsis: protective and deleterious. Front Immunol (2016) 7:155. doi: 10.3389/fimmu.2016.00155
45. Hoesel LM, Neff TA, Neff SB, Younger JG, Olle EW, Gao H, et al. Harmful and protective roles of neutrophils in sepsis. Shock (2005) 24(1):40–7. doi: 10.1097/01.shk.0000170353.80318.d5
46. Brown KA, Brain SD, Pearson JD, Edgeworth JD, Lewis SM, Treacher DF, et al. Neutrophils in development of multiple organ failure in sepsis. Lancet (2006) 368(9530):157–69. doi: 10.1016/S0140-6736(06)69005-3
47. Shen X, Cao K, Zhao Y, Du J. Targeting neutrophils in sepsis: from mechanism to translation. Front Pharmacol (2021) 12:644270. doi: 10.3389/fphar.2021.644270
48. DiPiro JT, Howdieshell TR, Hamilton RG, Mansberger AR Jr. Immunoglobulin e and eosinophil counts are increased after sepsis in trauma patients. Crit Care Med (1998) 26(3):465–9. doi: 10.1097/00003246-199803000-00016
49. Al Duhailib Z, Farooqi M, Piticaru J, Alhazzani W, Nair P. The role of eosinophils in sepsis and acute respiratory distress syndrome: a scoping review. Can J Anaesth (2021) 68(5):715–26. doi: 10.1007/s12630-021-01920-8
50. Yousefi S, Gold JA, Andina N, Lee JJ, Kelly AM, Kozlowski E, et al. Catapult-like release of mitochondrial DNA by eosinophils contributes to antibacterial defense. Nat Med (2008) 14(9):949–53. doi: 10.1038/nm.1855
51. Villar J, Herran-Monge R, Gonzalez-Higueras E, Prieto-Gonzalez M, Ambros A, Rodriguez-Perez A, et al. Clinical and biological markers for predicting ARDS and outcome in septic patients. Sci Rep (2021) 11(1):22702. doi: 10.1038/s41598-021-02100-w
52. Maslove DM, Wong HR. Gene expression profiling in sepsis: timing, tissue, and translational considerations. Trends Mol Med (2014) 20(4):204–13. doi: 10.1016/j.molmed.2014.01.006
Keywords: mitochondria, sepsis, machine learning algorithm, immune cell infiltration, mito-chondrial quality imbalance
Citation: Shu Q, She H, Chen X, Zhong L, Zhu J and Fang L (2023) Identification and experimental validation of mitochondria-related genes biomarkers associated with immune infiltration for sepsis. Front. Immunol. 14:1184126. doi: 10.3389/fimmu.2023.1184126
Received: 11 March 2023; Accepted: 26 April 2023;
Published: 09 May 2023.
Edited by:
Chenyang Duan, Chongqing Medical University, ChinaReviewed by:
Jun Liu, Nanjing Medical University, ChinaCopyright © 2023 Shu, She, Chen, Zhong, Zhu and Fang. This is an open-access article distributed under the terms of the Creative Commons Attribution License (CC BY). The use, distribution or reproduction in other forums is permitted, provided the original author(s) and the copyright owner(s) are credited and that the original publication in this journal is cited, in accordance with accepted academic practice. No use, distribution or reproduction is permitted which does not comply with these terms.
*Correspondence: Junfeng Zhu, emh1amZAempjYy5vcmcuY24=; Luo Fang, ZmFuZ2x1b0B6amNjLm9yZy5jbg==
†These authors have contributed equally to this work
Disclaimer: All claims expressed in this article are solely those of the authors and do not necessarily represent those of their affiliated organizations, or those of the publisher, the editors and the reviewers. Any product that may be evaluated in this article or claim that may be made by its manufacturer is not guaranteed or endorsed by the publisher.
Research integrity at Frontiers
Learn more about the work of our research integrity team to safeguard the quality of each article we publish.