 Qianqian Cheng
 Wei Wang†
 Jing Liu
 Yan Yang
- Department of Medical Oncology, The First Affiliated Hospital of Bengbu Medical College, Bengbu, China
Background: Membrane palmitoylated proteins (MPPs) are engaged in various biological processes, such as cell adhesion and cell polarity. Dysregulated MPP members have different effects on hepatocellular carcinoma (HCC) development. However, the role of MPP6 in HCC has been unknown.
Method: HCC transcriptome and clinical data from different public databases were downloaded and analyzed, and the results were further validated by qRT−PCR, Western blotting and immunohistochemistry (IHC) using HCC cell lines and tissues. The association between MPP6 and prognosis, potential pathogenic mechanisms, angiogenesis, immune evasion, tumor mutation burden (TMB) and treatment response in HCC patients was analyzed by bioinformatics and IHC staining.
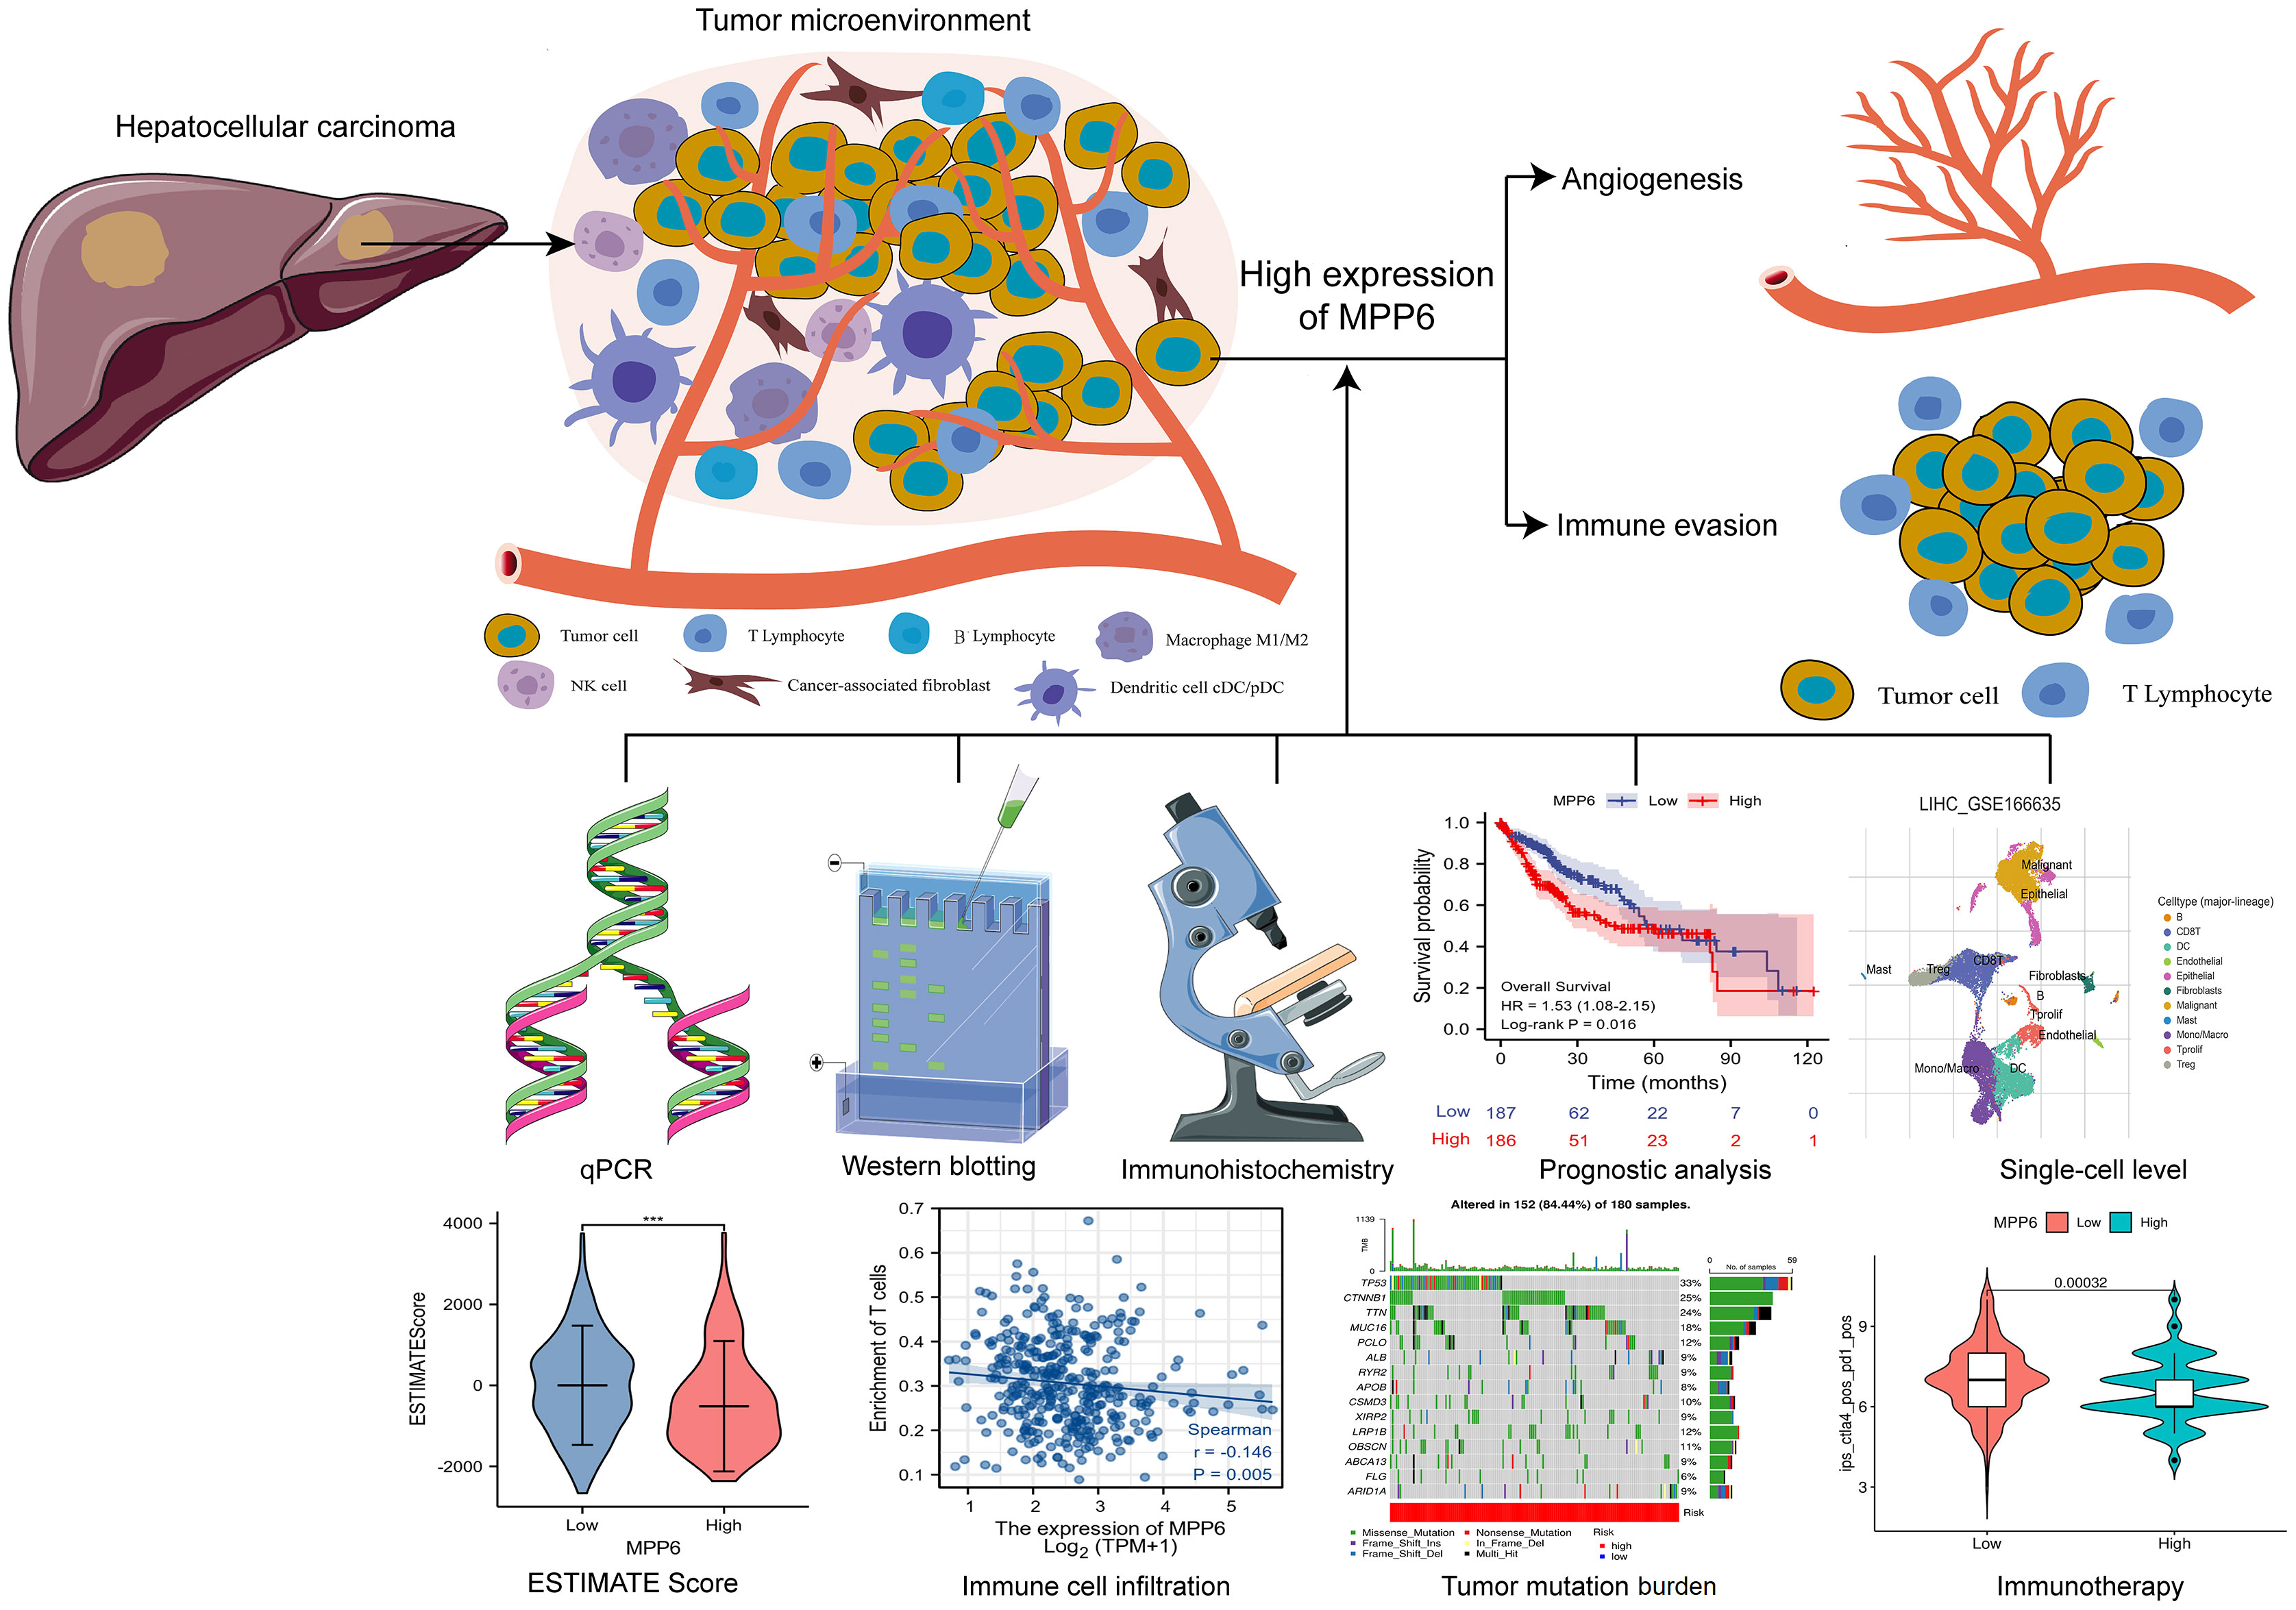
Results: MPP6 was significantly overexpressed in HCC, and its expression was related to T stage, pathologic stage, histologic grade and adverse prognosis in HCC patients. Gene set enrichment analysis revealed that differentially expressed genes were mainly enriched in the synthesis of genetic materials and the WNT signaling pathway. GEPIA database analysis and IHC staining suggested that MPP6 expression had a positive correlation with angiogenesis. Single-cell dataset analysis indicated that MPP6 was associated with features of the tumor microenvironment. Additional analyses discovered that MPP6 expression was inversely related to immune cell infiltration and was involved in tumor immune evasion. MPP6 expression was positively associated with TMB, and patients with high TMB had an adverse prognosis. Immunotherapy was more effective in HCC patients with low MPP6 expression, whereas those with high MPP6 expression responded better to sorafenib, gemcitabine, 5-FU, and doxorubicin.
Conclusions: Elevated MPP6 expression is associated with an unfavorable prognosis, angiogenesis and immune evasion in HCC. Moreover, MPP6 has the potential to be used to assess TMB and treatment response. Therefore, MPP6 might serve as a novel prognostic biomarker and therapeutic target for HCC.
Graphical Abstract
1 Introduction
Primary liver cancer (PLC) is one of the most prevalent malignancies worldwide (1–3). Hepatocellular carcinoma (HCC) accounts for approximately 85%-90% of PLC cases. Early diagnosis and treatment of HCC is ideal; however, many HCC patients are diagnosed at advanced stages, at which point the survival is unfavorable. Currently, the mechanism of HCC pathogenesis is unclear; hence, it is crucial to explore HCC pathological mechanisms and to recognize biomarkers that affect HCC initiation, progression and prognosis.
Membrane palmitoylated proteins (MPPs), which are mainly located at cell−cell junctions and include MPP1-MPP7, constitute an important subfamily of membrane-associated guanylate kinases (MAGUKs). MPPs can engage in various biological processes, such as cell adhesion, and cell polarity regulation (4–6), and abnormalities in MPPs functions may lead to malignant cell transformation and mediate tumor invasion and metastasis (7, 8). Although there have been great achievements in MPPs research over the years, the role of MPPs in malignant tumors is not completely understood (9–12). Li et al. (10) found that the upregulation of MPP2 promoted apoptosis and suppressed the spreading of HCC cells. However, MPP3 had increased expression in HCC tissues, which facilitated HCC cell migration and invasion and was related to unfavorable survival in a study (11). Above studies indicate that MPP members may have different effects on HCC development. MPP6 has been identified as an exosome-related RNA-binding protein (13) and has been demonstrated to inhibit ovarian cancer progression and prolong survival in ovarian cancer patients (12); however, the role of MPP6 in HCC has been unknown. This study explored MPP6 expression in HCC based on multiple databases and basic research and further assessed the correlations between MPP6 expression and prognosis, potential pathogenic mechanisms, angiogenesis, immune evasion, tumor mutation burden (TMB) and treatment response in HCC patients, aiming to provide a new potential prognostic biomarker and therapeutic target for HCC.
2 Materials and methods
2.1 Data collection
HCC transcriptome and clinical data were downloaded from The Cancer Genome Atlas (TCGA) database (14) (https://portal.gdc.cancer.gov/) with assessment date in September 2022, and the analyses results were verified by Japan data released in International Cancer Genome Consortium (ICGC) database (15) (https://dcc.icgc.org/). GSE112791 (GPL570 platform) and GSE101685 datasets was selected from the Gene Expression Omnibus (GEO) database (16) (http://www.ncbi.nlm.nih.gov/geo/), and none of the selected tissue samples had treatment scenarios. Differential expression of MPP6 mRNA in normal liver and HCC tissues were compared by the GEO2R online tool (17). R software was applied for integrating, analyzing and visualizing the data. Excel-VLOOKUP was employed to match and combine data.
2.2 Cell lines and cell culture
The human normal hepatic cell line LO2 was provided by Nanjing KeyGen Biotech. Co., Ltd. (Nanjing, China), and HCC cell lines (Huh7, Hep3B, BEL-7404 and SMMC-7721) were obtained from the Chinese Academy of Sciences (Shanghai, China). These cells were grown at 37°C in 5% CO2 in DMEM (Gibco, CA, USA) or RPMI 1640 medium (Gibco, CA, USA) containing 10% fetal bovine serum (Gibco, CA, USA).
2.3 qRT−PCR
TRIzol reagent (Invitrogen, CA, USA) was utilized to extract the entire RNA, and cDNA was generated using AMV reverse transcriptase (Promega, Wisconsin, USA). cDNA was amplified with RR820A SYBR® Premix Ex Taq™ II (Tli RNaseH Plus) (TaKaRa, Osaka, Japan) and a 7500 Fast Real-Time PCR System (Applied Biosystems, MD, USA). The above operations were carried out according to their instructions. The procedures for PCR quantification were performed as previously described (18, 19). Internal reference was the GAPDH gene. The primers were listed in Supplementary Table 1.
2.4 Western blotting
The protocols for protein extraction were from the above HCC cell lines and the subsequent processes were mentioned in our previous work (18, 19). The following primary antibodies and concentrations were utilized: MPP6 (1:4000; Proteintech, Wuhan, China) and GAPDH (1:10000; Proteintech, Wuhan, China). The GAPDH gene was employed to standardize gene and protein expression.
2.5 Clinical sample collection
Twenty pairs of human HCC and matched adjacent noncancerous tissue samples were obtained at the time of surgery between May 2022 and November 2022 at our institution. None of the HCC patients had systemic antitumor treatment before surgery.
Our institution’s Ethics Committee authorized this research.
2.6 Immunohistochemistry (IHC) staining
Rabbit anti-human MPP6, VEGFA and VEGFR2 polyclonal antibodies were provided from Proteintech (Wuhan, China), and anti-CD34 monoclonal antibody, anti-CD3+/CD4+/CD8+ T-cell monoclonal antibodies, secondary antibodies, and SP kits were purchased from Fuzhou Maishin Biotechnology (Fuzhou, China). These tissues were routinely dewaxed, hydrated, subjected to antigen repair with citrate buffer solution, and then assessed. All operating procedures strictly adhered to kit instructions. The MPP6, VEGFA and VEGFR2 primary antibody dilation ratio was 1:200, and anti-CD34 monoclonal antibody and anti-CD3+/CD4+/CD8+ T-cell monoclonal antibodies were ready-to-use antibodies. According to the positive signal, staining intensity was classified by unstained as negative, light yellow as (+), yellowish-brown as (++) and brown as (+++). Samples with MPP6 staining intensities of (+) and (+++) were chosen for VEGFA, VEGFR2 and CD34 staining to observe angiogenesis and CD3+/CD4+/CD8+ T-cell staining to evaluate immune cell distribution.
2.7 Analysis of MPP6 expression and correlation with clinicopathological characteristics of HCC patients
MPP6 expression in normal liver and HCC tissues was compared utilizing the R package “limma” in XIANTAO Academic (20) (https://www.xiantao.love/products) and the UALCAN website (21) (http://ualcan.path.uab.edu/). HCC samples were divided into high and low MPP6 expression groups according to the median MPP6 expression, and clinicopathological characteristics of HCC patients in different MPP6 expression groups were evaluated by the R packages “ComplexHeatmap” and “ggpubr” in XIANTAO Academic.
2.8 Prognostic analysis of MPP6 in HCC
The value of MPP6 in predicting HCC patient survival was analyzed utilizing the log-rank test and Cox regression model based on the TCGA and ICGC (Japan cohort) databases.
2.9 Differentially expressed gene (DEG) enrichment analysis
The R package “DESeq2” was utilized to screen DEGs of high and low MPP6 expression groups in TCGA database, and defined a subset of significantly DEGs according to |logFC|>1.5 and adjusted P<0.05 for GO analysis, which was performed by the Metascape online database (22) (https://metascape.org/gp/index.html#/main/step1). Gene set enrichment analysis (GSEA) in high and low MPP6 expression groups was conducted by the R package “clusterProfiler” with the reference dataset from the MSigDB website (23) (https://www.gsea-msigdb.org/gsea/msigdb/index.jsp), and significant enrichment was defined as FDR<0.25, adjusted P<0.05, and normalized enrichment score (NSE) >1.
2.10 Correlation analysis of MPP6 and angiogenesis
The CAMOIP online database (24) (http://www.camoip.net/) was used to investigate the connection between MPP6 and angiogenesis. The correlation between the expression of MPP6 and angiogenesis-related factors (VEGFA, VEGFR2 and CD34) was assessed by the GEPIA website (25) (http://gepia.cancer-pku.cn/) and validated by IHC staining in the study cohort.
2.11 Correlation between MPP6 and the tumor microenvironment (TME)
The TISCH open access tool (26) (http://tisch.comp-genomics.org) was applied to assess the link between MPP6 and TME features at the single-cell level, with screening parameters of Cell-type annotation: Cell type (major-lineage); Cancer type: LIHC (Liver Hepatocellular Carcinoma); Cell type included in datasets: No parameter set; Lineage for calculating correlation: All lineage; Treatment: No treatment; Primary/Metastatic: Primary. The “estimateScore” algorithm was employed to figure out the stromal score, immune score, ESTIMATE score, and tumor purity for all HCC samples, and these values across were compared among different MPP6 expression groups. In addition, this study also examined the connection between the expression of MPP6 and immune checkpoint genes.
Single-sample GSEA (ssGSEA) was carried out utilizing the R package “GSVA” to compare immune cell infiltration among different MPP6 expression groups; the immune cell score for each HCC sample was determined to assess the association between MPP6 and immune cell infiltration.
2.12 TMB analysis
TMB data was downloaded in TCGA database, and the R package “maftools” was applied to evaluate nucleotide compilation data, evaluate TMB for HCC patients with different MPP6 expression levels, and examine how TMB affects HCC patient survival. HCC samples were divided into high and low TMB groups according to the optimal cutoff value of TMB. Considering that the high and low TMB groups both contained high (representing high risk) and low (representing low risk) MPP6 expression samples, thus HCC samples could be divided into four groups: H-TMB+ high risk, H-TMB+ low risk, L-TMB+ high risk, and L-TMB+ low risk. The survival of HCC patients from these four groups were compared.
2.13 Comparison of treatment response under different expression levels of MPP6
Using the R package “pRRophetic”, we calculated and compared the half-maximal inhibitory concentration (IC50) values of several medications in HCC patients with different MPP6 expression levels. We acquired the immunophenotype score (IPS) data of HCC samples from the TCIA online database (27) (https://www.cancerimagingarchive.net/), with screening parameters: TCGA; LIHC; All genders; All stages; All T stages; All N stages; All M stages; All immune response, and evaluated the efficacy of immunotherapy based on IPS. IPS predicts patients’ response to immunotherapy based on immunogenicity, and it is widely assumed that high IPS indicates superior efficacy of immune checkpoint inhibitors (28).
2.14 Statistical analysis
R software (version 3.6.3) and GraphPad Prism 8.0 were employed to analyze data. A t test, or Wilcoxon test was applied to compare two independent groups. The Kruskal-Wallis test or ANOVA test was conducted to examine over two groups. The χ2 test was utilized to compare rates or percentages. Log-rank tests and Cox regression models were employed to survival analysis, and Pearson and Spearman correlation analyses were used for continuous factors and hierarchical factors, respectively. P<0.05 was deemed statistically significant.
3 Results
3.1 MPP6 expression in HCC
In the TCGA database, MPP6 mRNA was markedly overexpressed in various malignant tumor tissues, including HCC tissues (P < 0.05, Figure 1A). GSE112791 and GSE101685 datasets analyses also revealed increased MPP6 mRNA expression in HCC tissues (all P < 0.001, Figures 1B, C). qRT−PCR further verified that MPP6 mRNA was expressed at higher levels in HCC cell lines such as Huh7, Hep3B, BEL-7404 and SMMC-7721 than in the normal liver cell line LO2 (all P < 0.05, Figure 1D). At the protein level, MPP6 expression was notably higher in HCC tissues than in normal liver tissues from the CPTAC online database (21) (P<0.05, Figure 1E), and this result was confirmed in HCC cell lines and tissues by Western blotting (all P<0.05, Figure 1F) and IHC staining (Figure 1G), respectively.
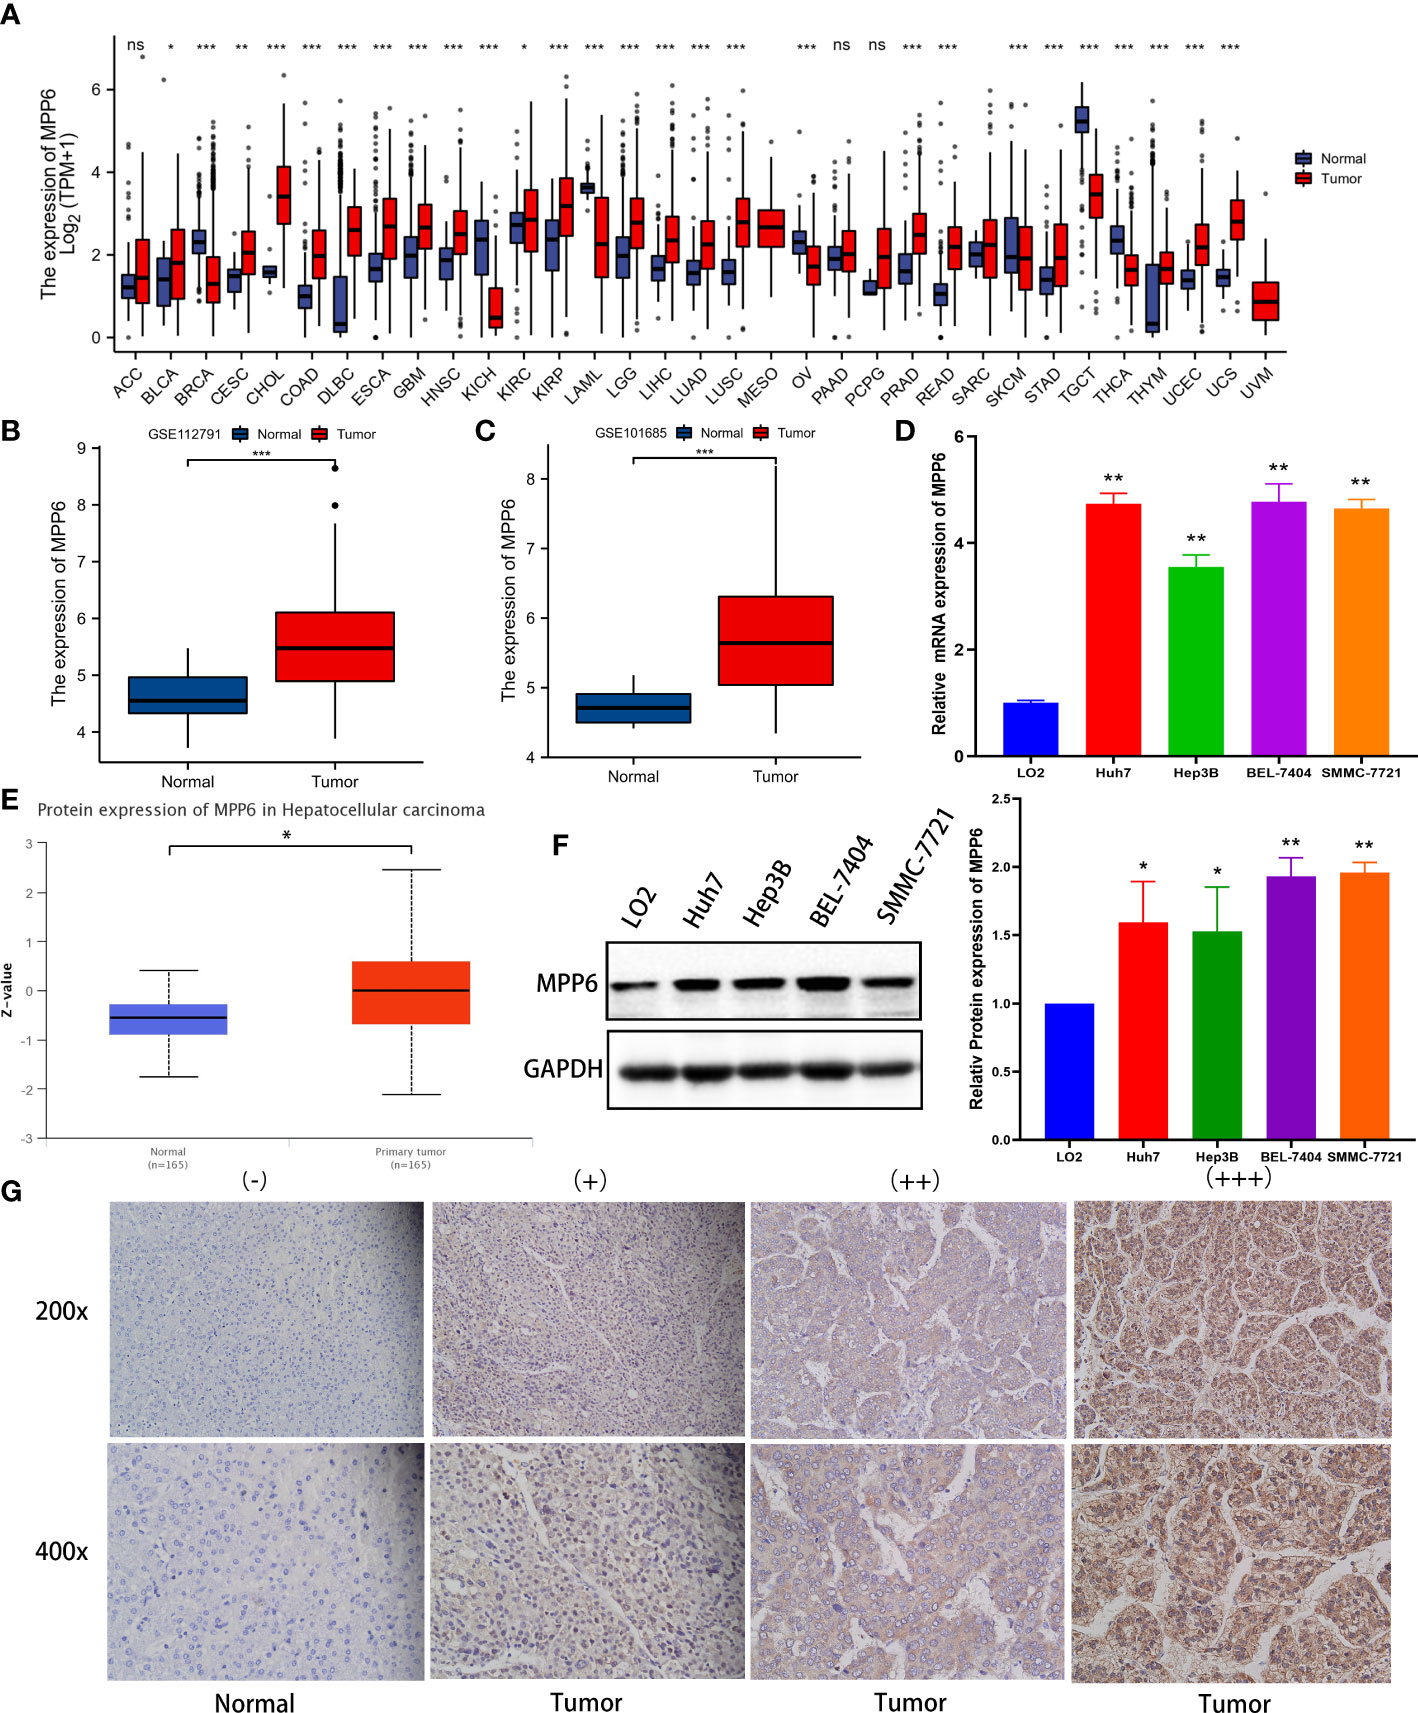
Figure 1 MPP6 expression in HCC. (A) MPP6 mRNA expression in malignant tumor and normal tissues based on the TCGA database. (B, C) MPP6 mRNA expression in normal liver and HCC tissues based on GSE112791 (GPL570 platform) and GSE101685 datasets. (D) MPP6 mRNA expression in HCC cell lines (Huh7, Hep3B, BEL-7404, and SMMC-7721) compared with the normal hepatic cell line LO2 by qRT−PCR. (E) MPP6 protein expression in normal liver and HCC tissues based on the UALCAN website. (F) MPP6 protein expression in LO2 and HCC cell lines (Huh7, Hep3B, BEL-7404, and SMMC-7721) by Western blotting. (G) Immunohistochemical staining analysis of MPP6 in normal liver and HCC tissues. *P <0.05; **P <0.01; ***P <0.001; ns: P >0.05.
3.2 Clinicopathological characteristics analysis
In the TCGA database, MPP6 expression had a positive relation to the T stage, pathologic stage, and histologic grade of HCC patients (all P < 0.05, Figure 2; Supplementary Tables 2, 3).
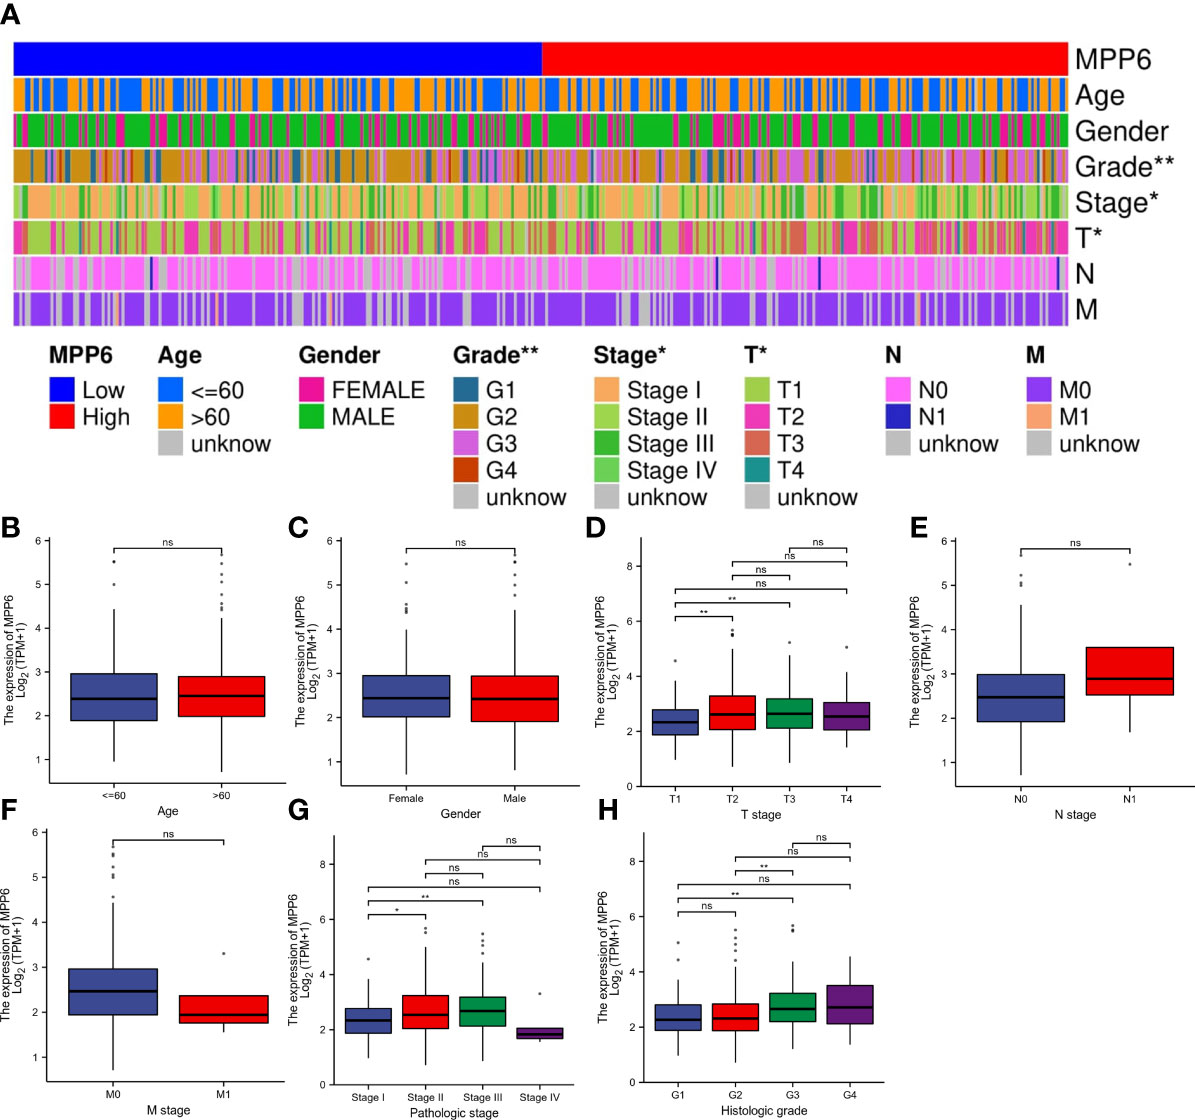
Figure 2 Correlation analysis of MPP6 expression with clinicopathological characteristics in HCC patients based on the TCGA database. (A) Heatmap showing the connection between MPP6 and clinicopathological characteristics in HCC. (B–H) Relationship between MPP6 and age, gender, T stage, N stage, M stage, pathologic stage, and histologic grade. *P <0.05; **P <0.01; ns, P >0.05.
3.3 Prognostic potential of MPP6 in HCC
In the TCGA database, high MPP6 expression suggested shorter overall survival (OS), disease-specific survival and progression-free interval than low MPP6 expression in HCC patients (all P<0.05, Figures 3A–C), and the Cox regression model revealed that MPP6 expression and pathologic stage were independent predictors of OS (all P<0.05, Figures 3D, E). Figure 3F shows that high MPP6 expression suffered worse OS than low MPP6 expression in HCC patients based on the ICGC cohort (P=0.039), and the Cox regression analysis revealed that MPP6 can independently predict HCC patient OS (all P<0.05, Figures 3G, H). Supplementary Table 4 displays HCC patient information in the ICGC database.
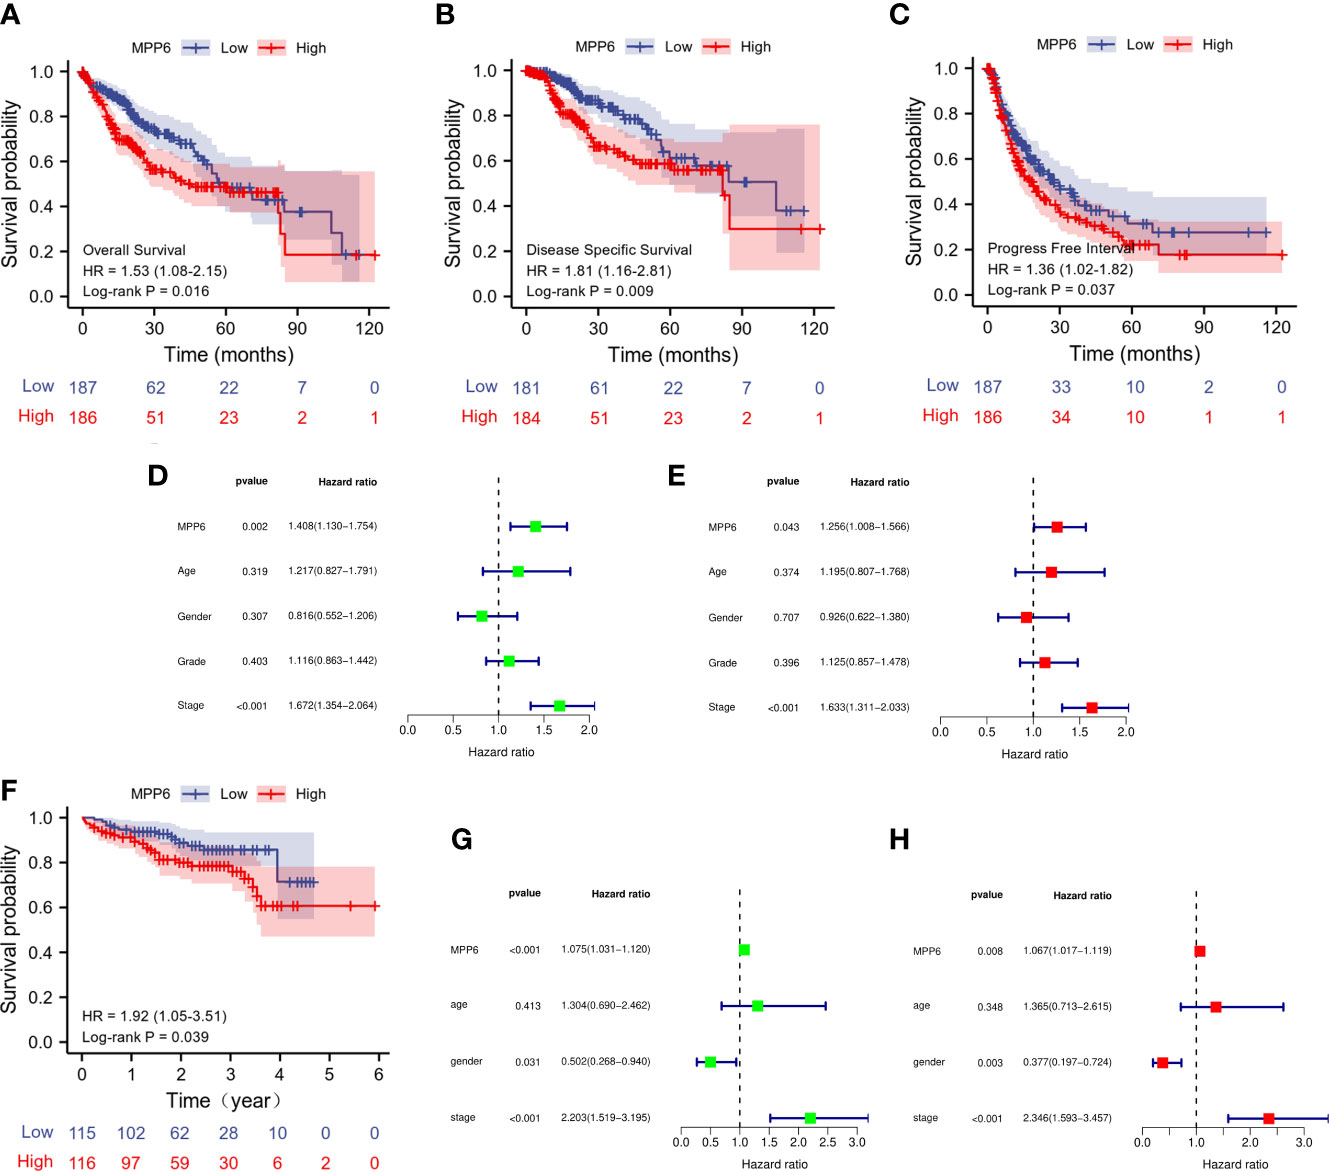
Figure 3 Prognostic analysis of MPP6 expression in HCC based on TCGA and ICGC databases. (A–C) KM curves of OS, DSS, and PFI for HCC patients with different MPP6 expression in the TCGA database. (D, E) Cox regression analyses of OS in the TCGA database. (F) KM curves of OS for HCC patients with different MPP6 expression in Japan cohort released in the ICGC database. (G, H) Cox regression analyses of OS in Japan cohort released in the ICGC database.
3.4 MPP6 related DEGs analysis and its relationship with angiogenesis
A total of 519 DEGs in TCGA database were discovered, and a volcano map was generated (Figure 4A); the top 20 DEGs are demonstrated in Figure 4B. The GO results revealed that these DEGs were enriched in biological activities, mainly including detoxification of copper ion, epithelial cell differentiation, hemoglobin complex, and inorganic ion transmembrane transport (Figure 4C). KEGG pathway analysis in GSEA demonstrated that in the high MPP6 expression group, the main enriched pathways were DNA replication, cell cycle, Fc gamma γ mediated phagocytosis, WNT signaling pathway, and cancer-related signaling pathways, while in the low MPP6 expression group, the main enriched pathways were fatty acid metabolism, primary bile acid biosynthesis, histidine metabolism, drug metabolism other enzymes, and oxidative phosphorylation-related pathways, which are demonstrated in Figures 4D, E and Supplementary Table 5.
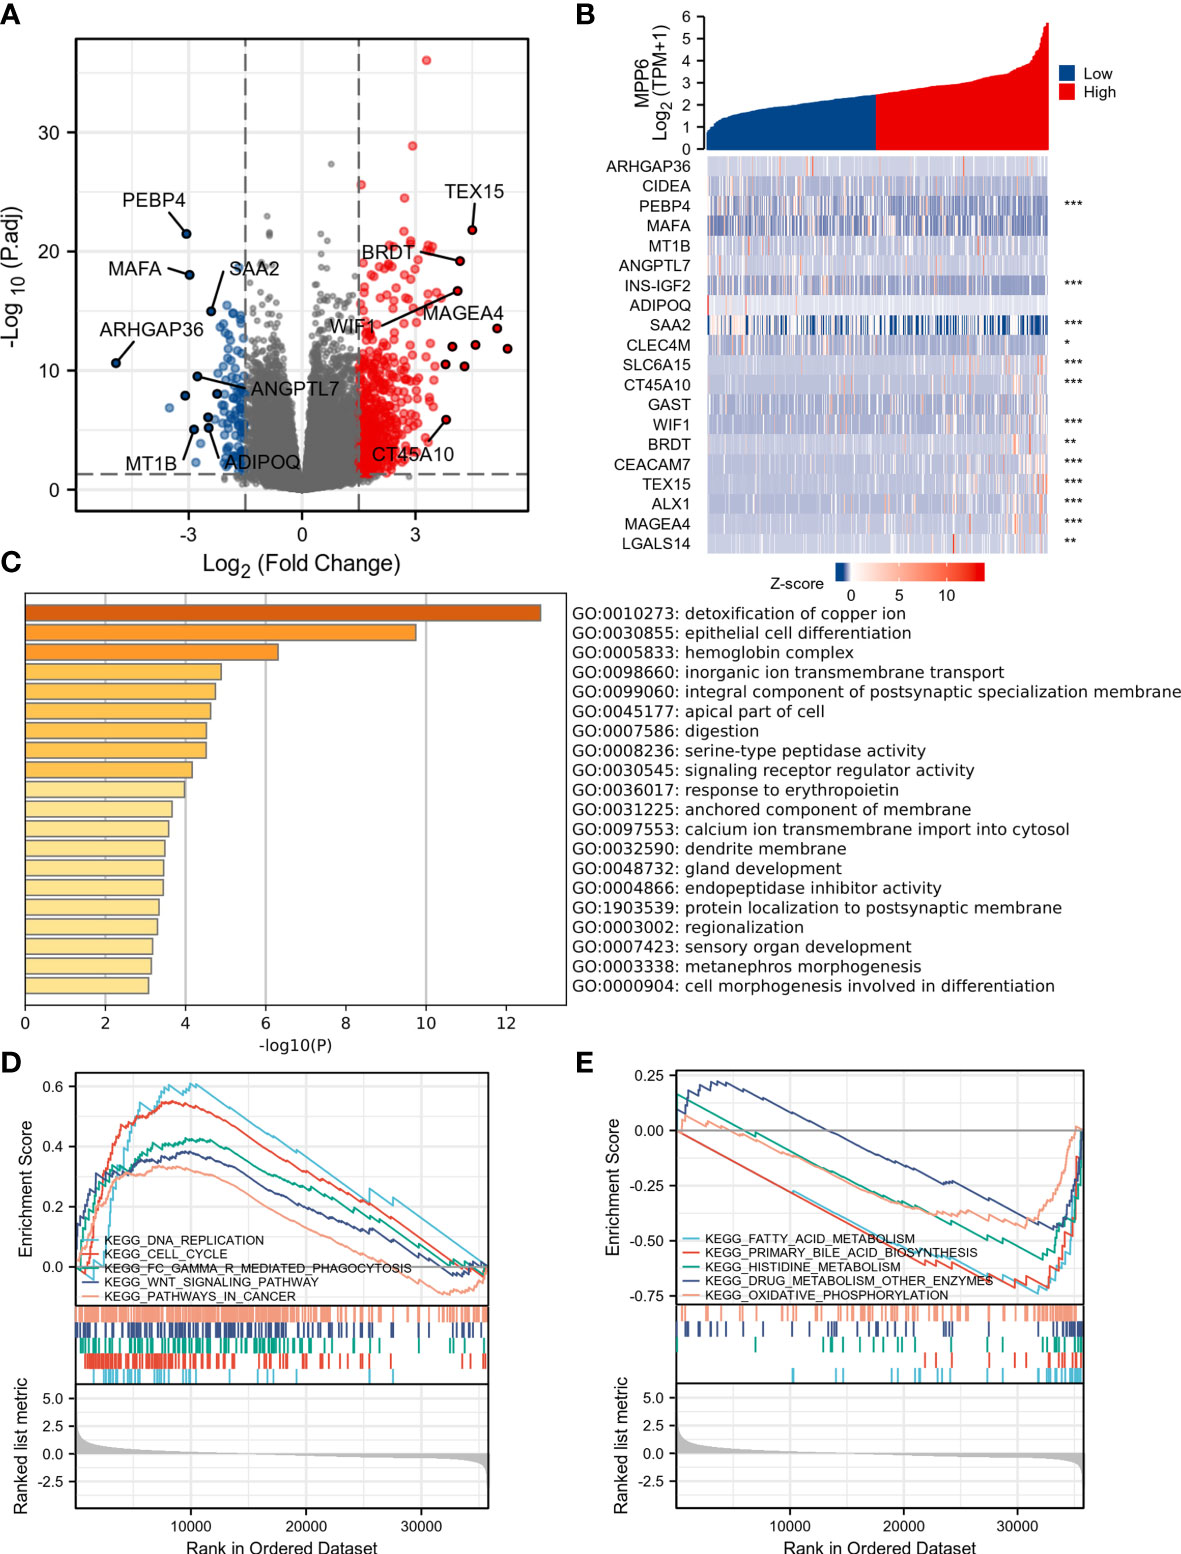
Figure 4 DEGs analysis of high and low MPP6 expression groups in TCGA database. (A) Volcano plot of DEGs of high and low MPP6 expression groups. (B) Heatmap of the top 20 DEGs correlated with MPP6. (C) GO enrichment analysis based on significantly DEGs correlated with MPP6. (D) Identification of MPP6-related signaling pathways by GSEA in high MPP6 expression groups. (E) Identification of MPP6-related signaling pathways by GSEA in low MPP6 expression groups.
GSEA by CAMOIP online database found that MPP6 could inhibit the proliferation of vascular-associated smooth muscle cells (Figure 5A). The GEPIA online database indicated that MPP6 expression had a positive correlation with the expression levels of VEGFA (r=0.4, P=8.9e-16, Figure 5B) and CD34 (r=0.12, P=0.022, Figure 5D), while no significant correlation was observed with VEGFR2 (r=0.022, P=0.67, Figure 5C). The expression of VEGFA, VEGFR2 and CD34 were positively linked with MPP6 expression by IHC staining in the study cohort (Figures 5E, F).
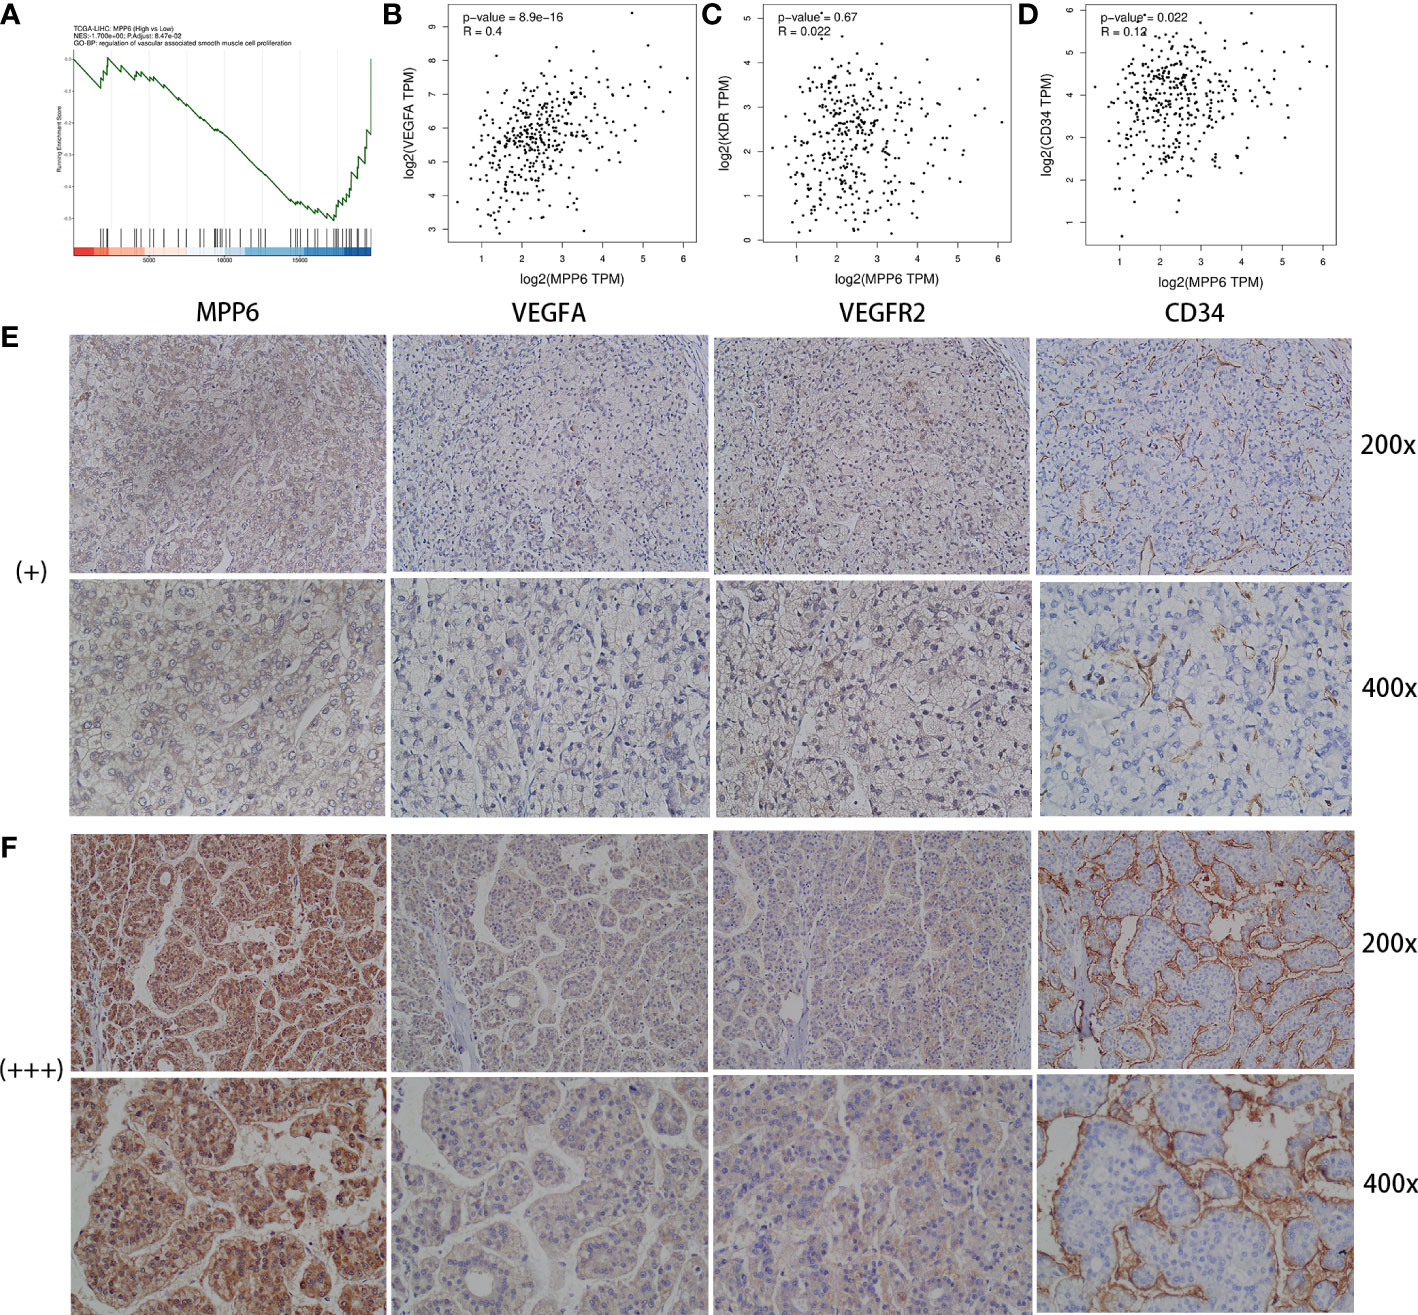
Figure 5 Analysis between MPP6 expression and angiogenic factors in HCC. (A) GO enrichment analysis by CAMOIP online database. (B–D) Relevance of expression between MPP6 and VEGFA, VEGFR2 and CD34 based on the GEPIA database. (E, F) Expression of VEGFA, VEGFR2 and CD34 in HCC samples with MPP6 staining intensity of “+” and “+++” based on the study cohort.
3.5 Correlation analysis of MPP6 with TME
Single-cell analysis revealed that a total of seven HCC datasets in this study. The findings indicated that MPP6 was expressed at different levels in malignant cells, stromal cells, and immune cells (Figure 6A). In the LIHC-GSE146115 dataset, MPP6 was expressed in malignant cells, T cells, B cells and macrophages, and MPP6 expression was highest in malignant cells (Figure 6B). In the LIHC-GSE146409 dataset, MPP6 was expressed at different levels in macrophages, epithelial cells, endothelial cells, malignant cells, hepatocytes, and fibroblasts, and MPP6 expression was highest in macrophages (Figure 6C). In the LIHC-GSE166635 dataset, MPP6 was mostly expressed in epithelial cells, CD8+ T cells and macrophage cells (Figure 6D).
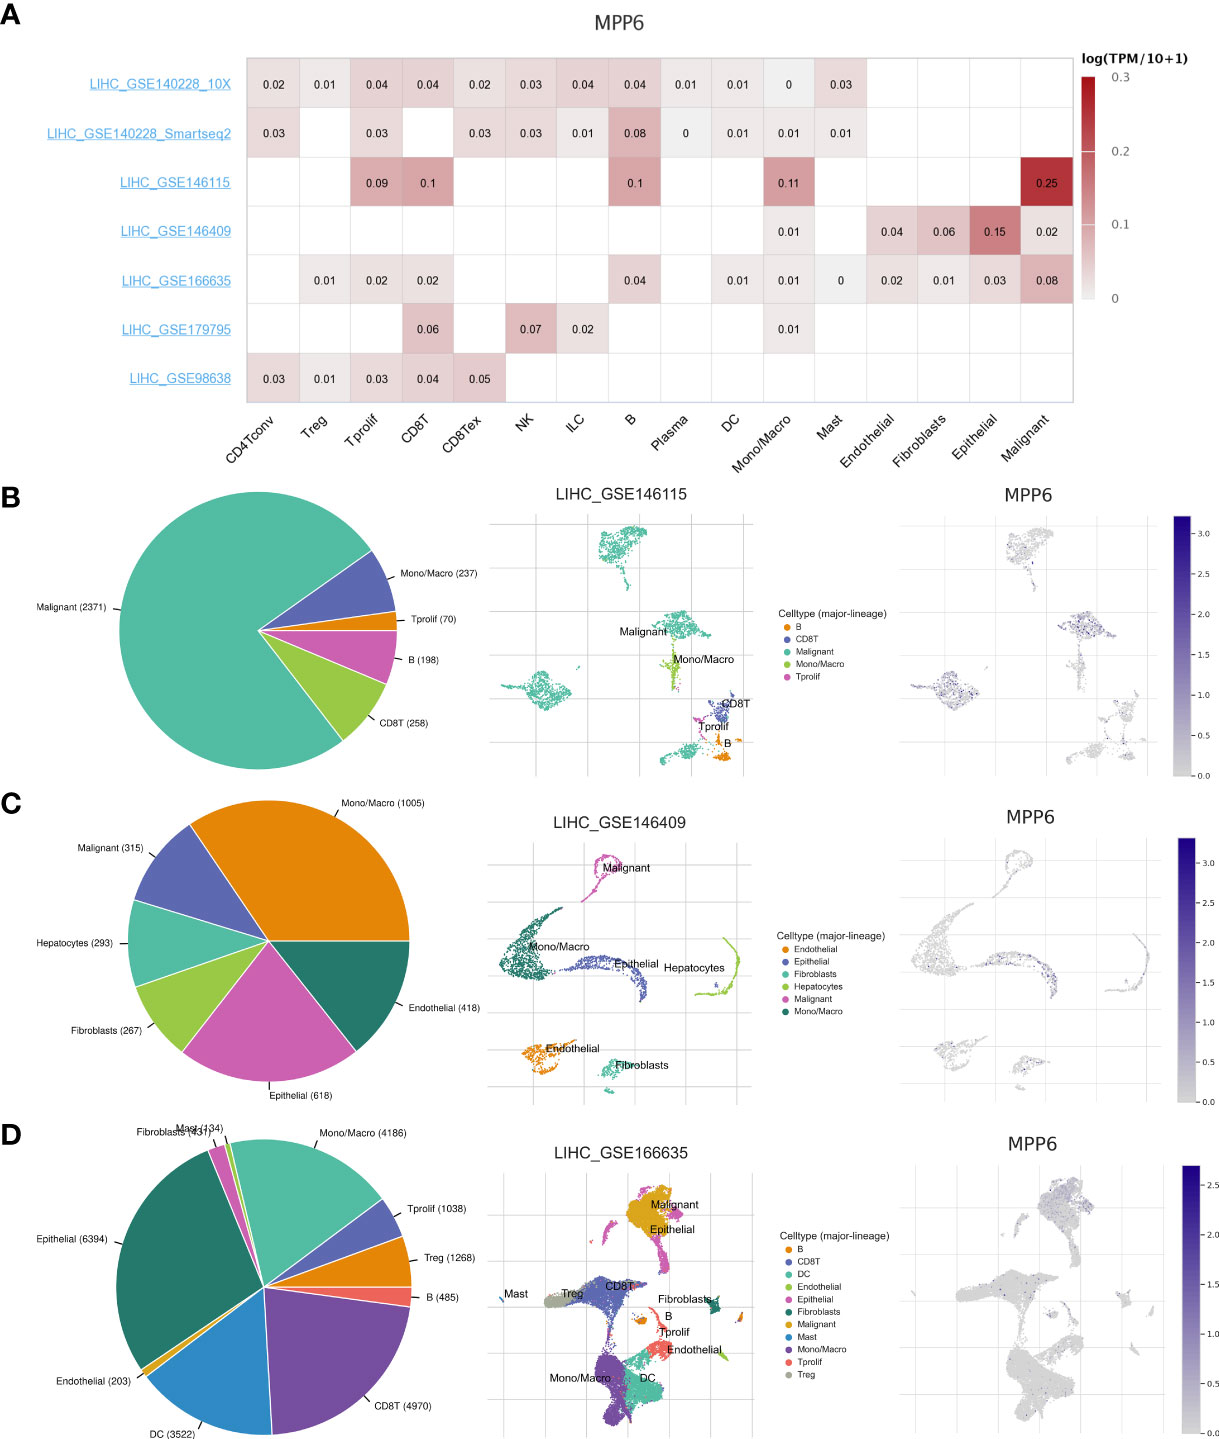
Figure 6 Correlation between MPP6 and TME at the single-cell level in the TISCH open access tool. (A) Heatmap showing MPP6 expression in various cells from diverse datasets. (B–D) MPP6 expression in various cells based on the GSE146115, GSE146409 and GSE166635 cohorts.
Further analysis revealed that, compared to the high MPP6 expression group, the low MPP6 expression group had markedly higher stromal score, immune score, and ESTIMATE score, whereas tumor purity in the low MPP6 expression group was lower (all P<0.05, Figures 7A–D). In addition, MPP6 was correlated with various immune checkpoint genes (P<0.05, Figure 7E). There were notable differences in TNFRSF9, CD80, TNFSF9, CD86, LAIR1, TNFSF15, IDO2, CD276, TNFRSF4, HHLA2, HAVCR2, LGALS9, VTCN1, TNFSF18, BTNL2, CD200R1, TNFSF4, CD200, and NRP1 expression in groups with different MPP6 expression (all P < 0.05, Figure 7F).
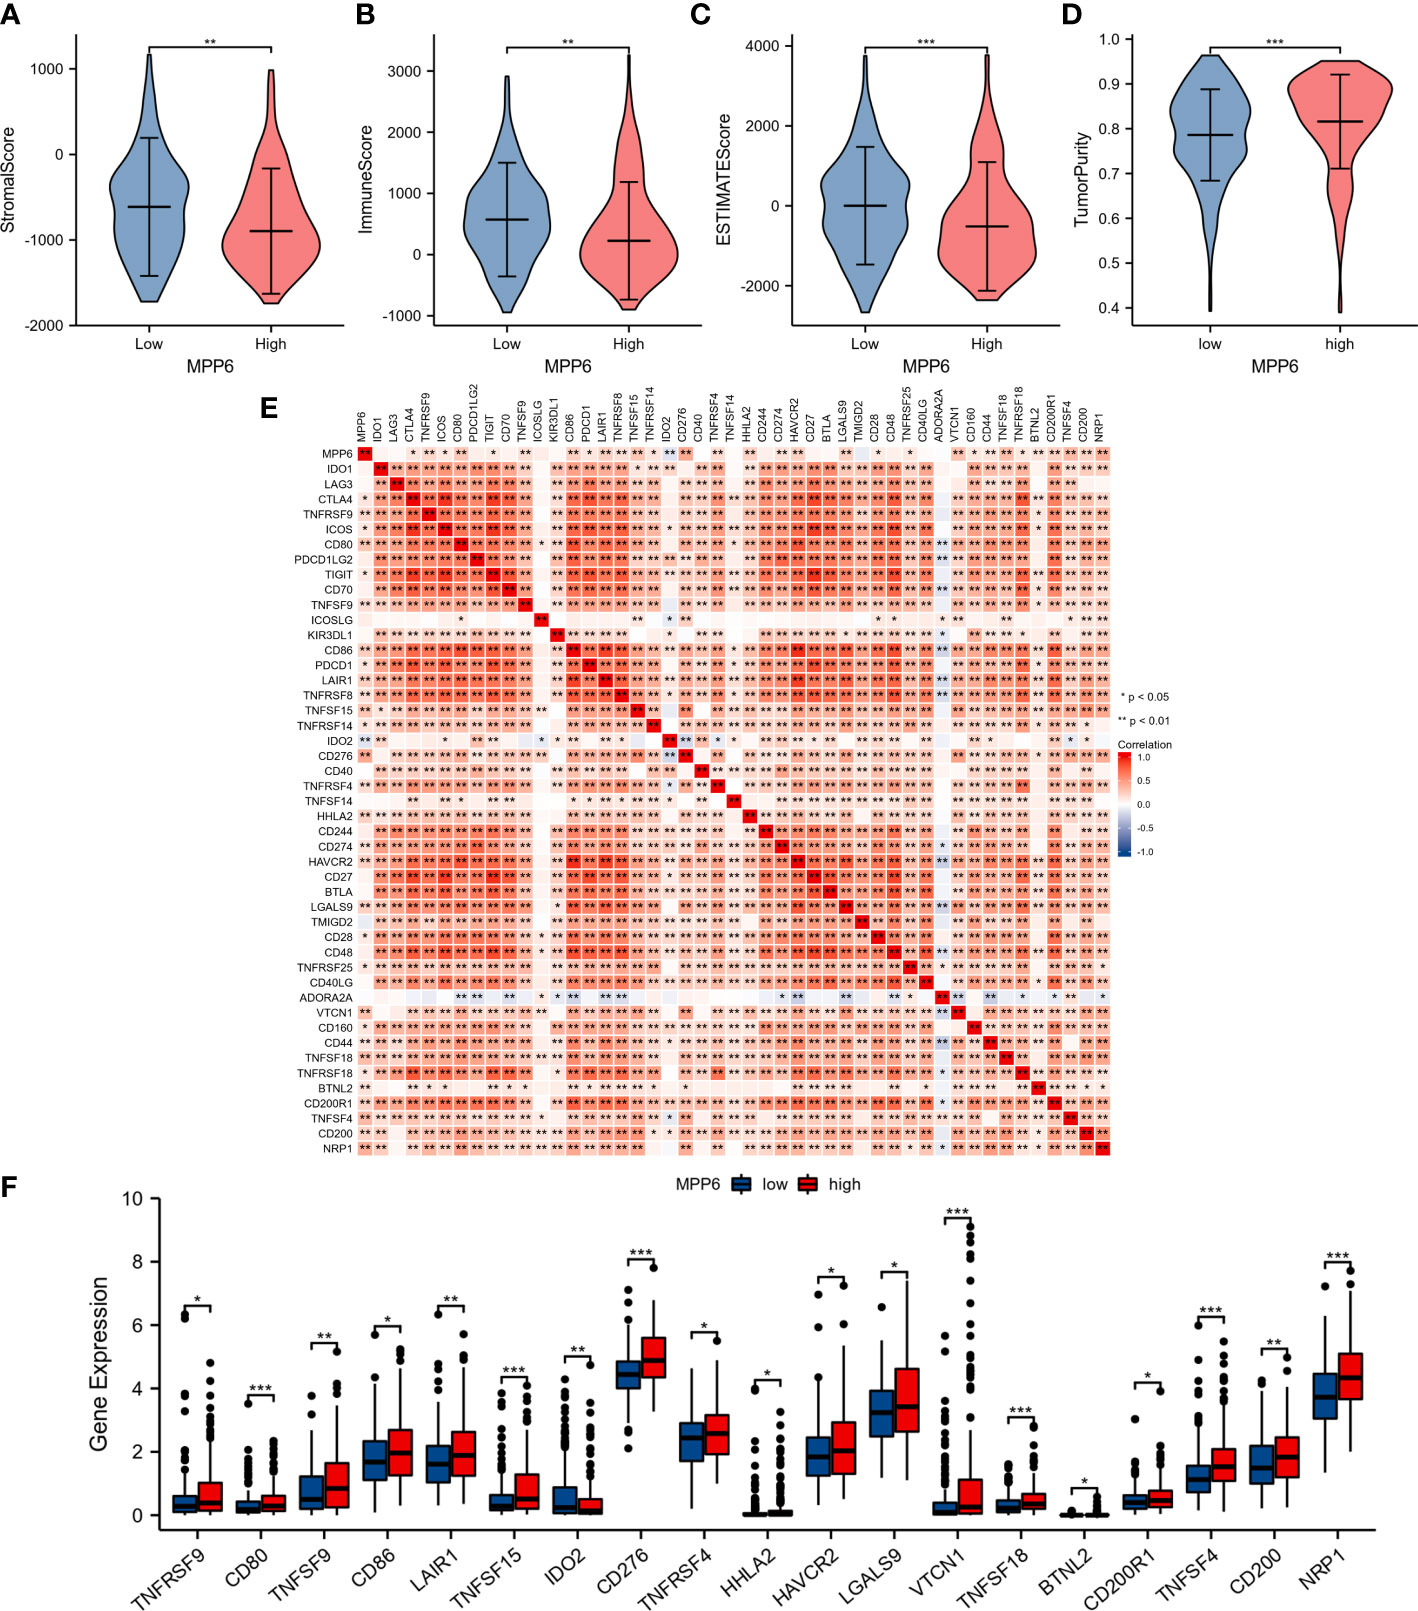
Figure 7 Relationship between MPP6 and alteration of the immune landscape. (A–D) Comparison of stromal score, immune score, ESTIMATE score and tumor purity in different MPP6 expression groups. (E) Relevance of expression between MPP6 and immune checkpoint genes. (F) Differential expression of immune checkpoint genes in different MPP6 expression groups. *P <0.05; **P <0.01; ***P <0.001.
T cells, CD8 T cells, cytotoxic cells, B cells, dendritic cells (DCs), mast cells, neutrophils, NK CD56dim cells, NK cells, pDCs, Tgd cells, and Th1 cells had higher infiltration levels in the low MPP6 expression group, while the infiltration levels of T helper cells, Tcm cells, and Th2 cells were higher in the high MPP6 expression group (all P < 0.05, Figure 8A). Further analysis demonstrated that MPP6 was related to various immune cells (Figure 8B), such as pDCs, cytotoxic cells, DCs, CD8 T cells, B cells, neutrophils, T cells, Tregs, Th17 cells, NK cells, Tgd cells, mast cells, macrophages, Tcm cells, TFH, T helper cells, and Th2 cells (all P<0.05, Figures 8C–S).
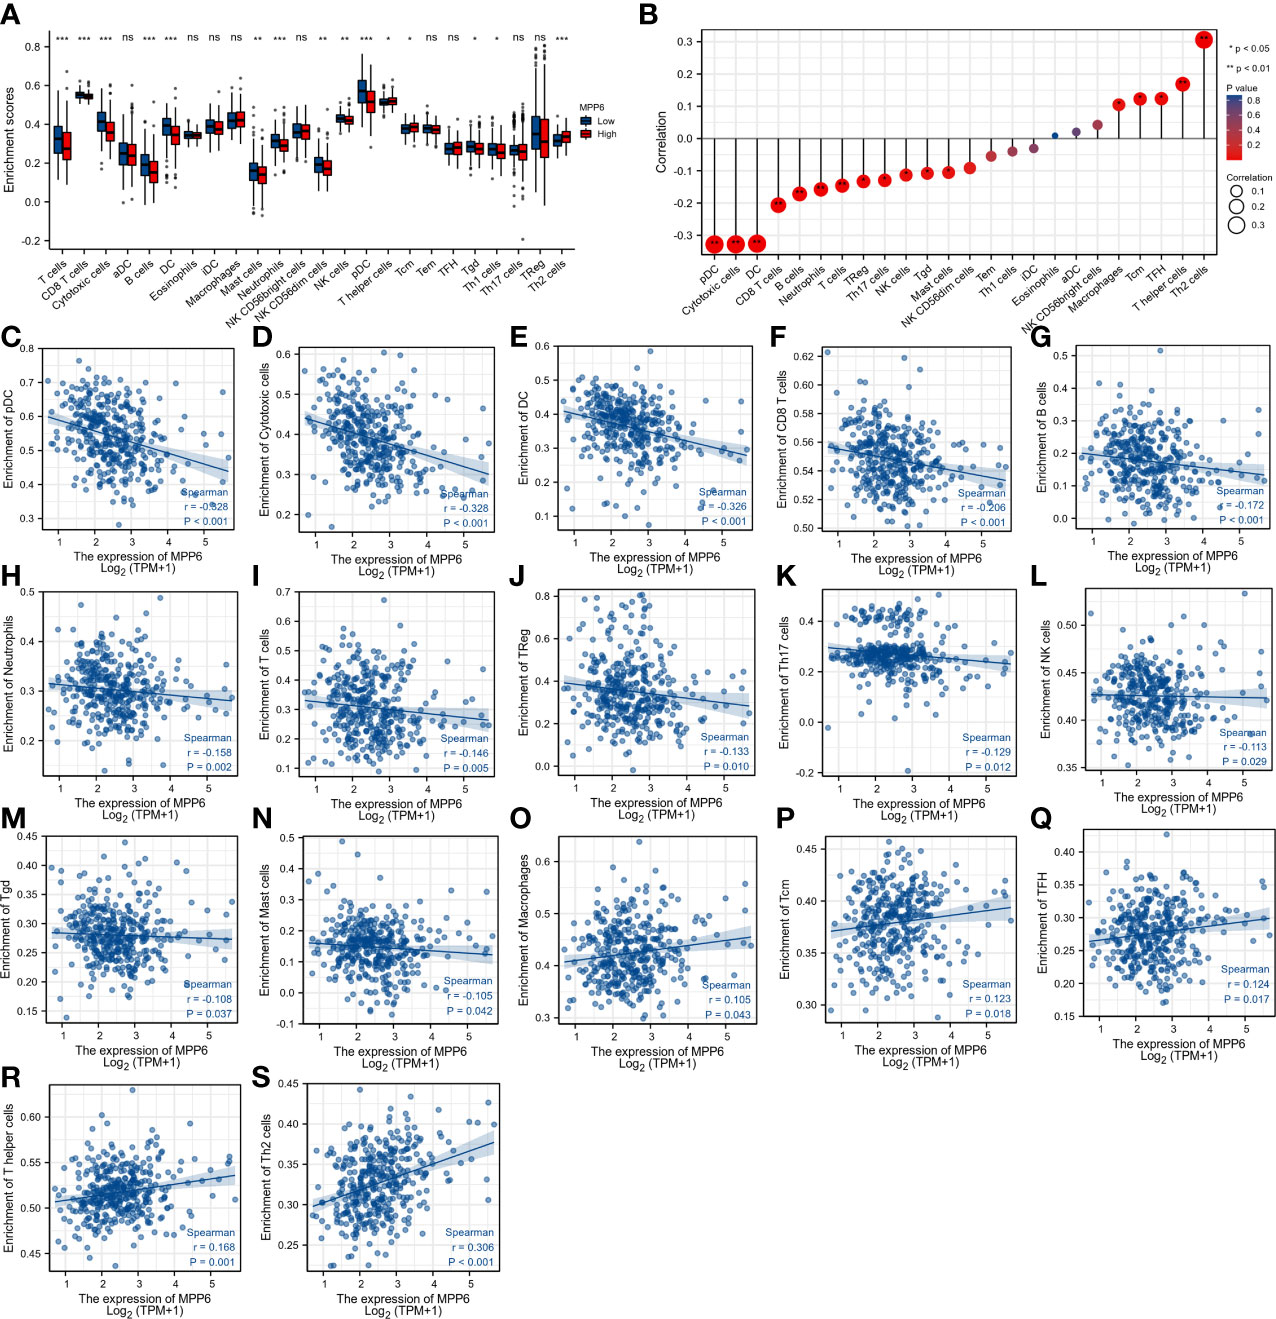
Figure 8 Correlation analysis of MPP6 with immune cell infiltration in HCC. (A) Differences in immune cell infiltration in different MPP6 expression groups. (B) Relationship between MPP6 and immune cell infiltration. (C–S) Correlation of MPP6 expression with infiltration level of pDC, cytotoxic cells, DC, CD8 T cells, B cells, neutrophils, T cells, Treg, Th17 cells, NK cells, Tgd, mast cells, macrophages, Tcm, TFH, T helper cells, and Th2 cells. *P <0.05; **P <0.01; ***P <0.001; ns, P >0.05.
In the study cohort, IHC staining revealed that CD3+ T cells, CD4+ T cells, and CD8+ T cells were diffusely distributed in the HCC tumor parenchyma when MPP6 expression was “+” (Figure 9A). In contrast, when MPP6 expression was “+++”, CD3+ T cells, CD4+ T cells and CD8+ T cells were mainly concentrated in the peritumoral stroma of HCC samples, with few or no T cells penetrating into the tumor parenchyma (Figure 9B).
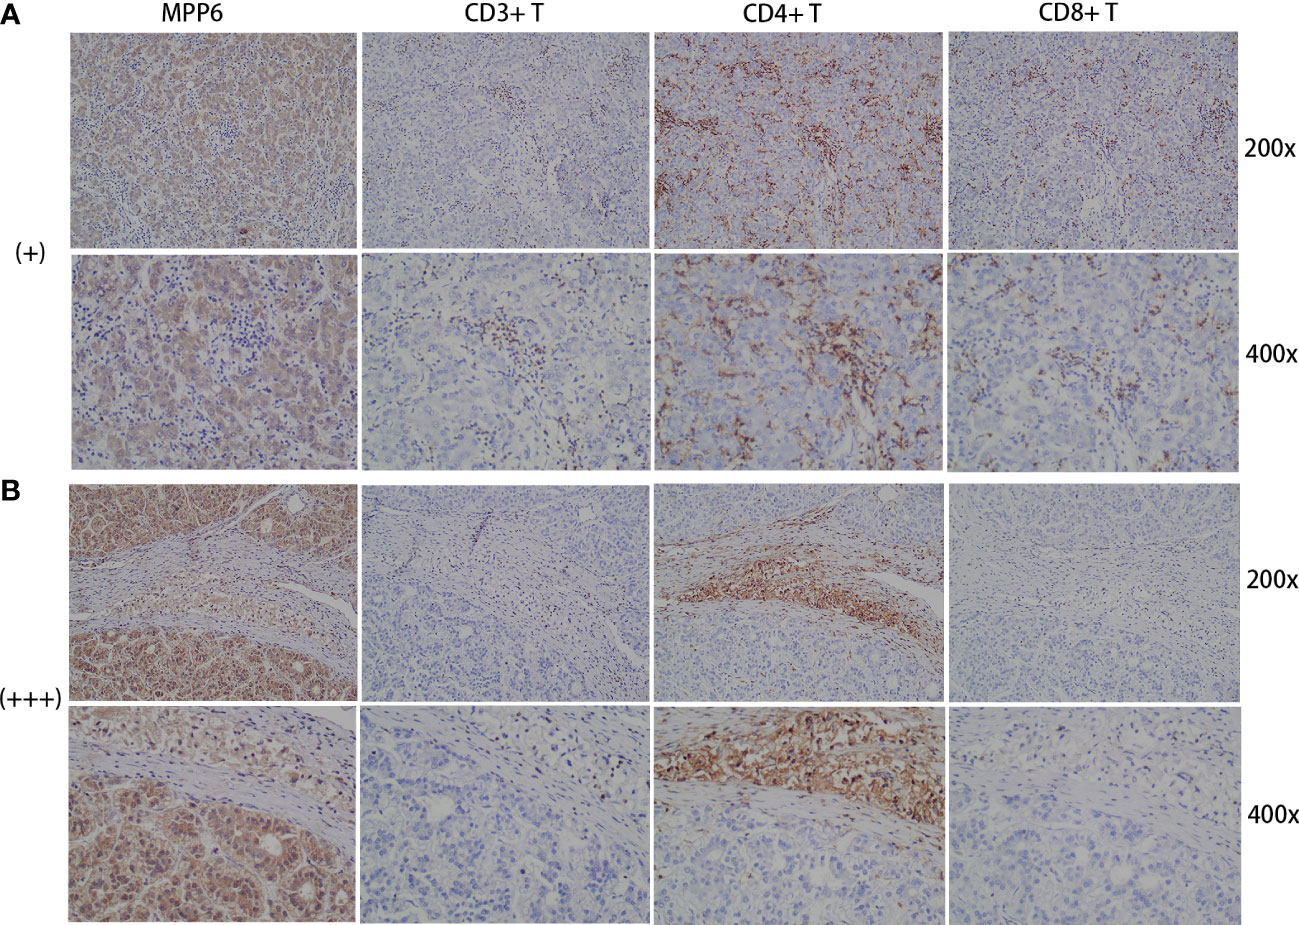
Figure 9 Association between immune evasion and MPP6 expression. (A) Distribution of CD3+ T cells, CD4+ T cells and CD8+ T cells in HCC samples with MPP6 staining intensity of “+” based on the study cohort. (B) Distribution of CD3+ T cells, CD4+ T cells and CD8+ T cells in HCC samples with MPP6 staining intensity of “+++” based on the study cohort.
3.6 Association between MPP6 expression and TMB
MPP6 expression was positively associated with TMB (Supplementary Figures 1A, B). HCC patients with high TMB exhibited worse survival (P<0.05, Supplementary Figure 1C). The worst survival was found in HCC patients with both high MPP6 expression and high TMB (P<0.05, Supplementary Figure 1D).
3.7 Prediction of sensitivity to different kinds of drugs and potential small-molecule inhibitors
Finally, we compared the drug sensitivity of HCC patients in different MPP6 expression groups. Compared to HCC patients in the low MPP6 expression group, the IC50 values of sorafenib, gemcitabine, 5-FU and doxorubicin were lower for HCC patients with high MPP6 expression (all P<0.05, Figures 10A–D), which means that high MPP6 expression patients were more responsive to sorafenib, gemcitabine, 5-FU and doxorubicin. In contrast, for HCC patients who received immune checkpoint inhibitor therapy, the high MPP6 group had a higher IPS than the low MPP6 group (all P<0.05, Figures 10E–H).
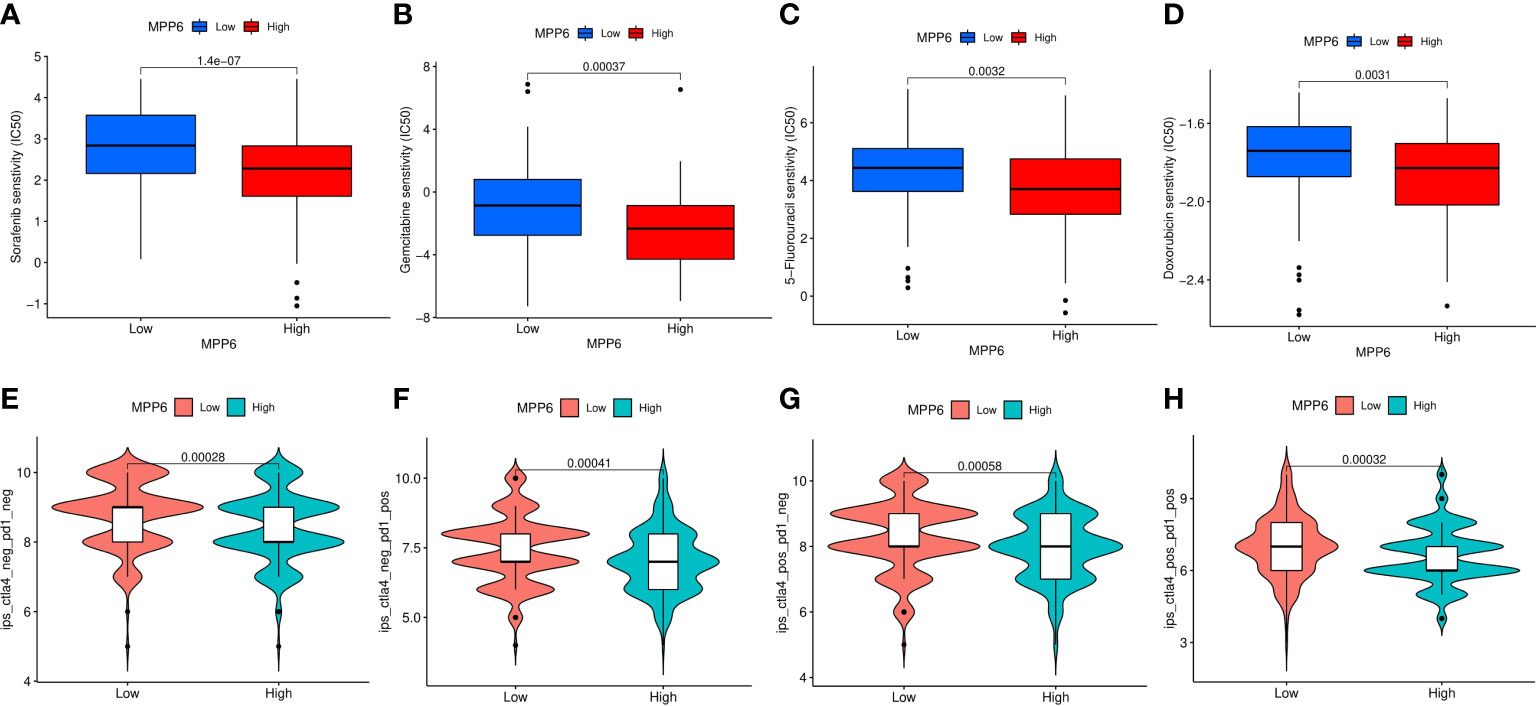
Figure 10 Prediction of treatment responses of HCC patients. (A–D) The IC50 values of sorafenib, gemcitabine, 5-FU and doxorubicin in different MPP6 expression groups. (E–H) Response to immunotherapy in high and low MPP6 expression patients.
4 Discussion
MPP6 was demonstrated to be significantly overexpressed in HCC tissues by bioinformatics analyses of several public databases, and this finding was further validated by qRT−PCR, Western blotting and IHC analyses using HCC cell lines and tissues of the study cohort. Clinicopathological characteristic analyses demonstrated that MPP6 expression was positively related to T stage, pathological stage and histological grade. High MPP6 expression patients exhibited adverse survival. These findings suggested that MPP6 was related to the malignant phenotype of HCC patients and has the potential to predict HCC patient prognosis.
GO biological processes enriched in DEGs mainly included the detoxification of copper ion. Studies have demonstrated that tumorigenesis is correlated with copper metabolism (29, 30). GSEA revealed that in the high MPP6 expression group, the main enriched pathways were the synthesis of genetic material, cell cycle, WNT signaling pathway and cancer-related pathways. Uncontrolled cell growth and hyperproliferation are the characteristics of malignant tumors (31, 32). Cell cycle disorder and increased abnormal synthesis of genetic material also support the association between MPP6 expression and the malignant phenotype of HCC patients. Studies, including ours, have proven that the WNT signaling pathway is engaged in HCC progression (33, 34). It has been shown in several studies that the WNT signaling pathway is closely connected with immune evasion (35, 36). Qu et al. (37) also revealed that the WNT signaling pathway can promote angiogenesis by regulating the expression of angiogenesis-related factors, which contributes to HCC metastasis. These events may be involved in the acquisition of the HCC malignant phenotype in the high MPP6 expression group. However, in the low MPP6 expression group, metabolism-related pathways were mainly enriched. To meet the energy needs for HCC cell proliferation, the metabolic balance of the entire organism is remodeled, which promotes cancer cell growth and migration (38, 39).
For advanced HCC patients, immunotherapy combined with antiangiogenic therapy is the standard first-line therapy, and the GSEA results suggest that the role of MPP6 in HCC angiogenesis and immune evasion is worth further exploration. GSEA revealed that MPP6 expression is inversely correlated with the proliferation of vascular-associated smooth muscle cells. However, most tumor vessels lack smooth muscle layers, which facilitates tumor cell invasion and migration (40). Bioinformatics and IHC staining jointly confirmed that MPP6 expression was positively related to the expression of angiogenesis-related factors (VEGFA and CD34). Based on the above findings, we speculated that MPP6 may promote HCC angiogenesis, which contributes to HCC cell invasion and migration and affects HCC patient prognosis (41–43).
This study indicated that MPP6 can be expressed in malignant cells and other cells, including immune cells and stromal cells, suggesting that MPP6 is closely associated with the TME and may induce an effect through a variety of cells. In addition, compared to the high MPP6 expression group, the low MPP6 expression group had a higher infiltration level of stromal cells and immune cells and a lower percentage of tumor cells. The above results were also conformity to the results of the immune cell analysis; that is, MPP6 expression was inversely related to most immune cells infiltration and positively related to a few immune cells infiltration. DCs, T cells, B cells, neutrophils, and NK cells can identify and kill tumor cells in a specific or nonspecific way, which can inhibit tumor growth, migration and invasion, thereby improving HCC patient prognosis (44–46). Macrophages are innate immune cells. Macrophages in the TME are called tumor-associated macrophages (TAMs). TAMs are vital for the immune response against tumors and may affect immunotherapy efficacy. For example, it has been shown that TAMs can mediate resistance to immune checkpoint inhibitors by regulating T-cell apoptosis and proliferation (47, 48). In a subsequent study evaluating immunotherapy efficacy, we found that patients with low MPP6 expression responded well to immunotherapy. All these results are consistent.
For patients with cancer, the immune system mobilizes lymphocytes to attack tumor cells, but the lymphocytes that truly work in the antitumor immune response are those that penetrate deeply into the tumor parenchyma, and the number of tumor-infiltrating lymphocytes (TILs) directly affects patient prognosis (49, 50). TILs are lymphocytes isolated from tumor tissues and mainly include CD3+ T cells, CD4+ T cells, and CD8+ T cells, especially CD8+ T cells, which are the basis for producing an effect of immunotherapy (51). The number of TILs has increased in patients who respond well to immunotherapy (52, 53). Immune evasion refers to tumors that manage to escape being identified and killed by the immune system. One of the hallmarks of the TME in patients with immune evasion is the reduced number of TILs, which means that lymphocytes can barely penetrate the tumor stroma and enter the tumor parenchyma to work (54). Therefore, it is reasonable to hypothesize that elevated MPP6 expression mediates immune evasion in HCC patients, and this speculation was supported by a subsequent study that discovered that patients with low MPP6 expression respond well to immunotherapy.
TMB is an indicator used to evaluate the frequency of gene mutation. This study found that MPP6 expression was positively related to TMB, while HCC patients with high TMB exhibited poor prognosis. It is speculated that high TMB might lead to impaired immune cell function by causing continuous antigen exposure (55), which also provides an indirect explanation of why high MPP6 expression patients have an adverse survival. In the subsequent analysis of treatment response, we also analyzed the IC50 of sorafenib, gemcitabine, 5-FU and doxorubicin and found that high MPP6 expression patients respond better to these drugs than low MPP6 expression patients. We speculated that this may be related to the higher frequency of gene mutations, higher degree malignancy and increased number of proliferative cells in these patients. Additionally, there were notable differences in the expression of various immune checkpoint genes in groups with different MPP6 expression, indicating that MPP6 may contribute to the selection of immunotherapeutic targets for HCC.
In summary, this study demonstrates that elevated MPP6 expression correlates with unfavorable clinicopathological features and an adverse survival in HCC patients. MPP6 is related to angiogenesis induction and immune evasion and could also be used in assessing TMB and treatment response; thus, MPP6 might serve as a novel prognostic predictor or potential therapeutic target for HCC.
Data availability statement
The original contributions presented in the study are included in the article/Supplementary Material. Further inquiries can be directed to the corresponding author.
Ethics statement
The studies involving human participants were reviewed and approved by Ethics Committee of The First Affiliated Hospital of Bengbu Medical College. The patients/participants provided their written informed consent to participate in this study.
Author contributions
QC and WW contributed equally as co-first authors in conducting main experiments, performing data analysis, and drafting the manuscript. JL assisted with data analysis and manuscript preparation. ZL and WJ contributed to material preparation and experiments performance. JY and WZ participated in data collection and discussion. YY conceived the study and helped to revise the manuscript. All authors contributed to the article and approved the submitted version.
Funding
This study was supported by the Scientific Research Key Project of Health Commission of Anhui Province (AHWJ2022a010), the Excellent Youth Talents Support Program in Higher Education Institutions of Anhui Province (Grant No. gxyq2022042), the 512 Talent Cultivation Plan of Bengbu Medical College (Grant No. by51202208), the Postgraduate Research and Innovation Program of Bengbu Medical College (Grant No. Byycx22108), and the Science Fund for Distinguished Young Scholars of the First Affiliated Hospital of Bengbu Medical College (Grant No. 2019byyfyjq02).
Acknowledgments
Some elements in the graphic abstract were obtained from the SMART website (https://smart.servier.com/?s=human), and drawn with Genuine software Adobe Illustrator from Adobe Systems Incorporated (San Jose, CA, USA).
Conflict of interest
The authors declare that the research was conducted in the absence of any commercial or financial relationships that could be construed as a potential conflict of interest.
Publisher’s note
All claims expressed in this article are solely those of the authors and do not necessarily represent those of their affiliated organizations, or those of the publisher, the editors and the reviewers. Any product that may be evaluated in this article, or claim that may be made by its manufacturer, is not guaranteed or endorsed by the publisher.
Supplementary material
The Supplementary Material for this article can be found online at: https://www.frontiersin.org/articles/10.3389/fimmu.2023.1173848/full#supplementary-material
Supplementary Figure 1 | Correlation between TMB and MPP6 expression, and their relationship with survival of HCC patients in the TCGA database. (A, B) Oncoplots of the top 15 mutated genes in different MPP6 expression groups. (C) KM curves of different TMB groups. (D) The effect of MPP6 expression combined with TMB on HCC patient prognosis.
References
1. Sung H, Ferlay J, Siegel RL, Laversanne M, Soerjomataram I, Jemal A, et al. Global cancer statistics 2020: globocan estimates of incidence and mortality worldwide for 36 cancers in 185 countries. CA: Cancer J Clin (2021) 71(3):209–49. doi: 10.3322/caac.21660
2. Xia C, Dong X, Li H, Cao M, Sun D, He S, et al. Cancer statistics in China and united states, 2022: profiles, trends, and determinants. Chin Med J (2022) 135(5):584–90. doi: 10.1097/cm9.0000000000002108
3. Siegel RL, Miller KD, Wagle NS, Jemal A. Cancer statistics, 2023. CA: Cancer J Clin (2023) 73(1):17–48. doi: 10.3322/caac.21763
4. Funke L, Dakoji S, Bredt DS. Membrane-associated guanylate kinases regulate adhesion and plasticity at cell junctions. Annu Rev Biochem (2005) 74:219–45. doi: 10.1146/annurev.biochem.74.082803.133339
5. Oliva C, Escobedo P, Astorga C, Molina C, Sierralta J. Role of the maguk protein family in synapse formation and function. Dev Neurobiol (2012) 72(1):57–72. doi: 10.1002/dneu.20949
6. Zhu J, Shang Y, Zhang M. Mechanistic basis of maguk-organized complexes in synaptic development and signalling. Nat Rev Neurosci (2016) 17(4):209–23. doi: 10.1038/nrn.2016.18
7. Huang L, Muthuswamy SK. Polarity protein alterations in carcinoma: a focus on emerging roles for polarity regulators. Curr Opin Genet Dev (2010) 20(1):41–50. doi: 10.1016/j.gde.2009.12.001
8. Chytła A, Gajdzik-Nowak W, Olszewska P, Biernatowska A, Sikorski AF, Czogalla A. Not just another scaffolding protein family: the multifaceted mpps. Mol (Basel Switzerland) (2020) 25(21):4954. doi: 10.3390/molecules25214954
9. New M, Van Acker T, Sakamaki JI, Jiang M, Saunders RE, Long J, et al. Mdh1 and Mpp7 regulate autophagy in pancreatic ductal adenocarcinoma. Cancer Res (2019) 79(8):1884–98. doi: 10.1158/0008-5472.Can-18-2553
10. Li FY, Fan TY, Zhang H, Sun YM. Demethylation of mir-34a upregulates expression of membrane palmitoylated proteins and promotes the apoptosis of liver cancer cells. World J Gastroenterol (2021) 27(6):470–86. doi: 10.3748/wjg.v27.i6.470
11. Ma H, Cai H, Zhang Y, Wu J, Liu X, Zuo J, et al. Membrane palmitoylated protein 3 promotes hepatocellular carcinoma cell migration and invasion Via up-regulating matrix metalloproteinase 1. Cancer Lett (2014) 344(1):74–81. doi: 10.1016/j.canlet.2013.10.017
12. Xu F, Si X, Du J, Xu F, Yang A, Zhang C, et al. Downregulating syncam and Mpp6 expression is associated with ovarian cancer progression. Oncol Lett (2019) 18(3):2477–83. doi: 10.3892/ol.2019.10542
13. Schilders G, Raijmakers R, Raats JM, Pruijn GJ. Mpp6 is an exosome-associated rna-binding protein involved in 5.8s rrna maturation. Nucleic Acids Res (2005) 33(21):6795–804. doi: 10.1093/nar/gki982
14. Liu J, Lichtenberg T, Hoadley KA, Poisson LM, Lazar AJ, Cherniack AD, et al. An integrated tcga pan-cancer clinical data resource to drive high-quality survival outcome analytics. Cell (2018) 173(2):400–16.e11. doi: 10.1016/j.cell.2018.02.052
15. The ICGC/TCGA Pan-Cancer Analysis of Whole Genomes Consortium. Pan-cancer analysis of whole genomes. Nature (2020) 578(7793):82–93. doi: 10.1038/s41586-020-1969-6
16. Edgar R, Domrachev M, Lash AE. Gene expression omnibus: ncbi gene expression and hybridization array data repository. Nucleic Acids Res (2002) 30(1):207–10. doi: 10.1093/nar/30.1.207
17. Barrett T, Wilhite SE, Ledoux P, Evangelista C, Kim IF, Tomashevsky M, et al. Ncbi geo: archive for functional genomics data sets–update. Nucleic Acids Res (2013) 41:D991–5. doi: 10.1093/nar/gks1193
18. Zhou X, Li M, Cheng Q, Shao Y, Wang W, Du Q, et al. Methylselenocysteine potentiates etoposide-induced cytotoxicity by enhancing gap junction activity. Biol Pharm Bull (2022) 45(4):467–76. doi: 10.1248/bpb.b21-00893
19. Yang Y, Zhu J, Zhang N, Zhao Y, Li WY, Zhao FY, et al. Impaired gap junctions in human hepatocellular carcinoma limit intrinsic oxaliplatin chemosensitivity: a key role of connexin 26. Int J Oncol (2016) 48(2):703–13. doi: 10.3892/ijo.2015.3266
20. Guo Q, Zhao L, Yan N, Li Y, Guo C, Dang S, et al. Integrated pan-cancer analysis and experimental verification of the roles of tropomyosin 4 in gastric cancer. Front Immunol (2023) 14:1148056. doi: 10.3389/fimmu.2023.1148056
21. Chandrashekar DS, Karthikeyan SK, Korla PK, Patel H, Shovon AR, Athar M, et al. Ualcan: an update to the integrated cancer data analysis platform. Neoplasia (New York NY) (2022) 25:18–27. doi: 10.1016/j.neo.2022.01.001
22. Zhou Y, Zhou B, Pache L, Chang M, Khodabakhshi AH, Tanaseichuk O, et al. Metascape provides a biologist-oriented resource for the analysis of systems-level datasets. Nat Commun (2019) 10(1):1523. doi: 10.1038/s41467-019-09234-6
23. Subramanian A, Tamayo P, Mootha VK, Mukherjee S, Ebert BL, Gillette MA, et al. Gene set enrichment analysis: a knowledge-based approach for interpreting genome-wide expression profiles. Proc Natl Acad Sci USA (2005) 102(43):15545–50. doi: 10.1073/pnas.0506580102
24. Lin A, Qi C, Wei T, Li M, Cheng Q, Liu Z, et al. Camoip: a web server for comprehensive analysis on multi-omics of immunotherapy in pan-cancer. Briefings Bioinf (2022) 23(3):bbac129. doi: 10.1093/bib/bbac129
25. Tang Z, Li C, Kang B, Gao G, Li C, Zhang Z. Gepia: a web server for cancer and normal gene expression profiling and interactive analyses. Nucleic Acids Res (2017) 45(W1):W98–w102. doi: 10.1093/nar/gkx247
26. Sun D, Wang J, Han Y, Dong X, Ge J, Zheng R, et al. Tisch: a comprehensive web resource enabling interactive single-cell transcriptome visualization of tumor microenvironment. Nucleic Acids Res (2021) 49(D1):D1420–d30. doi: 10.1093/nar/gkaa1020
27. Clark K, Vendt B, Smith K, Freymann J, Kirby J, Koppel P, et al. The cancer imaging archive (Tcia): maintaining and operating a public information repository. J Digital Imaging (2013) 26(6):1045–57. doi: 10.1007/s10278-013-9622-7
28. Charoentong P, Finotello F, Angelova M, Mayer C, Efremova M, Rieder D, et al. Pan-cancer immunogenomic analyses reveal genotype-immunophenotype relationships and predictors of response to checkpoint blockade. Cell Rep (2017) 18(1):248–62. doi: 10.1016/j.celrep.2016.12.019
29. Feng Y, Zeng JW, Ma Q, Zhang S, Tang J, Feng JF. Serum copper and zinc levels in breast cancer: a meta-analysis. J Trace elements Med Biol Organ Soc Minerals Trace Elements (GMS) (2020) 62:126629. doi: 10.1016/j.jtemb.2020.126629
30. Zhang M, Shi M, Zhao Y. Association between serum copper levels and cervical cancer risk: a meta-analysis. Bioscience Rep (2018) 38(4):BSR20180161. doi: 10.1042/bsr20180161
31. Hanahan D, Weinberg RA. The hallmarks of cancer. Cell (2000) 100(1):57–70. doi: 10.1016/s0092-8674(00)81683-9
32. Hanahan D, Weinberg RA. Hallmarks of cancer: the next generation. Cell (2011) 144(5):646–74. doi: 10.1016/j.cell.2011.02.013
33. Chai S, Ng KY, Tong M, Lau EY, Lee TK, Chan KW, et al. Octamer 4/Microrna-1246 signaling axis drives Wnt/β-catenin activation in liver cancer stem cells. Hepatol (Baltimore Md) (2016) 64(6):2062–76. doi: 10.1002/hep.28821
34. Yang Y, Zhang N, Zhu J, Hong XT, Liu H, Ou YR, et al. Downregulated Connexin32 promotes emt through the Wnt/β-catenin pathway by targeting snail expression in hepatocellular carcinoma. Int J Oncol (2017) 50(6):1977–88. doi: 10.3892/ijo.2017.3985
35. Takeuchi Y, Tanegashima T, Sato E, Irie T, Sai A, Itahashi K, et al. Highly immunogenic cancer cells require activation of the wnt pathway for immunological escape. Sci Immunol (2021) 6(65):eabc6424. doi: 10.1126/sciimmunol.abc6424
36. Galluzzi L, Spranger S, Fuchs E, López-Soto A. Wnt signaling in cancer immunosurveillance. Trends Cell Biol (2019) 29(1):44–65. doi: 10.1016/j.tcb.2018.08.005
37. Qu B, Liu BR, Du YJ, Chen J, Cheng YQ, Xu W, et al. Wnt/β-catenin signaling pathway may regulate the expression of angiogenic growth factors in hepatocellular carcinoma. Oncol Lett (2014) 7(4):1175–8. doi: 10.3892/ol.2014.1828
38. Pavlova NN, Zhu J, Thompson CB. The hallmarks of cancer metabolism: still emerging. Cell Metab (2022) 34(3):355–77. doi: 10.1016/j.cmet.2022.01.007
39. Cantor JR, Sabatini DM. Cancer cell metabolism: one hallmark, many faces. Cancer Discov (2012) 2(10):881–98. doi: 10.1158/2159-8290.Cd-12-0345
40. Chung AS, Ferrara N. Developmental and pathological angiogenesis. Annu Rev Cell Dev Biol (2011) 27:563–84. doi: 10.1146/annurev-cellbio-092910-154002
41. Viallard C, Larrivée B. Tumor angiogenesis and vascular normalization: alternative therapeutic targets. Angiogenesis (2017) 20(4):409–26. doi: 10.1007/s10456-017-9562-9
42. Morse MA, Sun W, Kim R, He AR, Abada PB, Mynderse M, et al. The role of angiogenesis in hepatocellular carcinoma. Clin Cancer Res (2019) 25(3):912–20. doi: 10.1158/1078-0432.Ccr-18-1254
43. Pestana RC, Hassan MM, Abdel-Wahab R, Abugabal YI, Girard LM, Li D, et al. Clinical and prognostic significance of circulating levels of angiopoietin-1 and angiopoietin-2 in hepatocellular carcinoma. Oncotarget (2018) 9(102):37721–32. doi: 10.18632/oncotarget.26507
44. Balan S, Saxena M, Bhardwaj N. Dendritic cell subsets and locations. Int Rev Cell Mol Biol (2019) 348:1–68. doi: 10.1016/bs.ircmb.2019.07.004
45. Mantesso S, Geerts D, Spanholtz J, Kučerová L. Genetic engineering of natural killer cells for enhanced antitumor function. Front Immunol (2020) 11:607131. doi: 10.3389/fimmu.2020.607131
46. Ley K, Hoffman HM, Kubes P, Cassatella MA, Zychlinsky A, Hedrick CC, et al. Neutrophils: new insights and open questions. Sci Immunol (2018) 3(30):eaat4579. doi: 10.1126/sciimmunol.aat4579
47. Yu J, Green MD, Li S, Sun Y, Journey SN, Choi JE, et al. Liver metastasis restrains immunotherapy efficacy Via macrophage-mediated T cell elimination. Nat Med (2021) 27(1):152–64. doi: 10.1038/s41591-020-1131-x
48. Chow A, Schad S, Green MD, Hellmann MD, Allaj V, Ceglia N, et al. Tim-4(+) cavity-resident macrophages impair anti-tumor Cd8(+) T cell immunity. Cancer Cell (2021) 39(7):973–88.e9. doi: 10.1016/j.ccell.2021.05.006
49. Yao W, He JC, Yang Y, Wang JM, Qian YW, Yang T, et al. The prognostic value of tumor-infiltrating lymphocytes in hepatocellular carcinoma: a systematic review and meta-analysis. Sci Rep (2017) 7(1):7525. doi: 10.1038/s41598-017-08128-1
50. Zheng X, Jin W, Wang S, Ding H. Progression on the roles and mechanisms of tumor-infiltrating T lymphocytes in patients with hepatocellular carcinoma. Front Immunol (2021) 12:729705. doi: 10.3389/fimmu.2021.729705
51. Tumeh PC, Harview CL, Yearley JH, Shintaku IP, Taylor EJ, Robert L, et al. Pd-1 blockade induces responses by inhibiting adaptive immune resistance. Nature (2014) 515(7528):568–71. doi: 10.1038/nature13954
52. Sharma P, Siddiqui BA, Anandhan S, Yadav SS, Subudhi SK, Gao J, et al. The next decade of immune checkpoint therapy. Cancer Discov (2021) 11(4):838–57. doi: 10.1158/2159-8290.Cd-20-1680
53. Ballot E, Ladoire S, Routy B, Truntzer C, Ghiringhelli F. Tumor infiltrating lymphocytes signature as a new pan-cancer predictive biomarker of anti pd-1/Pd-L1 efficacy. Cancers (Basel) (2020) 12(9):2418. doi: 10.3390/cancers12092418
54. Zhang Z, Zhang C, Luo Y, Zhang G, Wu P, Sun N, et al. Rna N(6) -methyladenosine modification in the lethal teamwork of cancer stem cells and the tumor immune microenvironment: current landscape and therapeutic potential. Clin Trans Med (2021) 11(9):e525. doi: 10.1002/ctm2.525
Keywords: angiogenesis, hepatocellular carcinoma, immune evasion, MPP6, prognosis, treatment response
Citation: Cheng Q, Wang W, Liu J, Lv Z, Ji W, Yu J, Zhang W and Yang Y (2023) Elevated MPP6 expression correlates with an unfavorable prognosis, angiogenesis and immune evasion in hepatocellular carcinoma. Front. Immunol. 14:1173848. doi: 10.3389/fimmu.2023.1173848
Received: 25 February 2023; Accepted: 11 April 2023;
Published: 03 May 2023.
Edited by:
Chun Wai Mai, UCSI University, MalaysiaReviewed by:
Lian Chee Foong, Shanghai Jiao Tong University, ChinaWei Meng Lim, Monash University Malaysia, Malaysia
Copyright © 2023 Cheng, Wang, Liu, Lv, Ji, Yu, Zhang and Yang. This is an open-access article distributed under the terms of the Creative Commons Attribution License (CC BY). The use, distribution or reproduction in other forums is permitted, provided the original author(s) and the copyright owner(s) are credited and that the original publication in this journal is cited, in accordance with accepted academic practice. No use, distribution or reproduction is permitted which does not comply with these terms.
*Correspondence: Yan Yang, cWlhbm5pYW5odXBvQDE2My5jb20=
†These authors have contributed equally to this work